strategic forecasting, inc. 1 energy and you. strategic forecasting, inc. 2 why petroleum? what is...
TRANSCRIPT
1
Strategic Forecasting, Inc.
Energy and You
2
Strategic Forecasting, Inc.
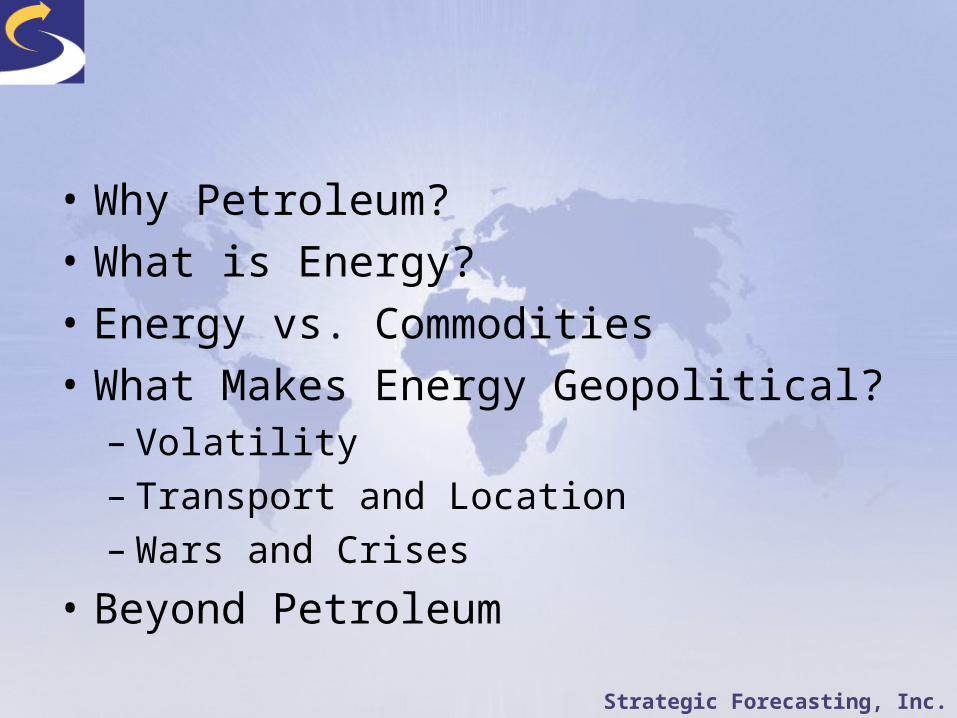
• Why Petroleum?
• What is Energy?
• Energy vs. Commodities
• What Makes Energy Geopolitical?– Volatility – Transport and Location– Wars and Crises
• Beyond Petroleum

3
Strategic Forecasting, Inc.0
1000000
2000000
3000000
4000000
5000000
6000000wood
coal
oil (clean)
gasoline
Why Petroleum: Calories per Pound
Petroleum isalso superiorin terms of density, evenburning andmanageability
4
Strategic Forecasting, Inc.
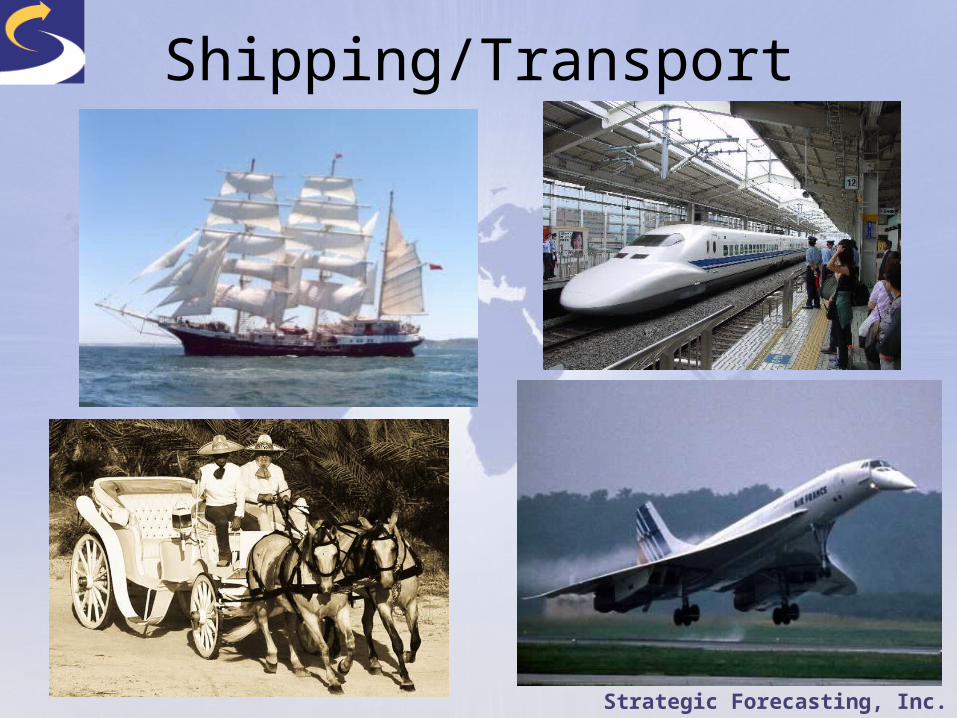
Shipping/Transport

5
Strategic Forecasting, Inc.
Military “High Tech”
6
Strategic Forecasting, Inc.
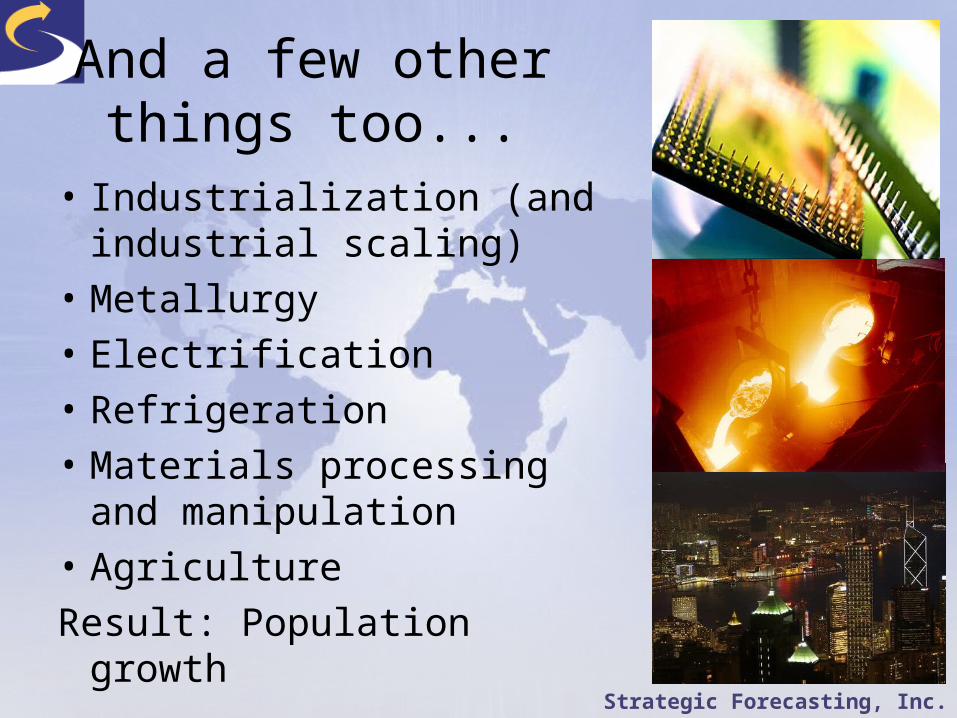
And a few otherthings too...
• Industrialization (and industrial scaling)
• Metallurgy
• Electrification
• Refrigeration
• Materials processing and manipulation
• Agriculture
Result: Population growth

7
Strategic Forecasting, Inc.
What is Energy: oil• fuel oil (electricity), gasoline, diesel, jet
fuel, waxes, sulfuric acid, asphalt, tar, lubricants, petrochem
8
Strategic Forecasting, Inc.
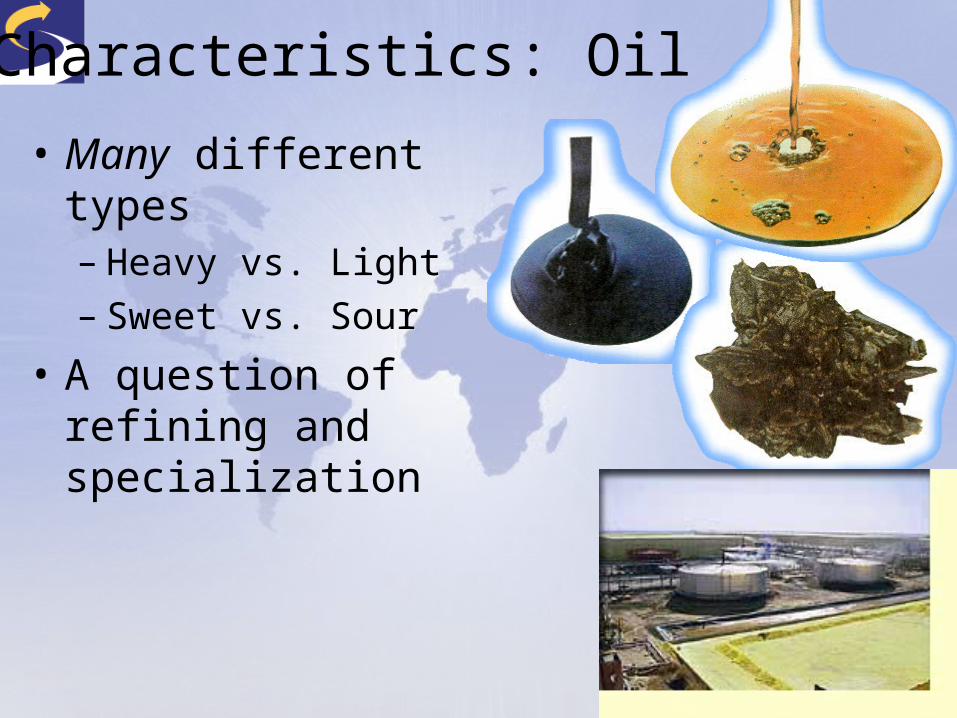
Characteristics: Oil
• Many different types– Heavy vs. Light– Sweet vs. Sour
• A question of refining and specialization

9
Strategic Forecasting, Inc.
What is Energy: Natural Gas
• electricity, heat, polymers, agriculture, petrochem

10
Strategic Forecasting, Inc.
• All the same damn stuff: cow farts (methane)
• Since either burned or used as chemical building blocks, needs to be pure for all applications – so purified very close to the point of extraction
Characteristics:Natural Gas

11
Strategic Forecasting, Inc.
Energy: Nuclear and Alternative
• Only of use in generating electricity

12
Strategic Forecasting, Inc.
What isEnergy:
Transport
Oil vs.
Natural gasvs.
electricity
13
Strategic Forecasting, Inc.
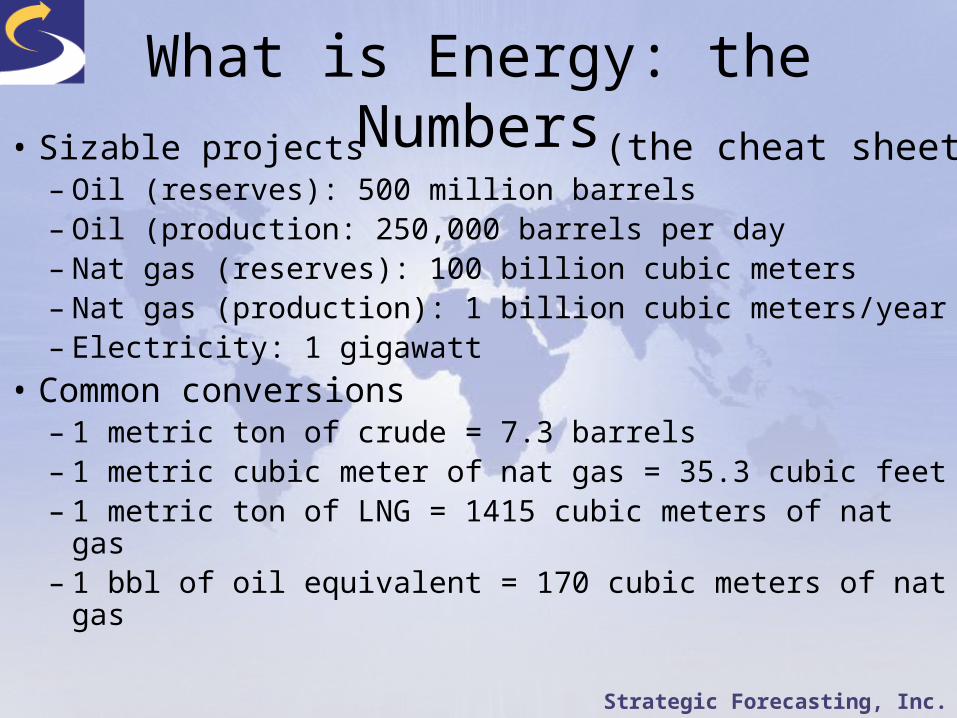
What is Energy: the Numbers• Sizable projects
– Oil (reserves): 500 million barrels– Oil (production: 250,000 barrels per day– Nat gas (reserves): 100 billion cubic meters– Nat gas (production): 1 billion cubic meters/year– Electricity: 1 gigawatt
• Common conversions– 1 metric ton of crude = 7.3 barrels– 1 metric cubic meter of nat gas = 35.3 cubic feet– 1 metric ton of LNG = 1415 cubic meters of nat gas– 1 bbl of oil equivalent = 170 cubic meters of nat gas
(the cheat sheet)
14
Strategic Forecasting, Inc.
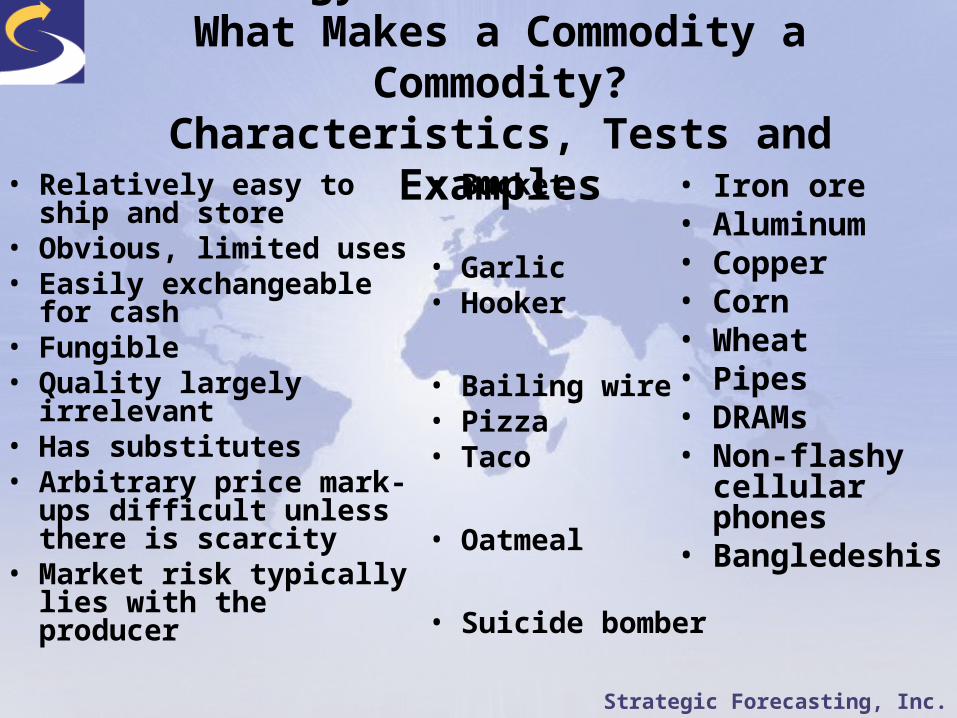
Energy vs. Commodities:What Makes a Commodity a Commodity?
Characteristics, Tests and Examples• Relatively easy to ship
and store • Obvious, limited uses• Easily exchangeable for
cash • Fungible• Quality largely
irrelevant• Has substitutes• Arbitrary price mark-
ups difficult unless there is scarcity
• Market risk typically lies with the producer
• Iron ore• Aluminum• Copper• Corn• Wheat• Pipes • DRAMs• Non-flashy
cellular phones • Bangledeshis
• Bucket
• Garlic• Hooker
• Bailing wire• Pizza • Taco
• Oatmeal
• Suicide bomber
15
Strategic Forecasting, Inc.
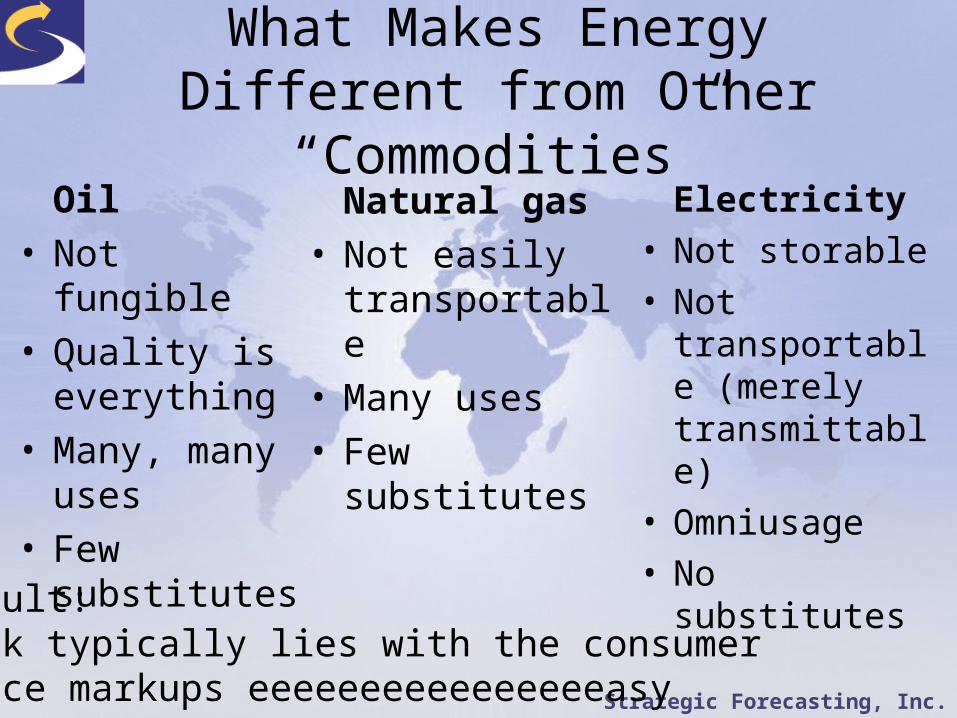
What Makes Energy Different from Other “Commodities”
Oil• Not fungible• Quality is
everything• Many, many
uses• Few substitutes
Natural gas• Not easily
transportable• Many uses• Few substitutes
Electricity• Not storable • Not
transportable (merely transmittable)
• Omniusage• No substitutes
Result: Risk typically lies with the consumerPrice markups eeeeeeeeeeeeeeeeasy

16
Strategic Forecasting, Inc.
What Makes Energy Geopolitical?Volatility: Increasing Costs
• Increased role of FSU requires mammoth – and costly – transport corridors
• More players mean greater chances of disruptions
• Increasing percentage of non-conventional or deepwater production
• Ever more massive outlays required to launch new production
• When something bad happens, it impacts a very large amount of already-sunk capital
17
Strategic Forecasting, Inc.
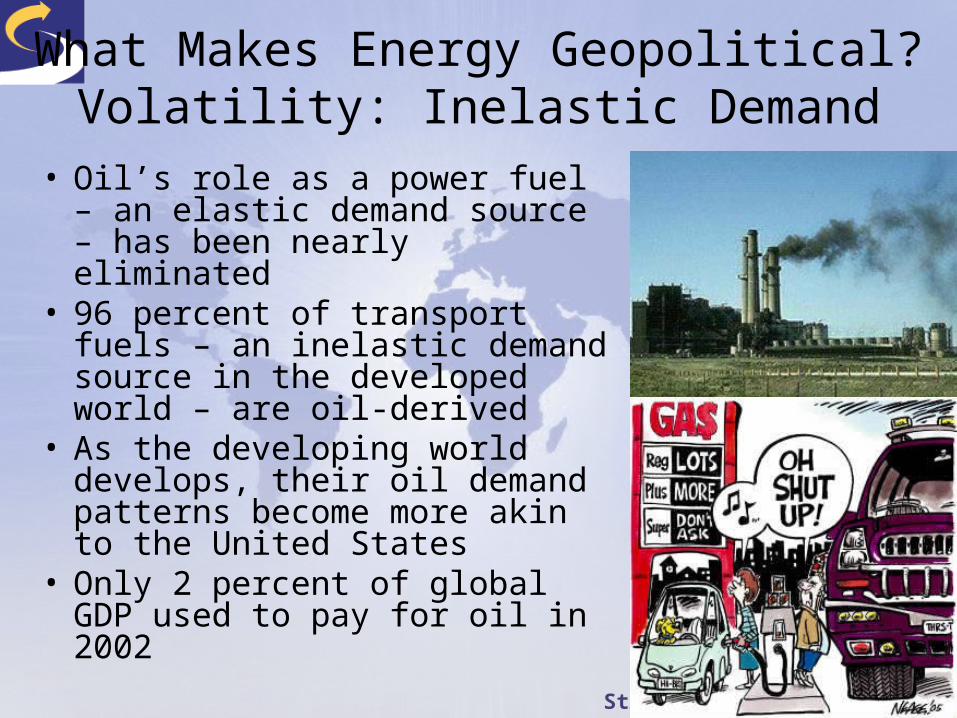
What Makes Energy Geopolitical?Volatility: Inelastic Demand
• Oil’s role as a power fuel – an elastic demand source – has been nearly eliminated
• 96 percent of transport fuels – an inelastic demand source in the developed world – are oil-derived
• As the developing world develops, their oil demand patterns become more akin to the United States
• Only 2 percent of global GDP used to pay for oil in 2002

18
Strategic Forecasting, Inc.
What Makes Energy Geopolitical:Volatility: Shrinking Buffer
19
Strategic Forecasting, Inc.
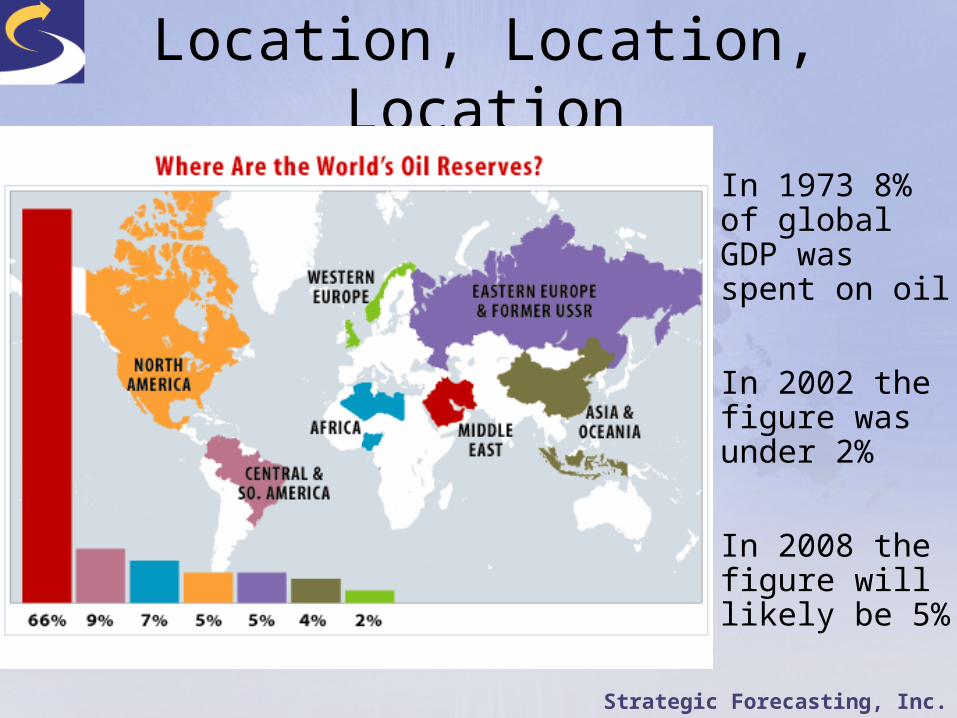
Location, Location, Location
• In 1973 8% of global GDP was spent on oil
• In 2002 the figure was under 2%
• In 2008 the figure will likely be 5%

20
Strategic Forecasting, Inc.
Natural Gas Transport Globally
Volumes over 30 bcm/year
21
Strategic Forecasting, Inc.
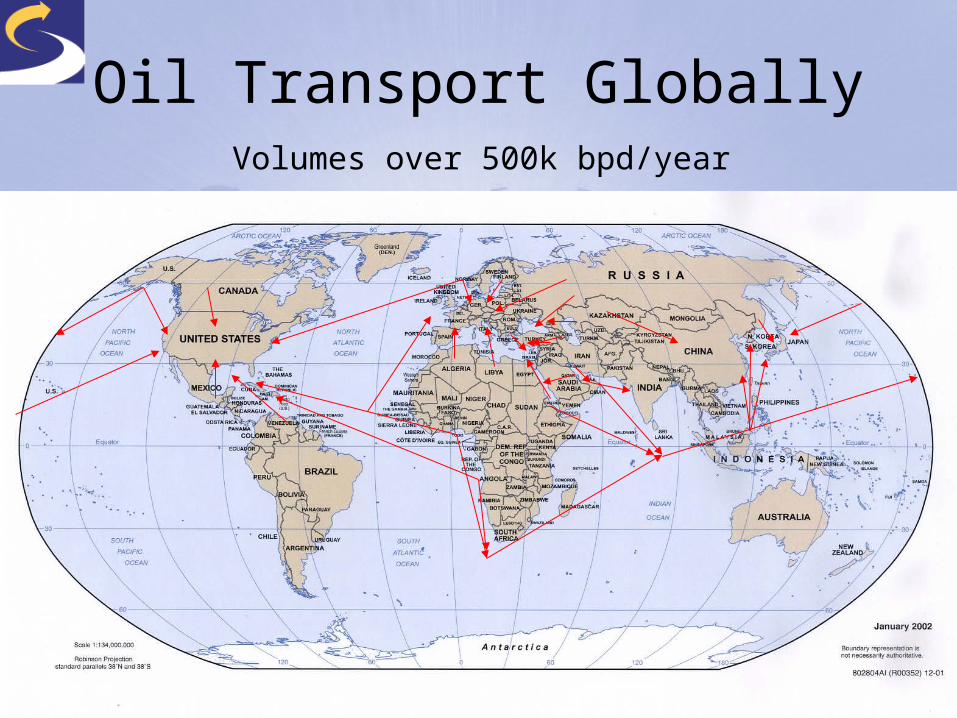
Oil Transport GloballyVolumes over 500k bpd/year
22
Strategic Forecasting, Inc.
Wars and Crises
• 1945: WW II– German USW and the UK blockade were
designed to starve the other of oil– Germany invaded Romania and USSR for oil– Japan launched its war for Indonesian oil– EU’s formation is the Coal and Steel
Community

23
Strategic Forecasting, Inc.

24
Strategic Forecasting, Inc.
Beyond Petroleum:installation cost ($) per kw of capacity
0
1000
2000
3000
4000
5000
6000
Nat Gas
Wind
Coal
Nuclear
Solar
(Electricity generation)
25
Strategic Forecasting, Inc.
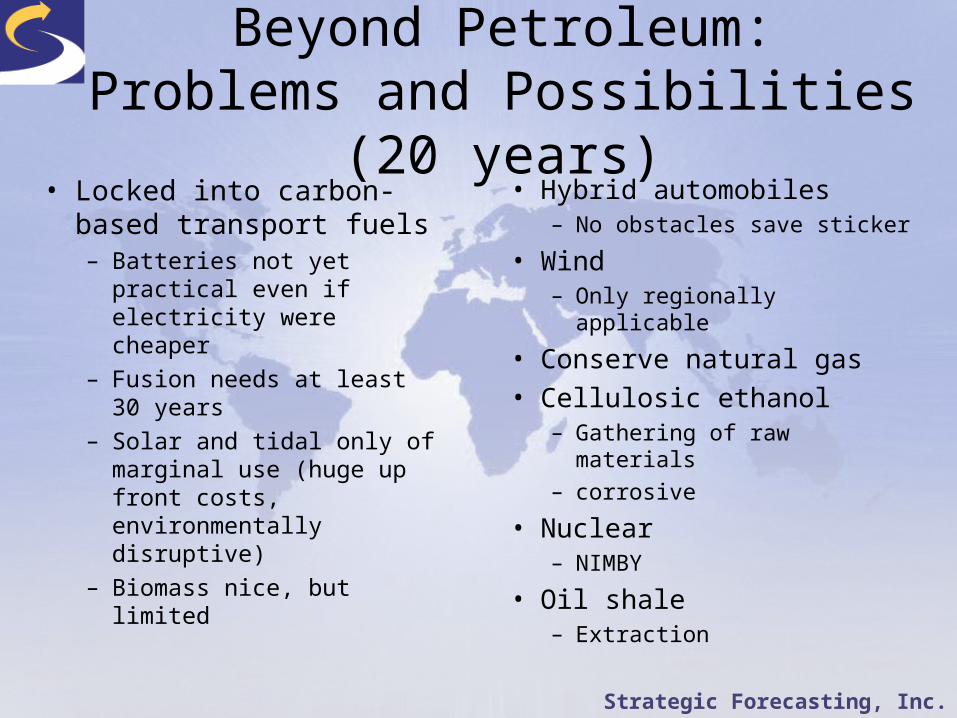
Beyond Petroleum:Problems and Possibilities (20 years)
• Locked into carbon-based transport fuels– Batteries not yet practical
even if electricity were cheaper
– Fusion needs at least 30 years
– Solar and tidal only of marginal use (huge up front costs, environmentally disruptive)
– Biomass nice, but limited
• Hybrid automobiles– No obstacles save sticker
• Wind– Only regionally applicable
• Conserve natural gas• Cellulosic ethanol
– Gathering of raw materials– corrosive
• Nuclear– NIMBY
• Oil shale– Extraction