strategic insights: optimizing the use of active and passive
TRANSCRIPT

May 2011
Strategic Insights: Optimizing the use of Active and Passive Management in Portfolio Construction
Portfolio Advisory Group
1
ab
Portfolio Advisory Group
Contributors
Members of the Portfolio & Wealth Advisory Groups
Anthony RothHead of Wealth Management Strategies
Portfolio Advisory Group Wealth Advisory Group Portfolio Strategy ConsultantsMichael Crook Richard Hollmann, CFA®
Executive Director Executive Director
Brian Nick Christopher Bryan, CIMA® David DurrantDirector Director Director
Diana Chen Christian Capasso Brian W. FormentoDirector Associate Director Director
Andrea Fisher Sujata Hingorani Curt RubinasAssociate Director Analyst Director
Kaitlyn Fischer Carly SharonAnalyst Analyst
CFA® is a trademark owned by the CFA Institute. CIMA® is a registered certification mark of the Investment Management Consultants Association.
Introduction
Strategic Insights: Optimizing the use of Active and Passive Management in Portfolio Construction piece discusses how investors should manage a portfolio. Unless otherwise noted, the views were developed by the Portfolio Advisory Group. In the context of making actual investment decisions, clients should work with their Financial Advisors to customize their portfolios to meet their unique financial and life circumstances, including age, risk tolerance, financial commitments and short-term liquidity needs. In addition, each UBS program, product or service is subject to specific eligibility and suitability requirements, each of which must be met in order for a client to invest. Unless otherwise noted, all information in this Strategic Insights is as of May 2, 2011.
The investment ideas presented in this Guide are for informational purposes only. In the context of making actual investment decisions, clients should work with their Financial Advisors to customize their portfolios to meet their unique financial and life circumstances, taking into account age, risk tolerance, financial commitments and short-term liquidity needs. In addition, each UBS program, product or service is subject to specific eligibility and suitability requirements, each of which must be met in order for a client to invest. Please see pages 19-22 for a general discussion of risk disclosures and other important information.
2
ab
Portfolio Advisory Group
Table of Contents
Introduction 3Summary Conclusions 4Portfolio Construction: Foundational Principals 5Building Blocks of Portfolio Performance 6Balancing TAA and Active Management: Reimaging Core/Satellite 7Active Management Plays a Vital Role 8Tactical Asset Allocation Also Plays a Vital Role 9Active-Passive Macro Asset Class Guidelines 10Equity Guidelines 11Fixed Income Guidelines 12Commodity Guidelines 13Hedge Fund Strategy Guidelines 14Appendix A: Tactical Considerations – Timing Active/Passive Deployment 15Appendix B: Active Manager Monte Carlo Analysis 16Appendix C: Active Management Theory 17Sources 18Important Information 19
3
ab
Portfolio Advisory Group
• This publication initiates a multi-part series laying out a framework for successfully incorporating both active – e.g., separately managed accounts, actively managed mutual funds and hedge funds -- and passive – e.g., ETFs and index funds -- solutions into investment portfolios
• We conclude that effectively balancing active management with tactical asset allocation lies at the heart of a successful portfolio construction process
• The second part of the series will present a comprehensive process for combining active and passive implementation along with tactical asset allocation specifically across equity asset classes
• Subsequent editions will address topics such as how we identify and monitor best-in-class Exchange Traded Funds (ETFs), the extent to which hedge fund replication strategies work and, where so, identify which we prefer
Introduction
The strategic asset allocation models presented represent the longer-term allocation of assets that is deemed suitable for a particular type of investor. The tactical asset allocation models presented reflect the strategic asset allocation models overlayed with the tactical shift that has been identified by the UBS Wealth Management Americas Investment Committee (WMA-IC). In the context of making actual investment decisions, clients should work with their Financial Advisors to customize their portfolios to meet their unique financial and life circumstances, including age, risk tolerance, financial commitments and short-term liquidity needs. In addition, each UBS program, product or service is subject to specific eligibility and suitability requirements, each of which must be met in order for a client to invest.
4
ab
Portfolio Advisory Group
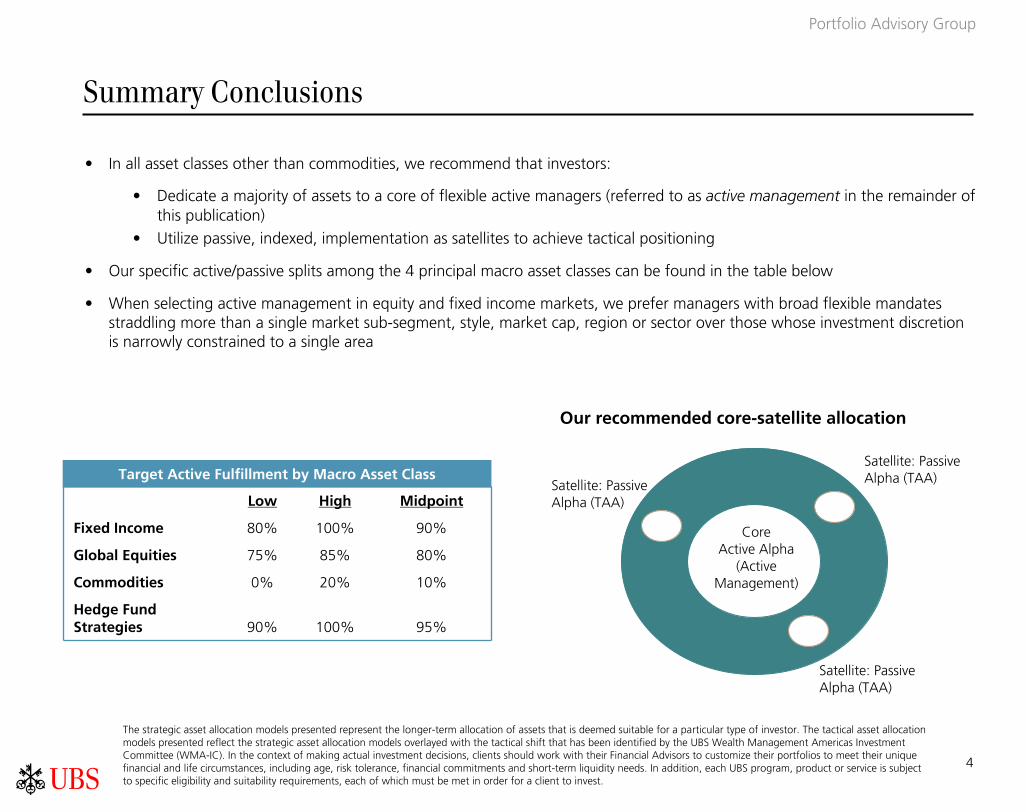
• In all asset classes other than commodities, we recommend that investors:
• Dedicate a majority of assets to a core of flexible active managers (referred to as active management in the remainder of this publication)
• Utilize passive, indexed, implementation as satellites to achieve tactical positioning
• Our specific active/passive splits among the 4 principal macro asset classes can be found in the table below
• When selecting active management in equity and fixed income markets, we prefer managers with broad flexible mandates straddling more than a single market sub-segment, style, market cap, region or sector over those whose investment discretion is narrowly constrained to a single area
Summary Conclusions
The strategic asset allocation models presented represent the longer-term allocation of assets that is deemed suitable for a particular type of investor. The tactical asset allocation models presented reflect the strategic asset allocation models overlayed with the tactical shift that has been identified by the UBS Wealth Management Americas Investment Committee (WMA-IC). In the context of making actual investment decisions, clients should work with their Financial Advisors to customize their portfolios to meet their unique financial and life circumstances, including age, risk tolerance, financial commitments and short-term liquidity needs. In addition, each UBS program, product or service is subject to specific eligibility and suitability requirements, each of which must be met in order for a client to invest.
Satellite: Passive Alpha (TAA)
Satellite: Passive Alpha (TAA)
Satellite: Passive Alpha (TAA)
CoreActive Alpha
(Active Management)
Our recommended core-satellite allocation
Target Active Fulfillment by Macro Asset Class
Low High Midpoint
Fixed Income 80% 100% 90%
Global Equities 75% 85% 80%
Commodities 0% 20% 10%
Hedge Fund Strategies 90% 100% 95%
5
ab
Portfolio Advisory Group
Portfolio Construction: Foundational Principals
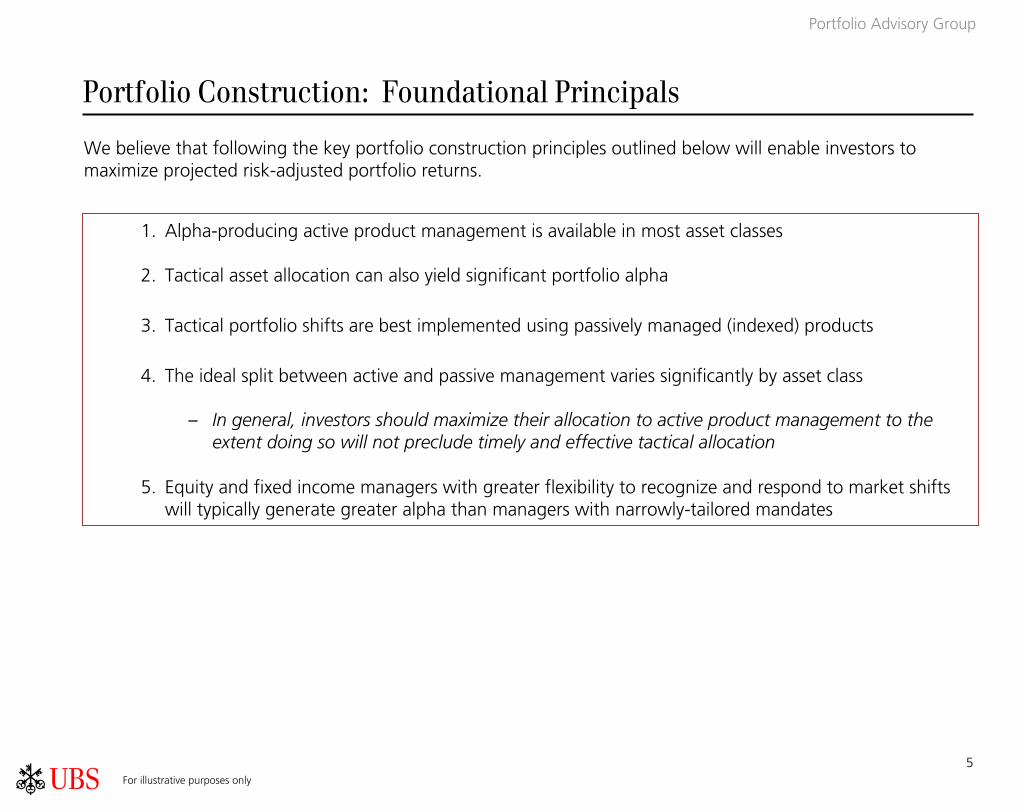
We believe that following the key portfolio construction principles outlined below will enable investors to maximize projected risk-adjusted portfolio returns.
Tactical
For illustrative purposes only
1. Alpha-producing active product management is available in most asset classes
2. Tactical asset allocation can also yield significant portfolio alpha
3. Tactical portfolio shifts are best implemented using passively managed (indexed) products
4. The ideal split between active and passive management varies significantly by asset class
– In general, investors should maximize their allocation to active product management to the extent doing so will not preclude timely and effective tactical allocation
5. Equity and fixed income managers with greater flexibility to recognize and respond to market shifts will typically generate greater alpha than managers with narrowly-tailored mandates
6
ab
Portfolio Advisory Group
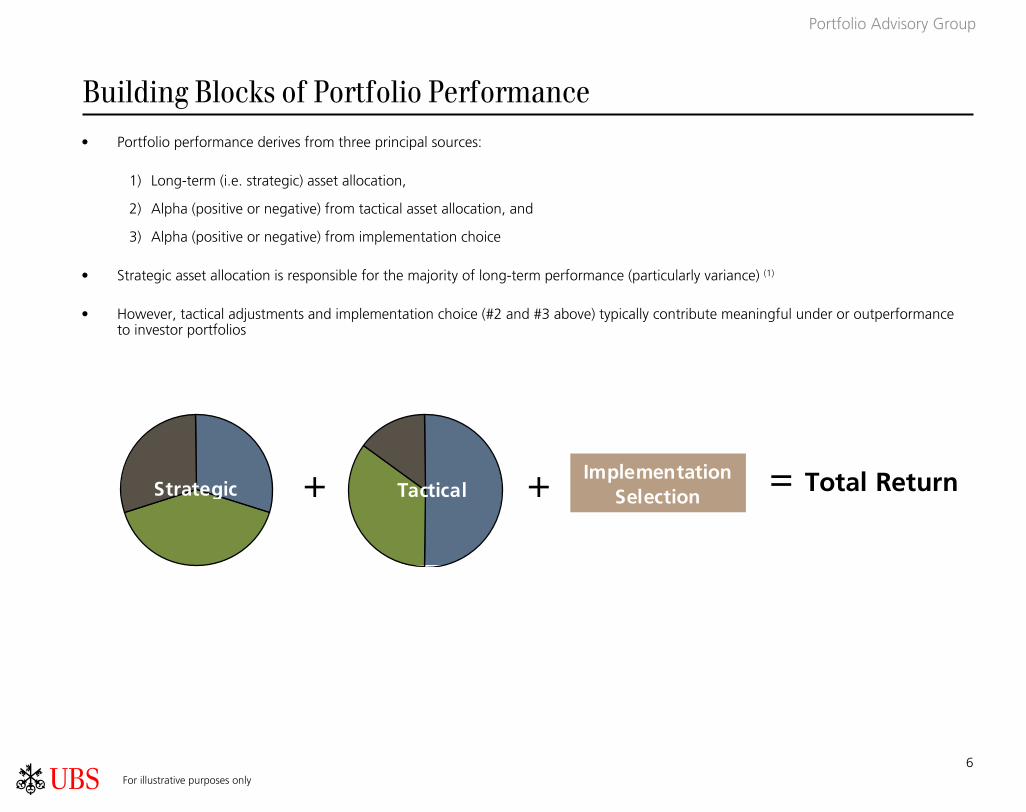
Building Blocks of Portfolio Performance• Portfolio performance derives from three principal sources:
1) Long-term (i.e. strategic) asset allocation,
2) Alpha (positive or negative) from tactical asset allocation, and
3) Alpha (positive or negative) from implementation choice
• Strategic asset allocation is responsible for the majority of long-term performance (particularly variance) (1)
• However, tactical adjustments and implementation choice (#2 and #3 above) typically contribute meaningful under or outperformanceto investor portfolios
+ Implementation Selection
= Total ReturnStrategic Tactical+
For illustrative purposes only
7
ab
Portfolio Advisory Group
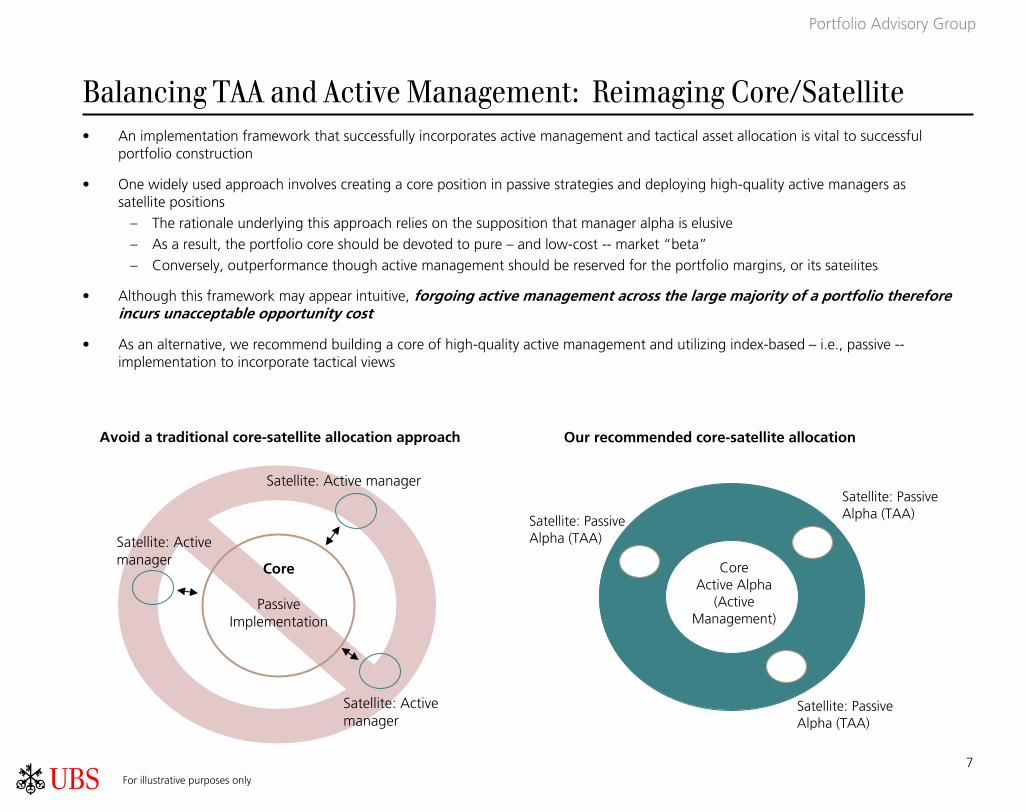
Balancing TAA and Active Management: Reimaging Core/Satellite• An implementation framework that successfully incorporates active management and tactical asset allocation is vital to successful
portfolio construction
• One widely used approach involves creating a core position in passive strategies and deploying high-quality active managers as satellite positions
– The rationale underlying this approach relies on the supposition that manager alpha is elusive
– As a result, the portfolio core should be devoted to pure – and low-cost -- market “beta”
– Conversely, outperformance though active management should be reserved for the portfolio margins, or its satellites
• Although this framework may appear intuitive, forgoing active management across the large majority of a portfolio therefore incurs unacceptable opportunity cost
• As an alternative, we recommend building a core of high-quality active management and utilizing index-based – i.e., passive --implementation to incorporate tactical views
Tactical
Core
Passive Implementation
Satellite: Active manager
Satellite: Active manager
Satellite: Active manager
Avoid a traditional core-satellite allocation approach Our recommended core-satellite allocation
For illustrative purposes only
Satellite: Passive Alpha (TAA)
Satellite: Passive Alpha (TAA)
Satellite: Passive Alpha (TAA)
CoreActive Alpha
(Active Management)
8
ab
Portfolio Advisory Group
1.11
1.78 1.781.63
2.33
1.591.46
2.52
1.78
3.24
0.00
0.50
1.00
1.50
2.00
2.50
3.00
3.50
Large Mid Small Emerging International
Alp
ha (%
)
Mutual Funds SMAs
7- Year Active Equity Alphas Outperformance Opportunity within Municipals
Source: PSN and Morningstar Direct
Active Management Plays a Vital Role
0%
1%
2%
3%
4%
5%
6%
0 5 10 15 20 25 30
Years to Maturity
Estim
ated
Tot
al R
etur
n
Estimated Total Return
Efficient Curve Points
Source: UBS Global Asset Management (as of 12/31/2010)
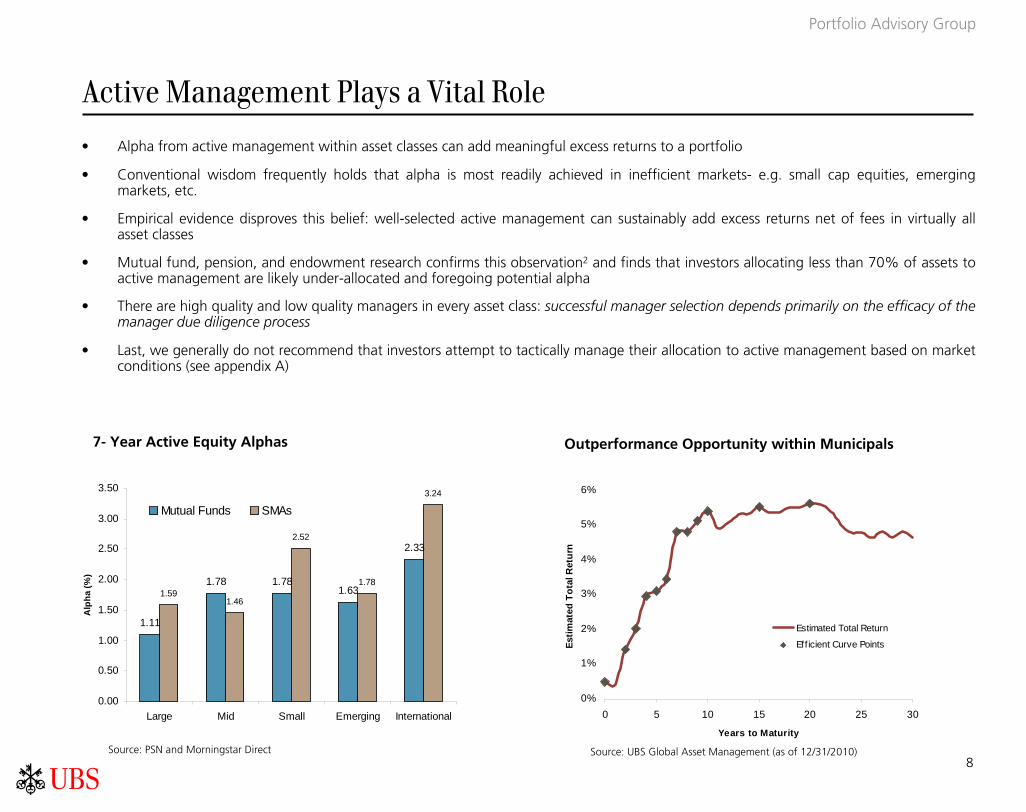
• Alpha from active management within asset classes can add meaningful excess returns to a portfolio
• Conventional wisdom frequently holds that alpha is most readily achieved in inefficient markets- e.g. small cap equities, emerging markets, etc.
• Empirical evidence disproves this belief: well-selected active management can sustainably add excess returns net of fees in virtually all asset classes
• Mutual fund, pension, and endowment research confirms this observation2 and finds that investors allocating less than 70% of assets to active management are likely under-allocated and foregoing potential alpha
• There are high quality and low quality managers in every asset class: successful manager selection depends primarily on the efficacy of the manager due diligence process
• Last, we generally do not recommend that investors attempt to tactically manage their allocation to active management based on market conditions (see appendix A)

9
ab
Portfolio Advisory Group
Tactical Asset Allocation Also Plays a Vital Role
Managing the level of portfolio risk can lead to outperformance Asset Class Performance is Highly Disparate
0.8
1
1.2
1.4
1.6
1.8
2
Jan-93 Jan-96 Jan-99 Jan-02 Jan-05 Jan-08 Jan-11
Gro
wth
of $
1 (lo
g)
US Government US MuniUS Credit US High YieldGlobal ex US Debt EM DebtUS Large Cap US Mid CapUS Small Cap Ex-US DevelopedEmerging Commodities
0
50
100
150
200
250
300
350
Jan-96 Jan-99 Jan-02 Jan-05 Jan-08 Jan-11
50/50 SAATAA
Source: Bloomberg, Portfolio Advisory Group
• Tactical asset allocation includes two principal facets:– Setting the absolute level of portfolio risk -- higher or lower -- based on existing market conditions, and– Distributing portfolio risk among asset classes
• Both aspects, successfully managed, can have a large impact on total portfolio returns
• To the extent that geopolitical and economic risk continue to manifest as short-term spikes in financial market volatility – which we believe is likely – tactical asset allocation will likely play an increasingly critical role in portfolio management
• Mutual fund, pension, and endowment data confirms that tactical asset allocation has provided meaningful return enhancement
• The bottom left chart illustrates the impact of a simple, “risk on/risk off” TAA mechanism. This model shifts assets from a 50/50 fixed income/equity SAA to either 40/60 or 60/40 FI/equity based on predicting the succeeding-twelve-month returns with perfect accuracy
• The bottom right chart illustrates returns for various asset classes -- large return dispersions over short periods create significant opportunity for enhancing overall performance through cyclical risk allocation among asset classes
10
ab
Portfolio Advisory Group
Active-Passive Macro Asset Class Guidelines
Tactical
Target Active Fulfillment by Macro Asset Class
Low High Midpoint
Fixed Income 80% 100% 90%
Global Equities 75% 85% 80%
Commodities 0% 20% 10%
Hedge Fund Strategies 90% 100% 95%
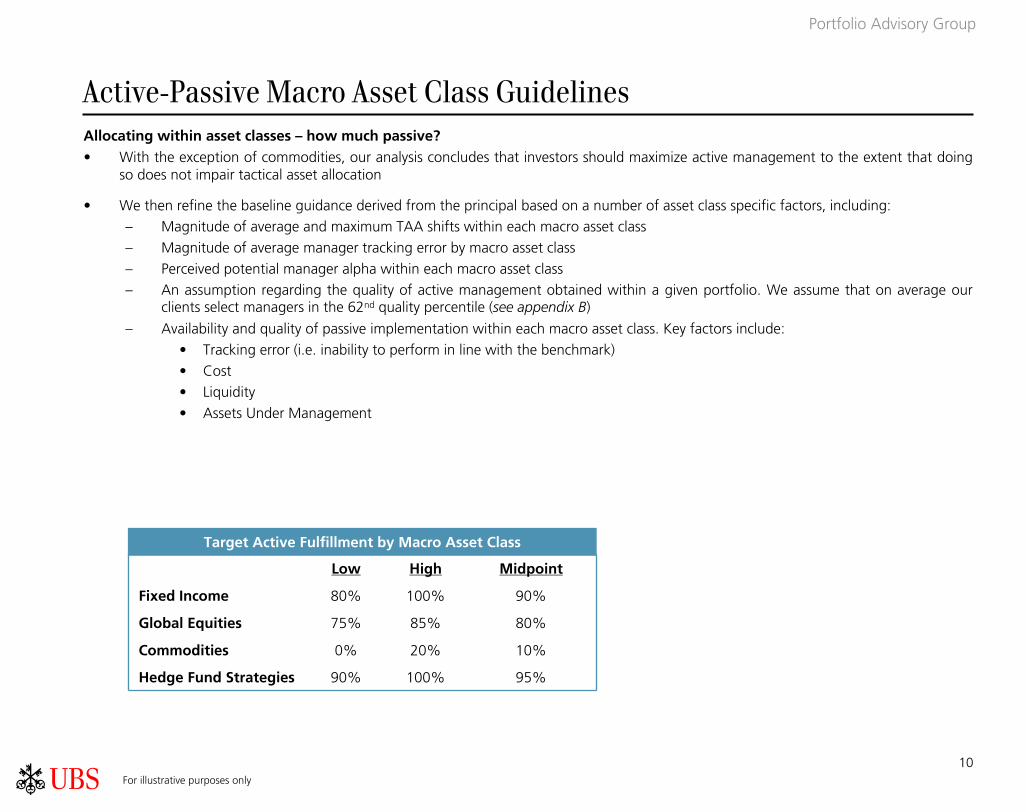
Allocating within asset classes – how much passive?• With the exception of commodities, our analysis concludes that investors should maximize active management to the extent that doing
so does not impair tactical asset allocation
• We then refine the baseline guidance derived from the principal based on a number of asset class specific factors, including:
– Magnitude of average and maximum TAA shifts within each macro asset class
– Magnitude of average manager tracking error by macro asset class
– Perceived potential manager alpha within each macro asset class
– An assumption regarding the quality of active management obtained within a given portfolio. We assume that on average our clients select managers in the 62nd quality percentile (see appendix B)
– Availability and quality of passive implementation within each macro asset class. Key factors include:
• Tracking error (i.e. inability to perform in line with the benchmark)
• Cost
• Liquidity
• Assets Under Management
For illustrative purposes only

11
ab
Portfolio Advisory Group
y = 0.5x - 1.2
R2 = 0.3
-10
-5
0
5
10
15
0 2 4 6 8 10 12
Tracking Error (%)A
lph
a (%
)Source: PSN and Morningstar Direct
Equity Manager Tracking error vs. alpha*
* Alpha is a risk-adjusted measure of the active return on an investments. Tracking error is a measure of how closely a portfolio follows the index to which it is benchmarked.
Equity Guidelines
Allocating within equity– how much passive?• High quality active and passive implementation are both widely
available in equity markets
• The upper bound for tactical deviations for a moderate risk profile investor is about 27% of equity portfolio assets
• Accordingly, we advise creating a large core portfolio of activemanagement (75-85% of assets) and utilizing indexed products to achieve specific tactical positioning
- For more information, please see Strategic Insights: A Framework for Managing Active and Passive Implementation in an Equity Portfolio
Allocating within equity – what type of manager?
• Within active management, flexible managers that are not benchmark-focused tend to exhibit greater outperformance over full market cycles
• Some long-short equity funds are also suitable equity portfolio implementations
• Manager constraints have the potential to reduce alpha opportunities
• The chart on the right illustrates this point – as manager tracking error increases, average alpha also increased over the last 7 years
• Please see Appendix C for more information on outperformancepotential for narrow vs. broad mandate active management
12
ab
Portfolio Advisory Group
Fixed Income Guidelines
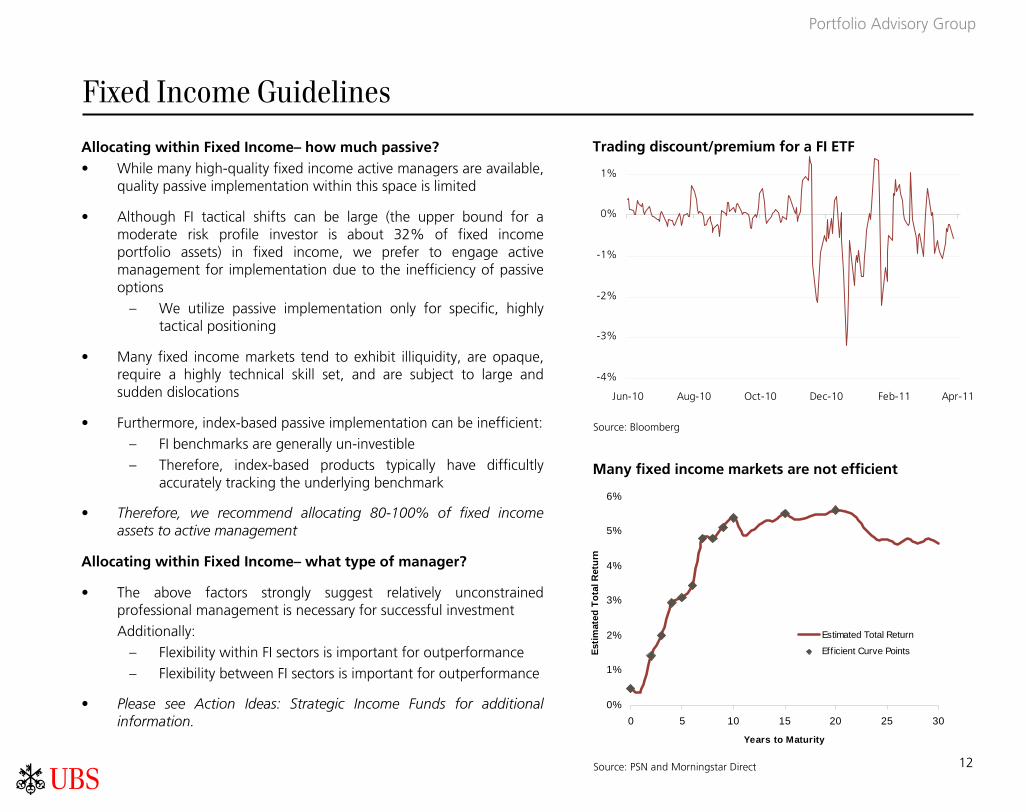
Allocating within Fixed Income– how much passive?• While many high-quality fixed income active managers are available,
quality passive implementation within this space is limited
• Although FI tactical shifts can be large (the upper bound for a moderate risk profile investor is about 32% of fixed income portfolio assets) in fixed income, we prefer to engage active management for implementation due to the inefficiency of passiveoptions
– We utilize passive implementation only for specific, highly tactical positioning
• Many fixed income markets tend to exhibit illiquidity, are opaque, require a highly technical skill set, and are subject to large and sudden dislocations
• Furthermore, index-based passive implementation can be inefficient:
– FI benchmarks are generally un-investible
– Therefore, index-based products typically have difficultly accurately tracking the underlying benchmark
• Therefore, we recommend allocating 80-100% of fixed income assets to active management
Allocating within Fixed Income– what type of manager?
• The above factors strongly suggest relatively unconstrained professional management is necessary for successful investment
Additionally:
– Flexibility within FI sectors is important for outperformance
– Flexibility between FI sectors is important for outperformance
• Please see Action Ideas: Strategic Income Funds for additional information.
Trading discount/premium for a FI ETF
-4%
-3%
-2%
-1%
0%
1%
Jun-10 Aug-10 Oct-10 Dec-10 Feb-11 Apr-11
Source: Bloomberg
Source: PSN and Morningstar Direct
0%
1%
2%
3%
4%
5%
6%
0 5 10 15 20 25 30
Years to Maturity
Estim
ated
Tot
al R
etur
n
Estimated Total Return
Efficient Curve Points
Many fixed income markets are not efficient

13
ab
Portfolio Advisory Group
0%
5%
10%
15%
20%
25%
1 2 3 4 5 6
Number of Commodity Sectors
Commodity Guidelines
0
100
200
300
400
500
600
700
800
Jan-96 Jan-98 Jan-00 Jan-02 Jan-04 Jan-06 Jan-08 Jan-10
S&P GSCI TRS&P GSCI Agriculture TRS&P GSCI Energy TRS&P GSCI Precious Metals TRS&P GSCI Industrial Metals TRS&P GSCI Livestock TR
Allocating within commodities– how much passive?• High-quality passive commodity-based investment vehicles are
available for commodity implementation
• Index-based commodity implementation provides:
– Transparency
– Relatively low fees
– Broad-based or commodity specific exposure
– Additionally, many indexed products provide "smart-role" characteristics to help mitigate negative roll yield
• Conversely, long-only commodity portfolio managers tend to exhibit relatively little meaningful benchmark deviation
– Correspondingly, we find that alpha production in commodity managers tends to be low and inconsistent
• Commodity sectors tend to be uncorrelated over time
– This results in large risk-reduction benefits from diversification
– It also results in opportunity for tactical asset allocation
• Therefore, we recommend allocating 0-20% of commodity assets to active management
Commodity Portfolio Implementation
• Unlike equity and fixed income implementation, we suggest:
– Investors focus on building a well-diversified passively implemented portfolios that achieve the TAA target
– Utilize high-conviction active management as satellite positions
Commodity Risk Reduction Benefit from Diversification
Source: Bloomberg, Hedge Fund Research, Inc.
Source: Bloomberg
Commodity Sectors Are Generally Uncorrelated
14
ab
Portfolio Advisory Group
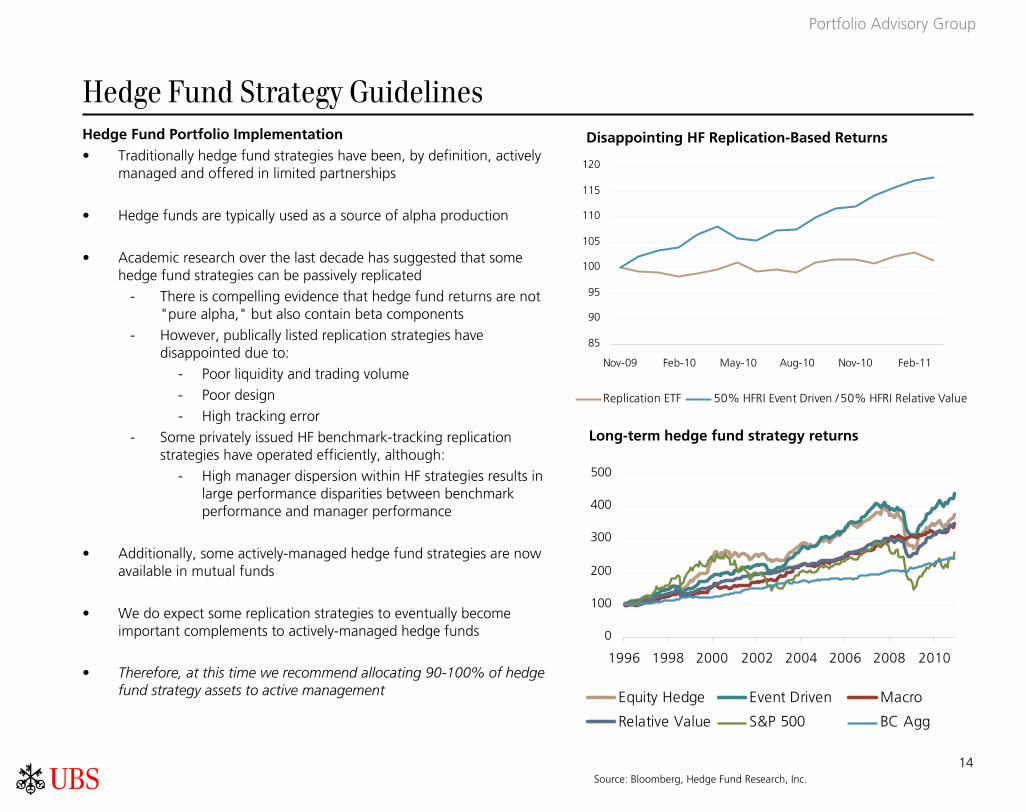
Hedge Fund Strategy GuidelinesHedge Fund Portfolio Implementation• Traditionally hedge fund strategies have been, by definition, actively
managed and offered in limited partnerships
• Hedge funds are typically used as a source of alpha production
• Academic research over the last decade has suggested that some hedge fund strategies can be passively replicated
- There is compelling evidence that hedge fund returns are not "pure alpha," but also contain beta components
- However, publically listed replication strategies have disappointed due to:
- Poor liquidity and trading volume
- Poor design
- High tracking error
- Some privately issued HF benchmark-tracking replication strategies have operated efficiently, although:
- High manager dispersion within HF strategies results in large performance disparities between benchmark performance and manager performance
• Additionally, some actively-managed hedge fund strategies are now available in mutual funds
• We do expect some replication strategies to eventually become important complements to actively-managed hedge funds
• Therefore, at this time we recommend allocating 90-100% of hedge fund strategy assets to active management
Source: Bloomberg, Hedge Fund Research, Inc.
0
100
200
300
400
500
1996 1998 2000 2002 2004 2006 2008 2010
Equity Hedge Event Driven Macro
Relative Value S&P 500 BC Agg
Long-term hedge fund strategy returns
85
90
95
100
105
110
115
120
Nov-09 Feb-10 May-10 Aug-10 Nov-10 Feb-11
Replication ETF 50% HFRI Event Driven / 50% HFRI Relative Value
Disappointing HF Replication-Based Returns

15
ab
Portfolio Advisory Group
Appendix A: Tactical Considerations – Timing Active/Passive Deployment
0
10
20
30
40
50
60
70
80
90
Feb-01 Jul-02 Dec-03 May-05 Oct-06 Mar-08 Aug-09 Jan-11
Average
Some market conditions favor active management• We have found that active equity managers tend to outperform in a
range of market conditions:
– Intra-market correlation between securities is muted
– Market volatility is near its long-term average
– Markets are declining in value (see chart, bottom right)
• However, the potential benefit of tactically adjusting active management is generally outweighed by tax and transaction cost considerations
Most investors should not try to time active management• The estimated additional return from tactically timing the
portfolio allocation to active management is small
• Investors also incur transaction costs and tax consequences whenshifting in and out of active management
• Therefore, we believe that attempting to significantly adjust the proportion of assets allocated to active management on a tactical basis is usually counterproductive
• We therefore recommend that investors focus on selecting managers they believe will outperform over a full market cycle rather than attempting to "time" active management
Source: PSN as of December 31, 2010. S&P 500 Index includes the leading 500 companies in the U.S.
The above example is for informational purposes only and is not an investment recommendation
Source: Bloomberg. VIX Index measures the implied volatility of S&P 500 index options.
Equity market volatility index (VIX)
-9
-6
-3
0
3
6
9
12
-30 -20 -10 0 10 20 30 40
S&P 500 Total Return (%)
Med
ian
Alp
ha (
%)
Median Alpha
Predicted Median Alpha
Market returns and manager alpha
16
ab
Portfolio Advisory Group
Appendix B: Active Manager Monte Carlo Analysis
Portfolio Resampling• The allocation decision between active and passive implementation rests on the cost-adjusted outperformance of active management
• Utilizing SMA and MF manager databases, we constructed generic manager data series representing manager quality, measured as information ratio, in the 25th, 50th, 62.5th, and 75th percentile of all managers. A manager in the 99th percentile is in the top 1% of all managers, and a manager in the 1st percentile is in the bottom 1% of all managers.
• Although active management in the 50th and above percentile outperforms passive investment, on average, even the best active managers don't outperform in all periods
– Therefore, the optimal amount of active management, assuming the ability to pick managers of at least average quality, is greater than zero but less than 100%
– However, the right amount is not apparent
– A simulation-based (Monte Carlo) process is helpful for pinpointing the answer
• The simulation process, referred to as portfolio resampling, operates as follows:
– Randomly sample a vector of means and a covariance matrix from the data set (the generic manager series and the corresponding passive implementation)
– Calculate a mean-variance efficient frontier based on the sample estimates
– Average the resampled weights to form the unbiased starting point
– Repeat until convergence.
– Select the allocation of active passive with the highest Sharpe Ratio as the baseline allocation
• The resampled moderate risk portfolio then provides a reasonable neutral starting point for the application of other portfolio management considerations.
• We have assumed that investors will successfully select managers in the 62.5th quality percentile in making our recommendations
17
ab
Portfolio Advisory Group
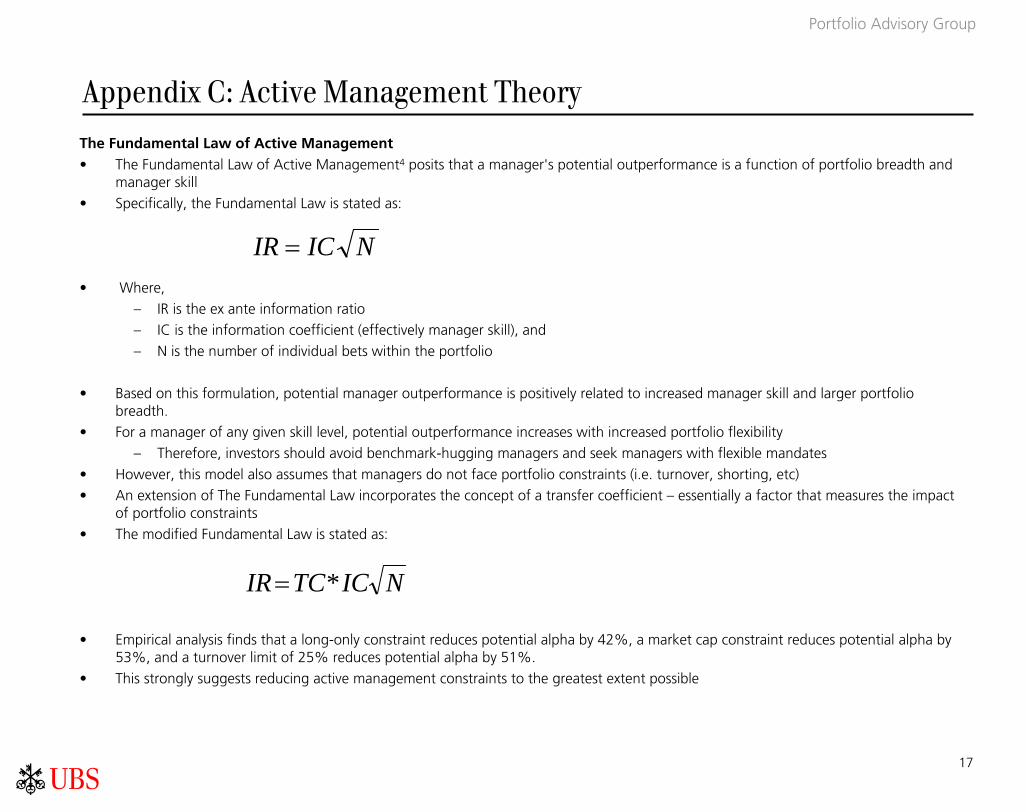
The Fundamental Law of Active Management• The Fundamental Law of Active Management4 posits that a manager's potential outperformance is a function of portfolio breadth and
manager skill
• Specifically, the Fundamental Law is stated as:
• Where,
– IR is the ex ante information ratio
– IC is the information coefficient (effectively manager skill), and
– N is the number of individual bets within the portfolio
• Based on this formulation, potential manager outperformance is positively related to increased manager skill and larger portfolio breadth.
• For a manager of any given skill level, potential outperformance increases with increased portfolio flexibility
– Therefore, investors should avoid benchmark-hugging managers and seek managers with flexible mandates
• However, this model also assumes that managers do not face portfolio constraints (i.e. turnover, shorting, etc)
• An extension of The Fundamental Law incorporates the concept of a transfer coefficient – essentially a factor that measures the impact of portfolio constraints
• The modified Fundamental Law is stated as:
• Empirical analysis finds that a long-only constraint reduces potential alpha by 42%, a market cap constraint reduces potential alpha by 53%, and a turnover limit of 25% reduces potential alpha by 51%.
• This strongly suggests reducing active management constraints to the greatest extent possible
NICIR =
NICTCIR *=
Appendix C: Active Management Theory

18
ab
Portfolio Advisory Group
Sources
(1) Brinson, G. P., L. R. Hood, and G. L. Beebower, 1986, Determinants of Portfolio Performance,"Financial Analysts Journal, 42, 39/48.
Brinson, G. P., B. D. Singer, and G. L. Beebower, 1991, Determinants of Portfolio Performance II: An Update," Financial Analysts Journal, 47,40/48.
(2) NACUBO; Brown, Keith C. and Tiu, Cristian Ioan, Do Endowment Funds Select the Optimal Mix of Active and Passive Risks? (March 10, 2010). Journal of Investment Management (JOIM), First Quarter 2010. Available at SSRN: http://ssrn.com/abstract=1568446
Brown, Keith C., Tiu, Cristian Ioan and Garlappi, Lorenzo, The Troves of Academe: Asset Allocation, Risk Budgeting, and the Investment Performance of University Endowment Funds (August 8, 2007). McCombs Research Paper Series No. FIN-03-07. Available at SSRN: http://ssrn.com/abstract=981436
(3) Grinold, R. (1989). “The Fundamental Law of Active Management,” Journal of Portfolio Management 15, 30–37.
Thorley, Steven, Portfolio Constraints and the Fundamental Law of Active Management (November 2001). Available at SSRN: http://ssrn.com/abstract=290916 or doi:10.2139/ssrn.290916
19
ab
Portfolio Advisory Group
Important Information
Wealth Management Solutions Portfolio Advisory Group
The Wealth Management Solutions' Wealth Planning and Portfolio Advisory ("Portfolio Advisory Group") is a business group within UBS Financial Services Inc. that delivers asset allocation, portfolio strategy and comprehensive wealth management solution insights to our Financial Advisors and their clients. The group is also responsible for authoring publications made available to both UBS employees and clients including the Action Ideas series and Seeking Alpha series.
Portfolio Advisory Group has created the Strategic Insights: Optimizing the use of Active and Passive Management in Portfolio Construction piece to discuss how investors should manage an equity portfolio. Unless otherwise noted, the views were developed by the Portfolio Advisory Group. In the context of making actual investment decisions, clients should work with their Financial Advisors to customize their portfolios to meet their unique financial and life circumstances, including age, risk tolerance, financial commitments and short-term liquidity needs. In addition, each UBS program, product or service is subject to specific eligibility and suitability requirements, each of which must be met in order for a client to invest.
Implementing or changing an investment strategy may result in incurring gains or losses for income tax purposes. Neither UBS Financial Services, Inc., nor any of its employees, provides tax or legal advice. We encourage all investors to consult qualified tax and legal counsel where appropriate, particularly before undertaking any investment in a product that may use leverage, options, derivatives or other complex financial structures. Finally, nothing contained herein should be construed as an offer to sell or as a solicitation of an offer to buy securities or other investments identified. Unless otherwise noted, all information in the Strategic Insights: Optimizing the use of Active and Passive Management in Portfolio Construction is as of May 2, 2011.
Important Information
It is important that you understand the ways in which we conduct business and the applicable laws and regulations that govern us. As a firm providing wealth management services to clients in the U.S., we are registered with the U.S. Securities and Exchange Commission (SEC) as an investment adviser and a broker-dealer, offering both investment advisory and brokerage services. Though there are similarities among these services, the investment advisory programs and brokerage accounts which we offer are separate and distinct, differ in material ways and are governed by different laws and separate contracts.
It is important that you carefully read the agreements and disclosures that we provide to you about the products or services we offer. While we strive to ensure the nature of our services is clear in the materials we publish, if at any time you seek clarification on the nature of your accounts or the services you receive, please speak with your Financial Advisor.
For more information, please visit our website at www.ubs.com/workingwithus.
20
ab
Portfolio Advisory Group
Important Information
Important Information Regarding UBS Wealth Management ResearchTwo sources of research are available to clients of UBS Financial Services Inc. Reports from the first source, UBS Wealth Management Research, are designed primarily for use by individual investors and are produced by UBS Wealth Management Americas (the UBS business group that includes, among others, UBS Financial Services Inc.) and UBS Wealth Management & Swiss Bank. The second source is UBS Investment Research, and its reports are produced by UBS Investment Bank, whose primary business focus is institutional investors. The two sources may have different opinions and recommendations. The various research content provided does not take into account the unique investment objectives, financial situation or particular needs of any specific individual investor. If you have any questions, please consult your Financial Advisor. UBS Wealth Management Research is provided by UBS Financial Services Inc. and UBS AG. UBS Financial Services Inc. is a subsidiary of UBS AG.
Important Information Regarding UBS Strategic and Tactical Asset Allocation Models
The strategic asset allocation models presented represent the longer-term allocation of assets that is deemed suitable for a particular type of investor. The strategic asset allocations presented in this Guide have been developed by UBS Investment Solutions, a business sector within UBS Wealth Management Americas, that develops research-based traditional investments (e.g., managed accounts and mutual fund programs) and alternative strategies (e.g., hedge funds, private equity and real estate) offered to UBS clients. These allocation models are provided for illustrative purposes only. They were designed by UBS Investment Solutions for hypothetical U.S. investors with a total return objective under five different investor profiles: conservative, moderate conservative, moderate, growth and aggressive. Please note that UBS has changed its strategic asset allocation models in the past and may do so in the future.
The process by which UBS Investment Solutions has derived the strategic asset allocations can be described as follows. First, an allocation is made to broad asset classes based on the InvestorProfile. This is accomplished using optimization methods within a mean-variance framework. Based on a proprietary set of capital market assumptions, including expected returns, risk and correlation of different asset classes, combinations of the broad asset classes are computed. A qualitative judgmental overlay is then applied to the output of the optimization process to arrive at the strategic asset allocation models. The capital market assumptions are developed by UBS Global Asset Management.
The tactical asset allocation models presented reflect the strategic asset allocation models overlayed with the tactical shift that has been identified by the UBS Wealth Management Americas Investment Committee (WMA-IC), which is made up of members from various business groups within UBS Wealth Management Americas, including UBS Wealth Management Research-Americas, UBS Investment Solutions and Investment Strategy Group. Note that UBS Wealth Management Research-Americas also publishes tactical asset allocations in its Investment Strategy Group Guide, as well as "Current Allocations" which reflects the strategic asset allocations overlayed with UBS Wealth Management Research-Americas tactical allocations. The Current Allocations shown in the Investment Strategy Group Guide may differ from the tactical asset allocation models presented in this Guide.
In general, strategic and target asset allocations will differ based on the general characteristics of the respective investor profile, including risk tolerance, return objectives and time horizon. Accordingly, the asset allocations presented may not be suitable for all investors or investment goals and should not be used as the sole basis of any investment decision. As always, please consult your UBS Financial Advisor to see how these weightings should be applied or modified according to your individual profile and investment goals.
21
ab
Portfolio Advisory Group
Important Information
Important Information Regarding Certain Investments and Investment StrategiesEquities and fixed income instruments are subject to market risk and will undergo price fluctuations in which downward and upward trends may occur over short or extended periods. The principalvalue of fixed income instruments may fluctuate due to interest rate changes and other factors. Equity securities, historically, have shown greater growth potential than other types of securities, but they have also shown greater volatility. Small-cap securities may be relatively highly volatile because the earnings and business prospects typically fluctuate more than larger-cap companies. International securities involve considerations and potential risks not typically associated with domestic securities, including risks associated with changes in currency values, economic, political and social conditions, loss of market liquidity, the regulatory environment of the respective country and difficulties in receiving current or accurate information.
Corporate Bonds: Fixed income securities are subject to market risk and interest rate risk. If sold in the secondary market prior to maturity, investors may experience a gain or loss depending on interest rates, market conditions and the credit quality of the issuer. Should an issue be called, investors may be faced with an earlier than anticipated reinvestment decision, possibly at lower rates.
Call Risk: Should an issue be called, investors may be faced with an earlier than anticipated reinvestment decision, and may be unable to reinvest their principal at equally favorable rates.
Interest Rate Risk: Corporate bonds are subject to market value fluctuations as interest rates rise and fall. If sold prior to maturity, the price received for an issue may be less than the original purchase price.
Reinvestment Risk: Since most corporate issues pay interest semiannually, the reinvestment of coupon payments over the life of the bond can have a major impact on the bond‘s total return.
Credit/Event Risk: Corporate investments are subject to event risk and changes in credit quality of the issuer. Companies can experience increased competition, takeovers and other economic situations that may have adverse effects on the market value of their securities.
Call Provisions: When evaluating the purchase of a corporate bond, one should be aware of any features that may allow the issuer to call the security. This is particularly important when considering an issue that is trading at a premium to its call price, since the return may be negatively impacted if the issue is redeemed.
High Yield Bonds: Investing in high yield bonds involves taking on the risk of a complete loss of principal. Clients who invest in high yield bonds should be very comfortable that they understand the risks of each of their investments and that they have appropriately diversified their portfolio.
Municipal Securities: UBS Financial Services Inc. does not provide tax or legal advice. Please contact your tax advisor regarding the suitability of tax-exempt investments in your portfolio. Income from municipal bonds may be subject to state and local taxes based on residency of the investor and may be subject to the Alternative Minimum Tax. Call features may exist that can impact yield. If sold prior to maturity, investments in municipal securities are subject to gains/losses based on the level of interest rates, market conditions and credit quality of the issuer.
Municipals DisclosuresInvestor Concerns: Fixed income securities are subject to market risk and interest rate risk. If sold in the secondary market prior to maturity, investors may experience a gain or loss depending on interest rates, market conditions and the credit quality of the issuer. A zero coupon bond pays all interest at maturity, and is purchased at a discount to the maturity value (par). The difference between the purchase price and the maturity value is the interest earned on the bond. (If a zero coupon bond is purchased at a discount to its compounding yield, there may be a taxable capitalgain.) Because they may be more volatile than current coupon bonds, zero coupon municipal bonds may not be suitable for investors concerned about a rise in interest rates or who need current income. Income from municipal bonds may be subject to state and local taxes as well as the Alternative Minimum Tax. Call features may exist that can impact yield. If sold prior to maturity, investments in municipal securities are subject to gains/losses based on the level of interest rates, market conditions and credit quality of the issuer. UBS Financial Services Inc. does not provide tax, legal or accounting advice. Investors should contact their tax advisor regarding the suitability of tax-exempt investments in their portfolio and their accounting advisor to determine the appropriate accounting treatment Additional information available upon request.
U.S. Treasury TIPS: The market for U.S. Treasury TIPs may not be as active or liquid as the secondary market for Treasury fixed-principal securities. In addition, TIPS are not as widely traded or as well understood as Treasury fixed-principal securities. Lesser liquidity and fewer market participants may result in larger spreads between the dealer-bid and the dealer-offered side of the market for inflation-protected securities than the bid-asked spreads for fixed-principal securities with the same time to maturity. Larger bid-asked spreads normally result in higher transaction costs and/orlower overall returns.
Inflation Indexed Securities: An investment in securities with principal or interest determined by reference to an inflation index involves factors not associated with an investment in a fixed coupon and principal security, such as the inflation index may be subject to significant changes; that changes in the index may or may not correlate to changes in interest rates generally or with changes in other indexes and that the resulting interest may be greater or less than that payable on other securities of similar maturities. Historic performance of the index is not necessarily indicative of future performance. Movements in the index that have occurred in the past are not necessarily indicative of changes that may occur in the future which may be greater or smaller than those that have occurred historically. Investors should not rely on any historical changes or trends in the index as an indicator of future changes in the index. There is no guarantee made as to an active and liquid secondary market for these securities.

22
ab
Portfolio Advisory Group
Important Information
Important Information Regarding Certain Investments and Investment Strategies (continued)Emerging Market Investments: Investors should be aware that Emerging Market assets are subject to, amongst others, potential risks linked to currency volatility, abrupt changes in the cost of capital and the economic growth outlook, as well as regulatory and socio-political risk, interest rate risk and higher credit risk. Assets can sometimes be very illiquid and liquidity conditions can abruptly worsen. Investors interested in holding bonds for a longer period are advised to select the bonds of those sovereigns with the highest credit ratings (in the investment grade band). Such an approach should decrease the risk that an investor could end up holding bonds on which the sovereign has defaulted. Sub-investment grade bonds are recommended only for clients with a higher risk tolerance and who seek to hold higher yielding bonds for shorter periods only
Preferred Stocks: Subject to Interest Rate Risk- Fixed income securities are subject to market value fluctuation given changes in the level of interest rates. For example, if interest rates rise, the value of this security could decline. Credit Quality Fluctuations – Adverse changes in the credit quality of the issuer may negatively impact the market value of the securities. Call Risk - The securities may be redeemed beginning on their call date, or at any time upon a special event (a change in tax law that adversely affects the Company with regard to the Securities). If called, holders may face a reinvestment decision at possibly lower future rates. Liquidity - While NYSE listing does provide some degree of liquidity, there is no guarantee made as to an active and liquid secondary market for any issue. Additional Risks that may be associated with investing in Preferred Stock:Trust Preferred Securities: Option to defer interest payment - At any time, the Corporation has the right to defer distribution payments for up to 20 consecutive quarters. If this occurs, holders of the securities will be required to recognize the accreted income for tax purposes ahead of receipt of the cash. Dividend Received Deduction (DRD)-Is a tax credit for corporate holders on received dividends. DRD allows qualified U.S Corporations (except Sub-Chapter “S” Corporations) to exclude from federal income taxation under current regulations 70% of dividends received from the preferred stocks of other corporations. This credit increases to 80% in the case of any dividend from a 20%owned corporation. DRD does not apply for individuals. In order to qualify, for this deduction, the securities must be held a minimum of 46 days.Tax-Advantaged Preferred: Subject to applicable limitations that may vary depending upon a holder’s individual circumstances, dividends paid to non-corporate holders in taxable years beginning before January 1, 2009 will constitute “qualified dividend income” that will be taxable at a maximum rate of 15%. Current or future proposed legislation may alter the tax treatment of this security.
Convertible Securities: Equities and fixed income instruments are subject to market risk and will undergo price fluctuations in which downward and upward trends may occur over short or extended periods. The principal value of fixed income instruments may fluctuate due to interest rate changes and other factors. Equity securities, historically, have shown greater growth potential than other types of securities, but they have also shown greater volatility. Small-cap securities may be highly volatile because the earnings and business prospects typically fluctuate more than larger-cap companies. International securities involve considerations and potential risks not typically associated with domestic securities, including risks associated with changes in currency values, economic, political and social conditions, loss of market liquidity, the regulatory environment of the respective country and difficulties in receiving current or accurate information.
Structured Products: Structured products involve risks. These risks can include, but are not limited to: fluctuations in the price, level or yield of underlying instruments, interest rates, currency values and credit quality, substantial or complete loss of principal, limits on participation in the appreciation of the underlying instrument, limited liquidity/limited or no secondary market for the structured product, credit risk of the issuer of the structured product, potential conflicts of interest between the investor and the business activities of UBS, other issuers of structured products or their respective affiliates. Investor concerns: The returns on structured products are linked to the performance of the relevant underlying asset or index. Investing in a structured product is not equivalent to investing directly in the underlying asset or index. Clients should carefully read the detailed explanation of risks, together with other information in the relevant offering materials including, but not limited to, information concerning the tax treatment of the investment before investing in any structured product. Structured products are debt obligations of the issuer. Investors should be comfortable with the credit risk of the issuer before purchasing a structured product. UBS Financial Services Inc. does not guarantee in any way the financial condition of the issuer or the accuracy of any financial information provided by the issuer.
Managed Accounts: For complete information regarding an investment manager, including their fees and performance, see the manager’s Form ADV, Part II. For information regarding managers participating in ACCESS or other UBS investment advisory program, your Financial Advisor can provide additional information, including the respective program's disclosure brochure.
Mutual Funds and ETFs: Mutual funds and exchange traded funds are sold by prospectus. For more complete information about a fund, including the investment objectives, charges, expenses and risk factors, contact your Financial Advisor for a free prospectus. The prospectus contains this and other important information that you should read and consider carefully before investing. Investors should be aware that the value of mutual funds and exchange traded funds changes from day to day. Therefore, an investment's return and principal value will fluctuate so that an investor's shares, when redeemed or sold, may be worth more or less than their original cost.
Money Market Funds: An investment in a money market fund is not a bank deposit and is neither secured nor guaranteed by the Federal Deposit Insurance Corporation or any other government agency. While money market funds seek to maintain the value of your investment at $1.00 per share, you may lose money by investing in any money market fund.