strategic plan progress reportrtachicago.org/files/documents/plansandprograms/2015 rta...
TRANSCRIPT

2015
STRATEGIC PLANPROGRESS REPORT

THE 2013-2018 REGIONAL TRANSIT STRATEGIC PLAN The 2013-2018 Regional Transit Strategic Plan establishes a common vision for transit in Northeastern Illinois and sets priorities over five years, positioning transit agencies to respond effectively to developing issues.
This Progress Report highlights the contributions of our agencies over the last year (2014-2015) towards implementing the plan.
The biggest challenge in 2015 is threatened funding at the state and federal levels. The Service Boards strive to operate valuable services under tight financial constraints, but if funding is reduced service and fare levels may need to be adjusted.
On the capital investment side, the gap between annual reinvestment needs and projected funding is growing. The lack of a new federal transportation funding bill and state capital program makes planning future transit investments difficult. A long-term solution for infrastructure funding is a top priority.
Last year marked the second consecutive year of ridership declines across the system, but at the same time rail ridership is increasing and nearing all-time highs. Transit supportive markets
such as zero-car households are growing while average transit trip lengths are increasing. Strategically, the RTA will need to better understand the direction of these trends and is working to develop the tools needed to shed light on changing transit markets. To continue to grow we need to meet the needs of our core while also expanding into new markets.
2015
www.RTAChicago.org2
STRATEGIC PLAN PROGESS REPORT

A world-class regional public transportation system providing a foundation to the region’s prosperity, livability and vitality.
THE 2013-2018 REGIONAL TRANSIT STRATEGIC PLAN
Promotea green, livable and prosperous region
• Promote transit, both alone and in combination with walking and cycling, as an alternative to motor vehicle use.
• Reduce transit’s impact on the environment.
• Encourage Transit-Oriented Development by partnering with communities, employers and other stakeholders.
• Connect employers to a broad and diverse workforce.
• Partner with communities to improve transportation infrastructure that adds lasting value to all users.
Ensurefinancial viability
• Prioritize capital investments based on safety, State of Good Repair, reliability, ridership and operating costs.
• Control costs through improved operational efficiencies, effective management, coordinated planning, innovation and technology.
• Increase and stabilize revenue through existing and new funding sources in order to maintain reasonable fares.
Providevaluable, accessible,
and attractive transportation options
• Provide public transportation choices that link people to jobs, education, services, cultural activities and other life commitments.
• Connect communities within the region through an enhanced and coordinated transit network that provides reliable and time competitive transportation options.
• Ensure that the transit system is more accessible and easier to use.
• Deliver safe, clean, reliable and affordable transportation services.
• Provide a customer experience that offers modern amenities utilizing state-of-the-art technology.
Advocatefor and be a trusted
steward of public transportation
• Elevate transit’s needs by educating elected officials and citizens on the benefits of public transportation such as its contribution to the region’s economic vitality, sustainability and individual health and well-being.
• Engage the public in meaningful and constructive ways.
• Increase transparency through improved oversight and information availability.
• Attract more riders to the system by promoting regional programs and services to businesses and residents.
• Increase awareness of transit through coordinated marketing and promotion.
VISION
GOALS
OBJECTIVES
Continue to
2015
www.RTAChicago.org 3
STRATEGIC PLAN PROGESS REPORT
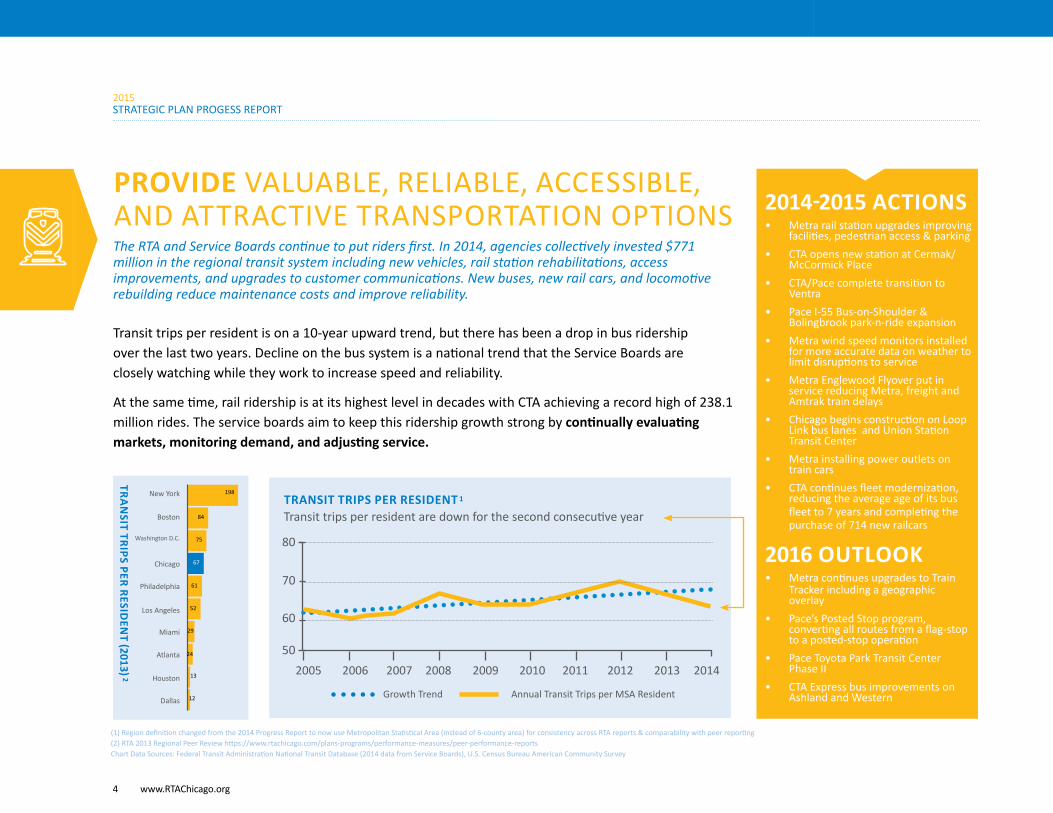
PROVIDE VALUABLE, RELIABLE, ACCESSIBLE, AND ATTRACTIVE TRANSPORTATION OPTIONSThe RTA and Service Boards continue to put riders first. In 2014, agencies collectively invested $771 million in the regional transit system including new vehicles, rail station rehabilitations, access improvements, and upgrades to customer communications. New buses, new rail cars, and locomotive rebuilding reduce maintenance costs and improve reliability.
Transit trips per resident is on a 10-year upward trend, but there has been a drop in bus ridership over the last two years. Decline on the bus system is a national trend that the Service Boards are closely watching while they work to increase speed and reliability.
At the same time, rail ridership is at its highest level in decades with CTA achieving a record high of 238.1 million rides. The service boards aim to keep this ridership growth strong by continually evaluating markets, monitoring demand, and adjusting service.
TRANSIT TRIPS PER RESIDENT 1 Transit trips per resident are down for the second consecutive year
80
70
60
502005 2006 2007 2008 2009 2010 2011 2012 2013 2014
Growth Trend Annual Transit Trips per MSA Resident
New York
Boston
Washington D.C.
Chicago
Philadelphia
Los Angeles
Miami
Atlanta
Houston
Dallas
198
84
75
61
52
29
24
13
12
67
TRAN
SIT TRIPS PER RESIDEN
T (2013)2
2014-2015 ACTIONS• Metra rail station upgrades improving
facilities, pedestrian access & parking• CTA opens new station at Cermak/
McCormick Place• CTA/Pace complete transition to
Ventra• Pace I-55 Bus-on-Shoulder &
Bolingbrook park-n-ride expansion• Metra wind speed monitors installed
for more accurate data on weather to limit disruptions to service
• Metra Englewood Flyover put in service reducing Metra, freight and Amtrak train delays
• Chicago begins construction on Loop Link bus lanes and Union Station Transit Center
• Metra installing power outlets on train cars
• CTA continues fleet modernization, reducing the average age of its bus fleet to 7 years and completing the purchase of 714 new railcars
2016 OUTLOOK• Metra continues upgrades to Train
Tracker including a geographic overlay
• Pace’s Posted Stop program, converting all routes from a flag-stop to a posted-stop operation
• Pace Toyota Park Transit Center Phase II
• CTA Express bus improvements on Ashland and Western
(1) Region definition changed from the 2014 Progress Report to now use Metropolitan Statistical Area (instead of 6-county area) for consistency across RTA reports & comparability with peer reporting (2) RTA 2013 Regional Peer Review https://www.rtachicago.com/plans-programs/performance-measures/peer-performance-reports Chart Data Sources: Federal Transit Administration National Transit Database (2014 data from Service Boards), U.S. Census Bureau American Community Survey
2015
www.RTAChicago.org4
STRATEGIC PLAN PROGESS REPORT

CHANGING MARKETS REQUIRE NEW INITIATIVESThe RTA continues to pursue increases in ridership in key markets that can be accommodated where there is capacity to carry more people on existing services. These include reverse commuters, older adults, and occasional riders. Other segments that have shown recent growth are also on our radar, several of which are showcased below.
ADA Paratransit
ADA paratransit ridership continues to grow, but year-over-year growth has averaged 6%, below the 7-8% annual growth projected after 2011. RTA continues to promote “Fixed Route First” while developing new ADA registration procedures to ensure the mobility needs of the region are met.
Transit Dependent
More residents in the region are living car-free, a trend that has been consistently rising for nearly a decade. Having the choice to live car-free makes the region more attractive and provides mobility to low-income residents.
Younger Commuters
Younger commuters are turning to transit for their work commute – the percent of this group using transit increased in 2013. Workers age 20-44 use transit more and have been increasing their share of transit for work trips at a greater rate than any other age group.
2011 2012 2013
3.4 M
4.1 M
2014
ANNUAL ADA PARATRANSIT TRIPS
2005 20052006 20062007 20072009 2009
11.6%
11.8%
10.8%11.5%
12.4% 13.6%
2014 20142010 20102011 20112012 20122008 2008
0-CAR HOUSEHOLDS (% OF REGION)1
TRANSIT MODESHARE1
(1) Region definition changed from the 2014 Progress Report to now use Metropolitan Statistical Area (instead of 6-county area) for consistency across RTA reports & comparability with peer reporting Chart Data Sources: Federal Transit Administration National Transit Database (2014 data from Service Boards), U.S. Census Bureau American Community Survey
Age 20-44 All Workers
2015
www.RTAChicago.org 5
STRATEGIC PLAN PROGESS REPORT

ENSURE FINANCIAL VIABILITYThe RTA and Service Boards continue to manage limited resources to ensure that the region operates with a balanced budget. RTA bonds were rated double-A by all three rating agencies in 2015.
Ensuring financial viability in the budget requires balance between costs and revenue. RTA and the Service Boards have controlled costs per revenue passenger mile, meeting RTA’s mandated requirement for a balanced budget. Metra increased fares in 2015 as part of a continuing regional strategy to keep fares on par with inflation; however, as costs rise with inflation, keeping revenue aligned with costs remains a constant challenge.
$0.00
$0.10
$0.20
$0.30
$0.40
$0.50
$0.60
$0.70
2005 2006 2007 2008 2009 2010 2011 2012 2013 2014
Operating Costs Public Operating Funding
Fare & Other Revenues
COSTS AND REVENUES PER PASSENGER MILE ARE BALANCED
New York
Boston
Washington D.C.
Chicago
Philadelphia
Los Angeles
Miami
Atlanta
Houston
Dallas
$0.74
$0.74
$0.78
$1.02
$0.63
$0.65
$0.67
$0.69
$0.72
$0.56
OPERATIN
G CO
ST PER PASSEN
GER M
ILE (2013) 1
(1) RTA 2013 Regional Peer Review https://www.rtachicago.com/plans-programs/performance-measures/peer-performance-reports Chart Data Sources: Federal Transit Administration National Transit Database (2014 data from Service Boards)
Public operating funding was increased through the 2008 RTA
Reform Legislation
In 2010 the least productive services
were cut to ensure cost effectiveness
2014-2015 ACTIONS• CTA receives first award for federal
Core Capacity capital grants for Red-Purple Modernization Project
• Metra implements fare increase and proposal for potential future fare increases to cover increasing costs and to support modernization plan
• Metra contracts to modernize back-office financial systems
• RTA bonds rated double-A by all three rating agencies
• CTA utilizes USDOT’s TIFIA loan program to help finance the improvements to the O’Hare branch of the Blue Line under the Your New Blue program and the reconstruction of the 95th Street Red Line Terminal
2016 OUTLOOK• Metra proposed fare increases will
help fund a 10-year, $2.4 billion modernization program to purchase new locomotives and coaches, rehab rolling stock, and maintain infrastructure
• Metra rail-fleet modernization program, including federally mandated Positive Train Control technology aimed at increasing rail safety funded through RTA & State bonds and federal funds
2015
www.RTAChicago.org6
STRATEGIC PLAN PROGESS REPORT

OPERATIONS FUNDING NEEDS STATE SUPPORTThe RTA transit system’s operations are funded through a variety of sources, including farebox and other system-generated revenue in addition to federal, state, and local sources. State and local funding sources are critical to continued transit service.
The State is a partner in the provision of transit in Northeastern Illinois. State budget decisions are of strategic importance to maintaining transit services, providing free and reduced fares, and sustaining ADA paratransit operations. If state funding is reduced, all service agencies may have to look at fare increases, service cuts, or other cost efficiency measures.
SOURCES OF OPERATING FUNDS 2014
CTA $1,380 M
METRA $685 M
PACE $194 M
ADA PARATRANSIT $153 M
Federal
State
Local
Fares & other systems generated revenue
Chart Data Sources: Federal Transit Administration National Transit Database (2014 data from Service Boards)
STATE FUNDING
2015
www.RTAChicago.org 7
STRATEGIC PLAN PROGESS REPORT

PROMOTE A GREEN, LIVABLE AND PROSPEROUS REGIONTransit helps the region prosper by connecting people with jobs, and does so with important environmental benefits by reducing auto trips and greenhouse gas emissions. RTA provides funding and technical assistance to communities to plan for and implement transit-oriented development (TOD1) and promotes transit with the Ride On marketing campaign. Nationally—and locally—there is a growing demand for living and working in TODs because of widespread traffic congestion, changing demographics and a desire among varying demographic groups to live in mixed-use, walkable communities accessible by transit.
The percentage of all regional residents taking transit to work is growing, showing the continued value of transit in linking people with jobs. In a new study, Access Across America4 reports that the Chicago metro area ranks #4 in the nation for access to jobs by walking or by auto, and #5 in the nation for access to jobs by transit. RTA has developed a local access measure to assess transit’s ability to link local workers to jobs, and continues to work with communities to make zoning changes, access improvements, and other investments that make it easier to take transit.
Washington D.C
Miami
Houston
New York
Los Angeles
Boston
Philadelphia
Chicago
Atlanta
Dallas
4.0%
3.0%
2.4%
1.4%
14.3%
12.3%
11.5%
9.6%
6.0%
30.4%
9%
10%
11%
12%
13%
2005 2006 2007 2008 2009 2010 2011 2012 2013
Chicago Metropolitan Statistical Area Transit Mode Share Average
Transit mode-share
has been steadily increasing since 2005
Transit mode share jumped during the last
recession
In 2013, transit mode share
for work trips increased slightly
2014-2015 ACTIONS• RTA Community Planning funds 16
projects to increase transit use, job access, and rider mobility
• CTA energy efficiency projects save over 3 million kilowatt-hours each year
• Pace purchases 91 Compressed Natural Gas buses to reduce greenhouse gas emissions
• Pace and Metra begin Shuttle Bug service connecting reverse commuters in Downers Grove
• Metra begins weekend express train service on Rock Island line to encourage drivers to switch to public transit on the weekends
• Pace launches updated Transit Supportive Guidelines
2016 OUTLOOK• Rosemont Transit Center: improving
Pace bus access and expand bus boarding area to accommodate I-90 service expansion
• Chicago’s Loop Link opens for service, improving travel times for riders on six bus routes through the Loop, through the use of dedicated bus lanes and boarding stations
• Metra completing 3rd bay of Englewood Flyover, creating room for future Metra Rock Island expansion
•
REGIONAL TRANSIT MODE SHARE FOR WORK TRIPS2
TRAN
SIT MO
DE SH
ARE PEER
COM
PARISO
N (2013) 3
(1) TOD is defined by the RTA as moderate to high-density, mixed-use communities generally located within a ½-mile radius (10-minute walk) of a rail or bus station designed to maximize walkability and access (2) Region definition changed from the 2014 Progress Report to now use Metropolitan Statistical Area (instead of 6-county area) for consistency across RTA reports & comparability with peer reporting (3) U.S. Census Bureau American Community Survey (4) Access Across America http://access.umn.edu (Auto 2013, Walk 2014, Transit 2014). Chart Data Sources: Federal Transit Administration National Transit Database (2014 data from Service Boards)
2015
www.RTAChicago.org8
STRATEGIC PLAN PROGESS REPORT

TRANSIT PROVIDES ACCESS TO JOBS Approximately 74% of the region’s population, covering 31% of the six-county geographic area is within walking distance of transit1. When including access to park-n-ride facilities, our regional transit network puts an average of 1.4 million jobs (36% of all jobs) within a 90 minute commute of every resident. Providing access to jobs is just one way in which the transit network helps promote a more prosperous region.
JOBS ACCESSIBLE IN 90 MINUTES BY TRANSIT VIA WALKING2
(1) Walk distance defined as ½ mile of rail station or ¼ mile of bus stop (2) 90-minute commute is an average of travel times between 6:00am and 9:00am, calculated for departures at every one minute interval, on a typical Wednesday Access Analysis Data Sources: 2015 GTFS transit schedules from CTA, Metra, Pace, and NICTD; ESRI StreetMap Premium street network with HERE 2015 historical traffic data; CMAP 2010 population and employment by subzone
2.7 Million
0
Jobs
Acc
essib
le
JOBS ACCESSIBLE IN 90 MINUTES BY TRANSIT VIA WALKING OR DRIVING TO PARK-N-RIDE FACILITIES2
2015
www.RTAChicago.org 9
STRATEGIC PLAN PROGESS REPORT

ADVOCATE FOR AND BE A TRUSTED STEWARD OF PUBLIC TRANSPORTATIONThe RTA and Service Boards have been in the forefront of the national conversation on the need to adequately fund infrastructure. In 2015, on both the national and state levels, there have been lapses in long-term commitments to capital funding. A series of short-term extensions of the federal transportation funding bill (MAP-21), which expired in September 2014, and the end of a state capital funding program for 2015 and 2016 has made it difficult to fund and plan future infrastructure investments.
The annual funding required to maintain the current size of the region’s investment backlog is $1.45 billion. In 2014 the capital funds received were inadequate to meet investment needs. The 5-Year Capital Plan projects annual funding levels of only half of what is needed to maintain the backlog, and only a quarter of what is needed to eliminate the backlog and achieve a State-of-Good-Repair in 20 years. RTA and the Service Boards continue to advocate for a long-term commitment to transportation infrastructure funding.
2014-2015 ACTIONS• RTA begins public live streaming of
monthly board meetings
• Metra board establishing new evaluation process for the executive director and receiving new comprehensive training for incoming members
• Metra adopts Confidential Close Call Reporting System
• Agencies advance public process on:
- CTA Red-Purple Modernization
- Pace Pulse
• RTA, CTA, Metra, and Pace participate in Stand Up 4 Transportation, urging Congress to pass a long-term transportation bill
• RTA launches “Ride On” and DuPage marketing campaigns
2016 OUTLOOK• Pace to undergo Aurora (Fox Valley)
market analysis and Niles Free Bus restructuring
• CTA to release draft environmental impact statement for Red Line Extension
(1) RTA 2013 Regional Peer Review https://www.rtachicago.com/plans-programs/performance-measures/peer-performance-reports Chart Data Sources: Federal Transit Administration National Transit Database, RTA Capital Asset Condition Assessment (2011-2014)
CAPITA
L PROG
RAM
EXPEND
ITURES
PER RESIDEN
T (2013) 1
Boston
Miami
Houston
New York
Los Angeles
Chicago
Philadelphia
Washington D.C.
Atlanta
Dallas
$212
$103
$100
$94
$88
$87
$52
$42
$32
$24 Capital Funding (2014$) Funding Level Needed to Maintain Backlog (2014$)
2005 2006 2007 2008 2009 2010 2011 2012 2013 2014 Projected$0.0 B$0.2 B
$0.4 B
$0.6 B
$0.8 B
$1.0 B
$1.2 B
$1.4 B
$1.6 B
CAPITAL FUNDING IS NOT MEETING THE REGION’S NEEDS
Funding gap is growing
2015
www.RTAChicago.org10
STRATEGIC PLAN PROGESS REPORT

DRIVING THE ECONOMY The Chicago region is critical to the economic health of the State of Illinois and transit is critical to the economic health of the Chicago region. The Chicago metropolitan region, including its reach into Indiana and Wisconsin represents a regional output equal to four-fifths of the State of Illinois. The transit network helps drive our economy by connecting people to jobs and employing over 16,000 local workers, yet there is no state contribution dedicated to keeping the transit system operating in a State of Good Repair.
18%Illinois, other
than Northeast Illinois
82%Chicago-Naperville-Elgin,
Northeast Illinois
Real GDP
U.S. Bureau of Economic Analysis
The RTA system employs 16,220
local workers
62% of commuters into Chicago’s Loop and South Loop
use transit
The 6-county RTA region
represents nearly 70% of the state’s
population
RTA provides approximately 2
million passenger trips each work day; provided
more than 637 million rides
in 2014
Every $1 invested in public
transportation generates $4 in
economic returns, nationally
70%
2015
www.RTAChicago.org 11
STRATEGIC PLAN PROGESS REPORT

MOVING FORWARDThe advent and adoption of new innovations in personal transportation are signaling what might be one of the most significant shifts in transportation in decades. Yet, public transit has faced the same hurdles for years when it comes to maintaining, modernizing, and expanding the system to better serve riders in the current transportation environment. The next Strategic Plan will build upon successes from past plans, providing a framework to position transit for sustained growth.
RTA and the Service Boards, alongside CMAP, have begun developing the next Strategic Plan. It will include an assessment of the transit landscape through 2023 and will plan accordingly to address topics such as:
• Regional transit access
• Emerging markets & growth potential
• Innovations in transportation & funding mechanisms
• Capital projects & strategic initiatives
As the plan is developed over the next two years there will be opportunities for input by the public, regional stakeholders, and local governments. All of this is with the goal of creating a unified vision through 2023 that will support and enhance transit’s role in the region.
2015
www.RTAChicago.org12
STRATEGIC PLAN PROGESS REPORT

LEARN MORE
PROVIDE • RTA’s Regional & Sub-Regional Performance Reports provide regional and modal metrics • RTAMS website provides planning, asset and financial information on the transit system • RTA’s Regional Ridership Report provides ridership trends • CMAP’s GO TO 2040 is the region’s transportation and land use plan ENSURE • RTA’s Operating Budget, Two-Year Financial Plan and Five-Year Capital Program provides information about responsible government fiscal policy and management • RTA’s Ten Year Financial Plan projects system operating results over the next decade • RTA’s Special-Purpose Combining Financial Statements provides combined RTA, CTA, Metra, and Pace financials • RTA’s Comprehensive Annual Financial Report provides RTA, CTA, Metra, and Pace reporting and budgeting
PROMOTE • RTA’s Community Planning Implementation Report: Bringing Transit Home provides an overview of the program supporting Transit-Oriented Development • RTA’s Interagency Signage helps passengers transfer seamlessly among services • The regional Green Transit Plan outlines the system’s efforts to become more environmentally sustainable • RTA’s Transit Benefit Fare Program allows employers and their employees to take advantage of a tax savings commuter benefit program
ADVOCATE • Getting America to Work coalition supports transit funding • RTA’s Capital Asset Condition Assessment Report provides physical condition assessment and investment needs • RTA’s Regional & Sub-Regional Peer Reviews compare our region and modes with U.S. peers • Stand Up for Transportation is a partnership of supporters for a comprehensive, long-term commitment from Congress
2015
www.RTAChicago.org 13
STRATEGIC PLAN PROGESS REPORT

www.RTAChicago.org
RTA Administration Offices 175 West Jackson Boulevard, Suite 1650 Chicago, Illinois 60604
Phone: 312-913-3200
Follow us on Facebook and Twitter
ChicagoRTA @RTA_Chicago