strategic planning and management – an …blog-pfm.imf.org/files/jai-seminar.pdfstrategic planning...
TRANSCRIPT

11
STRATEGIC PLANNING AND MANAGEMENT –
AN OVERVIEW
INTERNATIONAL MONETARY FUNDJune 1-
5, 2009

22
Introductions
Dale Hart
Technical Advisor –
IMF
Justin Zake
Senior Economist -
IMF
Norman Gillanders
Assistant Secretary, Revenue, Irish Tax and Customs
Louis Kasekende
Chief Economist, African Development Bank

33
Welcome to All
Botswana
Gambia
Ghana
Kenya
Lesotho
Malawi
Mauritius
Namibia
Rwanda
Seychelles
Sierra Leone
South Africa
Swaziland
Tanzania
Uganda
Zambia
44
Purpose
The seminar will provide:
The principles for strategic management in tax administration
A model for bringing sufficient discipline in the process to ensure that program decisions are strategic and will lead to improvement in tax compliance
Practical examples of how specific countries have implemented the principles discussed
An opportunity to exchange ideas about the application of strategic management principles with the leaders of other tax administrations
55
Agenda
Opening Session and Introductions
Global Economic Crisis and Revenue Mobilization
Mission, Values, Vision
Goals and Objectives
Strategic Assessments and Risk Management
Priority Setting and Resource Allocation
Performance Measurement
Business Planning and Execution
Balanced Scorecard
Country Presentations (Kenya, Zambia,
South Africa)
Team Presentations

6
Context of Strategic Management: Profile of Revenue Administration in Anglophone Africa

7
Outline
Background
Financing the national budget
Overview of revenue administration reform developments
Some Observations on the Reform Developments
8
Background (1)
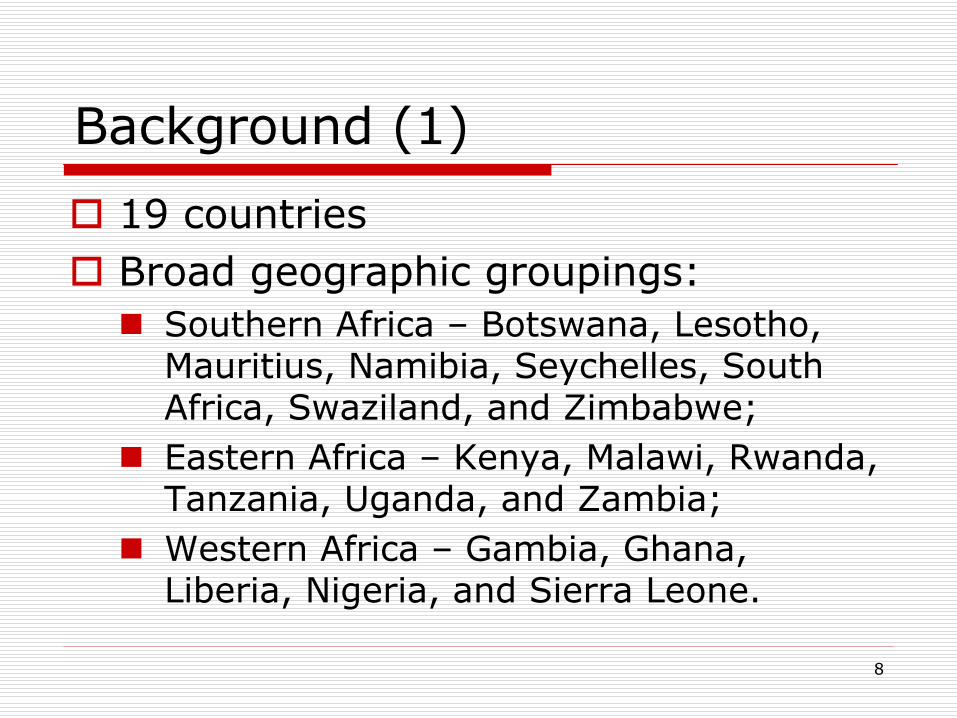
19 countries
Broad geographic groupings:
Southern Africa –
Botswana, Lesotho,
Mauritius, Namibia, Seychelles, South Africa, Swaziland, and Zimbabwe;
Eastern Africa –
Kenya, Malawi, Rwanda, Tanzania, Uganda, and Zambia;
Western Africa –
Gambia, Ghana, Liberia, Nigeria, and Sierra Leone.

9
Background (2)
General characteristics and observations:
most, but not all, have a British colonial legacy or heritage
prevalent use of the English language for business and government purposes
several countries emerged from national or regional conflicts in recent or earlier years (Liberia, Rwanda, Sierra Leone)
others are endowed with significant natural resources (Botswana, Nigeria, Namibia, Liberia, Sierra Leone, South Africa, Zambia)
new oil and gas discoveries (e.g. in Ghana, Rwanda, Sierra Leone, Tanzania, Uganda, Zambia)—curse or blessing?

10
Financing the National Budget (1)
How much does national revenue mobilization contribute to national budgets?
Revenue (tax and non-tax) as a percentage of GDP
Total expenditure and net lending as a percentage of GDP
The revenue gap!!

11
Financing the National Budget (2)Top 10 countries (Index of Economic Freedom)
N am eTot a l R e ven ue to GD P R at io
T ota l E xp end itu re to
G D P R atio
P er ce nt Exp en ditu re
fu nd ed b y D om estic R e venu e
H ong K ong 22 .2 14 .5 153 .1S inga pore 24 .3 14 .7 165 .3A ustra lia 26 .9 24 .9 108 .0I rela nd 34 .3 29 .6 115 .9N e w Z e aland 34 .5 31 .9 108 .2U nited Sta te s 30 .2 33 .8 89 .3C ana da 40 .2 38 .9 103 .3D e nma rk 55 .7 50 .9 109 .4S w itz erla nd 37 .2 35 .0 106 .3U nited K ingdom 39 .2 41 .8 93 .8
12
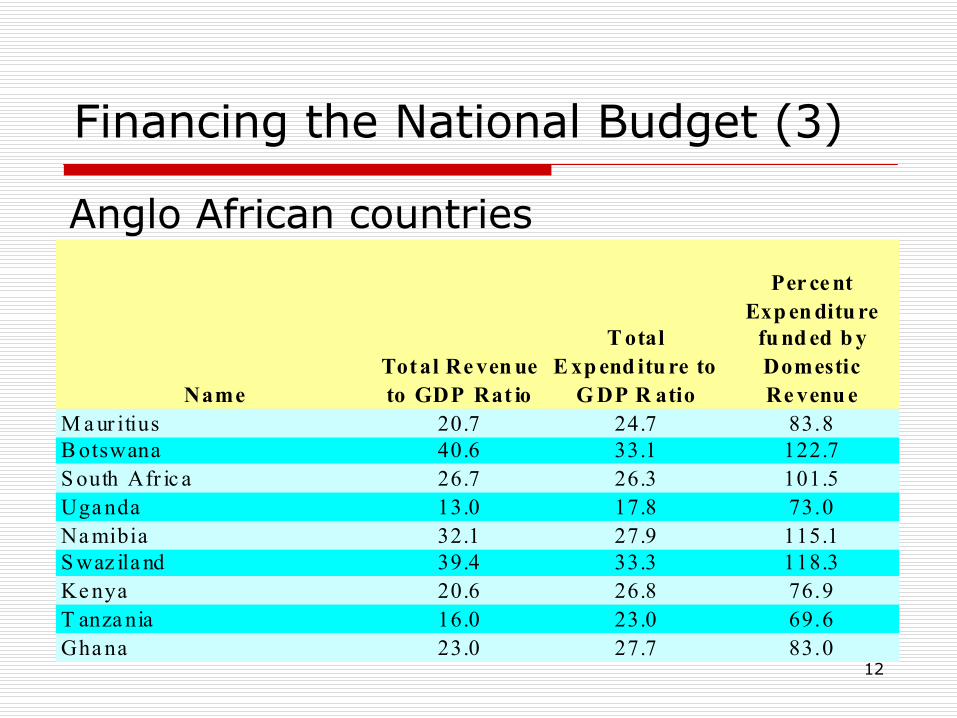
Financing the National Budget (3)
Anglo African countries
NameTot al Re ven ue to GDP Rat io
T otal E xp end itu re to
G DP R atio
Per ce nt Exp en ditu re
fu nd ed b y Domestic Re venu e
M a ur itius 20.7 24.7 83.8B otswana 40.6 33.1 122.7S outh Afr ic a 26.7 26.3 101.5Uga nda 13.0 17.8 73.0Na mibia 32.1 27.9 115.1S waz ila nd 39.4 33.3 118.3Ke nya 20.6 26.8 76.9T anza nia 16.0 23.0 69.6Gha na 23.0 27.7 83.0

13
Financing the National Budget (4)
Anglo African countries cont/d…
N am eTot a l R e ven ue to GD P R at io
T ota l E xp end itu re to
G D P R atio
P er ce nt Exp en ditu re
fu nd ed b y D om estic R e venu e
Z a mbia 21 .2 27 .4 77 .4G a mbia , T he 18 .6 21 .2 87 .7N ige ria 28 .2 27 .8 101 .4R w anda 14 .2 27 .1 52 .4M a la w i 19 .6 34 .9 56 .2L e so tho 61 .4 46 .1 133 .2L iber ia 25 .0 24 .6 101 .6S eyche lle s 36 .2 43 .9 82 .5S ierr a L eone 11 .9 21 .2 56 .1Z im babw e 4 .2 8 .1 51 .9

14
Financing the National Budget (5) Tax Structure
What tax structure results from the design and compliance management effort of the revenue agencies?
What are the dominant tax categories and why?
Highly formalized economy
Large industrial base
High levels of employment (income levels and consumption)
Large service industry (including credit institutions—credit dependency)

15
Financing the National Budget (6) Tax Structure
Top 10 countries (IEF)—period averages 2002-2006(source: IMF databases)
NameTotal
RevenueIncome and
Profits Taxes
Taxes on Goods and Services
Taxes on International
Trade Other taxesHong Kong 100.0 61.8 18.6 0.6 19.0Singapore 100.0 47.5 36.1 0.9 15.5Australia 100.0 57.1 27.2 2.1 13.6Ireland 100.0 48.3 40.6 0.0 11.1New Zealand 100.0 60.7 31.1 2.8 5.4United States 100.0 70.5 5.7 1.9 21.9Canada 100.0 74.1 24.1 1.8 0.0Denmark 100.0 44.7 52.4 0.0 2.9Switzerland 100.0 32.6 60.4 2.3 4.7United Kingdom 100.0 49.7 39.1 0.0 11.2Simple avg top10 IEF 100.0 54.7 33.5 1.2 10.5
16
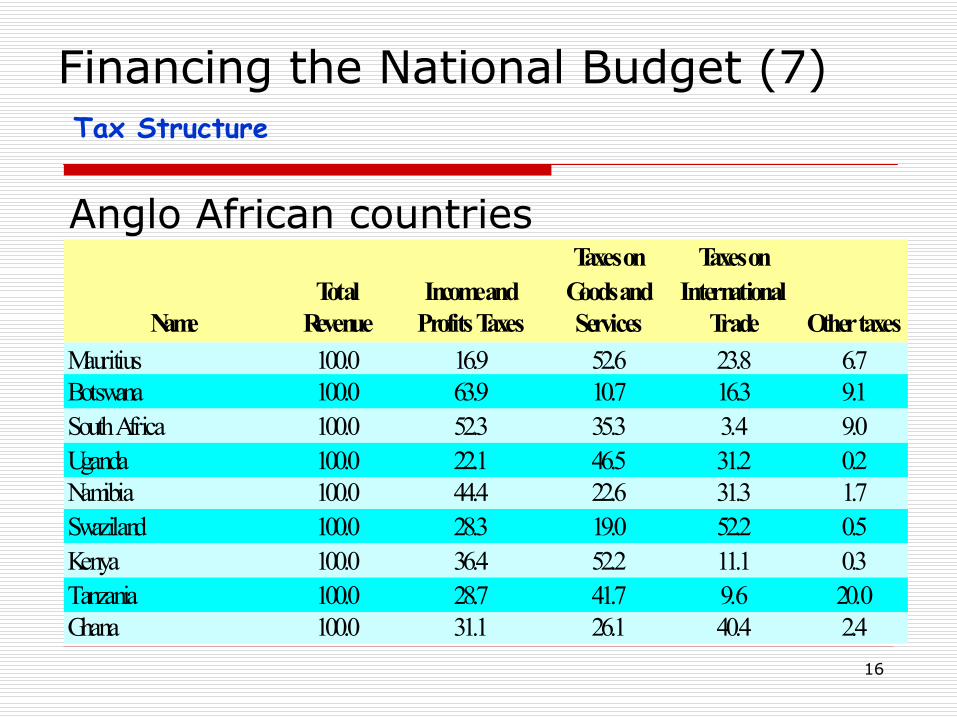
Financing the National Budget (7) Tax Structure
Anglo African countries
NameTotal
RevenueIncome and
Profits Taxes
Taxes on Goods and Services
Taxes on International
Trade Other taxesMauritius 100.0 16.9 52.6 23.8 6.7Botswana 100.0 63.9 10.7 16.3 9.1South Africa 100.0 52.3 35.3 3.4 9.0Uganda 100.0 22.1 46.5 31.2 0.2Namibia 100.0 44.4 22.6 31.3 1.7Swaziland 100.0 28.3 19.0 52.2 0.5Kenya 100.0 36.4 52.2 11.1 0.3Tanzania 100.0 28.7 41.7 9.6 20.0Ghana 100.0 31.1 26.1 40.4 2.4

17
Financing the National Budget (8) Tax Structure
Anglo African countries cont/d…
NameTotal
RevenueIncome and
Profits Taxes
Taxes on Goods and Services
Taxes on International
Trade Other taxesZambia 100.0 44.0 43.4 12.4 0.2Gambia, The 100.0 23.9 11.5 53.6 11.0Nigeria 100.0 89.2 3.6 3.2 4.0Rwanda 100.0 31.6 47.1 14.7 6.6Malawi 100.0 37.0 38.9 11.9 12.2Lesotho 100.0 25.3 19.8 54.4 0.5Liberia 100.0 36.4 6.9 48.2 8.5Seychelles 100.0 22.2 48.0 28.2 1.6Sierra Leone 100.0 29.0 17.7 53.3 0.0Zimbabwe 100.0 51.4 31.7 11.3 5.6Simple avg Anglo-Africa 100.0 37.6 30.3 26.9 5.3
18
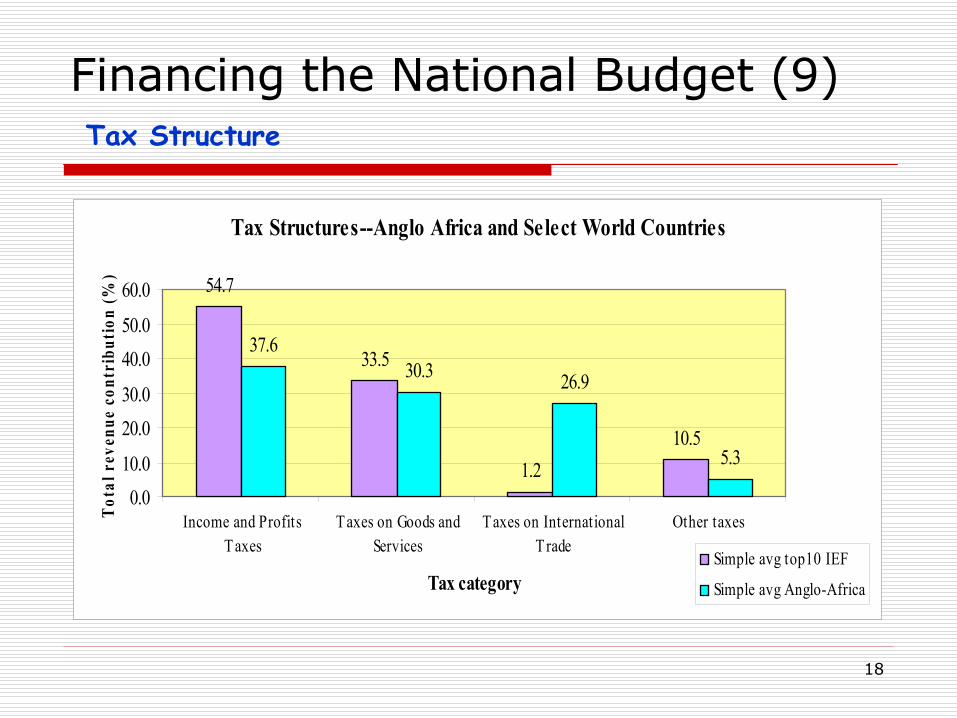
Financing the National Budget (9) Tax Structure
Tax Structures--Anglo Africa and Select World Countries
54.7
33.5
1.210.5
37.630.3 26.9
5.3
0.010.0
20.030.0
40.050.0
60.0
Income and ProfitsTaxes
Taxes on Goods andServices
Taxes on InternationalTrade
Other taxes
Tax category
Tota
l rev
enue
con
trib
utio
n (%
)
Simple avg top10 IEF
Simple avg Anglo-Africa
19
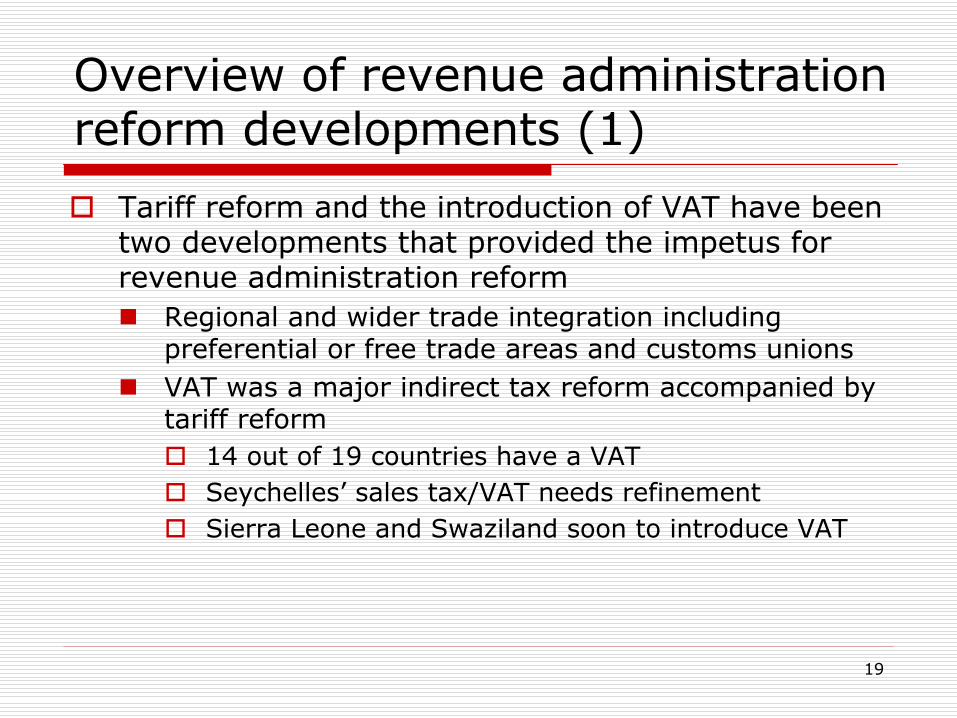
Overview of revenue administration reform developments (1)
Tariff reform and the introduction of VAT have been two developments that provided the impetus for revenue administration reform
Regional and wider trade integration including preferential or free trade areas and customs unions
VAT was a major indirect tax reform accompanied by tariff reform
14 out of 19 countries have a VAT
Seychelles’
sales tax/VAT needs refinement
Sierra Leone and Swaziland soon to introduce VAT

20
Overview of revenue administration reform developments (2)
Semi-autonomous Revenue Authorities (RA) is a significant development within Anglophone Africa
With the exception of Ghana, Liberia, Nigeria, Namibia
Ghana in the offing
Most RAs include both tax and customs
South Africa and Zimbabwe integrate tax and customs operations—not distinct program entities
Segmentation of the taxpayer population being implemented to address compliance issues of particular taxpayer categories (large, medium and small taxpayer categories)
21
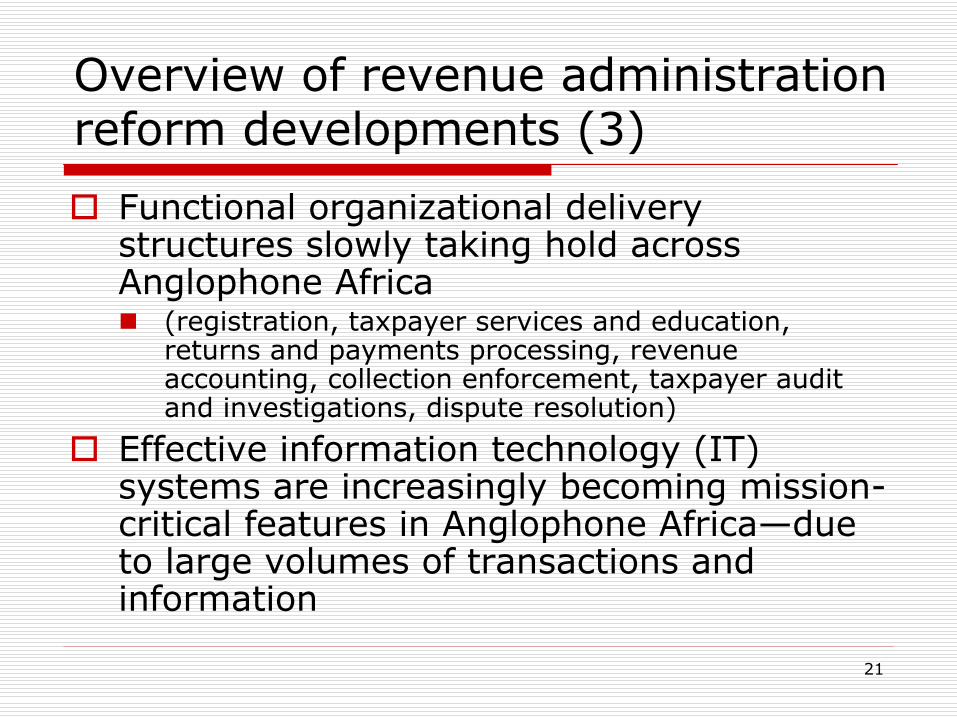
Overview of revenue administration reform developments (3)
Functional organizational delivery structures slowly taking hold across Anglophone Africa
(registration, taxpayer services and education, returns and payments processing, revenue accounting, collection enforcement, taxpayer audit and investigations, dispute resolution)
Effective information technology (IT) systems are increasingly becoming mission-
critical features in Anglophone Africa—due to large volumes of transactions and information
22
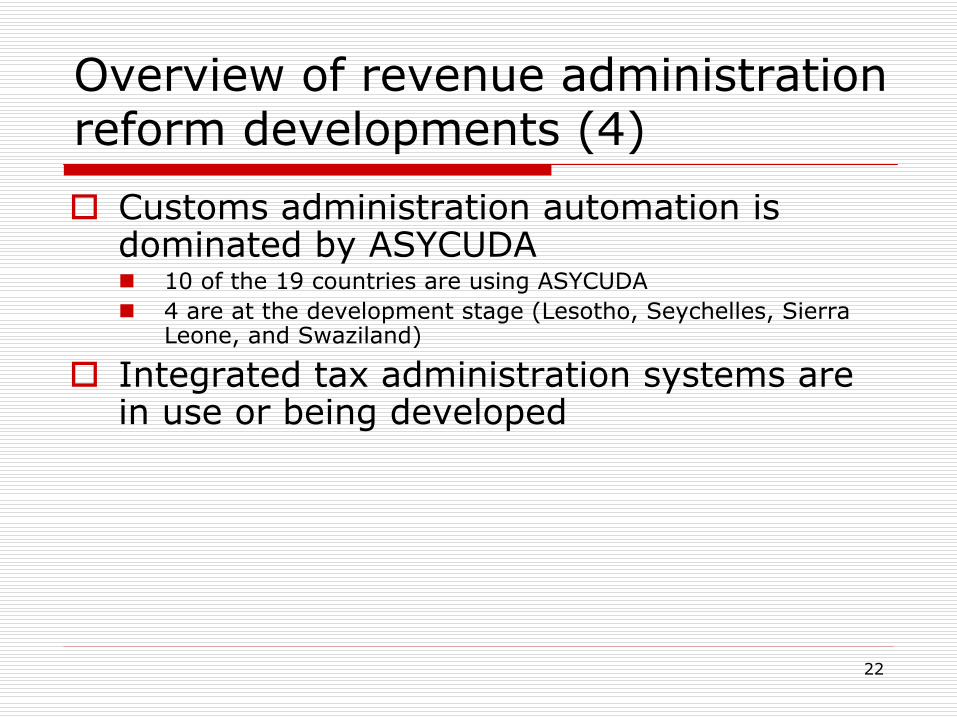
Overview of revenue administration reform developments (4)
Customs administration automation is dominated by ASYCUDA
10 of the 19 countries are using ASYCUDA
4 are at the development stage (Lesotho, Seychelles, Sierra Leone, and Swaziland)
Integrated tax administration systems are in use or being developed

23
Some Observations on Reform Developments (1)
Revenue results in GDP terms mixed
from the mid-1990s to around 2004, revenues were up in 13 countries, down in five (Botswana, Gambia, Seychelles, Swaziland and Zambia) and unchanged in one (Kenya)
The dominant RA model has not fully delivered the desired reform outcomes
the 1990s thrust towards the RA model appeared primarily designed to improve the HR environment and the productivity of revenue administration staff, rather than tackle more comprehensive reform (this appears to be changing)
A clear vision of the desired end-state of a modernized revenue administration has not been evident in the early years of reform
overriding focus on revenue targets (not as a consequential objective) may account for the slow speed of reform and the mixed results; piecemeal and often fragmented reform efforts are not the best use of scarce resources

24
Some Observations on Reform Developments (2)
Reform governance arrangements are still nascent—they are a critical element in managing the reform program
Segmentation and applying different compliance strategies to the high risk groups is a still relatively underdeveloped concept in customs administration
Strong headquarters (head office) functions (operational policy) are still elusive—day-to-day program management:
Design/planning
Monitoring
Evaluation
Ensuring timely remedial/value-adding action is taken
Fragmented tax administration IT systems are still the norm
25
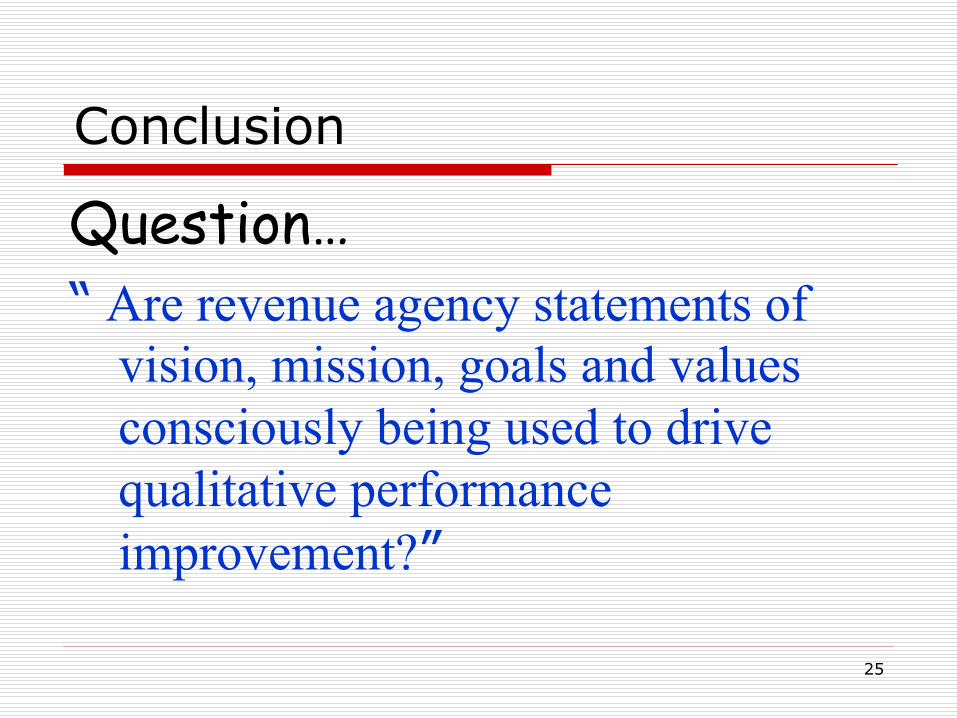
Conclusion
Question…“
Are revenue agency statements of vision, mission, goals and values consciously being used to drive qualitative performance improvement?”

2626
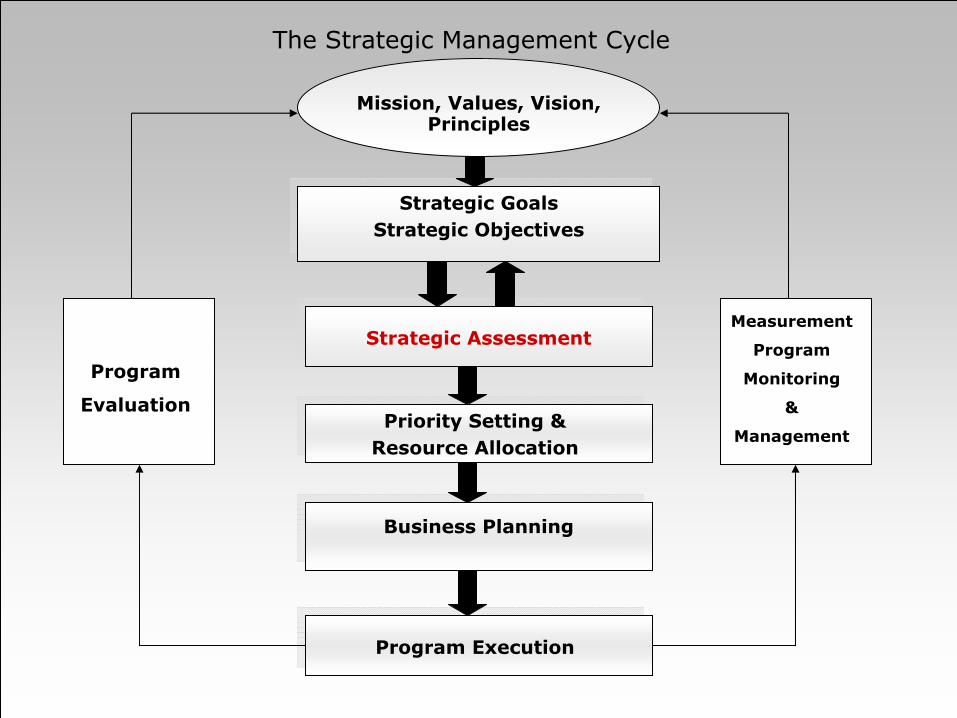
The Strategic Management Cycle
Strategic GoalsStrategic Objectives
Strategic Assessment
Priority Setting &Resource Allocation
Business Planning
Program Execution
Program
Measurement
Monitoring
&
Management
Program
Evaluation
Mission, Values and Vision

2727
Organizational Foundation
Includes the Mission, Values, and Vision
The mission and values anchor the administration’s vision for the future
The vision drives the development of its strategic objectives
Provides for clear understanding of the purpose of the organization and its direction
Shared understanding of these concepts helps to ensure that
all staff pull in the same direction
builds taxpayer and stakeholder confidence and trust in the tax administration
OrganizationFoundation
Strategic Objectives
Strategic Assessment
Priority Setting Business Planning
Program Execution
Evaluation Reporting

2828
Mission
While a tax administration’s mandate is derived from its legal authority, its mission statement provides a concise indication of purpose and business activity
Brazil: “Provide the State with revenue in order to guarantee the social welfare; provide excellent services for society; provide security, confidence and facilitate international trade.”
USA: “Provide America's taxpayers top quality service by helping them understand and meet their tax responsibilities and by applying the tax law with integrity and fairness to all.”
Canada: “To administer tax, benefits and related programs and to ensure compliance on behalf of governments across Canada, thereby contributing to the ongoing economic and social well-being of Canadians.”

2929
Values
Values are beliefs that members of the administration hold in common, and endeavor to put into practice
They need to be modeled by leaders with the goal of having all staff demonstrate them in their day-to-day behavior
Canadian Revenue Administration (CRA) values:
integrity
professionalism
respect
cooperation

3030
Vision
The vision defines the organization’s view of success
Its formulation is the responsibility of leaders
It is future looking and should inspire others across the organization to realize the vision
Vision statements typically have a medium-
to long-term horizon
Vision of the Inland Revenue Authority of Singapore (IRAS)
The leading tax administration in the world
A
partner of taxpayers in nation building
An eXcellent team of competent and committed people
Australian Tax Office’s aspiration: To work with the community in the fair administration and effective management of the tax system to add value to our nation.

3131
Develop Broad Support
Internally:
Seek concurrence and input from Ministry of Finance
Involve the “top team”
in drafting the mission, vision, and values
Give managers and employees opportunities to comment and provide input and raise concerns
Externally:
Circulate to taxpayer and industry groups, tax professionals (i.e., accountants and attorneys) for comment
Solicit views of key elected officials
Maintain visibility:
Go back to the groups that provided input with the final result
Link actions to the mission, vision and values as often as possible

3232
The Strategic Management Cycle
Strategic GoalsStrategic Objectives
Strategic Assessment
Priority Setting &Resource Allocation
Business Planning
Program Execution
Measurement
Program
Monitoring
&
Management
Program
Evaluation
Mission, Values and Vision

3333
Strategic Goals & Objectives
Mission answers why the administration exists
Vision answers where the administration wants to head
Strategic goals and objectives are driven by the vision and form the heart of the strategic plan
Strategic Goals
are long-term outcomes that help the organization achieve its mission
Strategic Objectives
are broad based outcome statements that support achievement of strategic goals by providing more specificity and clarity
In turn, they drive the initiatives and actions that will lead to improved tax administration
OrganizationFoundation
Strategic Objectives
Strategic Assessment
Priority Setting Business Planning
Program Execution
Evaluation Reporting

3434
Strategic Goals and Objectives -USA Example
•
Discourage non-compliance with emphasis on corporations, high-income individuals & other contributors to the tax gap
•
Ensure attorneys, accountants & practitioners follow the law
•
Deter financial criminal activity
Enhance Enforcement of the Tax Law
Strategic Goals
Providing America’s taxpayers top quality service by helping them understand and meet their tax responsibilities by applying the tax law with integrity and fairness to all.
Mission Statement
Tax GapTaxpayer Compliance
(Payment, Filing, Return Accuracy)
•
Improve service options for the taxpaying public
•
Facilitate participation in the tax system by all sectors of the public
•
Simplify the tax process
Improve Taxpayer Service
Taxpayer Burden
Customer Satisfaction
Accuracy
•
Increase organizational capacity (employee engagement / productivity)
•
Modernize information systems
•
Ensure safety & security
•
Modernize business processes
Modernize the IRS Through Its
People, Processes and Technology
Employee EngagementBenchmark IT to Private Industry

3535
Supporting strategies, actions, and initiatives -
US
Mission: Providing America’s taxpayers top quality service by helping them understand and meet their tax responsibilities by applying the tax law with integrity and fairness to all.
Strategic goal: Improve taxpayer service
Strategic objective: Improve service options to the public
Supporting strategies, actions, and initiatives:
Expand community coalitions and partnerships to enhance taxpayer education, tax preparation assistance and self-
sufficiency for improved taxpayer compliance
Offer products and services to address the needs of limited-
English-proficient taxpayers
Increase the rate of electronic filing

36
Strategic Goals and Objectives – Tanzanian Example
Mission Statement
An effective and efficient Tax Administration which promotes voluntary tax compliance by providing high quality customer service with fairness and integrity through competent and motivated staff.
Strategic Goals
Increase revenue collection in a cost
effective way
Modernize TRA operations
Provide high quality and responsive customer
service
Promote voluntary tax compliance
Enhance staff performance management system
-Broaden tax base-Strengthen domestic tax revenue-Improve tax structure -Enhance system for monitoring cost of revenue collection
-Introduce electronic operations-Enhance Customs Administration system-Enhance Domestic Tax Administration system-Strengthen data production and management
-Enhance TRA quality management system-Improve customer service-Enhance trade facilitation
-Enhance risk management model-Enhance tax knowledge-Provide support to local government authorities
-Improve staff appraisal system-Strengthen management controls-Improve staff capacity-Improve staff welfare and motivation
MeasuresTRA has key performance indicators that measure nature and scope of operations, efficiency, and effectiveness of the
tax administration. Including operational indicators, perception indicators, and monitoring and evaluation..
3737
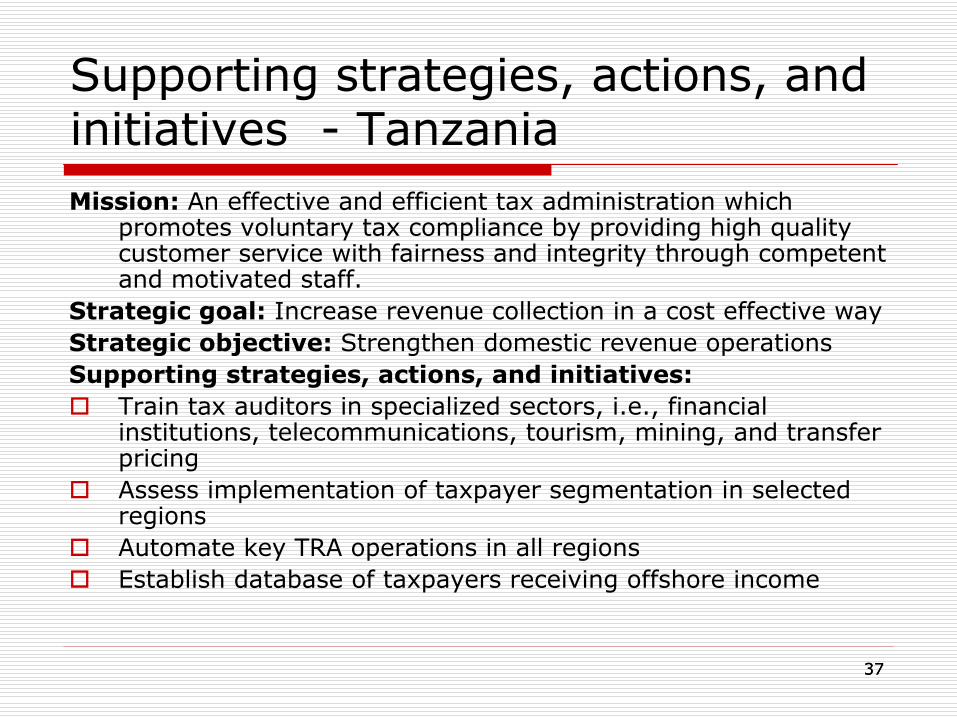
Supporting strategies, actions, and initiatives -
Tanzania
Mission: An effective and efficient tax administration which promotes voluntary tax compliance by providing high quality customer service with fairness and integrity through competent and motivated staff.
Strategic goal: Increase revenue collection in a cost effective wayStrategic objective: Strengthen domestic revenue operationsSupporting strategies, actions, and initiatives:
Train tax auditors in specialized sectors, i.e., financial institutions, telecommunications, tourism, mining, and transfer pricing
Assess implementation of taxpayer segmentation in selected regions
Automate key TRA operations in all regions
Establish database of taxpayers receiving offshore income

3838
Strategic Plan
The strategic plan provides direction for the next three to five years and typically contains:
statement of the mission, values, vision and strategic goals of the administration
corporate strategies and objectives
performance measures for those strategies
Serves as an internal and external communication tool:
to facilitates the staff’s to understand the organization’s goals and priorities
to inform taxpayers, politicians and other stakeholders of the tax administrations intended directions of provide
to ensure transparency and accountability
393939
The Strategic Management Cycle
Strategic GoalsStrategic Objectives
Strategic Assessment
Priority Setting &Resource Allocation
Business Planning
Program Execution
Measurement
Program
Monitoring
&
Management
Program
Evaluation
Mission, Values, Vision, Principles

404040
Strategic Assessment
An annual review is undertaken that will lead to the setting of strategic priorities
Includes the impacts that political, economic, social, technological and business trends may have on the vision, strategic objectives and priorities
International practices in tax administration, and compliance trends are also assessed
Generally, there is a business-line review of performance as well as an assessment of strengths, weaknesses, opportunities and threats
Organizational (internal) threats are assessed, as well as compliance (external) threats
This leads to a confirmation of the strategic objectives, and proposals for future actions
The initial Strategic Assessment is far more time-
consuming than subsequent annual updates. Full scale assessments are only performed periodically
OrganizationFoundation
Strategic Objectives
Strategic Assessment
Priority Setting
Business Planning
Program Execution
Evaluation Reporting
414141
Outline
Environmental Assessment
Organizational Risks
Compliance Risks
Risk ranking and SWOT Analysis
Proposals for Change
424242
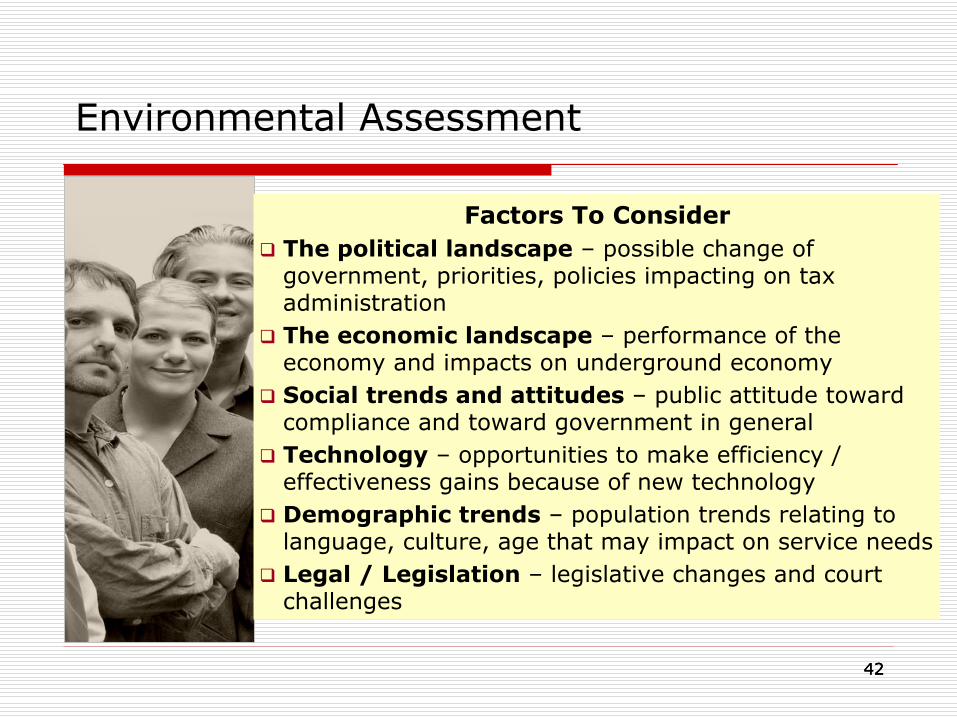
Factors To Consider
The political landscape
–
possible change of government, priorities, policies impacting on tax administration
The economic landscape
–
performance of the economy and impacts on underground economy
Social trends and attitudes
–
public attitude toward compliance and toward government in general
Technology
–
opportunities to make efficiency / effectiveness gains because of new technology
Demographic trends
–
population trends relating to language, culture, age that may impact on service needs
Legal / Legislation
–
legislative changes and court challenges
Environmental Assessment

434343
Organizational Risk
Organizational risk may exist in a number of major categories, such as:
Human resources
Information technology
Business processes
Governance framework
Tax policy and/or tax procedures

444444
Examples of Organizational Risk
Human resources
Do staff have the skills necessary to do their jobs effectively?
Are there adequate resources to handle work demands?
Infrastructure
Are staff equipped to do their jobs efficiently?
Legislative
Does the legislative framework have gaps or allow unintended interpretations?
454545
Examples of Organizational Risk (con’t)
Governance
Are there clear lines of accountability for all key business processes in the organization?
Is the organizational structure adequate to achieve the administration’s goals and objectives?
Business Processes
Are the right business processes in place? Are they effective? Are they efficient?
Are the processes for identifying compliance risk adequate?
Are compliance actions risk-based?
Is there a business resumption plan in case of disaster (e.g., earthquake, flood, terrorism)?

464646
Examples of Organizational Risk (con’t)
Partnerships
Are external partnerships (e.g., industry groups, accountancy and legal boards) used to support the goals of the administration?
Financial Control
Are there adequate controls to ensure integrity in the stewardship of the administration?
Information Technology
Is the technology infrastructure adequate? Are the necessary computer systems in place?
Are the computer systems thoroughly tested to ensure that processing is accurate?
Are the computer systems and databases adequately backed up in case of a disaster?
47
Compliance Risks
Are estimates of the informal economy increasing?
Is the public attitude towards paying taxes changing? For better or worse?
Are there changes in registration, filing, reporting, or payment indicators?
Are high-risk segments growing (self- employed, large taxpayers, high-net-wealth
individuals)
Are patterns of tax avoidance, evasion and fraud changing?

4848
Risk Ranking Matrix
Risk: Likelihood
ConsequenceExtreme Serious Prejudicial Minor Negligible
Almost Certain(~95%)
Critical Severe High Major Significant
Probable(~80%)
Severe High Major Significant Moderate
Possible(~50/50)
High Major Significant Moderate Low
Unlikely(~20%)
Major Significant Moderate Low Trivial
Rare(~5%)
Significant Moderate Low Trivial Trivial
494949
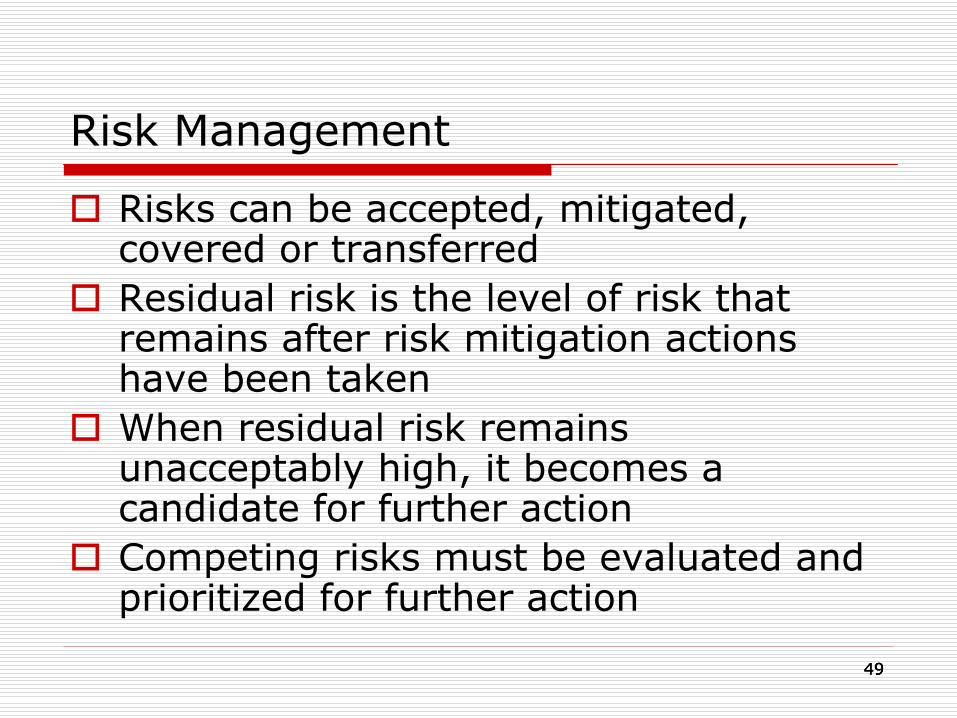
Risk Management
Risks can be accepted, mitigated, covered or transferred
Residual risk is the level of risk that remains after risk mitigation actions have been taken
When residual risk remains unacceptably high, it becomes a candidate for further action
Competing risks must be evaluated and prioritized for further action
505050
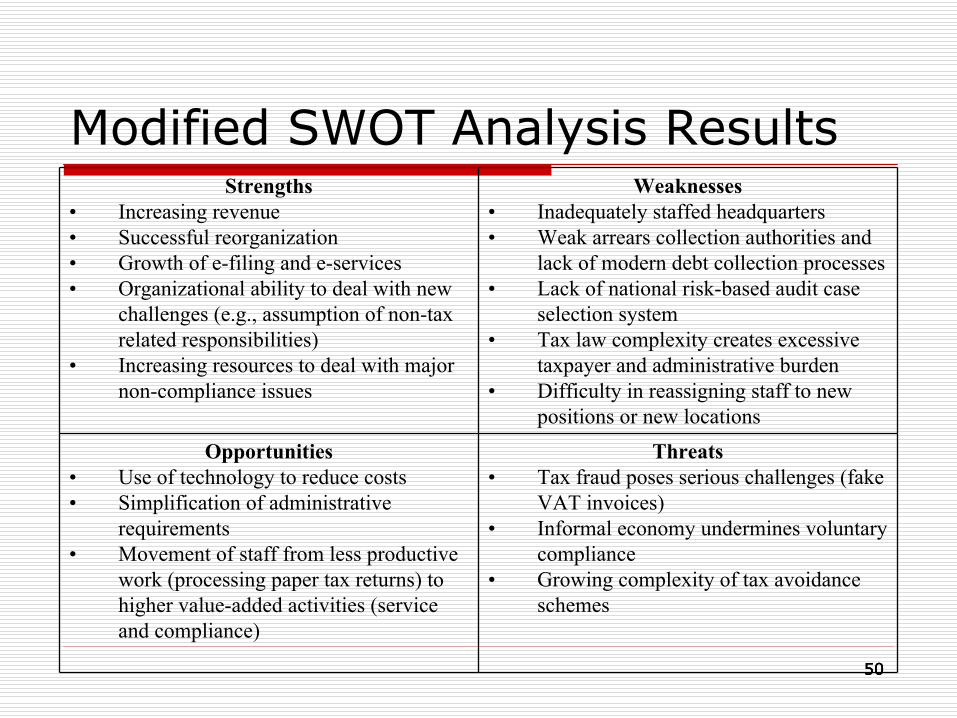
Modified SWOT Analysis ResultsStrengths
•
Increasing revenue•
Successful reorganization•
Growth of e-filing and e-services•
Organizational ability to deal with new challenges (e.g., assumption of non-tax related responsibilities)
•
Increasing resources to deal with major non-compliance issues
Weaknesses•
Inadequately staffed headquarters •
Weak arrears collection authorities and lack of modern debt collection processes
•
Lack of national risk-based audit case selection system
•
Tax law complexity creates excessive taxpayer and administrative burden
•
Difficulty in reassigning staff to new positions or new locations
Opportunities•
Use of technology to reduce costs •
Simplification of administrative requirements
•
Movement of staff from less productive work (processing paper tax returns) to higher value-added activities (service and compliance)
Threats•
Tax fraud poses serious challenges (fake VAT invoices)
•
Informal economy undermines voluntary compliance
•
Growing complexity of tax avoidance schemes

515151
Strengths, Weaknesses, Opportunities, Threats
Business line review:
Leaders assess areas of responsibility and make proposals for improvement
Evaluate program effectiveness, what went right, what went wrong and ‘what keeps them up at night’
Supported by information supplied by the ‘bottom-up’
view of front-line operations
Organization-wide review
Brings together the business-line views and seeks to identify any gaps

525252
Strategic Assessment Results
The results of the strategic assessment are first used to validate the vision and the strategic objectives
These results can and do periodically alter the strategic objectives
Only when the new objectives have been confirmed, can the process for determining what initiatives and actions would be most important to achieving those objectives proceed

535353
Proposals for Change
Agreed actions must be anchored and aligned with strategic objectives
Initiatives may provide efficiency gains, effectiveness gains, or both
Inputs to new programs include human resources and operating budgets.
Funding decisions should be made during the priority setting process (e.g., reallocating or shifting resources from other lower priority programs)

545454
Proposals for Change
Proposals should include a multi-year analysis of the costs, benefits and expected results
Both assumptions and dependencies should be provided with the proposal
The strategic assessment can then proceed to the next step –
priority
setting and resource allocation decisions

55
Compliance Risk Management

5656
Outline
Introduction
Compliance Risk Management Model
Identifying risks
Assessing and prioritizing risks
Analyzing compliance behavior
Developing Treatment Strategies
Evaluating results
5757
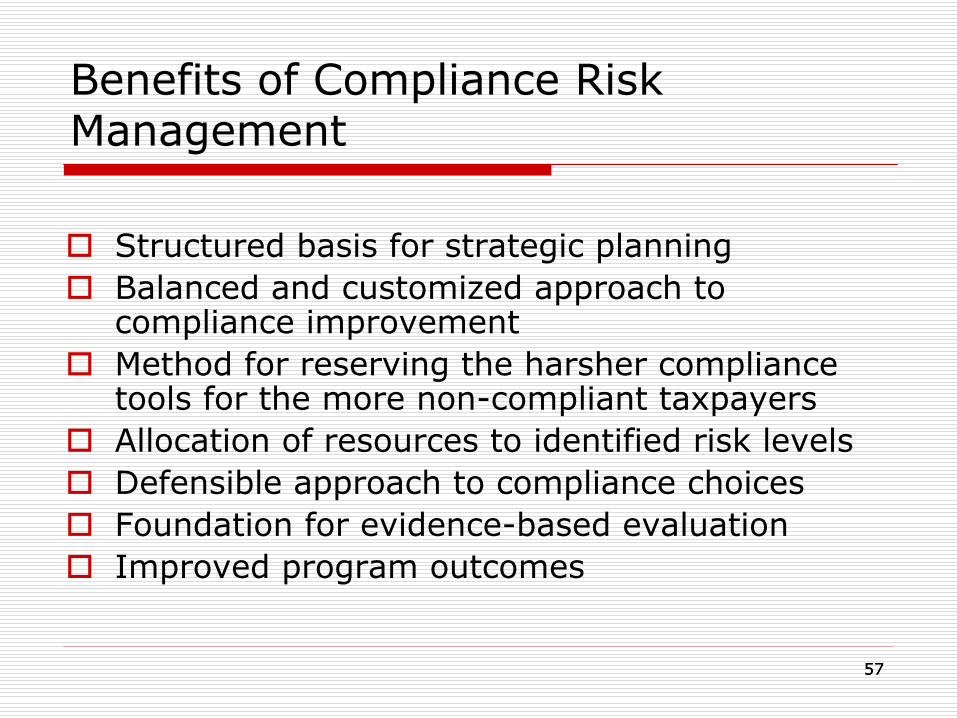
Benefits of Compliance Risk Management
Structured basis for strategic planning
Balanced and customized approach to compliance improvement
Method for reserving the harsher compliance tools for the more non-compliant taxpayers
Allocation of resources to identified risk levels
Defensible approach to compliance choices
Foundation for evidence-based evaluation
Improved program outcomes

5858
Assess and prioritise risksAssess and prioritise risks
Analyse compliance behaviour(causes, options for treatment)
Analyse compliance behaviour(causes, options for treatment)
Determine treatment strategiesDetermine treatment strategies
Plan and implement strategiesPlan and implement strategies
Identify risksIdentify risks
Monitor performance against plan
Monitor performance against plan
Operating ContextOperating Context
Evaluate compliance outcomes• Registration
• Filing
• Reporting
• Payment
Evaluate compliance outcomes• Registration
• Filing
• Reporting
• Payment
RISK MANAGEMENT CYCLE(OECD MODEL)

595959
Compliance Risk
Three Key approaches
Macro-level
Socio-economic indicators
Trends in public attitudes including views related to registering, filing, reporting and remitting
Tax gap measures
Systems-based
Non-registration and fraud
Non-filing
Underreporting revenues, taxable incomes, and taxes owing
Non-payment and collections
Market Segmentation
Used to create homogeneous grouping that allows for easier detection of risk
By tax type (e.g., VAT, income tax)
By size (e.g., Large, Medium, Small, and Micro)

6060
Many sources of information
Economic and demographic trends
Behavioral information
Business results
Third party information
Employees and managers
External groups (e.g., tax professionals)
Other countries
Data mining/Compliance studies

6161
Macro-Level
Economic indicators
Trends in public attitudes including views related to registering, filing, reporting and remitting
Tax gap measures

6262
Canada: Macro-level Risk Analysis: Net GST vs Expenditure on Domestic Goods and Services
N et G ST /H ST vs. C on su m er E xpend iture on D om estic G oods an d Services
190 000
210 000
230 000
250 000
270 000
290 000
310 000
330 000
1991-92
1992-93
1993-94
1994-95
1995-96
1996-97
1997-98
1998-99
1999-00
2000-01
F isca l Y ear
Exp
endi
ture
($ m
illio
ns)
1 3 000
15 000
17 000
19 000
21 000
23 000
25 000
27 000
Net
GST
/HST
Rev
enue
s ($
mill
ions
)
C onsum er E xpend iture , G oods C onsum er E xpend iture , Services N et G ST /H ST
Source: Fiscal R eference Tables, C A N SIM
GST revenues are tracking in line with consumer expenditures, indicating stable compliance levels.

63635
C R O P S u r v e y o n C o m p lia n c e A t t i tu d e s a n d B e h a v io u rs
%
3 0
2 7
1 1
1 3
1 1
8
1 . A l t r u i s t i c c o m p l i e r s
2 . D e f e r e n t c o m p l i e r s
3 . P s e u d o - c o m p l i e r s
4 . S i t u a t i o n a l n o n - c o m p l i e r s
5 . P o t e n t i a l n o n - c o m p l i e r s
6 . R e b e l s
C o m p l i e r s
C o n t i n g e n t N o n -c o m p l i e r s
N o n -c o m p l i e r s
Canadian Example: Public Attitudes to Compliance

6464
Random Audit Programs
Make statistically valid measurements of non-compliance
Quantify the “tax gap”
Measure evasion among different groups of taxpayers to develop or validate audit selection models
Identify emerging trends or new forms of evasion
General deterrent to non-compliance

6565
USA INTERNAL REVENUE SERVICETAX YEAR 2001 FEDERAL TAX GAP
($ in Billions)
Non-filing*27
IndividualIncome Tax
$119.6
Non-BusinessIncome$30.6
BusinessIncome$65.3
Underpayment33
EmploymentTax54
Estate & Excise Taxes
4
Large Corporations
25
Underreported BusinessIncome
109
Small Corporations
5
Underreported Non-Business
Income56
FICA & Unemployment
Taxes15
IndividualIncome Tax
197
Actual Amounts
Updated Estimates
Dependent on Older Estimates
Overstated Adjustments,Deductions,Exemptions and Credits
32
Underreporting285
CorporationIncome Tax
30
Gross Tax Gap: 345(Noncompliance Rate: NCR = 16.3%)
Self-
Employment Tax 39
Status of the Estimates
Estimates in Bold Boxes Have Been Updated Based on Detailed TY01 NRP Analysis
* Updated using Census tabulations

6666
Market Segmentation
Used to create homogeneous grouping that allows for easier detection of risk
By tax type (e.g., VAT, income tax)
By size (e.g., large business, medium, small, and micro)
By sector (e.g., farming, professions, industries)
6767
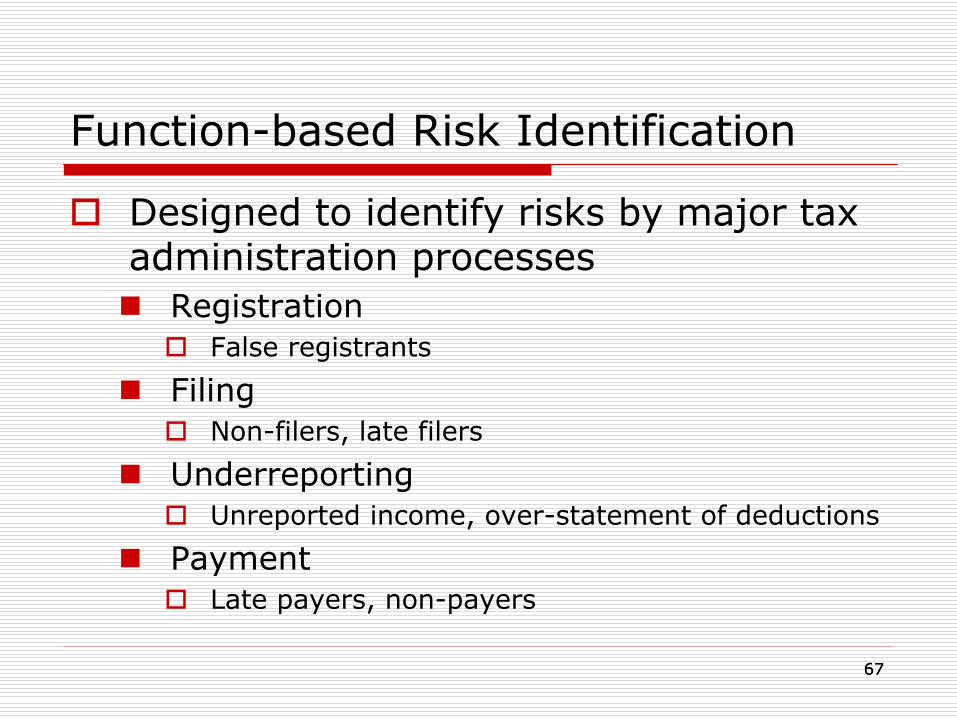
Function-based Risk Identification
Designed to identify risks by major tax administration processes
Registration
False registrants
Filing
Non-filers, late filers
Underreporting
Unreported income, over-statement of deductions
Payment
Late payers, non-payers

6868
Desired result: Three different levels of risk –
and emerging risk -
identification
Strategic
Environmental scans
Tax gap measures, demographic and economic trends, behavioral analysis
Tax population profiles
Tactical
Groups (e.g., professions, trade sectors, and industries)
Functions (e.g., registration, filing, reporting, and payment)
Major tax issues
Operational (Taxpayer)
Case selection within each area
Requires a top-down / bottom-up flow of information

6969
Possible Risks
Growth in service sector
Small cash-based businesses
Limited cash flow
Risky taxpayers
Younger males
High-net-wealth individuals
Risky sectors
Construction, taxis, bars and restaurants
Potential high revenue loss
Large taxpayer tax-avoidance strategies

7070
Assessment and Prioritization
Goal is to answer two questions:
Is the risk serious?
Should you do anything about it?
7171
Assessment and Prioritization
Is the risk serious?
Considerations:
Likelihood of the risk occurring
Frequency and vulnerability
Risk to revenue
Risk to public confidence
Impact on achieving organizational goals both now and in the future
7272
Assessment and Prioritization
Should you do anything about it?
Consider:
Internal capability
Effectiveness of any proposed treatment
Risk rating
Return on investment
Risk of infection
Public perception

7373
Problems -
Causes
Identify patterns
Are there sectoral or geographic differences?
Systematic or organized evasion
Are fraudsters exploiting legislative or administrative weaknesses?
Identify different causes
Which ones are possible to influence?
Trend
Is the problem increasing or decreasing?

7474
Prioritization
Goal is to choose which risks will be treated with available staff and capabilities
High revenue impact
Cost to benefit ratio
Impact on taxpayer perceptions
Impact on tax administration’s goals (high, medium, low)
Focus on OUTCOMES not outputs
Prioritized analysis of compliance risks feeds into the Strategic Assessment
7575
Data, Information and IT Systems
Risk identification and assessment depend on accurate data, data analytics to evaluate risks, and systems to deliver high priority taxpayer casework.
Build capability over TIME!
Business registration –
ranking of new
registrants for fraud potential
Informal economy
Third-party data matching
Other public data

7676
Data, Information and IT Systems (con’t)
Tax return data, including financial statements
Benchmark data –
financial ratios, trade sector
profit ratios
Cross-program matching –
payroll, VAT, import
and export data, corporations and major shareholders
Identification of non-filers
Audit and collection risk-scoring systems
Data mining
Automated workload selection tools

7777
Sweden: Taxpayer selection
Central and local queries preset each year
Data
Selected taxpayers
Tax returns
Personal data
External data
Annual statements
Queries
7878
Seeing the Whole Taxpayer
Cross-Program Client Compliance Profile (Canada)
History of all compliance/enforcement actions, including those related to registration, filing, reporting, remitting
History of risk assessment results
Links to associated accounts
Ensures that taxpayers’
compliance behaviors affect their business relationships with the tax
administration.

7979
Canada: Compliance Measurement, Profiling and Assessment System (COMPASS)
Allows auditors to:
Gain quick point-and-click access to high-risk workload in a Windows-like environment
View comprehensive taxpayer compliance profiles to make audit workload selections
Test compliance theories by using individually established criteria to detect new areas of non-
compliance and fraud
Examine risk characteristics at an aggregate level across economic sectors, geographic areas, etc., in order to target workload more strategically

8080
Risk Analysis by Industry Sector

8181
Developing Compliance Strategies (OECD Model)
Have decided not to comply
Don’t want to comply,but will if we pay attention
Try to but don’talways succeed
Willing to dothe right thing
Use the full force of the law
Deter by detection
Assist to comply
Make it easyOur strategies aim to create
pressure down
Attitude to compliance Compliance strategy
012345678
910
Psychological
IndustryBusiness
Sociological Economic
Taxpayer
Psychological
IndustryBusiness
Sociological Economic
Taxpayer
Factors influencing taxpayer behaviour
8282
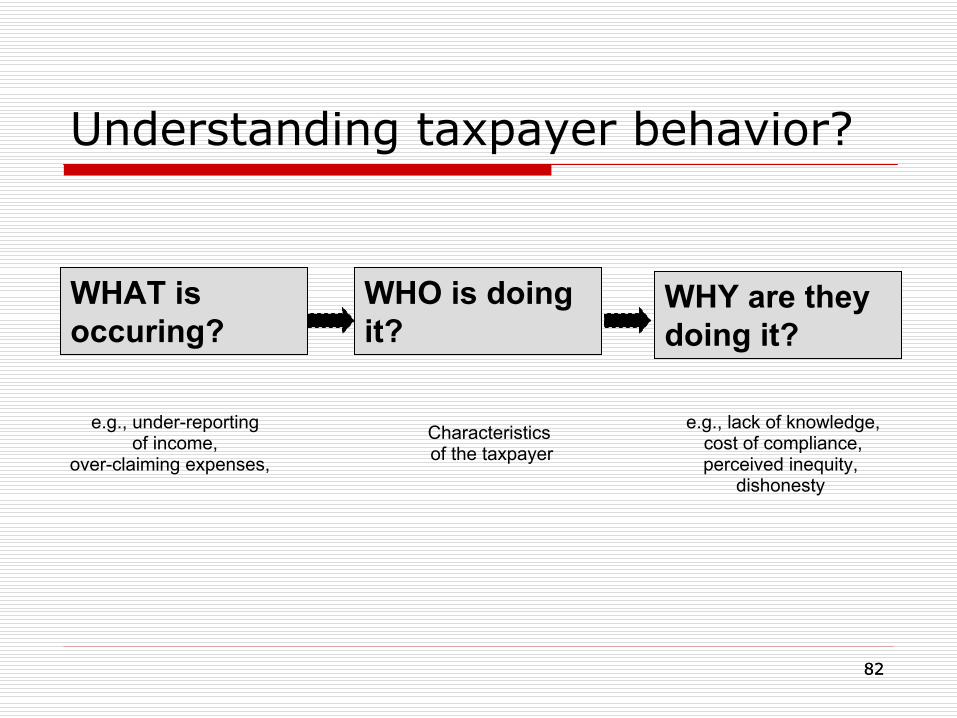
Understanding taxpayer behavior?
WHY are they doing it?
WHAT is occuring?
WHO is doing it?
e.g., under-reportingof income,
over-claiming expenses,
Characteristicsof the taxpayer
e.g., lack of knowledge,cost of compliance, perceived inequity,
dishonesty

8383
Potential reasons for non- compliance
Equity
Is the taxpayer treated fairly
Does the government make good use of the tax revenue
Opportunity for non-compliance
Cash based businesses
Individual differences
Risky taxpayers (e.g., younger males)
Social norms
Every body does it…
Dissatisfaction with revenue authorities
Is the tax administration fair and efficient

8484
Treatment options
Make obligations clear and make it easy to comply
Understandable legislation and tax returns, readily accessible help, proactive education
Reduce the scope for error
Use third-party information
Use escalating sanctions
Provide incentives
Publicize service and enforcement activities
8585
Treatment Strategies
Link the strategy to the underlying cause.
Canadian taxpayers owning rental properties showed a lack of understanding of the difference between a capital expense and a current expense. An education strategy worked well in improving compliance levels.
The United Kingdom provided information on common misunderstandings relating to deductible expenses against business income to self-employed individuals who prepared their own tax returns and had been identified as ‘at risk’.
8686
Treatment Strategies
Reduce the opportunity for error through increased visibility and transparency:
In Australia, withholding of tax was required of construction subcontractors, along with information reporting by the contractor. This brought greater visibility to work transactions that were not previously transparent.

8787
USA Internal Revenue Service: Effectiveness of Third-Party Reporting
$11B
1.2%$9B 4.5%
$51B
8.6%
$110B53.9%
110
100
90
80
70
60
50
40
30
20
10
0
55
50
45
40
35
30
25
20
15
10
5
0Substantial info
reporting & withholdSubstantial
information reportingSome information
reportingLittle or no information
reporting
Underreporting Tax Gap Net Misreporting Percentage
8888
Treatment Strategies
Sweden developed a four-pronged audit strategy:
Concerted effort to catch the big evaders
Preventative approach that involves auditing new businesses even when the risk potential would appear low
Follow-up on taxpayers who had substantial non-compliance in the past
Focus on ‘hot spots’
for the public –
evaders
who claim social benefits.

8989
Treatment Strategies
The U.S. developed a comprehensive approach to address tax shelters that included:
Expedited guidance identifying abusive transactions;
Improved disclosure requirements to provide greater transparency;
Increased audits of tax shelter promoters as well as thousands of audits of high-income individuals and corporations who entered into potentially abusive transactions; and
Legislation to limit abusive transactions and increase penalties.
9090
Remember: The goal is not to find non-compliance; it is to prevent non-
compliance

9191
Plan for evaluation
Develop evaluation criteria when the treatment strategy is chosen
Key questions:
Were the right risks identified?
Were they analyzed correctly?
Was the right treatment selected?
Was the risk reduced?
Is outside help needed?
Legislative changes
Additional resources

9292
Evaluation
Look beyond outputs to outcomes –
changing behavior
Are the trends moving the right way over time
Taxpayer surveys
Filing and paying rates
Correct reporting
Registration rates
Tax gap measures

9393
EU Evaluation model
InputInput OutputOutput OutcomesOutcomesActivitiesActivities
Productivity/efficiency
Quantity/quality
Effectiveness

9494
Evaluating compliance is difficult, but…
What gets measured -
gets done!
Aim for the best outcome

9595
The Strategic Management Cycle
Strategic GoalsStrategic Objectives
Strategic Assessment
Priority Setting &Resource Allocation
Business Planning
Program Execution
Measurement
Program
Monitoring
&
Management
Program
Evaluation
Mission, Values, Vision, Principles

96
Priority Setting and Resource Allocation
9797
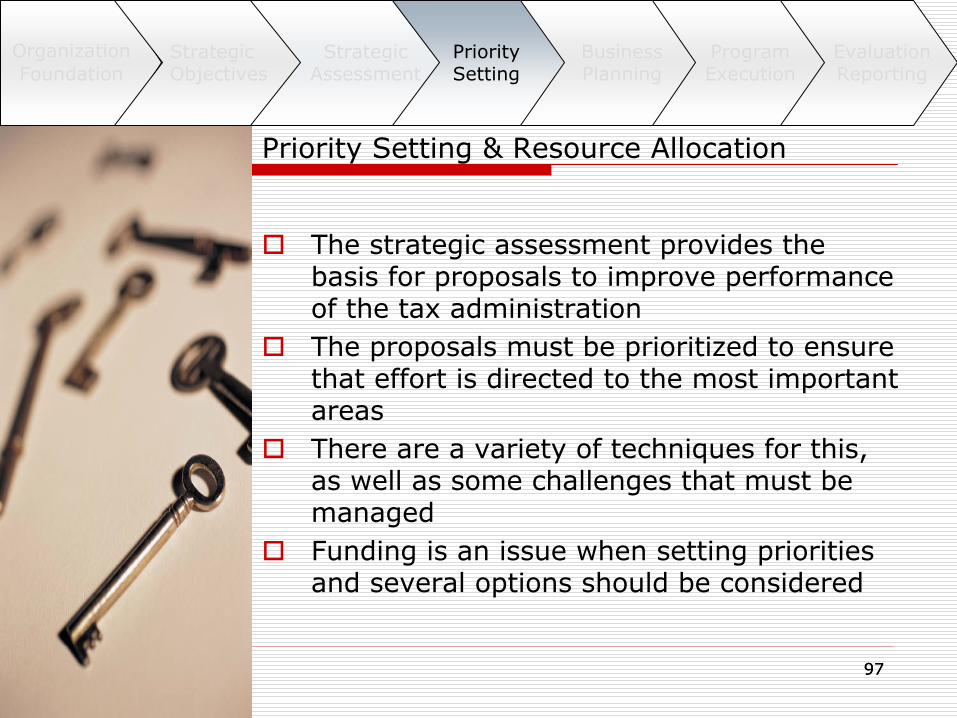
Priority Setting & Resource Allocation
The strategic assessment provides the basis for proposals to improve performance of the tax administration
The proposals must be prioritized to ensure that effort is directed to the most important areas
There are a variety of techniques for this, as well as some challenges that must be managed
Funding is an issue when setting priorities and several options should be considered
OrganizationFoundation
Strategic Objectives
Strategic Assessment
Priority Setting
Business Planning
Program Execution
Evaluation Reporting

98
Vision
Mission
Goals,Strategies
Organization’s Resources
Management of on-going Operations
Management of Projects
Operations Planning Project Portfolio
Management
Business Direction and Resource Allocation
There is need to align the organization’s resources and their allocation to the desired business direction
99
The Scenario (1)
Increasingly being asked to do more with less resources
Relatively good success of revenue agencies (systems) has resulted into being saddled with more non-core collection activities, e.g. appropriations-in-aid
with no
additional funding
Have the revenue agencies adjusted? Mixed results!!
100
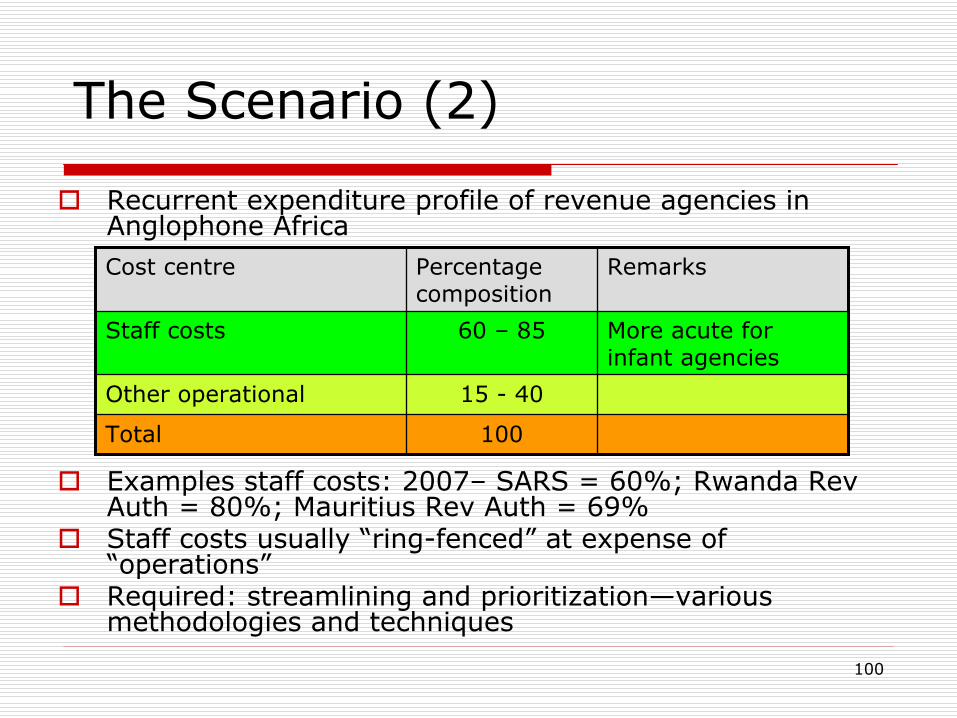
Recurrent expenditure profile of revenue agencies in Anglophone Africa
Examples staff costs: 2007–
SARS = 60%; Rwanda Rev Auth = 80%; Mauritius Rev Auth = 69%
Staff costs usually “ring-fenced”
at expense of “operations”
Required: streamlining and prioritization—various methodologies and techniques
The Scenario (2)
Cost centre Percentage composition
Remarks
Staff costs 60 –
85 More acute for infant agencies
Other operational 15 -
40
Total 100

101
Therefore, there is need to …
Decide
What to spend on or invest in
How much to spend/invest
When to change spending or investments
Based on an agency’s
Goals
Agreed strategy
Total resources available to spend/invest
Changing conditions (external and internal)

102
102
Competition for resources often creates tension, which, if not properly managed, often begets chaos …
Frequent reactions
Constituents of expenditure candidates competing for resource allocation exhibit adversarial behavior
As the number of initiatives a resource is assigned increases, focus is diluted and progress typically slows or quality suffers
It can look right on paper but expected results are undermined by insufficient resources and organizational politics
103
103
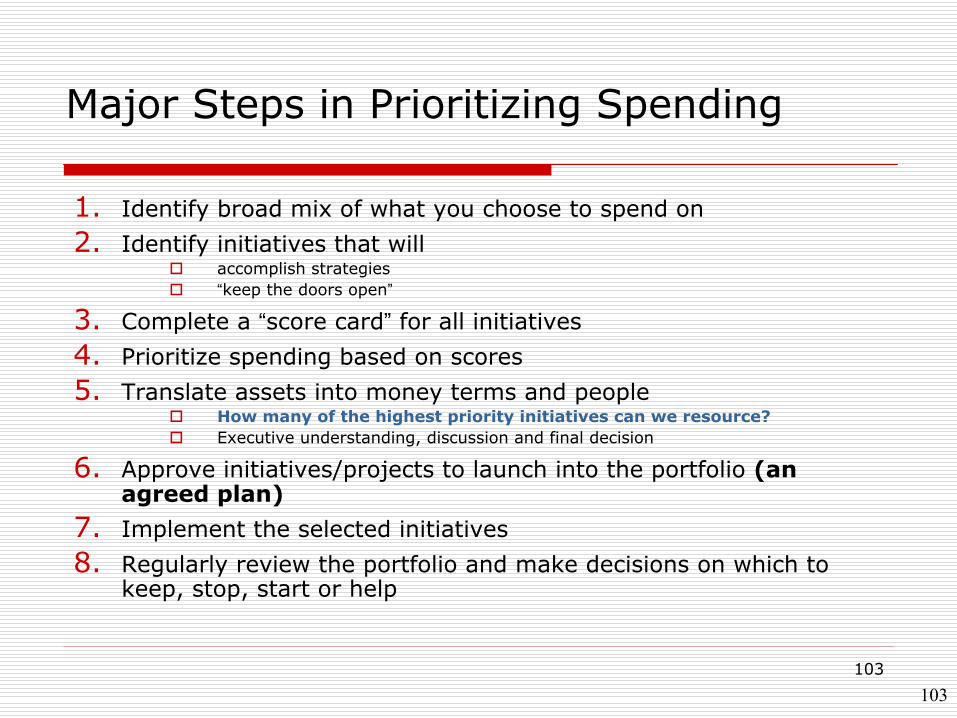
Major Steps in Prioritizing Spending
1.
Identify broad mix of what you choose to spend on2.
Identify initiatives that will
accomplish strategies
“keep the doors open”
3.
Complete a “score card”
for all initiatives4.
Prioritize spending based on scores 5.
Translate assets into money terms and people
How many of the highest priority initiatives can we resource?
Executive understanding, discussion and final decision
6.
Approve initiatives/projects to launch into the portfolio (an agreed plan)
7.
Implement the selected initiatives8.
Regularly review the portfolio and make decisions on which to keep, stop, start or help

104
104
MissionVision
Goal
Goal
Goal
Goal
Strategy
Strategy
Strategy
Strategy
Strategy
Strategy
Strategy
Strategy
Project 1
Project 2
Project 3
Project 4
Project 5
Project 6
Project 7
Project 8
Project 9
Project 10
Project 11
Project 12
Project 13
Project 2
Project 3
Project 6
Project 8
Project 9
Project 12
C
R
I
T
E
R
I
A
“Portfolio”of ProjectsResource
Capacity “Pipe”
ScoringProcess
Leverage strategic planning to identify potential initiatives/projects by introducing selection criteria
…

105
105
Regulatory requirement
Agency goal/strategy alignment
Key stakeholder expectations (government, taxpayers, employees)
Risks -
probability of success, complexity, capability
Resource availability (internal capacity)
Financial, e.g. ROI, NPV
Human (persons and skills)
Logistics and infrastructure
Competitive threat (including outsourcing the operation)
Scorecard criteriaGeneric categories of criteria –
assessment of initiatives/project viability
Turn subjective assessments into quantitative ratings so unlike initiatives/projects can be compared.

106
Internal: Goal/Strategy Alignment (impact) To what extent do the initiatives PROMOTE the agency’s goals/strategies?
Goal
Increase revenue collections;
Improve taxpayer services and trade facilitation;
Enhance taxpayer compliance;
Simplify laws, regulations, systems and procedures;
Increase the application of modern risk management approaches;
Increase security of systems, processes and property
Improve staff
skills and productivity;
Fight corruption;
Enhance corporate social responsibility; and
Meet national, regional
or international obligations (includes political and appeasement goals).
Goal/Strategy enabling -
scores
High
= 9
Medium=
6
Low
=
3
None
=
0

107
Quasi-External: Stakeholder Expectations To what extent do the projects SATISFY key stakeholder
expectations?
Expectations
Government
Increased economic competitiveness
Increased local and foreign investment
No corruption
Increased national revenue
Lower consumer costs
Taxpaying community/clients
Faster, predictable and efficient service
Transparent appeals procedure
Greater facilitation for compliant taxpayers
Lower business costs
Revenue Agency Staff
Clear and transparent operational guidelines
Protection from corruption
Skills development and professionalism
Career progression and job security
Satisfaction of stakeholder expectations
High
= 9
Medium=
6
Low
=
3
None
=
0
108
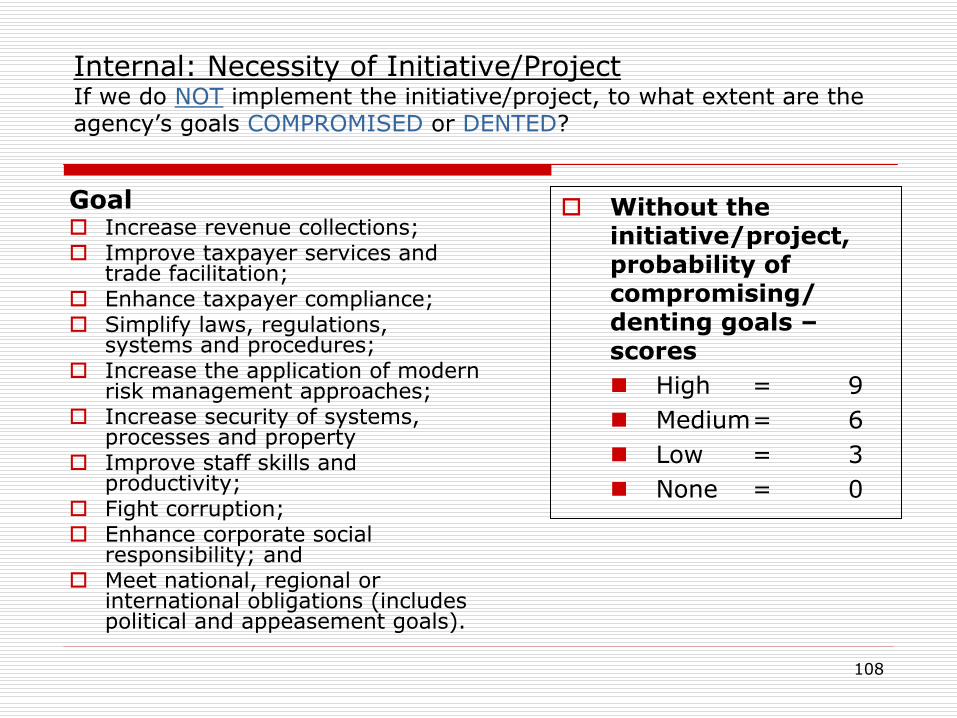
Internal: Necessity of Initiative/Project If we do NOT
implement the initiative/project, to what extent are the agency’s goals COMPROMISED or
DENTED?
Goal
Increase revenue collections;
Improve taxpayer services and trade facilitation;
Enhance taxpayer compliance;
Simplify laws, regulations, systems and procedures;
Increase the application of modern risk management approaches;
Increase security of systems, processes and property
Improve staff
skills and productivity;
Fight corruption;
Enhance corporate social responsibility; and
Meet national, regional
or international obligations (includes political and appeasement goals).
Without the initiative/project, probability of compromising/ denting goals –
scores
High
= 9
Medium=
6
Low
=
3
None
=
0

109
Internal: Implementation Risks (1) IF WE WERE TO IMPLEMENT
the initiative/project, what RISKS are we LIKELY to FACE
Risks (1)
Initiative/project outside the legal mandate of the organization
Not understanding why the organization needs the initiative/project
No management commitment
Lack of strong sponsor or sponsor not at high enough level to get people motivated
Sponsor leaves the initiative/project
Unrealistic schedules
Inadequate funding—capital or recurrent budget too small
Lack of proper skills and experience—
untrained staff
Staff not available when you need them
Poor project management
Not properly designed/architected
Implementation risks –
negative
scores
High
= -9
Medium=
-6
Low
=
-3
None
=
0
110
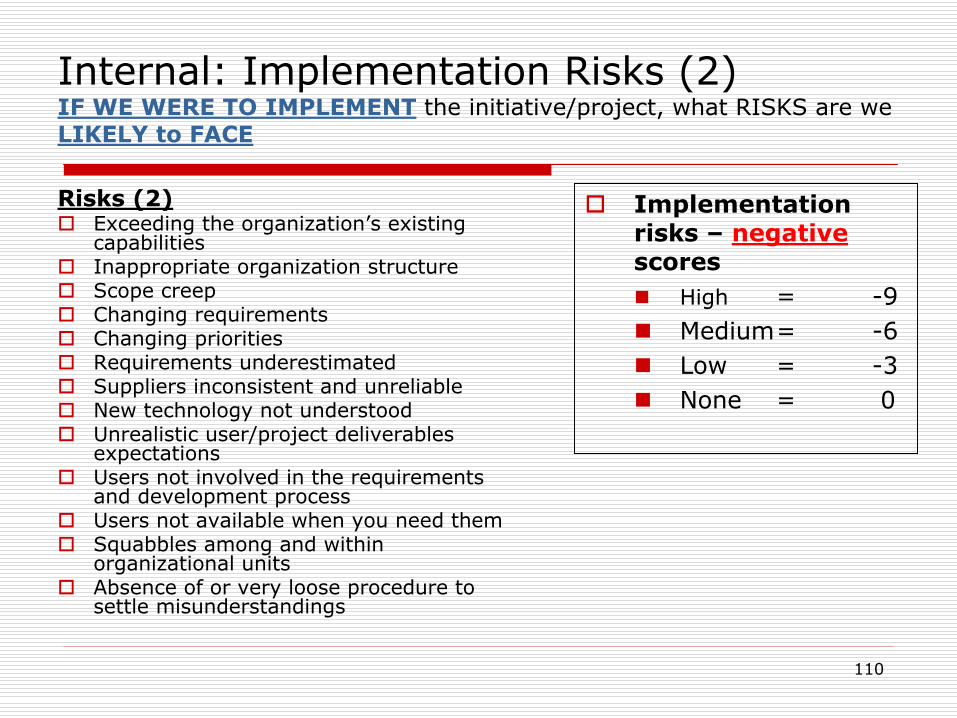
Internal: Implementation Risks (2) IF WE WERE TO IMPLEMENT
the initiative/project, what RISKS are we LIKELY to FACE
Risks (2)
Exceeding the organization’s existing capabilities
Inappropriate organization structure
Scope creep
Changing requirements
Changing priorities
Requirements underestimated
Suppliers inconsistent and unreliable
New technology not understood
Unrealistic user/project deliverables expectations
Users not involved in the requirements and development process
Users not available when you need them
Squabbles among and within organizational units
Absence of or very loose procedure to settle misunderstandings
Implementation risks –
negative scores
High
= -9
Medium=
-6
Low
=
-3
None
=
0

111
Internal: Resource availability (also reflected in the RISKS)
Financial adequacy
Capital budget
Recurrent budget
Human Resource availability
Numbers
Skills/quality
Infrastructure
Equipment and incidental items
Hardware
Software

112
Sections
Goals/Strategic Outlook
To what degree does this initiative/project enable our goals and
strategies?
Key stakeholder expectations
To what extent does this initiative/project meet key stakeholder
expectations?
Risk
If we do not
implement this initiative/project, to what extent would our goals be compromised?
If we implement this initiative/project, what are the risks—and if we decide to implement the initiative despite the risks, how do we mitigate them and at what cost?
Sample Scorecard
113
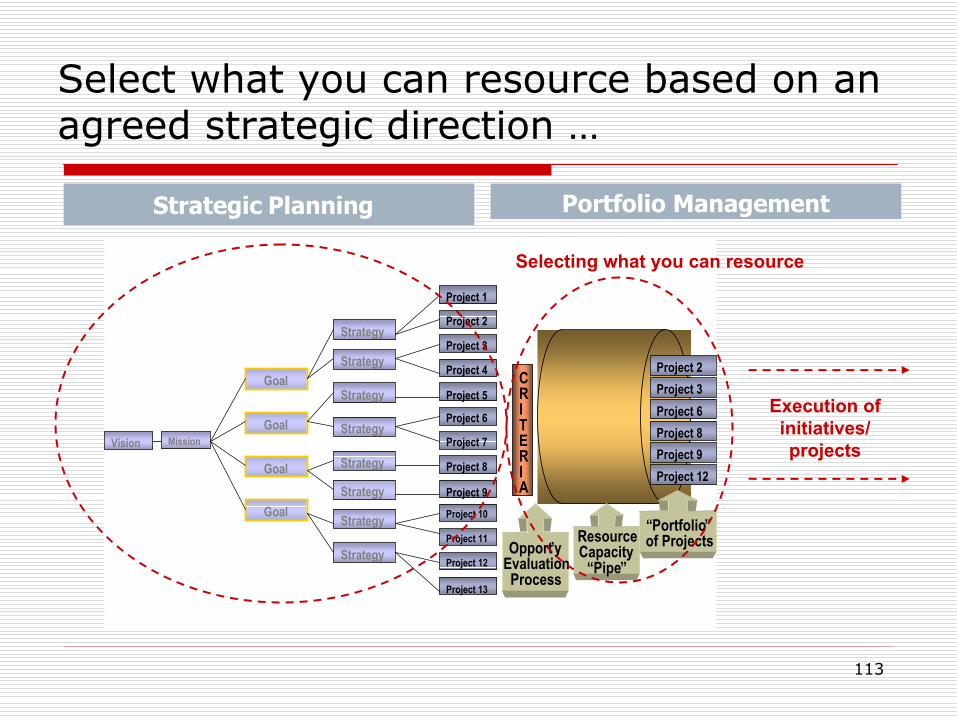
Select what you can resource based on an agreed strategic direction …
MissionVision
Goal
Goal
Goal
Goal
Strategy
Strategy
Strategy
Strategy
Strategy
Strategy
Strategy
Strategy
Project 1
Project 2
Project 3
Project 4
Project 5
Project 6
Project 7
Project 8
Project 9Project 10
Project 11
Project 12
Project 13
Project 2 Project 3Project 6Project 8Project 9 Project 12
CRITERIA
“Portfolio”of ProjectsResource
Capacity “Pipe”
Opport’yEvaluationProcess
Execution of initiatives/ projects
Strategic
Planning
Selecting what you can resource
Portfolio Management

114
Benefits of prioritized
resource allocation to initiatives that will yield the highest return on investment …
Foundation for strong governance
Transparent decision-making
Clear linkages between goals & allocation of organization’s resources
Understood by all stakeholders (internal and external)
Goal-oriented culture
Employees see the value of their work
Employees are focused and fast (previously dragged down in multiple, simultaneous initiatives/projects of various values)“Let’s do a great job on this one and move on to the next important
initiative/project to move this organization forward.”
Strategic communications
Discussions aren't just about how much an initiative/project will cost, but also about its anticipated risks and returns in relation to other initiatives/projects. This way, entire portfolios can be assembled to produce the highest returns based on existing conditions.

115
Prioritized selection of initiatives synchronizes the organization
For delivery of an accelerating flow of valuable initiatives/projects through the pipeline and to the bottom line
People sleep
at night
Each initiative/project is clearly visible
and its contribution to the portfolio measured
Focus
-
achieves organizational priorities
Faster
initiatives/projects (but fewer)
Optimize resources
Flexibility to redirect
resources quickly
Achieve laser clarity
to reach decision, to allocate resources directly to strategies and objectives, to measure and knowingly achieve “the right things”
There must be a custodian (FOCAL POINT) of the prioritization methodology in the organization; and ALL initiatives should be filtered through the agreed methodology

116
Examples
Kenya Customs
Original understanding was 25 initiatives/projects
185+ initiatives “discovered”
using methodology
Settled on priority of about 40 “defendable”
and
resourced priorities
Malawi Revenue Authority
Had in sight about 40 initiatives
Identified a total of 124
Settled on 29 key initiatives

117117117
The Strategic Management Cycle
Strategic GoalsStrategic Objectives
Strategic Assessment
Priority Setting &Resource Allocation
Business Planning
Program Execution
Measurement
Monitoring
&
Reporting
Program
Evaluation
Mission, Values, Vision, Principles

118
Performance Measurement, Analysis and Reporting
Why measure performance?Compare actual to standards and expectationsAccountabilityImprove the bottom line—service or revenue in the face of resource pressure or competition

119119119
Measurement of Performance
Measures of performance affect behaviour. Choosing the right measure will support the achievement of the strategic outcome. Choosing the wrong measure may result in an unintended outcome
120
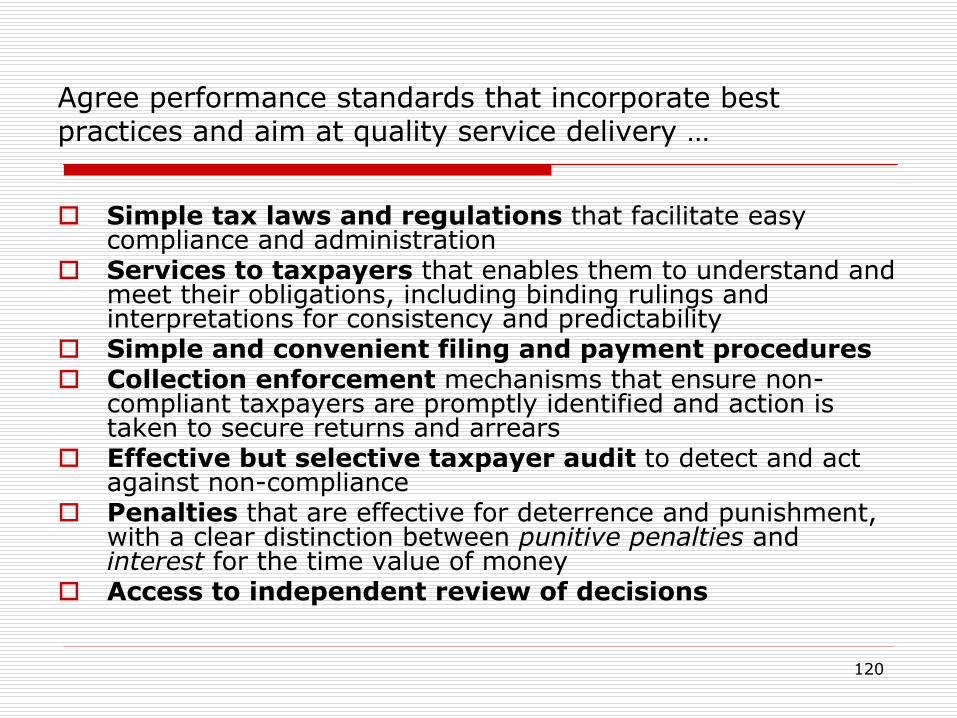
Agree performance standards that incorporate best practices and aim at quality service delivery …
Simple tax laws
and regulations
that facilitate easy compliance and administration
Services to taxpayers
that enables them to understand and meet their obligations, including binding rulings and interpretations for consistency and predictability
Simple and convenient filing and payment procedures
Collection enforcement
mechanisms that ensure non-
compliant taxpayers are promptly identified and action is taken to secure returns and arrears
Effective but selective taxpayer audit to detect and act against non-compliance
Penalties
that are effective for deterrence and punishment, with a clear distinction between punitive penalties
and interest
for the time value of money
Access to independent review of decisions

121
…and geared towards achieving targeted outcomes …
Improving taxpayer voluntary compliance
Reducing compliance costs to the taxpayer
Minimizing tax evasion
Widening the tax base
Reducing administrative costs of enforcing tax laws (collection)
Collect all tax revenue legitimately due

122
Also need …
Key performance indicators (KPIs)…
KPIs represent the measures that an
organization relies on to monitor
and drive
business performance…
KPIs needed at all levels
Strategic
Operational
Tactical (the coal-face)

123
Need to know …
What the facts are—what is happening
Why is it happening that way –
linkages,
relationships
or influences
How does it compare and
impact on the
strategic direction of the organization (vision, mission, goals)
What remedial action
is required
When the remedial action should be taken
What is required to take the remedial action
Who is responsible
for taking the remedial
action
feedback

124
Iteratively …

125
Example: Key Performance Indicators – Mauritius Revenue Authority
126
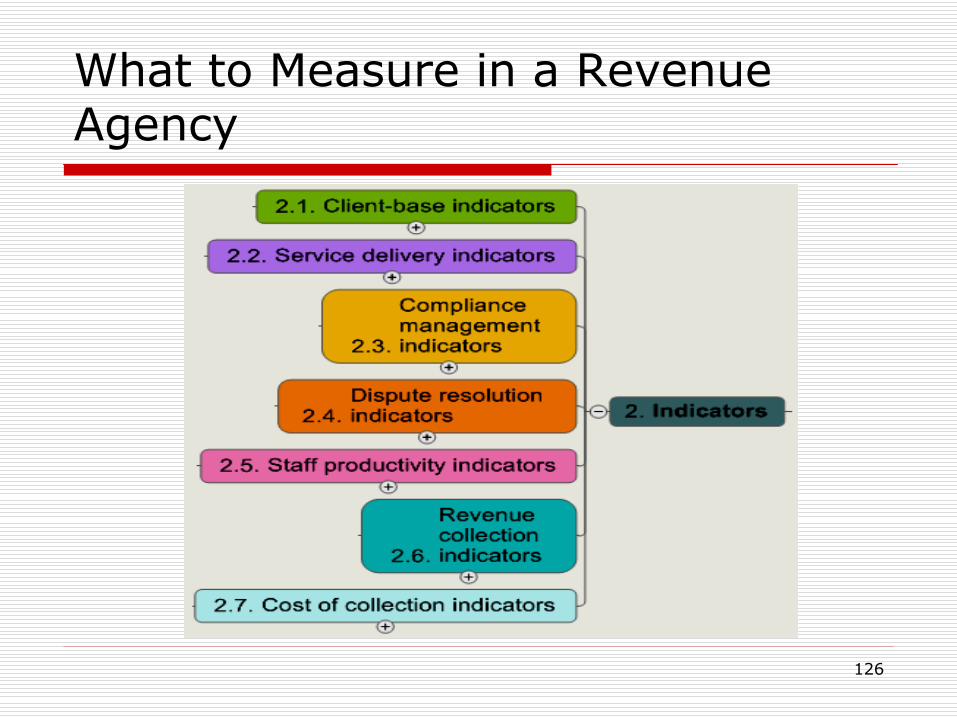
What to Measure in a Revenue Agency

127
Client-base Indicators

128
Service Delivery Indicators

129
Compliance Management Indicators

130
Dispute Resolution Indicators

131
Staff Productivity Indicators
132
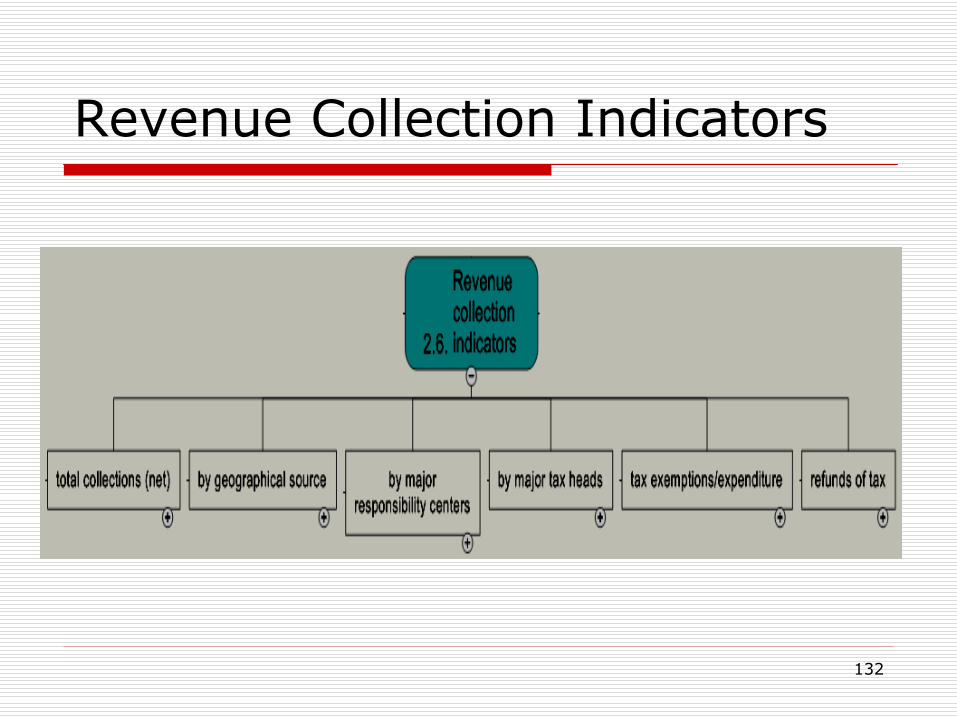
Revenue Collection Indicators

133
Cost of Collection Indicators
134
The revenue agency would then have a holistic view of …
What is happening
Why it is happening that way
How results compare with the strategic and quality direction
What to do about it
The challenge?
…
weak headquarters/head office function that designs, monitors, evaluates and quality assures performance …
135
Performance Measurement— putting it together
South African Revenue Services (SARS)
136

137
South African Revenue Services Performance (2)
138
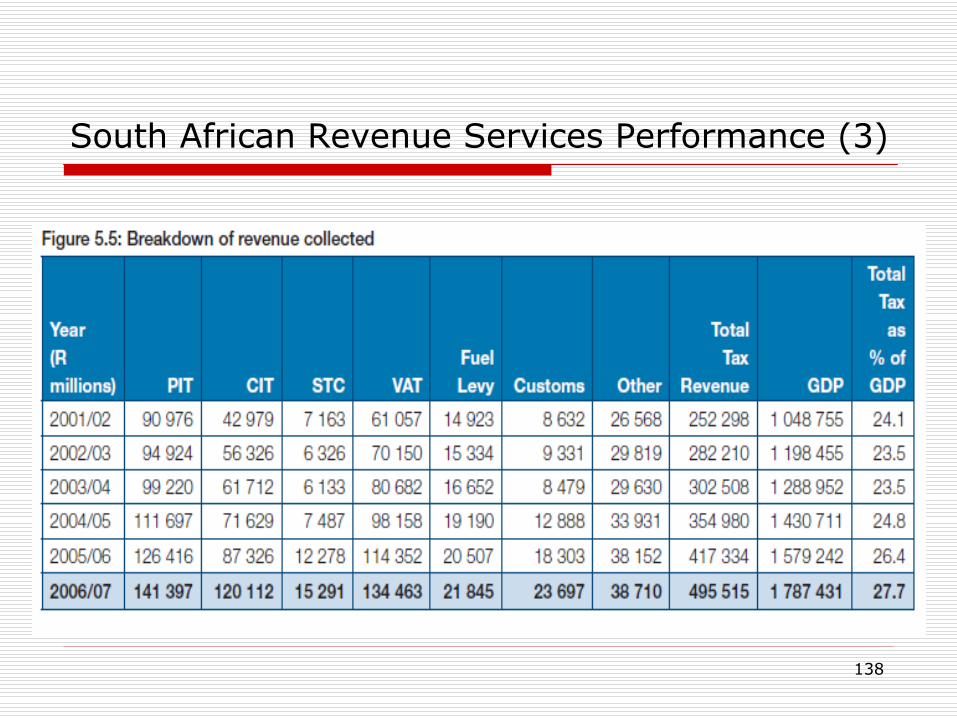
South African Revenue Services Performance (3)

139
South African Revenue Services Performance (4)

140
South African Revenue Services Performance (5)
141
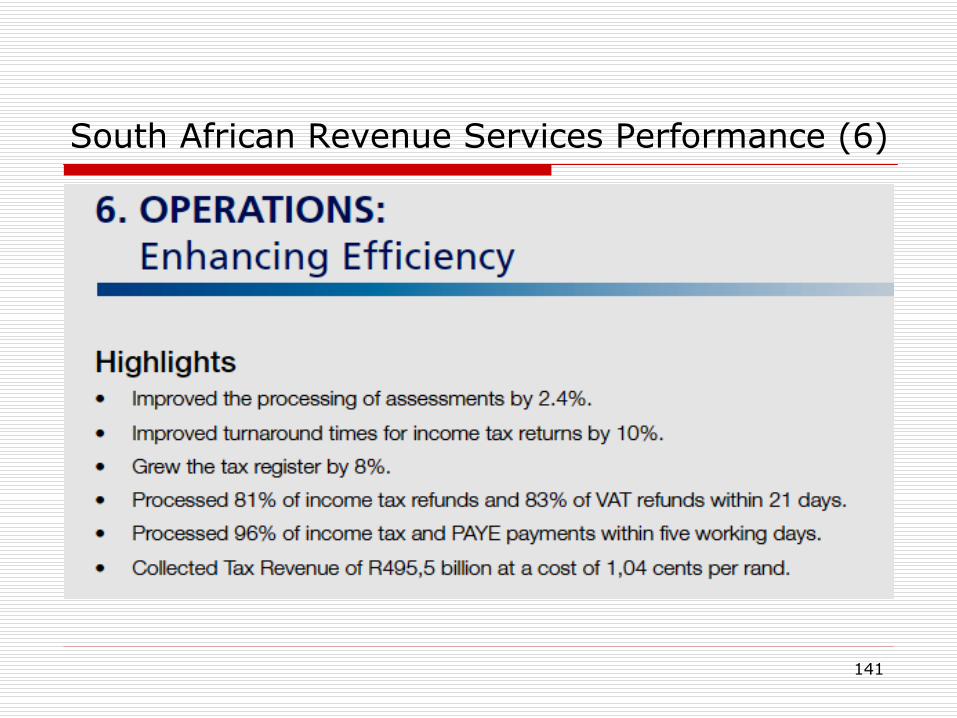
South African Revenue Services Performance (6)

142
South African Revenue Services Performance (7)

143
South African Revenue Services Performance (8)

144
South African Revenue Services Performance (9)
145
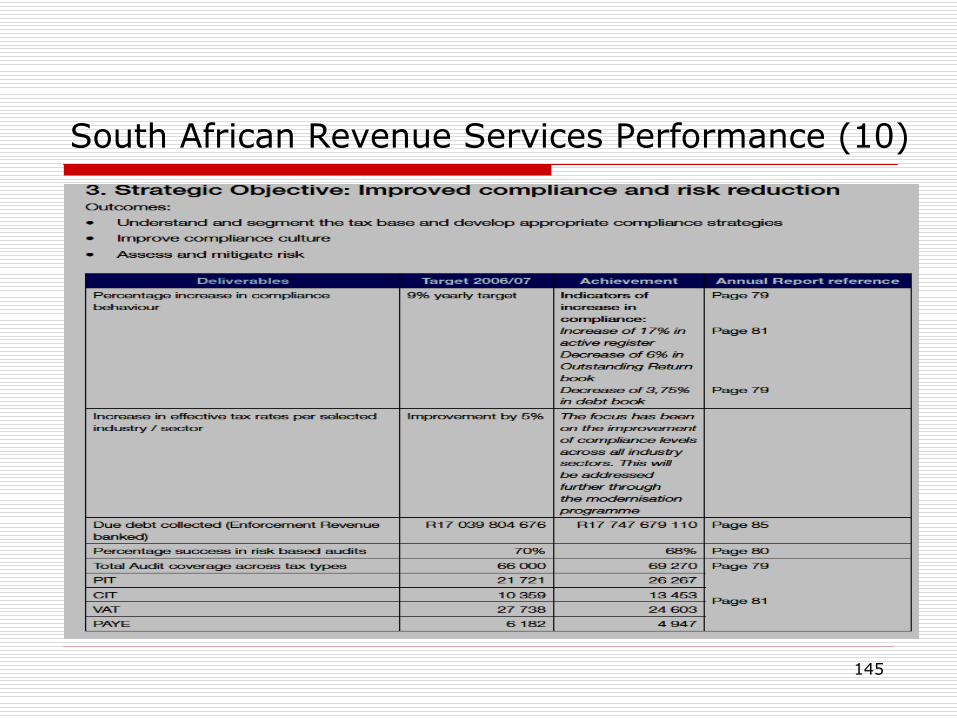
South African Revenue Services Performance (10)

146
South African Revenue Services Performance (11)

147147147
Balanced ScorecardAn Alternative Measurement System

148148148
Alternative Measurement System: The Balanced Scorecard
Use of a balanced scorecard (BSC) methodology can drive positive and focused improvements across critical areas
Performance measures are developed along four key dimensions
Financial results
Internal operations,
Innovation and learning
Customer satisfaction
Ensures that each area receives appropriate attention
149149149
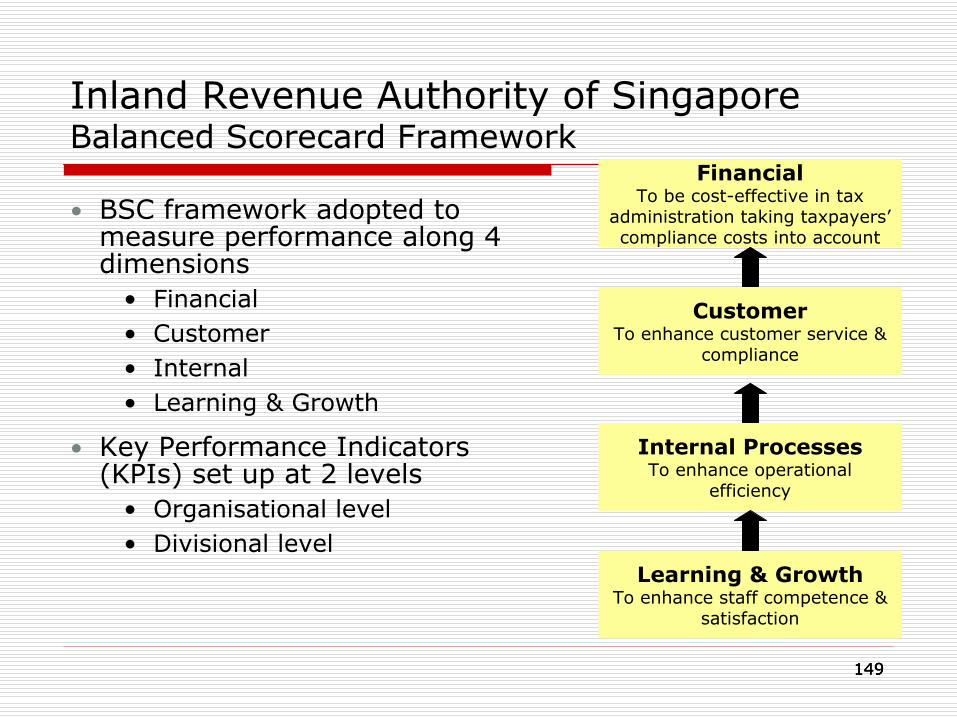
Inland Revenue Authority of Singapore Balanced Scorecard Framework
Learning & GrowthTo enhance staff competence &
satisfaction
Internal ProcessesTo enhance operational
efficiency
CustomerTo enhance customer service &
compliance
FinancialTo be cost-effective in tax
administration taking taxpayers’
compliance costs into account
•
BSC framework adopted to measure performance along 4 dimensions
•
Financial•
Customer•
Internal •
Learning & Growth
•
Key Performance Indicators (KPIs) set up at 2 levels
•
Organisational level•
Divisional level
150150150
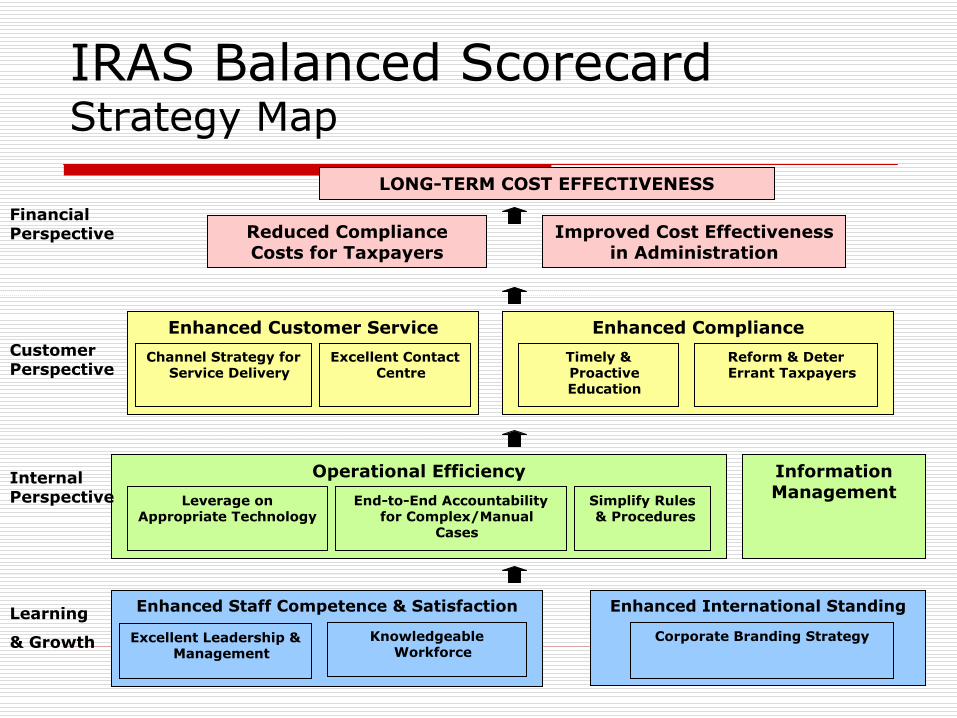
IRAS Balanced Scorecard Strategy Map
LONG-TERM COST EFFECTIVENESS
Reduced Compliance Costs for Taxpayers
Improved Cost Effectiveness in Administration
Operational EfficiencyEnd-to-End Accountability
for Complex/Manual Cases
Simplify Rules & Procedures
Leverage on Appropriate Technology
Information Management
Enhanced Staff Competence & Satisfaction
Knowledgeable Workforce
Excellent Leadership & Management
Enhanced International Standing
Corporate Branding Strategy
Enhanced ComplianceTimely & Proactive Education
Reform & Deter Errant Taxpayers
Enhanced Customer ServiceChannel Strategy for
Service DeliveryExcellent Contact
Centre
Financial Perspective
Customer Perspective
Learning
& Growth
Internal Perspective

151151151
IRAS Balanced Scorecard Key Performance Indicators (KPI)
Key performance measures and targets for the organisation are developed based on strategies in the BSC Map
Example: Financial Perspective
Balanced Scorecard Strategy
KPI
Measure Organizational Target
Improve cost effectiveness of tax administration
Operating Net Economic Value (NEV)
% improvement over 3 years
Reduce compliance costs for taxpayers
Taxpayers’
perception of compliance costs (TP
survey)
% improvement per survey
152152152
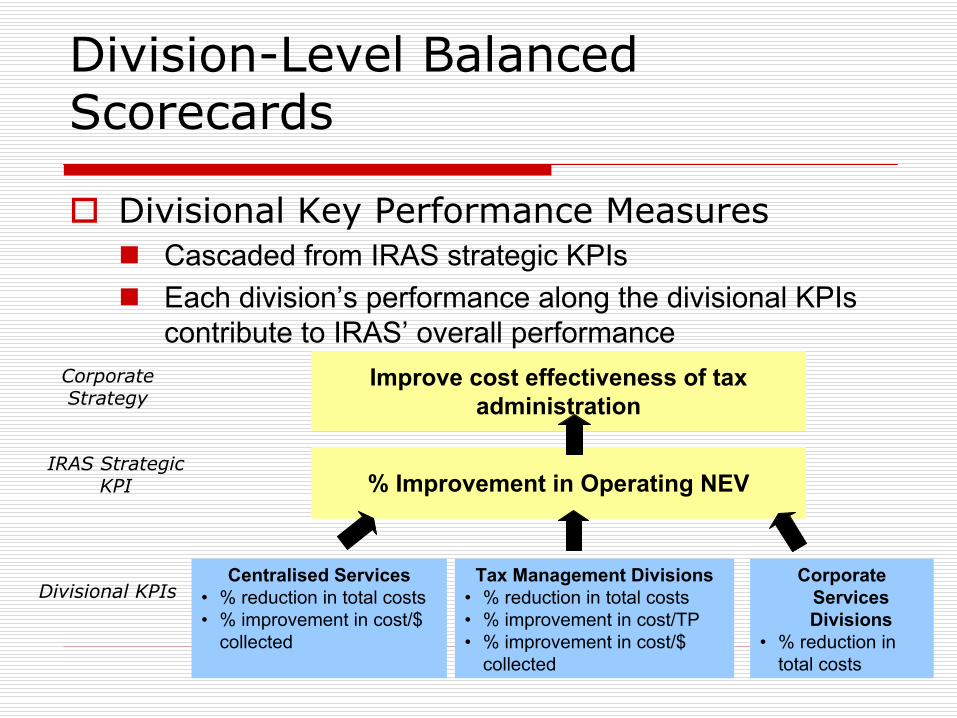
Divisional Key Performance Measures
Cascaded from IRAS strategic KPIs
Each division’s performance along the divisional KPIs
contribute to IRAS’
overall performance
Division-Level Balanced Scorecards
Improve cost effectiveness of tax administration
Corporate Strategy
% Improvement in Operating NEVIRAS Strategic
KPI
Tax Management Divisions•
% reduction in total costs•
% improvement in cost/TP•
% improvement in cost/$ collected
Divisional KPIsCentralised Services
•
% reduction in total costs•
% improvement in cost/$ collected
Corporate Services Divisions
•
% reduction in total costs

153153153
BSC for Corporate Tax Division
1 REDUCE COST OF ADMINISTRATION
2 REDUCE TAXPAYER COMPLIANCE COSTSTP’s perception of compliance cost: x% improvement per taxpayer survey
1 REDUCE NON-COMPLIANCE
2 IMPROVE TAXPAYER SATISFACTIONTP’s satisfaction (TP survey): X% improvement per taxpayer survey
3 IMPROVE VOLUNTARY COMPLIANCETP’s perception of compliance levels: 1.5% improvement / taxpayer survey
1 REDUCE GENERATION OF TAXPAYER CONTACT
2 USE APPROPRIATE TECHNOLOGY
3 REDUCE ASSESSMENT ERRORS
1 IMPROVE STAFF SATISFACTION
2 IMPROVE STAFF COMPETENCE
Learning & Growth PerspectiveInternal Processes Perspective
TargetStrategy
• XX man days per staff a year• Encourage learning
• X% decrease per Learning Needs Analysis• Reduce competency gaps
• XX ATS in 3 years• Encourage staff to gain accreditation
• All to contribute to CT knowledge database• Promote knowledge sharing
TargetStrategy
• Supervisors attend leadership courses at least once in 2 years
• X% improvement in quality of leadership score by the next OCS
• X% improvement in staff satisfaction score for each OCS
• Improve quality of leadership & management
TargetStrategy• XX% decrease in non front-line contact per
taxpayer• Review & reduce number of
Returns, ECI & other forms to be completed by taxpayer
TargetStrategy
• XX% increase in audit cases using CAAT• Use CAAT for audit
• XX% of corporate cases through pipeline• Leverage on STP
TargetStrategy
• X% and tax involved $100K• Reduce errors identified by Internal Audit
Customer Perspective
TargetStrategy
• XXX full audits, X% of STP cases partial audit• X field visits per CT-LC officer
• Increase audit presence• All debt X yrs old; 75% of debt value Y yrs• Improve quality of debt• Arrears/Net tax assessed X%• Promote timely payment
• XX% completion• Finalize assessments early
• By FY06: % of taxpayers use 1 e-service• Promote e-services• XX% increase in contacts through e-mode• Encourage self-help• Turnaround targets for corres, tel & interview• Meet service standards
• XX% decrease in contact/taxpayer by 2007• Reduce frontline contact
TargetStrategy
TargetStrategy
• XX% increase in number of initiatives a year• More education initiatives• x% increase in Returns filed on time• Promote timely filing
TargetStrategy
• 100% of rules reviewed every 3 years• Review & simplify rules• XX% issues resolved in 2 years• Speedier issue resolution
TargetStrategy
• X% decrease over 3 years (FY04 as a base)• Reduce cost per dollar collected
• X% decrease over 3 years (FY04 as a base)• Reduce cost per taxpayer• X% decrease over 3 years (FY04 as a base)• Reduce total cost
Financial Perspective

154
Revenue Ireland tried BSC
Based on 2002
Constructed as an index; 2002 = 100
We fitted it to 2001 data
Did the sums for 2003
Index ran as follows;
2001 –
99
2002
–
100
2003 –
103

155
How did we build it?
It followed the 3 corporate goals in our Statement of Strategy:
Maximise Compliance with tax and customs law
Meet our external obligations
Develop a capable and effective organisation

156
The index
It used 81 indicators
Spread over the three goals
Indicators were weighted:
Maximise Compliance –
75%
External obligations –
10%
Capable organisation –
15%

157
Some issues
Lack of objective criteria for weightings –
negotiated in good faith
Too many indicators –
no one wanted to be left out!
Lack of all the necessary data
Huge calculation every year
Resource-hungry
158
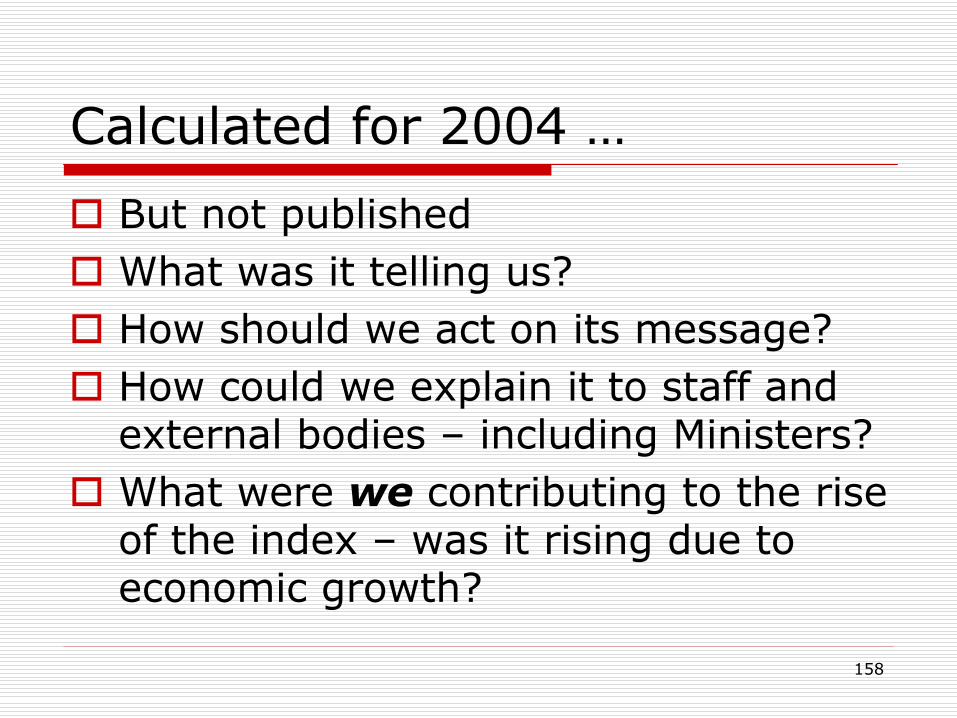
Calculated for 2004 …
But not published
What was it telling us?
How should we act on its message?
How could we explain it to staff and external bodies –
including Ministers?
What were we contributing to the rise of the index –
was it rising due to
economic growth?

159
So ……….. we dropped the BSC!
Developed a set of performance indicators
Publish them monthly in our Corporate Performance Report
Based on hard data
Linked to our corporate goals
Same data as BSC, presented simply
But are working hard on improving our management information

160160
The Strategic Management Cycle
Strategic GoalsStrategic Objectives
Strategic Assessment
Priority Setting &Resource Allocation
Business Planning
Program Execution
Measurement
Program
Monitoring
&
Management
Program
Evaluation
Mission, Values, Vision, Principles
161161
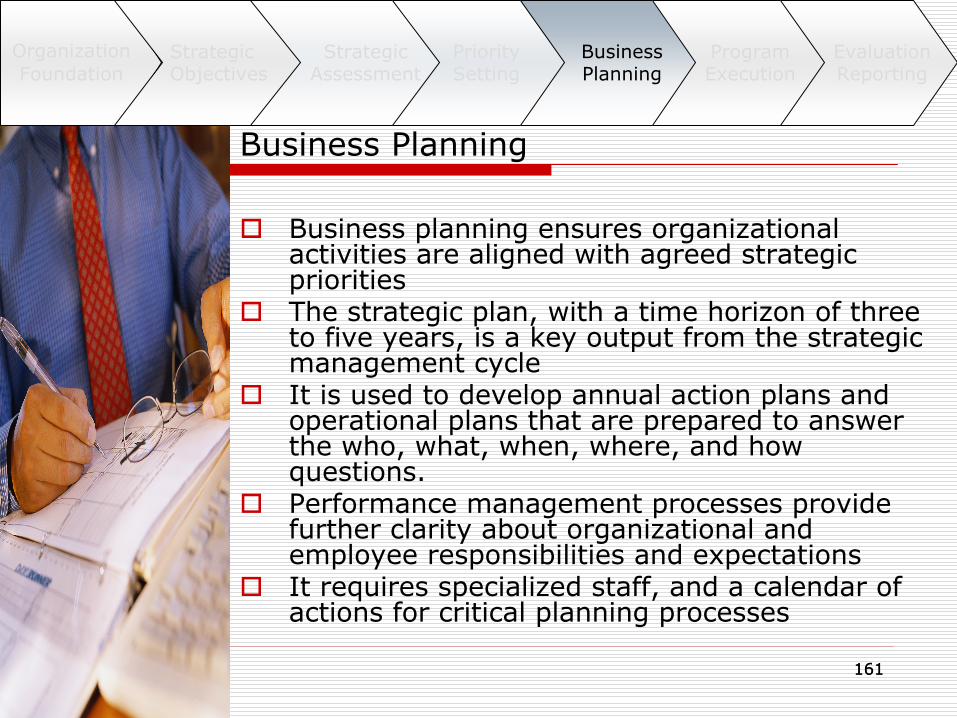
Business Planning
Business planning ensures organizational activities are aligned with agreed strategic priorities
The strategic plan, with a time horizon of three to five years, is a key output from the strategic management cycle
It is used to develop annual action plans and operational plans that are prepared to answer the who, what, when, where, and how questions.
Performance management processes provide further clarity about organizational and employee responsibilities and expectations
It requires specialized staff, and a calendar of actions for critical planning processes
OrganizationFoundation
Strategic Objectives
Strategic Assessment
Priority Setting
Business Planning
Program Execution
Evaluation Reporting

162162
From Planning to Implementation
Strategic Plan
Action Plan
Operational Plan
Planning
Implementation

163163
Business Planning: Action and Operational Plans
Action and operational plans perform different but complementary roles in the execution of the strategic plan:
Action plans translate strategic plans into specifics in a shorter timeframe (e.g. 1 year); while operational plans provide implementation details that support action plans
Actions plans will include initiatives that are supported by operational plans, for example:
Developing a strategy to improve compliance of high wealth individuals, will include
audits of high-wealth taxpayers in an operational plan
other activities that are not in operational plans, but are essential to success, such as outreach to professional groups and proposals for legislative changes
Operational plans provide detailed expectations for products or outputs at work section levels (e.g., audits, taxpayers assisted, and arrears)

164164
Annual Action Planning
Presents the strategic goals and sub-strategies underneath them (objectives, actions, projects, activities)
Identifies the primary office of responsibility, partner offices and dependencies
detailed sub-plans by business-line are necessary
Identifies deadlines and resource allocation
Requires project management to ensure implementation
organization-wide
business-line and supporting functions (HR, IT, facilities)
individual action, such as the development of a new IT system

165165
Translating Strategic Plans Into Action2009 2010 2011
Strategic Goal 1
Plan for Implementation
oActivitiesoTimelinesoDependenciesoResources requiredoOutcomes incl. KPIs 2011oExpected Savings
DEPARTMENTAL ANNUAL BUSINESS PLAN 2009•2009 Actions to Realise Strategy (Goal 1)o2009 Actions to Realise other Strategic GoalsoOn-going Monitoring & Managing business through KPIs & targeted improvements
DEPARTMENTAL ANNUAL BUSINESS PLAN 2010•2010 Actions to Realise Strategy (Goal 1)o2010 Actions to Realise other Strategic GoalsoOngoing Monitoring & Managing business through KPIs & targeted improvements
DEPARTMENTAL ANNUAL BUSINESS PLAN 2011•Actions to Realise Strategy (Goal 1) completedo2011 Actions to Realise other Strategic GoalsoOngoing Monitoring & Managing business including new KPI to measure success of Goal 1 implementation
For each Strategic Goal an action plan for delivery is drawn up and agreed by participants
Exceptional Activity
Business as usual

166166
Example of Annual Action Plan
Major Strategy Operational Priority IT Improvement Project
Increase compliance among small business taxpayers by enhancing compliance techniques and targeting education efforts.
Lead: Department A
Partners: Offices B and C
Support: Unit D
Deadline: December 2009
-Focus resources and research on uncovering and addressing unreported income -
Assess and impede non-
filing by developing and implementing a comprehensive non-filer strategy.-Deter growing arrears through root cause analysis and process improvements.-Assess the effectiveness of notices and redesign as appropriate.
Implement an audit case selection system using updated selection models.
167167
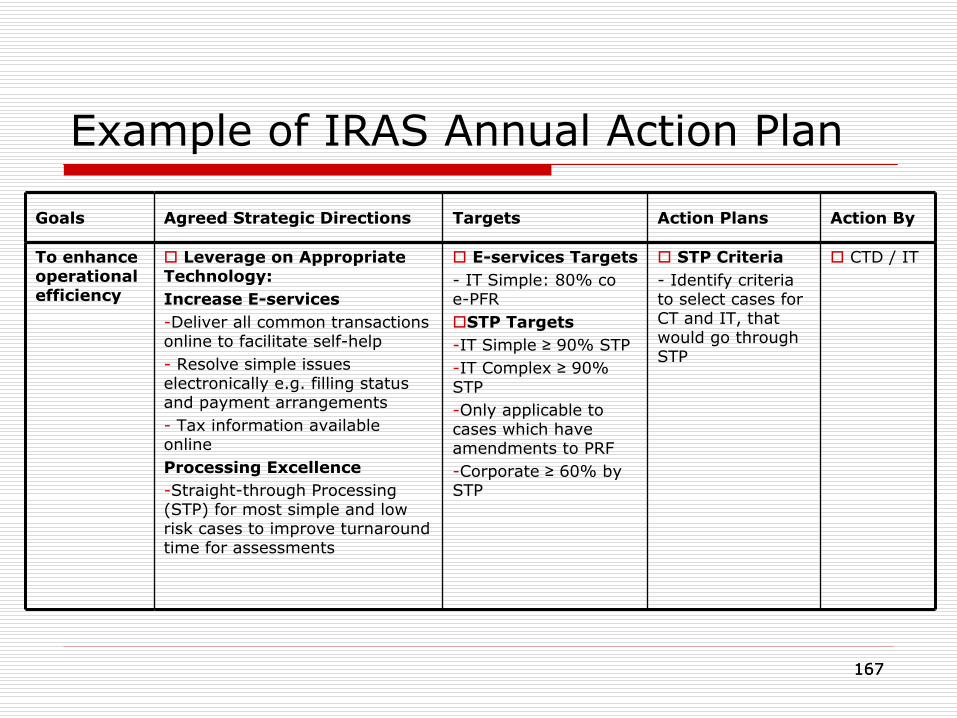
Goals Agreed Strategic Directions Targets Action Plans Action By
To enhance operational efficiency
Leverage on Appropriate Technology:Increase E-services-Deliver all common transactions online to facilitate self-help-
Resolve simple issues electronically e.g. filling status and payment arrangements-
Tax information available onlineProcessing Excellence-Straight-through Processing (STP) for most simple and low risk cases to improve turnaround time for assessments
E-services Targets-
IT Simple: 80% co e-PFRSTP Targets-IT Simple ≥
90% STP-IT Complex ≥
90% STP-Only applicable to cases which have amendments to PRF-Corporate ≥
60% by STP
STP Criteria-
Identify criteria to select cases for CT and IT, that would go through STP
CTD / IT
Example of IRAS Annual Action Plan

168168
Operational Plans
Annual operational business plans
ensure that core tax administration activities align with agreed organizational priorities
provide details at work section levels, also answering the who, what, when, where, why questions
Operational plans require:
Forecasts of workloads
Estimates of direct staff hours available
Productivity standards for specific work activities
Output targets
Focus is on production units and day-to-day activities (e.g., number of audits per region and per type of taxpayer)
Operational plans provide details on inputs, expected outputs and performance measures

169169169
Setting Annual Operational Objectives
Function Audit Plan agrees to produce 1,000 Large, 3,000 Medium and 12,000 Small Audits to Audit Quality Standard of 80% or more.
Tax Directorate 1 (10% of national audit capacity) agrees to produce100 Large, 300 Medium, and 1,200 Small Audits to 80%+ Quality Standard
Audit Team 1 (25% of Tax Directorate 1 audit staff) agrees to produce 25 Large, 75 Medium and 300 Small Audits to 80%+ Quality Standard
AUDIT FUNCTION
TAX DIRECTORATE
1
TAX DIRECTORATE 2
TAX DIRECTORATE
3…
AUDIT TEAM 1 AUDIT TEAM2 AUDIT TEAM 3

170170
IRAS Annual Planning Program
Feedback & Assessment
Management Planning Session (I)
Staff Workshop
Management Planning Session (II)
Cascading Down process
Communication
Review
External Scanning
Customer Feedback
Internal Stakeholders
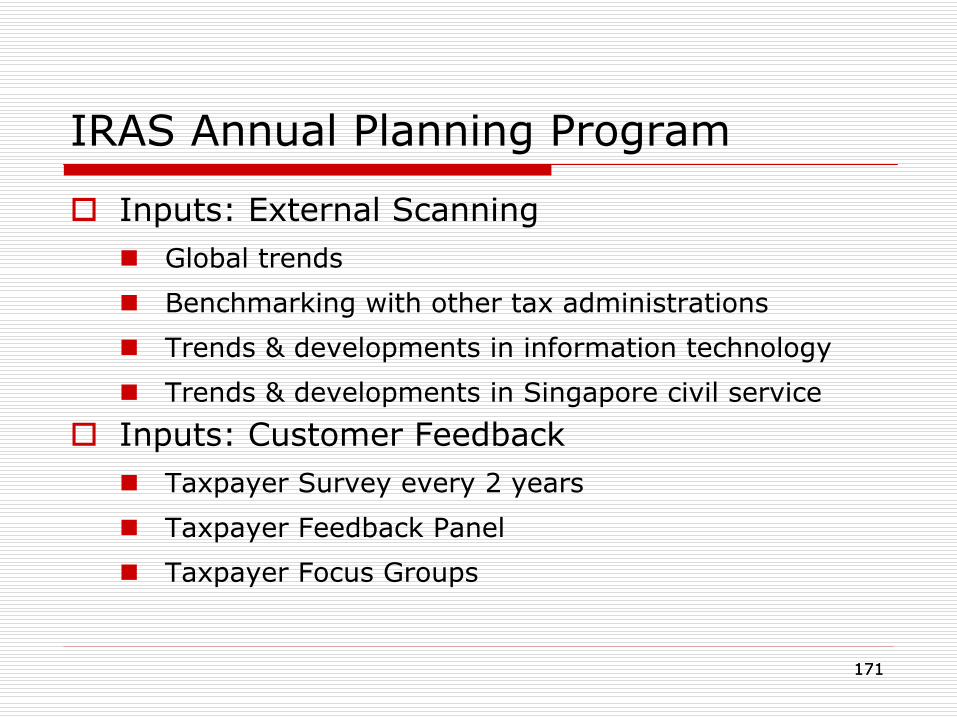
171171
IRAS Annual Planning Program
Inputs: External Scanning
Global trends
Benchmarking with other tax administrations
Trends & developments in information technology
Trends & developments in Singapore civil service
Inputs: Customer Feedback
Taxpayer Survey every 2 years
Taxpayer Feedback Panel
Taxpayer Focus Groups

172172
Management Planning Workshop (I)
Take stock of past year’s performance
Review inputs from customers, external scanning, etc
Identify key directions and challenges in the year ahead
Develop strategies and action plans
Staff Workshops
Communicate strategies developed at the Management Planning Workshop
Gather feedback for Management to fine-tune strategies and action plans
IRAS Annual Planning Program

173173
Management Planning Workshop (II)
Analyse staff feedback
Incorporate feedback in strategic and action plans
Formalise key directions for the year
Communication Plan
Communication to staff at all levels to keep them informed and involved
Mass retreats, corporate events, staff workshops, divisional briefings, Commissioner's speech, e-mails and internal web portal to communicate key directions
IRAS Annual Planning Program

174174
Communication to taxpayers
Media coverage, taxpayer education programs
IRAS Annual Planning Program

175175
The Strategic Management Cycle
Strategic GoalsStrategic Objectives
Strategic Assessment
Priority Setting &Resource Allocation
Business Planning
Program Execution
Measurement
Program
Monitoring
&
Management
Program
Evaluation
Mission, Values, Vision, Principles

176176
Program Execution
Even the best strategic planning is ineffective without good execution
Program execution is difficult and complicated
There are several challenges to successful execution
Keys to better execution include:
Clear roles within a well-designed organizational structure
A commonly understood and well articulated business plan
A culture of performance
OrganizationFoundation
Strategic Objectives
Strategic Assessment
Priority Setting
Business Planning
Program Execution
Evaluation Reporting

177177
Program Execution as a Key to Success
Good execution of a poor plan will not provide improvement in tax administration
Neither will poor execution of a good plan
Both a sound strategic plan and proper execution of the plan are necessary to make improvement
Sound program execution requires a disciplined process that logically connects a series of integrated activities together
Success may require early, positive intervention by managers
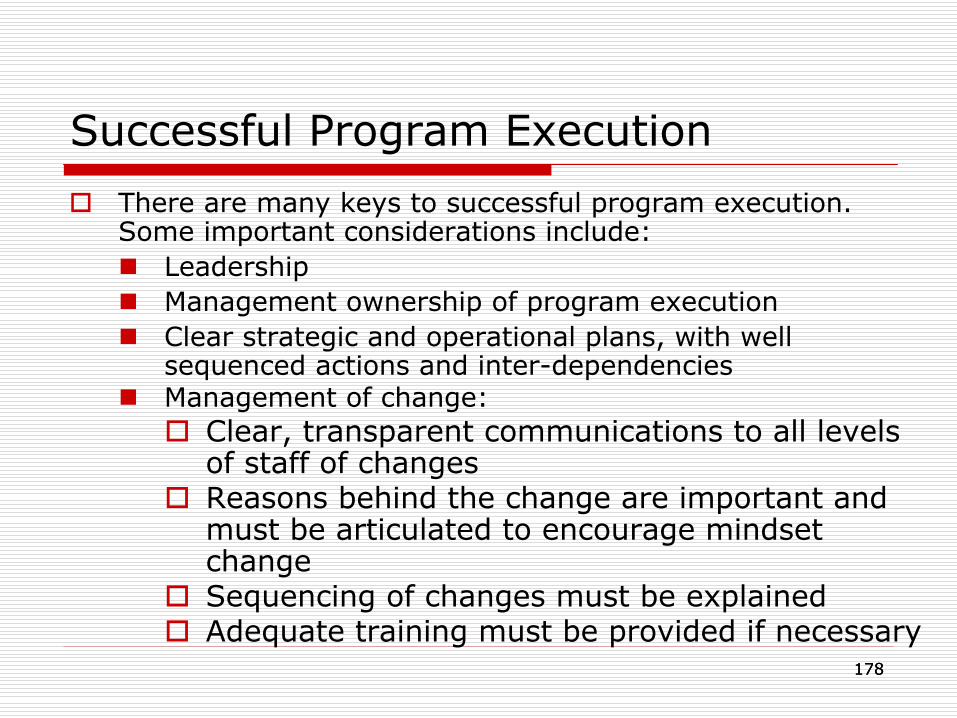
178178
Successful Program Execution
There are many keys to successful program execution. Some important considerations include:
Leadership
Management ownership of program execution
Clear strategic and operational plans, with well sequenced actions and inter-dependencies
Management of change:
Clear, transparent communications to all levels of staff of changes
Reasons behind the change are important and must be articulated to encourage mindset change
Sequencing of changes must be explained
Adequate training must be provided if necessary

179179
Successful Program Execution
Defined responsibilities:
Clear understanding of who
is responsible and
for what
Different parts of the organization may be responsible for different aspects of a strategy
Organizational structure is important to accountability and strategy integration
Organizational culture of achievement:
Incentives and recognition for effort and achievement are strong motivating factors
Solid system of controls, feedback and adaptation
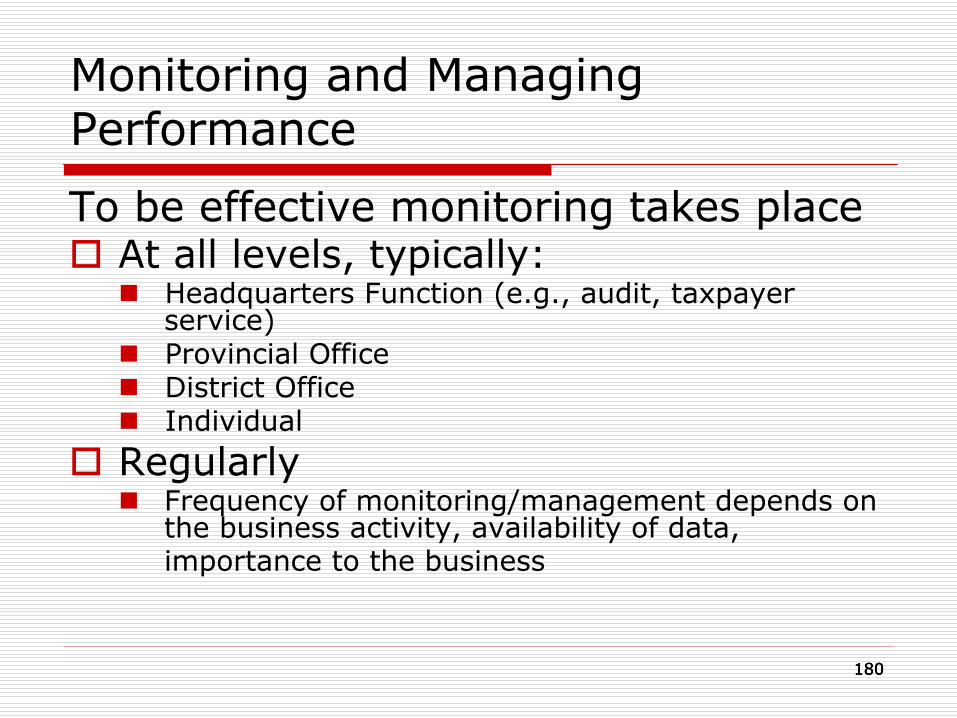
180180180
Monitoring and Managing Performance
To be effective monitoring takes place
At all levels, typically:
Headquarters Function (e.g., audit, taxpayer service)
Provincial Office
District Office
Individual
Regularly
Frequency of monitoring/management depends on the business activity, availability of data, importance to the business

181181181
Monitoring –
An Example
Measure
2006 Actual
2007Actual
2008Actual
2009Target
2009Target9/30/09
Actual9/30/09 Status
Employee Satisfaction
53% 57% 62% 65% 65% 68% Green
Customer Satisfaction
81% 85% 77% 82% 82% 76% Yellow
Quality 80% 78% 89% 90% 90% 87% Green
Processing Time
59.7 60.16 61.44 58.00 58.00 61.74 Yellow
Number of Returns Closed
3,734 4,851 4,527 3,528 2,905 3,921 Green
Direct Staff Years
1,485 1,500 1,352 1,340 1,103 1,151 Green

182182182
Performance Measures
Strategic
Operational
Diagnostic Measures
Individual/Managerial
Performance Appraisals
Organization Level
Business Line Level
Individual Level
Objectives Examples
•
Given the strategies, measure the effectiveness of execution of particular aspects of the organization
•
Business Results:
–
Quality
–
Quantity•
Customer Satisfaction•
Employee Satisfaction
•
Help identify the underlying factors that affect changes in performance measures
•
Process and qualitative
•
Assess how organizational measures relate to individual/managerial performance appraisals
•
Critical job elements for employees
•
Commitments for executives
•
Measure the outcomes of given strategies in terms of behavioral impacts
•
Voluntary Compliance Levels
•
Customer Satisfaction•
Employee Satisfaction
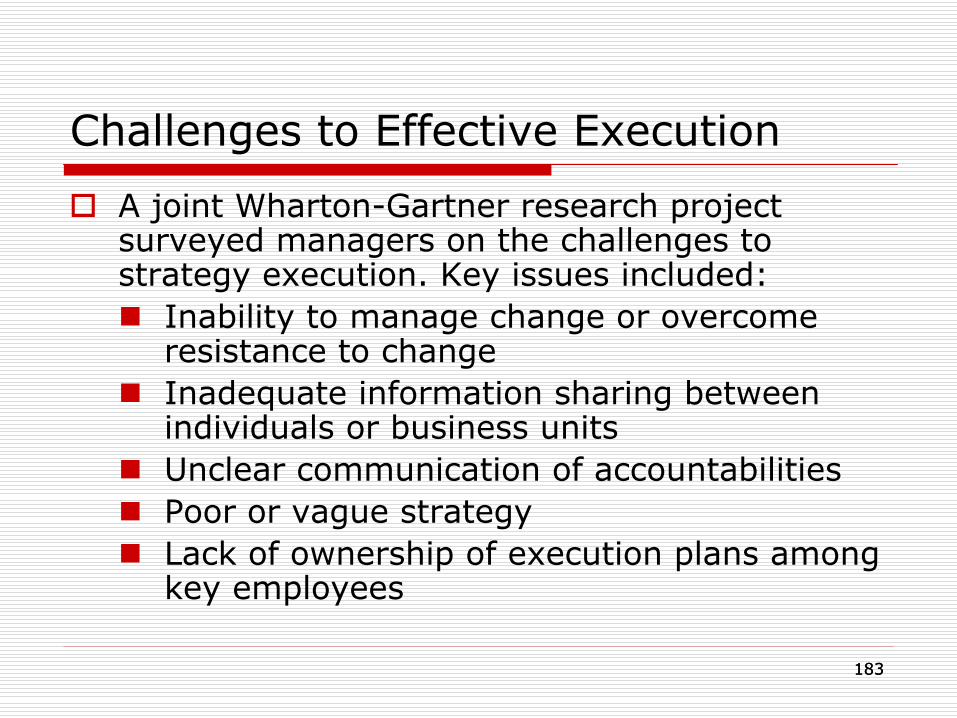
183183
Challenges to Effective Execution
A joint Wharton-Gartner research project surveyed managers on the challenges to strategy execution. Key issues included:
Inability to manage change or overcome resistance to change
Inadequate information sharing between individuals or business units
Unclear communication of accountabilities
Poor or vague strategy
Lack of ownership of execution plans among key employees

184184
Planning Cycle and Staff Support

185185
Planning Calendar
The strategic management cycle has a calendar of events associated with it.
While the programs for the current fiscal year are being executed, the strategic assessment and priority setting is taking place for the upcoming three-to-five year period.
Once completed, in the form of a strategic plan, the process for developing business plans (i.e., action and operational work plans) is started, in preparation for the upcoming fiscal year
The following slides depict a quarterly scheduling of planning activities that involve prior year, current year and future year activity

186186
Activity Q1 Q2 Q3 Q4
Evaluate last year’s performance
Prepare the Annual Report
Develop employee performance contracts for current year
Execute the current year program
Prepare for upcoming year:
Conduct environmental scan, SWOT
Revise strategic plan and submit budget request
Set priorities and allocate budget
Develop action and operational plans, and performance goals
Prior Year Current Year Next Year
Planning Calendar

187187
d
e
Strategic Planning, Budgeting, and Performance
Management Cycle
Prepare/UpdatePerformance Plan, OMBBudget & Congressional
Justification
Develop Strategy &Program Plan
Commissioner’sPlanning Guidance
Conference
Conduct StrategicAssessment
Execute & ReviewStrategy, Program &
Budget
Develop Business &Resource Allocation
Plans
IRS Strategic Planning, Budgeting, and Performance Management Cycle
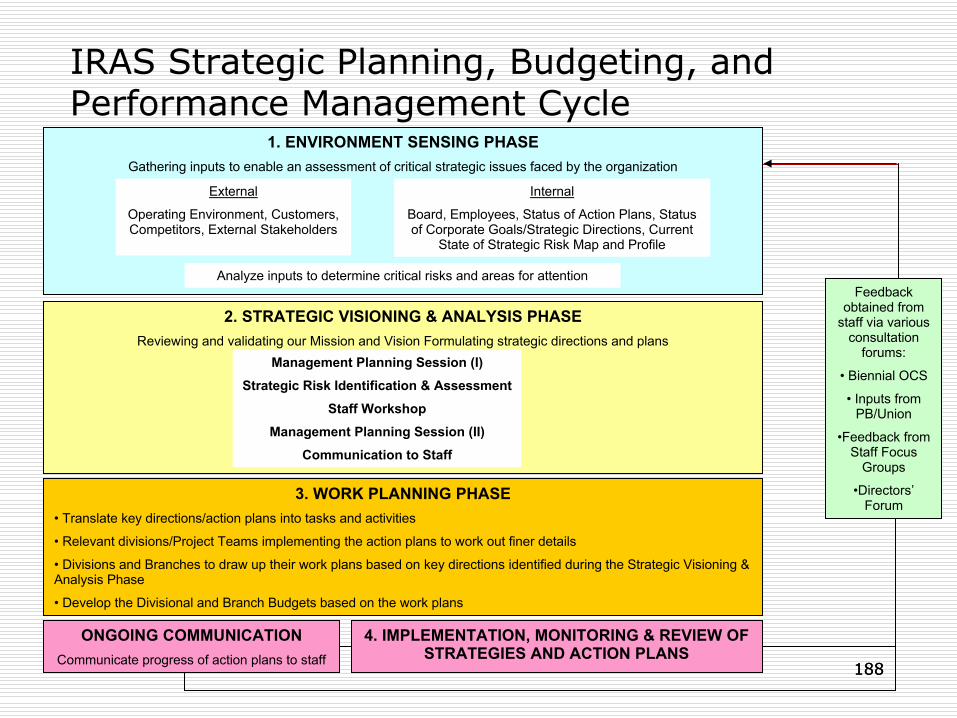
188188
IRAS Strategic Planning, Budgeting, and Performance Management Cycle
1. ENVIRONMENT SENSING PHASEGathering inputs to enable an assessment of critical strategic issues faced by the organization
2. STRATEGIC VISIONING & ANALYSIS PHASEReviewing and validating our Mission and Vision Formulating strategic directions and plans
3. WORK PLANNING PHASE• Translate key directions/action plans into tasks and activities
• Relevant divisions/Project Teams implementing the action plans to work out finer details
•
Divisions and Branches to draw up their work plans based on key
directions identified during the Strategic Visioning & Analysis Phase
• Develop the Divisional and Branch Budgets based on the work plans
ONGOING COMMUNICATIONCommunicate progress of action plans to staff
4. IMPLEMENTATION, MONITORING & REVIEW OF STRATEGIES AND ACTION PLANS
External
Operating Environment, Customers, Competitors, External Stakeholders
Internal
Board, Employees, Status of Action Plans, Status of Corporate Goals/Strategic Directions, Current
State of Strategic Risk Map and Profile
Analyze inputs to determine critical risks and areas for attention
Management Planning Session (I)
Strategic Risk Identification & Assessment
Staff WorkshopManagement Planning Session (II)
Communication to Staff
Feedback obtained from
staff via various consultation
forums:
• Biennial OCS
• Inputs from PB/Union
•Feedback from Staff Focus
Groups
•Directors’
Forum
189189
Planning Staff’s Responsibilities
A headquarters-based planning staff would through coordination with operations
develop strategic and annual plans
develop and administer the framework for organizational performance measurement and improvement
prepare internal and external performance reports
administer the customer satisfaction survey program
analyze program performance and customer survey results

190190
Planning Function
Business lines (e.g., audit, tax administration, and other organizational units, such as provinces) also typically have resources dedicated to planning
Coordination across business line planning is necessary to manage in an integrated cross-
organizational fashion
High-level direction must come from the leader of the tax administration with the support of other senior leaders, often operating as a Strategic Planning Committee

191191
IRAS Corporate Planning Branch
In IRAS, corporate planning branch is set up to guide and develop the organization towards total organizational excellence. Functions of corporate planning branch include:
To support IRAS management in strategic planning
E.g. Corporate Planning Exercise 2009
To review corporate policies and carry out corporate research
Set up Tax Competitiveness Forums with economic agencies and to look into long term tax strategies
To build organization's capabilities and drive towards business excellence
ISO Certification
Singapore Quality Award (SQA)
People Developer (PD) Certification
To introduce and implement new initiatives
Enterprise Risk Management (ERM)
Learning Organization (LO)
Knowledge Management (KM)

192192
Research Capability
Many tax administrations have a research function that provides information on compliance trends and evaluates the impact that particular strategic initiatives have had on compliance. Activities include:
Conducting market research to understand and the behavioral trends and needs of taxpayers.
Identifying and analyzing emerging compliance patterns among taxpayers, particularly in filing, reporting, and payment compliance.
Providing research decision support to the strategic assessment process.
Providing support in developing balanced organizational measures, including processes for gathering customer and employee input and assessing the impact of products and services.
Measuring the impact of products and services through internal and external research, program evaluation and analysis of customer feedback.