strategic real estate development: mixed method using...
TRANSCRIPT
Journal of Entrepreneurship, Business and Economics ISSN 2345-4695
2015, 3(2): 65–85
Copyright © 2015 Scientificia www.scientificia.com
STRATEGIC REAL ESTATE DEVELOPMENT: MIXED METHOD
USING SEQUENTIAL EXPLANATORY STRATEGY – RESEARCH
METHODOLOGY
Kelik Hastjarjo
Padjadjaran University, Bandung, Indonesia
E-mail: [email protected]
Received June 2015; accepted August 2015
Abstracts
Strategic Real Estate Development (Strategic RED) is the contemporary framework that integrate
both Resorce-based View (RBV) and Industrial Organization (IO) paradigm. Strategic RED have
many complex variables and indicators, to test the hypotheses need a mix method, combination of
QUANTITATIVE and qualitative methods, because the results of the first quantitative study needs to
be deepened with qualitative study. The research design using sequential explanatory strategy, This
model of combination research give more higher weight to the use of quantitative research methods.
This mixed sequential explanatory design first examined the relationships between environment riks,
core competence, competitive strategy, competitive advantage, and organizational performance. 200
real estate companies will asked the hypotheses and analyze with partial least square technique in the
quantitative design. In a second phase of the study, further exploration of result of relationships be-
tween contributing variables was explored through qualitative semi-structured interviews with CEO,
Senior Manager, and Expertist in real estate development. Interviews were recorded, transcribed, and
then analyzed for themes.
Conceptual paper
Keywords: Mix Method Research, Sequential Explanatory Design, Real Estate Indonesia
Reference to this paper should be made as follows: Hastjarjo, K. (2015). “Strategic Real Estate De-
velopment: Mixed Method Using Sequential Explanatory Strategy – Research Methodology”, Journal
of Entrepreneurship, Business and Economics, Vol. 3, No. 2, pp. 65–85. 1
1 This paper is a revised and expanded version of a paper presented at the International Conference on
Entrepreneurship, Business and Social Sciences, Indonesia in 2015.

Hastjarjo, K. 2015. Strategic Real Estate Development: Mixed Method Using Sequential Explanatory
Strategy-Research Methodology
66
Introduction
The arguments of mixed methods in business management research have
continued over recent decades. These arguments focus on the consistence
and relevance when applying different methods with different philosophical
paradigms in a single research study. In fact, one study can follow
different research styles. As pragmatists postulated the compatibility of the
research, the mixed methods are used to achieve the complementary results
by using the strengths of one method to enhance the other one in a single
study. In social science, mixed method can be used to refer
to the combination of both quantitative and qualitative data sources in a
single study. Creswell (2013) suggested a combination method study "is
one in which the researcher uses multiple methods of data collection and
analysis". These methods may be drawn from within methods approaches,
such as different types of quantitative or qualitative data collection
strategies, for example a survey and an experiment. Alternatively, it may be
between methods basing on quantitative and qualitative data collection
procedures, for instance a structured interview and a survey questionnaire
(Abro et al, 2015: p. 104-105)
Mixed methods research has now become established as a legitimate
methodological choice and is utilised by many academics and researchers
from across a variety of discipline areas. However, there would appear to be
no one single definition of mixed methods as pointed out by Thurston et
al. (2008, p. 3). “Mixed methods studies can either combine methods from
different paradigms or use multiple methods within the same paradigm, or
multiple strategies within methods”. The Journal of Mixed Methods
Research (2006), in its call for papers defines mixed methods as “research

Journal of Entrepreneurship, Business, and Economics, 2015, 3(2): 65–85
67
in which the investigator collects, analyses, mixes, and draws inferences
from both quantitative and qualitative data in a single study or a program of
inquiry”. Creswell and Plano Clark (2007, p. 5) define mixed methods as
follows:
Mixed methods research is a research design with philosophical
assumptions as well as methods of inquiry. As a methodology, it involves
philosophical assumptions that guide the direction of the collection and
analysis of data andthe mixture of qualitative and quantitative data in a
single study or series of studies. Its central premise is that the use of
quantitative and qualitative approaches in combination provides a better
understanding of research problems than either approach alone.
Creswell and Plano Clark (2007) mapped a brief history of mixed
methods research and its evolution to date and have posited four, often
overlapping, time periods in the evolution of mixed methods. These four
time periods are the: formative period (1950s-1980s); paradigm debate
period (1970s-late 1990s); procedural development period (late 1980s-2000)
and; the advocacy as a separate design period (2000+). Cameron and
Molina-Azorin (2014, p. 14-15).
Generally, there are some points of view that explain why both
quantitative and qualitative methods should be combined in a single study.
Prevalently, in current literature there are two main reasons
for the combination of qualitative and quantitative methods in a single study
that are gaining a more complete understanding of the phenomenon and
achieving complementary results by using the strengths of one method to
enhance other one. Furthermore, the significance of combination is that by
combining methods in the same study, the researchers can partially
Hastjarjo, K. 2015. Strategic Real Estate Development: Mixed Method Using Sequential Explanatory
Strategy-Research Methodology
68
overcome the deficiencies or biases that arise from one method. In other
words, each method has its own weakness or disadvantage, for instance, a
quantitative research method may be unable to capture the inner meaning of
the research problem, whilst a qualitative method may miss the importance
of the objective issues that have influences on the final results of the study.
Mix Method Design for Strategic Real Estate Development Research
Creswell suggested three models of combination of research designs in
social science (Creswell, 2013). In detail,the first model relates to the two-
phase design approach in which the researcher proposes to carry out a
separate qualitative phase of the study together with a separate quantitative
phase of study. The second model concerns the dominant-less dominant
design. In this design, the researcher presents a study within a single
dominant paradigm with one small component of overall study coming
from the alternative paradigm. In other words, theresearcher use two
methodologies in one single study, but one is dominant and the other is less
dominant. Thefinal model design is the mixed-method design. This design
requires a high degree of mixing paradigms. The researcher can mix
different perspectives from the qualitative and quantitative paradigms at all
methodological steps in the research. These paradigms can be mixed in
the introduction, literature review and research questionHarrison and Reilly
(2011: p. 7-8)
There are two main factors which can help determine the various
types of mixed methods design (Morse 1991; Morgan 1998; Tashakkori and
Teddlie 1998; Creswell 2003; Onwuegbuzie et al. 2009):
Journal of Entrepreneurship, Business, and Economics, 2015, 3(2): 65–85
69
– Priority/weight/emphasis of approaches. In a mixed methods study the
researcher can give the same priority, weight or status to the quantitative
and qualitative aspects (equal weight designs), or alternatively may give
greater weight to one of them (different weight designs).
– Implementation of data collection/time orientation. This refers to the
order in which the researcher collects quantitative and qualitative data.
The two options are collecting information at the same time (simultane-
ous, concurrent or parallel designs) or obtaining data at different points
(sequential or two-stage designs).
The way in which these two factors are combined will determine the
resulting design. The notation proposed by Morse (1991) is useful for
representing the different possible designs. In her system the abbreviations
“quan” and “qual” are used to represent the quantitative and qualitative
parts, respectively. When one method has greater weight than the other the
former is shown in capitals letters (QUAN, QUAL), while the latter is writ-
ten in lower case (quan, qual). Furthermore, the symbol “+” is used to indi-
cate a simultaneous design, whereas the arrow “→” refers to a sequential
design. Therefore, the various combinations of data collection strategy and
priority produce four blocks that give rise to nine mixed methods designs
(Johnson and Onwuegbuzie 2004):
– Equal weight, simultaneous: (1) QUAL + QUAN.
– Equal weight, sequential: (2) QUAL → QUAN; (3) QUAN → QUAL.
– Different weight, simultaneous: (4) QUAL + quan; (5) QUAN + qual.
– Different weight, sequential: (6) qual → QUAN; (7) QUAL → quan; (8)
quan → QUAL; (9) QUAN → qual.

Hastjarjo, K. 2015. Strategic Real Estate Development: Mixed Method Using Sequential Explanatory
Strategy-Research Methodology
70
As regards the purpose of conducting mixed designs by integrating
different types of data in the same study, several potential reasons have been
noted by various authors (Greene et al. 1989; Morgan 1998; Creswell 2003).
Two of the most widely stated reasons are triangulation and complementari-
ty. The main aim of triangulation (Jick 1979) is to achieve a convergence of
the results obtained via the quantitative and qualitative approaches, such that
these results are more reliable. What is sought, therefore, is a corroboration
or correspondence of results obtained through different methods. Regarding
complementarity, the main objective is to clarify or illustrate the results ob-
tained with one method by also applying the other. In this case the designs
used are usually sequential.
This study use sequential explanatory strategy. Sequential Explana-
tory Strategy in mixed methods research is characterized by the collection
and analysis of quantitative data in a first phase followed by the collection
and analysis of qualitative data in a second phase that build on the result of
initial quantitative results (Creswell, 2009). A QUAN → qual design, whe-
reby the qualitative part may help to evaluate and interpret the results ob-
tained from the main quantitative study. In this purpose of mixed methods
designs may be to enable expansion, the quantitative part of a study may
focus on relationship of variables of strategic real estate development, while
the qualitative analyze of quantitative results for theory development.
Sequential Explanatory Research Design combination models are
shown in Figure 1. This model is called sequential explanatory because after
proving the next sequence is deepening.

Journal of Entrepreneurship, Business, and Economics, 2015, 3(2): 65–85
71
Figure 1. Sequential Explanatory Research Design (Source: Author)
The model of combination research give more higher weight to the
use of quantitative research methods. Based on the figure 1, in the early
stages of research in data collection and analysis both using quantitative me-
thods, and followed by qualitative methods. Data collection and analysis for
the two methods is carried out separately, but made continued. This method
is used because I think the results of the first quantitative study needs to be
deepened with qualitative study. The combination of the two method data
connecting the results of the first phase and second phase of the study. Step-
by-step this research process by sequential explanatory models shown in
figure 2.
Figure 2. Research Process (Source: Author)

Hastjarjo, K. 2015. Strategic Real Estate Development: Mixed Method Using Sequential Explanatory
Strategy-Research Methodology
72
Based on figure 2 The combination of research conducted to answer
the problem statement of quantitative research and the problem formulation
of qualitative research that is result of the hypothesis test. So, qualitative
research complement and reinforce the conclusion.
Strategic Real Estate Development Variables & Indicators for PLS -
SEM
The popularity of structural equation modeling (SEM) has grown out
of the need to test complete theories and concepts. Much of SEM's success
can be attributed to the method's ability to evaluate the measurement of
latent variables, while also testing relationships between latent variables.
Although the initial application of this method embraced a covariance-based
approach (CB-SEM), researchers also have the option of choosing the
variance-based partial least squares technique (PLS-SEM).
PLS is an SEM technique based on an iterative approach that
maximizes the explained variance of endogenous constructs. Unlike CB-
SEM, which aims to confirm theories by determining how well a model can
estimate a covariance matrix for the sample data, PLS-SEM operates much
like a multiple regression analysis. This characteristic makes PLS-
SEM particularly valuable for exploratory research purposes:
PLS is primarily intended for research contexts that are simultaneously data-
rich and theory-skeletal. The model building is then an evolutionary
process, a dialog between the investigator and the computer. In the process,
the model extracts fresh knowledge from the data, thereby putting flesh on

Journal of Entrepreneurship, Business, and Economics, 2015, 3(2): 65–85
73
the theoretical bones. At each step PLS rests content with consistency of the
unknowns.
While CB-SEM is the more popular method, PLS-SEM has recently
received considerable attention in a variety of disciplines including
marketing, strategic management, management information systems,
operations management, and accounting. Much of the increased usage
of PLS-SEM can be credited to the method's ability to handle
problematic modeling issues that routinely occur in the social sciences such
as unusual data characteristics (e.g. nonnormal data) and highly complex
models.
PLS-SEM provides numerous advantages to researchers working
with structural equation models. Given the popularity of CB-SEM, the use
of PLS-SEM often requires additional discussion to explain the rationale
behind the decision ([9] Chin, 2010). As our meta-analysis of PLS-
SEM review studies has shown, the most prominent justifications for
using PLS-SEM are attributed to:
– nonnormal data;
– small sample sizes; and
– formatively measured constructs (Table I [Figure omitted. See Article
Image.]).
Nonnormal data. Data collected for social science research often fails to
follow a multivariate normal distribution. When attempting to evaluate a
path model using CB-SEM, nonnormal data can lead to underestimated
standard errors and inflated goodness-of-fit measures. Fortunately, PLS-
SEM is less stringent when working with nonnormal data because the PLS
Hastjarjo, K. 2015. Strategic Real Estate Development: Mixed Method Using Sequential Explanatory
Strategy-Research Methodology
74
algorithm transforms nonnormal data in accordance with the central limit
theorem. However, the caveat to PLS-SEM providing the end-all solution to
models using nonnormal data is twofold. First, researchers should be aware
that highly skewed data can reduce the statistical power of the analysis.
More precisely, the evaluation of the model parameters' significances relies
on standard errors from bootstrapping, which might be inflated when data
are highly skewed. Second, because CB-SEM has a variety of alternative
estimation procedures, it may be problematic to assume thatPLS-SEM is the
automatic choice when considering data distribution.
Small sample size. Sample size can affect several aspects of SEM including
parameter estimates, model fit, and statistical power. However, different
from CB-SEM, PLS-SEM can be utilized with much smaller sample sizes,
even when models are highly complex. In these situations, PLS-
SEM generally achieves higher levels of statistical power and demonstrates
much better convergence behavior than CB-SEM. A popular heuristic states
that the minimum sample size for a PLS model should be equal to the larger
of the following:
- ten times the largest number of formative indicators used to measure one
construct; or
- ten times the largest number of inner model paths directed at a particular
construct in the inner model
Formative indicators. The central difference between reflective and
formative constructs is that formative measures represent instances inwhich
the indicators cause the construct (i.e. the arrows point from the indicators

Journal of Entrepreneurship, Business, and Economics, 2015, 3(2): 65–85
75
to the construct), whereas reflective indicators are caused by the construct
(i.e. the arrows point from the construct to the indicators). While both, PLS-
SEM and CB-SEM can estimate models using formative indicators, PLS-
SEM has received considerable support as the recommended method.
Because analyzing formative indicators with CB-SEM often leads to
identification problems, it is not uncommon for researchers to believe that
PLS-SEM is the superior option. However, formative indicators should be
approached with caution when using PLS-SEM. Researchers should be
aware that the evaluation of formatively measured constructs relies on a
totally different set of criteria compared to their reflective counterparts.
Prior PLS-SEM review studies have criticized the careless handling of
formative indicators and researchers should apply the most recent set of
evaluation criteria when examining the validity of formatively measured
constructs.
When applying PLS-SEM, researchers need to follow a multi-stage
process which involves the specification of the inner and outer models, data
collection and examination, the actual model estimation, and the evaluation
of results.In the following, this review centers around the three most salient
steps:
– model specification;
– outer model evaluation; and
– inner model evaluation.
The model specification stage deals with the set-up of the inner and
outer models. The inner model, or structural model, displays the
relationships between the constructs being evaluated. The outer models, also
known as the measurement models, are used to evaluate the relationships

Hastjarjo, K. 2015. Strategic Real Estate Development: Mixed Method Using Sequential Explanatory
Strategy-Research Methodology
76
between the indicator variables and their corresponding construct. Once the
inner and outer models have been specified, the next step is running
the PLS-SEM algorithm, based on the results, evaluating the reliability and
validity of the construct measures in the outer models. By starting with the
assessment of the outer models, the researcher can trust that the constructs,
which form the basis for the assessment of the inner model relationships, are
accurately measured and represented. When evaluating the outer models, the
researcher must distinguish between reflectively and formatively measured
constructs. The two approaches to measurement are based on different
concepts and therefore require consideration of different evaluative
measures. Reflective indicators constitute a representative set of all possible
items within the conceptual domain of a construct. As a result, reflective
items are interchangeable, highly correlated and capable of being omitted
without changing the meaning of the construct. Reflective indicators are
linked to a construct through loadings, which are the bivariate correlations
between the indicator and the construct.
According to Chen and Khumpaisal (2009) and Rymarzak &
Sieminska (2012), the uncertainty associated with the risk of industrial
environment in all phases of real estate development, these risks can occur
at this stage of the feasibility study, design, tendering, construction, or
marketing or even during the handover period. On the demand
side, factors that influence the location’s attractiveness from a market pers-
pective for the product, information, or service include the number of con-
sumers, their purchasing power, and transportation between consumers
and the site.The supply-side factors are determined by the location’s condi-
tions that allow the specific business to be conducted, which directly or indi-
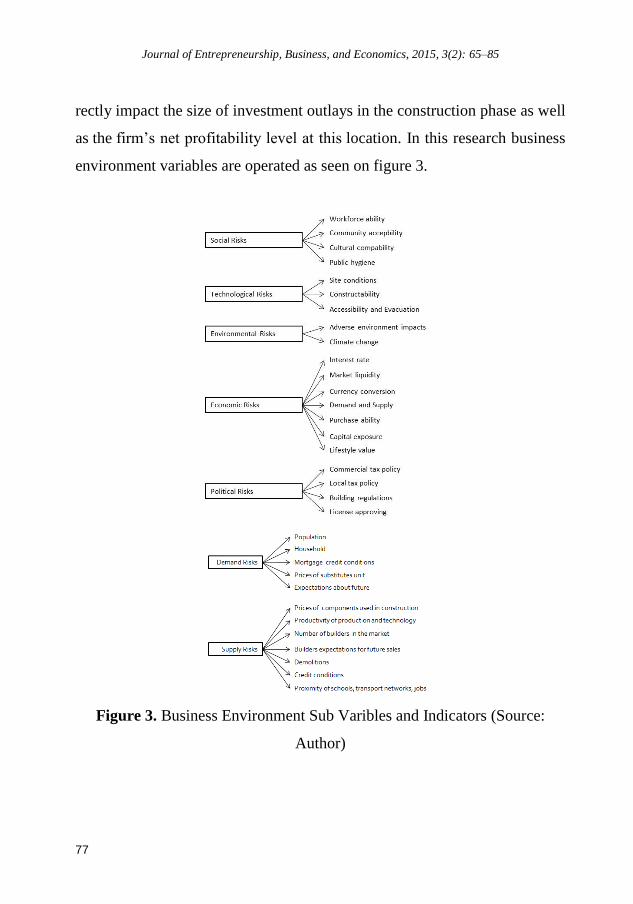
Journal of Entrepreneurship, Business, and Economics, 2015, 3(2): 65–85
77
rectly impact the size of investment outlays in the construction phase as well
as the firm’s net profitability level at this location. In this research business
environment variables are operated as seen on figure 3.
Figure 3. Business Environment Sub Varibles and Indicators (Source:
Author)

Hastjarjo, K. 2015. Strategic Real Estate Development: Mixed Method Using Sequential Explanatory
Strategy-Research Methodology
78
According to Wei, et al. (2007), Hewlett and Kaufmann (2008), and
Zhang et al (2010). Core Competence variables are operated as seen on
figure 4.
Figure 4. Core Competence Sub Variables and Indicators (Source: Author)
Adapted from Porter (2004), Jing-min et al (2010), and McDonagh et al
(2009) Competitive Strategy variables are operated as seen on figure 5.
Figure 22. Competitive Strategy Sub Variables and Indicators (Source:
Author)

Journal of Entrepreneurship, Business, and Economics, 2015, 3(2): 65–85
79
Accrording to Sigalas et al (2013) and Krumm and Vries (2003)
Competitive Advanatage variables are operated as seen on figure 23.
Figure 5. Competitive Advantage Sub Variables and Indicators (Source:
Author)
Based on BSC technique and Lindholm & Nenonen (2006) Organization
Performance variables are operated as seen on figure 6.
Figure 6. Organization Performance Sub Variables and Indicators (Source:
Author)
Hastjarjo, K. 2015. Strategic Real Estate Development: Mixed Method Using Sequential Explanatory
Strategy-Research Methodology
80
Grounded Theory Research of Strategic Real Estate Development for
Theory Development.
The are several major characteristics of grounded theory that might be
incorporated into a research study:
The researcher focuses on process or an action that has distinct steps or
phases that occur over time. Thus, a grounded theory study has
“movement” or some action that the researcher is attempting to explain.
A process might be “developing a general education program” or the
process of “supporting faculty to become good researchers”.
The researcher also seeks, in the end, to develop a theory of this process
or action. There are many definitions of a theory available in the
literature, but, in general, a theory is an explanation of something or an
understanding that the researcher develops. This explanation or
understanding is a drawing together, in grounded theory, of thoerrtical
categories that are arrayed to show how the theory works. For example,
a theory of support for faculty may show how faculty are supported over
time, by specific resources, by specific actions taken by individuals,
with individual outcomes that enhance the research performance of a
faculty member (Creswell & Brown, 1992).
Memoing ecomes part of developing the theory as the researcher writers
down ideas as data are collected and analyzed. In these memos, the ideas
attempt to formulate the process that is being seen by the researcher and
to sketch out the flow of this process.
The promary form of data collection is often interviewing in which the
researcher is constantly comparing data gleaned from participants with

Journal of Entrepreneurship, Business, and Economics, 2015, 3(2): 65–85
81
ideas about the emerging theory. The process consists of going back and
forth between the participants, gathering new interviews, and then
returning to the evolving theory to fill in the gaps and to elaborate on
how it works.
Data analysis can be structured and follow the pattern of developing
open categories, selecting one category to be the focus of the theory, and
then detailing additional categories (axial coding) to form a theoretical
model. The intersection of the categories becomes the theory (called
selective coding). This theory can be presented as a diagram, as
propositions (or hypotheses), or as a diccussion (Strauss & Corbin,
1998). Data analysis can also be less structured and based on developing
a theory by piecing together implicit meanings about a category
(Charmaz, 2006).
In this research results of hypotheses test will be analyze with
structured approach, the model of strategic real estate development presents
a coding paradigm or logic diagram (i.e., a visual model) in which the
researcher identifies a central phenomenon (i.e., a central category about the
phenomenon), explores causal conditions (i.e., categories of conditions that
influence the phenomenon), specifies strategies (i.e., the actions or
interactions that result from the central phenomenon), identifoes the context
and intervening conditions (i.e., the narrow and broad conditions that
influence the strategies), and delineates the consequences (i.e., the outcomes
of the strategies) for this phenomenon.
In selective coding, the researcher may write a “story line” that connects the
categories. Alternatively, propositions or hypotheses may be specified that
state predicted relationships. The result of this process of data collection and
Hastjarjo, K. 2015. Strategic Real Estate Development: Mixed Method Using Sequential Explanatory
Strategy-Research Methodology
82
analysis is a theory, a substantive-level theory, written by a researcher close
to a specific problem or population of people. The theory emerges with help
from the process of memoing, in which the researcher writes down ideas
about the evolving theory throughout the process of open, axial, and
selective coding. The substantive-level theory may be tested later for its
empirical verification with quantitative data to determine if it can be
generalized to a sample and population (see mixed methods design
procedures, Creswell & Plano Clark, 2011). Alternatively, the study may
end at this point with the generation of a theory as the goal of the research.
(Creswell, 2013: p. 85 & 89).
This study proposes the model of the relationship between business
environment, core competence, competitive strategy, competitive advantage
and organizational performance. Therefore:
CRE Competitive strytegy can be the strategic options on real estate
development for anticipate the new competitive landscape on real
estate industry to achieve organizational performance
Dynamic core competence can be build from external and internal
organization resources to gain sustainable competitive advantage
(SCA).
Core competence as capability from value chain analysis can be
strategic competitive resources.
Core competence as strategic competitiveness sources to gain SCA
Competitive strategy, of course, as the SCA resources.

Journal of Entrepreneurship, Business, and Economics, 2015, 3(2): 65–85
83
Figure 7. Teoritical Model of Strategic RED (Source: self elaborated)
Conclusion
The use of mixed methods across disciplines is growing,
especially in applied disciplines in the social and behavioural sciences
and in nursing, health and medicine. The aim of this study was to explore
the prevalence rates of mixed methods across specific business and
management fields and to gauge the level of acceptance mixed methods has
within these fields. In this research, mixed method will applied in real estate
development management. Mixed methods it is argued here will become
increasingly used by business and management researchers especially those
continually trying to innovate, add value and gain greater insights into
increasingly complex business and management phenomena and discipline
based inquiry.
Mixed methods research allows researchers to be "more flexible,
integrative, and holistic in their investigative techniques, as they strive to
address a range of complex research questions that arise". However, mixed
methods researchers have suggested that there is a need for distinguishing
between studies that utilize the two types of data without serious integration
and studies that "mix" the data sets effectively. The benefits of such
integration include, but are not limited to, the possibility of redirecting one

Hastjarjo, K. 2015. Strategic Real Estate Development: Mixed Method Using Sequential Explanatory
Strategy-Research Methodology
84
or both studies given earlier results, adding questions to a revised
questionnaire so that the quantitative data address the issue more
systematically, or seeing new issues from "other" responses to surveys that
can be supplemented qualitatively.
The inclusion of both deductive and inductive logic allows for a
more holistic view of a given real estate development problem rather than a
strictly positivistic or interpretivist slant to the data. From a practical
standpoint, many seemingly "empirical" articles already utilize qualitative
methods while conducting scale construction, pre-tests, manipulation
checks, and other research tasks where simply asking research subjects their
opinions is more diagnostic to researchers than running multiple tests.
References
1. Abro, M. M. Q., Khurshid, M. A., & Aamir, A. (2015). The use of mixed methods in management
research. Journal of Applied Finance and Banking, Vol. 5, No. 2, pp. 103-108. Retrieved
from http://search.proquest.com/docview/1664920363?accountid=32819
2. Cameron, R., & Molina-Azorin, J. (2014). The acceptance of mixed methods in business and
management. International Journal of Organizational Analysis, Vol. 22, No. 1, pp. 14-29.
doi: dx.doi.org/10.1108/IJOA-08-2010-0446
3. Creswell, Jhon W. (2013). Qualitative Inquary & Research Design Choosing Among Five Ap-
proaches Third Edition, Sage Publications, Inc.
4. Greene, J. C., Caracelli, V. J., & Graham, W. F. (1989). Toward a conceptual framework for
mixed-method evaluation designs. Educational evaluation and policy analysis, Vol. 11, No.
3, pp. 255-274.
5. Hair, J. F., Jr, Sarstedt, M., Hopkins, L., & Kuppelwieser, V. G. (2014). Partial least squares
structural equation modeling (PLS-SEM). European Business Review, Vol. 26, No. 2, pp.
106-121. doi: dx.doi.org/10.1108/EBR-10-2013-0128
6. Harrison, R. L., & Reilly, T. M. (2011). Mixed methods designs in marketing re-
search. Qualitative Market Research, Vol. 14, No. 1, pp. 7-26. doi:
dx.doi.org/10.1108/13522751111099300

Journal of Entrepreneurship, Business, and Economics, 2015, 3(2): 65–85
85
7. Hewlett, C. A., & Kaufmann, G. (2008). Strategy for real estate companies. Urban Land Insti-
tute.
8. Jick, T. D. (1979). Mixing qualitative and quantitative methods: Triangulation in action. Admin-
istrative science quarterly, pp. 602-611.
9. Johnson, R. B., & Onwuegbuzie, A. J. (2004). Mixed methods research: A research paradigm
whose time has come. Educational researcher, Vol. 33, No. 7, pp. 14-26.
10. Krumm, P. J., & de Vries, J. (2003). Value creation through the management of corporate real
estate. Journal of Property Investment & Finance, Vol. 21, No. 1, pp. 61-72.
11. Lindholm, A. L., & Nenonen, S. (2006). A conceptual framework of CREM performance mea-
surement tools. Journal of Corporate Real Estate, Vol. 8, No. 3, pp. 108-119.
12. Lopez-fernandez, O., & Molina-azorin, J. (2011). The use of mixed methods research in the field
of behavioural sciences. Quality and Quantity, Vol. 45, No. 6, pp. 1459-1472. doi:
dx.doi.org/10.1007/s11135-011-9543-9
13. McDonagh, D., Denton, H., & Chapman, J. (2009). Design and emotion. Journal of Engineering
Design, Vol. 20, No. 5, pp. 433-435.
14. Morgan, D. L. (1998). Practical strategies for combining qualitative and quantitative methods:
Applications to health research. Qualitative health research, Vol. 8, No. 3, pp. 362-376.
15. Morse, J. M. (1991). Principles of mixed methods and multimethod research design. Handbook
of mixed methods in social and behavioral research, pp. 189-208.
16. Onwuegbuzie, A. J., Johnson, R. B., & Collins, K. M. (2009). Call for mixed analysis: A philo-
sophical framework for combining qualitative and quantitative approaches. International
journal of multiple research approaches, Vol. 3, No.2, pp. 114-139.
17. Porter, M. E. (2004). Building the microeconomic foundations of prosperity: Findings from the
business competitiveness index. World Competitiveness Report, 2005.
18. Sigalas, C., Pekka Economou, V., & B. Georgopoulos, N. (2013). Developing a measure of com-
petitive advantage. Journal of Strategy and Management, Vol. 6, No. 4, pp. 320-342.
19. Tashakkori, A., & Teddlie, C. (1998). Mixed methodology: Combining qualitative and quantita-
tive approaches (Vol. 46). Sage.
20. Thurston, W. E., Cove, L., & Meadows, L. M. (2008). Methodological congruence in complex
and collaborative mixed method studies. International Journal of Multiple Research Ap-
proaches, Vol. 2, No. 1, pp. 2-14.
21. Zhang, H., Shu, C., Jiang, X., & Malter, A. J. (2010). Managing knowledge for innovation: the
role of cooperation, competition, and alliance nationality. Journal of International Market-
ing, Vol. 18, No.4, pp. 74-94.