strategic reusability planning and management in product
TRANSCRIPT

Strategic Reusability Planning and Managementin Product Development
byAhmed Yahia
Ing6nieur, Ecole Centrale Paris (1996)
Submitted to the Department of Mechanical Engineeringin partial fulfillment of the requirements for the degree of
Master of Science in Mechanical Engineering
at the
MASSACHUSETTS INSTITUTE OF TECHNOLOGY
February 1997
Massachusetts Institute of Technology 1997. All rights reserved.
Author ......................... ....
Certified by..................
.... ... ... . ....... ................
Department of Mechanical EngineeringNovember 15, 1996
......................................
e- Don P. ClausingSenior Lecturer
-.--..- Thesis Supervisor
Accepted by................................................................................................. .............Ain A. Sonin
Chairman, Department Committee on Graduate Students
OFR 'E•I-r~ .,1, •-
APR 161997
L110P~ARNES


Strategic Reusability Planning and ManagementCompetitive Product Development
byAhmed Yahia
Submitted to the Department of Mechanical Engineeringon November 15, 1996, in partial fulfillment of the requirements
for the degree ofMaster of Science in Mechanical Engineering
Abstract
Reusability consists of the ability to reuse existing, analogous or competitive designconcepts, parts, systems, facilities and tooling. Reusability is a strategic enabler insupporting breakthrough efforts for achieving affordable customer-perceived productvariety, and product freshness along with design and manufacturing cost reduction,development time reduction, and quality improvement. The present study describes a setof strategic management and planning tools to support long term technology, product andprocess development; to enhance business and engineering efficiency through reusability;and to build market-driven as well as cost-driven products. The tools, integrated into thestrategic reusability planning and management process, will help product developmentteams to focus their development resources on the features that are the most valuable tothe customer, and achieve the best balance between reuse and innovation.
Thesis Supervisor: Don P. ClausingTitle: Senior Lecturer


AcknowledgmentsThis thesis was supported by many sources. Intellectually, the greatest source of
support was my advisor, Don P. Clausing. His never-ending supply of good ideas was agreat inspiration. I would like also to thank him for his support, guidance, understandingand despite all patience.
I would like to express my appreciation to Ford Motor Company for theircommitment and support in providing me with the opportunity to ground this process inoperational realities. I would like to use this venue to express my deepest gratitude to theAdvanced Vehicle Technology and Process Leadership people that made this workpossible - including Ed Adams, Hank Chapman, Terry Cupp and Roscoe Nasch.
I would like to thank Professor Sawyer-Lauganno for editing this thesis, DianeAlderete and Kamla for their technical support, as well as my teammates - includingMohammad Ali, Joel Cain and Mike Charles - for their insights.
No words can express my appreciation to my parents, my wife and my littledaughter for their support, encouragement, love, and help in keeping the whole work inperspective.


Contents
List of Figures _______--------------------------------------- 11
Chapter I - Introduction 131-Background - - - _______________________14
2- Thesis outline 14
Chapter II - Reusability: definition, drivers _ 171-Definition 172- Variants 17
3- Reusability drivers 184- Reusability associated risks ______________20
Chapter III - The Business Integration Model 231- Definition and scope -------- 23
1.1- The intent 231.2-The benefits 231.3-The reusability side 25
2- The BIM, a powerful planning tool 272.1- Core competency strategy 272.2- Technology strategy 272.3- Product/manufacturing strategy 31
3- Application to a lighting system, matching basic strengths, technology, and productstrategies _______ __ ______ _ ______-__ _____34
Chapter IV - Assessing Customer-driven design, facilities andtooling changes _----------------------------------- 391- Tree analysis - High level assessment of the design and manufacturing changemagnitude required by each product expectation 402- Facilities and tooling reusability ________..._______-____- ___ 433- The product and plant reusability matrices 44
3.1- Definition and architecture 443.2- Applications 48
3.2.1- Better assess reusability degrees 483.2.2- The reusability matrices as a feedback tool 49

Chapter V - Product Planning Matrix1- Definition and scope 52
1.1- Intent 521.2- Benefits 52
2- Product Planning Matrix - Planning a successful, and affordable product_ ____ 532.1- Building a market-driven product 53
2.1.1- Product expectations' prioritization 532.1.2- Correlation Matrix 54
2.2- Building a cost-driven product 552.2.1- Assumptions 552.2.2- Costing approach - Expenditure deployment through the levels 562.2.3- Tie to the product planning matrix 58
2.3- Defining product-expectation-driven design and manufacturing changes 592.3.1- Evaluating the change magnitude required by product expectations at each product level 592.3.2- Computing the resulting reuse degree 62
2.4- Defining the targets achievement degree 662.4.1- Product expectations achievement degree 662.4.2- Overall achievement of program in terms of product expectations 672.4.3- Design, facilities and tooling change achievement degree 672.4.4- Overall achievement of program in terms of design, facilities and tooling changes 68
2.5- Budget allocation for PEs' optimal achievement magnitude 682.5.1- Assumptions 682.5.2- Recommended budget allocation by product expectations 682.5.3- Team decision based budget allocation 692.5.4- PE budget allocation: translation into system design, facilities and tooling budget allocation 69
3- Achieving the best balance between reuse and innovation - Enhancing reusabilitydegrees to achieve affordability_ _____________ __________72
3.1 Defining the reusability degrees which maximize the overall achievement magnitude of the programfor a given budget 723.2- Defining the cost of a targeted overall achievement magnitude 77
4- Balancing investment costs with production costs, and sales volumes 78
Chapter VI - Economic Analysis ----------------------- 811- Costs and revenues inter-dependencies _ __ -___ __ ________82
2- Activity-based costing vs. traditional job costing _______ ___832.1- When traditional job costing fails 832.2- Activity-based costing 843.1- Target costing process 873.2- Cost incurrence and locked-in costs 883.3- Product profitability evaluation - Example 89
4- Financial model for program's Net Present Value assessment - Making of long-termplanning decisions for investment 92
4.1- Net Present Value method 924.2- Manufacturing example 93
5- Sensitivity analysis for making better trade-offs 97
6- Dealing with uncertainty_ 99
Chapter VII - Strategic Reusability Planning and ManagementProcess 1031- From strategic vision to platform concepts pre-definition ___ _________104
1.1- Defining the corporate strategic vision 1041.2- Analyzing the external environment 105
51

1.3- Platform strategy - Defining the most promising platform concepts 1061.3.1- Platform: Definition 1061.3.2- Platform strategy - Platform concepts pre-definition 107
2- Platform planning __1102.1- Defining the strategic voice of the customer 1102.2- Platform planning in the context of the corporate environment 113
3- Advanced product planning - How new is each product? ________ __1164- Platform concept selection ____ 119
Chapter VIII - Conclusion _________________________ 1231- Summary of results __ _____123
2- Further research__ 124
Bibliography --------------------------------------- 125


List of Figures
2.1 Alternative reusability scenarios
3.1 The Business Integration Model: overview3.2 Technology forecast map3.3 Technology ranking matrix3.4 System reusability plan3.5 Overall linking of product strategy with technology strategy, and core
competencies3.6 Detailed system reusability migration plan
4.1 Lathe functional tree4.2 Lathe hardware tree4.3 Vehicle architecture4.4 Product reusability matrix [Clausing 91]4.5 Plant reusability matrix4.6 Vehicle reusability matrix4.7 Product and production system reusability
5.1 Product expectations' prioritization5.2 Correlation matrix5.3 Cost deployment through the levels5.4 Accumulated investment cost at each product level5.5 Cost of all new design, facilities and tooling deployment through product levels5.6 Alternative scales for evaluating the PEs' impact on design, facilities and tooling5.7 Relationship matrix5.8 Computing design, facilities and tooling reusability degrees by system, and by
product expectation, given the relationship matrix - Example5.9 Product planning matrix - Budget for achieving 100% customer satisfaction
deployment through product levels5.10 Adjusted product planning matrix, alternative # 15.11 Adjusted product planning matrix, alternative # 2

6.1 The hierarchy of factory operating expenses6.2 Standard pattern of cost incurrence and locked-in costs6.3 Product profitability of X'. Target achievement degree6.4 Typical experience cost curve6.5 Cash flow table example6.6 Development cost sensitivities6.7 Decision-tree
7.1 Porter's Five Forces Model7.2 Example of product platform plan7.3 Strategic reusability planning and management: steps 1 to 47.4 Market segment map example7.5 Example of core product specific house of quality7.6 Defining the programs' sequence and the bottleneck utilization level7.7 Process steps: 5 to 107.8 Process steps: 11 to 157.9 Process steps 16 to 187.10 Strategic reusability planning and management process road map

Chapter I - Introduction
The objective of this research is to create the strategic reusability planning and
management process for implementing systematic and optimal reuse when developing
families of products, as well as single products. This integrates Quality Function
Deployment (QFD), the business integration model, the reusability matrix, and the
product planning matrix to create a process that will achieve affordable customer-
perceived product variety and new product revenue, while reducing engineering, facilities
and tooling costs. This process proposes a methodology leading to the effective
utilization of existing assets to achieve the best balance between reuse and innovation.
Simple reuse - piece parts used in more than one product - has long been
recognized and partially implemented in the product development arena. This research
builds on that simple concept to reuse other assets - including equipment and tooling - in
the development of new product programs. This will reduce development and production
costs, the development time, while balancing this with the strategic voice of the customer,to achieve customer satisfaction.
An example of product reuse beyond the piece-part level is the reuse of the robustdesign of a critical subsystem. Even if many of the piece parts are changed, effectiveplanning can reuse the robust critical parameters of the packaging so that the robustnesswork does not have to be repeated. An example of facilities and tooling reuse is the reuseof existing manufacturing equipment and tooling in the development of a futuregenerational product, by defining hardpoints or constraints for the design engineers sothat they design for manufacturability.

The planning process created concentrates new development effort on those areas
that have the greatest impact on customer satisfaction, driving design, facilities and
tooling changes by customer wants. Any system design that is not directly affected by the
new customer wants is systematically targeted for reuse.
1-Background
Reusability analysis was proposed as a means to achieve flexible product
development and affordable customer-perceived variety [Clausing 1991] through the
application of a reusability matrix. That concept was expanded within the framework of
total quality development [Clausing 1994]. Research on the tactical planning and
management of reusability to implement reuse within a product development program has
been completed [Witter et al, 1994]. It integrates the reusability matrix with the House of
Quality (QFD) to integrate reusability with customer satisfaction - for one product.
Clausing and Cohen [1994] reported a strategic House of Quality that covers many
products within one industry. Collaboration between MIT and Ford in 1994 led to the
further development of the business integration model (BIM), which had originally been
introduced in [Witter et al, 1994]. Related work in this area deals with the relationship of
product architecture and the performance of the firm [Ulrich 1992; Henderson and Clark
1990], product variety [Suzue and Kohdate 1990; Sanderson and Uzumeri 1992; Whitney
1993], and platform planning [McGrath 1995].
By integrating the strategic House of Quality (for many products), the BIM,
platform planning and Witter's process, the basic approach for the strategic planning and
management of reusability was created. This embryonic process was then further
developed in a joint effort between Ford and MIT.
2- Thesis outline
The thesis is organized into 8 chapters. Before defining the strategic reusability
planning and management process, we had to improve and further enhance the existing
reusability planning and management tools; and complete the existing set of tools
introducing new concepts which better support the planning and quantification of
reusability. The thesis is organized in accordance with this approach. After the
introductory chapter, the second chapter defines reusability, and the drivers of the
reusability decision-making process. The third chapter introduces the Business
Integration Model as a planning tool to support product, process, and technologyplanning; and enhance business and engineering efficiency through reusability. Chapter 4

is an overview and introduction to one possible approach to assess the design, facilities
and tooling changes required by new product expectations on the existing products.Chapter 5 outlines a process for achieving a degree of product change that is clearlyvisible, suitable to the customer, and avoids unnecessary investment. Then Chapter 6describes one possible approach to assessing the economic value of a product program.Finally Chapter 7 describes the proposed strategic reusability planning and managementprocess for reducing investment costs and development time, for improving quality, butalso for effectively using the company's resources.


Chapter II - Reusability: definition, drivers
1-Definition
The concept of reuse consists of the ability to reuse existing, analogous, orcompetitive design/process concepts, parts, systems, tooling, and facilities leveraged andsupported by innovation in the development of freshening actions, new products, productlines, or platforms.
Reusability is the forward thinking process of structuring product families suchthat more reuse can be planned for. Reusability is a strategic enabler in supportingbreakthrough efforts for effective utilization of existing assets, design and manufacturingcost reduction, development time reduction, quality improvement, and customer-perceived variety achievement.
2- Variants
We will make a clear distinction in this thesis between two different types ofreusability: commonality, and carryover.
Commonality focuses on product components, systems, features, productexpectations, facilities and tools that are shared with other products, but not the priormodel product. Commonality can be compared across models, derivatives (sameplatform, but different body shell and overhangs for a vehicle for instance), andplatforms. Sharing parts, systems will generally reduce the number of new tools andfacilities required. Through standardization, commonality can eliminate time and energywastes in solving the same problem twice. The point of commonality is to set up astandard for all members of a given product range, which makes both material and

processing costs lower. Required capacity protection becomes also lower as volumes are
aggregated.
Carryover systems or components focuses on elements reused from prior models.
This will enable the reuse of facilities and tooling, which will sensitively reduce the
investment costs. As mentioned before, items that have little or no affect on customer
perceived value, should be targeted for carryover assumptions.
Product development teams should focus on reusing facilities and tools from prior
models. For components' tools, this could include reusing dies, molds and check fixtures.
For component facilities, this could include reuse of presses, injection molding
equipment, ovens, machine tools and floor space. For assemblies, reusability could
include equipment such as conveyors, workstations, transfer equipment, floor space, and
bonding equipment such as welding equipment.
Reusability of facilities and tooling minimizes investment by making use of tools
and facilities that are already in place. When capacity is not available, savings in tool
design and processing time can still be achieved through reuse of same type of equipment
although new.
3- Reusability drivers
One can face some dilemmas when the time comes to decide upon which part, system, or
facility to reuse when several options are available. The decision-making process should
be based on the evaluation of a certain number of parameters. There follows a list of
possible drivers for the reusability decision-making process. This list is far from being
exhaustive, and should be carefully reviewed and adapted to the context in which
reusability is done. Some of drivers of the decision-making process of parts and systems
reusability would be:
- Fixed and variable costs (traditional accounting misleading)
- Performance and Capability
. Behavior, and interface with other parts
.Manufacturability
. Modularity (How flexible is the design?)
- Customer acceptance and satisfaction
- Underlying technology competitiveness

- Capacity availability
- Cost of incremental capacity
- Reuse Effectiveness for the asset X considered :
)= [ n(C N- CR ))/ CD * [TI At]
Where:
n = number times asset X was reused
Ci = Cost of developing or buying asset i instead of reusing X
Ci = Cost of utilizing asset X, instead of designing a new asset (finding,
adapting, etc.)
CD = Initial development cost of asset X
T = Average life cycle of the technology
At = Time elapsed since first used
For facilities and tooling the drivers of the reusability decision-making process would be:
- Fixed costs and Variable costs, as for parts and systems reusability
- Manufacturing Flexibilityl
" Volume/Mix flexibility 2
" Product/Changeover flexibility3
- Process capability (Is the process delivering what it is expected to deliver? How
consistent relative to design tolerances?)
. Mean Time To Failure, Mean Time To Repair, Throughput
- Reuse effectiveness index.
1 Manufacturing flexibility consists of the ability of manufacturing and product design to respond in theshortest amount of time to market changes with products that profitably meet customer wants.2 Volume/Mix flexibility consists of the ability to change the mix of products within existing capacitylimitations (shared versus dedicated plant).3 Product/Changeover flexibility consists of the ability to convert to a new product with minimuminvestment cost, and changeover losses.

4- Reusability associated risks
An organization's strategy for adopting a reusability process should be based on a
vision for improving the organization's way of doing business (at Ford, this would be:
Low Cost Producer, Investment Efficient, etc.). To improve the results a company
achieves through reuse requires that the company take a comprehensive view of its
product development process (i.e., view process as an integrated part of a system of
operations for delivering products) and address the technical and non technical issues
within this context. Toshiba's success with reusability is attributed to systematizing reuse
to their integrated set of tools, techniques, management procedures, controls, incentives,
and training programs.
Particular attention should be paid to avoid reusability with added complexity
(such as a slightly modified steering wheel rim section, or a one mm increase in a ball
joint diameter). Moreover, reusing a component that fulfills for more than the defined
functional requirements should be avoided, or at least carefully dealt with. Overdesign is
a major reason for cost increases. Reusability should be systematic only if quality
standards, customer needs, technology issues, and competitive costs are warranted.
Figure 2.1 presents two possible cases: one resulting in a low reuse capability, the
other in a high reuse capability. The low reuse capability case is characteristic of an ad
hoc approach to reuse where the potential opportunities1 are not identified (represented
by dashes). Since the potential opportunities are not known, the target opportunities will
likely fall outside the potential opportunities. The target opportunities may also not be
explicitly defined (or planned), but represent the total opportunities pursued by
individuals. When the target opportunities fall outside the potential opportunities, the
actual reuse is constrained to the intersection. The result is a low reuse efficiency since
effort is expended on opportunities which do not result in actual reuse.
The second case is characteristic of systematic reuse where the organization
identifies its potential opportunities, ensures the target set of opportunities falls within the
potential, and has a process which ensure the target is met. The target may not contain the
entire set of potential opportunities because the potential benefit from those opportunities
outside the target may not be worth the additional reuse investment; i.e., the target is
focused on the opportunities with the highest payoff.
1 A reuse opportunity is an occasion where an asset (existing or to be developed) may satisfy a need(current or anticipated); an asset being any tangible resource that may apply to the solution of a problem.

Low Reuse Capability
TargetOpportunities.........
Actual Reuse
PotentialOpportunities
High Reuse Capability
PotentialOpportunities
TargetOpportunities
Actual Reuse
Figure 2.1 - Alternative reusability scenarios
Some notions must be clearly defined before any metric can be put forward.
As stated previously, a reuse opportunity is an occasion where an asset (existingor to be developed) may satisfy a need (current or anticipated), an asset being anytangible resource that may apply to the solution of a problem (design, equipment, etc.).Potential reuse opportunities are the set of reuse opportunities that will result in actualresult when exploited. The optimal set of reuse opportunities to be exploited can bedefined on the basis of an evaluation of the impact of customer-needs, in terms of changerequired at each level of product, from both engineering and manufacturing perspectives1 .The reusability drivers mentioned previously should also be taken into account whenmaking a reuse decision.
Targeted reuse opportunities are the set of reuse opportunities toward which anorganization directs its efforts. At Ford Motor Company macro targeted reuseopportunities are defined by the Investment Efficiency Council. As shown in the previous
1 The approach related to the definition of the optimal reuse levels is developed in Chapter 5.

paragraph, a targeted reuse opportunity may not always be a potential reuse opportunity
(e.g., when an asset is developed for reuse for which there is no real need).
We will try in the next chapters to present a set of tools which will help product
development people to succeed in doing reusability, before describing a strategic
reusability planning and management process which will help any organization in better
exploiting potential reuse opportunities when developing products.

Chapter III - The Business Integration Modell
1- Definition and scope
1.1- The intent
The intent of the BIM is to support product, process, and technology planning,
and enhance business, and engineering efficiency through carryover, commonality, and
reusability.
The BIM displays linkages between products desired and the technology and
engineering knowledge required to develop them, as well as the manufacturing
technology necessary to produce them. The BIM is a simple mapping of technical
strengths, technologies, product, and manufacturing strategy relationships. Therefore, it
can be used as a planning tool for resource acquisition and allocation needed to support
efficient product development and manufacturing systems design.
1.2-The benefits
The benefits of the BIM are multi-fold 2 :
from a value management perspective
- permits assessment of product value relative to resources required
- defines choices available to maximize reusability
1 The original business integration model was developed by Ron Andrade, and Don Clausing in 1994, in ajoined effort with Ford Motor Company. The objective was to integrate the product, technology, and corecompetency strategies with support of planned reusability.2 Ford/Xerox, Reusability Methodology Exchange Meeting, November 8, 1994.

from a complexity reduction perspective
- identifies opportunities to avoid complexity increases through reusability
from a decision making perspective
- helps for resource allocation
- defines products, and processes timing
The BIM overcomes major cash drains that plague traditional productdevelopmentl:
- Matching product and technology strategies overcomes Cash Drain 1:"Technology Push, but Where's the Pull?"
- Customer driven technology development overcomes Cash Drain 2: "Disregardfor the Voice of the Customer"
- Product-process compatibility eliminates Cash Drain 4: "Pretend Design"(newand different but not better, not production-intent designs) , and Cash Drain 7:"Here's the Product. Where's the Factory".
Some Ford managers who applied part of the BIM to some of their systemsnoticed:
"What we do not know became more obvious:
- We need additional customer data on all our products
- We do not really know how much reuse we are missing out on
- We are developing basic strengths and technologies without well defined timerelationships to products, and processes
- We cannot quantify the adequacy of our basic strengths
- We do not have an effective plan for allocating our basic strengths
- We have intuitive plans, not strategically clear and transferable plans(documented)
- We have a different view of our products than the view of our suppliers
- Some of our subsystems are constantly redesigned without customer benefit".
1 Don Clausing. 1994. Total Quality Development. New York: ASME Press.

1.3-The reusability side
The BIM is a strategic tool for planning reusability of not only parts and systems,
but also facilities and tooling.
Systems, and parts reusability reduces the number of end items and increases the
usage of common parts in products and across product lines. Systems, and part reusability
entails carryover within product line, carry across from product lines, and modified carry-
over/across. This enables the company to concentrate its development resources on the
features that are the most valuable to the customer, while reducing its engineering and
design costs.
Reusing facilities and tooling, and aligning the product and manufacturing
strategies with one another, the cycle planning team can further reduce costs associated
with new or in-cycle program changes by creating manufacturing flexibility.
Manufacturing flexibility1 is the ability of manufacturing and product design to respond
in the shortest amount of time to market changes with products that profitably meet
customer needs. It accommodates changes with the least amount of investment. It
integrates product architecture and manufacturing process strategies such that they are
common across product lines and consistent from present to next generation of products.
Figure 3.1 displays the Business Integration Model for a product platform - it
could also be a product-line. The Product Planning Team should systematically build itstechnologies upon what it perceives as being the existing, or future core competencies of
the company. It should then reuse this technology, as well as existing designs, as much aspossible in building new products. By the same token, it should think about: 1) themanufacturability aspect of the product, 2) what basic strengths the company has in termsof production, and 3) how they can be leveraged to support the manufacturing strategy.
The examples displayed at the bottom show how reusability should be approached.Product 4 is a derivative of product 3, and has two carry over subsystems from product 3,the other subsystems are either reused, but modified subsystems, or new designs. Externalreusability (as displayed in figure 3.1 for product 4) refers to the reuse of subsystemsfrom analogous products (a tractor for instance), or competitive products (a GM part).Sometimes when external reusability do not lead to carry over, it can still be a
1 As defined by the Ford Design Institute, Reusability working paper, January, 1995

Ti T2
new External
new Reusability Reusability,Rs Reusabilityl
"[F&T2 Reusability F&T 2'
FT2 F&T 2'
F&T 1
Time
new Reusability new newTime
I
nT1
new
ExternalReusability
Reusability V V V
Product I Reusability Reusability
n ' Reusability i Reusability
new new- -- --
T2 T3
e Reusabilitynew
C2 C3
F&T= Facilities and ToolingT
= Technology
C= Core Competency
Product 4SS1SS2'SS34
F&T 2Plants
Plant LayoutProcess Layout 2
Equipment 2Tooling 2
Reusability Plan
ReuseReuseReuse
ModifyNew
Figure 3.1 - The Business Integration Model: overview
CoreCompetency
Strategy
ManufacturingTechnology
Strategy
ManufacturingStrategy
ProductStrategy
MarketSeaments
EAD
-C
A
ProductTechnology
Strategy
CoreCompetency
Strategy
Product 3SSISS2SS3SS4SS5
Reusability Plan
Reuse
ModifyNew
Reuse
F&T 2'Plants
Plant LayoutProcess Layout 2
Equipment 2Tooling 2'
I

good benchmark for building a better design. Xerox Corporation1 used designcompetitive benchmarking in developing a new copier. After evaluating four competitiveproducts, they found that the Canon design for one of the subsystems was functionallysuperior and its cost was 25% of the existing Xerox design cost. The Xerox engineerswere challenged to beat the competitive benchmark design or use it. The result was 85%
cost reduction.
A similar example is displayed for Facilities and Tooling (manufacturing systems)and the possibility to reuse different levels of a plant (from the floor space, transportationdevices, to the tools). The Product Planning Team should systematically consider reusingexisting production plants, or at least sub-elements of the plant.
2- The BIM, a powerful planning tool
2.1- Core competency strategy
Among the tasks that should be performed when building the BIM, is anassessment of the core competencies. A core competency, or a basic strength, can be anyfundamental, or engineering science the company, or one of its departments2 mastersbetter than anybody else (Programming, Mechanical Engineering, Precision Mechanisms,Electronic Packaging, Mechatronics, etc.). As mentioned by Clausing [1994], these arenot technologies in the sense of being subsystems that could be sold as independentproducts or incorporated into larger total systems. Rather, these are the basic strengthsthat support the technologies. It can also be a unique way of doing business (MarketingSkills). Manufacturing core competencies can be tooling and fixture design skills,machine design skills, process design skills, excellence in new process development, oreven a flexible work force. A complete set of basic strengths, according to Meyer andUtterbach 3 , includes customer needs understanding, and distribution channels.Eventually, the Product Planning Team (PPT) should define the core competencies whichwill be needed for the next technology generations.
2.2- Technology strategy
The PPT should also define the technology portfolio in concert with the AdvancedEngineering Division (AED). It should rank technologies according to their development
1 Don Clausing. 1994. Total Quality Development. New York: ASME Press.2 Advanced Lighting Technology, or Powertrain for instance.3 Meyer, Marc H., and James M. Utterbach. 1993. "The Product Family and the Dynamics of the CoreCapability". Loan Management Review 34: 29-47.

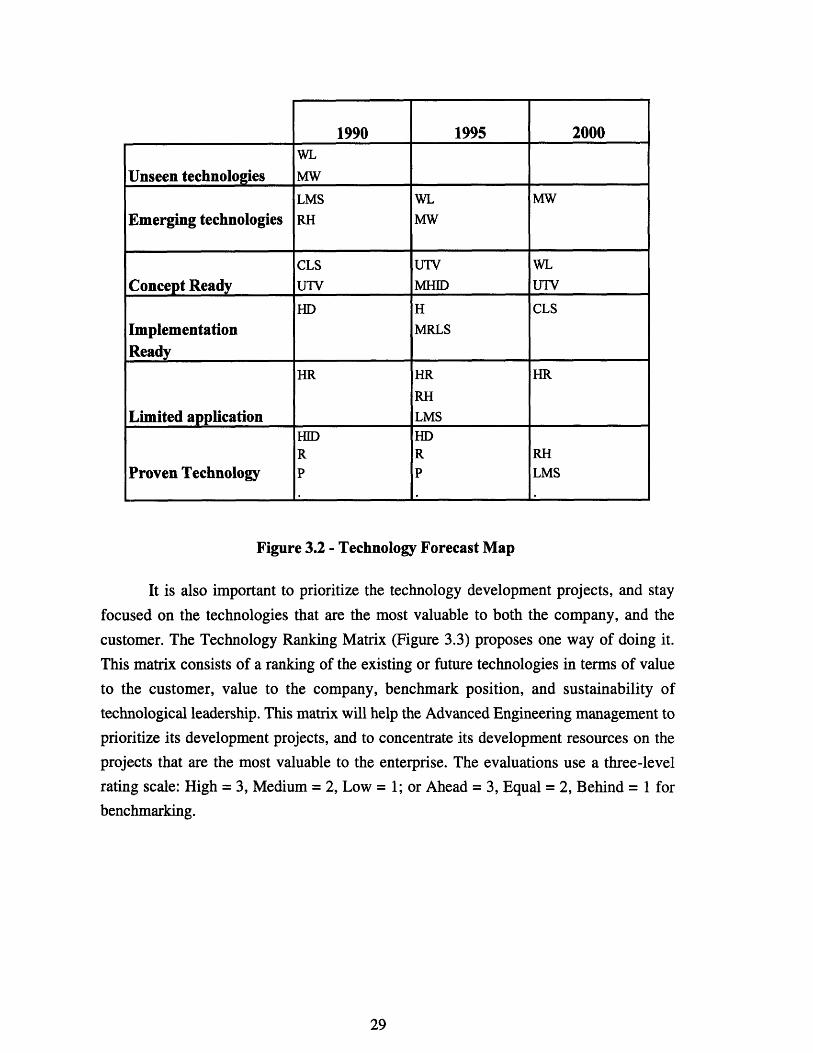
stage using the 5/10 years Technology Forecast Map, as shown in Figure 3.21 . This map
will help the AED to assess the actual state of its Technology Portfolio, and the evolution,
and proliferation of technologies over time. Technologies are ranked from unseen to
proven, and the migration of each technology is mapped over time. In the example shown
below, the WL Technology is unseen in 1996, but becomes an emerging technology in
2001, and reaches the concept ready phase in 2006. This map reflects the list of Concept
Ready and Implementation Ready technologies over time. Examples of manufacturing
technologies are: 3D Printing, Single Minute Exchange Die (SMED), Poka-yoke, Lean
Manufacturing Cell. The 3 D Printing technology can be built on the Mechanical
Engineering and New Process Development core competencies; The SMED technology
could be built on the Tooling and Fixture Design, and Machine Design core
competencies.
Following are the definitions of the different technology categories:
Unseen technologies: Technologies that may be just an idea or a vision. No real work has
been done.
Emerging technologies: Technologies or ideas that have been written about.
Concept Ready: Working hardware exists. Technology has been shown to work.
Implementation Ready: No new invention required. Technology can be programmed.
Limited application: Technologies that are in production on a limited number of vehicles
or car lines.
Proven technologies: Technologies that are in widespread production, at the mature stage
of their life cycle.
1 This was done by the Advanced Lighting Group at Ford Motor Company, 1996. To protect the company,the map was truncated.
Unseen technologies
Emerging technologies
Concept Ready
ImplementationReady
Limited application
Proven Technology
WL
MW
LMSRH
CLS
UTV
HD
HR
HIDRP
WL
MW
UTV
MHID
H
MRLS
HR
RH
LMSHDRP
MW
WLUTV
CLS
HR
RHLMS
Figure 3.2 - Technology Forecast Map
It is also important to prioritize the technology development projects, and stay
focused on the technologies that are the most valuable to both the company, and the
customer. The Technology Ranking Matrix (Figure 3.3) proposes one way of doing it.
This matrix consists of a ranking of the existing or future technologies in terms of value
to the customer, value to the company, benchmark position, and sustainability of
technological leadership. This matrix will help the Advanced Engineering management toprioritize its development projects, and to concentrate its development resources on theprojects that are the most valuable to the enterprise. The evaluations use a three-levelrating scale: High = 3, Medium = 2, Low = 1; or Ahead = 3, Equal = 2, Behind = 1 for
benchmarking.
1990 1995 2000

1.Value to customer
2.Value to Ford
3.Current position
vs. competition
4.Potential position
vs. competition
5.Sustainability of
technological leadership
6.Manufacturing
Technology Reusability
Med Med High Med High Med High High
Med Low Med Med High High High High
Equal Behind Behind Equal Equal Ahead Equal Behind
Equal Equal Equal Equal Ahead Ahead Equal Ahead
Low Low Low Low Low Low Low High
Low Low Med Med High Low Low High
10 8 11 11 15 13 12 16
7 8 5 5 2 3 4 1
Figure 3.3 - Technology Ranking Matrix
ScorePosition
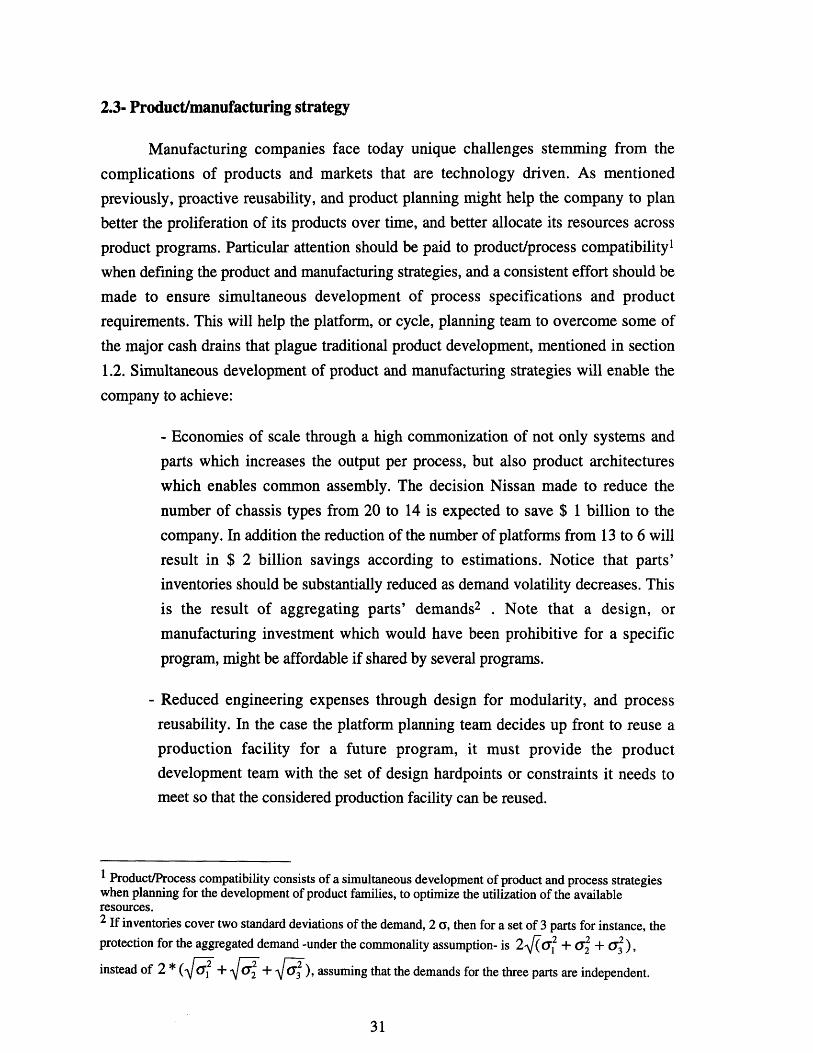
2.3- Product/manufacturing strategy
Manufacturing companies face today unique challenges stemming from the
complications of products and markets that are technology driven. As mentioned
previously, proactive reusability, and product planning might help the company to plan
better the proliferation of its products over time, and better allocate its resources across
product programs. Particular attention should be paid to product/process compatibilityl
when defining the product and manufacturing strategies, and a consistent effort should be
made to ensure simultaneous development of process specifications and product
requirements. This will help the platform, or cycle, planning team to overcome some of
the major cash drains that plague traditional product development, mentioned in section
1.2. Simultaneous development of product and manufacturing strategies will enable the
company to achieve:
- Economies of scale through a high commonization of not only systems and
parts which increases the output per process, but also product architectures
which enables common assembly. The decision Nissan made to reduce the
number of chassis types from 20 to 14 is expected to save $ 1 billion to the
company. In addition the reduction of the number of platforms from 13 to 6 will
result in $ 2 billion savings according to estimations. Notice that parts'
inventories should be substantially reduced as demand volatility decreases. This
is the result of aggregating parts' demands2 . Note that a design, or
manufacturing investment which would have been prohibitive for a specific
program, might be affordable if shared by several programs.
- Reduced engineering expenses through design for modularity, and processreusability. In the case the platform planning team decides up front to reuse aproduction facility for a future program, it must provide the productdevelopment team with the set of design hardpoints or constraints it needs tomeet so that the considered production facility can be reused.
1 Product/Process compatibility consists of a simultaneous development of product and process strategieswhen planning for the development of product families, to optimize the utilization of the availableresources.2 If inventories cover two standard deviations of the demand, 2 a, then for a set of 3 parts for instance, theprotection for the aggregated demand -under the commonality assumption- is 2-fa + -2 + C32 ),
instead of 2 * ( 2+ + ), assuming that the demands for the three parts are independent.

- Flexibility, and quick market response enabled by a high commonization
magnitude which facilitates capacity transfers across plants, and from a product
generation to the next one, when demands for different vehicles are negatively
correlated.
- Investment and changeover time reduction as a result of greater use of carryover
and common equipment and tooling.
However, and despite all these benefits, the cycle planning team might face
dilemmas when the time comes to decide whether to reuse the existing equipment which
is not common across the product family, or to buy new equipment to increase
commonization. The first option might be better for short term planning, however the
second will in the long run prove to be more profitable to the company. The planning
team will have to make trade-offs, and build a long term plan to achieve a smooth
transition to process commonality.
As explained before, the BIM should help the cycle, or platform, planning team at
a lower level, to better plan the proliferation of its products and processes over time, and
better allocate its resources. It can be used to reflect the overall strategy of the company,and therefore, show the weaknesses and strengths of each alternative. Many tools were
developed to support this strategic planning approach.
The System Reusability Plan (Figure 3.4), for instance, supports the detailed BIM
and product/process compatibility, and depicts the reusability levels across products, over
time in terms of both engineering and manufacturing. For each subsystem, a clear
difference was made between engineering, and facilities and tooling investment. The
reason for this, is to enforce the reuse of manufacturing processes as much as we can,
especially when design changes are required. As stated earlier, product/process
compatibility can sensitively reduce investment costs.
In the example shown in Figure 3.4, the product is a lighting system. This can also
be applied to a product line, or a product platform going one step higher.

a a aD
E C EE E
Subsystems1.Source Engineering
F&T
2.Outer lens Engineering
F&T
3.Reflector EngineeringF&T
4.Shielding EngineeringF&T
5.Slide Engineering
F&T
5.Venting EngineeringF&T
6.Mounting EngineeringF&T
7.Bonding/Sealing EngineeringF&T
8.Light Distribution EngineeringF&T
D C D A-D
B B C A-DD B A-D A-D
D F E C D B A-D A-D
B C C C D B A-D A-D
A-D -
B A A A
A-D A-D A-D A-D
A A A
- A A-D A-D
- A-D A-D A-D
- A A-D A-D
- - - - - - A-D A-D
A = Existing application or potential for identical usage of a previous partB = Reuse technology or process in different configuration
C = Evolution of previous technology or processD = All new part/technology/process
E = Develop internal capabilityF = Follow US development
Figure 3.4 - System Reusability Plan
E
4)Cl
E)r0.eI-
0.
E(5-J
3- Application to a lighting system, matching basic strengths, technology, andproduct strategiesl
Given limited investment and people resources, the Business Integration Model
can be used as a strategic planning tool to identify the most important technologies and
people to have in place for developing a given customer-driven a well as a cost-driven
product. Reuse of systems and technologies can sensitively reduce the development time,
increasing by the same token the return on investment on technologies.
The BIM will increase the technology implementation rate, ensuring that the only
technologies to be developed are the ones needed for future generational products.
Indeed, any technology that does not have enough buyers will not be developed. The
current processes for technology deployment in most companies "accept" waste as a fact
(25% implementation), refusing to plan for technology implementation - or the
technology migration plan - before the concept ready phase. Common sense tells us that
one should find customers, identify what they want, and then deliver to them what they
are asking for. If one does not have enough customers, he should definitely forget
developing his product.
The BIM also increases cooperation between different programs over time to
optimally share costs. A prohibitive cost for a given product development program (new
process technology for instance), can become reasonable when shared by four, or five
programs.
Shown in figure 3.5 is an example of a technology reusability study. For instance,
in order to develop a C headlamp technology, one would need mechanical, optical, and
software engineering as basic strengths or core competencies. They are required to run
the mechanical, optical, and optimization software #1. Finally results gathered from
optimization software 1 were utilized to design a C headlamp technology. The focus of
the above diagram is not on reusability, but resource allocation across product programs
(people, technologies).
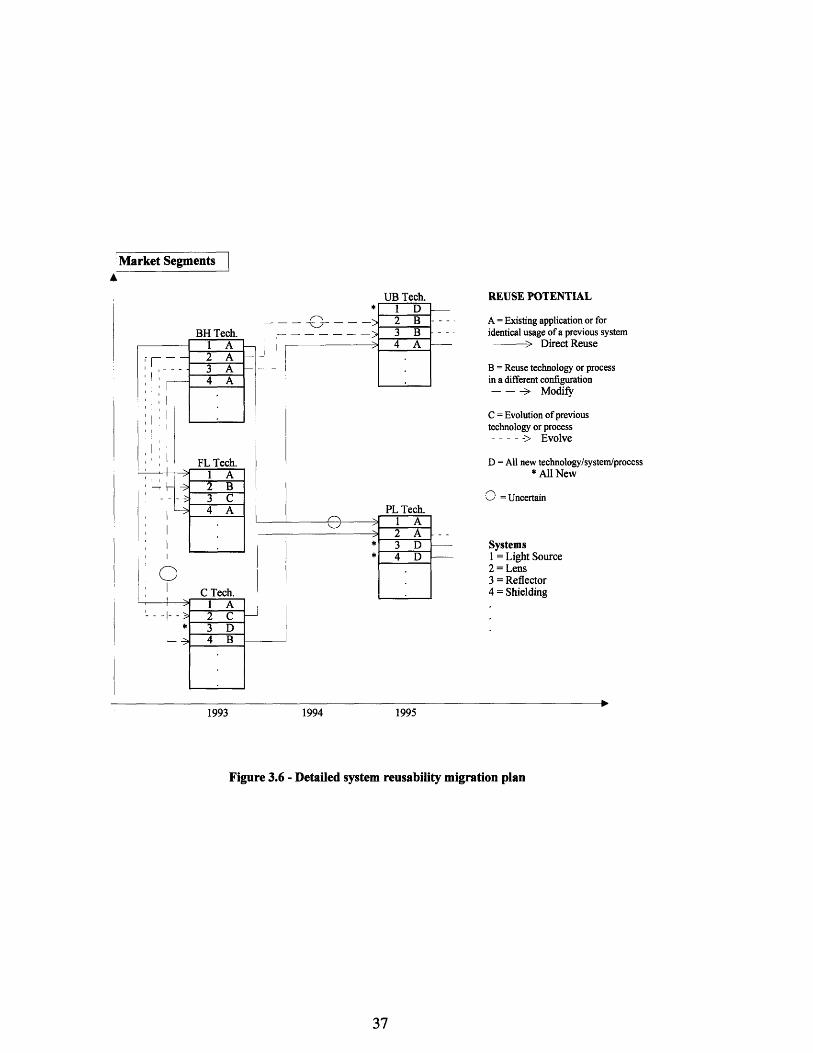
We can go a step further, and break down each system into subsystems and
analyze the reusability potential of each, as shown in Figure 3.6 . 1, 2, 3, and 4 represent
some of the lighting systems. Very detailed planning can be done relative to the changes
at the system level from a product generation to another. This helps to maximize
1 Originally this application was carried out by Professor Ron Andrade, in a joint effort with Ford MotorCompany. To protect the company, the actual results are not reported in this thesis.

reusability, and to better allocate resources as explained previously. For instance, the UBproduct has only one brand new system, the light source (1), the other systems beingmodified or reused from existing products.
A better approach would be to define the manufacturing strategy simultaneously,and think about what plants to reuse for production, and eventually which manufacturingprocesses.

UTV
UB
MechanicalEngineering
Optical MarketOptica g Software ResearchEngineerin Engineering Capabies
,Engineering 'Capabilities- - - - -- - - - - - - -
Time
Figure 3.5 - Overall Linking of Product Strategy with Technology Strategy & Basic Strengths
[ProductStrategy
ProductTechnology
Strategy
CoreCompetency
Strategy
BH Tech.
PL Tech.
REUSE POTENTIAL
A = Existing application or foridentical usage of a previous system
> Direct Reuse
B = Reuse technology or processin a different configuration-- -> Modify
C = Evolution of previoustechnology or process-- - > Evolve
D = All new technology/system/process* All New
O = Uncertain
Systems1 = Light Source2 = Lens3 = Reflector4 = Shielding
Figure 3.6 - Detailed system reusability migration plan
Market SegmentsAý
1993 1994 1995


Chapter IV - Assessing Customer-driven design, facilitiesand tooling changes
The previous chapter introduced a strategic planning tool for supporting
technology, product, and process planning for a family of products. As will be described
later in chapter seven, a cycle, or platform, planning team might have to choose one set of
products to be developed among a wide range of possibilities. Sometimes, the BIM and a
broad financial analysis will not be sufficient to decide upon how many products should
be developed, and how new should be each product to maximize the overall profitability
of the corporation.
Hence, a more detailed analysis is needed. A deep understanding of each product
expectation is a key step in this process. The following chapter will describe some tools
which will help the cycle - or platform - planning team to better assess the type of
changes to be made at each product level from both an engineering and manufacturing
perspective. The subsequent chapters will present some tools which that help the teamdetermine the resources necessary to develop each product program, as well as thefinancial return on each of the development alternatives.
We will describe in this chapter:
- the tree analysis which enables the platform team to better assess the design andmanufacturing change magnitude required by each product expectation on theproduct functions, physical designs, and production system.
- the manufacturing reusability template which identifies key manufacturinghardpoints required for manufacturing and assembly reusability.

- the reusability matrices which display the sources of the design and
manufacturing solutions for each product expectation.
1- Tree analysis - High level assessment of the design and manufacturing changemagnitude required by each product expectation!
After having defined the product expectations or specifications, the development
team must assess their impact on the functions of the product, and try to determine how
each product expectation will change the functional requirements for the product. At the
same time, the team must highlight the consequences on the existing design, and
associated facilities and tooling.
The first step after the definition of the product expectations, or specifications,
consists of an assessment of how each high level product expectation affects the functions
of the existing, or previous generational, model. The development team should recall the
functional tree built for the previous generational product if it exists, or build one if this
was not done before. The functional tree displays the problem to be solved in terms of
functional requirements which are derived from the set of specifications 2 that the final
product must satisfy. The functional tree should be updated, or established, in a solution-
neutral environment, without being biased by preconceived physical solutions. The team
must assess how each product expectation will affect the functions of the product based
on its experience and experts judgment. Consensus must be reached on each evaluation.
This will help the development team to better understand the implications of the new
customer needs in terms of the functions the product must satisfy, and therefore better
understand the implications of each new product expectation in terms of design, facilities
and tooling changes.
Let us consider a machine-tool-design company. One of the products of one of the
company's platforms might be a lathe. Figure 4.13 displays the functional tree - also
called functional hierarchy - for a lathe. The development team should define what in the
functional tree, which could be the one associated with the previous generation of lathes,
should be changed to meet each new customer requirement or product expectation -
which can be derived from the House of Quality. This analysis is to be carried at a fairly
1 Other names for product expectations are product attributes, design requirements, corporate expectations,product requirements, and engineering characteristics. The prioritization of the product expectations can bethe one resulting from the House of Quality I, when the QFD approach has been effectively used by thecompany or the department.2 The set of product specifications, or product expectations can be derived from the QFD House of Quality(Hauser and Clausing, 1988).3 Derived from The Principles of Design, Nam P. Suh, 1990. New York: Oxford University Press.

detailed level - including systems and subsystems -, contrary to the BIM analysis which
was carried out at the system level.
Supply Rotate Adjust Support Support Positionpower wspeed workpiece and structure toolpower[ workpiece speed hold tool structure tool
Hold Position Supporttool structure
Figure 4.1 - Lathe functional tree
Before looking at the subfunctions of the high level functions, the development
team must conceptualize a physical design which can satisfy each of the high level new
functional requirements dictated by the product expectation considered. For the power
supply functional requirement of the lathe, the physical solution for the future
generational model might be the existing one if the product expectation considered does
not dictate any change on this function of the product. We will then keep a motor drive to
fulfill this function. Figure 4.21 displays the lathe hardware tree which shows the physical
design solutions to each of the functional requirements displayed in the functional tree. If
this tree was built for the previous generation of lathes, once again it needs to be updatedto meet better the new set of functional requirements associated with each productexpectation.
It is of primary importance for the multifunctional team to address the issue ofmanufacturability, and define the set of manufacturing and assembly processes that willenable the manufacturing and assembly of each system of the product, and eventually theproduct itself. The production system and the product design must be developed
I Derived from The Principles of Design, Nam P. Suh, 1990. New York: Oxford University Press.

concurrently and in close coordination. The benefits of developing simultaneously the
design and the production system were described in the previous chapter.
Lathe
Motor Head Geardrive stock box Tailstock Bed Carriage
Spindle Feedassembly screw
Figure 4.2 - Lathe hardware tree
The development team will have to display the set of processes used so far to
manufacture the product systems, and focus on the reuse of the existing facilities and
tooling. Any design change which meets the functionality of the product as dictated by
the product expectations, and permit the reuse of the existing facilities and tooling should
be systematically adopted, except when conflicting with long term corporate goals - such
as achieving process commonality instead of reusing unique processes.
As mentioned by Suh [1990], the development team must not decompose the first-
level functional requirements (FRs) of the product further into lower-level FRs before
determining acceptable design and manufacturing solutions for the first-level FRs, for
each product expectation.
The analysis described herein will help the development team to determine the
product design, facilities and tooling changes dictated by each product expectation. It also
helps the team to enforce systematic reusability of design systems, and manufacturing
facilities and tooling, and to drive changes by customer wants.

2- Facilities and tooling reusability
Manufacturing investment costs usually represent the major part of the total
investment for a product program. At Ford Motor Company, facilities and tooling
expenditures represent more than 70% of the total product program investment. This is
why a particular effort should be made to reuse the existing facilities and tooling
especially when design changes are required. This requires that the platform team define
a set of design constraints - or hardpoints - for each manufacturing or assembly process to
be reused. These constraints will then provide design engineers with guidance to design
for manufacturability.
The set of hardpoints consists of a list of directions to be met when designing a
system, so that we can reuse the processes that had been used to produce the previous
generational system. These hardpoints or constraints can be displayed in a table where the
study items, or systems to be designed, are on the vertical axis; and the areas under
constraints on the horizontal axis. We would then have in each cell the product/processcompatibility I hardpoints that should be maintained to ensure affordability and minimizethe impact to manufacturing and assembly. These manufacturing hardpoints aredirections and not frozen constraints. They are the specific physical drivers that support
the manufacturing targets set by the program team (for instance, reuse stamping plant A).
The manufacturing hardpoints can be related to machine tolerances, part features(radius on corners for casting), thickness of materials for injection molding. Assemblyhardpoints might be related to the assembly sequence, the level of automation, etc.
1 Product/process compatibility is arriving at the best product/process concept by simultaneouslyoptimizing the drivers of investment that are customer wants and cost reduction efforts - includingreusability.

3- The product and plant reusability matrices
3.1- Definition and architecture
The product reusability matrix, as described by Clausing [1991], shows the
relationship between the sources of the design -system-technology concepts, or end items,
integrated into a new product, and the product levels. Breaking down the total product
into several product levels enables a more subtle characterization of reusability than the
traditional simple reusability of piece parts [Witter 1994]. Following are the definitions of
the different product levels and the different sources of technology or design concepts.
The Total System Architecture (TSA) of a product consists of a set of systems, their
arrangement, basic composition -in terms of technology-, and structure. It can be
considered as the mechanical packaging of the product (including robustness and value of
critical design parameters).
A System (S) is a collection of subsystems combined to work as a larger integrated
subsystem having the capabilities of all the separate subsystems. It can also be defined as
a combination of two or more sets -generally physically separated when in operation- and
other assemblies and parts, necessary to perform an operational function or functions.
A Subsystem (SS) is an assemblage of elements within a system (including its general
technology, its robustness, and value of critical design parameters). A subsystem is often
identified at a level of definition within a system at which an independent development
effort is initiated. Complex products have more than one subsystem level.
A Component can be defined as one piece, or two or more pieces joined together, that are
not subject to disassembly without destruction or impairment of the part's designated use.
A partial example of break down of a product into its sub-levels is shown in figure 4.3.
Existing Products are products developed by the company up to the present time, and thatwere already introduced to the market. Their underlying technologies and concepts
should be well understood by the company at this time. Therefore, reusing them shouldrequire no or little development efforts.

VehicleArchitecture
Frame & Mounting SI
Engine S Transmission S
Engine Lubrification SS
IRadiator &
Cap
Engine Cooling SS
IEngineCoolant
Fuel Charging & Controls SS
IRadiatorShutters
Figure 4.3 - Vehicle architecture
Competitive products are products developed by the company's direct competitors. Reuse
of competitive products, modules, subsystems or components is commonly refered to as
reverse engineering.
Analogous products are products developed by another branch of industry, whose
technologies, modules, or parts can be imported. Analogous products reusability is also a
form of reverse engineering. A tractor would be an analogous product to a car, a printer to
a copier.
New means radical innovation or no reusability.
The product reusability matrix is described in figure 4.4. This matrix perfectly describes
the static/dynamic spectrum from incremental (I) products to radical (R) products as
stated by Clausing [1994]. An incremental change is a freshening action on an existing
product, or slight improvement of previous generational product. The majority of thedesign concepts would be derived from existing products, which is best represented bythe first column of the matrix. A radical change is primarily based on new technologies.This type of innovation is best represented by the right column or dynamic side of thematrix. Henderson and Clark [1990] have described two other types of product
IBody S
I
I
-I 1

innovations or changes - architectural and modular. Architectural products emphasize
changes at the total-system-architecture level, while modular products are primarily
modified at the lower levels.
Sources
C.rrvover nroducts
ducts
chnologyLevels
Total System Architecture
System
Subsystem level 1
Subsystem level 2
End items/Components
0_ 3;00
Arcnlut
/IoCs
Figure 4.4 - Product Reusability Matrix [Clausing 91]
Having identified the necessity of visualizing and quantifying plant reusability,
we developed at Ford Motor Company a similar matrix which displays the plant levels
and the possible manufacturing reusability sources when designing a new production
facility. Following are the definitions of the different plant levels; the different sources of
reusability being similar to those of the product planning matrix.
Plant Layout is the physical arrangement of the processes and any activity or physical
entity that supports this arrangement and its synchronization (transportation devices
between processes, inter-processes operators, floor space, buildings, etc.). Eliminating the
processes from the plant, you would still have the plant layout.
Manufacturing process refers to the series of activities performed upon material to
convert it from the raw or semi-finished state to a state of further completion and a
greater value.
I

Manufacturing assembly refers to the series of activities performed upon a number of
basic parts or subassemblies to combine them, or join them together to perform a specific
function.
The meaning of manufacturing process/assembly layout is similar to plant layout at a
lower level. Taking out the machines from a process/assembly, you would have the
process/assembly layout.
Equipment includes any machine or physical entity (conveyors, etc.) that is necessary for
the performance of a production operation on a product item in a manufacturing
process/assembly.
Tooling is defined as a set of required standard or special tools for production of aparticular part, including jigs, fixtures, gages, cutting tools, dies, and others. Thedefinition specifically excludes machine tools.
Figure 4.5 displays the structure of the plant reusability matrix.
Sources('vrrvnvir nlantc
Levels
Plant layout
Assembly process layout
Manufacturing process layout
Equipment
Tooling
nts
:ilities & tooling
Vrchite
q iod -
0
Figure 4.5 - Plant Reusability Matrix
0
0f zte'
r___d I I
I

It is important to keep in mind that these matrices are flexible and more rows can
be added if the development team wants to look at the system reusability in more details.
Figure 4.6 shows the partial product reusability matrix which would be used for a vehicle.
SourcesCarrvnvPr nrodiilt.t
>ductschnology
Levels
Total Vehicle Architecture
Body System
Fame & Mounting System
Engine System
Transmission System
etc.
Figure 4.6 - Vehicle Reusability Matrix
3.2- Applications
3.2.1- Better assess reusability degrees
The Business Integration Model reflects the product strategy a company plans to
adopt in the development of a product family. It displays the planned reusability levels at
the system level. However, when the time comes to compare different product strategies -
as will be described in chapter 6 - a more detailed analysis of the reusability degrees
should be performed. The level of details at which the development team should look
depend on the level of complexity of the product. However, in most cases analyzing the
design, facilities and tooling changes to be made to satisfy a product expectation, up to
the subsystem level, is enough to decide, upon completion of an economic analysis, what
set of products should be developed, and how new should be each product.
I
I

The product and plant reusability matrices can help the platform planning team to
evaluate the changes to be made at each product level to the existing product, as well as
the sources of the design and manufacturing solutions, to 100% meet each product
expectation. The first step in such an evaluation consists of a display of all plants that
contribute to the production of the previous generational product, or could be targeted for
reuse. The team would then have to assess how each product expectation affects the
existing product and plants in terms of design, facilities and tooling changes, using the
tree analysis to support this process.
Let us consider a simple product x with two systems. Let us assume that the
production system associated with this product consists of three plants: manufacturing
and assembly plants for system 1 and 2, and a final assembly plant. When developing the
next generation of product x - x' -, after the definition of the new set of product
expectations, we must assess how each product attribute will affect the existing design,facilities and tooling. We can use the approach displayed in figure 4.7, which consists ofdefining the contribution of each cell of the product (respectively plant) matrix to the total
product (respectively plant) cost, to 100% achieve the product expectation considered. Asimilar evaluation must then be performed for the subsequent product expectations. Thiswill help the cycle, or platform, planning team in defining the maximum reuse degreewhich can be achieved at each product level, and still hit 100% customer satisfaction - aswill be described in the next chapter.
3.2.2- The reusability matrices as a feedback tool
The product and plant reusability matrices can also be used to provide thedevelopment team a visual display of the type of design, facilities and tooling reuse it hasplanned to achieve before program approval, and later before production ramp-up. It canalso help the development team to better assess the type of innovation it has made, andbetter align its reuse decisions with corporate objectives, in future product developmentprojects. The company might have decided to launch incremental products every yearinstead of a radical product every four years as mentioned by Clausing [1994]; thereusability matrix will help the company to check whether or not it is following its plans.

Plant Reusability Matrices
Sources
Levels
Sources
Levelsducts
chnology
Total System Architecture 15% 9% 6%System 1 25% 10 10%
System 2 5% 30%
Plant layout 20%° 1Assembly process layout 20%Manufacturing process layout 10%
Equipment 30%
Tooling 20%/o
Sources
Levels
Plant layout 20%
Sys Mfg I Assembly process layout 20%-adAswely Manufacturing process layout 5% l%
Equipment 5%Tooling 20%
Sources
Levels
Plant layout 30%
Assembly process layout lo%System 2 Mfg and Manufacturing process layout 20%
Equipment 20% 0Tooling 20%
Figure 4.8 - Product and production system reusability. Notice that numbers inside the cells represent the contribution of the cell to the product orplant design in terms of dollars. The sum of all cells for a given matrix should be 100%.
its
cilities & tooling
Intscilities & tooling
nts
cilities & tooling
Product Reusability Matrix
rrmm.mrn(~nt.
Sources
"

Chapter V - Product Planning Matrix
Targets are a qualified set of goals (not just financial) that permits management to
assess whether initial development is directionally correct and encompasses all
potentially attractive alternatives. Targets are approximate goals to work toward, not
contracts to be met1 .
When Ford Motor Company started thinking about reusability years ago, one of
their first concerns was to institutionalize it. They decided that this could best be done by
assigning to each product program, depending on whether it was a new generational car
or a freshening, a target for reusability based on a company worldwide policy, that is
complexity reduction. The question that struck me was related to the target defining
process, which was based on nothing, except experience and experts judgments. Why
50% parts' reusability and not 30%, or even 70%? The root problem was actually how to
define the best balance between reuse and customer-driven innovation, or change; and
therefore, how to define reusability targets for product, and manufacturing engineering.
The following legend is to be used for the graphs inserted in this part.
Engineering (hours*$/hour = $$)
Manufacturing (investment = $$)
1 Actual Ford definition of Targets.

1- Definition and scope
The product planning matrix outlines a process for achieving a degree of product
change that is clearly visible, suitable to the customer, but avoids unnecessary
investment. Marketing, engineering, manufacturing, and accounting must work jointly to
identify a design approach to achieve it.
1.1- Intent
The intent of the product planning matrix is to help the multifunctional product
development team to:
- Better determine the reusability levels that should be targeted at each product
level from both engineering and manufacturing perspectives,
- Better allocate spending and resources, and focus development resources on
those features that are the most valuable to the customer,
- Assess the achievement level of the product expectations, after the budget is
allocated, and therefore, focus development resources on design changes that
have the highest impact on product expectations' achievement level.
1.2- Benefits
The benefits are multiple. Indeed, this tool will help product planners to:
- Achieve the best balance between reuse and innovation, combining existing
designs, and facilities & tooling, with clean-sheet designs, and brand new
facilities & tooling, to provide product variety and greater market presence
relative to the development effort,
- Assess before decisions are frozen the impact of the team's decisions on the
probable achievement level of the program's product expectations.
- Consider and analyze different alternatives using an Excel' spreadsheet, before
choosing the alternative maximizing customer satisfaction and corporate
business goals.
1 Excel is a registered name of a Microsoft software.

2- Product Planning Matrix - Planning a successful, and affordable product
2.1- Building a market-driven product
Design changes must be driven by customer wants. Any change or improvement
to be made to a new generational product should therefore be dictated by a product
expectation. Of course, these product expectations need to be prioritized, and the
correlation between them identified. This will give to the team guidance on how to spend
its budget, and on what requirements it should focus its efforts, as will be described late
in this chapter.
2.1.1- Product expectations' prioritization
Other names for product expectations are product attributes, design requirements,
corporate expectations, product requirements, and engineering characteristics. The
prioritization of the product expectations can be the one resulting from the House of
Quality' , when the QFD approach has been effectively used by the company or the
department. A ranking can also be performed, as described by Lou Cohen2 , on the basis
of the assessment of:
- The importance to the customer of each product expectation
- The current satisfaction performance, which reflects the customer's perception
of how well the current product or service is meeting his need
- Competitive benchmarking
- The goal, which is the level of customer satisfaction the team is targeting for
each product expectation
- The sales point, which measures your ability to sell a product based on how well
each customer need is met.
It is necessary to assign to each product expectation a weight corresponding to its
relative importance, the sum of the product expectations' weight being 100%. An
example is displayed in figure 5.1, where we have four product expectations A, B, C, and
D. Their relative importance is shown in the first column: prioritization of productexpectations.
1 Don Clausing. 1994. Total Quality Development .New York: ASME Press.2 Lou Cohen. 1995. Quality Function Deployment. Reading, Massachusetts: Addison Wesley.

Total System Architecture
- I
Figure 5.1 - Product expectations' prioritization
2.1.2- Correlation Matrix
This could be once again derived from the House of Quality. Even if you do not
use QFD, the correlation matrix must be evaluated. It is aimed at showing the
relationships between each pair of product expectations. Indications of negative impact of
one specification upon another represent bottlenecks in the design.
Five correlation levels are used to evaluate the correlation level: 1) strong
positive, 2) positive, 3) no impact, 4) negative, and 5) strong negative. As stated
previously, negative relationships' are of primary importance, as satisfaction of both
requirements during the design activities will imply trade-offs, especially if the design
team fails to fulfill for conflicting requirements. In such a case, the relative importance of
each product specification will probably determine whether or not it will be neglected,
and the amount of resources to be dedicated to its satisfaction. Nevertheless, the objective
is to identify conflicting product expectations early so that particular attention is paid to
satisfying both requirements. These negative correlations might call for special planning
or breakthrough attempts. It is also to avoid design rework2 . Figure 5.2 shows the
structure of the correlation matrix.
1 For instance, the peak closing force for a car door and the ability to seal out wind, rain, and dust.2 A producer of integrated circuits was developing an ASIC (Application-Specific Integrated Circuit) for acustomer. Analysis of the technical correlations disclosed that certain customer requirements weretechnically incompatible. Had this incompatibility not been discovered during the product planning phase,the ASIC producer believes they would have wasted several million dollars in preliminary developmentwork before discovering the need to redesign [Cohen 95]
Prioritizationof Product Expectations
SProduct Expectations I
1- PE A
2- PE B
3- PE C4- PE D
50%
30%
15%
5% L
I

Prioritizationof Product Expectations
Product Expectations
1- PE A2- PE B3-PE C4- PE D
Figure 5.2 - Correlation matrix
Now that we have prioritized the product expectations and evaluated their
interrelationships, which will make our design and manufacturing changes market-driven,
it is time to look at the financial aspect of the product program.
2.2- Building a cost-driven product
The objective is to determine costly design systems and manufacturing operations
so that a particular effort is made to reuse them, and commonize them across product-
lines. It is also to assess the budget necessary to cover a design or manufacturing change
at a specific level. This information will be used to support the product development
decision process. The cost of all new design, facilities and tooling deployment through
the product levels can provide the team with the financial information mentioned.
Following is a description of how the expenditures at each product level can bedetermined.
2.2.1- Assumptions
- Costs of all new design, facilities and tooling (F&T) when derived from pastfinancial data are updated to their current value, using the average compoundedinflation rate.
Strong Positive * 9Positive 0 3Negative X -3Strong Negative 9 -9
I - -
Correlation matrix
50%
30%15%
5%
* *
rr · ~·

- Costs of all new design, and manufacturing facilities do not vary sensitively over
time, except by the average compounded inflation rate.
2.2.2- Costing approach - Expenditure deployment through the levels
The first step in this part is to build a hardware tree for our product. This tree must
show all the product systems. Afterwards, the product development team, or product
planning team must assess based on its experience, the previous programs and the
existing financial data, the total cost of a brand new program, with all new design,
facilities and tooling. It should then deploy this total cost through the product levels
(Total-system-architecture, systems, subsystems, etc.), to show how much is spent for
what. The objective is to display visually the product development costs as they occur at
each product level, in terms of engineering as well as manufacturing investment.
At each product level the engineering and manufacturing investment should
reflect the very amount of money to be spent at this product level for entirely new design
and manufacturing systems. This evaluation can be based on the team's experience, and
existing financial data from previous programs.
In the case of a simple product with two systems, the hardware tree is
Total System Architecture
I ISystem 1 System 2
Let us assume that the product development team found that the aggregated cost
of all-new (0% reusability) design, facilities and tooling is $100,000 based on its
experience and past data. The next step is to deploy this $100,000 through the product
levels - here the TSA (Total System Architecture), system 1, and system 2. This provides
the allocated costs if the product were all new. Later we will calculate the cost reduction
that is achieved through reusability. It is very important to separate engineering from
manufacturing investment. Figure 5.3 shows the results of such an analysis. For instance,
the total-system-architecture engineering' will cost about $5,000 if it is all new. The cost
of a new total-system-architecture final assembly plant is expected to be $20,000.
The sum of all costs displayed should sum up to the aggregated cost of all new
design and manufacturing facilities - $100,000.
1 This would be the engineering cost of packaging systems 1 and 2.

It is important to keep in mind that the lowest level displayed (system in this
example) should be considered as a black box. In other words, end item, or componentengineering, and manufacturing investment should be accounted for at this level. In ourexample, the lowest level is the system level; therefore, the engineering, andmanufacturing costs allocated to each system must include the investments related to thedesign, and manufacturing of their components, or sub-elements.
Some engineers and product managers would prefer to have a tree with costsaggregating as you go up, as suggested by Chapman' (Figure 5.4). The cost ofengineering the total-system-architecture would then be computed simply as follows:$25,000 - $12,000 - $8,000 = $5,000.
Aggregated Cost for an all new design and manufacturing facilities (0% reuse): $100,000
e
(cost of assembly plant) I I
Engineering cost of
designing the system
Manufacturing investment(cost of the manufacturing plar
System 1
$25,000
it)
ISystem 2
_$12,000
$30,000
MJPPOPDO
Figure 5.3 - Cost deployment through the levels
1 Private discussion with Henry L. Chapman, Ford Program Planning Associate, Advanced VehicleTechnology Planning, July 1996.
|L

Aggregated Cost for an all new design and manufacturing facilities (0% reuse): $100,000
Total Sv.tCerm Architct htre.
,000
QsK~e"
Total engineering cost
for the program
Total manufacturing investment
for the program
Engineering cost of
designing the system
Manufacturing investr
(cost of the manufacturing
System 1$8,000
$25,000
nentg plant)
Figure 5.4 - Accumulated investment cost at each product level
2.2.3- Tie to the product planning matrix
A percentage, reflecting the contribution of engineering and manufacturing
facility expenses to the total investment, is computed at each product level. The sum
across all product levels should be a 100%, which corresponds to the cost of an all new
program ($100,000 in the example considered). In our example, the total-system-
architecture contribution to the total expenditures (for an all new program) would be 5%
= $5,000 / $100,000 for engineering, and 20% = $20,000 / $100,000 for manufacturing.
The final result of our financial analysis should be plugged into the product
planning matrix in the format that is displayed in figure 5.5.
ISystem 2
$12,000
$30,000
1
-- v
w -- 1
J
I

% Total Cost of all newDesign/F&T
Prioritizationof Product Expectations
Product Expectations
1- PE A
2- PE B
3- PE C
4- PE D
Impact Level
Total System Architecture
= 100.0
Figure 5.5 - Cost of all new design, facilities and tooling deployment through product levels
2.3- Defining product-expectation-driven design and manufacturing changes
Next we take the viewpoint of providing complete customer satisfaction, except for cost.
2.3.1- Evaluating the change magnitude required by product expectations ateach product level
The objective is to assess the impact of each product expectation at each product
level in terms of changes required, from both an engineering and a manufacturing
perspective. In other words, we want to know what type of change we need to make ateach product level to satisfy our customers, and to be consistent with any corporate,regulatory or manufacturing goals. This evaluation is done by the multifunctional productdevelopment team, or multifunctional product planning team based on their experienceand knowledge of the past programs.
Later in this chapter, we will iterate to achieve the best balance between cost andthe other product expectations.
L
I

a- Assumptions
- Reusability, and innovation (or change) are measured in dollars saved. For
system 1, in the example considered above, 50% reuse of the design would be
equivalent to $ 4,000 = 50% * $8,000 saved ($8,000 being the cost of a brand
new design).
- Complementary changes across product expectations (PEs) are taken into
account only once - for the highest priority product expectation
- Distinct changes should be accounted for independently
- In case of conflicting changes, priority is given to most important PE. Trade-offs
are made so that no conflicting changes appear on the matrix.
b- Relating design, and manufacturing changes to product expectations
In traditional product planning, design and manufacturing changes have often not
been highly correlated, or even driven by product expectations. Overdesign, unnecessary
investment, poor reusability, rework, and low profitability products are some of the
results of such a negligence. To overcome this problem, the product development, or
product planning, team uses the relationship matrix to ensure that design changes, and
manufacturing system changes are a high-fidelity translation of corporate product
expectations' . The multifunctional team must resolve differences, and converge on a
consensus for each cell that best represents the responsiveness of the corresponding
design, facilities and tooling changes to the specific product expectation.
A variety of scales can be used in the matrix to assess the impact2 of each product
expectation at each product level from a design and manufacturing change perspective.
Figure 5.63 shows some of the possible scales. It is important to keep in mind that the
reuse degree is interpreted in terms of dollars saved.
1 The QFD House of Quality ensures that product expectations themselves are a high fidelity translation ofcustomer wants.2 To assess the impact means to evaluate the degree of change, dictated by each product expectation at eachproduct level form both a design and manufacturing perspective.3 The Go/No Go scale was suggested by Brian K. Vought, Manager, Ford Product Strategy office, during aprivate discussion, August 1996. The Standard scale was suggested by Henry L. Chapman, ProgramPlanning Associate, Ford Advanced Vehicle Technology, during a private discussion, August 1996.

Standard**
0 = New
1 = Carryover/Common
1 = New (<20% reuse)
3 = Modified (20%-80% reuse)
5 = Carryover/Common (>80% reuse)
1 = New (<20% reuse)
2 = Highly modified (20-40% reuse)
3 = Modified (40-60% reuse)
4 = Slightly modified (60-80% reuse)
5 = Carryover/Common (>80% reuse)
Figure 5.6 - Alterantive scales for evaluating the PEs' impact on design, facilities and tooling
While using the Go/NoGo, and standard scales might be easier for the team, the
linear scale makes the differentiation among alternative reuse magnitudes clearer, giving
the team a more detailed information related to the type of change it has made later in the
development process. For instance, this would enable the team to differentiate between a
corporate, a competitive, and an analogous carryover or common system. Indeed, in
response to a product specification, reusing a corporate system should cost us less than
20% of the cost of an entirely new design - this would be a change of type 5 -. However,
reusing a system from an external source, which could be a competitive product or an
analogous product, might cost us more than 20% of the cost of a clean-sheet design. It
would most likely be a change of type 4/5 for a competitive product, and a change of type
3/5 for an analogous product, which will naturally require more modifications.
The multifunctional team should address each product expectation's impact on the
existing, previous generational design and manufacturing plants separately, starting with
the highest priority product expectation.
The design, facilities and tooling changes resulting from the evaluation of the first
product expectation should be taken as a reference for the evaluation of the changesdeemed necessary for the next product expectation. In case of conflicting changes, trade-offs are to be made, if no technical solution can satisfy both requirements. Early trade-offs should be avoided. The team should always seek a solution that satisfies bothrequirements. This is often how innovation occurs.
Figure 5.7 shows an example of relationship matrix for our two-system product. Itis important to keep in mind that the sum of the changes to be made to a system cannot bemore than 100%. Therefore, the sum of the numbers in each column should be greater
Go/No Go* Linear

than 5 * (# of PEs - 1), but less than 5 * (# of PEs). In the example displayed in figure
5.7, the sum of the numbers plugged into each column should be greater than 15, but less
than 20. The reason for that is that one unit in the one-to-five scale corresponds to 20% of
the product's cost, the maximum change level for the product being 100%.
% Total Cost of all newDesign/F&T
Prioritizationof Product Expectations
Impact Level
Total System Architecture
Product Expectations
50%
30%
15%
5%
5.0% 20.0% 8.0% 25.0% 12.0% 30.0%
Figure 5.7 - Relationship matrix (These numbers are judged to provide completecustomer satisfaction on each PE)
Note that the greatest changes are made to satisfy PE A. These changes also go far
towards satisfying PE B. Therefore, only one small additional change is needed to satisfy
PE B. No additional change is needed to satisfy PE C.
2.3.2- Computing the resulting reuse degree
a- Reuse degreel associated with each product expectation
The reuse degree by product expectation gives an indication of how a given
product expectation affects the design, facilities and tooling changes, and the budget
necessary to fulfill for each product expectation. This will help the team to better allocate
its budget. For instance, a product expectation that is low priority, but requires a high
change expenditure, will probably be neglected when we iterate our calculations to
achieve the best balance between cost and product expectations satisfaction.
1 The reuse level here is the percentage of the cost of all new design, facilities and tooling required to meetthe product expectation considered.
1- PE A2- PE B3- PE C
4- PE D
I

The reuse degree by product expectation is the cost-weighted sum of the various
reuse degrees dictated by the product expectation at each product level. That is
RPE = (CkD* Rik +CkF[&T * Rf )/ 5k
where, CkD is the cost of an all new design at product level k' ,
C F&T is the cost of all new facilities and tooling at product level k,
RPDE,k is the design reuse degree dictated by PEi, at product level k,
RpFE is the facilities and tooling reuse degree dictated by PEi, at product level
k.
In the example shown in figure 5.7, the overall reuse degree associated with
product expectation A is RPEA = 49.4% = (4 * 5% + 2 * 20% + 5 * 8% + 3 * 25% + 1 *
12% + 2 * 30%) / 5. The design reuse degree would be 57.6% = (4 * 5% + 5 * 8% + 1 *
12%) / 5. The facilities and tooling reuse degree would be 46.7% = (2 * 20% + 3 * 25% +
2 * 30%) / 5. The financial weight of engineering design being 25% = 5%+8%+12%, theequivalent for facilities and tooling being 75% = 20% + 25% + 30%, the overall reusedegree associated with product expectation A (PE A) is therefore 49.4% = 25% * 57.6%+ 75% * 46.7%, which confirms the result obtained above.
Figure 5.8 displays the reuse levels by product expectation, and by system for theexample considered previously. The budget necessary to fulfill for PE A will then be (1 -49.4%) * $100,000 = $50,6002 . Notice that this will also produce partial achievement on
the remaining PEs, so relatively little additional expenditure is needed to achievecustomer satisfaction on all PEs. Besides, the aggregated reuse level Raggregated for theproduct is equal to
aggragated = 100% - (100% -RPE,) = 100% - ChPEi=1 i=1
where, RPE, is the cost of an all new design at product level k,
n the number of product expectations.
ChPE, = (100% - RPE ) represents the change degree - in terms of dollars-
required in our product to meet PEi.
1 In the example considered, at product level 1 we have the total-system-architecture, at product level 2.1system 1, and at product level 2.2 system 2.2 ($100,000 * 25%) * (1 - 57.6%) = $10,600 for engineering, and ($100,000 * 75%) * (1 - 46.7%) =$39.975 for facilities and tooling

% Total Cost of all newDesign/F&T
Prioritizationof Product Expectations
Product Expectations
1- PE A
2- PEB
ýX 3- PEC
4- PE D
Reuse Level by system ($$)
% Change in product for100% achievement of PEi
Impact Level
Total System Architecture
% Reuse for 100%achievement of PEi
5.0% 20.0%
80% 40%
8.0% 25.0%
80% 60%
12.0% 30.0%
20% 20%
100.0%
57.6%
100.0%
100.0%
93 6%
25.0% 75.0%
50.6%
6.0%
0.0%
1.6%
46.7%
92.0%
100.0%
100.0%
51.2% 38.7%
Aggregated reusability level for the product /
Aggregated change degree for the product
Figure 5.8 - Computing design, facilities and tooling reusability degrees by system, and by product expectation, given the relationship matrix - Example
In the team's judgement, as represented in the impact values 1-5, this case will provide complete customer satisfaction on PEs A-D.
Note that this is achieved with only 58.2% change (1-41.8%). Thus, expenditures beyond $58,200 would be difficult to justify.
Strong Positive
Positive
Negative
Strong Negative
@ 9
O 3
X-3
-9 100.0%
49.4%
94.0%
100.0%
98.4%
41.8% 58.2%
,w
~--i--i
! -- ~--- --~-'
58.2%--- ~--
100.0%
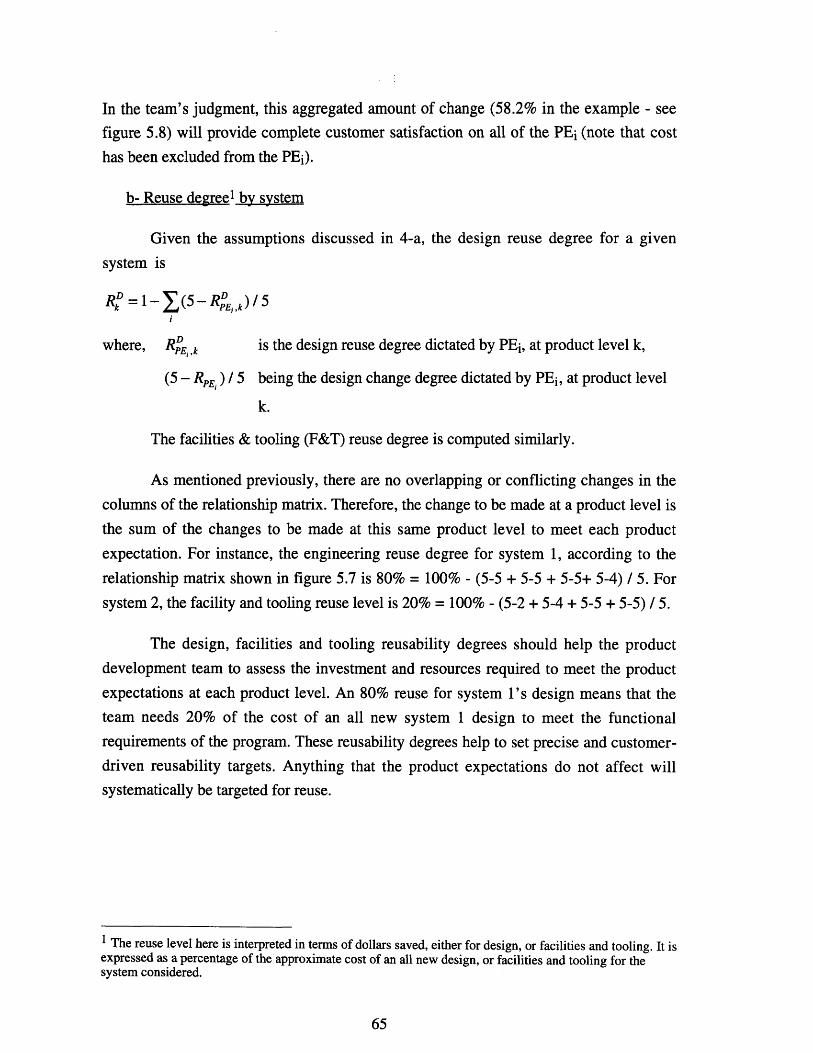
In the team's judgment, this aggregated amount of change (58.2% in the example - seefigure 5.8) will provide complete customer satisfaction on all of the PEi (note that cost
has been excluded from the PEi).
b- Reuse degreel by system
Given the assumptions discussed in 4-a, the design reuse degree for a given
system is
RD =1 f,(5- REi,k) / 5
where, RL'E,k is the design reuse degree dictated by PEi, at product level k,
(5 - RPE) / 5 being the design change degree dictated by PEi, at product level
k.
The facilities & tooling (F&T) reuse degree is computed similarly.
As mentioned previously, there are no overlapping or conflicting changes in the
columns of the relationship matrix. Therefore, the change to be made at a product level isthe sum of the changes to be made at this same product level to meet each productexpectation. For instance, the engineering reuse degree for system 1, according to therelationship matrix shown in figure 5.7 is 80% = 100% - (5-5 + 5-5 + 5-5+ 5-4) / 5. For
system 2, the facility and tooling reuse level is 20% = 100% - (5-2 + 5-4 + 5-5 + 5-5) / 5.
The design, facilities and tooling reusability degrees should help the productdevelopment team to assess the investment and resources required to meet the productexpectations at each product level. An 80% reuse for system l's design means that theteam needs 20% of the cost of an all new system 1 design to meet the functionalrequirements of the program. These reusability degrees help to set precise and customer-driven reusability targets. Anything that the product expectations do not affect willsystematically be targeted for reuse.
1 The reuse level here is interpreted in terms of dollars saved, either for design, or facilities and tooling. It isexpressed as a percentage of the approximate cost of an all new design, or facilities and tooling for thesystem considered.

2.4- Defining the targets achievement' degree
We have calculated the cost for all-new (clean-sheet) design, facilities and tooling
- $100,000 in the example. We have calculated the cost - $58,200 in the example - of
satisfying all of the customer-driven expectations PEi. Now we will explore trade-offs
that further reduce the cost, while only sacrificing a small amount of customer
satisfaction on the PEs. The customers might be more satisfied with a lower cost and
slightly reduced achievement of PEs.
To do so, we need to first define the achievement degree of a product expectation
in response to a design or facilities and tooling change. We need then to define the overall
achievement degree of the program, which will be used to find the best balance between
cost reduction and the overall satisfaction of the PEs.
2.4.1- Product expectations achievement degree
The degree of product expectation achievement to be expected is computed as the
budget allocated to satisfy the product expectation considered, divided by the change
degree to be made to the product to meet this product expectation times the total cost of
all-new design, facilities and tooling - $100,000 in the example. That is:
APE = [xi * B] / [(1- RPE) * B0)] = [xi * B] / [ChE, * B0)]
where, xi is the proportion of the current program's budget to be allocated to
satisfy PEi,
RpEi is the product reuse degree driven by product expectation PEi,
ChPE = (100% - RPE) represents the change degree - in terms of dollars-
required in our product to meet PEi.
B0 is the aggregated cost of all new design, facilities and tooling (0%
reuse),
B is the actual program's budget.
APE` is the money to be given, xi * B, divided by the money actually needed to achieve
100% customer satisfaction on PEi, ChPEi * Bo; thus it is the degree of achievement on
PEi".
1 The maximum achievement degree is 100%.

In the previous example (figure 5.8), assuming that 86.9%1 of the program's
budget - that is $58,200 - is allocated to satisfying product expectation A, the
achievement degree of this product expectation would be (86.9% * $58,200) / (50.6% *$100,000) = 100% - which is not surprising as $58,200 is the cost of providing completecustomer satisfaction on all PEs A-D.
2.4.2- Overall achievement of program in terms of product expectations
The overall achievement of the program in terms of product expectations iscomputed as fellows:
S(WPE, * AE,)
where, WPEi is the weight of product expectation PEi,
APE, is the degree of product expectation PEi achievement.
2.4.3- Design, facilities and tooling change achievement degree
A degree of design change achievement is the budget allocated to realize thechange divided by the budget actually required to achieve it. Similarly, a degree offacilities and tooling change achievement is the budget allocated to realize the changedivided by the budget actually required to achieve it. That is:
A = [yk * B]/[(1- Rk)* Bo)]
where, yk is the proportion of the current program's budget to be allocated to
achieve the change required at product level k, in terms of designif 1 = D, facilities and tooling if 1 = F&T,
Rk is the reuse degree at product level k, in terms of engineering design if
1 = D, facilities and tooling if 1 = F&T,
B0 is the aggregated cost of all new design, facilities and tooling (0%
reuse),
B is the actual program's budget.
If we consider system 1 design (figure 5.8), 80% of the design is carried over;therefore, we have 20% change, or innovation. The cost of designing a new system 1 wasevaluated at 8% * $100,000 = $8,000. As a consequence, 20% * $8,000 = $1600 is the
1 As displayed in figure 9.

budget necessary to achieve the system 1 design change for 100% customer satisfaction.
Now if for some reason the budget allocated to make this change is $1,000, the
achievement level of system 1 design will be 63% = $1,000 / $1,600.
2.4.4- Overall achievement of program in terms of design, facilities and tooling
changes
The overall achievement of the program in terms of design, facilities and tooling
changes is computed as fellows:
X(CD° * AD + CF&T y AFr)k
where, Ckf is the cost of an all new design at product level k,
C[&T is the cost of all new facilities and tooling at product level k,
AkD is the degree of design change achievement, at product level k,
A[&T is the degree of facilities and tooling change achievement, at product
level k.
2.5- Budget allocation for PEs' optimal achievement magnitude
In this section, we will simply assume that the product development team wants to
achieve a 100% customer satisfaction on all product expectations. As seen previously,
this can be achieved if it has enough money to fulfill for all design, facilities and tooling
changes, as determined by the product expectations - in the example $58,200.
2.5.1- Assumptions
- A product expectation that requires no changes in both the design, and the
manufacturing facilities, will be considered as 100% achieved, and no money
will be allocated to its satisfaction.
- The product expectations optimal achievement magnitude is 100%.
2.5.2- Recommended budget allocation by product expectations
As stated before, the optimal budget allocation would be the one that maximizes
the overall achievement of the program in terms of product expectations, at 100%. The
optimal distribution of spending, and resources is best reached by allocating to each

product expectation the exact proportion of the budget required to achieve complete
customer satisfaction on the product expectation considered, that is:
x i = ChPEi * (B / BRequired) = (1- RPEi)*(B / BRequired)
where, xi is the proportion of the current program's budget to be allocated to
completely satisfy PEi,
RPE, is the product reuse degree driven by product expectation PEi,
ChPE = (100% - RPE ) represents the change degree - in terms of dollars-
required in our product to meet PEi.
BRequired is the budget required to achieve a complete customer satisfaction
on all product expectations - $58,200 in the example considered
previously.
Bo is the aggregated cost of all-new design, facilities and tooling -
$100,000 in the example.
2.5.3- Team decision based budget allocation
The product development, or product planning team might have a systematic
approach, and methodology to allocate spending and resources. In such a case, these
numbers should be plugged into the product planning spreadsheet, and the achievement
levels should be watched. If this allocation base does not achieve a 100% of customer
satisfaction on each product expectation - the budget required to meet all product
expectations being the one defined previously ($58,200 in the example) - it is not
optimal.
2.5.4- PE budget allocation: translation into system design, facilities and toolingbudget allocation
Allocating spending and resources to product expectations will help the team to
concentrate its efforts on the features that are the most valuable to the customer; however,spending should be deployed through the product levels, to provide a frame of reference,a set of specific expectations to design and manufacturing engineers.
The resources allocation must be proportional to the design or facilities andtooling change cost. For product level k, the proportion of the total program's budgetdedicated to the design change - if 1 = D -, or facilities and tooling change - if 1 = F&T -,is:

Yk= x* R xE,k) C'/ 5 R,k) * C +
l=Dl=F&T
where, x; is the proportion of the current program's budget to be allocated to
satisfy PEi,
RPEi,k is the reuse degree to be achieved, at product level k, in terms of
design if 1 = D, in terms of facilities and tooling if 1 = F&T,
Ck is the cost, at product level k, of an all new design if 1 = D, or all
new facilities and tooling if 1 = F&T,
E = le - 9 is a constant used to avoid division by 0 when no change is
required by a product expectation.
Figure 5.9 displays the budget deployment through product levels for the example
considered in this chapter. Given the aggregated reuse level for the product (displayed in
figure 5.8), 41.8%, and the cost of all new design, facilities and tooling, $100,000, we can
compute the budget necessary to have a 100% achievement level of all product attributes:
(1 - 41.8%) * $100,000 = $58,200.
In most cases, the product program budget will be less than actually required to
develop the product. Therefore, the team will have to make trade-offs, do more reuse to
stay within budget, and achieve an affordable business structure generally enforced by
high level management. The next part addresses this issue, through an attempt to build a
more realistic approach with regard to design, facilities and tooling changes'
achievement. Nevertheless, this first analysis is sufficient and will provide the product
development team with guidance for allocating its budget to realize design, and
manufacturing systems' changes, in the case, senior management wants to achieve a
100% customer satisfaction on all product expectations.

Budget for program $ B =Budget for totally new program $ B =
$58,200$100,000
% Budget neccesary andrecommended for 100%
achievement of PEi
% Total Cost of all newDesign/F&T
Prioritizationof Product Expectations
SProduct Expectations
I- PE A2- PE B3-PEC
4- PE D[Reuse Level ($$)
Budget Allocation
/iTarget Achievement
Impact Level
Total System Architecture
% Change in product for100% achievement of PEi
% Reuse for 100%achievement of PEi
5.0% 20.01%
80% 40%
1.7% 20.6%
100% 100%
1 8.0%
810% 60%
17.2%
100% 100%
12.0% 30.11% 100.0%
20)% 20%
16.5% 41.2%
100% 100%
100.0%
25.0% 750%
57.6% 46.7%
100.0% 92.0%
100.0% 100.0%
93.6% 100.0%
51 2% 38 7%
0 01 0% 1000%
49.4% 50.6%
94.0% 6.0%
100.0% 1.11%
98.4% 1.6%
1 4 8% 58 2%
Overall Achievement of Programin terms of Design/F&T
Overall Achievement of Programin terms of Product Expectations1-0-0%/-
Figure 5.9 - Product planning matrix. Budget deployment through product levels. Case where the budget for the program is exactly
what is needed to achieve complete customer satisfaction on each PE - $58,200
Strong Positive
Positive
Negative
Strong Negative
0 90 3X-3
-9
86.9% 100%
10.3% 100%0.0% 100%
2.7% 100%
100.0%
100%
~ --- --
I c---------- .
I I I I I . .. .. i
512%. .7%41. .8% 582%
r

3- Achieving the best balance between reuse and innovation - Enhancing reusability
degrees to achieve affordability
The objective of any well-managed organization is to be investment efficient.
That is to say, minimize investment while optimizing customer value to achieve an
affordable product. Today, many product program teams are still costing product
alternatives that are not consistent with their investment targets, being sometimes
hundreds of millions of dollars over their investment target, but still not achieving 100%
of the product expectations achievement.
As stated before, the product planning matrix will help the team to minimize its
expenses, by systematically carrying over items that the product expectations do not
affect. However, this will not be sufficient in some cases, and the team will still need to
cut its expenditures. In such a case, it needs to increase its reusability degrees while still
trying to meet the product expectations, and therefore achieving a high customer
satisfaction level.
The team needs then to build a second product planning matrix where it tries to
eliminate the design, and manufacturing system' changes that have the lowest impact on
the overall achievement of the program in terms of product expectations - as defined
previously -, but which are costly. This will decrease the spending, keeping customer
satisfaction relatively close to its maximum level. In this matrix, the team should always
achieve 100% of its targets. A design, or manufacturing system change cannot be half
done. It is a go / no go policy.
3.1 Defining the reusability degrees which maximize the overall achievement
magnitude of the program for a given budget
When the budget for the product program is less than the budget required to
achieve a 100% customer satisfaction on PEs - $58,200 in the example - the product
development team should adjust the product-expectation-driven reusability degrees to
stay within the constraint of its affordability targets.
Several iterations might be necessary, before the team finds the best alternative. In
the example shown in figure 5.8, the product planning team, or product development
1 A manufacturing system is a set of machines, transportation elements, computers, storage buffers, andother items that are used together for manufacturing. People are also part of the system. Alternate terms arefactory, production system, production facility.

team would need $ 58,200 = 58.2% * $100,000 to entirely meet all product expectations.
It has only $50,000 that it must use such as to maximize customer satisfaction, definingachievable change degrees1 . Figure 5.10 displays one possible alternative of doing morereuse to stay within budget.
If it decides to reuse 60% of system 2 facilities and tooling, instead of a 20%reuse, it will stay within budget. Of course, the product expectation A achievement levelwill be affected as its impact on system 2 manufacturing systems was evaluated at 2/5(highly modified), whereas the team decided to make a change of type 4/5, using andadapting existing equipment. As a consequence the overall achievement level of theprogram in terms of product expectations will be not more than 88%; the same metricrelated to design, facilities and tooling being 85%, as shown in figure 5.10. The budgetnecessary for such a change would be 92.4% of the actual one.
Another alternative would be to make a change of type 4/5 for system 1manufacturing system changes, and a change of type 3/5 for system 2 manufacturingsystem changes. This would result in a higher overall achievement level of the program interms of product expectations (89% vs. 88%) and lower achievement in terms of design,and manufacturing changes as displayed in figure 5.11. The budget actually necessary toachieve these changes would be no more than 94.4% of the actual program's budget. Theteam can do several iterations until it finds the best alternative.
However the fastest way of finding the reuse degrees that achieve the highestprogram achievement magnitude would be to solve the following linear programmingproblem, where
1 Remember that the team should only plan for changes it can afford - which it can completely achieve.

Budget for program $ B =
Budget for totally new program $ B =
Yo% Budget required to meet the team 'schange level decision, by PE$50,000
$100,000
%Yo Total Cost of allnew Design/F&T
Prioritizationof Product Expectations
Product Expectations
I- PA A
2- PA B
3- PA C4- PA D
iReuse Level ($$)
IBudget Allocation% Team Targets Achievement
I% Program Targets Achievement
Impact Level
Total System Architecture
% Reuse driven by PEs(in )
5.0% 20.0%
80% 40%
2.0% 24.0%
100% 100%
100% 100%
8.0% 25.0%
80% 60%0
3.2% 20.0%
100% 100%
100% 100%
12.0% 30.0%
20% 60%"
19.2% 24.0%
100% 100%
100% 50%
100.0%
92.4%
25.0% 75.0%
57.6%
100.0%
100.0%
93.6%
51.2%
62.7%
92.0%
100.0%
100.0%54.7%
100.0%
61.4%0
94.0%0
100.0%
98.4%
53.8%
PEachievement
level
S4 Targets I Targets1 92.4%1/ ..... Targets]
77.2%
12.0%0.0%
3.2%
100%
100%
100%
100%
76%
100%
100%
100%
Overall Achievement of Programin terms of Design/F&T
Overall Achievement of Programin terms of Product Attributes 88%F 85%
Figure 5.10 - Adjusted product planning matrix, alternative #1. This matrix reflects the change degrees decided by the team, based on the ones driven by the product expectations,
and the available budget for the program. The team does more reuse than is dictated by the market to stay within budget
Strong Positive
Positive
Negative
Strong Negative
S9
() 3
X -3
-9
S
_ ~X~XrnI ------ ~----1 I I I I
I
I
4- PA D

Budget for program $ B =
Budget for totally new program $ B =
% Budget required to meet the team 'schange level decision, by PE$50,000
$100,000
-1 PAA
2- PA B
X 3-PAC
4- PA D
% Total Cost of allnew Design/F&T
Prioritizationof Product Expectations
Product Expectations I
i i -
Reuse Level ($$)
[Budget Allocation4% Team Targets Achievement ]
I% Program Targets Achievement
Impact Level
Total System Architecture
% Reuse driven by PEs(in $)
5.0% 20.0%
40%
2.0%
100%
24.0%
100%
100% 100%
8.0% 25.0%
10% 80%
3.2%
100%
10.0%
100%
100% 500/%
12.0% 30.0%
20% 40%
19.2% 36.0%
100% 100%
100% 75%
I 100.0%
94.4%
25 0% 75.0%
57 6%
100.0%0
100.0%
93.6%
51.2%
61.3%
92.0%
100.0%
100.0%
53.3%
100 0%
60.4%0
94.0%
100.0%
98.4%
52.8%'
PEachievement
level
Tea• I rogramTar4ets 40 Targets94.4%a T
79.2%
12.0%
0.0%
3.2%
100% 78%100% 100%100% 100%
100% 100%
Overall Achievement of Programin terms of Design/F&T
Overall Achievement of Programin terms of Product Attributes 89%80%0
Figure 5.11 - Adjusted product planning matrix , alternative #2. This matrix reflects the change degrees decided by the team, based on the ones driven by the product expectations,and the available budget for the program. The team does more reuse than is dictated by the market to stay within budget
Strong Positive
Positive
Negative
Strong Negative
@ 9
0 3
X -3
/ -9h
I !
40% 1 0 0--- ~- ~----~----
I
I
llMEWM2~
i j

imax Y[ (Ch * B)/(Ch * Bo) ]*wPERPEi =D,L=F&T
given Ch' =1- i(C *REi,k)/5
I=D,I=F&T
n
subject to, (Ch•E, Bo) < BIi=1
RE,,k Rk 5 for 1< k: m and 1< i n 2
where, RpEi,k is the reuse degree to be achieved, at product level k, in terms of
design if 1 = D, in terms of facilities and tooling if 1 = F&T, related
to satisfying product expectation i. It is the variable in this
optimization problem,
R° E, is the product change degree driven by product expectation PEi, as
computed in the previous section,
RIE, is the product change degree decided by team to meet PEi,
WPE, is the market-driven weight of product expectation PEi,
Bo is the aggregated cost of all new design, facilities and tooling,
B is the actual program's budget.
Ck is the normalized cost, at product level k, of an all new design if 1 =
D, or all new facilities and tooling if 1 = F&T,
n is the number of product expectation,
m is the number of product levels - that is one (for the total-system-
architecture) plus the number of systems plus the number of
subsystems.
1 This condition reflects the fact that we cannot spend in the design and manufacturing changes more thanthe budget we have.2 This means that we are going to do more reuse to stay within affordability.

In the example, the optimization problem would be:
{[Chl * $50000] / (50.6% * $100000) * 50%
max +[Ch * $50000] / (6% * $100000) * 30%RPEi I=DL=F&T L PEB
15k[n + [Chl *$50000] 1/(1.6% * $100000) * 5%PE D
given ThatCh =1- [(5% * RE,,1) / 5+ (8% * REi,2)/ 5+ (12% * RPE,3) / 5given That ChR = 1-F&T
PE' +(20% * RE, 1) / 5 + (25% * R9,, ) / 5 + (30% * R"E,) / 5
subject to, (ChiE A + ChIE BChIE C + ChE D) * $100,000 $50,000
RO Ek R1Ei,k 5
which can be solved using a linear programming computer solver .
It is important to keep in mind that the money required to achieve the change
degree decided by the team for each product expectation, corresponds to the actual money
which will be allocated to meet this change degree. The team should not take into account
design and manufacturing change alternatives which would make the necessary budget to
actually realize them greater than the budget it has, or it expects to be given - which is
reflected by the first constraint in the linear programming optimization problem.
As displayed in the example presented in figure 5.9, the achievement level of the
team targeted changes should always be 100%. However, the aggregated number shown
in the %-budget-required-to-meet-the-team's change-degree-decision column must be
less than 100% if we want to stay within affordability.
3.2- Defining the cost of a targeted overall achievement magnitude
In most cases, the team will target a certain overall achievement magnitude for theproduct expectations; and will then try to define the design, facilities and tooling changedegrees which achieve this magnitude at a minimum cost.
The approach described in the previous example is easier from a computationalpoint of view - given a certain budget it is easier to determine the change degrees whichmaximizes the overall achievement of the program in terms of product expectations.
1 Many softwares for solving optimization problems are available in the market.

Therefore, we will use the tabulation technique, which consists of finding the
optimal1 change degrees for extreme values of the budget. We will then iterate, trying to
narrow the interval from which the value of the budget is chosen, until we determine the
exact value of the budget which corresponds to the targeted overall achievement
magnitude. At this point the team would know what the minimum cost for achieving a
given customer satisfaction magnitude is.
In the example, we can try to evaluate the minimum cost of achieving a 90%
achievement level. If the budget were $50,000, the achievement magnitude in terms of
PEs would be 89%. If it were $51,000, it would be 91%. Therefore, the minimum cost for
achieving 90% customer satisfaction is approximately $50,500.
4- Balancing investment costs with production costs, and sales volumes
The Product Planning Matrix should provide product planners with a powerful
tool to achieve the highest customer satisfaction level for a minimal investment in design,
facilities and tooling. This will be done through a systematic reuse of systems that are not
affected by customer requirements or regulatory requirements - thus eliminating none
market-driven changes -; but also, through an optimal allocation of resources to the
design and manufacturing changes that have the highest impact on the achievement
magnitude of customer satisfaction, and corporate goals. It will also help the platform
planning teams to better share their investments across product-lines through systematic
commonization of systems, facilities and tooling that are not affected by product
expectations.
However other constraints - than investment - need to be taken into account
before making final investment decisions, such as the production cost, and the sales
volume. A low investment (with a high degree of reuse) might not be the best option,
especially if a higher investment results in a lower variable cost, or a higher quality
product, which is usually associated with higher sales volumes. Moreover, as lower
investment entails lower customer satisfaction, it might affect the sales volume.
This suggests that it is necessary to take into account all parameters related to the
full product cost, and the net present value of the project before making a final decision
related to design and manufacturing investment.
1 Which maximizes the overall achievement of the program in terms of product expectations.

The next chapter presents a two phase approach to analyzing the economic value
of a product program. This will help the platform team to choose between alternativedesign, facilities and tooling alternatives.


Chapter VI - Economic Analysis
During a product development process, a team has to make several decisions that
can affect the future profitability of the product:
- What magnitude of customer satisfaction should be targeted: 80% with a low
product price, or 100% with a high product price? How would this affect sales
volumes, and after-sales-service (warranty costs...)?
- How much should we spend in design and manufacturing investment? What
reuse degrees should be targeted at each product level? How would this affect
the production cost?
- How the team's decisions will affect the full product cost, the operating income
of the business unit, and the net present value of the program?
The team will inevitably face dilemmas and will need to make prompt decisions.
A deep understanding of interrelationships between the cost and revenue drivers as well
as a detailed accounting of estimated costs, and revenues will help the product
development team to make the right decision when facing many alternatives. Especially
when dealing with reusability, the team needs to assess the financial consequences of
each of the alternatives, so that it can adopt the most beneficial option.
This chapter presents:
- An attempt to understand the interrelationships existing between investment
costs, customer satisfaction, sales forecasts, marketing costs, and productioncosts.

- A comparison of a traditional and misleading job costing system to the activity-
based costing system, which enables the company to better allocate expenditures
to products.
- A costing approach to compute product costs, and profit margins; and to help the
product development team to assess how its decisions affect the product cost and
the profit per unit given the market price.
- A financial model to compute the net present value (NPV) of a product program,
which will help the PDT to assess how its the decisions affect the NPV.
If we spend 10% more in design, or if we reuse an overdesigned1 system instead
of building a new one, etc., how would that affect the cost of our product, our profit
margin, our market share, our operating income, the NPV of our project?
1- Costs and revenues inter-dependencies
It is of critical importance to understand how our investment decisions affect
other costs, and sales revenues through customer satisfaction. In the previous chapter, a
model was presented which depicts how investment decisions affect customer
satisfaction. We need to go one step further and define how sales volumes relate to the
customer satisfaction magnitude.
A very simple model is a linear model in which one assumes that the customersatisfaction - as defined in the previous chapter - and sales volumes are linearly
correlated. Another approach would be to use a regression analysis based on past data, to
determine how sales and customer satisfaction relate to each other. This relationship is
beyond the scope of this thesis.
The product development team should also take into account variable costs inmaking investment decisions. A standard procedure consists of a systematic evaluation of
the production costs associated with a given investment scenario.
This will help the team focus on investment scenarios that are consistent with thecorporate goals and the affordability targets.
1 Which fulfills more functional requirements than demanded.

2- Activity-based costing vs. traditional job costing
Before any economic analysis can be performed, we need to verify the validity of the
models used to compute our product related costs - production costs, marketing costs,distribution costs... It is clear that if our evaluation of the expenses per product is
defective, the economic analysis and profitability study that follow will be entirely
erroneous.
The overall purpose of accounting is two-fold: first, to ascertain how much it costs the
enterprise to provide products and services to its customers, and second, to determine
how much the company gains in profit from these endeavors. In fact, any flaw in the set
of assumptions that govern these two assessments can have serious repercussions for the
enterprise.
2.1- When traditional job costing fails
Job costing is a costing system where the cost of a product is obtained by
assigning costs to a distinct, identifiable product. This costing system has two majorcharacteristics:
- Overhead is aggregated into large pools.
- Overhead is allocated to jobs1 based on a volume-related driver such as direct labor.
The general approach to Job Costing consists of 5 steps:
- Step 1: Identify the job that is the chosen cost object2 .
- Step 2: Identify the direct cost categories for the job.
- Step 3: Identify the indirect cost pools associated with the job.
- Step 4: Select the cost allocation base to use in assigning each indirect cost pool to thejob.
- Step 5 : Develop the rate per unit of the cost allocation base used to allocate indirect
costs to the job.
The most common job costing system consists of two pools for direct costs -materials cost and labor cost -, and a unique large pool for indirect costs - so calledoverhead costs. The indirect cost allocation base is the labor-hour. This accountingsystem demonstrated its performance in an era of labor intensive products (where laboraccounted for 75 to 95% of total cost). Today cost patterns have changed significantly
1 Jobs are identifiable units or small batches of reasonably homogeneous products.2 A cost object is anything for which a separate measurement of costs is desired.

due to new product and production technologies, and the labor contribution to the total
cost is generally below 10%. In companies where overhead is still allocated on the basis
of labor hours, the accounting departments continue to expend significant time and
energy to track labor elements that have become increasingly of secondary importance,
and more misleading than anything else. It is important to keep in mind that even if the
overhead allocation-base was the machine-hour (as we moved from a labor-paced to a
machine-paced environment), the job costing system would still fail.
Today, the job costing approach fails for many reasons: technological changes
which have greatly reduced the importance of direct labor, product variety as volume-
based drivers do not capture changes in overhead consumption, large size and
heterogeneity of cost pools... Many companies still take irrelevant decisions in terms of
investment and production because of a misleading accounting system. And any company
committed to the path of world-class products, still using these systems, may get a
distorted and misleading picture of its present performance, challenges, and improvement
options.
Following are some of the symptoms of an outdated cost system:
- The outcome of bids is difficult to explain.
- Competitors' prices appear unrealistically low.
- Products that are difficult to produce show high profits.
- Operational managers want to drop products that appear profitable.
- The company has a highly profitable niche all to itself.
- Some departments use their own accounting system
- Product costs change as financial reporting regulations do.
It is of critical importance to the company to have a relevant measurement of the
way jobs, products, services, and customers differentially use the resources of the
organization. These changes can require additional direct cost tracing, or more indirect
cost pools.
2.2- Activity-based costing
Activity-based costing (ABC) is a costing system that focuses on activities as the
fundamental cost objects. It uses the cost of these activities as the basis for assigning
costs to other objects such as products and services. ABC can be characterized as follows:
- Cost pools are identified by activities.

- Activities are characterized by overhead cost hierarchy (figure 6.1).
- It has a sophisticated identification of cost drivers, which are related to activities
There are many advantages to the ABC approach. The use of non-unit causal
drivers provide more accurate product costs for decision making. An analysis of causal
drivers using an ABC approach gives companies a better understanding of the economicsof the production process. This information can be used to focus improvement projects onthe non-value-added activities that drive many costs (e.g. machine set ups, productcomplexity). The overhead hierarchy can provide useful information on the avoidable andunavoidable costs for a given decision.
In the next sections, we describe a quantitative approach for economic analysis ofa product program, which can support the product development team by showing thefinancial impact of their decisions on the profitability of the product. This economicanalysis can also support the reusability decision-making process by answering suchquestions as (1) how much reuse should we target to hit our target cost and achieve ourtargeted profit margin and (2) what is an optimal net present value for the program?

ACTIVITIES
Facility-Sustaining
Activities*
Product-Sustaining
Activities
EXPENSES
Plant ManagementBuilding & GroundsHeating & Lighting
Process EngineeringProduct Specifications
Engineering Change NoticesProduct Enhancement
SetupsMaterial Movements
Purchase OrdersInspection
Batch-Level 4
Activities 4
Unit-Level --
Activities -4
Figure 6.1 - The hierarchy of factory operating expenses (Cooper and Kaplan, "Profit Priorities from Activity Based Costing". 1991)
* = If plant makes more than one product, this expense is allocated on the basis of value added.
Direct LaborMaterials
Machine CostsEnergy

3- Target costingL - Proactive costing for a better decision-making process
After the team has defined several scenarios, it needs to choose the ones whichwill most benefit the company, ensuring the targeted operating income and the desiredprogram net present value. The first step is to assess the market price for the product to besold, which will later become the target price. The target price is the estimated pricepotential customers will be willing to pay for a product. This estimate is based on anunderstanding of the customer-perceived value for a product and the responses ofcompetitors. The target cost is the estimated long-run cost of a product that when soldenables the company to achieve the targeted income. Target cost is derived by subtractingthe target profit margin from the target price.
To achieve its target cost, the company often has to improve its design, andproduction processes, or lower its spending - through reusability for instance. Today,many worldwide companies use this approach to better assess the financial implicationsof their investment decisions, and better consolidate their positioning in the market.
3.1- Target costing process
Developing target prices and target costs requires the following iterative steps:
Step 1: Develop a product that will satisfy the customer needs, and corporate musts.Quality Function Deployment can be of great benefit in designing such a product.
Step 2: Identify a target price based on:(i) Customers' perceived value for the product, and(ii) Potential competitors' prices.
In this case a deep market research should be done. Competitive benchmarkingmight also be of great benefit in defining the target price.
Step 3: Derive a target cost by subtracting the desired profit margin from target price.
Step 4: Perform value engineering 2 and consider several investment scenarios whichmight be consistent with the target costs. Reusability is a strategic enabler fromthat perspective.
1 Target costing is an important form of market-based pricing. The market-based approach always starts byasking, "Given what our customers want and how our competitors will react to what we do, what priceshould we charge?".2 Value engineering is a systematic evaluation of all aspects of research and development, design ofproducts and processes, production, marketing, distribution, and customer service, with the objective ofreducing costs while satisfying customer needs.
Two key cost-related concepts important in value engineering are cost incurrence,
and locked-in costs. Successful value engineering requires drawing a careful
distinction between when costs are incurred and when costs are locked in.
Step 5: If target cost is achieved for one of the investment alternatives, select scenario.
Otherwise refine product design and begin again at step 1.
3.2- Cost incurrence and locked-in costs
Cost incurrence occurs when resources are actually utilized. Cost systems
recognize and record costs only when cost are incurred.
Locked-in costs are those costs that have not yet been incurred, but that will be
incurred in the future on the basis of decisions that have already been made.
It is very important to distinguish between these two types of costs. It is always
difficult to reduce costs that have already been locked-in. Figure 6.21 displays a typical
pattern of cost incurrence and locked-in costs for a standard manufactured product. The
point of the graph is to emphasize the wide divergence between when costs are locked in
and when those costs are incurred. Most costs are locked in well before they are actually
incurred. Likewise, once design is set, costs are difficult to influence. Therefore, most of
the scope for cost reduction is in the design phase:
- Better designs reduce scrap, rework, customer service, and warranty costs.
- Simpler designs reduce direct labor and machine hours and testing and
inspection costs
- Using fewer parts reduces ordering and handling costs...
From such a perspective, reusability is a strategic enabler. While focusing the
development team on critical issues related to customer wants, it helps improving existing
designs and building on the work done before, making the best benefit from corporate
experience.
1 Horngren, Foster, and Datar. 1994. Cost Accounting - A Managerial Emphasis. Englewood Cliffs:Prentice Hall

Cumulative Costner Unit of Product
Locked-in Cost Curve
Incurrence Curve
Figure 6.2 - Standard pattern of cost incurrence and locked-in costs
3.3- Product profitability evaluation - Example
There are several basic cash inflows and cash outflows in the life cycle of a
product. Cash inflows come from product sales. Cash outflows include spending on
research and development - or advanced engineering; design and manufacturing
investment costs; marketing costs; distribution costs; and customer-service costs; and the
cost of goods sold that are the ongoing production costs such as raw materials, labor, and
overhead.
A product is profitable if it generates more cumulative inflows than cumulative
outflows. When developing a product, the team must think its decisions in terms of how it
affects the unit cost, and the profit margin per unit; it must also take into account the
overall profitability of the program over its life-cycle - as will be presented in part 2 -,and other external constraints such as competition (a capital expenditure might not have a
payback within two or three years, but it still may be necessary so as not to fall behind
industry sometime later).
it- . . .

Figure 6.3 depicts how revenue, full product costs, and operating income relate to
each other. It is important to keep in mind that the unit price is market-driven; therefore it
is given when the product program is first initiated. The desired margin is also defined as
a corporate requirement for the program by high level managers. At this point, the cost of
goods sold, and the operating costs are the only profit drivers the team can influence.
Consider product X', the new generation of product X. The company (Abyss)
producing X, very concerned about severe price competition, decides to design a new
version of its product to consolidate its position in the market. Abyss' management
believes it must respond aggressively by reducing its actual price by 20% (from $200 to
$160), as the competition is targeting a 15% reduction in its price. Management also
wants a 15% target operating income on sales revenue. The marketing manager forecasts
an increase of annual sales from 400,000 to 600,000 units resulting from price reduction.
Therefore,
Total target sales revenue = $160 * 600,000 = $96 million.
Total target operating income = 15% * $96 million = $14.4 million.
Target operating income per unit = $14.4 million / 600,000 units = $24 per unit.
Target cost per unit = Target price - Target operating income per unit = $160 - $24 =
$136.
Total current operating cost for product X = $ 75,000,000.
Current operating costs per unit of X = $75,000,000 / 400,000 = $188 per unit.
In designing the new version of product X, the team should focus its resources on
the features that are the most valuable to the customer, and carry over any systemi or
manufacturing process that is not conflicting with customer requirements. A drastic
reduction of design, and manufacturing investment can help the team to reduce the full
product costs very efficiently; as is displayed in figure 6.3, which shows how reusability
of existing designs and manufacturing processes can help in achieving the target cost (this
reflected by research and development, and design and manufacturing cost reduction).
1 Target costing often causes designers to favor lower-priced new systems, or parts, over existing parts thatmay be slightly more expensive. Other costs associated with the requirements of new systems, or parts,more processes, more support tasks, numbers of parts, and expected inventory turns are rarely considered.

Product X
Revenue
Cost of goods sold
Direct materials costs
Direct manufacturing labor costs
Direct machining costs
Manufacturing overhead costs
Ordering, shipping, and handling costs
Testing, inspection, and rework costs
Administrative cost
Total cost of goods sold
Operating costs
Research and Development costs
Product, and process design costs
Marketing costs
Distribution costs
Customer-service costs
Total Operating costs
Full Product costs
Operating income
Total Revenue and Costs
for 400,000 units of X sold
A
$80,000,000
$25,000,000
$5,000,000
$6,000,000
$1,000,000
$800,000
$1,200,000
$39,000,000
$5,000,000
$20,000,000
$6,000,000
$2,000,000
$3,000,000
$36,000,000
$75,000,000
$5,000,000
Unit Revenue
and Unit Costs
B = A /400,000
$160.00
$62.50
$12.50
$15.00
$0.00
$2.50
$2.00
$3.00
$97.50
$0.00
$12.50
$50.00
$15.00
$5.00
$7.50
$90.00
$187.50
$12.50
Total Revenue and Target Costs
for 600,000 units of X' to be sold
A'
$96,000,000
$35,000,000
$7,000,000
$8,000,000
$1,000,000
$1,000,000
$1,300,000
$53,300,000
$3,300,000
$10,000,000
$8,000,000
$3,000,000
$4,000,000
$28,300,000
$81,600,000
$14,400,000
Cost reduction achievement level 100%
Desired operating income achievement level 100%
Figure 6.3 - Product profitability of X'. Targets achievement level. Note that X' is the next generational model of product X.
The numbers in the first two columns of the table are actual numbers. The ones in the last two columns are estimates.
As displayed in this table, a drastic reduction of design, and manufacturing investment
can help the team to reduce the full product cost significantly
Unit Revenue
and Unit Costs
B' = A' / 600,000
$160.00
$58.33
$11.67
$13.33
$1.67
$1.67
$2.17
$88.83
$5.50
$16.67
$13.33
$5.00
$6.67
$47.17
$136.00
$24.00
Product X'
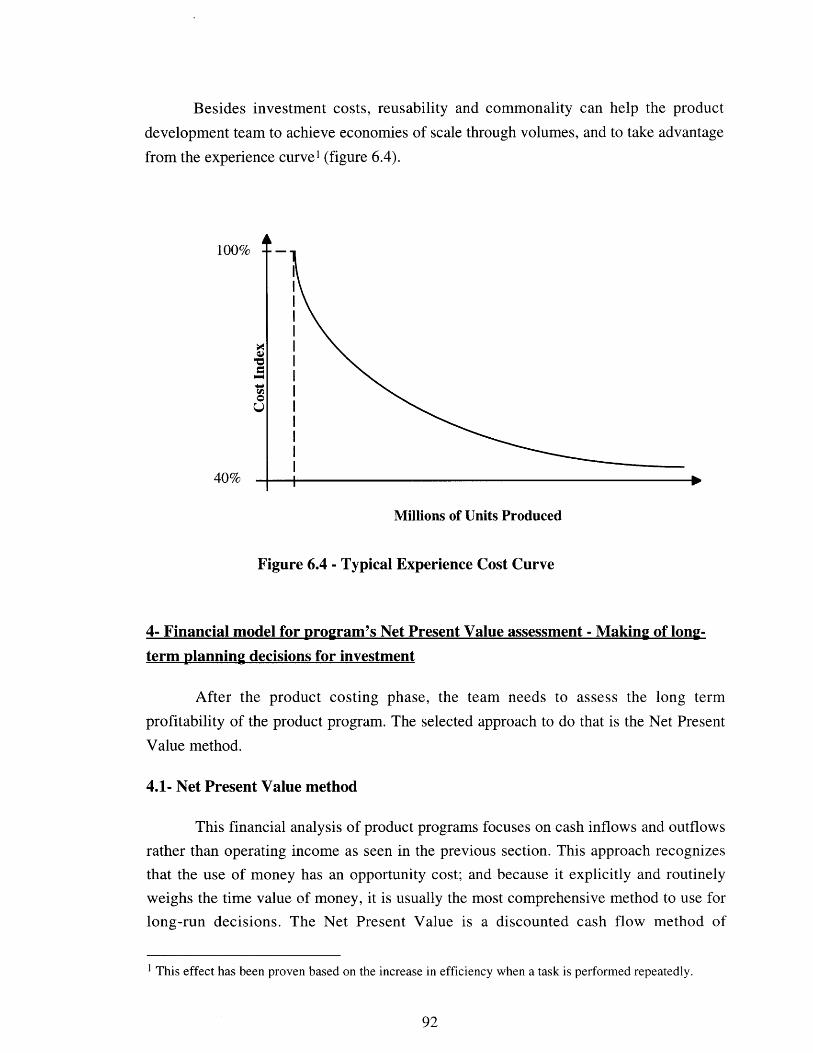
Besides investment costs, reusability and commonality can help the product
development team to achieve economies of scale through volumes, and to take advantage
from the experience curve' (figure 6.4).
100%
0
40%
Millions of Units Produced
Figure 6.4 - Typical Experience Cost Curve
4- Financial model for program's Net Present Value assessment - Making of long-
term planning decisions for investment
After the product costing phase, the team needs to assess the long term
profitability of the product program. The selected approach to do that is the Net Present
Value method.
4.1- Net Present Value method
This financial analysis of product programs focuses on cash inflows and outflows
rather than operating income as seen in the previous section. This approach recognizes
that the use of money has an opportunity cost; and because it explicitly and routinely
weighs the time value of money, it is usually the most comprehensive method to use for
long-run decisions. The Net Present Value is a discounted cash flow method of
1 This effect has been proven based on the increase in efficiency when a task is performed repeatedly.
-

calculating the expected net monetary gain or loss from a project by discounting all
expected future cash inflows and outflows to the present point in time, using theappropriate rate of return1. A product program is acceptable if its net present value is
positive; which means that the return from this project exceeds the cost of capital1
It is of critical importance to assess the net present value of the project
periodically, by quarter for instance; and verify that cash outflows are spread enough tobe supported by the company.
The analysis can be conducted in four steps:
Step 1: Draw a sketch of relevant cash inflows and cash outflows from the
time the program starts, until production stops.
Step 2: Compute each periods cash flow adding cash inflows to cash outflows.
Step 3: Choose the appropriate rate of return, and compute the present valueof each period's cash flow.
Step 4: Sum the present values to determine the net present value.
4.2- Manufacturing example
The basic categories of cash flows for a typical product program are:
- Research and development cost (new technologies' development, advancedengineering)
- Design and manufacturing investment costs
- Production cost, also called cost of goods sold (direct costs, and indirect costs)- Marketing cost (launch cost, promotion costs)- Distribution cost
- Customer-service cost
- Sales revenue
- Tax expenses
- Miscellaneous inflows and outflows (working capital, cannibalization, salvagecost...).
The numerical values of the cash flows come from budgets and other estimatesobtained from the multifunctional product development team. The financial estimates
1 The minimum return that the company could expect to receive elsewhere for an investment of comparablerisk.

must be merged with timing information. This can be done considering the project
schedule and sales forecast.
Let us consider an example to illustrate the net-present-value financial analysis.
Product X' has the following estimated budgets, production costs, and sales volume
forecasts:
Type of cash flow Product X' (estimate) Product X (actual)
- Research and development (R&D): $3.3 million
- Design and manufacturing investment cost:$10 million
- Production cost: $53.3 million
- Marketing cost: $8 million
- Distribution cost: $3 million
- Customer-service cost: $4 million
- Sales volume 600,000 units
- Target price $160/Unit
- Target cost $136/Unit
Let us assume that the schedule from the
the following:
$5 million
$20 million
$39 million
$6 million
$2 million
$3 million
400,000 units
$200/Unit
$187.50/Unit
inception through market withdrawal is
- Research and development: 3 quarters
- Design and manufacturing investment: 5 quarters
- Marketing: 11 quarters
- Distribution and customer-service: 10 quarters
- Production and sales window: 10 quarters.
The timing and magnitude of the cash flows is estimated by merging the project
schedule with the program budget, the estimated production costs, and sales revenues.
The level of detail should be relevant to the type of decision to be made. If a more precise
analysis is required, the major cash flows presented above may be broken down into their
sub-levels (production cost into direct and indirect costs for instance). The level of detail
of cash flows should be coarse enough to be convenient to work with, yet it should
contain enough information to permit effective decision making. A project cash flow
table - whose columns are successive time periods, and whose rows are the different cash
flow categories - can be used to compute the NPV of a product program. The rate of cash
flows can be arranged in any way that best represents the team's forecast of the cash
flows. It is important to keep in mind that future cash inflows must be discounted by the

appropriate rate of return. Figure 6.5 presents the cash flow table of the exampleconsidered in this chapter.
The period cash flow for a given period is the sum of inflows and outflows duringthat same period. For instance, for the first quarter of year 3 (shaded area in figure 6.5),the period cash flow is:
Marketing cost ($727,000)Distribution cost ($300,000)Customer service cost ($400,000)
Production cost ($5,300,000)
Sales revenue $9,600.000
Period cash flow $2,873,000
The present value of this cash flow discounted at 10% per year (2.5% per quarter)back to the first quarter of year 1 (a total of 8 quarters) is: $2,8730,000 / (1 + 0.025)A8 =$2,358,000.
The project Net Present Value (NPV) is simply the sum of the discounted cashflows for each period - that is $8,770,000. The expected NPV of the product programshows whether or not the program is profitable in the long run.
This model can support major investment decisions. Say for instance thatcompany X were deciding between two production facilities requiring differentmanufacturing investments, and production costs (the first option being to reuse anexisting facility, or to build a new one which would have lower production costs). Theycould run such a model for both scenarios, and choose the one with the best NPV. Otherfactors need to be taken into account, such as operating income, price per unit, cost perunit.

Timeline Year I Year 2 Year 3 Year 4 Year 5
Cash Flows Q Q2 Q3 Q4 Q 1 Q2 Q3 Q4 Q1 Q2 Q3 Q4 IQI Q2 Q3 Q4 IQ
Research and Development cost ($1,10oo) ($1,100) ($1,100)
Design and manufacturing investment cost ($2,000) ($2,000) ($2,000) ($2,000) ($2,000)Marketing cost ($727) ($727) ($727) ($727) ($727) ($727) ($727) ($727) ($727) ($727) ($727)
Distribution cost ($300) ($300) ($300) ($300) ($300) ($300) ($300) ($300) ($300) ($300)
Customer-service cost ($400) ($400) ($400) ($400) ($400) ($400) ($400) ($400) ($400) ($400)
Production volume 60,000 60,000 60,000 60,000 60,000 60,000 60,000 60,000 60,000 60,000
Unit production cost $-88.8/u $-88.8/u $-88.8/u $-88.8/u $-88.8/u $-88.8/u $-88.8/u $-88.8/u $-88.8/u $-88.8/u
Production cost ($5,300) ($5,300) ($5,300) ($5,300) ($5,300) ($5,300) ($5,300) ($5,300) ($5,300) ($5,300)
Sales volume 60,000 60,000 60,000 60,000 60,000 60,000 60,000 60,000 60,000 60,000
Unit target price $160/u $160/u $160/u $160/u $160/u $160/u $160/u $160/u $160/u $160/u
Sales revenue $9,600 $9,600 $9,600 $9,600 $9,600 $9,600 $9,600 $9,600 $9,600 $9,600
Period Cash Flows ($1,100) ($1,100) ($3,100) ($2,000) ($2,000) ($2,000) ($2,727) $2,873 $2,873 $2,873 $2,873 $2,873 $2,873 $2,873 $2,873 $2,873 $2,873
Present Value Year 1, r=10% ($1,100) ($1,073) ($2,951) ($1,857) ($1,812) ($1,768) ($2,351) $2,417 $2,358 $2,300 $2,244 $2,190 $2,136 $2,084 $2,033 $1,984 $1,935
Project NPV $8,770
Figure 6.5 - Cash flow table example ($ values in thousands). This table displays the expected net monetary gain or loss from a project
by discounting all expected future cash flows and inflows to the present point in time. This analysis will help the product
planners to better assess the long term profitability of a product program

5- Sensitivity analysis for making better trade-offs
Sensitivity analysis is a "what-if' technique that examines how a result will
change if the original predicted data are not achieved, or if an underlying assumption
changes. It provides an immediate measure of the financial effect of differences between
forecasts and actual outcomes. Therefore, it helps managers to focus on those decisions
that may be very sensitive, and eases their mind about decisions that are not so sensitive.
In the context of manufacturing, the objective is to measure the change in the full
product cost, the operating income, and the NPV of the program corresponding to
changes in the factors included in the model. Internal factors are those over which the
development team has a large degree of influence (market research expenses,
development cost, development time, production cost, product performance and
quality...). External factors are those that are not directly controlled by the team (product
price, sales volume, competition, suppliers...).
Sensitivity analysis can take various forms. For instance, management may want
to know how far cash inflows must fall to reach the point of indifference for the NPV of
the project - NPV = 0, or by how much we need to cut investments to achieve our target
cost, and how this would affect sales volumes.
They might be interested in determining how development cost variations affect
the NPV of the project, the full product cost, or the operating income. By making
incremental changes to development cost (research and development investment + design
and manufacturing investment) while holding other factors constant, we can see the
incremental impact on the project NPV, the full product cost, and the operating income
(figure 6.6) 1 .
This type of analysis shows how critical reusability is from a cost reduction stand
point, and how reusability decisions can affect the profitability of a product through
investment cost reduction.
We can also evaluate the impact of an increase in development time - which
delays the start of the production ramp-up, and therefore product sales - on the NPV ofthe project. If we assume for instance that there is a fixed window for sales, an increase ofthe development time will clearly decrease the NPV of the project, other factors being
1 Note that computer spreadsheets enable managers to conduct systematic, efficient sensitivity analysis.

constant. Reusability can be once again a strategic enabler in development time reduction,
and therefore a major source of profit.
Figure 6.6 - Development cost sensitivities
Production costs can also be decreased through reusability, making the best profit
through the reuse of existing stable processes, and exploitation of the positioning in the
experience curve. Sensitivity analysis can help to prove such advantages, and therefore
provide managers with guidance in their decision making process.
However, interdependencies across cost pools make the sensitivity analysis
sometimes more complex, as a change in a given cost pool might affect other cost pools
(if the development cost increases by 10%, the sales volume will probably decrease as the
cost of the product increases). In this case, several scenarios should be evaluated.
Change in Development
Development Cost, Change in Product Cost, Change in Operating Inc., Change in NPV,
Cost, % $Thousands Product cost, % $ Operating Inc., % $Thousands NPV, % $Thousands
50 19950 8.1% $147.1 -46.2% $7,750 -70.0% $2,627
20 15960 3.3% $140.4 -18.5% $11,740 -28.0% $6,313
10 14630 1.6% $138.2 -9.2% $13,070 -14.0% $7,542
base 13,300 0.0% $136.0 0.0% $14,400 0.0% $8,770
-10 11970 -1.6% $133.8 9.2% $15,730 14.0% $9,999
-20 10640 -3.3% $131.6 18.5% $17,060 28.0% $11,227
-50 6650 -8.1% $124.9 46.2% $21,050 70.0% $14.913

6- Dealing with uncertainty
Managers make predictions and decisions in an environment that is not
deterministic. Rather, it is probabilistic, and surrounded with uncertainty. This section
describes a systematic approach to risk assessment and dealing with uncertainty when
making forecasts for sales volumes or market prices. It helps managers to deal with the
uncertainty surrounding the outcome related to some investment decision - how would
sales volumes be affected if the development cost is increased by 10%? Would a 5%
increase of the investment ensure a better operating income?
Decision analysis structures the problem to bring out all the relevant choices, as
well as all the possible outcomes that can be imagined. The means for doing this is the
decision tree. It is a conceptual device for enumerating each of the possible decisions that
can be made, and each of the possible outcomes that may occur according to each of the
events that may arise. Thus, we have:
* An objective function which provides a basis for choosing the best alternative action.
Maximize the net present value of the product program in the example.
* A set of possible decisions or actions, Di.
D1 = spend 10% more in product development for quality improvement.
D2 = spend 20% more in product development for quality improvement.
* A set of relevant events, Ej, which should be mutually exclusive and collectively
exhaustive.
El = Sales volume increase up to 650,000 units
E2 = Sales volume increase up to 750,000 units
* A set of probabilities, where a probability is the likelihood of occurrence of an event.
If D1 P(E1) = 0.7 If D2 P(E1) = 0.4
P(E2) = 0.3 P(E2) = 0.6
* A set of possible outcomes Oij that result from having chosen Di and being subject toEj1
1 The application of decision analysis to situations involving continuous probability distributions, and aninfinite number of possible outcomes is essentially identical to the procedure just described. The onlydifference is that we must use integrals to evaluate the expected values.

Using and updating the table in figure 6.5, we see that the net present value of the
product program considered, for each of the alternative decisions and relevant
events, is:
NPV(O11) = $13.6 million
NPV(O12) = $25.7 million
NPV(021) = $12.4 million
NPV(O22) = $24.4 million
The optimal decision is the one with the best expected value for the outcomes.
The expected value for each possible decision is easily calculated. It is simply the
probabilistic average of the possible outcomes resulting from a given decision' :
EV(D,) = P(Ej). Oij. In the example, the expected net present value of each decision isI
computed as follows:
EV(D,) = 0.7 * (13.6) + 0.3 * (25.7) = $17.2 million
EV(D2) = 0.4 *(12.4)+ 0.6 *(24.4) = $19.6 million
To maximize the net present value of the product program, we need to invest 20%
more in product development. The decision tree (figure 6.7) illustrates the decision
analysis process.
Decision analysis helps management and decision makers:
- By structuring the problem to bring into focus the real range of risk and options.
- By defining an optimal choice when several alternatives are to be considered.
1 In the case of an infinite number of events, and a continuous probability distribution for the events, the
expected value of each decision is EV(Di) =f 0O. f(Ej)dEj, where f is the probability distribution of
the events.
100

Decisions Outcome Probabilityof events
Sales = 650,000 units
Decision 1 .1 Sales =750,000 units
Sales = 650,000 units
Decision 2
Sales = 750,000 units
$ 13,6 million
$ 25.7 million
$ 12.4 million
$ 24.4 million
$ 9.5 million
$ 7.7 million
$ 17.2 million
$ 5.0 million
$ 14.6 million
$ 19.6 million
DI = Pay $17.2 millionD2 = Pay $ 19.6 million
Figure 6.7 - Decision-Tree
101
Expected NetPresent Value
5 = 3*4
Events

102

Chapter VII - Strategic Reusability Planning andManagement Process
Manufacturing companies face today unique challenges stemming from a more
complex and volatile demand than ever. Henceforth, markets are driven by three major
forces: rising product value, falling prices, and a growing demand for customized
products. Understanding these constraints is the starting point in developing a successful
product strategy which is the most important determinant of success for manufacturing
companies.
Ideally we would like to provide each customer with exactly what he wants, with
no time constraint at a competitive price. Disciplined reusability along with integrated
technology, product and manufacturing strategies can help product planners to achieve
such an ideal. Reusability , as described in the first chapter, is a strategic enabler in
supporting breakthrough efforts for achieving affordable customer-perceived variety and
freshness along with investment efficiency, design and manufacturing cost reduction,
development time reduction and quality improvement. This chapter consists of an
integration of the strategic reusability planning and management tools into a product
strategy framework1 . We have tried in this section to address what we consider as being
the key questions for the Product Development Team:
- How many new products ?
- How new is each product ?
1 Schnabel [1996] developed a step by step approach for implementing reusability in platform planning. Inthis chapter, we have built a more simplistic and analytical process for planning and implementing strategicreusability.
103

- How are the products grouped into platforms ?
I- From strategic vision to platform concepts pre-definition
1.1- Defining the corporate strategic vision
Henry Ford envisioned a process that would put a car in every garage, Bill Gates
saw better than anyone else that the explosion in microprocessors would create a vast
array of opportunities for computer software. However, Ampex Corporation, which
invented the video tape recorder in 1956, and that became a big success with broadcasting
companies eventually, failed to identify the possibilities for the VTR in the consumer
market. Hence, it lost the opportunity to be a key player in the multi-billion dollar
consumer VCR market.
Step 1 - Define the strategic vision
Product strategy begins with a clear strategic vision which provides the context
and direction for product strategy. It guides the product development team by telling the
team members where the company is going, how to get there, and why the company will
be successful. Any company with long term objectives must have a strategic vision.
However, the issue is not to have a strategic vision, rather it is to define a strategic vision
that will lead the company towards success.
Keeping in mind the purpose of the strategic vision helps in defining a successful
path for any company. Its intent is five fold:
- Focus the efforts of those responsible for identifying new platform/product
opportunities, and help them to select platform/product development options that
are consistent with the company's strengths. The business integration model
introduced in chapter 2 will further enforce this purpose.
- Establish a framework for platform strategy. It helps in defining the nature, timing
and competitive positioning of product platforms.
- Guide product development activities. A clear strategic vision helps align product
development activities in a common direction, which helps product development
teams share activities, design, facilities and tooling costs across similar projects.
- Provide general direction for core competency and technology development.
104

- Set high level expectations for customers, employees, and investors which will
help the company achieve its vision
Besides, a strategic vision must be simple to share, manage, and implement; sustainable
for the foreseeable future; and innovative, identifying needs that have not yet emerged.
Responsibility for strategic vision rests clearly with the CEO or head of the
business unit. In the case of a large diversified company, trying to develop a strategic
vision at the corporate level might be ineffective. Rather, a specific vision should be
developed for each business unit. McGrath [1995] has summarized the characteristics of
the major types of strategic visions, ranging from Blind to Foresighted.
1.2- Analyzing the external environment
Step 2 - Build Porter's Five Forces Model
One way to scan and organize information about the external environment of a
company that shows us the potential attractiveness of its potential markets is the Five
Forces Model developed by Michael Porter1 , described in figure 7.1.
POTENTIALENTRANTS
Threats ofnew entrants
Bargaining powerof suppliers
SUPPLIERS
INDUSTRYCOMPETITOR
Rivalry amongexisting firms
Threat of substituteproducts or services
SUBSTITUTES
Figure 7.1 - Porter's Five Forces Model
1 Porter, Michael E. (1980). Competitive Strategy. New York, NY: Free Press.
105

The five forces shown in the figure help to explain the environment a company
competes in, and the overall level of profitability it might expect from different market
segments in a given industry. This also helps the company to assess how its current
products meet customer needs in comparison with competitive products.
Porter's model suggests that the expected level of profitability of a business, or
market segment - at a lower scale - can be explained by five factors:
- Intensity of competition.
- Presence of substitute products.
- Buyer power.
- Power of suppliers
- Potential entrants.
An in depth understanding of these factors will help the company to better define the set
of core competencies it needs to develop to nurture future development projects, and the
markets where it has the best opportunities given its internal capabilities.
1.3- Platform strategy - Defining the most promising platform concepts
1.3.1- Platform: Definition
A product platform is a collection of the common elements implemented across a
range of products; it is the foundation for a number of related products. The nature of
product platforms varies widely across industries and product applications. In the
personal computer industry, a platform is the microprocessor combined with its operating
system, such as the Apple Macintosh, and Intel/Windows platforms. In the automotive
industry, a platform could be a set of underbody subassemblies (front structure, front
floorpan, rear structure) that can be processed in a single underbody framing line.
Strategic reusability planning and management starts with platform concepts
definition. There are four major reasons why a company should structure its products in
product platforms:
- Provide distinct markets with customized products, while sharing technologies,
engineering systems, and production processes to stay within business
affordability, to reduce development time, and to improve quality; by focusing
the company's resources on the features that are the most important to the
customers.
106

- Focus senior management on the most important decisions related to a product
family instead of diluting attention across many products.
- Link a company's strategic vision with its product development programs. The
platform strategy is entitled to achieve the strategic vision, while
- Provide research and development engineers with specific directions for core
competency and technology development.
1.3.2- Platform strategy - Platform concepts pre-definition
Step 3 - Define possible platform concepts
Based on the strategic vision and the analysis of the external environment, senior
management must define the set of platforms which best reflects the strategic intent of the
company, and its long term goals. They must select the most promising platform
concepts. This initial phase of platform development defines the objectives and scope of
all platforms that appear to be consistent with the company's objectives. It includes an
evaluation of the feasibility of each platform, and a selection of the best alternatives. A
company may select several alternative platforms to address a general market segment, or
a set of market segments, and postpone the decision to select the best one to the next
phase (platform selection).
At this stage, senior management must have defined the most promising platform
concepts, their underlying technology or defining elements1, their vector of
differentiation 2 , their planned life-cycle, and how they will achieve a competitive
sustainable advantage3 for the company. A platform plan displaying the expected life-
cycle of all current platforms and the anticipated schedule for new alternative platforms
should be built (figure 7.24).
It is very important to keep in mind that the number of platforms to be developed
should not be defined at this stage. Rather, it should be done later after the assessment of
the development resources required by each product platform, and the evaluation of the
economic value of each platform.
1 In the automotive industry, a platform can be a set of underbody subassemblies that can be processed in asingle underbody framing line, as stated previously. In the equipment design industry, it can be the frame.2 Apple used "ease of use" as a vector of differentiation for its Macintosh Platform.3 While the IBM PC was a very successful product platform, it did not give IBM a sustainable advantage -PC-clone manufacturers being able to acquire the platform underlying technology and reproduce it. As aresult IBM lost market share.4 Derived from McGrath. 1995. Product Strategy for High Technology Companies. New York: IRWIN
107

General Market Segment A Platfrm1 Al. C ic 1[iiriiiiiiii~iiJi•J• PJi l atformA~i • i~ ~~•!ii • i~~~~~iiiiii~~iiiiiii~ii~~iiionce t2iii~iiiiiiiiiiiiiiiiii~ii~ii~ii
General Market Segment BPlatform BI. Next Generation. Concept 1
Platform B1. Next Generation. Concept 2
General Market Segment C
=II
I I I I
::::::::::-:::::::::::::: ::: ··:::·: ··· ::::::::::::::::::::::··ba X X: ::: ·I~'i·:::::::::::::::::::::ti: :::::r:::: O::::::::::ep t:::::Pii tfiiii r~i u C' nee t 2
Derivative Platform C4'. Concept 2
I I I I I II I I I I I I I I
Year -4 -3 -2 -1 +1 +2 +3 +4 +5
Figure 7.2 - Example of Product-Platform Plan. Platforms currently developed are indark grey. Platforms at the concept selection stage are in light grey.
Step 4 - Plan for platform commonization
Herein, the cycle planning team, or product strategy office must develop aparticular effort to commonize product architectures, system designs, facilities, andtooling whenever possible within and across product-platforms - more specifically whenplanning for derivatives, or next generational platform. The benefits are multiple:
From an engineering design perspective:
- Minimal "clean sheet" designs
- Reduced time to market
- Proven product performance
- Proven subsystem compatibility (avoid packaging issues)...
From a manufacturing perspective:
108
~8aa~aarrraEaara~
..... . ... ..
..... ... .... .. .. .. ... .. .. .. .. ... .. .. .. .. ... .. .. .... '':l
•| ''l
.. ... .. ... .. ... .. ... .. ... .. ... ..
-

- Reduced engineering and development costs
- Less need for prototypes and testing
- Reuse of assembly tooling
- Reduced tooling procurement costs (assembly tools, dies, fixtures)- Optimal use of manufacturing facilities...
This first step in strategic reusability planning and management is entirelycompleted after senior management has nominated the platform champions, who will
actually be responsible for the platform planning - define the set of product-lines andproducts to be developed - and the estimation of the platform profitability.
Figure 7.3 summarizes the first 4 steps of the strategic reusability planning andmanagement process.
1 - Strategic VisionCorporate Goals
2 -Analyze External EnvironmentPerform Porter's Five Force Analysis
Assess general market segments attractiveness
1 3 -Define Potential Platform Concents
Potential Pla orm Concept A
Alternative I Alternative 2 Alternative 3
Potential Platform Concept B
I I IPotential Platform Concept C
Set minimal commonization targetsand complexity reduction targets
Figure 7.3 - Strategic reusability planning and management: steps 1 to 4
109
4 -.
. 1
• • • w m
I

2- Platform planning
The platform teams should follow the process described below to define the set of
product programs to be developed under their platform, and the inter-relationships among
these product programs. It is of primary importance to have a high-level multifunctional
team, with members representing marketing, product design, sales, and manufacturing
functions.
2.1- Defining the strategic voice of the customer
Step 5 - Gather the strategic voice of the customer
The first step consists of gathering the voice of the customer. Most of the time, the
company has products in the targeted market segments. Therefore, there does exist a pre-
understanding of the customer profile. However, the platform team should conduct
further market research to assess the new customer wants and their importance. This
classification can be done through a KJ diagram [Shiba, Graham, and Walden 1993]. At
this stage, agreement should be reached on which market segments are of interest to the
company and on what basis, and the customer wants should be clearly attributed to the
selected market segments.
Step 6 - Generate market segment map
Next, the platform team should generate a market segment map for the platform,
that provides us with the importance of the different market segments - which can be
based on sales volumes, or operating income per market segment- and the importance of
the customer wants within each market segment. An overall importance for each
customer want might then be computed as the product of the importance of the customer
wants within the associated market segment and the market segment importance (an
example is displayed in figure 7.4).
110

Figure 7.4 - Market Segment Map example
Step 7 - Generate platform House of Quality
On this basis, and on the basis of the existing QFD information - Houses of
Quality for previous product generations which were under the defined market segments,
the platform team must build the Strategic, or Platform House of Quality' . This defines
the corporate expectations for the products to be developed under the considered
platform, as well as their relative weight. The primary objective is to define customer
needs, product expectations, and their linkages applicable to many market segments, far
into the future. Thus, the master House of Quality will be the source for many product-
specific Houses of Quality. One of the major benefits consists of an identification up-
front of common features across product programs.
1 Don Clausing, and Lou Cohen, "Recent Development in QFD in the United States". IMechE Conference,Coventry, England 1994.
111
1 a Secondary Attribute
E Easy to order 100 40S. Easy to use 70 28
6 Parts available 60 24On-time delivery 60 24
Good looking 100 30
0 No safety hazards 90 27
Easy to maintian 100 40
6 Reliable 80 32

Step 8 - Derive Houses of Quality for Core Products
Next the platform team must derive from the platform house of quality the core
products Houses of Quality. A core product would be any product on the basis of which a
family of products - differentiated in capacity, performance, features, packaging and
quality - is built. The Intel 486 DX 25 MHz is an example of core product, from which an
entire family of products was derived. A core product could also be defined as the startingproduct of a product-line' . As displayed in figure 7.5, the Houses of Quality of these core
products could be directly derived from the master House of Quality by just deriving the
appropriate set of rows and columns.
Figure 7.5 - Example of major product specific House of Quality
1 McGrath [1995] defines a product-line as an integrated set of products with a similar, but somewhatdifferent, purpose. Each product varies from others in the product-line by some characteristic such ascapacity, performance, features...
112

2.2- Platform planning in the context of the corporate environment
Step 9 - Generate the platform Business Integration Model
At this point, the platform team must generate the business integration model for
the platform considered based on the results of the previous step of the platform planning
process, and a definition of the internal capabilities. The team must develop
simultaneously the technology, product, and process strategies as explained in chapter 1.
The BIM must display the entire set of potential products to be developed under the
platform considered - including the derivatives of the core product of each product-line -,the plants supporting the production system, and the technology migration plan. This step
includes an assessment of the corporate core competencies and internal capabilities which
will be used as the basis on which the future technologies will be built.
The platform team must define the first set of high-level reusability degrees to be
targeted between product-program generations, and across product-programs, based on
the commonality existing between product expectations, and an analysis of the
commonization and carryover opportunities - any vehicle system or production process
which could be commonized or carried over, without altering the customer satisfaction,should be identified and targeted for reuse.
The platform team may build several BIMs corresponding to different market
range alternatives, or different numbers of products per market segment. In any case, the
platform BIMs have to be related to the total BIM which can be built at step 4 when
planning for commonization across platforms.
Step 10 - Prepare Aggregate Project Plan for each alternative
In the previous section, the team defined the appropriate product mix, thesequencing of product-lines and derivatives, as well as the system and process high levelreusability objectives for each product program.
The first step in building the Aggregate Project Plan consists of a definition of thetypes or classes of development projects covered by the BIM. Every firm has its ownranking of product-programs. At Ford Motor Company for instance, the ScaleabilityProcess provides a consistent approach to "binning" programs based on program size andcomplexity, as well as degree of product change. Clausing [1994] has proposed a rankingof product programs from genesis to customized. This ranking of each product program
113

under one of these categories will help the platform team to grasp better the development
resources required by each product program displayed in the BIM. The high level
reusability targets set in the previous section will help to further detail the needs for each
program.
Next, the platform team must define for each product program the critical
resources 1 and cycle time for its complete development. Competitive benchmarking
might provide the platform planning team with guidance for determining the time and the
people to be allocated to each product program. The team must also determine the
capacity of the firm at the bottleneck of the product development cycle (which is usually
human resources), and compute the utilization level for each period given the time frame
of the product programs to be developed, as displayed in the BIM (figure 7.6). The
utilization level should always be under 100%. If it happened to be over 100% during
some period, the team must rethink the sequencing of its products, and revise the BIM
for each product alternative until its plan falls within its internal capabilities.
Development ResourcesCommitted Project Projects' sequence
Measured in units at the bolleneck) Type 1996 1997 1 1998(# of engineers) 1 1 2 3 4 1 1 2 3 4 1 2 3 4
30 Genesis W152
12 Associated W144
20 Market-Segment Entry U86
10 Variant U180
Number of product programs 3 3 3 3 3 2 2 2 2 2 2 1
Critical Resource Utilization degree 65% 65% 65% 78% 78% 63% 63% 63% 63% 63% 63% 25%
Total Number of design engineers 80 - - - Pre-program planning and analysisAverage # of design engineers assigned 63% Actual program (after approval)
Figure 7.6 - Defining the programs' sequence and the bottleneck utilization level
The BIM must be revised for each platform alternative and reflect the precedent
change in the sequence of product programs.
1 Most of the time, as stated by Wheelwright and Clark [1992], human resource is the bottleneck in productdevelopment; therefore, the timeframe of each product program is determined on the basis of the number ofdevelopment engineers, product marketing people, and manufacturing people required to go from projectconception through market introduction.
114

Developing an aggregated project plan might be a relatively simple andstraightforward procedure; however carrying it out - moving from the first draft of theBIM to a robust, effective set of projects that matches and reinforces the product strategy- involves hard choices and discipline.
Figure 7.7 summarizes steps 5 to 10 of the strategic reusability planning andmanagement process.
Potential Platform Concetp A
Alternative 1Alternative I Alternative 2
1 I5 - Gather the StrategicVoice of the customer
Market research
I6 - Genarate Market Segment Map
7 -Generate Platform HoQ7 - Generate Platform HoQ
1 8 - Derive Core Product HoQs
IAlternative 3
HoQ Core Product 1 HoQ Core Product 2 HoQ Core Product :
9 - Generate Business Integration ModelI Explore system design, and process
xI reusability options
HoQ Core Product 4
10 - Prepare Aggregate Project PlanDefine cycle time and critical resources
for each core product program
Figure 7.7 - Process steps 5 to 10
115
• I
3- Advanced product planning - How new is each product?
This part introduces the tree analysis, and the product planning matrix introduced
in chapters 3 and 4. This will help the platform team to define the exact reusability
degrees at each product level, as well as the budget necessary to achieve a 100%
customer satisfaction (product cost excluded at this point) for every product program. The
following analysis is to be carried out separately for each platform alternative, and for
each product to be developed under the same platform.
Step 11 - Perform a Tree Analysis for each Core Product
As stated previously a core product is defined as the first product in a product-line
which is usually followed by a whole set of derivative products. The tree analysis will
help the platform team to better assess the design and manufacturing change magnitudes
required by each product expectation on the product functions, physical design, and
production system as explained in chapter 3. We will use, to perform this task, the
product expectations derived from the House of Quality for each Core Product, as defined
in step 8.
The tree analysis should be completed by a clear definition of the reuse and
innovation or change degrees - including the sources of the design and manufacturing
solutions - to be targeted to 100% satisfy each product expectation. This will help the
team to build the product planning matrix for each core product in the next step.
Step 12 - Build a Product Planning Matrix for each Core Product
The product planning matrix, as described in chapter 4, will help the platform
team to define the minimum design, facilities and tooling change magnitude - that is the
maximum reuse level - achieving a 100% customer satisfaction, for each Core Product
Program. The budget necessary to achieve total customer satisfaction will then be defined
for each core product program.
Step 13 - Define the budget required by each product derivative, within everyproduct-line
The Product Planning Matrix of the core product of the product-line considered
can be used to define the development cost (design plus facilities and tooling cost) of
each derivative within the same product-line. A Product Planning Matrix may also be
116
derived for each derivative, the reference for design, facilities and tooling costs being
those of the core product itself instead of those of a clean-sheet product.
This will give us the exact investment cost required by each product program.
Step 14 - Estimate the product unit cost, and iterate back to step 12 until thetarget cost 1 is achieved
Based on sales volumes' forecasts, an estimate of marketing costs, an estimate of
the production cost associated with the investment choices, and an estimate of overhead
costs, the team can compute the product unit cost. If this cost is greater the target cost as
determined by the marketing department, one more iteration is necessary back to step 12.
We will have to enhance the reusability degree to meet the target cost. Once the target
cost is achieved, we can go to the next step.
Step 15 - Estimate the platform development cost
After completion of these last three steps, the platform team will know the
development cost of each product program, as well as the development cost of each
platform alternative - the development cost of the platform being simply the sum of the
development costs of each product-line within the platform; the cost of developing a
product-line being the sum of the development costs of the core product and the
derivatives within each product-line.
Step 15' - Iterate back to step 12 until affordability is achieved
That is to say if the estimate of the development resources actually required to
build the platform - determined in the previous step - are within the company's
capabilities (resources, and budgets), then the platform team should go for the next step.
Otherwise, additional iterations might be necessary. The team will then have to go back
to step 12, and enhance the reusability degrees of each product, or across products to
reduce development expenditures, to stay within affordability.
Figure 7.8 summarizes steps 10 to 15 of the strategic reusability planning and
management process.
1 The target cost is defined as the market price minus the desired margin per product. However, we shouldkeep in mind that the market price will depend on the degree of innovation.
117

10 - Prepare Aggregate Project PlanDefine cycle time and critical resources
for each core product program
11 - Tree Analysis - Assess the change degreeto be made to each core product
12 - Build a Product Planning Matrix PPMfor each core product, andfor each of its derivatives
PPM core prod. 1PPM derivative I. 1PPM derivative 1.2PPM derivative 1.3
iProduction cost estimate
Marketing cost estimate
Sales Forecasts
PPM core prod. 2PPM derivative 2.1
PPM come prod. 3PPM derivative 3.1PPM derivative 3.2
I
PPM corePPM deriva
13 - Estimate the development cost of each product program
14 - Estimate product unit cost
prod. 4ative 4. 1
Enhancereuse
degrees toachieve target
costs
Target Costs Achieved ?
15 - Estimate platform development cost
Stay within platform budget, and affordability targets?
no
Figure 7.8 - Process steps 11 to 15
Enhancereuse
degrees tomeet budgetreauirements
1

4- Platform concept selection
Step 16 - Economic Analysis - Defining the Operating Income, and the Net
Present Value of each platform alternative - Cash flow analysis.
On the basis of an estimate of the sales volumes, the unit manufacturing cost, and
marketing costs for each product-program, the platform team must assess the operating
income, and the net present value of each product-program, as described in chapter 5. A
complete cash flow table must be built for each product-program
The operating income and the net present value of each platform alternative is
then simply the sum of those of each product-program within the platform. Similarly, the
cash flow for the platform for each period is computed as the sum of the cash flows of the
product-programs under the same platform.
Step 17 - Select the best alternative for each platform concept, and the best
platform concepts
The cycle planning team checks for consistency with the long term corporate
goals, and selects the best alternative for each platform concept based on the economic
analysis, and any other relevant piece of information (Return on Investment for instance).
Then, it selects the most promising platform concepts. The Pugh Concept
Selection process can be used to complete this task.
Step 18 - Finalize the product development strategy
At this point, the team should finalize the BIM, the Aggregate Project Plan, and
the Product Planning Matrices which will support the actual development of the final set
of platforms.
Figure 7.9 summarizes steps 16 to 18 of the strategic reusability planning andmanagement process.
Figure 7.10 is a road map for the strategic reusability planning and managementprocess that enables the reader to quickly survey the entire process and thus obtain astrong perspective on the interconnections.
119

17 - Patform Pugh Concept Selection
18 - Finalyze product development strategy
Figure 7.9 - Process steps 16 to 18
16 - Economic AnalysisThe economic analysis must be carried out for each product within every
platform. The Operating Income and NPV of the product programs under each
platform should then be summed to assess the profitability of the platform alternative

Step # Process steps Rationale for each step
1 Define the strategic vision Where is the company going? How to get there? Why will it be successful?
2 Build Porter's Five Forces Model Scan and organize information about the external environment of the company, that shows the attractiveness of potential markets.
3 Define possible platform concepts Define the set of platform concepts which best reflects the strategic intent of the company, and its long term goals.
4 Plan for platform commonization Make effort to commonize product architectures, system designs, facilities and tooling, specifically when planning for derivatives, or next generational platforms
5 Gather the strategic voice of the customer for each platform Conduct market research to assess new customer wants and their importance.
6 Generate a Market Segment Map Provide us with the importance of the different market segments, and the importance of customer wants within each market segment.
7 Generate platform House of Quality (HoQ) Define the corporate expectations for the products to be developped under the considered platform, as well as their relative weight.
8 Derive Houses of Quality for Core Products Derive from the platform HoQ the core products' HoQ.
9 Generate the platform Business Integration Model Display core competency, technology, product and manufacturing strategies; as well as reusability plans for the platform concept studied here.
10 Prepare Aggregate Project Plan for each platform alternative Define the timing of the product programs and the utilization level over time of the critical development resource - the bottleneck.
11 Perform a tree analysis for each core product Assess the design and change magnitudes required by each product expectation on the product functions, the physical design, and the production system.
12 Build a Product Planning Matrix for each core product Define the minimum design, facilities and tooling change magnitude achieving 100% customer satisfaction, and the corresponding budget.
13 Define the budget required by each product derivative Assess the investment required for each product derivative within every product-line of the platform alternative considered.
14 Estimate the product unit cost, and iterate back to 12 until Enhance reusability degrees in the product planning matrix until the target cost is achieved.
the target cost (market price - desired margin) is achieved
15 Estimate the platform development cost Provide the development team with an estimate of the resources required to actually develop the platform considered
15' Iterate back to step 12 until affordability is achieved
16 Economic analysis - Cash flow analysis Define the operating income, and the net present value of each platform.
17 Select best alternative for each platform concept Based on the aggregated operating income, and net present value of each platform, the team make its decision. Any other relevant information
and the best platform concepts might be taken into account using the Pugh Concept Selection process.
18 Finalize the product development strategy Finalyze the BIM, the Aggregated Project Plan, and the Product Planning Matrix for the "winning" platform concepts.
Figure 7.10 - Strategic Reusability Planning and Management road map.

122

Chapter VIII - Conclusion
1- Summary of results
The purpose of this thesis was to create the strategic reusability planning and
management process, to implement systematic and optimal reuse in product development.
This process was built on the basis of a set of planning tools, some of which were
developed in this thesis.
In chapter 3, we introduced an improved version of the business integration
model, a strategic planning tool for supporting product, process, and technology planning,
and enhancing business and engineering efficiency through reusability. The BIM will
help companies to better use their resources, and better plan the proliferation of their
products.
The following chapter presents one possible approach to defining the impact - in
terms of design, facilities and tooling changes - of every new product expectation on the
existing designs, and production facilities.
Next, we introduce the product planning matrix which will help product
developers to achieve the best balance between reuse and innovation, combining existing
assets with new assets to provide product variety and greater market presence relative tothe development effort. This matrix will also help product developers to assess, beforedecisions are frozen, the consequences of their decisions on the probable achievementmagnitude of the program's product expectations; and therefore, adjust their choices tobetter meet customer and corporate-wants.
123

Chapter 6 introduces an approach to analyze the economic value of different
product development alternatives; and therefore, to make the choices which maximizes
the net profit for the company.
Finally, we introduce in chapter 7 the strategic reusability planning and
management process which builds on the tools developed in this thesis, and those
introduced in previous work on reusability. This process will help product planners to
decide upon the number of platforms to be targeted for development, the number of
products per platform, and the change magnitude to be made to each product; to
maximize customer satisfaction, and the company's profit from both a short and a long
term perspectives.
2- Further research
Throughout this thesis, we have encountered issues that were not fully resolved,
and could form opportunities for further research.
In chapter 5, we built a model which will help product planners to achieve the
best balance between investment cost reduction and customer satisfaction. This model
would be best supported by a definition of the inter-dependencies existing between
customer satisfaction and sales volumes on the one hand, investment costs and production
costs on the other hand.
Besides, one of the most critical issues in implementing reusability was not
discussed here: how to overcome the reuse barriers, and actually get people to adhere to
the reusability plan? An empowered organization might be required to enforce
reusability. This area is worthwhile to explore.
Another topic that might be of great interest to manufacturing companies is
complexity reduction. Reusability is a strategic enabler for reducing complexity.
However is it the only way to reduce complexity? How should complexity be measured:
by the number of parts per product, or the number of models per part or process type?
Maybe both.
124

Bibliography
Andrade, Ron and Don, Clausing (1995). "Strategic Integration of Products,Technologies and Core Competencies with Support of Planned Reusability". Draft ofan internal working paper of the Laboratory of Manufacturing and Productivity atMIT.
Clausing, Don P. (1989). " Quality Function Deployment: Applied SystemsEngineering". Proceeding of the 1989 Quality and Productivity ResearchConference, University of Waterloo.
Clausing, Don P. (1991). " Flexible Product Development". In proceedings of theConference Time-Based Competition: Speeding New Product Design andDevelopment, Vanderbilt University, Nashville, Tennessee.
Clausing, Don and Nam, Suh (1991). "Enhanced Quality Function Deployment". InProceedings of the Design Productivity International Conference, Honolulu.
Clausing, Don P. (1994). Total Quality Development. New York: ASME Press.
Clausing, Don P. and Lou, Cohen (1994). "Recent Development in QFD in the UnitedStates". IMechE Conference, Coventry, England.
Cohen, Lou (1995). Quality Function Deployment. Reading, MA: Addison-Wesley.
De Neuville, Richard (1990). Applied Systems Analysis. New York, NY: McGraw-Hill.
Galsworth, Gwendolyn D. (1994). Smart Simple Design. Essex Junction, Vermont:Omneo.
Gershwin, Stanley B. (1994). Manufacturing Systems Engineering. Englewood Cliffs,NJ: Prentice Hall.
Goldratt, E.M. and J., Cox (1986). The Goal. North River Press.
Hauser, J.R. and Don, Clausing (1988). "The House of Quality", Harvard BusinessReview 66 (May-June), p6 3 -7 3 .
125

Henderson, Rebecca M. and Kim B., Clark (1990). "Architectural Innovation: TheReconfiguration of Existing Product Technologies and the Failure of the EstablishedFirms". Administrative Science Quarterly 35: 9-30.
Horngren, Charles T.; George Foster, and Srikant M. Datar (1994). Cost Accounting. AManagerial Emphasis. Englewood Cliffs, NJ: Prentice Hall.
McGrath, Michael E. (1995). Product Strategy for High-Technology Companies. BurrRidge, Illinois: Irwin.
Oster, Sharon M. (1994). Modern Competitive Analysis. New York, NY: OxfordUniversity Press.
Porter, Michael E. (1980). Competitive Strategy. New York, NY: Free Press.
Sanderson, S. and M., Uzumeri (1992). "Managing Product Families: The Case of theSony Walkman", Working Paper, Rewnsselear Polytechnic Institute.
Schnabel, Axel (1996). Leveraging Reusability Strategies in Product Development withProduct Platforms and Enhanced QFD. Diplomarbeit thesis completed at theMassachusetts Institute of Technology.
Shingo, Shigeo (1989). A Study of the Toyota Production System From an IndustrialEngineering Viewpoint. Portland, Oregon: Productivity Press.
Suh, Nam P. (1990). The Principles of Design. New York, NY: Oxford UniversityPress.
Suzue, Toshio and Akira, Kohdate (1990). Variety Reduction Program. Cambridge,MA: Productivity Press.
Ulrich, Karl T. (1992). "The Role of Product Architecture in the Manufacturing Firm",Working Paper #3483-92-MSA, MIT.
Wheelwright, Steven C. and Kim B., Clark (1992). Revolutionizing ProductDevelopment. New York, NY: Free Press.
Withney, Daniel E. (1993). "Nippondenso Co. Ltd: A Case Study of Strategic ProductDesign". Research in Engineering Design 5: 1-20.
Witter, Jerome; Don Clausing and Ron Andrade (1994). "Integration of Reusability andInterface Management into Enhanced Quality Function Deployment Methods",Working Paper, LMP, MIT.
6~Ot- S
126