strategies for an optogenetic modulation of the pacemaker
TRANSCRIPT
1
BI-NATIONAL PhD in
MOLECULAR AND CELLULAR BIOLOGY
Strategies for an optogenetic modulation of
the pacemaker current If
Thesis of the student: Paolo Zuccolini
Supervisors: Prof. Anna Moroni (Milano)
Prof. Gerhard Thiel (Darmstadt)

2
1
INDEX

3
1 INDEX p. 2
2 ABSTRACTS p. 4
3 INTRODUCTION AD AIM OF THE THESIS p.8
3.1 Birth and development of a powerful technique p. 9
3.2 The HCN channel family and the role of HCN4 in sinoatrial node cells. p. 16
3.3 A photo-regulated diguanylate cyclase. p. 24
3.4 Aim of the thesis p. 29
4 REULTS AND DISCUSSION p. 30
4.1 A bacterial cyclase can modulate the voltage dependency of HCN4 channels p. 31
4.2 Experiments with a light-activated bacterial diguanylate cyclase. p. 42
4.3 Quantification of the synthesis of c-di-GMP by ELISA assay. p. 49
4.4 Quantification of the c-di-GMP via immuno-fluorescence. p. 58
5 CONCLUSIONS AND FUTURE PROSPECTIVES p. 66
6 MATERIALS AND METHODS p. 71
6.1 Molecular Biology p. 72
6.2 HEK293T cells culture and transfection p. 76
6.3 Jurkat cells culture and transfection p .77
6.4 Electrophysiology p. 78
6.5 ELISA assays for quantification of intracellular c-di-GMP p. 79
6.6 Imaging of Jurkat cells p. 80
7 BIBLIOGRAPHY p. 82

4
2
ABSTRACTS
5
2.1 Abstract in English
HCN4 channels control pacemaking of the heart. They are activated by negative voltage and modulated by
cAMP. Recently it had been discovered that cyclic di-nucleotides bind to a second site in the channel C-
terminus. This counteracts the effect of cAMP on shifting channel activation positive. A bacterial cyclase,
which synthesizes c-di-GMP in response to red light, allows engineering of an optogenetic system for
remote HCN4 modulation and hence for controlling the heart pace.
Two cyclases were used in this work: one constitutively active (Slr1143) and one red ligh-regulated (BphS).
Because the latter has some dark activity, it is co-expressed with a phosphodiesterase (YhjH). Recordings of
HCN4 activity in HEK293T cells show that Slr1143 affects the voltage dependence of the channel, shifting
the activation curve negative with respect to the control.
Experiments with BphS show no difference in HCN4 activity between light and dark treated cells. The
combined BphS-YhjH expression seemed to be unable to increase the c-di-GMP concentration in a light
dependent manner. To examine the effect of light on c-di-GMP production we quantified the cyclic di-
nucleotide with an established ELISA assays in HEK293T cells and with an immune-fluorescence method.
The latter consisted of monitoring expression of interferon-β in BphS-YhjH expressing T cells. Cyclic di-
nucleotides can activate the STING pathway, which augments synthesis of interferon-β. Both methods
underlined that Slr1143 and BphS-YhjH system increased the level of c-di-GMP in cells. This activity,
however, was not light regulated. The immuno-fluorescence data indicate a slightly higher expression
of the constitutive compared to the light-regulated cyclase. This may explain why we observed an effect of
the former but not of the latter on HCN4 gating. Eliminating YhjH did not affect the level of c-di-GMP,
suggesting that the phosphodiesterase is insufficient for eliminating c-di-GMP dark production. The data
confirm previous results in that c-di-GMP is able to modulate HCN4 activity. BphS is not yet suitable as an
optogenetic tool because of its high dark activity. This problem may be overcome by increasing the
expression/activity of the phosphodiesterase in the next iteration of engineering an optogenetic tool.
6
2.2 Abstract in italiano
I canali HCN4 sono i principali regolatori della frequenza cardiaca. Si aprono in iperpolarizzazione e sono
modulati da cAMP. Recentemente si è scoperto che anche i nucleotidi di-ciclici interagiscono con il canale,
legandosi in un altro sito localizzato al C-terminale. Ciò contrasta la capacità del cAMP di spostare la
voltaggio dipendenza verso potenziali più positivi. Una ciclasi batterica, che sintetizza c-di-GMP in risposta a
luce rossa, permette di costruire un sistema per il controllo remoto di HCN4 e dunque del pacemaker.
In questo lavoro sono state utilizzate due ciclasi: una costitutivamente attiva (Slr1143) ed una regolata da
luce rossa (BphS). Dato che quest’ultima presenta attività ciclasica anche al buio, va co-espressa con una
fosfodiesterasi (YhjH). Registrazioni delle correnti attivate da HCN4 in HEK293T, mostrano che Slr1143
modifica la voltaggio dipendenza del canale spostandone la curva di attivazione rispetto ai controlli.
Gli esperimenti con BphS non mostrano alcuna differenza nell’attività di HCN4 tra buio e luce. L’espressione
combinata di BphS e YhjH sembrava non aumentare la concentrazione di c-di-GMP in modo luce-
dipendente. Per analizzare l’effetto della luce sulla produzione di c-di-GMP, esso è stato quantificato con un
consolidato test ELISA e con immuno-fluorescenza. Quest’ultimo metodo consisteva nel monitorare
l’espressione di interferone β in cellule T esprimenti Bphs-YhjH. I nucleotidi di-ciclici attivano infatti il
pathway di STING, che aumenta la sintesi dell’interferone. Entrambi i metodi hanno evidenziato che
Slr1143 e il sistema BphS-YhjH aumentavano il c-di-GMP nelle cellule. Tuttavia, questa attività non era luce-
dipendente. I dati di immuno-fluorescenza indicano un’espressione leggermente maggiore della ciclasi
costitutiva rispetto a quella luce-regolata. Ciò può spiegare perché abbiamo osservato un effetto del primo
costrutto sul gating di HCN4 ma non del secondo. L’eliminazione della fosfodiesterasi YhjH non aumenta la
concentrazione finale di c-di-GMP e ciò indica che essa non è in grado di compensarne la produzione al
buio. I dati confermano osservazioni precedenti sulla capacità del c-di-GMP di modulare l’attività di HCN4.
Tuttavia BphS non è ancora adatto per essere usato in optogenetica per via della sua attività al buio.
Questo problema potrebbe essere risolto aumentando l’espressione e l’attività della fosfodiesterasi nelle
successive fasi di sviluppo del sistema.
7
2.3 Abstract auf Deutsch
HCN4-Kanäle steuern die Frequenz des Herzschlags. Sie werden durch negative Spannung aktiviert und
durch cAMP moduliert. Kürzlich wurde entdeckt, dass auch zyklische Dinukleotide an eine zweite Stelle im
C-Terminus des Kanals binden können. Dies wirkt dem Effekt von cAMP auf die Aktivierung des Kanals
entgegen. Eine bakterielle Cyclase, die c-di-GMP als Reaktion auf Rotlicht synthetisiert, ermöglicht die
Entwicklung eines optogenetischen Systems zur ferngesteuerten HCN4-Modulation und damit zur
Steuerung des Herzrhythmus.
Zwei Proteine wurden verwendet: eine konstitutiv aktive (Slr1143) und eine rotlichtregulierte (BphS)
Cyclase. Da letztere eine gewisse Dunkelaktivität aufweist, wird eine Phosphodiesterase (YhjH)
koexprimiert. Aufzeichnungen über die HCN4-Aktivität in HEK293T-Zellen zeigen, dass Slr1143 die
Spannungsabhängigkeit von HCN4 beeinflusst; Slr1143 verschiebt die Aktivierungskurve des Kanals relativ
zur Kontrolle in Richtung negativer Membranspannungen.
Experimente mit BphS zeigen keinen Unterschied in der HCN4-Aktivität zwischen Zellen, die im Hellen oder
Dunklen inkubiert wurden. Die kombinierte BphS-YhjH-Expression schien nicht in der Lage zu sein, die c-di-
GMP-Konzentration in einer lichtabhängigen Weise zu erhöhen. Um die Wirkung von Licht auf die c-di-
GMP-Produktion zu untersuchen, haben wir die zyklische Dinukleotid-Konzentration mit einem etablierten
ELISA-Assay in HEK293T-Zellen und mit einer Immunfluoreszenzmethode quantifiziert. Letztere bestand in
der Überwachung der Expression von Interferon-β in BphS-YhjH exprimierenden T-Zellen. Zyklische
Dinukleotide können den STING-Pfad aktivieren, der die Synthese von Interferon-β verstärkt. Beide
Methoden zeigten, dass sowohl Slr1143 als auch das BphS-YhjH-System zu einer Erhöhung des zellulären c-
di-GMP-Spiegels führen. Diese Aktivität war jedoch nicht durch Licht reguliert. Die Eliminierung von YhjH
hatte keinen Einfluss auf das c-di-GMP-Level, was darauf hindeutet, dass die Phosphodiesterase nicht in der
Lage ist, die Produktion von c-di-GMP im Dunklen zu unterbinden. Die Daten bestätigen die bisherigen
Ergebnisse, dass c-di-GMP in der Lage ist, die HCN4-Aktivität zu modulieren. BphS ist aufgrund seiner hohen
Dunkelaktivität noch nicht als optogenetisches Werkzeug geeignet. Um dieses Problem auf dem Weg zur
Konstruktion eines funktionsfähigen optogenetischen Werkzeugs zu überwinden, muss die
Expression/Aktivität der Phosphodiesterase erhöht werden.

8
3
INTRODUCTION
AND
AIM OF THE THESIS
9
3.1 Birth and development of a powerful technique
Optogenetics is an innovative and powerful approach that combines methods of genetic and optical
techniques to trigger or inhibit well defined events in specific cells of living tissues (Deisseroth, 2015). The
principle of optogenetics is to remotely modulate cellular events of interest with light. The effective light
stimulations can be applied in a very fast manner and further fine tuned by grading the power and/or the
wavelengths of the stimulating light. The final light stimulation can then penetrate, with or without the help
of specific light guides, deeply into the tissues. The modulation of cellular processes by light stimulation can
be achieved by the expression of specific photo-regulated proteins in the target cells. An activation of these
light sensitive proteins then leads, directly or indirectly, to the desired effects (Rost et al., 2017).
The principle of optogenetics was introduced in 2015 by Boyden and colleagues as a tool for selectively
controlling the activity of specific types of neurons (Deisseroth, 2011). The neural circuits are highly
complex systems in which different types of neurons stimulate or inhibit each other. The great challenge
for neurobiologists was to experimentally dissect these complex circuits and investigate the role of each
class of neuron in the information processing (Boyden, 2011). Before the introduction of optogenetics
important insights into the role of different neurons within a circuit could be provided by direct electrical
stimulation of cells in intact brain tissue. The drawback of this method is that neurons belonging to a
specific class are often sparsely embedded within the tissue (Fenno et al., 2011). An alternative approach
for dissecting complex neuronal circuits was provided by pharmacological methods. This type of
manipulation indeed offered a more precise way of targeting a specific cell type of interest with certain
expression patterns. The drawback of this approach is that it requires the diffusion of chemical compounds
to the site of action, which is in most cases too slow for manipulating the desired activity of neurons (Fenno
et al., 2011). Scientists realized since the late seventies that to understand more deeply how the brain
works they needed a method by which neurons of just one type could be manipulated, leaving the others
unaffected (Crick, 1979). The ideal technique would employ a genetically encoded tool, which is selectively
expressed in a defined class on neurons and which is able to affect excitability in response to a diffuse and
fast stimulus. The first step in this direction was the intuition that light could be such a stimulus, fulfilling
the need for speed, diffusion and simplicity of delivery.
Before optogenetics was introduced, other researchers already had the idea of using light as a remote and
non-invasive stimulus to elicit neuronal firing. Zemelman and colleagues conferred photo-sensitivity to
hippocampal neurons by co-expressing in these cells the elements of the phototransduction machinery of
Drosophila (Zemelman et al., 2002). In invertebrates, the stimulation of the photoreceptors activates a
pathway that eventually causes cell depolarization via opening of cation channels. By expressing the
phototransduction elements in hippocampal neurons, they were able to elicit the firing of action potentials
in response to light irradiation. The light activated firing was obtained also in neurons treated with
10
inhibitors of glutamate receptors, proving that the observed action potentials were not provoked by
excitatory synaptic inputs. However, the recordings of action potentials in these light-sensitive neurons
indicated that there was a delay of 0.5÷34 seconds between the beginning of the irradiation and the
appearance of the firing. The technique, although interesting, was not providing the desired temporal
precision.
To achieve an activation of neural firing with a higher temporal precision, the pioneers of optogenetics
expressed in neurons an ion channel that is directly gated by light. This system does not require any
signaling cascade or second messenger between light perception and membrane depolarization. The crucial
channel, which provided these features, was channelrhodopsin-2 (ChR2), a light-activated ion channel from
Chlamydomonas reinhardtii, first characterized by Nagel and colleagues in 2003 (Nagel et al., 2003). Before
the publication of this seminal work it was already known that this channel uses retinal as a chromophore
to sense light, and that the activity of the channel was involved in the generation of “photocurrents” in the
algae when the latter are irradiated with blue light (Sineshchekov et al., 2002). When Nagel and colleagues
characterized this protein, they clearly demonstrated that it was both a light sensor and an ion channel.
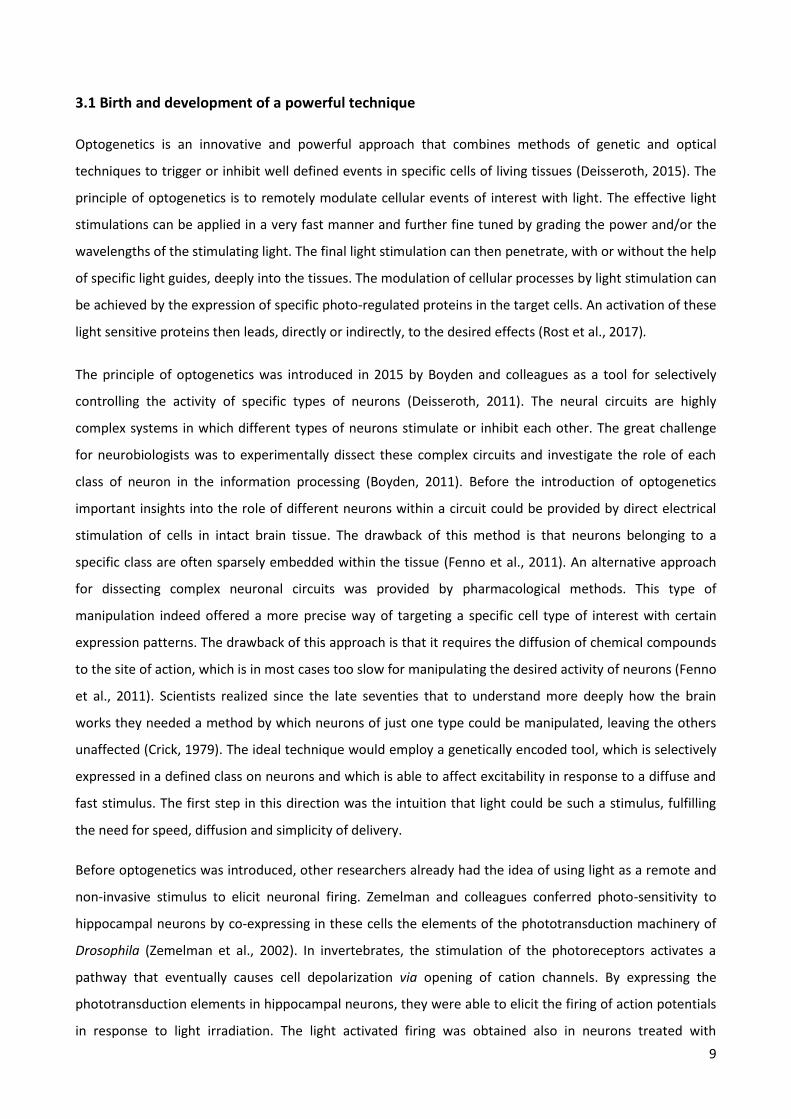
They expressed the protein into Xenopus laevis oocytes supplied with all-trans retinal. In these oocytes they
were able to measure a blue light-activated inward current that displayed a peak followed by a decay to a
steady state level (Fig. 3.1 A). The channel turned out to be permeable for mono and divalent cations, while
anions did not contribute in any way to the measured currents. The authors furthermore performed inside-
out patch clamp experiments: with this technique it is possible to measure currents flowing through a small
piece (patch) of membrane that is isolated from the rest of the membrane and the cytoplasm. In this
configuration channel gating cannot depend on potential regulators or signaling cascades from the
cytoplasm. Using excised patches the authors confirmed that even after isolating the channel from the
cytoplasm it was still able to elicit a light-activated current similar to that observed in whole-cell
measurements (Fig. 3.1 B). With this work it was proven that ChR2 is cation channel, which is directly gated
by blue light.
Fig 3.1 Characterization of ChR2. (A) Currents recorded in Xenopus laevis oocytes expressing ChR2. When the voltage was clamped
at -100 mV, blue light illumination elicited the activation of an inward cation currents. (B) Inside-out patch-clamp recordings of a
patch of membrane from an oocyte expressing ChR2. (figures from Nagel et al., 2003).
A B

11
Boyden and co-workers understood that this peculiar channel from an alga could be used to elicit action
potentials in neurons in a light dependent manner (Boyden et al., 2005). The channel opens upon blue light
illumination and is selective for cations. Because of the electrochemical gradient across the membrane of
neurons, the opening of a cation channels will cause an inward flux of positive ions and hence a
depolarization of the membrane potential. This in turn will trigger the generation of action potentials. For a
proof of concept, Boyden and coworkers infected cultured rat neurons with lentiviruses containing a Chr2-
YFP fusion protein. In these cells they were able to measure blue light activated inward currents similar to
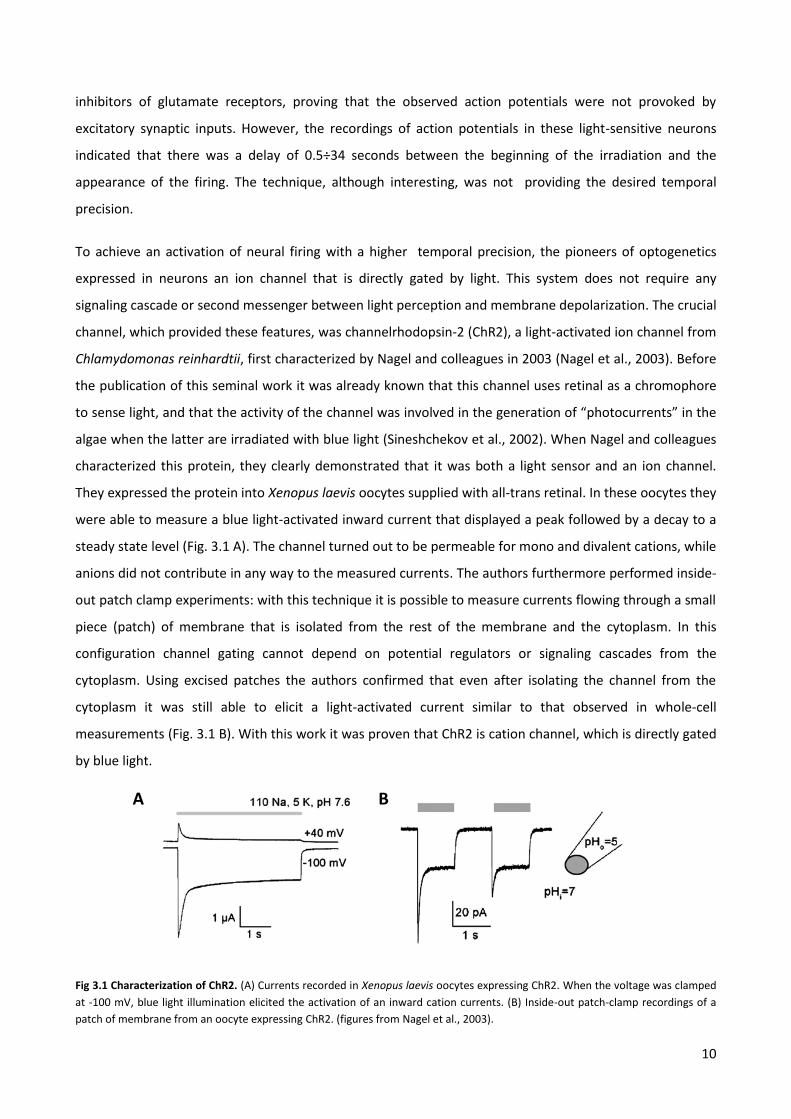
those measured by Nagel one year before (Fig 3.2 A and B). Under continuous blue light irradiation they
observed an appreciable depolarization of the membrane potentials and the rise of spiking activity. The
latter appeared few milliseconds after the light stimulation began but the frequency decreased
dramatically during the stimulation (Fig. 3.2 C). Given the rapid activation of Chr2 by light and the
consequent depolarizing current, they also succeeded in eliciting single action potentials by short single
blue light flashes. They found that a light flash of 15 ms was able to generate a complete action potential
and that multiple light pulses separated by dark periods were able to generate high frequency firing in the
neurons (Fig. 1.2 D). Thanks to such an incredible temporal precision, they were able not only to elicit
neuronal firing but also to regulate the frequency of their spikes by modulating the light pulses frequency.
The results of these experiments show that the concentration of retinal in neurons is evidently sufficient
for a proper Chr2 function. Collectively this implied that this optogenetic tool is totally genetically encoded
and does not require to treat the cells with any exogenous compound. This is an important feature for an
optogenetic tool, as its ability to response to light will not depend on the delivery of chemicals to cells. In
the same period in which Boyden and colleague developed optogenetics, another research group
engineered a light-activated channel called SPARK (Banghart et al., 2004). The shortcoming of this channel
is that it needs to be supplied with an exogenous molecule that confers light dependence to the gating. The
system developed by Boyden and colleagues is, on the contrary, intrinsically light regulated.
In the past decade the optogenetics methods have been further developed and the technique has been
enriched with new tools, some of which are present in nature and belonging to the opsin family (Mei and
Zhang, 2012). An example of these proteins is the yellow light regulated chloride pump halorhodopsin from
Natronomonas pharaonis (NpHR). This is a pump that is able to transport chloride ions across the
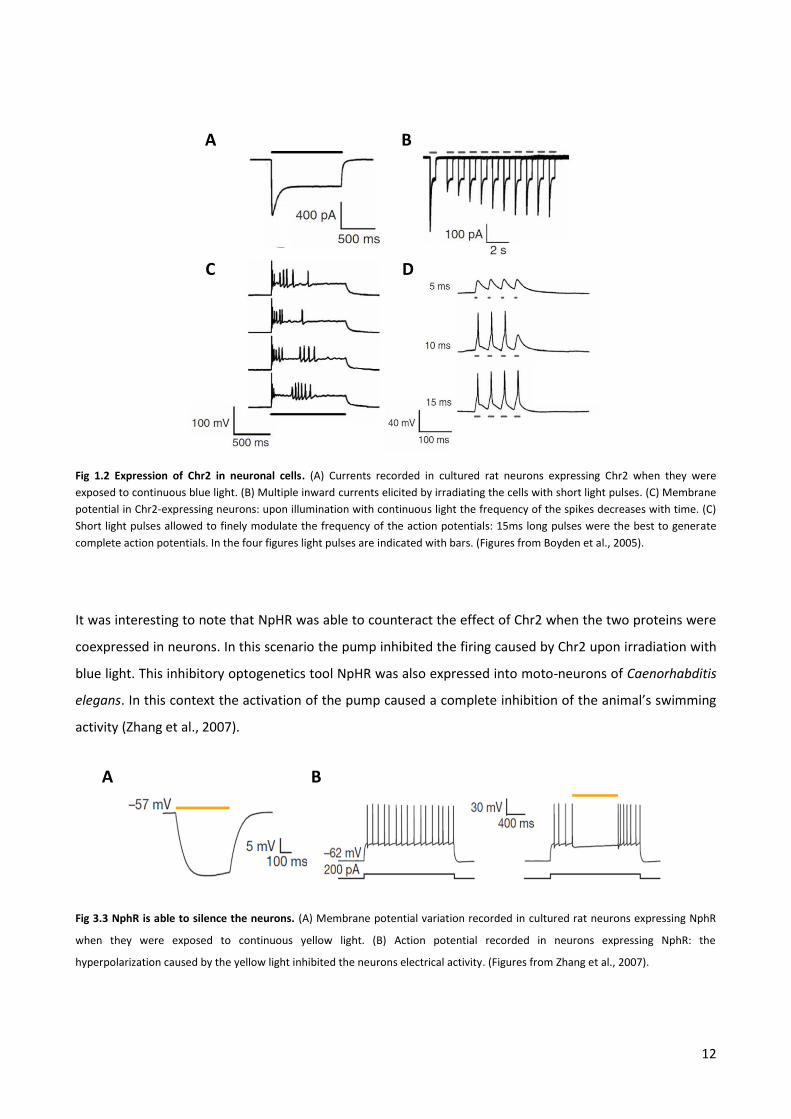
membrane into the cytoplasm (Bamberg et al., 1993). The transfer of negative charges into an excitable
cells should hyperpolarize the membrane potential, preventing the rise of action potentials. This is indeed
what happened when NpHR was expressed into neurons: an illumination with yellow light led to a
hyperpolarization of the membrane potential and an inhibition of firing (Fig. 1.3, Zhang et al., 2007). Action
potentials were in this case induced by injecting positive currents into the cells. The ability of this
stimulation to induce firing promptly disappeared when the yellow light was turned on.
12
Fig 1.2 Expression of Chr2 in neuronal cells. (A) Currents recorded in cultured rat neurons expressing Chr2 when they were
exposed to continuous blue light. (B) Multiple inward currents elicited by irradiating the cells with short light pulses. (C) Membrane
potential in Chr2-expressing neurons: upon illumination with continuous light the frequency of the spikes decreases with time. (C)
Short light pulses allowed to finely modulate the frequency of the action potentials: 15ms long pulses were the best to generate
complete action potentials. In the four figures light pulses are indicated with bars. (Figures from Boyden et al., 2005).
It was interesting to note that NpHR was able to counteract the effect of Chr2 when the two proteins were
coexpressed in neurons. In this scenario the pump inhibited the firing caused by Chr2 upon irradiation with
blue light. This inhibitory optogenetics tool NpHR was also expressed into moto-neurons of Caenorhabditis
elegans. In this context the activation of the pump caused a complete inhibition of the animal’s swimming
activity (Zhang et al., 2007).
Fig 3.3 NphR is able to silence the neurons. (A) Membrane potential variation recorded in cultured rat neurons expressing NphR
when they were exposed to continuous yellow light. (B) Action potential recorded in neurons expressing NphR: the
hyperpolarization caused by the yellow light inhibited the neurons electrical activity. (Figures from Zhang et al., 2007).
A B
C D
A B
13
Some other more recently developed optogenetic tools are proteins that cannot be found in nature; they
are the product of protein engineering. These constructs are usually designed to confer light sensitivity to a
protein responsible for the effect that one wants to control. For this purpose the photosensitive domain of
a light regulated protein is in most of the cases fused with the protein of interest. In the past years, new
synthetic proteins for optogenetic applications have been engineered using, as regulatory domain in these
chimeras, the LOV2 domain of the plant phototropin 1 (Cosentino et al., 2015; Niopek et al., 2014; Pham et
al., 2011; Strickland et al., 2008). This domain, which is part of a blue light sensor in plants, is composed by
antiparallel β-strands that form an hydrophobic cavity (cage or core), in which the chromophore flavin
mononucleotide is held uncovalently. The C terminus of the cage contains an amphipathic alpha helix called
Jα, whose apolar side docks onto the core (Fig 1.4 A, Christie, 2007). Irradiation of the domain induces the
formation of a covalent adduct between the C(4a) carbon of the flavin chromophore and a conserved
cysteine residue within the LOV2 domain. The conformational rearrangements in the cage, that occur after
the formation of the covalent bond, cause the disruption of the interaction between the cage and the Jα,
which partially unfolds. This unfolding of the Jα results in an activation of the kinase domain of the
phototropin, located at the end of the helix (Fig. 1.4 B, Christie, 2007). The LOV2 domain is therefore able
to keep a catalytic domain blocked against its core and to “release” it in response to blue light.
An elegant example for the construction of new optogenetics tools using the LOV2 domain, is the light
gated potassium channel BLINK (Cosentino et al., 2015). Potassium channel opening drives the membrane
voltage negative and hence terminates in this way action potentials and prevents firing in excitable cells
(Hille, 2001). Such a light sensitive K+ channel could be very useful for optogenetics because opsin-based
hyperpolarizing optogenetic tools have some shortcomings. First, these ion pumps are rather inefficient
because they move only one ion per photocycle. Notably a channel conducts in contrast up to 108 ions per
second. Moreover the pumps also create abnormal ion gradients in cell. For these reasons, the optogenetic
community had been looking for a more efficient and genuine light-gated channel, which can be used to
hyperpolarize cells. In 2015 Cosentino and co-workers constructed a light-gated potassium channel by
fusing the LOV2 domain to a viral potassium channel called Kcv (Fig 1.4 C). This is a very small potassium
channel composed by only the pore module of a K+ channel lacking any regulatory domain (Plugge et
al.,2000). The design of this synthetic channel was inspired by the finding that channel proteins are often
modular elements in which the pore, which conducts the ions, is connected with regulatory domains
(Arrigoni et al., 2014). Conformational changes of the regulatory domain can be transmitted to the pore
unit were they alter the flux of ions. This natural architecture of ion channels can be mimicked in synthetic
proteins in which a channel pore unit is coupled in an intelligent manner with a foreign regulatory or sensor
unit (Arrigoni et al., 2014, Difrancesco et al., 2015). The native fusion of the a viral potassium channel pore
to the LOV2 domain resulted, after some optimization steps, in a potassium channel that could be
reversibly gated by blue light (Fig. 1.4 D, Cosentino et al., 2015).
14
Optogenetic principles can also be used to regulate different types of cellular processes beyond the control
of changes in the membrane voltage. An interesting example for such a system that does not involve ion
currents, is presented in the work from the Di Ventura’s group (Niopek et al., 2014; Niopek et al., 2016; Di
Ventura, 2016). They were able to control, precisely and reversibly, nuclear translocation of proteins in
human cells. They used the LOV2 domain as photo-switch and added at the C terminus of the Jα a nuclear
localization signal (NLS). The latter is concealed from the nuclear import machinery in the dark state but, in
the light, the Jα helix unfolds and undocks from the AsLOV2 core domain, exposing the NLS to the
cytoplasm (Fig 1.4 E). In this condition the NLS can be recognized and bound by the endogenous importins.
They named this light-inducible nuclear localization signal LINuS. A construct made by Mcherry and LINuS
(Fig 1.4 F) was expressed in different cell types. In cells expressing this construct it was possible to see that
the mCherry fluorescence signal was present both in the nucleus and the cytoplasm in the dark. To reduce
the background nuclear localization of LINus, they added also a nuclear export signal (NES). This new
construct was, in the dark, dispersed in the cytoplasm but was not present in the nucleus. Upon
illumination, they observed the occurrence of a mCherry signal in the nucleus, which indicated that the
protein was being relocated there (Fig 1.4 G). With LINuS as an optogenetic tool they are now able to
control cellular events that involve nuclear translocation of a protein or a set of proteins. Examples are
mitotic entry or gene expression. In the next step they used the same principles behind LINuS to create a
light dependent export signal called LEXY.
With this brief overview, I want to show the principles optogenetics and the importance of this new
technology in biological sciences. A number of recent reviews underscore the great impact on this new
concept on progress in research in many fields (Rost et al., 2017; Boyle at al., 2018). To complete the
picture I also described some examples of synthetic proteins, which were designed to expand the collection
of neurophysiology tools or to achieve the modulation of new and different cellular events.
Optogenetics is a dynamic and rapidly evolving field that can be enriched with new light-inducible proteins
to control different phenomena. This PhD work was motivated by the idea to further expand the
optogenetics toolbox. The particular goal was to create a system which allows a light-regulated gating of
the HCN4 channel and, with this, a way to modulate the heart rate in an non invasive manner. The rationale
behind this approach will be presented in the next chapter.

15
Fig 1.4 New synthetic LOV2-based proteins for optogenetics. (A) Structure of LOV2 domain of phototropin 1 (Christie, 2007). (B)
The unfolding of the Jα helix leads to the activation of the effector domain of the phototropin 1 (Christie, 2007). (C) Schematic
representation of BLINK1, a synthetic light-gated potassium channel in which the LOV2 domain is fused to the N terminus of the
potassium channel Kcv (Cosentino et al., 2015). (D) I/V curves obtained from HEK293T cells expressing BLINK1 in the dark (black
squares), after irradiation with blue light (blue dots) and after dark recovery (empty triangles) (Cosentino et al., 2015). (E) Cartoon
representing how, upon light irradiation, the NSL is exposed to cytoplasm in LInuS (Niopek et al., 2014). (F) The fusion protein LINuS
(Niopek et al., 2014). (G) Reversible nuclear migration of LINuS in response to blue light can be observed by monitoring the
mCherry fluorescence (Niopek et al., 2014).
A
B
C D
E
G
F
16
3.2 The HCN channel family and the role of HCN4 in sinoatrial node cells.
Hyperpolarization-activated cyclic nucleotide gated channels (HCN1-4) are a family of ion channels, which
are expressed both in the brain and in the heart. They are voltage dependent and open upon
hyperpolarization of the plasma membrane; at depolarized voltages they are closed. In addition to a
regulation by voltage, the activity of these channels is also modulated by the binding of the second
messenger cAMP to a cytosolic binding domain (Biel et al., 2009). With respect to their regulation HCN
channels share therefore characteristics with both voltage-gated and ligand-gated channels. A peculiar
feature of HCN channels is that they are, different from K+ channels with the same architecture, not strictly
K+ selective. This means that not only K+ is permeating the pore, but also Na+ (Santoro and Tibbs, 1999; Biel
et al., 2009). The selectivity ratio is approximately 3:1 meaning that for three K+ ions one Na+ is on average
transported by these channels.
The currents mediated by HCN channels were first discovered in the heart and immediately attracted the
attention of physiologists because of their peculiarities in gating and selectivity. Different from all other
channels known at this time, HCN channels were activated by hyperpolarization while all other voltage
gated channels were activated by depolarization (Brown et al., 1979). As mentioned before the current
carried by these channels was not selective for K+ alone but a mix of both K+ and Na+ (DiFrancesco et al.,
1986). For these reasons the current was named “funny” current (If) in the first place although now is often
called Ih (Barbuti and DiFrancesco, 2008). Later, an hyperpolarization activated current, named Ih, was
measured also in neurons (Pape, 1996) and the genes of the HCN isoforms began to be identified at the end
of the nineties (Ludwig et al., 1998; Ludwig et al., 1999; Santoro et al., 1997; Santoro et al., 1998; Vaccari et
al., 1999).
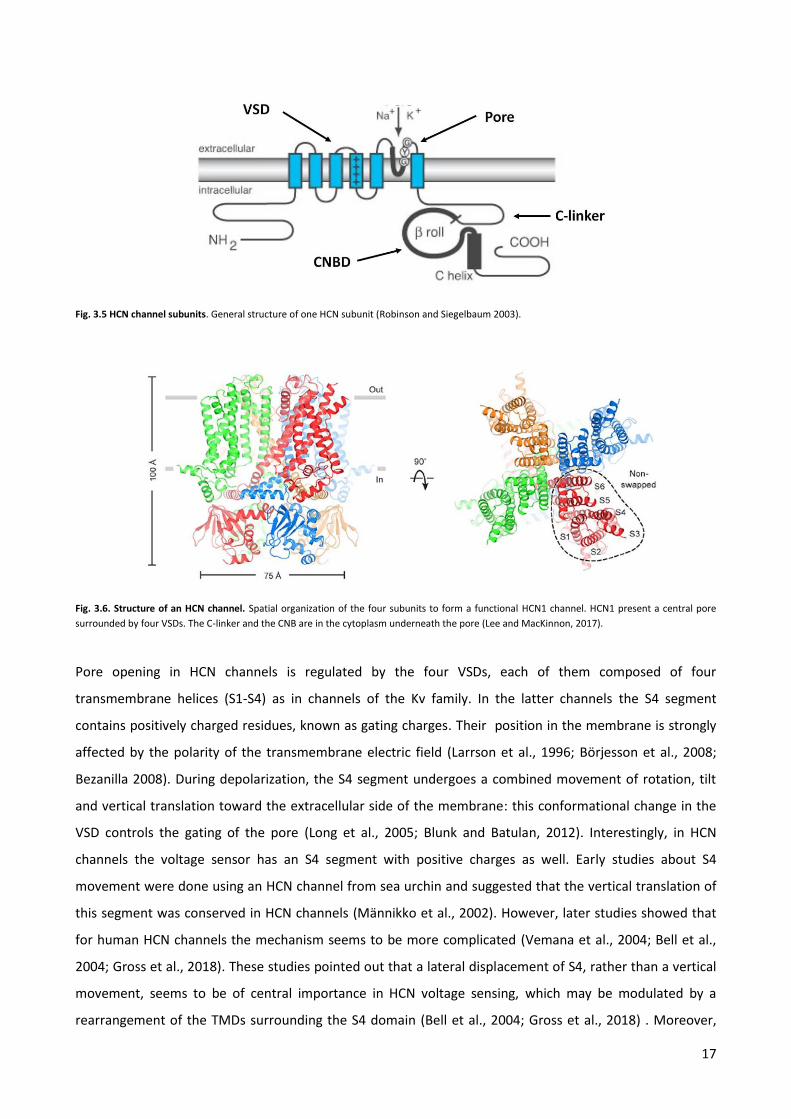
Recently the structure of HCN1 was solved by high resolution cryoEM. Hence new information and possible
explanations for the particular behavior of these channels are now available (Lee and MacKinnon, 2017).
From the structural data it becomes evident that HCN channels share some features with voltage gated K+
channels (Kv). The channel is composed of four subunits and each of them presents three modules: the
voltage sensor domain (VSD), the pore module and a cyclic nucleotide–binding domain (CNBD) (Fig. 3.5).
The latter is connected to the pore module via the so-called C-linker region, which is protruding into the
cytoplasm. The four subunits are organized to form a central pore surrounded by the four VSDs, as in Kv
channels (Fig. 3.6; Lee and MacKinnon, 2017).
17
Fig. 3.5 HCN channel subunits. General structure of one HCN subunit (Robinson and Siegelbaum 2003).
Fig. 3.6. Structure of an HCN channel. Spatial organization of the four subunits to form a functional HCN1 channel. HCN1 present a central pore
surrounded by four VSDs. The C-linker and the CNB are in the cytoplasm underneath the pore (Lee and MacKinnon, 2017).
Pore opening in HCN channels is regulated by the four VSDs, each of them composed of four
transmembrane helices (S1-S4) as in channels of the Kv family. In the latter channels the S4 segment
contains positively charged residues, known as gating charges. Their position in the membrane is strongly
affected by the polarity of the transmembrane electric field (Larrson et al., 1996; Börjesson et al., 2008;
Bezanilla 2008). During depolarization, the S4 segment undergoes a combined movement of rotation, tilt
and vertical translation toward the extracellular side of the membrane: this conformational change in the
VSD controls the gating of the pore (Long et al., 2005; Blunk and Batulan, 2012). Interestingly, in HCN
channels the voltage sensor has an S4 segment with positive charges as well. Early studies about S4
movement were done using an HCN channel from sea urchin and suggested that the vertical translation of
this segment was conserved in HCN channels (Männikko et al., 2002). However, later studies showed that
for human HCN channels the mechanism seems to be more complicated (Vemana et al., 2004; Bell et al.,
2004; Gross et al., 2018). These studies pointed out that a lateral displacement of S4, rather than a vertical
movement, seems to be of central importance in HCN voltage sensing, which may be modulated by a
rearrangement of the TMDs surrounding the S4 domain (Bell et al., 2004; Gross et al., 2018) . Moreover,

18
the S4 segment in HCN channels is longer than that of Kv channels and it extends in the cytoplasm (Fig. 3.7
A; Lee and MacKinnon, 2017). It has been proposed that this extraordinary length of the S4 helix allows an
interaction between the C-linker and the so-called S4-S5 linker, which connects the S4 to the S5 helix (Lee
and MacKinnon, 2017; Gross et al., 2018). This interaction, when the S4 helix is in the “depolarized
position”, may stabilize the closed state of the pore and may be involved in cAMP effect on the voltage
dependence.
The voltage sensor is directly connected to the pore via the so-called S4-S5 linker, consisting of few amino
acids (Lee and MacKinnon, 2017). The pore module is made of two transmembrane helices (S5 and S6)
separated by the pore helix and the selectivity filter. It has already been mentioned that HCN channels
allow the permeation of both K+ and Na+ with a permeability ratio PNa:PK of about 1:3 (Santoro and Tibbs,
1999). Surprisingly, HCN channels contain the same essential amino acids that are required to form the K+
selectivity filter in highly selective K+ channels (Biel et al., 2009). The structure of the HCN1 obtained by Lee
and MacKinnon in 2017 is now able to explain the low K+ selectivity of HCN channels. It shows that the first
two amino acids of the selectivity filter have a different orientation compared to that of canonical
potassium channels (Lee and MacKinnon, 2017). As a consequence, the outer half of the selectivity filter
appears to be dilated. In K+ selective channels this part of the filter contains two of the four binding sites
that coordinates the entrance of K+ ions. The presence of four sites in selective K+ channels allows two
K+ ions to bind simultaneously (Zhou et al., 2001). The outer part of the filter in HCN1 in contrast is much
wider so that sites 1 and 2 are absent (Fig. 3.7 B). Lee and MacKinnon hypothesized that “a filter in which
only a single ion can bind, even if the binding is thermodynamically favorable for K+ over Na+, will not
exhibit strong kinetic selectivity because an entering Na+ ion, which will only reside very briefly, will rapidly
exit to either side (i.e., it can permeate)” (Lee and MacKinnon, 2017). On the contrary, in K+ selective
channels a multi-K+-ion occupancy in the filter can augment the probability of Na+ exiting from the same
side that it entered. The latter is favored by a K+ ion hindering the transition into the other direction. Given
the particular nature of this selectivity filter architecture in HCN1, channel opening at the resting
membrane potentials of neurons or cardiomyocytes will result in an inward current, which depolarizes the
membrane. This depolarization brings the voltage to the threshold for activation of an action potential. The
importance of this depolarization is explained in details in the next paragraphs.
As mentioned previously the pore is connected, at its C-terminal end, to the regulatory domain CNBD. This
ligand binding domain includes α-helices (A, P, B, C, D and E) and a β-roll between the A and B helices
(Zagotta et al., 2004; Lolicato et al., 2011; Saponaro et al., 2014; Lee and MacKinnon 2017). The latter also
contains the so-called phosphate binding cassette, which forms the cAMP binding pocket. cAMP binding to
this site causes major spatial reorientation of the helical components of the CNBD; in particular, the B and C
helices move toward the core of the CNBD (Fig. 3.7 C, Saponaro et al., 2014; Lee and MacKinnon 2017). This
19
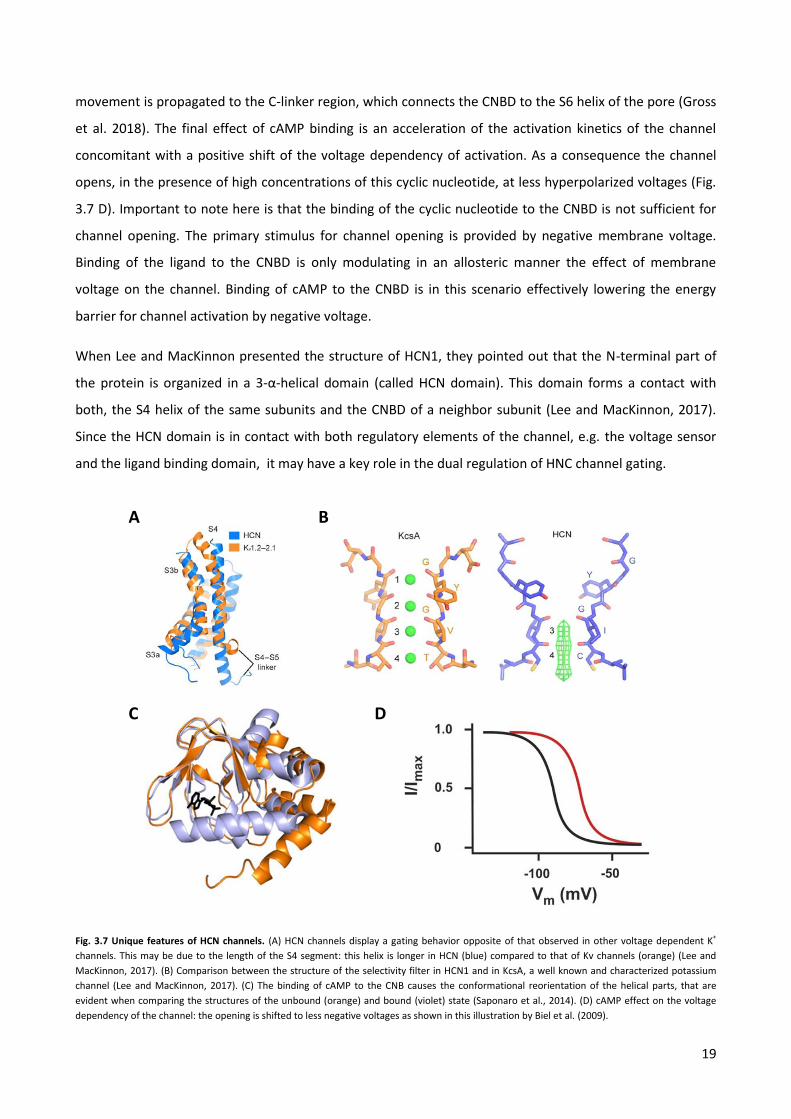
movement is propagated to the C-linker region, which connects the CNBD to the S6 helix of the pore (Gross
et al. 2018). The final effect of cAMP binding is an acceleration of the activation kinetics of the channel
concomitant with a positive shift of the voltage dependency of activation. As a consequence the channel
opens, in the presence of high concentrations of this cyclic nucleotide, at less hyperpolarized voltages (Fig.
3.7 D). Important to note here is that the binding of the cyclic nucleotide to the CNBD is not sufficient for
channel opening. The primary stimulus for channel opening is provided by negative membrane voltage.
Binding of the ligand to the CNBD is only modulating in an allosteric manner the effect of membrane
voltage on the channel. Binding of cAMP to the CNBD is in this scenario effectively lowering the energy
barrier for channel activation by negative voltage.
When Lee and MacKinnon presented the structure of HCN1, they pointed out that the N-terminal part of
the protein is organized in a 3-α-helical domain (called HCN domain). This domain forms a contact with
both, the S4 helix of the same subunits and the CNBD of a neighbor subunit (Lee and MacKinnon, 2017).
Since the HCN domain is in contact with both regulatory elements of the channel, e.g. the voltage sensor
and the ligand binding domain, it may have a key role in the dual regulation of HNC channel gating.
Fig. 3.7 Unique features of HCN channels. (A) HCN channels display a gating behavior opposite of that observed in other voltage dependent K+
channels. This may be due to the length of the S4 segment: this helix is longer in HCN (blue) compared to that of Kv channels (orange) (Lee and
MacKinnon, 2017). (B) Comparison between the structure of the selectivity filter in HCN1 and in KcsA, a well known and characterized potassium
channel (Lee and MacKinnon, 2017). (C) The binding of cAMP to the CNB causes the conformational reorientation of the helical parts, that are
evident when comparing the structures of the unbound (orange) and bound (violet) state (Saponaro et al., 2014). (D) cAMP effect on the voltage
dependency of the channel: the opening is shifted to less negative voltages as shown in this illustration by Biel et al. (2009).
A B
C D
20
The present work focuses on one member of the HCN family namely the HCN4 isoform. This channel plays a
key role in the generation and the regulation of the spontaneous electrical activity of the heart. HCN4 is
indeed the HCN isoform, which is most highly expressed in the sinoatrial node (SAN), the natural
pacemaker of the heart (Shi et al.,1998; Difrancesco 2010; Baruscotti et al.,2010). Therefore HCN4 provides
the main contribution to the If current and in this way to the autonomous pace making of the SAN. SAN
cells display a spontaneous and rythmic electrical activity, which means that they are able to fire
continuously action potentials, without the requirement of any excitatory input from the nerves. The
electrical signals generated in the SAN propagate through the whole heart causing the rhythmical
contraction of the cardiac muscular tissue and, therefore, the beating of the heart.
The spontaneous firing of the SAN is possible thanks to the peculiar characteristics of the HCN channels,
which were described in the previous paragraphs: the opening at hyperpolarized voltages and the ability to
conduct both Na+ and K+. The mechanism was first proposed in the seventies and eighties of the last
century on the basis of several experimental observation (reviewed in DiFrancesco 2010). It was observed
that an action potential depolarizes at its peak up to +30 mV before returning back to negative voltages
(repolarization) by the opening of K+ channels. This repolarization phase causes the membrane voltage to
hyperpolarize up to -60 mV, a voltage at which the HCN channels start to open. The opening of the HCN
channels at negative voltages results, because of the electrochemical gradient existing across the
membrane, in the depolarizing current If. As a consequence the membrane potential slowly depolarizes, a
phenomenon known as slow diastolic depolarization (SDD). The SDD brings the voltage to the threshold for
the subsequent action potential (Fig. 3.8). Thanks to the unique biophysical properties of HCN channels, the
SAN cells are able to continuously generate firing: the last phase of an action potential triggers the
mechanism that leads to the activation of another one.
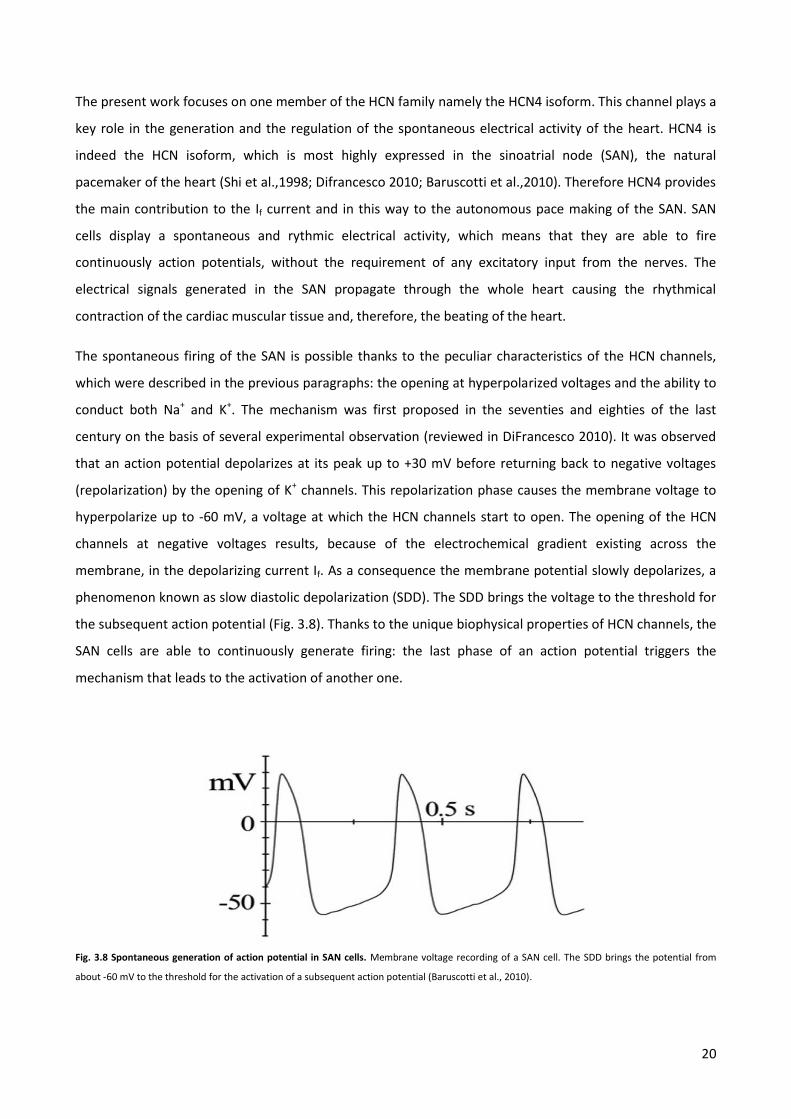
Fig. 3.8 Spontaneous generation of action potential in SAN cells. Membrane voltage recording of a SAN cell. The SDD brings the potential from
about -60 mV to the threshold for the activation of a subsequent action potential (Baruscotti et al., 2010).
21
As previously mentioned, the voltage dependency of the channel is shifted to positive voltages following
cAMP binding. The degree of the shift along the voltage axis is in this case a function of the cAMP
concentration (DiFrancesco and Tortora, 1991). This mechanism allows a fine tuning of the If current by
physiological changes in the concentration of this second messenger in the cytoplasm. As a result of this
tuning of HCN4 activity in SAN cells, the timing and the duration of the SDD is modulated by the cAMP
concentration. The latter, in SAN cells, increases and decreases after beta-adrenergic and cholinergic
stimulation, respectively (Sicchitano et al., 2012). The adrenergic and muscarinic receptors are in this
scenario the initiators of pathways, which eventually affect the concentration of cAMP and therefore the
opening of HCN4 channels (Barbuti and DiFrancesco, 2008). An increase of the intracellular concentration,
of cAMP as output of a signal cascade, will in this way augment opening of the channel already at less
negative voltages. This in turn affects the activation of theSDD, causing a faster frequency of the firing (Di
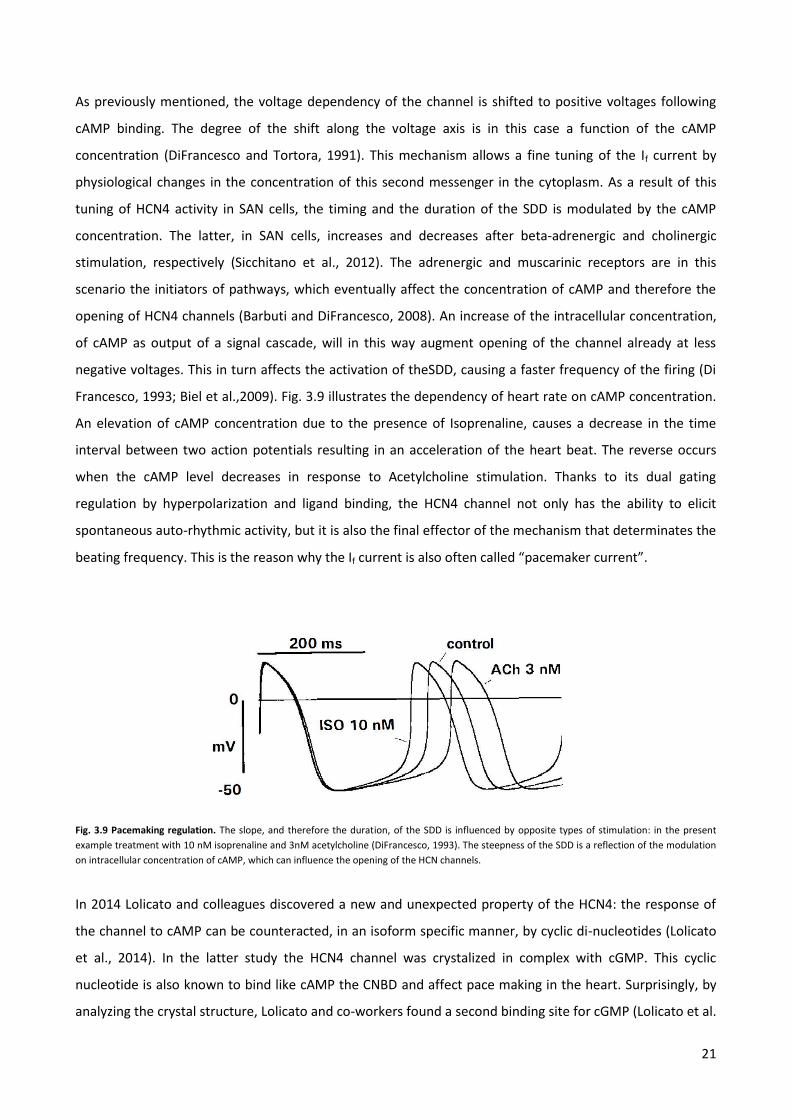
Francesco, 1993; Biel et al.,2009). Fig. 3.9 illustrates the dependency of heart rate on cAMP concentration.
An elevation of cAMP concentration due to the presence of Isoprenaline, causes a decrease in the time
interval between two action potentials resulting in an acceleration of the heart beat. The reverse occurs
when the cAMP level decreases in response to Acetylcholine stimulation. Thanks to its dual gating
regulation by hyperpolarization and ligand binding, the HCN4 channel not only has the ability to elicit
spontaneous auto-rhythmic activity, but it is also the final effector of the mechanism that determinates the
beating frequency. This is the reason why the If current is also often called “pacemaker current”.
Fig. 3.9 Pacemaking regulation. The slope, and therefore the duration, of the SDD is influenced by opposite types of stimulation: in the present
example treatment with 10 nM isoprenaline and 3nM acetylcholine (DiFrancesco, 1993). The steepness of the SDD is a reflection of the modulation
on intracellular concentration of cAMP, which can influence the opening of the HCN channels.
In 2014 Lolicato and colleagues discovered a new and unexpected property of the HCN4: the response of
the channel to cAMP can be counteracted, in an isoform specific manner, by cyclic di-nucleotides (Lolicato
et al., 2014). In the latter study the HCN4 channel was crystalized in complex with cGMP. This cyclic
nucleotide is also known to bind like cAMP the CNBD and affect pace making in the heart. Surprisingly, by
analyzing the crystal structure, Lolicato and co-workers found a second binding site for cGMP (Lolicato et al.
22
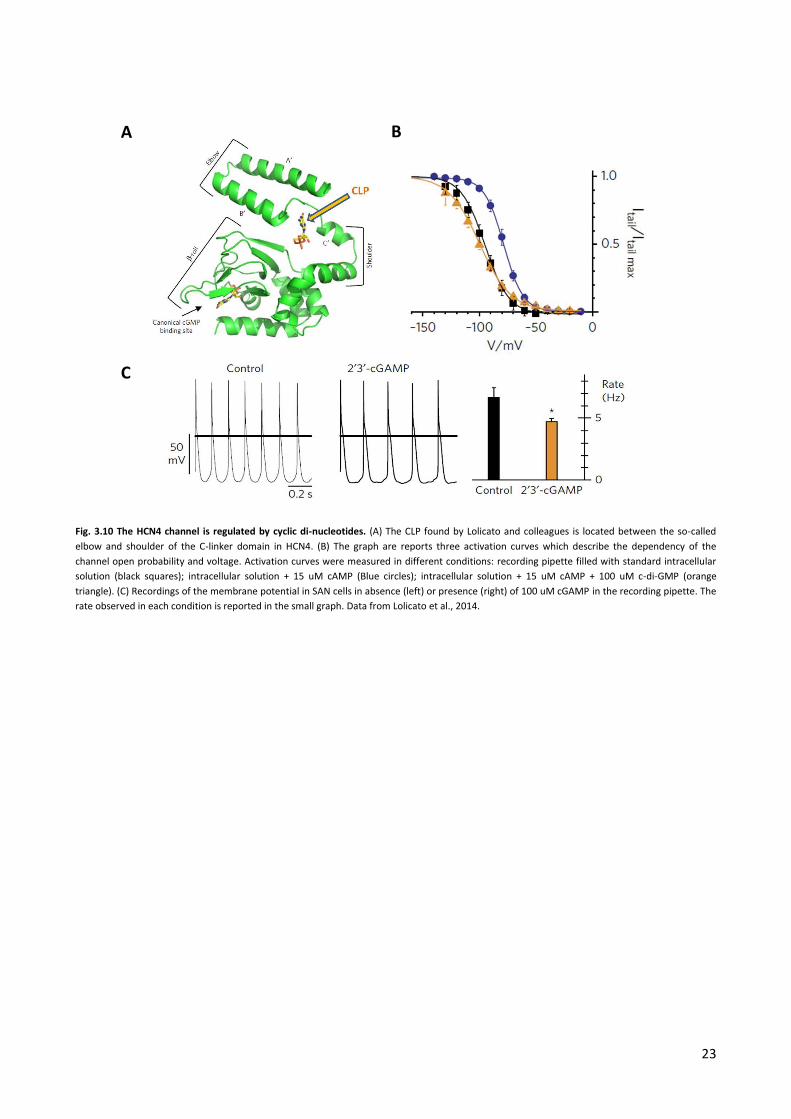
2014). This binding site in the C-linker was called C-linker poket (CLP). The CLP is located between the
second and the third helices of the C-linker, a region important for the propagation of conformational
changes between the CNBD and the pore (Fig.3.10 A) (Gross et al. 2018). Further scrutiny of the structural
data suggested that the pocket might be wide enough to bind a molecule about twice the size of cGMP. For
this reason and supported by docking studies, the authors of this study tested, whether c-di-GMP or other
cyclic di-nucleotides could bind the CLP and affect channel opening.
For this purpose, they measured HCN4 activity in patch clamp recordings in HEK293 cells in presence and
absence of 100 uM c-di-GMP, c-di-AMP and cGAMP in the recording pipette. The electrophysiological assay
revealed that the cyclic di-nucleotides had by itself no effect on the voltage dependency of the HCN4
channel. However when the measurements were repeated in presence of saturating concentration of
cAMP (delivered via pipette as well) they found that cyclic di-nucleotides completely reversed the positive
shift of the HCN4 activation curve. Only when cAMP was added to the pipette solution alone they observed
the expected right shift; a co-presence of cAMP and cyclic di-nucleotides completely suppressed the
positive shift of cAMP (Fig. 3.10 B). Control experiments confirmed the view that this effect was due to the
specific binding of cyclic di-nucleotides to the newly discovered binding site. Mutations of amino acids,
which were presumably involved in the binding of cyclic di-nucleotides to the respective site, eliminated
the effect of these molecules. To test whether this antagonistic action of cyclic di-nucleotides on cAMP
regulation of the HCN4 channel could affect a key physiological function of the channel such as
peacemaking, the authors recorded the membrane potential of SAN cardiomyocites. Consistent with the
effect of cyclic di-nucleotides on the HCN4 activation curve, the presence of cyclic di-nucleotides (in this
case cGAMP) in the recording pipette caused a decrease in the spontaneous firing rate of SAN cells (Fig.
3.10 C). Binding to CLP seems to prevent β-adrenergic stimulation on the If current, mimicking the
physiological effect of acetylcholine. Since the newly discovered CLP is located in a region of the channel
that connects the CNBD and the pore it was hypothesized that ligand binding to the CLP may hamper the
transmission of the conformational change from the CNBD to the pore.
Cyclic di-nucleotides are small molecule commonly used as second messenger in bacteria. The only second
messenger present in mammals is the cGAMP, which is synthesized only in cells of the immune system in
response to exogenous DNA in the cytoplasm. C-di-GMP is not present at all in mammals and, in particular,
in humans. Therefore it is tempting to exploit this system in an orthogonal pathway for regulating HCN4. In
this work I tried to establish a system with a light regulated di-guanylate cyclases from bacteria, which
might be used as a tool for a remote control of HCN4 channel activity and hence heart rate.
23
Fig. 3.10 The HCN4 channel is regulated by cyclic di-nucleotides. (A) The CLP found by Lolicato and colleagues is located between the so-called
elbow and shoulder of the C-linker domain in HCN4. (B) The graph are reports three activation curves which describe the dependency of the
channel open probability and voltage. Activation curves were measured in different conditions: recording pipette filled with standard intracellular
solution (black squares); intracellular solution + 15 uM cAMP (Blue circles); intracellular solution + 15 uM cAMP + 100 uM c-di-GMP (orange
triangle). (C) Recordings of the membrane potential in SAN cells in absence (left) or presence (right) of 100 uM cGAMP in the recording pipette. The
rate observed in each condition is reported in the small graph. Data from Lolicato et al., 2014.
A B
C
24
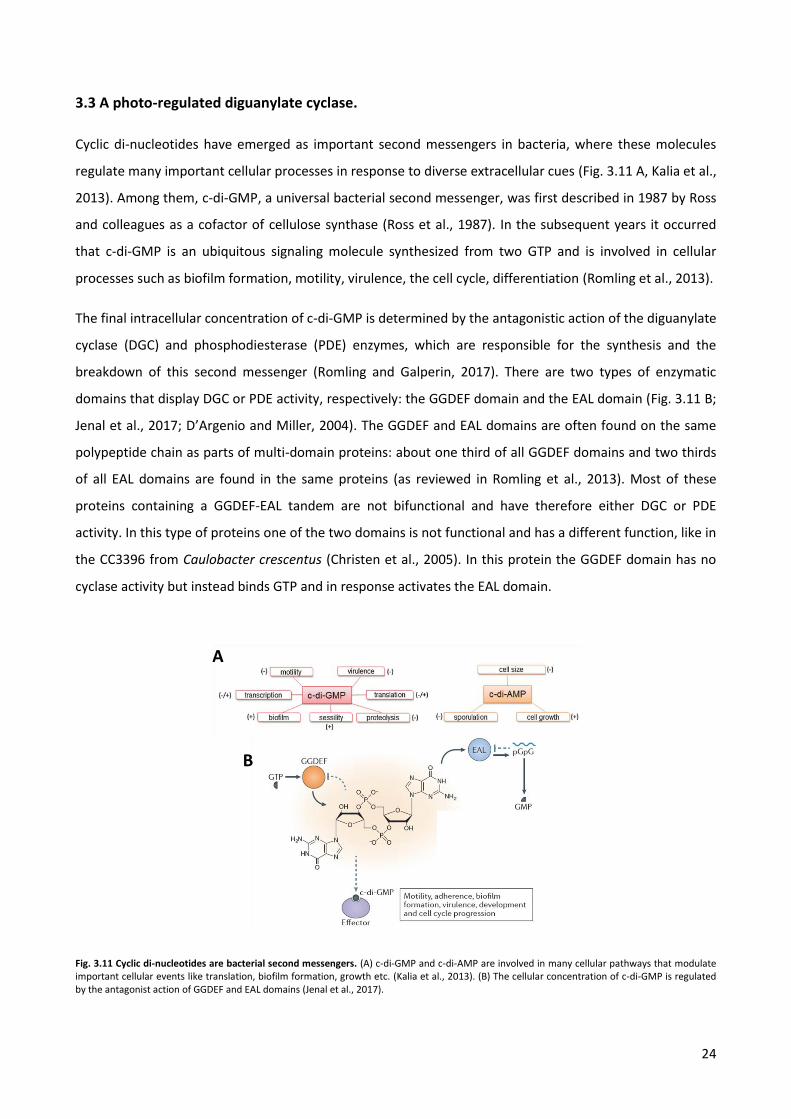
3.3 A photo-regulated diguanylate cyclase.
Cyclic di-nucleotides have emerged as important second messengers in bacteria, where these molecules
regulate many important cellular processes in response to diverse extracellular cues (Fig. 3.11 A, Kalia et al.,
2013). Among them, c-di-GMP, a universal bacterial second messenger, was first described in 1987 by Ross
and colleagues as a cofactor of cellulose synthase (Ross et al., 1987). In the subsequent years it occurred
that c-di-GMP is an ubiquitous signaling molecule synthesized from two GTP and is involved in cellular
processes such as biofilm formation, motility, virulence, the cell cycle, differentiation (Romling et al., 2013).
The final intracellular concentration of c-di-GMP is determined by the antagonistic action of the diguanylate
cyclase (DGC) and phosphodiesterase (PDE) enzymes, which are responsible for the synthesis and the
breakdown of this second messenger (Romling and Galperin, 2017). There are two types of enzymatic
domains that display DGC or PDE activity, respectively: the GGDEF domain and the EAL domain (Fig. 3.11 B;
Jenal et al., 2017; D’Argenio and Miller, 2004). The GGDEF and EAL domains are often found on the same
polypeptide chain as parts of multi-domain proteins: about one third of all GGDEF domains and two thirds
of all EAL domains are found in the same proteins (as reviewed in Romling et al., 2013). Most of these
proteins containing a GGDEF-EAL tandem are not bifunctional and have therefore either DGC or PDE
activity. In this type of proteins one of the two domains is not functional and has a different function, like in
the CC3396 from Caulobacter crescentus (Christen et al., 2005). In this protein the GGDEF domain has no
cyclase activity but instead binds GTP and in response activates the EAL domain.
Fig. 3.11 Cyclic di-nucleotides are bacterial second messengers. (A) c-di-GMP and c-di-AMP are involved in many cellular pathways that modulate important cellular events like translation, biofilm formation, growth etc. (Kalia et al., 2013). (B) The cellular concentration of c-di-GMP is regulated by the antagonist action of GGDEF and EAL domains (Jenal et al., 2017).
A
B
25
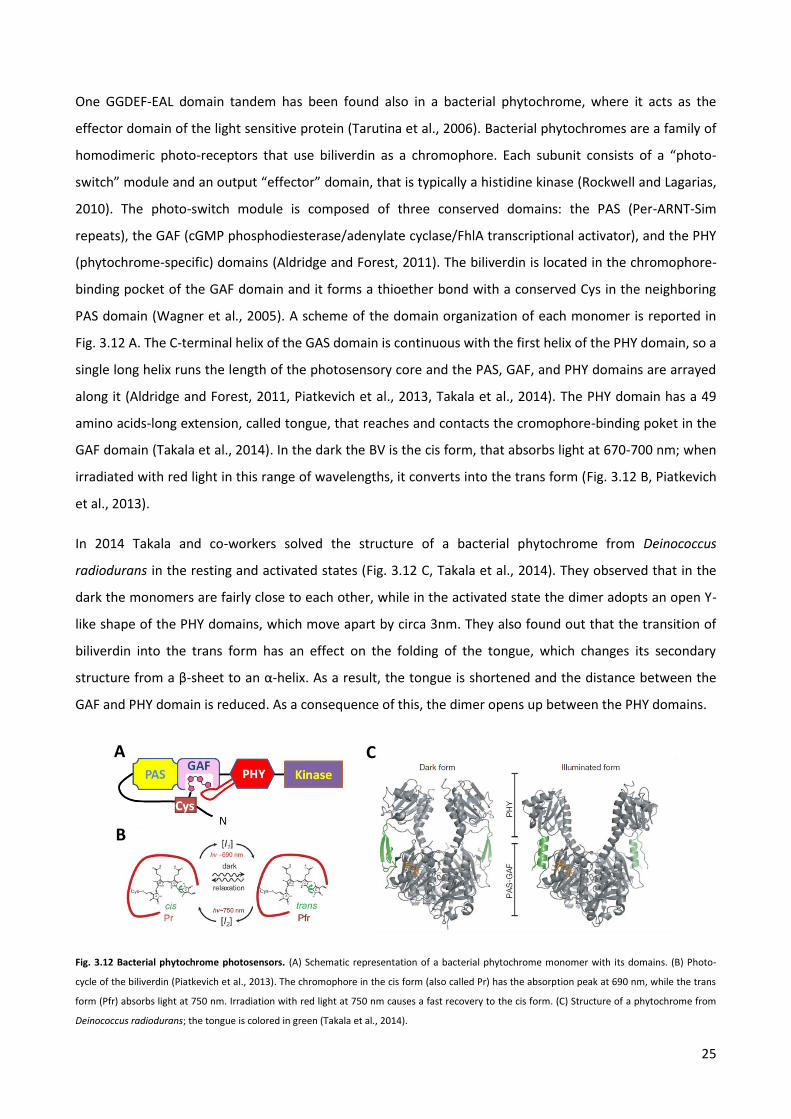
One GGDEF-EAL domain tandem has been found also in a bacterial phytochrome, where it acts as the
effector domain of the light sensitive protein (Tarutina et al., 2006). Bacterial phytochromes are a family of
homodimeric photo-receptors that use biliverdin as a chromophore. Each subunit consists of a “photo-
switch” module and an output “effector” domain, that is typically a histidine kinase (Rockwell and Lagarias,
2010). The photo-switch module is composed of three conserved domains: the PAS (Per-ARNT-Sim
repeats), the GAF (cGMP phosphodiesterase/adenylate cyclase/FhlA transcriptional activator), and the PHY
(phytochrome-specific) domains (Aldridge and Forest, 2011). The biliverdin is located in the chromophore-
binding pocket of the GAF domain and it forms a thioether bond with a conserved Cys in the neighboring
PAS domain (Wagner et al., 2005). A scheme of the domain organization of each monomer is reported in
Fig. 3.12 A. The C-terminal helix of the GAS domain is continuous with the first helix of the PHY domain, so a
single long helix runs the length of the photosensory core and the PAS, GAF, and PHY domains are arrayed
along it (Aldridge and Forest, 2011, Piatkevich et al., 2013, Takala et al., 2014). The PHY domain has a 49
amino acids-long extension, called tongue, that reaches and contacts the cromophore-binding poket in the
GAF domain (Takala et al., 2014). In the dark the BV is the cis form, that absorbs light at 670-700 nm; when
irradiated with red light in this range of wavelengths, it converts into the trans form (Fig. 3.12 B, Piatkevich
et al., 2013).
In 2014 Takala and co-workers solved the structure of a bacterial phytochrome from Deinococcus
radiodurans in the resting and activated states (Fig. 3.12 C, Takala et al., 2014). They observed that in the
dark the monomers are fairly close to each other, while in the activated state the dimer adopts an open Y-
like shape of the PHY domains, which move apart by circa 3nm. They also found out that the transition of
biliverdin into the trans form has an effect on the folding of the tongue, which changes its secondary
structure from a β-sheet to an α-helix. As a result, the tongue is shortened and the distance between the
GAF and PHY domain is reduced. As a consequence of this, the dimer opens up between the PHY domains.
Fig. 3.12 Bacterial phytochrome photosensors. (A) Schematic representation of a bacterial phytochrome monomer with its domains. (B) Photo-
cycle of the biliverdin (Piatkevich et al., 2013). The chromophore in the cis form (also called Pr) has the absorption peak at 690 nm, while the trans
form (Pfr) absorbs light at 750 nm. Irradiation with red light at 750 nm causes a fast recovery to the cis form. (C) Structure of a phytochrome from
Deinococcus radiodurans; the tongue is colored in green (Takala et al., 2014).
B
C A
26
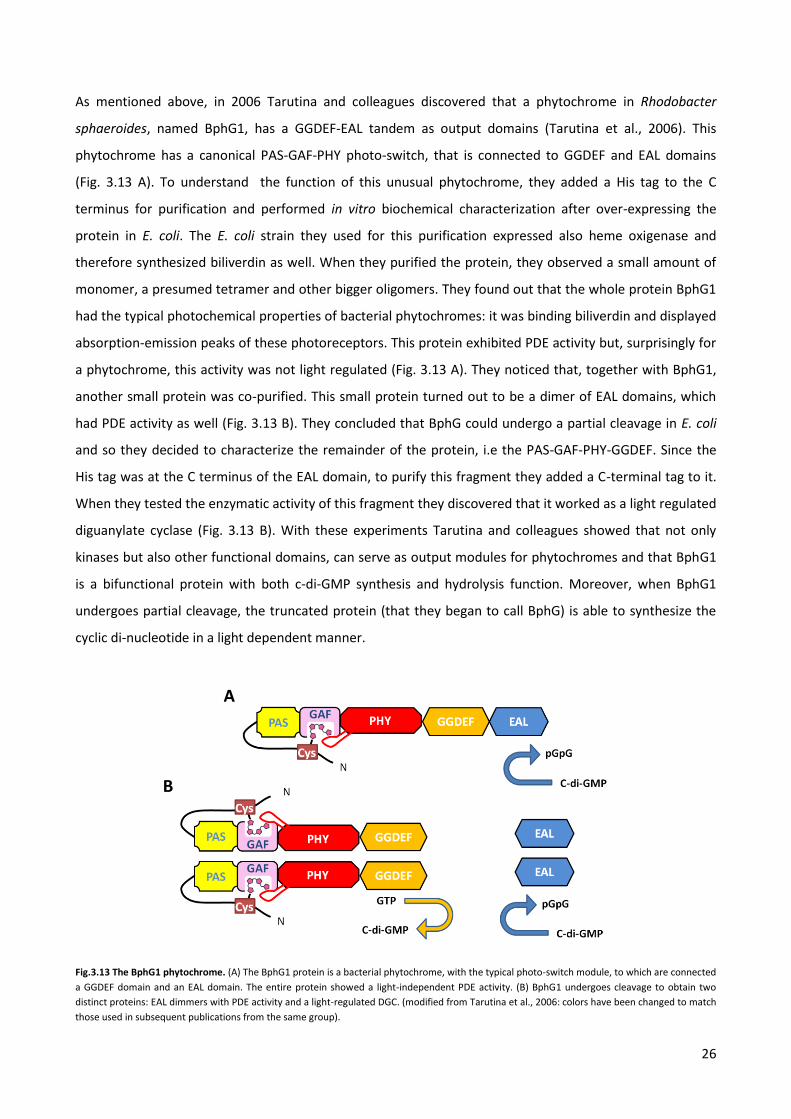
As mentioned above, in 2006 Tarutina and colleagues discovered that a phytochrome in Rhodobacter
sphaeroides, named BphG1, has a GGDEF-EAL tandem as output domains (Tarutina et al., 2006). This
phytochrome has a canonical PAS-GAF-PHY photo-switch, that is connected to GGDEF and EAL domains
(Fig. 3.13 A). To understand the function of this unusual phytochrome, they added a His tag to the C
terminus for purification and performed in vitro biochemical characterization after over-expressing the
protein in E. coli. The E. coli strain they used for this purification expressed also heme oxigenase and
therefore synthesized biliverdin as well. When they purified the protein, they observed a small amount of
monomer, a presumed tetramer and other bigger oligomers. They found out that the whole protein BphG1
had the typical photochemical properties of bacterial phytochromes: it was binding biliverdin and displayed
absorption-emission peaks of these photoreceptors. This protein exhibited PDE activity but, surprisingly for
a phytochrome, this activity was not light regulated (Fig. 3.13 A). They noticed that, together with BphG1,
another small protein was co-purified. This small protein turned out to be a dimer of EAL domains, which
had PDE activity as well (Fig. 3.13 B). They concluded that BphG could undergo a partial cleavage in E. coli
and so they decided to characterize the remainder of the protein, i.e the PAS-GAF-PHY-GGDEF. Since the
His tag was at the C terminus of the EAL domain, to purify this fragment they added a C-terminal tag to it.
When they tested the enzymatic activity of this fragment they discovered that it worked as a light regulated
diguanylate cyclase (Fig. 3.13 B). With these experiments Tarutina and colleagues showed that not only
kinases but also other functional domains, can serve as output modules for phytochromes and that BphG1
is a bifunctional protein with both c-di-GMP synthesis and hydrolysis function. Moreover, when BphG1
undergoes partial cleavage, the truncated protein (that they began to call BphG) is able to synthesize the
cyclic di-nucleotide in a light dependent manner.
Fig.3.13 The BphG1 phytochrome. (A) The BphG1 protein is a bacterial phytochrome, with the typical photo-switch module, to which are connected
a GGDEF domain and an EAL domain. The entire protein showed a light-independent PDE activity. (B) BphG1 undergoes cleavage to obtain two
distinct proteins: EAL dimmers with PDE activity and a light-regulated DGC. (modified from Tarutina et al., 2006: colors have been changed to match
those used in subsequent publications from the same group).
A
B

27
Some years later, the same group had the idea to use BphG for developing an optogentic tool, which is able
to synthesize the second messenger c-di-GMP in a light dependent manner (Ryu et al., 2014). They
monitored the production of c-di-GMP in vivo in E. Coli cells and found that the activity of the protein was
very poor. The intracellular concentration of the second messenger was indeed incompatible with the
activation of many c-di-GMP dependent processes. To improve the cyclase activity, they substituted the
GGDEF domain of BphG with the GGDEF domain of a more active DGC from Synechocystis sp. called
Slr1143: this Chimeric protein was called BphS1. Upon irradiation with red light, the BphS1 construct
showed a circa 2.5-fold higher DGC activity compared to BphG. To further improve the cyclase activity of
the chimera, they introduced a mutation in the conserved RXXD sequence motif located in the GGDEF
domain of Slr1143. This motif is involved in a feedback inhibition mechanism of DGC activity. They
introduced the mutation R587A (R250 of Slr1143) and eliminated the feedback inhibition system. A
schematic representation of this protein assemble is reported in Fig. 3.14 A. The mutated construct (named
BphS) turned out to have a DGC activity in the light that was circa 2.2-fold higher than that of BphS1
and 5.5-fold higher compared to the original BphG. This modification hence resulted in an improvement of
the DGC activity but, at the same time, caused also an unwanted increase in the dark activity of the protein.
To circumvent this problem they co-expressed a constitutive PDE, which should maintain low levels of c-di-
GMP in the dark: YhjH (Fig. 3.14 B).
The expression of YhjH needed to be adjusted to achieve degradation of the cyclic di-nucleotide in the dark
without affecting (or affecting only minimally) the c-di-GMP synthesis in the light. To do this, they prepared
different plasmids in which they inserted, upstream of YhjH, different ribosome binding sites (RBSs). They
expressed the plasmid in E. coli cells and checked their motility. It was indeed known that c-di-GMP can
bind a specific receptor that hampers the activity of the flagellum rotor. With this functional assay they
were able to select the RBS, which offers the biggest difference in motility between light and dark (Fig. 3.14
C). To further verify that the co-expression of BphS and YhjH can be used to photo-modulate cellular
phenomena, they tested the ability of the system to activate a c-di-GMP-dependent expression system.
They were able to obtain a light-dependent expression of lacZ, monitored with the color of the colonies.
In further experiments the combined BphS-YhjH system could be used to increase the intracellular
concentration of c-di-GMP in response to far red light and therefore to photo-modulate pathways activated
by this second messenger. The construct has two important features. 1. It responds to red light e.g. a light
that is able to penetrate tissues more deeply than blue or yellow light. 2. As mentioned in previous
paragraphs, cyclic di-nucleotides are second messengers in bacteria, not in mammals. In humans, cGAMP
can be found only in cells of the immune system under certain conditions, i.e. activation of the immune
response, while c-di-GMP is totally absent in human cells. Since the bacterial and human system are
orthogonal the c-di-GMP concentration in human cells can be manipulated without altering other

28
physiological signaling pathways, i.e. cascades which are activated by endogenous mammalian second
messengers like cAMP. One target for the light-dependently produced c-di-GMP could be the HCN4
channel, as it can be directly regulated by cyclic di-nucleotides. The aim of this work was to examine the
possibility of using the bacterial cyclases described in the previous paragraph to photo-modulate channel
gating of HCN4 and as a result the pacemaker current If in the sinoadrinal node.
Fig 3.14 The synthetic BphS construct. (A) Construction of the Chimeric protein BphS by fusing BphG and Slr1143. (B) The dual regulation of c-di-
GMP levels by BphS and YhjH. (C) Light regulation of c-di-GMP production reflects on the different motility in light and dark of bacterial cells
expressing BphS and YhjH. The numbers indicates the different RBSs used. V indicates cells transformed with an empty vector.
C
B A
29
3.4 Aim of the thesis
The current progress in optogenetics underscores that the regulation of cellular events with light is very
useful for research and applications in many areas of biology. This has stimulated the development of new
optogenetic tools in the past years. With the present project we wanted to examine the possibility of
designing a potential new optogenetic tool for a remote regulation of the HCN4 channel by light. This
channel is crucially involved in the generation of the spontaneous electrical activity in the pacemaker cells
of the sinus node and its activity determines the frequency of the heart beat. Like in the case of all HCN
channels also the gating of HCN4 is dually controlled by voltage and cAMP. The channel is activated by
hyperpolarization and this voltage dependence is further modulated by cAMP. This second messenger
binds the C-terminal domain of the channel in the cytoplasm, causing a positive shift in the channel voltage
dependency. Upon binding of cAMP, the channel opens at less depolarized voltages as the binding of the
cyclic nucleotide stabilizes the open state of the pore. The consequence of this cAMP mediated alosteric
regulation of HCN4 channels, in the sinol adrial node, is a fine tuning of the beating frequency of the heart.
It has been demonstrated that also cyclic di-nucleotides can bind the HCN4 channel, in an isoform specific
manner, in a binding side upstream of the cAMP binding site. The effect of cyclic di-nucleotide binding to
HCN4 is to counteract the effect of cAMP on the channel voltage dependence. The present project is
inspired by the idea that the gating of HCN4 channels and consequently the frequency of heart beat can be
influenced via a modulation of cyclic di-nucleotides concentration in the sinus node .
Cyclic di-nucleotides are ubiquitous second messengers in bacteria, where they regulate many different
pathways. Among the cyclic di-nucleotides, c-di-GMP is completely absent in human cells. This implies that
the synthesis and degradation of this molecule, by specific cyclases and phosphodiesterases, should not
affect physiological pathways of human cells, in which cAMP or cGMP are used as second messengers. The
idea of creating a light regulated system is based on the finding of a bacterial phytochrome, which catalyses
the synthesis of c-di-GMP in a far red light dependent manner. It is important to mention that such a red
light based optogenetic tool would favor applications over those triggered by blue light, since the former is
able to penetrate tissues more deeply.
Given the present state of the art, we decided to test if it is possible to regulate the gating of HCN4 channel
by using bacterial di-guanylate cyclases. For this purpose we co-expressed these enzymes in human cells
together with HCN4 and tested if they were able to produce sufficient c-di-GMP in a light depednent
manner for affecting the voltage dependence of the channel. In the case that the light-activated enzyme is
able to generate an appreciable amount of c-di-GMP, it should counteract the effect of cAMP on channel
gating. By interfering with the cAMP dependent modulation of the funny current, this tool could be suitable
to achieve a remote regulation of the heart rate.

30
4
RESULTS AND DISCUSSION
31
4.1 A bacterial cyclase can modulate the voltage dependency of HCN4 channels
I reasoned that the best strategy for the construction of a light-regulated modulation of HCN4 channel
activity would be to start with the constitutively active diguanylate cyclase Slr1143 from the
cyanobacterium Synechocystis sp. This protein was extensively described in the Introduction. The GGDEF
domain of this protein is identical to the catalytic part of the light-activated construct BphS (Ryu and
Gomelsky, 2014). By expressing Slr1143 in HEK293T cells and measuring HCN4 channel activity, I wanted to
learn whether this protein is able to synthesize enough c-di-GMP to affect the voltage dependency of HCN4
channels. These experiments should also provide information on the time which is required between
transfection and the first measurable effect of c-di-GMP on HCN4 channel gating. The Slr1143 DNA for
these experiements was provided by the laboratory of prof. Gomelsky. The gene was inserted in a pCAG
expression vector that included a GFP tag (PCAG-GFP; PSV40-Slr1143). As mentioned in Matherials and
Methods, for this work it was used rabbit HCN4 DNA (RbHCN4) that was included into a pCI vector (PCMV-
RbHCN4). From now on I will refer to this channel and its DNA simply as HCN4. GFP DNA was required to
monitor the expression of the channel in control cells, given the lack of fluorescent tag in the pCI vector.
The GFP gene was contained in a pMAX plasmid (PCMV-GFP). Both these two plasmids had been previously
proved to be suitable for transfection and expression of GFP and HCN4 in HEK293T cells. The HEK293T cells
were then transfected, as described in Materials and Methods, with 1 µg of HCN4 + 1µg of GFP (as control)
and 1 µg of HCN4 + 1 µg of Slr1143.
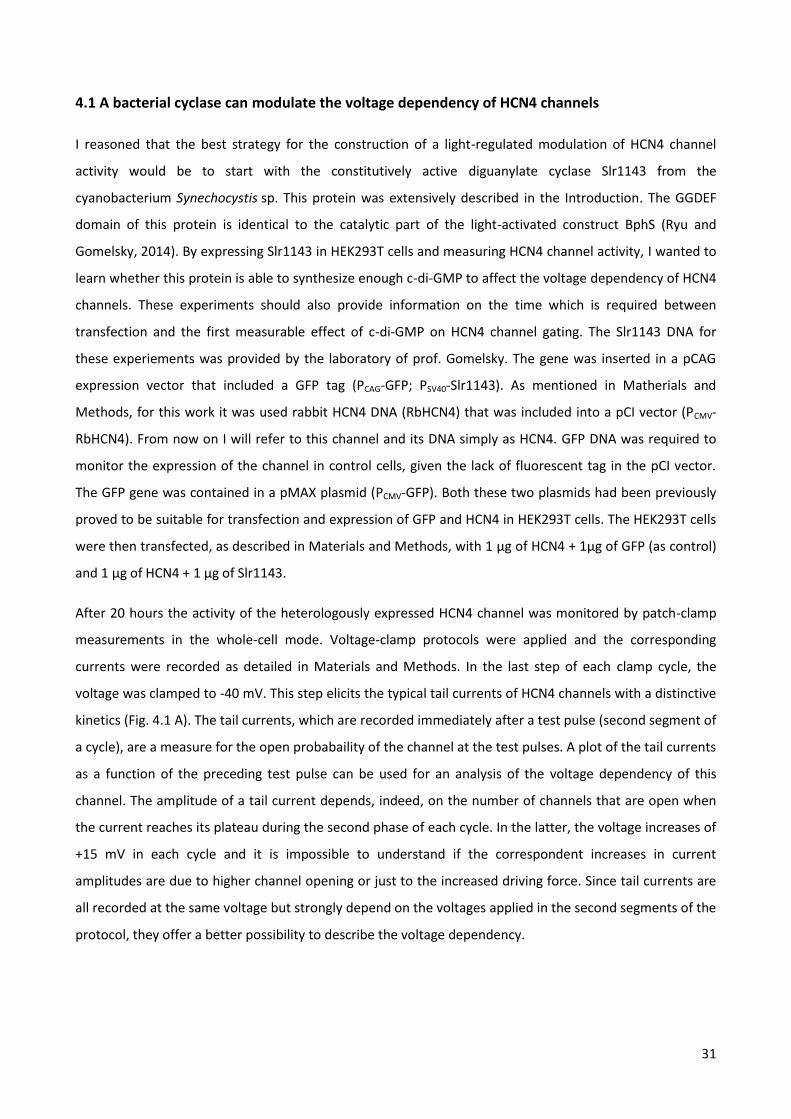
After 20 hours the activity of the heterologously expressed HCN4 channel was monitored by patch-clamp
measurements in the whole-cell mode. Voltage-clamp protocols were applied and the corresponding
currents were recorded as detailed in Materials and Methods. In the last step of each clamp cycle, the
voltage was clamped to -40 mV. This step elicits the typical tail currents of HCN4 channels with a distinctive
kinetics (Fig. 4.1 A). The tail currents, which are recorded immediately after a test pulse (second segment of
a cycle), are a measure for the open probabaility of the channel at the test pulses. A plot of the tail currents
as a function of the preceding test pulse can be used for an analysis of the voltage dependency of this
channel. The amplitude of a tail current depends, indeed, on the number of channels that are open when
the current reaches its plateau during the second phase of each cycle. In the latter, the voltage increases of
+15 mV in each cycle and it is impossible to understand if the correspondent increases in current
amplitudes are due to higher channel opening or just to the increased driving force. Since tail currents are
all recorded at the same voltage but strongly depend on the voltages applied in the second segments of the
protocol, they offer a better possibility to describe the voltage dependency.

32
Normalized tail current amplitudes were plotted as a function of the preceding test voltage. The sigmoidal
transition of the closed channel at positive voltages to the open channel at negative voltages can be fitted
with the Boltzman equation (Equation 1):
where A1 is the maximal tail current amplitude, A2 is the minimum tail current value, x is the test pulse
voltage, x0 is the half-activation voltage (V1/2) and dx is the slope factor. In this way it is possible to describe
the relationship between channel opening and voltage (Fig. 4.1 C).
Fig. 4.1 A shows an example for a measurement of HCN4 in a HEK293T cell under control condition, i.e.
without co-expression of Slr1143. The cell exhibited the typical currents of this inward rectifying channel, in
which hyperpolarizing voltages elicit a slow activating inward current. The kinetics of activation of HCN4, as
in this case, is typically accelerated the more negative is the imposed the voltage. The steady state I/V
relation of this recording showed that the channel is closed at positive voltages and only opens at voltages
more negative than approximately -70 mV (Fig. 4.1 B). The tail currents are shown in Fig. 4.1 A and data for
the activation curve were collected in the region marked by the red dashed lines. A plot of the normalized
tail currents as a function of the test voltages exhibited the typical shape of the activation curve of this
inward rectifier. It could be well fitted with the Boltzmann function yielding, in the present example, a value
for V1/2 of -110 ± 0.7 mV (Fig. 4.1 C). The slope factors and other parameters for this and the rest of the
figures are reported in Additional Information. The same measurements were repeated with 12 other
control cells giving a mean half-activation voltage of -107.7 ± 1.6 mV (Fig. 4.2). HCN channels are known to
display an high variability in the V 1/2 values: for the same channel different kinetics and V1/2 have been
found by different laboratories (Biel et al., 2016; Biel et al., 2009). For this reason, every set of experiments
includes control measurements; when changes in the V1/2 are shown, they always refer to the actual
controls from the same set of experiments.
The same measurements were repeated with cells co-expressing HCN4 and Slr1143. Fig. 4.1 A shows a
representative recording from such a HEK293T cell. Scrutiny of the current responses showed that the
currents were overall similar to those in control cells. But a closer inspection of the dynamics of activation
indicated that co-expression of Slr1143 caused a slight slowdown of channel activation. The steady state I/V
curve showed indeed that the channel began to open at more negative voltages compared to the controls:
-90 mV in the reported example (Fig. 4.1 B). A plot of the tail currents indicated that the activation curve of
the HCN4 channel is negatively shifted in the cell, which co-expresses the Slr1143 protein. In the present
example the fit of the data with the Boltzmann function showed a 8 mV left shift compared to the control
cells (Fig.4.1 C).
33
Figure 4.1 Co-expression of Slr1143 and HCN4 in HEK293T cells. (A) Exemplary current traces obtained by application of voltage protocols in control
and Slr1143-expressing cells. Tail currents recorded at -40 mV of each current family are enlarged and reported on the right for each measurement.
Amplitude values of the tail currents were taken in the region marked by the red dashed lines. (B) I/V curves from the measurements showed in (A),
obtained by plotting the steady state current amplitudes as a function of the voltage. (C) Normalized tail current amplitudes plotted as a function of
the preceding test voltage. Black dots: HCN4; Blue dots: HCN4 + Slr1143. Data points were fitted with the Boltzmann equation (equation 1). Color
code for the fitting is the same used for the data points.
The same experiments were repeated in 25 other cells where it turned out that the V1/2 values could be
separated in two populations (Fig. 4.2). In 50% of the cells the V1/2 value was identical to the control. In the
other 50% of the cells co-trasfected with HCN4 and Slr1143 (N=13) the V1/2 was -114.8 ± 0.9 mV. The
comparison with control cells suggested that this negative shift, of about 7 mV, is related to the effect of
the c-di-GMP on the endogenous cAMP binding to the CNBD. This result differed from what had been
A
B C

34
observed by Lolicato and colleagues, which didn’t see any effect of the c-di-GMP on the binding of basal
level of cAMP to the CNBD (Lolicato et al., 2014).
To test the hypothesis that the synthesis of c-di-GMP affects the regulation of HCN4 by cAMP, the
experiments in Fig. 4.1 were repeated by adding cAMP to the intracellualr solution (i.e. the pipette
solution) at saturating concentration (15 µM). An analysis of the V1/2 values from control cells showed that
the presence of cAMP caused the expected right shift of the HCN4 activation curve (Fig. 4.2). The average
V1/2 of control cells was -93.5 ± 2 mV (N=4). This value is similar to the cAMP induced shift of the activation
curve in other studies and supports the robustness of the measurements. In cells co-transfected with HCN4
+ Slr1143 the average V1/2 value was -95 ± 0.7 mV (N=6). The results of these experiments suggested that
the enzyme was not synthesizing enough c-diGMP to counteract the effect of saturating concentrations of
cAMP of the channel gating.
Fig. 4.2 V1/2 values of control and Slr1143-expressing cells. Mean ± S.E. of the V1/2 values of HEK293T cells expressing HCN4 or co-expressing HCN4 +
Slr1143 in presence or absence of cAMP in the recording pipette. Black circle: HCN4 (N=13); Blue circle: HCN4 + Slr1143, shifted (N=13); Blue
trangle: HCN4 + Slr1143, not shifted (N=12); Empty Black circle: HCN4 + 15uM cAMP (N=4); Empty blue circle: HCN4 + Slr1143 + 15uM cAMP (N=6).
The negative shift of the activation curve observed in cells expressing Slr1143 suggested that the c-di-GMP
synthesized by Slr1143, could be potentially able to modulate the voltage dependency of HCN4. One
mechanism by which it might do this is by interfering with the endogenous cAMP, which is present in the
cells and affects channel gating. The fact that the expression of Slr1143 was however not able to counteract

35
saturating concentrations of cAMP, which were delivered via the pipette, might indicate that the enzyme
was not synthesizing enough c-di-GMP to reverse the positive shift induced by this channel regulator when
the concentration of the latter increased. This conclusion was consistent with the observation that the
negative shift of the activation curve was only observed in 50% of the cells expressing Slr1143. It is
reasonable to assume that the level of c-di-GMP synthesis was so low that it was only able to counteract
the effect of the basal levels of cAMP on channel gating. In the light of these data we speculated that the
activity of the Slr1143 enzyme was not as strong as it was expected to be.
An idea for improving the performance of Slr1143 came from the literature. When Ryu and Gomelsky
developed BphS, they created a chimera by substituting the cyclase domain of the phytochrome BphG with
Slr1143 (Ryu and Gomelsky, 2014). Although the first results were encouraging, they needed to further
improve the c-di-GMP synthesis by introducing in Slr1143 a mutation known to augment the catalytic
activity of the GGDEF domain. For this purpose they mutated the arginine in position 250 (587 in the whole
BphS protein) into an alanine. Inspired by these data I decided to insert in Slr1143 the R250A mutation and,
moreover, to move it under a CAG promoter. This operation should increase both the expression and the
activity of the protein. I decided to move the construct in a plasmid that contained, in this order: a CAG
promoter, the multiple cloning site and an IRES sequence followed by a TdTomato (PCAG-IRES-Tdtomato)
This pCAG plasmid was already available in the lab and successfully used for previous cloning by colleagues:
for this reason was chosen to perform this cloning.
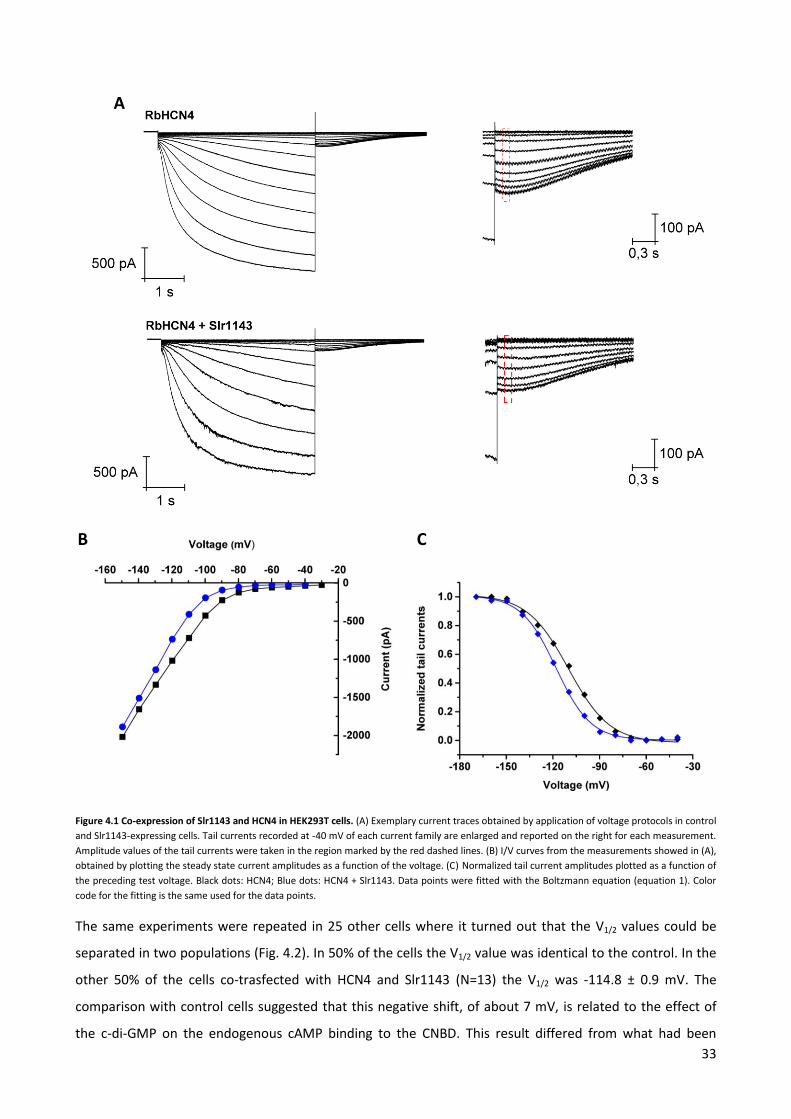
The mutated gene was transferred into the new plasmid with an enzyme-free cloning technique called
AQUA cloning (detailed description in Materials and Methods). This method requires the preparation of an
insert with flanking regions of homology to a linearized expression vector. The insert and the linearized
plasmid should then be transformed into competent E.coli cells, which will integrate the insert in the
plasmid via homologous recombination (Beyer at al., 2015). The Slr1143 R250A insert was prepared by
overlapping-PCR in order to insert the mutation and the flanking sequences. The desired PCR product was
gel-purified while the PCAG-IRES-Tdtomato plasmid was linearized by digestion with a restriction enzyme and
gel-purified as well. The insert and the linearized plasmid were then used to perform an AQUA cloning,
after which colonies were obtained and subsequently screened by colony-PCR. A scheme of the procedure
is reported in Fig. 4.3.
The new plasmid was tranfected into HEK293T cells using the same amount of DNA employed in the
previous experiments: 1 µg HCN4 + 1 µg Slr1143 R250A. After 20 hours, an unexpected effect was
observed: the cells were all dead and detached from the bottom of the petri. I reasoned that the
combination of the mutation and the new promoter were causing an over-expression of the protein and
therefore an excess of c-di-GMP in the cytoplasm. This high concentration of the signaling molecule might
have been the cause of cell death. To overcome this problem, I decided to try different experimental
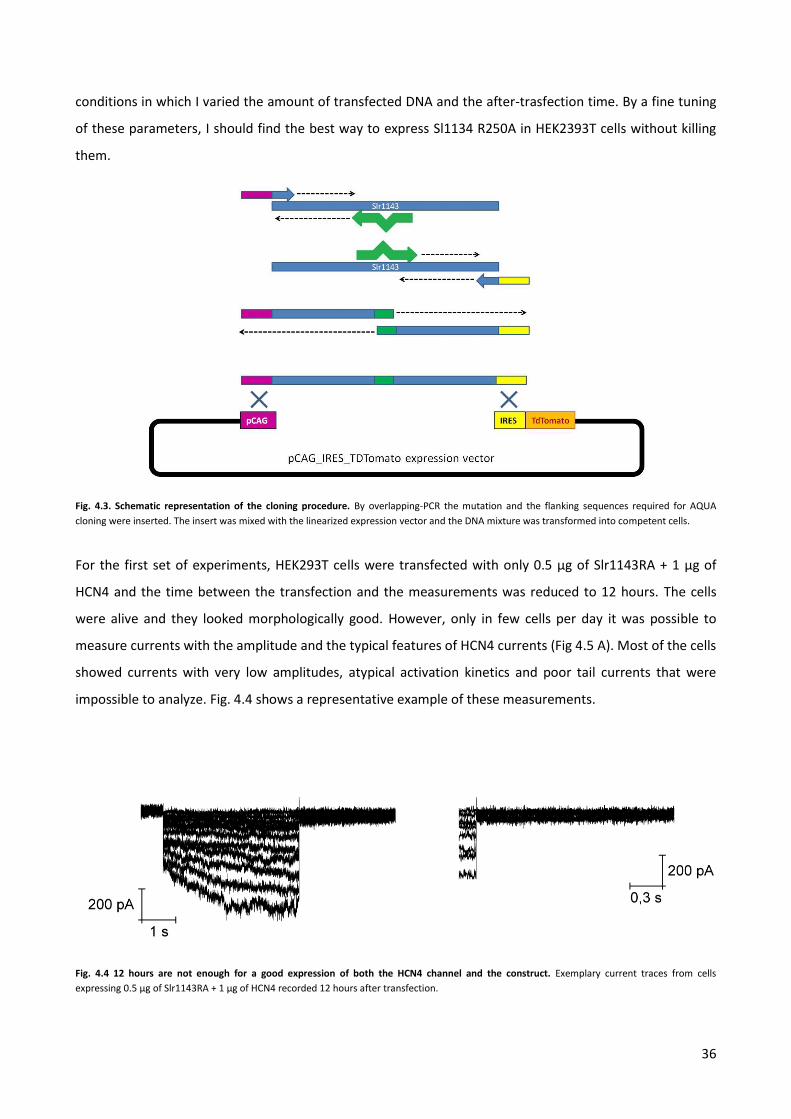
36
conditions in which I varied the amount of transfected DNA and the after-trasfection time. By a fine tuning
of these parameters, I should find the best way to express Sl1134 R250A in HEK2393T cells without killing
them.
Fig. 4.3. Schematic representation of the cloning procedure. By overlapping-PCR the mutation and the flanking sequences required for AQUA
cloning were inserted. The insert was mixed with the linearized expression vector and the DNA mixture was transformed into competent cells.
For the first set of experiments, HEK293T cells were transfected with only 0.5 µg of Slr1143RA + 1 µg of
HCN4 and the time between the transfection and the measurements was reduced to 12 hours. The cells
were alive and they looked morphologically good. However, only in few cells per day it was possible to
measure currents with the amplitude and the typical features of HCN4 currents (Fig 4.5 A). Most of the cells
showed currents with very low amplitudes, atypical activation kinetics and poor tail currents that were
impossible to analyze. Fig. 4.4 shows a representative example of these measurements.
Fig. 4.4 12 hours are not enough for a good expression of both the HCN4 channel and the construct. Exemplary current traces from cells
expressing 0.5 µg of Slr1143RA + 1 µg of HCN4 recorded 12 hours after transfection.
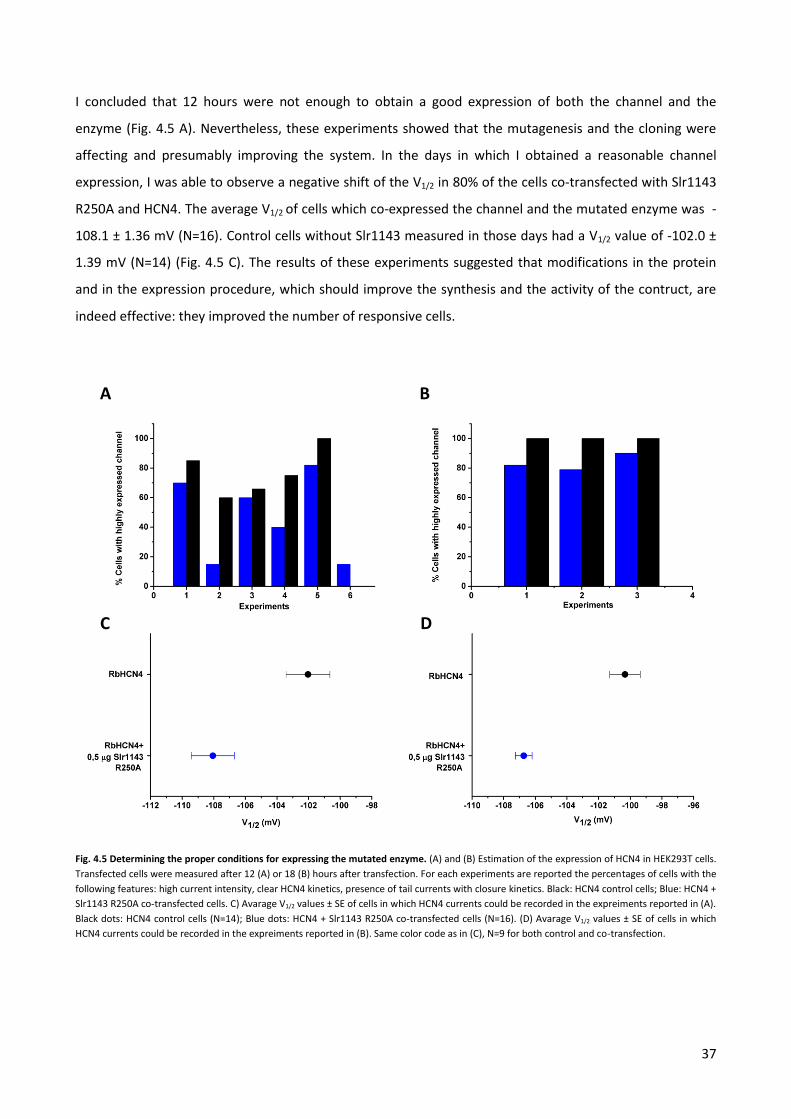
37
I concluded that 12 hours were not enough to obtain a good expression of both the channel and the
enzyme (Fig. 4.5 A). Nevertheless, these experiments showed that the mutagenesis and the cloning were
affecting and presumably improving the system. In the days in which I obtained a reasonable channel
expression, I was able to observe a negative shift of the V1/2 in 80% of the cells co-transfected with Slr1143
R250A and HCN4. The average V1/2 of cells which co-expressed the channel and the mutated enzyme was -
108.1 ± 1.36 mV (N=16). Control cells without Slr1143 measured in those days had a V1/2 value of -102.0 ±
1.39 mV (N=14) (Fig. 4.5 C). The results of these experiments suggested that modifications in the protein
and in the expression procedure, which should improve the synthesis and the activity of the contruct, are
indeed effective: they improved the number of responsive cells.
Fig. 4.5 Determining the proper conditions for expressing the mutated enzyme. (A) and (B) Estimation of the expression of HCN4 in HEK293T cells.
Transfected cells were measured after 12 (A) or 18 (B) hours after transfection. For each experiments are reported the percentages of cells with the
following features: high current intensity, clear HCN4 kinetics, presence of tail currents with closure kinetics. Black: HCN4 control cells; Blue: HCN4 +
Slr1143 R250A co-transfected cells. C) Avarage V1/2 values ± SE of cells in which HCN4 currents could be recorded in the expreiments reported in (A).
Black dots: HCN4 control cells (N=14); Blue dots: HCN4 + Slr1143 R250A co-transfected cells (N=16). (D) Avarage V1/2 values ± SE of cells in which
HCN4 currents could be recorded in the expreiments reported in (B). Same color code as in (C), N=9 for both control and co-transfection.
A
C
B
D
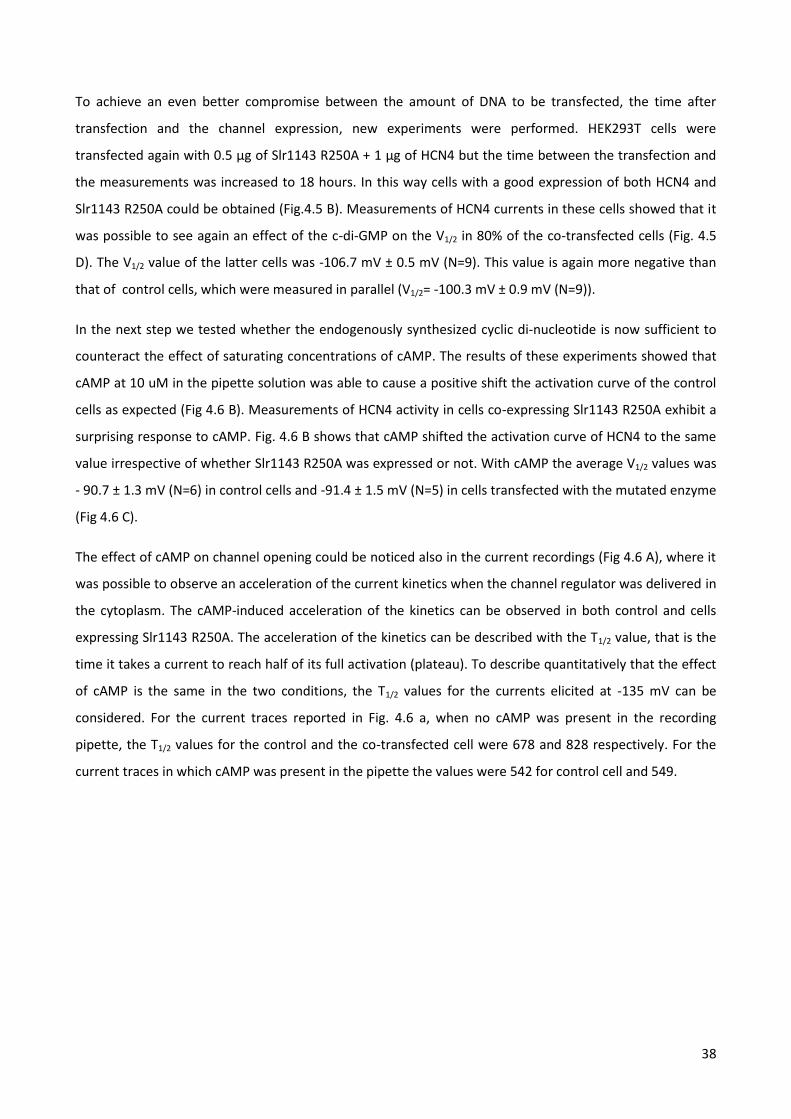
38
To achieve an even better compromise between the amount of DNA to be transfected, the time after
transfection and the channel expression, new experiments were performed. HEK293T cells were
transfected again with 0.5 µg of Slr1143 R250A + 1 µg of HCN4 but the time between the transfection and
the measurements was increased to 18 hours. In this way cells with a good expression of both HCN4 and
Slr1143 R250A could be obtained (Fig.4.5 B). Measurements of HCN4 currents in these cells showed that it
was possible to see again an effect of the c-di-GMP on the V1/2 in 80% of the co-transfected cells (Fig. 4.5
D). The V1/2 value of the latter cells was -106.7 mV ± 0.5 mV (N=9). This value is again more negative than
that of control cells, which were measured in parallel (V1/2= -100.3 mV ± 0.9 mV (N=9)).
In the next step we tested whether the endogenously synthesized cyclic di-nucleotide is now sufficient to
counteract the effect of saturating concentrations of cAMP. The results of these experiments showed that
cAMP at 10 uM in the pipette solution was able to cause a positive shift the activation curve of the control
cells as expected (Fig 4.6 B). Measurements of HCN4 activity in cells co-expressing Slr1143 R250A exhibit a
surprising response to cAMP. Fig. 4.6 B shows that cAMP shifted the activation curve of HCN4 to the same
value irrespective of whether Slr1143 R250A was expressed or not. With cAMP the average V1/2 values was
- 90.7 ± 1.3 mV (N=6) in control cells and -91.4 ± 1.5 mV (N=5) in cells transfected with the mutated enzyme
(Fig 4.6 C).
The effect of cAMP on channel opening could be noticed also in the current recordings (Fig 4.6 A), where it
was possible to observe an acceleration of the current kinetics when the channel regulator was delivered in
the cytoplasm. The cAMP-induced acceleration of the kinetics can be observed in both control and cells
expressing Slr1143 R250A. The acceleration of the kinetics can be described with the T1/2 value, that is the
time it takes a current to reach half of its full activation (plateau). To describe quantitatively that the effect
of cAMP is the same in the two conditions, the T1/2 values for the currents elicited at -135 mV can be
considered. For the current traces reported in Fig. 4.6 a, when no cAMP was present in the recording
pipette, the T1/2 values for the control and the co-transfected cell were 678 and 828 respectively. For the
current traces in which cAMP was present in the pipette the values were 542 for control cell and 549.
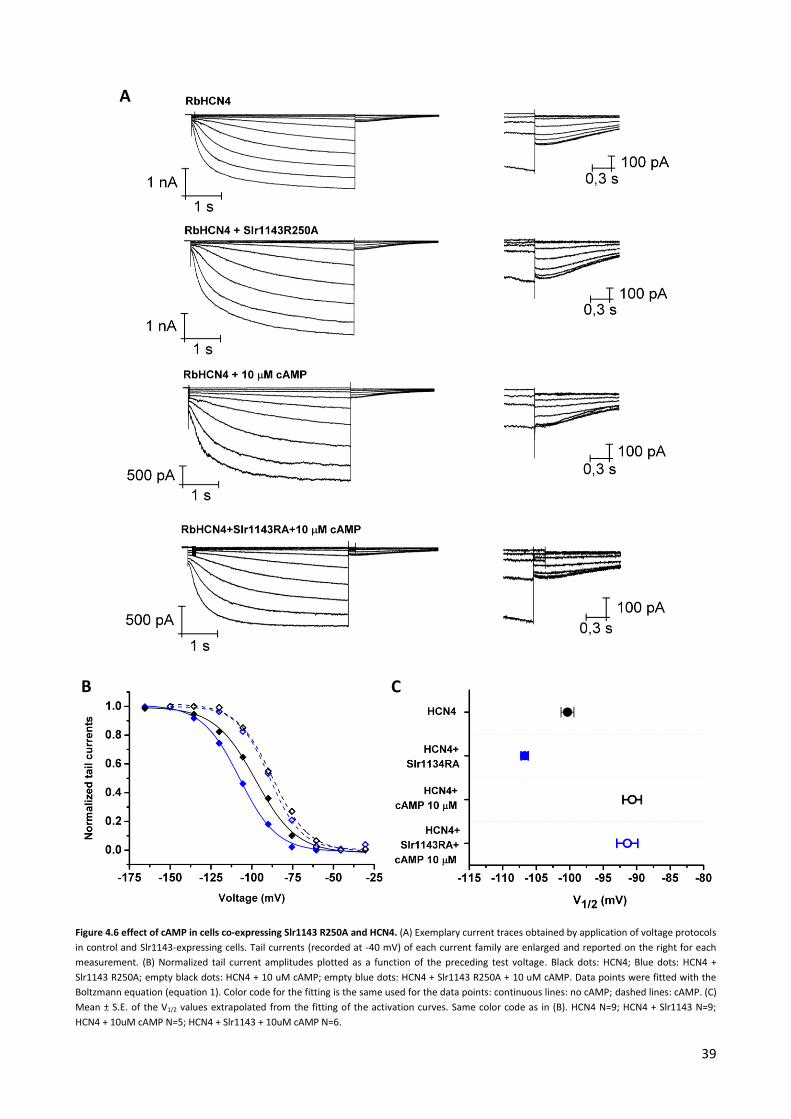
39
Figure 4.6 effect of cAMP in cells co-expressing Slr1143 R250A and HCN4. (A) Exemplary current traces obtained by application of voltage protocols
in control and Slr1143-expressing cells. Tail currents (recorded at -40 mV) of each current family are enlarged and reported on the right for each
measurement. (B) Normalized tail current amplitudes plotted as a function of the preceding test voltage. Black dots: HCN4; Blue dots: HCN4 +
Slr1143 R250A; empty black dots: HCN4 + 10 uM cAMP; empty blue dots: HCN4 + Slr1143 R250A + 10 uM cAMP. Data points were fitted with the
Boltzmann equation (equation 1). Color code for the fitting is the same used for the data points: continuous lines: no cAMP; dashed lines: cAMP. (C)
Mean ± S.E. of the V1/2 values extrapolated from the fitting of the activation curves. Same color code as in (B). HCN4 N=9; HCN4 + Slr1143 N=9;
HCN4 + 10uM cAMP N=5; HCN4 + Slr1143 + 10uM cAMP N=6.
A
B C
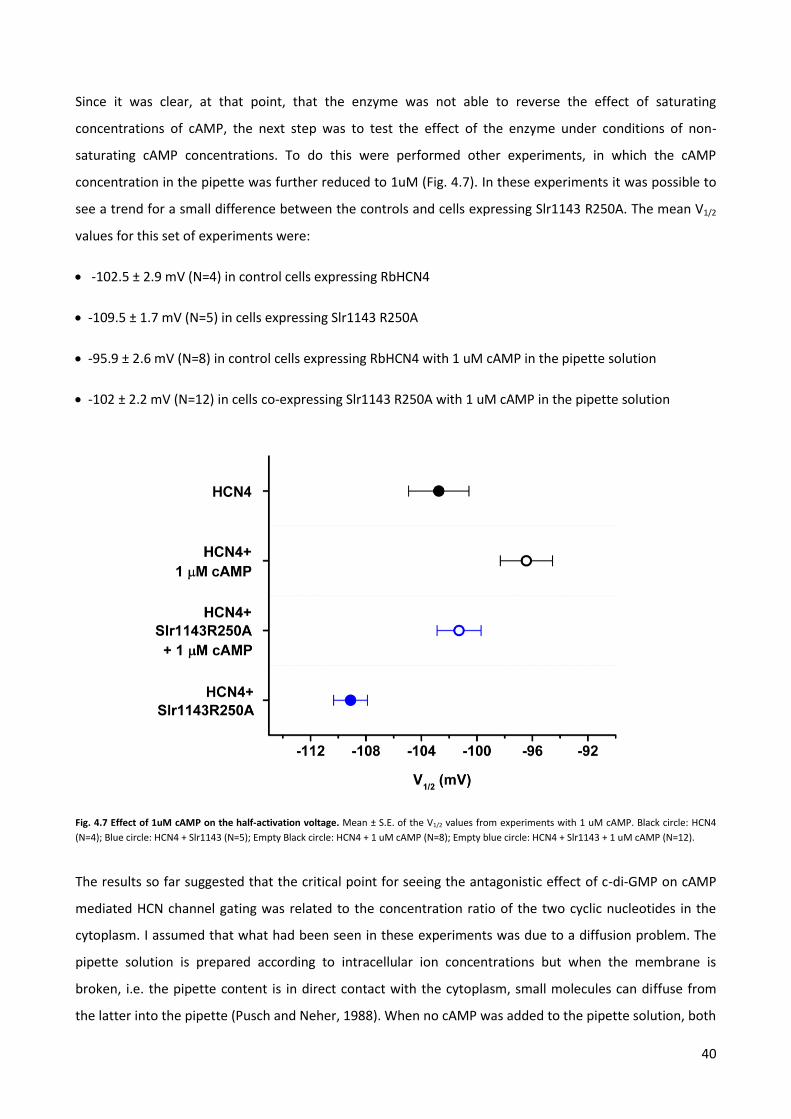
40
Since it was clear, at that point, that the enzyme was not able to reverse the effect of saturating
concentrations of cAMP, the next step was to test the effect of the enzyme under conditions of non-
saturating cAMP concentrations. To do this were performed other experiments, in which the cAMP
concentration in the pipette was further reduced to 1uM (Fig. 4.7). In these experiments it was possible to
see a trend for a small difference between the controls and cells expressing Slr1143 R250A. The mean V1/2
values for this set of experiments were:
-102.5 ± 2.9 mV (N=4) in control cells expressing RbHCN4
-109.5 ± 1.7 mV (N=5) in cells expressing Slr1143 R250A
-95.9 ± 2.6 mV (N=8) in control cells expressing RbHCN4 with 1 uM cAMP in the pipette solution
-102 ± 2.2 mV (N=12) in cells co-expressing Slr1143 R250A with 1 uM cAMP in the pipette solution
Fig. 4.7 Effect of 1uM cAMP on the half-activation voltage. Mean ± S.E. of the V1/2 values from experiments with 1 uM cAMP. Black circle: HCN4
(N=4); Blue circle: HCN4 + Slr1143 (N=5); Empty Black circle: HCN4 + 1 uM cAMP (N=8); Empty blue circle: HCN4 + Slr1143 + 1 uM cAMP (N=12).
The results so far suggested that the critical point for seeing the antagonistic effect of c-di-GMP on cAMP
mediated HCN channel gating was related to the concentration ratio of the two cyclic nucleotides in the
cytoplasm. I assumed that what had been seen in these experiments was due to a diffusion problem. The
pipette solution is prepared according to intracellular ion concentrations but when the membrane is
broken, i.e. the pipette content is in direct contact with the cytoplasm, small molecules can diffuse from
the latter into the pipette (Pusch and Neher, 1988). When no cAMP was added to the pipette solution, both
41
the c-di-GMP synthesized by Slr1143 R250A and the endogenous cAMP equally diffused into the pipette: in
this case it was still possible to see an effect of the c-di-GMP binding to the CNBD. When extra cAMP was
added to the pipette solution the second messenger diffused constantly from the pipette into the
cytoplasm. Within minutes the cytoslolic cAMP concentration equilibrated with the concentration of cAMP
in the pipette. The c-di-GMP messenger, in contrast, was diffusing from the cytoplasm to the pipette, which
means that it was rapidly diluted in the cytosol.
To circumvent this problem I decided to continue with the photo-activated enzyme and search for
conditions e.g. light intensity, wavelength, exposure time that might allow robust production of c-di-GMP.
This should affect at least the binding of endogenous cAMP to the CNBD and modulate in this way cAMP
gating.

42
4.2 Experiments with a light-activated bacterial diguanylate cyclase.
The BphS-1 DNA was a generous gift form Prof. Gomelsky, Wyoming University. This is a chimera composed
by the photo-switch of the pytochrome BphG plus Slr1143 as the effector domain. The latter does not have
the aforementioned R250A mutation. Given the results from Chapter 4.1, I decided to introduce the
mutation in this construct (now called BphS) and to move it into the pCAG-IRES-TdTomato plasmid. The
mutated construct was obtained in the same manner as that used for Slr1143: overlapping-PCR with
primers for AQUA cloning and for mutagenesis. The insert was then integrated in the plasmid by AQUA
cloning and positive colonies were screened via colony-PCR.
Since it was already known that BphS can have some dark activity (Ryu and Gomelsky, 2014), it was
important to verify that this dark activity could not influence the voltage dependence of the channel in a
light-independent manner. To estimate this dark effect, HEK293T cells were transfected with 1µg of HCN4
+ 0.5 µg of BphS and 1µg of HCN4 + 0.5 µg of GFP as controls.
After 18 hours of cultivation, the HCN4 activity was estimated by patch clamp recordings. Cells were
measured as in Fig. 4.8 A in the whole cell configuration: voltage-clamp protocols with negative voltage
steps were applied to the cells to activate and measure HCN4 currents. Tail current values were used again
to assess the voltage dependency of the channel. A comparison of the activation curves obtained from
BphS-expressing cells and from control cells showed that the two voltage dependencies are almost
indistinguishable (Fig. 4.8 B).
Consequently also the estimated V1/2 values from Boltzmann fits were the same: -104 ± 1 mV for the
controls (N=14) and -103 ± 0.8 mV for BphS-expressing cells (N=12) (Fig. 4.8 C). The results of these
experiments showed that the dark activity of the enzyme did not affect the channel opening in any way.
After this important control, current measurements were performed on cells which were exposed to red
light. For these experiments, cells were grown and transfected in a medium that did not contain phenol
red. This should prevent any kind of interference between the medium and the light. As an irradiation tool,
I used a custom made array of LEDs (10x15 cm, c.a. 300 LEDs) with an emission maximum at 660 nm; six
petri dishes could be positioned on this array. The LED array was connected to a timer, which allowed a
regulation of the light/dark cycles (Fig. 4.9). In the present case a continuous cycle of 20 seconds of light
and 90 seconds of dark was used for stimulation. The light/dark cycle was recommended by prof.
Gomelsky.

43
Fig. 4.8 Monitoring the dark activity of BphS. (A) Exemplary current traces obtained by application of voltage protocols in control and BphS-
expressing cells. Tail currents (recorded at -40 mV) of each current family are enlarged and reported on the right for each measurement. (B)
Normalized tail current amplitudes plotted as a function of the preceding test voltage. Black empty squares: HCN4; Red empty squares: HCN4 +
BphS. Data points were fitted with the Boltzmann equation (equation 1). Color code for the fitting is the same used for the data points. (C) Mean ±
S.E. of the V1/2 values of HEK293T cells expressing HCN4 or co-expressing HCN4 + BphS. Black squares: HCN4 (N=14); Red squares: HCN4 + BphS
(N=12).
The set up was constructed in such a way that the cells were not in direct contact with the LEDs: empty
petri dishes were used as a “spacer” between the dishes with cells and the light source. In addition to the
timing, also the light intensity of the LED array could be regulated. The initial experiments were planned
with a long light exposure (hours). This extreme exposure should provide information on whether the
system results at all in a measurable response of the HCN4 currents. In the next step the treatment should
then be adapted with respect to light intensity and exposure.
A
B C
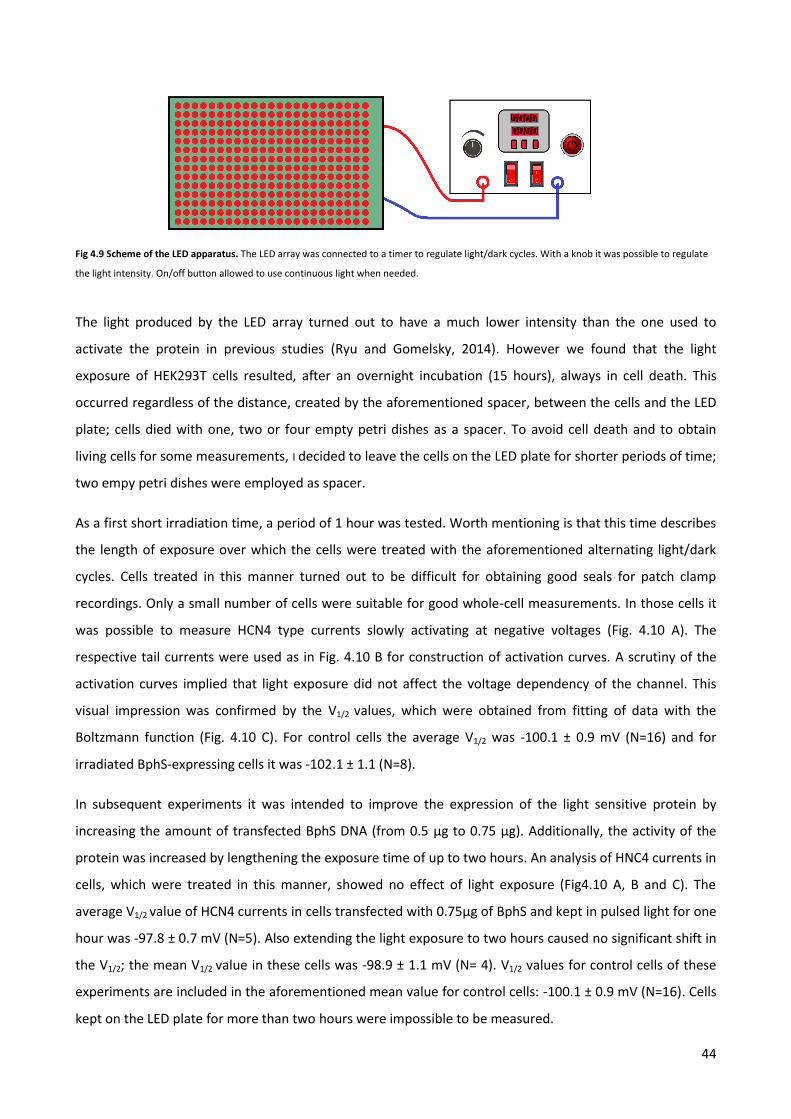
44
Fig 4.9 Scheme of the LED apparatus. The LED array was connected to a timer to regulate light/dark cycles. With a knob it was possible to regulate
the light intensity. On/off button allowed to use continuous light when needed.
The light produced by the LED array turned out to have a much lower intensity than the one used to
activate the protein in previous studies (Ryu and Gomelsky, 2014). However we found that the light
exposure of HEK293T cells resulted, after an overnight incubation (15 hours), always in cell death. This
occurred regardless of the distance, created by the aforementioned spacer, between the cells and the LED
plate; cells died with one, two or four empty petri dishes as a spacer. To avoid cell death and to obtain
living cells for some measurements, I decided to leave the cells on the LED plate for shorter periods of time;
two empy petri dishes were employed as spacer.
As a first short irradiation time, a period of 1 hour was tested. Worth mentioning is that this time describes
the length of exposure over which the cells were treated with the aforementioned alternating light/dark
cycles. Cells treated in this manner turned out to be difficult for obtaining good seals for patch clamp
recordings. Only a small number of cells were suitable for good whole-cell measurements. In those cells it
was possible to measure HCN4 type currents slowly activating at negative voltages (Fig. 4.10 A). The
respective tail currents were used as in Fig. 4.10 B for construction of activation curves. A scrutiny of the
activation curves implied that light exposure did not affect the voltage dependency of the channel. This
visual impression was confirmed by the V1/2 values, which were obtained from fitting of data with the
Boltzmann function (Fig. 4.10 C). For control cells the average V1/2 was -100.1 ± 0.9 mV (N=16) and for
irradiated BphS-expressing cells it was -102.1 ± 1.1 (N=8).
In subsequent experiments it was intended to improve the expression of the light sensitive protein by
increasing the amount of transfected BphS DNA (from 0.5 µg to 0.75 µg). Additionally, the activity of the
protein was increased by lengthening the exposure time of up to two hours. An analysis of HNC4 currents in
cells, which were treated in this manner, showed no effect of light exposure (Fig4.10 A, B and C). The
average V1/2 value of HCN4 currents in cells transfected with 0.75µg of BphS and kept in pulsed light for one
hour was -97.8 ± 0.7 mV (N=5). Also extending the light exposure to two hours caused no significant shift in
the V1/2; the mean V1/2 value in these cells was -98.9 ± 1.1 mV (N= 4). V1/2 values for control cells of these
experiments are included in the aforementioned mean value for control cells: -100.1 ± 0.9 mV (N=16). Cells
kept on the LED plate for more than two hours were impossible to be measured.
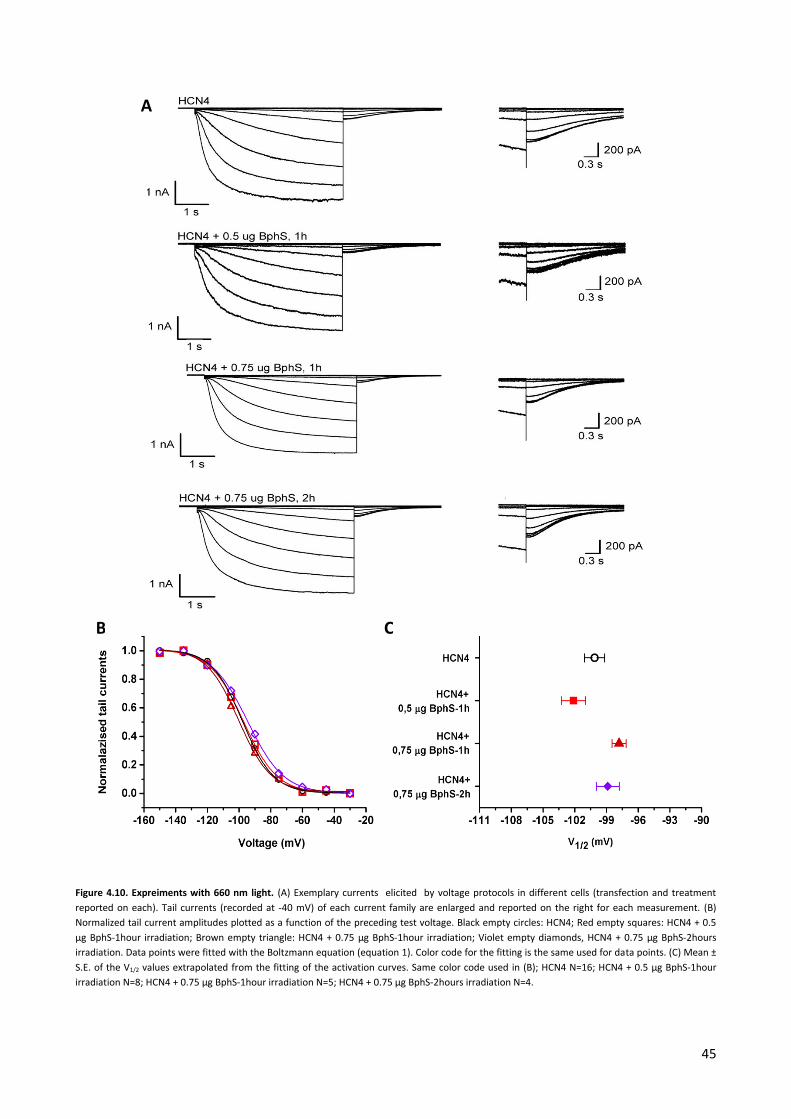
45
Figure 4.10. Expreiments with 660 nm light. (A) Exemplary currents elicited by voltage protocols in different cells (transfection and treatment
reported on each). Tail currents (recorded at -40 mV) of each current family are enlarged and reported on the right for each measurement. (B)
Normalized tail current amplitudes plotted as a function of the preceding test voltage. Black empty circles: HCN4; Red empty squares: HCN4 + 0.5
µg BphS-1hour irradiation; Brown empty triangle: HCN4 + 0.75 µg BphS-1hour irradiation; Violet empty diamonds, HCN4 + 0.75 µg BphS-2hours
irradiation. Data points were fitted with the Boltzmann equation (equation 1). Color code for the fitting is the same used for data points. (C) Mean ±
S.E. of the V1/2 values extrapolated from the fitting of the activation curves. Same color code used in (B); HCN4 N=16; HCN4 + 0.5 µg BphS-1hour
irradiation N=8; HCN4 + 0.75 µg BphS-1hour irradiation N=5; HCN4 + 0.75 µg BphS-2hours irradiation N=4.
A
B C

46
At this point I decided to design a new irradiation device. This LED array should provide a higher irradiance
without killing the cells. In a first step I tested the possibility to increase the LEDs irradiance by increasing
the applied voltage. This strategy was not successful because the voltage used for experiments in Fig. 4.10
was already close to the tolerance level of the LEDs. Moreover, it turned out that the array of many parallel
LEDs was producing a lot of heat. The heat was presumably the reason why the cells where dying after
some hours on the LED array, even if they were not directly in contact with the LEDs.
To increase the light irradiance, new and, more powerful LEDs (1W) were purchased (660 nm LEDs from
LumenLaden). To reduce heat exposure of the cells a plastic support with holes in which 35 mm petri could
fit was designed. The LEDs were fixed with a specific glue on an aluminum plate, which improved the heat
dissipation. The plastic support was located above the LED array and the distance between the two could
be adjusted and modified with four screws. The whole structure was organized in such a way that each LED
was located under the center of a petri dish (Fig. 4.11). The new device was able to generate a maximal
light at an higher irradiance of up to 2 W/m2 (with the previous device was only 0.2 W/m2).
Fig. 4.11 New irradiation device. With this irradiation device it was possible to achieve an higher irradiance and much better heat dissipation.
Once the new device was ready, also a newer version of BphS became available: the construct had been
codon-optimized for expression in mammalian cells by prof. Gomelsky’s group. The new BphS DNA was
inserted into a pCDNA plasmid, under the control of a CMV promoter and was followed by an auto-
cleavage sequence of the 2A family (Wang et al., 2015). The 2A self-cleaving peptides are a family of
oligopeptides located between two proteins that can undergo self-cleavage to generate mature proteins.
The cleavage site is located between the last two amino acid of the oligopeptide: a glycine, that will
become the last amino acid of the first protein, and a proline that will be the first residue of the second
protein (Wang et al., 2015). The 2A sequence separated BphS from a c-di-GMP phosphodiesterase called
YhjH that should maintain a low concentration of c-di-GMP in the dark. It was expected that the codon
optimization should allow a much higher expression of the BphS gene so also the dark activity of this
construct should be improved. It was already known that the YhjH protein is able to lower, as a counter-
47
player of the cyclase, the problem of unwanted dark activity (Ryu et al., 2017 and 2014). The multi-genes
expression system Bphs-2A-Yhjh from now on will be called BphSOpti.
During the course of the experiments, other groups had already tried to express the BphSOpti multi-genes
in mammalian cells. Publications from these laboratories provided useful information for the present
endeavor. Shao and colleagues published a study in which they expressed BphSOpti in HEK293T cells to try
to regulate the expression of a gene of interest (Shao et al., 2017). The cyclic di-nucletide produced in a
light dependent manner bound the STING protein, which then activated a signaling cascade resulting in
activation and nuclear traslocation of the transcription factor IF3. The gene of interest was under the
control of a promoter engineered to contain IF3 binding site. They were able to see a light-driven
expression of the desired protein within 2-4 hours. Moreover they showed that the presence of the Yhjh
phopshodiesterase was actually necessary to keep a low concentration of c-di-GMP in the dark.
The new plasmid containing the multi-genes expression system BphSOpti was therefore used to transfect
HEK293T cells, taking advantage of the new information in terms of irradiation time and intensity. Since the
new plasmid did not contain any fluorescent protein, I prepared the following co-transfection protocol: 1
µg of HCN4 + 0.75 µg of BphSOpti + 0.3 µg of GFP/µg other DNAs. The latter was an amount of GFP, which
already proved to be good for triple transfections; these experiments had been performed by colleagues in
the lab. In this case I preferred to use the GFP because it is a bit brighter than the TdTomato. Irradiance was
set to 2 W/m2 and 24 hours after transfection cells were exposed for 2.5 hours to pulsed red light.
The first measurements with cells, which expressed the new codon-optimized enzyme and which were
exposed to the new light device, exhibited no perceivable response to red light. Tri-transfected cells
showed weaker membranes and were therefore hard to measure. Recordings from cells suitable for patch
clamp recordings, showed HCN4 type currents that were used for further analysis (Fig 4.12 A). An analysis
of the activation curves, which were as in Fig. 4.12 B constructed from the tail currents, showed no
appreciable difference between the control cells and tri-transfected cells exposed to red light. Also in this
case the fitting of the data reveled no difference in the average V1/2 values between the control cells
expressing HCN4 and the BphSOpti-RbHCN4 co-transfected cells (Fig 4.12 C). The V1/2 value was -102.1 ± 1.2
mV (N=3) in control cells and -103 ± 2.5 mV (N=4) in the BphSOpti-RbHCN4 expressing cells. Notably the
number of tested cells was, because of the problems of obtaining robust measurements, rather low. But
the data indicated already that an effect of a light regulated modulation of HCN4 channels by BphS would
be, if any, very small.
The first results were not encouraging and asked for additional experiments in which other experimental
parameters are tested. One critical parameter could be the exposure. According to Shao et al. exposure
time between 2 and 48 hours could be suitable for testing (Shao et al., 2017). But since these experiments
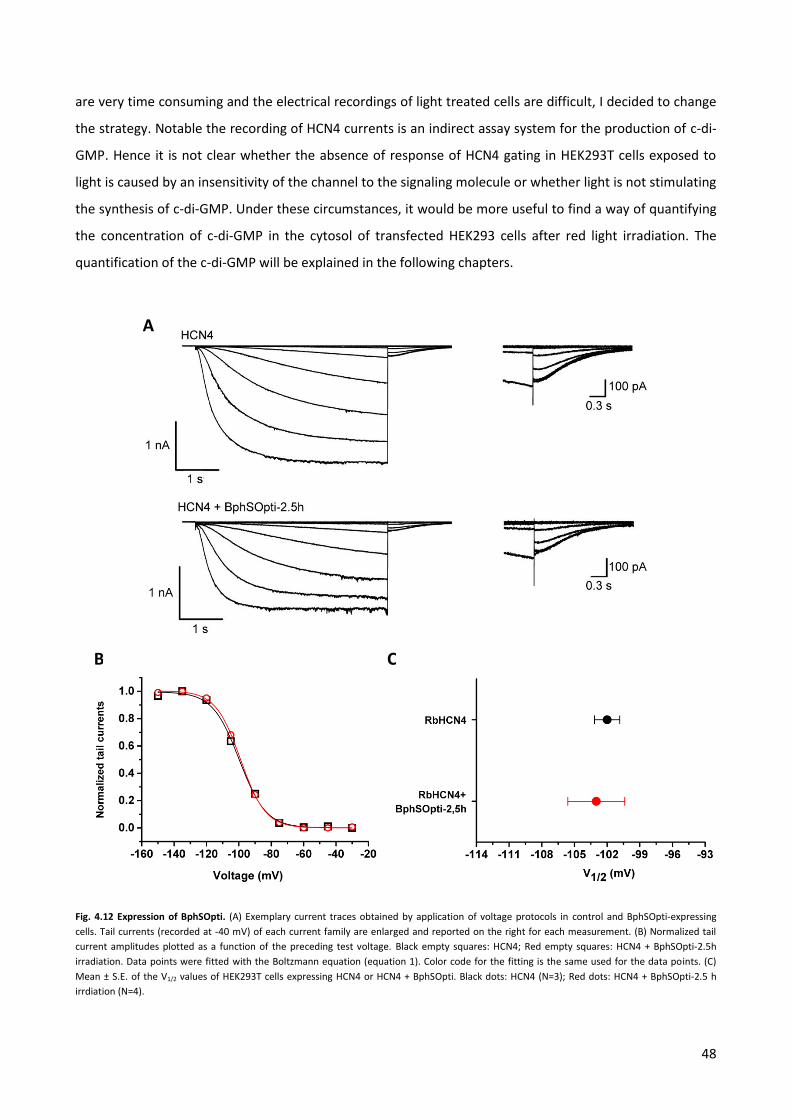
48
are very time consuming and the electrical recordings of light treated cells are difficult, I decided to change
the strategy. Notable the recording of HCN4 currents is an indirect assay system for the production of c-di-
GMP. Hence it is not clear whether the absence of response of HCN4 gating in HEK293T cells exposed to
light is caused by an insensitivity of the channel to the signaling molecule or whether light is not stimulating
the synthesis of c-di-GMP. Under these circumstances, it would be more useful to find a way of quantifying
the concentration of c-di-GMP in the cytosol of transfected HEK293 cells after red light irradiation. The
quantification of the c-di-GMP will be explained in the following chapters.
Fig. 4.12 Expression of BphSOpti. (A) Exemplary current traces obtained by application of voltage protocols in control and BphSOpti-expressing
cells. Tail currents (recorded at -40 mV) of each current family are enlarged and reported on the right for each measurement. (B) Normalized tail
current amplitudes plotted as a function of the preceding test voltage. Black empty squares: HCN4; Red empty squares: HCN4 + BphSOpti-2.5h
irradiation. Data points were fitted with the Boltzmann equation (equation 1). Color code for the fitting is the same used for the data points. (C)
Mean ± S.E. of the V1/2 values of HEK293T cells expressing HCN4 or HCN4 + BphSOpti. Black dots: HCN4 (N=3); Red dots: HCN4 + BphSOpti-2.5 h
irrdiation (N=4).
A
B C

49
4.3 Quantification of the synthesis of c-di-GMP by ELISA assay.
As previously mentioned, I decided that it was necessary to quantify the c-di-GMP produced by the BphS-
construct after different times of light exposure. By doing this it should be possible to understand the
relationship between the irradiation period and the concentration of c-di-GMP in the cytoplasm of a BphS-
expressing cell. From the results obtained in Chapter 4.1 with the constitutively active enzyme Slr1143
R250A, it was already anticipated that the latter was able to generate sufficient cyclic di-nucleotide for
affecting the HCN4 voltage dependency. For this reason the constitutively active enzyme can be considered
as a very good positive control. At the same time the cyclic di-nucleotide produced by this construct serves
as an internal reference for the desired minimum amount of c-di-GMP. I decided to quantify the enzyme
activity by performing an ELISA assay, which is a test commonly used to detect the presence of a molecule
of interest and to quantify its concentration in biological samples like cell culture supernatants, tissue
homogenates, plasma etc.
An ELISA kit specific for quantification of c-di-GMP is available from EIAab and is based on the competitive
immunoassay technique. In this type of ELISA the sample containing the substance of interest is mixed with
a fixed amount of the same molecule whereby the latter carries a label. To calibrate the system, samples
with known concentration of the analyte are prepared by diluting a stock solution provided with the kit.
One of these standard solutions contains only the dilution buffer, which serves as the “blank” of the assay.
The standards are mixed with the labeled molecule as well. The standards and the samples are loaded into
a special multi-well plate in which the wells have been pre-coated with an antibody able to bind the
analyte. In this manner, the molecules from the samples/standards and the labeled cyclic di-nucleotides
will compete for binding sites on the antibodies located on the bottom of each well. The binding of the
marked antigen to the antibody can be monitored optically as it will react with the buffers subsequently
added to each well, changing their color to yellow. So the concentration of the molecule of interest in the
samples is inversely proportional to the color change: the less colored a well, the higher the concentration
of the analyte in the sample loaded in that well. The absorbance in the yellow range of the spectrum is
measured for each well using a special spectrophotometer, designed for multi-well plates. The absorbance
value of the blank has to be subtracted from all the others to apply the blank correction. The standards are
used to create a concentration/absorbance calibration curve from which the unknown concentrations of
the samples can be extrapolated. This type of ELISA was successfully used by Shao and colleagues to
quantify c-di-GMP synthesis in HEK293T cells (Shao et al., 2017, Fig. 4.13 A). I used this paper as a reference
for expression of BphS in HEK293T cells.
HEK293T cells were transfected with the same amount of DNA used for experiments in chapter 4.2: 1µg
HCN4 + 0.75 µg BphSOpti +0.3 µg of GFP/µg other DNAs. Slr1143 R250A was used as a positive control: the
respective cells were transfected with 1 µg of HCN4 + 0.5 µg of Slr1143 R250A. The transfections presented
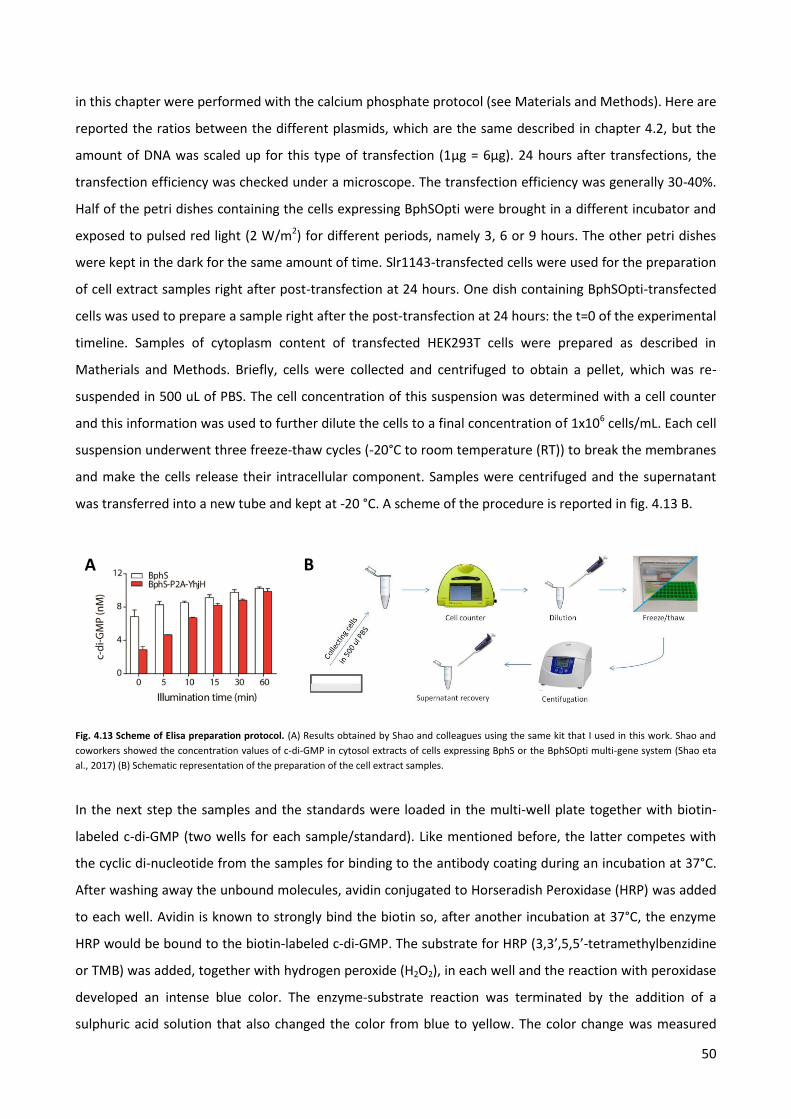
50
in this chapter were performed with the calcium phosphate protocol (see Materials and Methods). Here are
reported the ratios between the different plasmids, which are the same described in chapter 4.2, but the
amount of DNA was scaled up for this type of transfection (1µg = 6µg). 24 hours after transfections, the
transfection efficiency was checked under a microscope. The transfection efficiency was generally 30-40%.
Half of the petri dishes containing the cells expressing BphSOpti were brought in a different incubator and
exposed to pulsed red light (2 W/m2) for different periods, namely 3, 6 or 9 hours. The other petri dishes
were kept in the dark for the same amount of time. Slr1143-transfected cells were used for the preparation
of cell extract samples right after post-transfection at 24 hours. One dish containing BphSOpti-transfected
cells was used to prepare a sample right after the post-transfection at 24 hours: the t=0 of the experimental
timeline. Samples of cytoplasm content of transfected HEK293T cells were prepared as described in
Matherials and Methods. Briefly, cells were collected and centrifuged to obtain a pellet, which was re-
suspended in 500 uL of PBS. The cell concentration of this suspension was determined with a cell counter
and this information was used to further dilute the cells to a final concentration of 1x10⁶ cells/mL. Each cell
suspension underwent three freeze-thaw cycles (-20°C to room temperature (RT)) to break the membranes
and make the cells release their intracellular component. Samples were centrifuged and the supernatant
was transferred into a new tube and kept at -20 °C. A scheme of the procedure is reported in fig. 4.13 B.
Fig. 4.13 Scheme of Elisa preparation protocol. (A) Results obtained by Shao and colleagues using the same kit that I used in this work. Shao and
coworkers showed the concentration values of c-di-GMP in cytosol extracts of cells expressing BphS or the BphSOpti multi-gene system (Shao eta
al., 2017) (B) Schematic representation of the preparation of the cell extract samples.
In the next step the samples and the standards were loaded in the multi-well plate together with biotin-
labeled c-di-GMP (two wells for each sample/standard). Like mentioned before, the latter competes with
the cyclic di-nucleotide from the samples for binding to the antibody coating during an incubation at 37°C.
After washing away the unbound molecules, avidin conjugated to Horseradish Peroxidase (HRP) was added
to each well. Avidin is known to strongly bind the biotin so, after another incubation at 37°C, the enzyme
HRP would be bound to the biotin-labeled c-di-GMP. The substrate for HRP (3,3’,5,5’-tetramethylbenzidine
or TMB) was added, together with hydrogen peroxide (H2O2), in each well and the reaction with peroxidase
developed an intense blue color. The enzyme-substrate reaction was terminated by the addition of a
sulphuric acid solution that also changed the color from blue to yellow. The color change was measured
A B
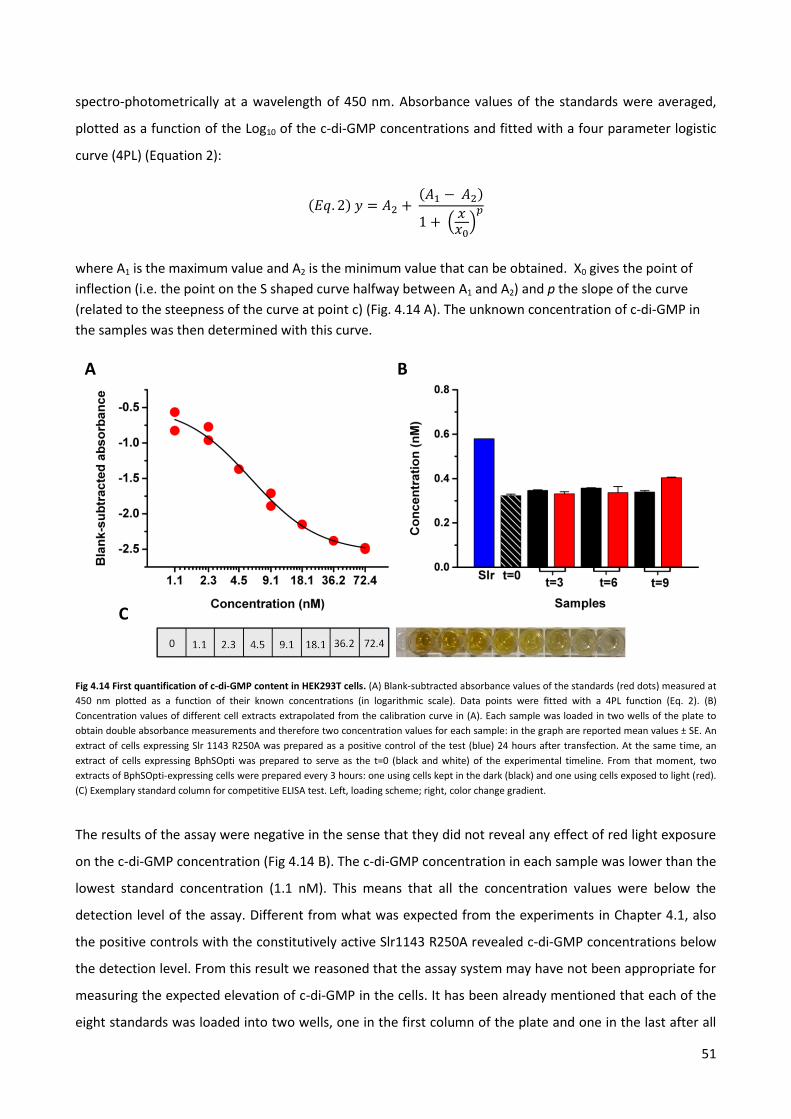
51
spectro-photometrically at a wavelength of 450 nm. Absorbance values of the standards were averaged,
plotted as a function of the Log10 of the c-di-GMP concentrations and fitted with a four parameter logistic
curve (4PL) (Equation 2):
where A1 is the maximum value and A2 is the minimum value that can be obtained. X0 gives the point of
inflection (i.e. the point on the S shaped curve halfway between A1 and A2) and p the slope of the curve
(related to the steepness of the curve at point c) (Fig. 4.14 A). The unknown concentration of c-di-GMP in
the samples was then determined with this curve.
Fig 4.14 First quantification of c-di-GMP content in HEK293T cells. (A) Blank-subtracted absorbance values of the standards (red dots) measured at
450 nm plotted as a function of their known concentrations (in logarithmic scale). Data points were fitted with a 4PL function (Eq. 2). (B)
Concentration values of different cell extracts extrapolated from the calibration curve in (A). Each sample was loaded in two wells of the plate to
obtain double absorbance measurements and therefore two concentration values for each sample: in the graph are reported mean values ± SE. An
extract of cells expressing Slr 1143 R250A was prepared as a positive control of the test (blue) 24 hours after transfection. At the same time, an
extract of cells expressing BphSOpti was prepared to serve as the t=0 (black and white) of the experimental timeline. From that moment, two
extracts of BphSOpti-expressing cells were prepared every 3 hours: one using cells kept in the dark (black) and one using cells exposed to light (red).
(C) Exemplary standard column for competitive ELISA test. Left, loading scheme; right, color change gradient.
The results of the assay were negative in the sense that they did not reveal any effect of red light exposure
on the c-di-GMP concentration (Fig 4.14 B). The c-di-GMP concentration in each sample was lower than the
lowest standard concentration (1.1 nM). This means that all the concentration values were below the
detection level of the assay. Different from what was expected from the experiments in Chapter 4.1, also
the positive controls with the constitutively active Slr1143 R250A revealed c-di-GMP concentrations below
the detection level. From this result we reasoned that the assay system may have not been appropriate for
measuring the expected elevation of c-di-GMP in the cells. It has been already mentioned that each of the
eight standards was loaded into two wells, one in the first column of the plate and one in the last after all
A B
C

52
the samples. This procedure provides two values for each concentration and offers an internal check for the
precision of the performance of the assay. A comparison of these internal standards showed that both gave
about the same color gradient as the one reported if Fig. 4.14 C: a very pale yellow turned into orange
according to the decrease in concentration of the standards (from 72.4 to 1.1 nM). This means that the
procedure of the assay is sufficiently robust; even some pipetting error between individual samples should
not compromise the whole test. Based on the results of these experiments and on the considerations on
the assay system, we reasoned that the problem could have been an un-sufficient cell lysis. An inefficient
membrane disruption may have prevented the release of cytosolic c-di-GMP from the cells into the
supernatant.
To improve the assay I contacted prof. Haifeng Ye, the corresponding author of the paper by Shao et al.
(Shao et al., 2017), to ask for advice on experimental details of the ELISA assay, which were not spelled out
in the paper. It turned out that, despite of what they wrote in the paper, they did not follow the
instructions in the manual. Instead they used a lysis buffer from another ELISA kit to break the cell
membranes. I then decided to perform a chemical lysis as well. I prepared two types of lysis buffer. For the
first one I took advantage of the knowledge of my colleagues that lysed human cells with the detergent
Triton (1%) to analyze their protein content. The second buffer was kindly suggested by prof. Haifeng Ye.
He recommended a buffer used in another paper, in which the authors were trying to extract cytosolic c-di-
GMP from HEK cells (Folcher et al., 2014). This buffer contained acetonitrile, methanol and H2O (2:2:1).
Three sets of samples were prepared in order to achieve a sufficient cell lysis. The preparation of the first
set of samples followed the instruction manual of the kit, i.e. including a re-suspension of the cells in PBS.
But unlike in the experiments in Fig. 4.14 the freeze-thaw cycles were performed from -80°C to RT. The
second set of sample was prepared by lysing the cell with Triton buffer. In the third attempt an Acetonitrile-
Methanol buffer was used to prepare the cells. Detailed protocols and buffer contents can be found in
Materials and Methods. In this round of experiments also samples of un-transfected cells were prepared as
an additional negative control. Each sample, as well as the standards, were loaded two times on an ELISA
plate. Also in this assay, the color gradient of the standards was the expected one with little variations
between the values of the two dual recordings. The absorbance data points of the standards were well
fitted with a 4PL function (Equation 2) providing the calibration curve. Unlike in the experiments reported
in Fig. 4.14, modified lysis procedure provided some interesting differences between the experimental
samples (Fig. 4.15).
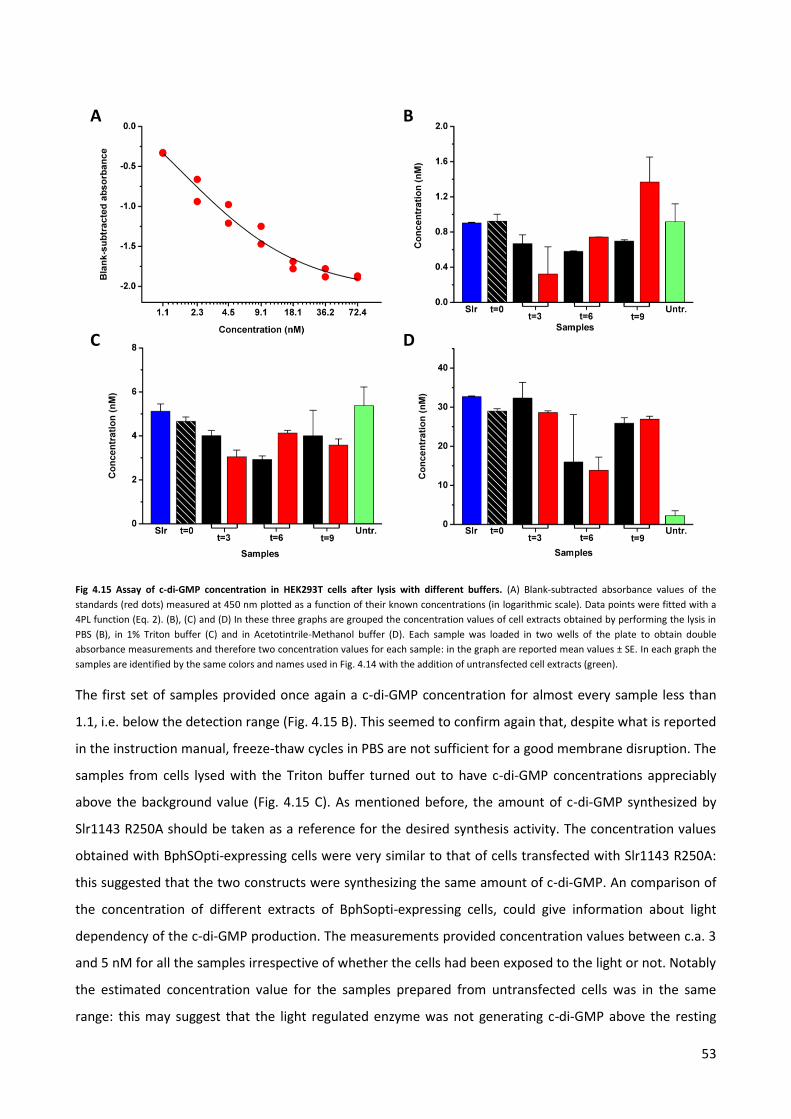
53
Fig 4.15 Assay of c-di-GMP concentration in HEK293T cells after lysis with different buffers. (A) Blank-subtracted absorbance values of the
standards (red dots) measured at 450 nm plotted as a function of their known concentrations (in logarithmic scale). Data points were fitted with a
4PL function (Eq. 2). (B), (C) and (D) In these three graphs are grouped the concentration values of cell extracts obtained by performing the lysis in
PBS (B), in 1% Triton buffer (C) and in Acetotintrile-Methanol buffer (D). Each sample was loaded in two wells of the plate to obtain double
absorbance measurements and therefore two concentration values for each sample: in the graph are reported mean values ± SE. In each graph the
samples are identified by the same colors and names used in Fig. 4.14 with the addition of untransfected cell extracts (green).
The first set of samples provided once again a c-di-GMP concentration for almost every sample less than
1.1, i.e. below the detection range (Fig. 4.15 B). This seemed to confirm again that, despite what is reported
in the instruction manual, freeze-thaw cycles in PBS are not sufficient for a good membrane disruption. The
samples from cells lysed with the Triton buffer turned out to have c-di-GMP concentrations appreciably
above the background value (Fig. 4.15 C). As mentioned before, the amount of c-di-GMP synthesized by
Slr1143 R250A should be taken as a reference for the desired synthesis activity. The concentration values
obtained with BphSOpti-expressing cells were very similar to that of cells transfected with Slr1143 R250A:
this suggested that the two constructs were synthesizing the same amount of c-di-GMP. An comparison of
the concentration of different extracts of BphSopti-expressing cells, could give information about light
dependency of the c-di-GMP production. The measurements provided concentration values between c.a. 3
and 5 nM for all the samples irrespective of whether the cells had been exposed to the light or not. Notably
the estimated concentration value for the samples prepared from untransfected cells was in the same
range: this may suggest that the light regulated enzyme was not generating c-di-GMP above the resting
A B
C D

54
concentration of cells. However, the instruction manual of the kit reports that a chemical lysis may cause
unexpected ELISA results by a cross reaction between the lysis agent and the assay system. For this reason
it was assumed that the measured values might be affected by an interaction between the buffer and the
rest of the ELISA components.
With the third lysis buffer I was able to obtain the best results (Fig. 4.15 D). First of all the concentration
values were on average 6 and 30 times bigger than the previous approaches with Triton and PBS
respectively. This indicated that the cell lysis was more efficient and that the lysis buffer did presumably not
interfere in a negative manner with the assay. The estimated c-di-GMP concenatrations were in the range
of 15 and 32 nM. An overlook of the results obtained with different types of samples indicated that there
was no significant difference between the concentration of the second messenger in the cells transfected
with Slr 1143 R250A and its light-dependent counterpart. The cytoplasm sample from cells transfected with
BphSOpti, 24 hours after transfection, turned out to have the same c-di-GMP concentration as the positive
control. The lack of light regulation could be confirmed also by comparing the BphSOpti samples: there was
no concentration difference on whether cells were exposed to the light or not. In this assay, the
concentration value obtained from the untransfected cells was very close to the minimum value of the
calibration curve. This result is reasonable for cells that do not express any digaunylate cyclase; together
with the expected behavior of the standards, this is a proof of the robustness of the assay.
The results of the experiments suggested that the concentration values obtained with the third lysis
method were the most reliable because they were all in the detection range of the assay, which did not
seem affected by the buffer (as indicated by the negative control). This assay showed that the c-di-GMP
levels produced by cells expressing Slr1143 R250A and BphSOpti are basically the same. Notably also the
samples prepared at t=0, i.e. without any light stimulation, contained c-di-GMP at a concentration similar to
that of the positive control (Fig 4.15 D). These results suggested the following interpretation: the BphSOpti
system was actually able to synthesize c-di-GMP in a similar manner to the Slr1143 R250A enzyme. This
synthesis however did not exhibit any light-regulation: between paired samples, which were exposed for
the same length of time to light or dark, the assay showed no appreciable difference in terms of
concentration of the second messenger. The data seemed to describe a homeostatic system in which c-di-
GMP synthesis by BphS in the dark is not antagonized by the activity of Yhjh, which degrades the second
messenger. The system presumably reaches an equilibrium in which the phosphodiesterase is not able to
counteract the construct activity.
The assay of Fig. 4.15 D with the lysis in Acetonitrile-Methanol was repeated a second time to confirm the
results. In this experiment the samples were loaded three times on the multi well plate in order to have
more absorbance measurements. Moreover, the first sample from light-exposed cells was collected at 1.5
hours to test whether a shorter exposure time could beneficial for detecting a difference between light and
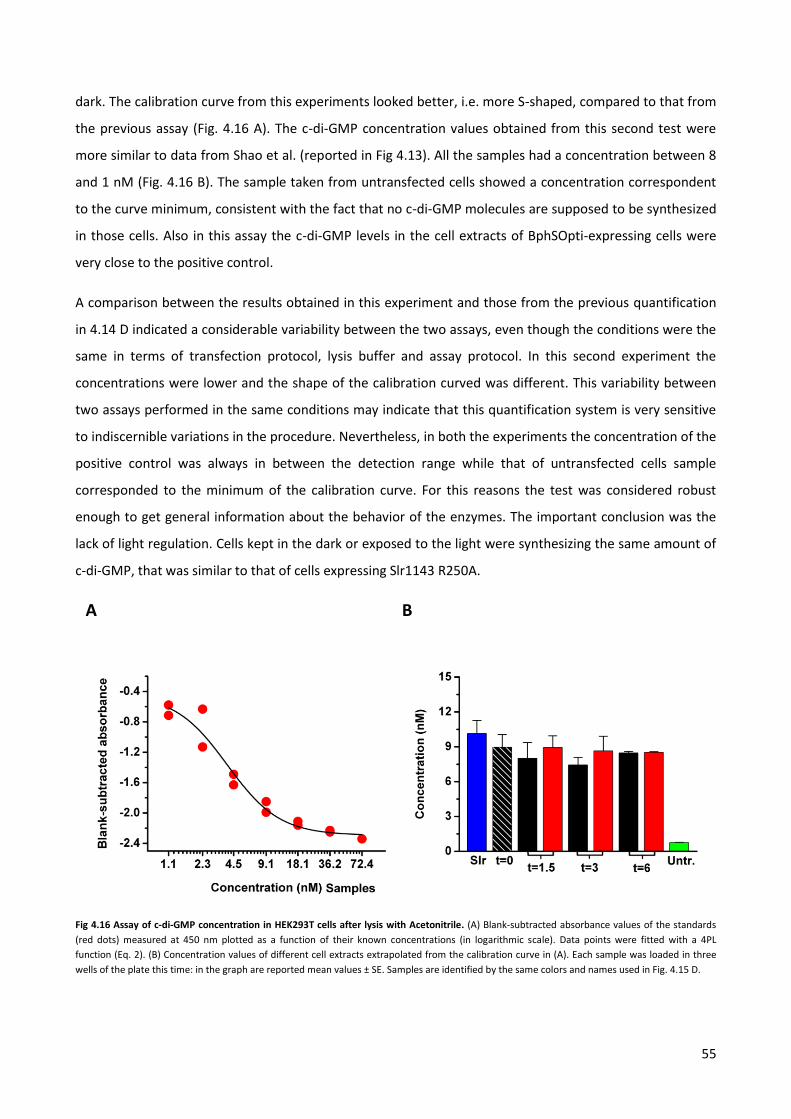
55
dark. The calibration curve from this experiments looked better, i.e. more S-shaped, compared to that from
the previous assay (Fig. 4.16 A). The c-di-GMP concentration values obtained from this second test were
more similar to data from Shao et al. (reported in Fig 4.13). All the samples had a concentration between 8
and 1 nM (Fig. 4.16 B). The sample taken from untransfected cells showed a concentration correspondent
to the curve minimum, consistent with the fact that no c-di-GMP molecules are supposed to be synthesized
in those cells. Also in this assay the c-di-GMP levels in the cell extracts of BphSOpti-expressing cells were
very close to the positive control.
A comparison between the results obtained in this experiment and those from the previous quantification
in 4.14 D indicated a considerable variability between the two assays, even though the conditions were the
same in terms of transfection protocol, lysis buffer and assay protocol. In this second experiment the
concentrations were lower and the shape of the calibration curved was different. This variability between
two assays performed in the same conditions may indicate that this quantification system is very sensitive
to indiscernible variations in the procedure. Nevertheless, in both the experiments the concentration of the
positive control was always in between the detection range while that of untransfected cells sample
corresponded to the minimum of the calibration curve. For this reasons the test was considered robust
enough to get general information about the behavior of the enzymes. The important conclusion was the
lack of light regulation. Cells kept in the dark or exposed to the light were synthesizing the same amount of
c-di-GMP, that was similar to that of cells expressing Slr1143 R250A.
Fig 4.16 Assay of c-di-GMP concentration in HEK293T cells after lysis with Acetonitrile. (A) Blank-subtracted absorbance values of the standards
(red dots) measured at 450 nm plotted as a function of their known concentrations (in logarithmic scale). Data points were fitted with a 4PL
function (Eq. 2). (B) Concentration values of different cell extracts extrapolated from the calibration curve in (A). Each sample was loaded in three
wells of the plate this time: in the graph are reported mean values ± SE. Samples are identified by the same colors and names used in Fig. 4.15 D.
A B
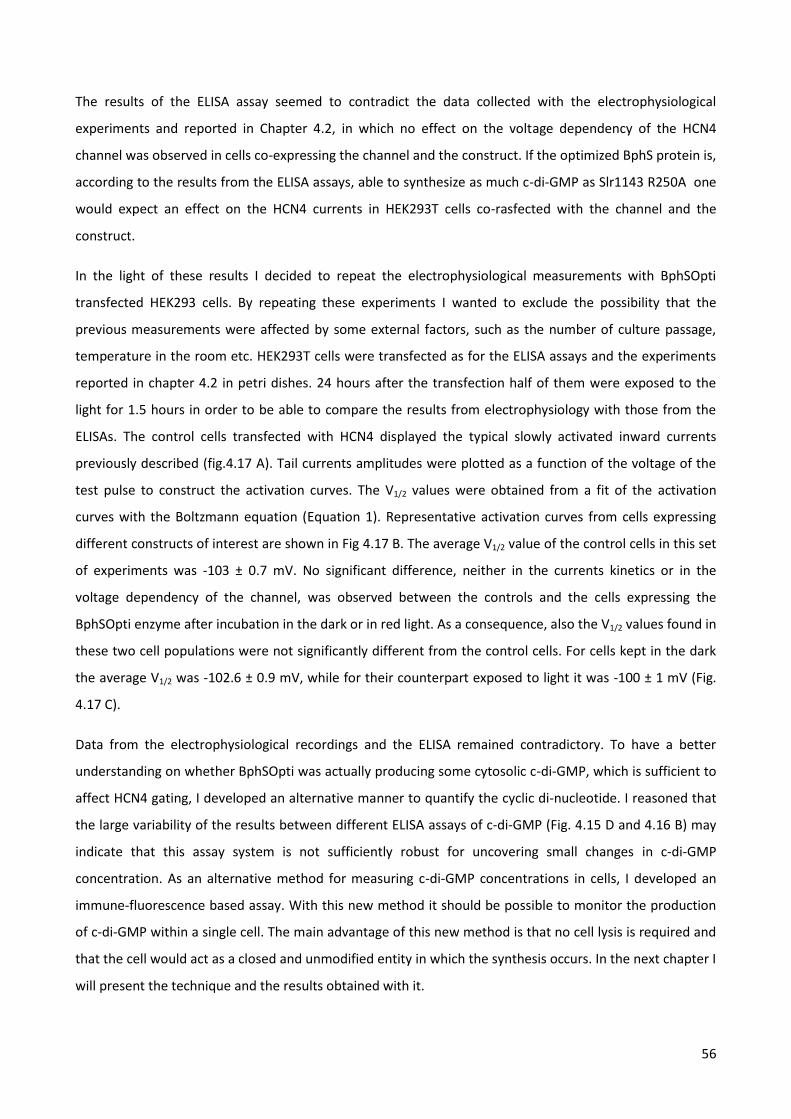
56
The results of the ELISA assay seemed to contradict the data collected with the electrophysiological
experiments and reported in Chapter 4.2, in which no effect on the voltage dependency of the HCN4
channel was observed in cells co-expressing the channel and the construct. If the optimized BphS protein is,
according to the results from the ELISA assays, able to synthesize as much c-di-GMP as Slr1143 R250A one
would expect an effect on the HCN4 currents in HEK293T cells co-rasfected with the channel and the
construct.
In the light of these results I decided to repeat the electrophysiological measurements with BphSOpti
transfected HEK293 cells. By repeating these experiments I wanted to exclude the possibility that the
previous measurements were affected by some external factors, such as the number of culture passage,
temperature in the room etc. HEK293T cells were transfected as for the ELISA assays and the experiments
reported in chapter 4.2 in petri dishes. 24 hours after the transfection half of them were exposed to the
light for 1.5 hours in order to be able to compare the results from electrophysiology with those from the
ELISAs. The control cells transfected with HCN4 displayed the typical slowly activated inward currents
previously described (fig.4.17 A). Tail currents amplitudes were plotted as a function of the voltage of the
test pulse to construct the activation curves. The V1/2 values were obtained from a fit of the activation
curves with the Boltzmann equation (Equation 1). Representative activation curves from cells expressing
different constructs of interest are shown in Fig 4.17 B. The average V1/2 value of the control cells in this set
of experiments was -103 ± 0.7 mV. No significant difference, neither in the currents kinetics or in the
voltage dependency of the channel, was observed between the controls and the cells expressing the
BphSOpti enzyme after incubation in the dark or in red light. As a consequence, also the V1/2 values found in
these two cell populations were not significantly different from the control cells. For cells kept in the dark
the average V1/2 was -102.6 ± 0.9 mV, while for their counterpart exposed to light it was -100 ± 1 mV (Fig.
4.17 C).
Data from the electrophysiological recordings and the ELISA remained contradictory. To have a better
understanding on whether BphSOpti was actually producing some cytosolic c-di-GMP, which is sufficient to
affect HCN4 gating, I developed an alternative manner to quantify the cyclic di-nucleotide. I reasoned that
the large variability of the results between different ELISA assays of c-di-GMP (Fig. 4.15 D and 4.16 B) may
indicate that this assay system is not sufficiently robust for uncovering small changes in c-di-GMP
concentration. As an alternative method for measuring c-di-GMP concentrations in cells, I developed an
immune-fluorescence based assay. With this new method it should be possible to monitor the production
of c-di-GMP within a single cell. The main advantage of this new method is that no cell lysis is required and
that the cell would act as a closed and unmodified entity in which the synthesis occurs. In the next chapter I
will present the technique and the results obtained with it.
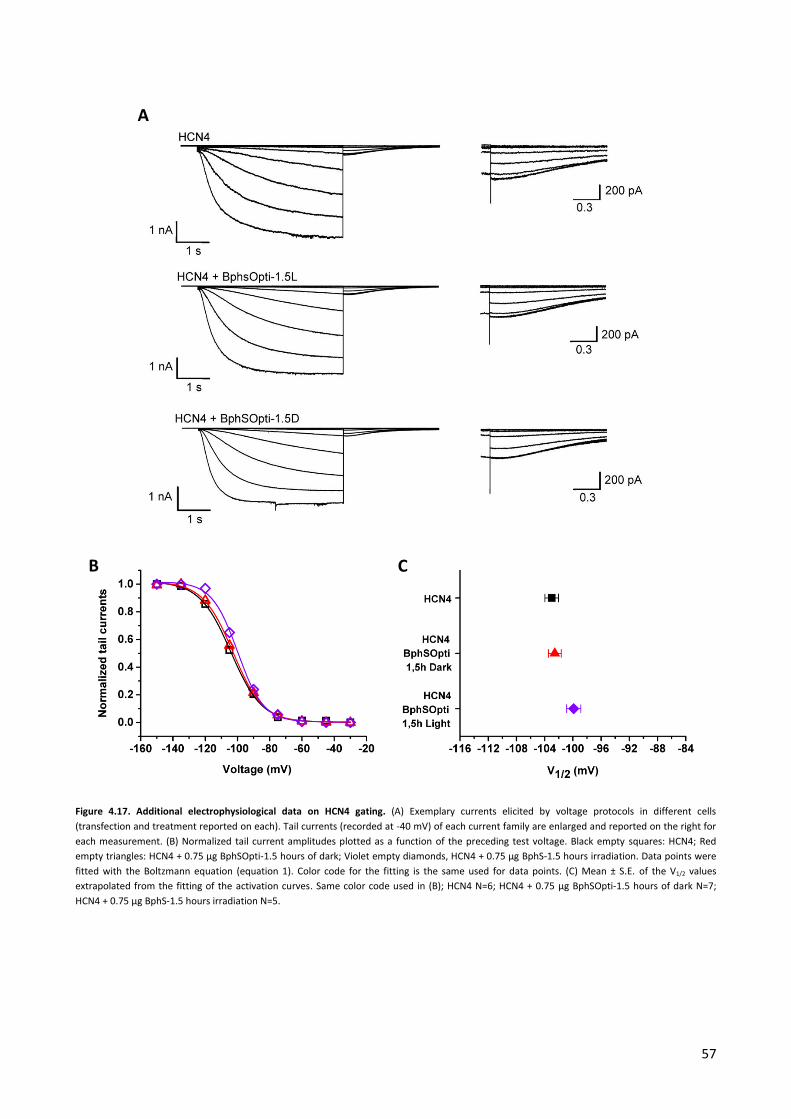
57
Figure 4.17. Additional electrophysiological data on HCN4 gating. (A) Exemplary currents elicited by voltage protocols in different cells
(transfection and treatment reported on each). Tail currents (recorded at -40 mV) of each current family are enlarged and reported on the right for
each measurement. (B) Normalized tail current amplitudes plotted as a function of the preceding test voltage. Black empty squares: HCN4; Red
empty triangles: HCN4 + 0.75 µg BphSOpti-1.5 hours of dark; Violet empty diamonds, HCN4 + 0.75 µg BphS-1.5 hours irradiation. Data points were
fitted with the Boltzmann equation (equation 1). Color code for the fitting is the same used for data points. (C) Mean ± S.E. of the V1/2 values
extrapolated from the fitting of the activation curves. Same color code used in (B); HCN4 N=6; HCN4 + 0.75 µg BphSOpti-1.5 hours of dark N=7;
HCN4 + 0.75 µg BphS-1.5 hours irradiation N=5.
A
B C
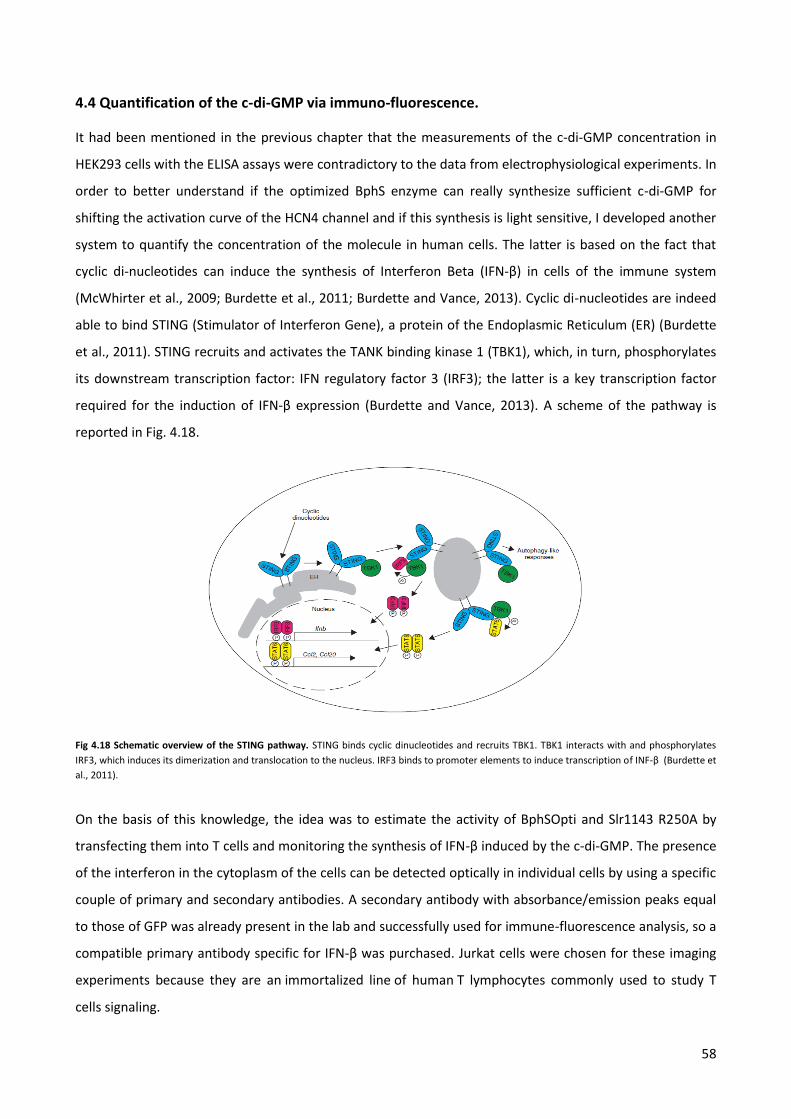
58
4.4 Quantification of the c-di-GMP via immuno-fluorescence.
It had been mentioned in the previous chapter that the measurements of the c-di-GMP concentration in
HEK293 cells with the ELISA assays were contradictory to the data from electrophysiological experiments. In
order to better understand if the optimized BphS enzyme can really synthesize sufficient c-di-GMP for
shifting the activation curve of the HCN4 channel and if this synthesis is light sensitive, I developed another
system to quantify the concentration of the molecule in human cells. The latter is based on the fact that
cyclic di-nucleotides can induce the synthesis of Interferon Beta (IFN-β) in cells of the immune system
(McWhirter et al., 2009; Burdette et al., 2011; Burdette and Vance, 2013). Cyclic di-nucleotides are indeed
able to bind STING (Stimulator of Interferon Gene), a protein of the Endoplasmic Reticulum (ER) (Burdette
et al., 2011). STING recruits and activates the TANK binding kinase 1 (TBK1), which, in turn, phosphorylates
its downstream transcription factor: IFN regulatory factor 3 (IRF3); the latter is a key transcription factor
required for the induction of IFN-β expression (Burdette and Vance, 2013). A scheme of the pathway is
reported in Fig. 4.18.
Fig 4.18 Schematic overview of the STING pathway. STING binds cyclic dinucleotides and recruits TBK1. TBK1 interacts with and phosphorylates
IRF3, which induces its dimerization and translocation to the nucleus. IRF3 binds to promoter elements to induce transcription of INF-β (Burdette et
al., 2011).
On the basis of this knowledge, the idea was to estimate the activity of BphSOpti and Slr1143 R250A by
transfecting them into T cells and monitoring the synthesis of IFN-β induced by the c-di-GMP. The presence
of the interferon in the cytoplasm of the cells can be detected optically in individual cells by using a specific
couple of primary and secondary antibodies. A secondary antibody with absorbance/emission peaks equal
to those of GFP was already present in the lab and successfully used for immune-fluorescence analysis, so a
compatible primary antibody specific for IFN-β was purchased. Jurkat cells were chosen for these imaging
experiments because they are an immortalized line of human T lymphocytes commonly used to study T
cells signaling.
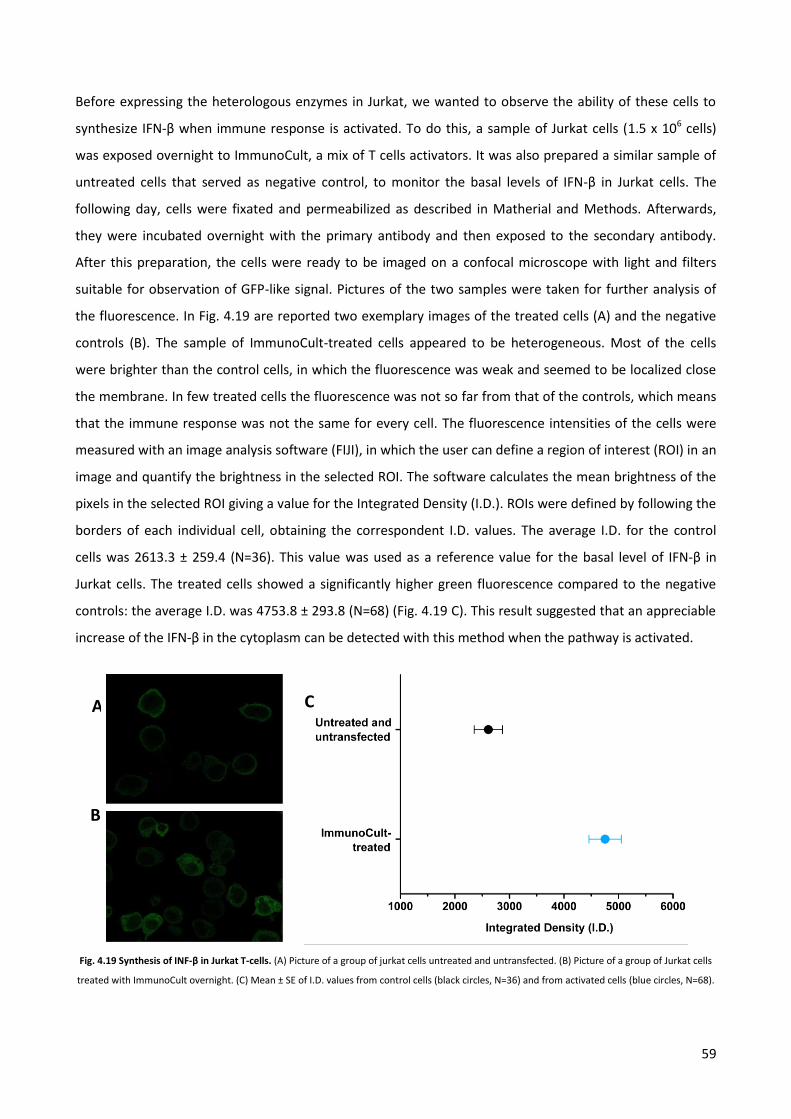
59
Before expressing the heterologous enzymes in Jurkat, we wanted to observe the ability of these cells to
synthesize IFN-β when immune response is activated. To do this, a sample of Jurkat cells (1.5 x 10⁶ cells)
was exposed overnight to ImmunoCult, a mix of T cells activators. It was also prepared a similar sample of
untreated cells that served as negative control, to monitor the basal levels of IFN-β in Jurkat cells. The
following day, cells were fixated and permeabilized as described in Matherial and Methods. Afterwards,
they were incubated overnight with the primary antibody and then exposed to the secondary antibody.
After this preparation, the cells were ready to be imaged on a confocal microscope with light and filters
suitable for observation of GFP-like signal. Pictures of the two samples were taken for further analysis of
the fluorescence. In Fig. 4.19 are reported two exemplary images of the treated cells (A) and the negative
controls (B). The sample of ImmunoCult-treated cells appeared to be heterogeneous. Most of the cells
were brighter than the control cells, in which the fluorescence was weak and seemed to be localized close
the membrane. In few treated cells the fluorescence was not so far from that of the controls, which means
that the immune response was not the same for every cell. The fluorescence intensities of the cells were
measured with an image analysis software (FIJI), in which the user can define a region of interest (ROI) in an
image and quantify the brightness in the selected ROI. The software calculates the mean brightness of the
pixels in the selected ROI giving a value for the Integrated Density (I.D.). ROIs were defined by following the
borders of each individual cell, obtaining the correspondent I.D. values. The average I.D. for the control
cells was 2613.3 ± 259.4 (N=36). This value was used as a reference value for the basal level of IFN-β in
Jurkat cells. The treated cells showed a significantly higher green fluorescence compared to the negative
controls: the average I.D. was 4753.8 ± 293.8 (N=68) (Fig. 4.19 C). This result suggested that an appreciable
increase of the IFN-β in the cytoplasm can be detected with this method when the pathway is activated.
Fig. 4.19 Synthesis of INF-β in Jurkat T-cells. (A) Picture of a group of jurkat cells untreated and untransfected. (B) Picture of a group of Jurkat cells
treated with ImmunoCult overnight. (C) Mean ± SE of I.D. values from control cells (black circles, N=36) and from activated cells (blue circles, N=68).
B
C A
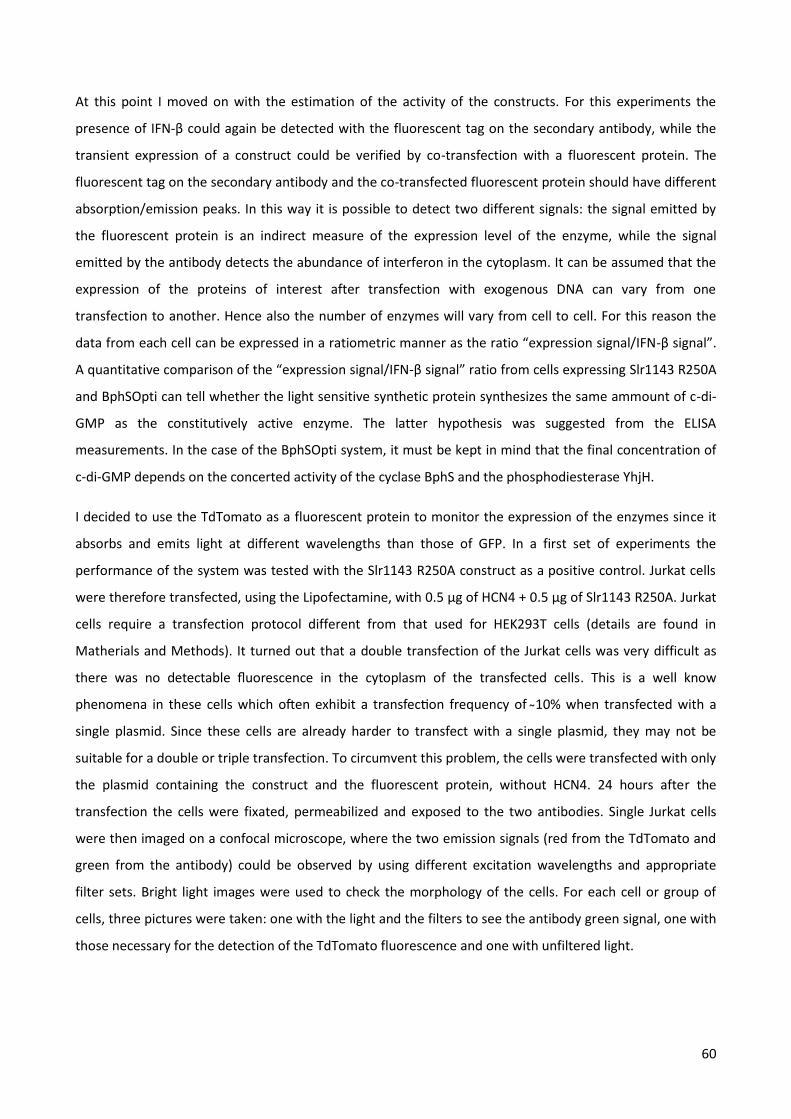
60
At this point I moved on with the estimation of the activity of the constructs. For this experiments the
presence of IFN-β could again be detected with the fluorescent tag on the secondary antibody, while the
transient expression of a construct could be verified by co-transfection with a fluorescent protein. The
fluorescent tag on the secondary antibody and the co-transfected fluorescent protein should have different
absorption/emission peaks. In this way it is possible to detect two different signals: the signal emitted by
the fluorescent protein is an indirect measure of the expression level of the enzyme, while the signal
emitted by the antibody detects the abundance of interferon in the cytoplasm. It can be assumed that the
expression of the proteins of interest after transfection with exogenous DNA can vary from one
transfection to another. Hence also the number of enzymes will vary from cell to cell. For this reason the
data from each cell can be expressed in a ratiometric manner as the ratio “expression signal/IFN-β signal”.
A quantitative comparison of the “expression signal/IFN-β signal” ratio from cells expressing Slr1143 R250A
and BphSOpti can tell whether the light sensitive synthetic protein synthesizes the same ammount of c-di-
GMP as the constitutively active enzyme. The latter hypothesis was suggested from the ELISA
measurements. In the case of the BphSOpti system, it must be kept in mind that the final concentration of
c-di-GMP depends on the concerted activity of the cyclase BphS and the phosphodiesterase YhjH.
I decided to use the TdTomato as a fluorescent protein to monitor the expression of the enzymes since it
absorbs and emits light at different wavelengths than those of GFP. In a first set of experiments the
performance of the system was tested with the Slr1143 R250A construct as a positive control. Jurkat cells
were therefore transfected, using the Lipofectamine, with 0.5 µg of HCN4 + 0.5 µg of Slr1143 R250A. Jurkat
cells require a transfection protocol different from that used for HEK293T cells (details are found in
Matherials and Methods). It turned out that a double transfection of the Jurkat cells was very difficult as
there was no detectable uorescence in the cytoplasm of the transfected cells. This is a well know
phenomena in these cells which o en exhibit a transfec on frequency of 10% when transfected with a
single plasmid. Since these cells are already harder to transfect with a single plasmid, they may not be
suitable for a double or triple transfection. To circumvent this problem, the cells were transfected with only
the plasmid containing the construct and the fluorescent protein, without HCN4. 24 hours after the
transfection the cells were fixated, permeabilized and exposed to the two antibodies. Single Jurkat cells
were then imaged on a confocal microscope, where the two emission signals (red from the TdTomato and
green from the antibody) could be observed by using different excitation wavelengths and appropriate
filter sets. Bright light images were used to check the morphology of the cells. For each cell or group of
cells, three pictures were taken: one with the light and the filters to see the antibody green signal, one with
those necessary for the detection of the TdTomato fluorescence and one with unfiltered light.
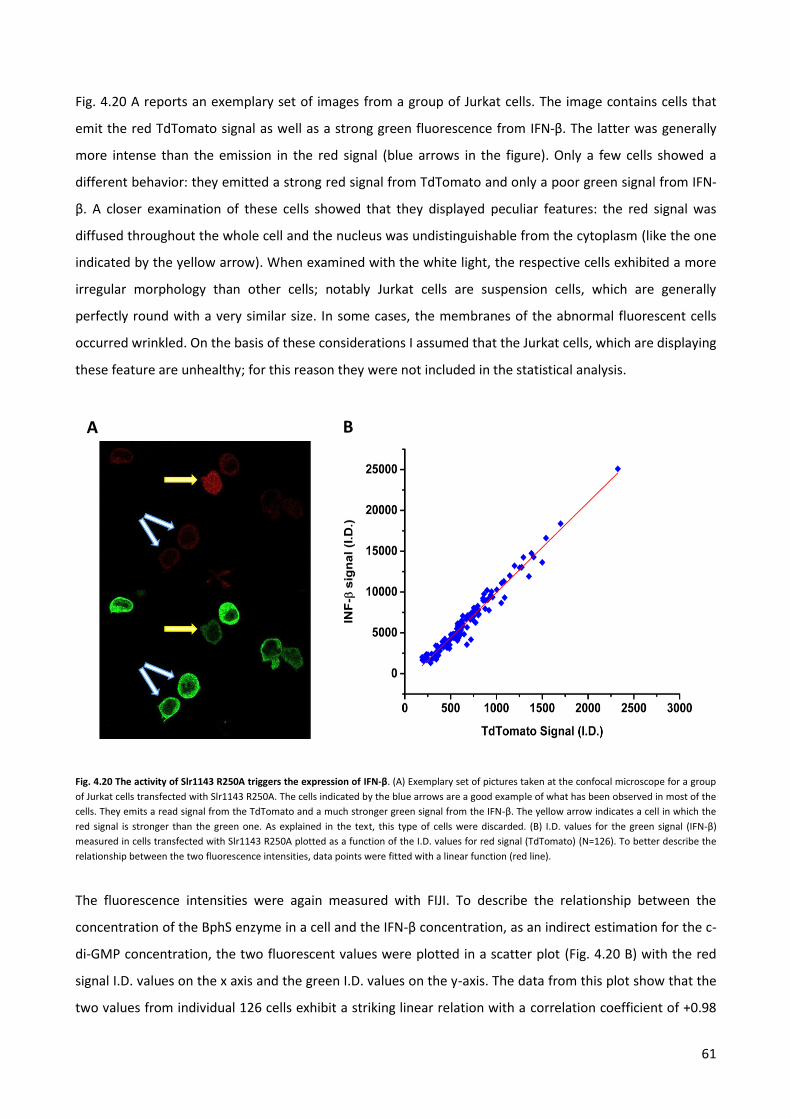
61
Fig. 4.20 A reports an exemplary set of images from a group of Jurkat cells. The image contains cells that
emit the red TdTomato signal as well as a strong green fluorescence from IFN-β. The latter was generally
more intense than the emission in the red signal (blue arrows in the figure). Only a few cells showed a
different behavior: they emitted a strong red signal from TdTomato and only a poor green signal from IFN-
β. A closer examination of these cells showed that they displayed peculiar features: the red signal was
diffused throughout the whole cell and the nucleus was undistinguishable from the cytoplasm (like the one
indicated by the yellow arrow). When examined with the white light, the respective cells exhibited a more
irregular morphology than other cells; notably Jurkat cells are suspension cells, which are generally
perfectly round with a very similar size. In some cases, the membranes of the abnormal fluorescent cells
occurred wrinkled. On the basis of these considerations I assumed that the Jurkat cells, which are displaying
these feature are unhealthy; for this reason they were not included in the statistical analysis.
Fig. 4.20 The activity of Slr1143 R250A triggers the expression of IFN-β. (A) Exemplary set of pictures taken at the confocal microscope for a group
of Jurkat cells transfected with Slr1143 R250A. The cells indicated by the blue arrows are a good example of what has been observed in most of the
cells. They emits a read signal from the TdTomato and a much stronger green signal from the IFN-β. The yellow arrow indicates a cell in which the
red signal is stronger than the green one. As explained in the text, this type of cells were discarded. (B) I.D. values for the green signal (IFN-β)
measured in cells transfected with Slr1143 R250A plotted as a function of the I.D. values for red signal (TdTomato) (N=126). To better describe the
relationship between the two fluorescence intensities, data points were fitted with a linear function (red line).
The fluorescence intensities were again measured with FIJI. To describe the relationship between the
concentration of the BphS enzyme in a cell and the IFN-β concentration, as an indirect estimation for the c-
di-GMP concentration, the two fluorescent values were plotted in a scatter plot (Fig. 4.20 B) with the red
signal I.D. values on the x axis and the green I.D. values on the y-axis. The data from this plot show that the
two values from individual 126 cells exhibit a striking linear relation with a correlation coefficient of +0.98
A B
62
and a slope of 11 ± 0.2. It is noteworthy that the average I.D. value of the untransfected cells (Fig. 4.19 C)
corresponds to the smallest values of the curve in Fig. 4.20 B. I reasoned that the higher green fluorescence
in Slr1143 R250A sample, compared to negative controls, was due to the presence of the exogenous
enzyme. The results of these experiments suggested indeed that an expression of Slr1143 R250A in Jurkat
cells triggers the synthesis of IFN-β presumably via an increase in c-di-GMP concentration. The data
furthermore suggest that the increase in the concentration of IFN-β is a function of the concentration of
the BphS enzyme.
In the following set of experiments the same measurements were repeated with the light-regulated
enzyme. As described in previous chapters, the multi-gene sequence BphSOpti was inserted in a plasmid
that lacked a fluorescent tag. I then designed an AQUA cloning procedure to introduce after YhjH another
2A sequence and a Tdtomato, obtaining in this way a single suitable for single transfections of the Jurkat
cells. Three dishes of cells were transfected: the first one with 1 µg of Slr1143 R250A (to have a positive
control) and the other two with 1 µg of the new plasmid. 24 hours after the transfection, one of these two
dishes was exposed to pulsed light for 1.5 hours. After this time, Jurkat cells from the three petri dishes
were separately collected and prepared for the staining. The cell samples were then imaged on the
confocal microscope, where it was possible to observe a high number of cells emitting the TdTomato signal
in each of the three dishes. Like in the previous assay, these cells also emitted in the green spectrum.
Pictures were taken at the microscope and analyzed with FIJI to investigate the fluorescence intensities.
First, I analyzed the fluorescence of the cells transfected with the positive control Slr1143 R250A. Red
fluorescence from the TdTomato was linearly correlated with the green fluorescence from IFN-β
(correlation coefficient +0.99; m = 14 ± 0.2; N=40) (Fig. 4.21 A). The vast majority of the I.D. values were
larger than the average value of the negative control. In cells, which were expressing BphSOpti but kept in
the dark the two fluorescent intensities exhibited the same linear relationship (fig 4.21 B) with a correlation
coefficient of +0.96 and a slope of 15.6 ± 0.8 (N=27). These data seemed to indicate that the enzyme
activity in the dark is already comparable to that of the positive control Slr1143 R250A. The same analysis
was done for the cells expressing BphSOpti and treated with pulsed light. The two fluorescence intensities
showed also in this case a linar relationship (Fig 4.21 C). Even if data points were more dispersed, a linear
equation was perfectly able to follow the trend of their distribution: the correlation coefficient was +0.86
and the m value was 17.6 ± 2 (N=28). For this cell population the activity of the enzyme seems to be similar
to that observed in cells kept in the dark: the slopes of the two lines were not too different (Fig. 4.21 D).
The results of this analysis indicated that light had no positive effect on the production of IFN-β and hence
on the underlying production of c-di-GMP.

63
If we take the correlation between the concentration of the enzyme and the synthesis of IFN-β as an
indirect estimate for the BphS enzymatic activity, the data confirm the results from the ELISA assay. First,
BphS is able to synthesize as much c-di-GMP as its constitutively active counterpart even if its effect on the
HCN4 channel could not be observed in HEK293T cells. Second, the activity of BphS does not seem to be
affected by red light.
Fig. 4.21 Estimation of the BphS activity in light and dark. (A) I.D. values for the green signal (IFN-β) measured in cells transfected
with Slr1143 R250A plotted as a function of the I.D. values for red signal (TdTomato) (N=40). (B) I.D. values for the green signal (IFN-
β) measured in cells transfected with BphSOpti and kept in the dark, plotted as a function of the I.D. values for the red signal
(TdTomato) (N=27). (C) I.D. values for the green signal (IFN-β) measured in cells transfected with BphSOpti and exposed to light for
1.5 hours, plotted as a function of the I.D. values for the red signal (TdTomato) (N=28). Data points in (A), (B) and (C) are fitted with
a linear equation. (D) Linear equations used to fit the data points in (B) (grey) and (C) (red).
It has been mentioned that the final concentration of c-di-GMP in a cell with BphSOpti is determined by the
combined and antagonistic action of the cyclase and the phosphodiesterase. The latter is required to
maintain low levels of c-di-GMP in the dark. So one possible explanation for the lack of light regulation
could be that the dark activity of the enzyme is not compensated by the phosphodiesterase. The capacity of
this enzyme might be overloaded already by the dark activity of the enzyme. In this case it may not be able
A
C
B
D
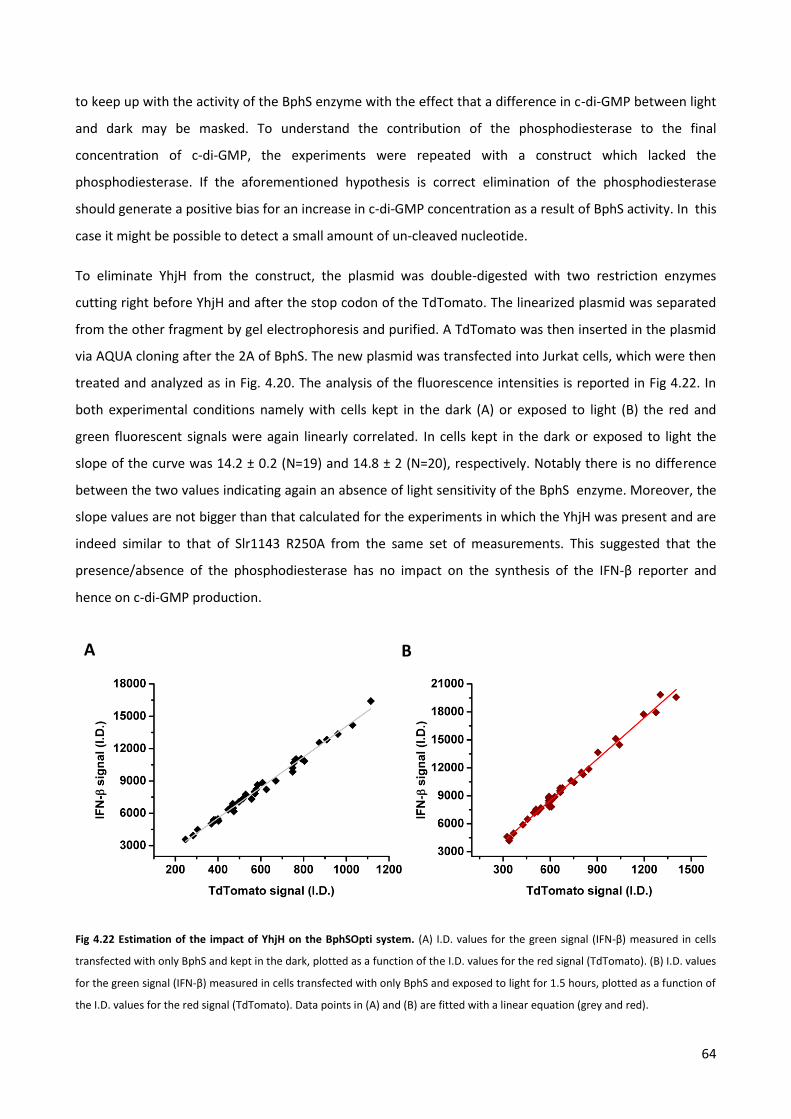
64
to keep up with the activity of the BphS enzyme with the effect that a difference in c-di-GMP between light
and dark may be masked. To understand the contribution of the phosphodiesterase to the final
concentration of c-di-GMP, the experiments were repeated with a construct which lacked the
phosphodiesterase. If the aforementioned hypothesis is correct elimination of the phosphodiesterase
should generate a positive bias for an increase in c-di-GMP concentration as a result of BphS activity. In this
case it might be possible to detect a small amount of un-cleaved nucleotide.
To eliminate YhjH from the construct, the plasmid was double-digested with two restriction enzymes
cutting right before YhjH and after the stop codon of the TdTomato. The linearized plasmid was separated
from the other fragment by gel electrophoresis and purified. A TdTomato was then inserted in the plasmid
via AQUA cloning after the 2A of BphS. The new plasmid was transfected into Jurkat cells, which were then
treated and analyzed as in Fig. 4.20. The analysis of the fluorescence intensities is reported in Fig 4.22. In
both experimental conditions namely with cells kept in the dark (A) or exposed to light (B) the red and
green fluorescent signals were again linearly correlated. In cells kept in the dark or exposed to light the
slope of the curve was 14.2 ± 0.2 (N=19) and 14.8 ± 2 (N=20), respectively. Notably there is no difference
between the two values indicating again an absence of light sensitivity of the BphS enzyme. Moreover, the
slope values are not bigger than that calculated for the experiments in which the YhjH was present and are
indeed similar to that of Slr1143 R250A from the same set of measurements. This suggested that the
presence/absence of the phosphodiesterase has no impact on the synthesis of the IFN-β reporter and
hence on c-di-GMP production.
Fig 4.22 Estimation of the impact of YhjH on the BphSOpti system. (A) I.D. values for the green signal (IFN-β) measured in cells
transfected with only BphS and kept in the dark, plotted as a function of the I.D. values for the red signal (TdTomato). (B) I.D. values
for the green signal (IFN-β) measured in cells transfected with only BphS and exposed to light for 1.5 hours, plotted as a function of
the I.D. values for the red signal (TdTomato). Data points in (A) and (B) are fitted with a linear equation (grey and red).
A B
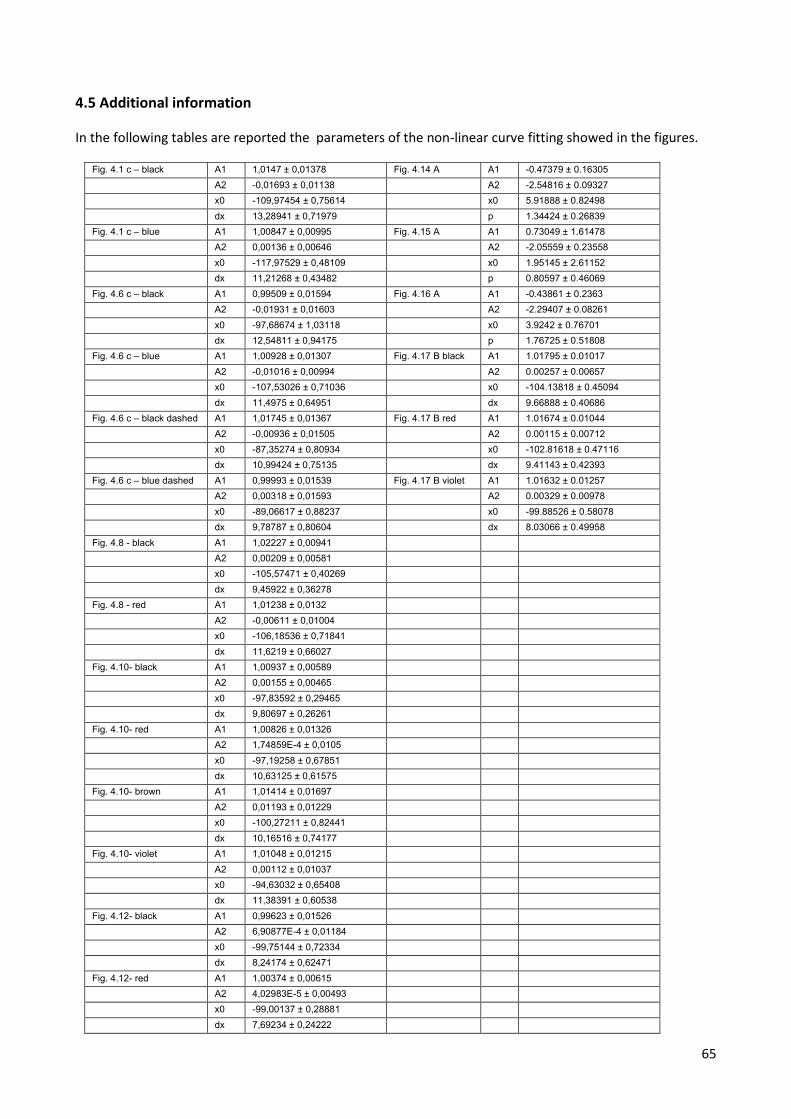
65
4.5 Additional information
In the following tables are reported the parameters of the non-linear curve fitting showed in the figures.
Fig. 4.1 c – black A1 1,0147 ± 0,01378 Fig. 4.14 A A1 -0.47379 ± 0.16305
A2 -0,01693 ± 0,01138 A2 -2.54816 ± 0.09327
x0 -109,97454 ± 0,75614 x0 5.91888 ± 0.82498
dx 13,28941 ± 0,71979 p 1.34424 ± 0.26839
Fig. 4.1 c – blue A1 1,00847 ± 0,00995 Fig. 4.15 A A1 0.73049 ± 1.61478
A2 0,00136 ± 0,00646 A2 -2.05559 ± 0.23558
x0 -117,97529 ± 0,48109 x0 1.95145 ± 2.61152
dx 11,21268 ± 0,43482 p 0.80597 ± 0.46069
Fig. 4.6 c – black A1 0,99509 ± 0,01594 Fig. 4.16 A A1 -0.43861 ± 0.2363
A2 -0,01931 ± 0,01603 A2 -2.29407 ± 0.08261
x0 -97,68674 ± 1,03118 x0 3.9242 ± 0.76701
dx 12,54811 ± 0,94175 p 1.76725 ± 0.51808
Fig. 4.6 c – blue A1 1,00928 ± 0,01307 Fig. 4.17 B black A1 1.01795 ± 0.01017
A2 -0,01016 ± 0,00994 A2 0.00257 ± 0.00657
x0 -107,53026 ± 0,71036 x0 -104.13818 ± 0.45094
dx 11,4975 ± 0,64951 dx 9.66888 ± 0.40686
Fig. 4.6 c – black dashed A1 1,01745 ± 0,01367 Fig. 4.17 B red A1 1.01674 ± 0.01044
A2 -0,00936 ± 0,01505 A2 0.00115 ± 0.00712
x0 -87,35274 ± 0,80934 x0 -102.81618 ± 0.47116
dx 10,99424 ± 0,75135 dx 9.41143 ± 0.42393
Fig. 4.6 c – blue dashed A1 0,99993 ± 0,01539 Fig. 4.17 B violet A1 1.01632 ± 0.01257
A2 0,00318 ± 0,01593 A2 0.00329 ± 0.00978
x0 -89,06617 ± 0,88237 x0 -99.88526 ± 0.58078
dx 9,78787 ± 0,80604 dx 8.03066 ± 0.49958
Fig. 4.8 - black A1 1,02227 ± 0,00941
A2 0,00209 ± 0,00581
x0 -105,57471 ± 0,40269
dx 9,45922 ± 0,36278
Fig. 4.8 - red A1 1,01238 ± 0,0132
A2 -0,00611 ± 0,01004
x0 -106,18536 ± 0,71841
dx 11,6219 ± 0,66027
Fig. 4.10- black A1 1,00937 ± 0,00589
A2 0,00155 ± 0,00465
x0 -97,83592 ± 0,29465
dx 9,80697 ± 0,26261
Fig. 4.10- red A1 1,00826 ± 0,01326
A2 1,74859E-4 ± 0,0105
x0 -97,19258 ± 0,67851
dx 10,63125 ± 0,61575
Fig. 4.10- brown A1 1,01414 ± 0,01697
A2 0,01193 ± 0,01229
x0 -100,27211 ± 0,82441
dx 10,16516 ± 0,74177
Fig. 4.10- violet A1 1,01048 ± 0,01215
A2 0,00112 ± 0,01037
x0 -94,63032 ± 0,65408
dx 11,38391 ± 0,60538
Fig. 4.12- black A1 0,99623 ± 0,01526
A2 6,90877E-4 ± 0,01184
x0 -99,75144 ± 0,72334
dx 8,24174 ± 0,62471
Fig. 4.12- red A1 1,00374 ± 0,00615
A2 4,02983E-5 ± 0,00493
x0 -99,00137 ± 0,28881
dx 7,69234 ± 0,24222

66
5
CONCLUSIONS
AND
FUTURE PROSPECTIVES
67
From the results obtained so far it is possible to draw some conclusions about the functionality of the
tested constructs. The experiments in which the HCN4 channel and the constitutive Slr1143 enzyme were
co-expressed in HEK239T cells clearly show that the latter results in a measurable increase in c-di-GMP in
these cells an that this elevated levels of the ligand affect the voltage dependence of the HCN4 channel.
The increase in c-di-GMP concentration in Slr1143 expressing cells was confirmed by two independent
methods and the left shift of the activation curve of HCN4 between Slr1143 expressing cells and control
cells is significant. The coincidence between an elevated concentration in c-di-GMP and a modulation of
HCN4 gating strongly supports previous reports, which advocated cyclic di nucleotides binding to HCN4 and
a consequence on channel gating (Lolicato et al. 2014). The present data further advocate a correlation
between the catalytic activity of the enzyme and a shift of the voltage dependence of HCN4. The data show
that an improvement in the synthesis of c-di-GMP by the mutation R250A in the Slr1143 enzyme, causes an
increase in the number of measurements in which the activation voltage of HCN4 is negative shifted with
respect to the control. All this contradicts the results from an other publication in which no binding of cyclic
di-nucleotides to the channel was observed (Hayoz et al., 2017).
While the present data confirm a previous report on an interaction of c-di-GMP with the HCN4 channel
(Lolicato et al. 2014) they reveal also some differences to the latter study. The aforementioned study
reported that c-di-GMP did not modulate the channel at endogenous physiological concentration of cAMP
in HEK293T cells; in their measurements c-di-GMP was only effective in reverting the effect of additionally
added cAMP. In contrast to these data the present recordings show already an effect of c-di-GMP on HCN4
gating with basal physiological cAMP concentrations. The reason for the different results of the two studies
might be related to the different type of experiments. While c-di-GMP was continuously synthesized in the
present study it was added together with or without cAMP via the patch pipette in the study by Lolicato
and coworkers (Lolicato et al. 2014). Based on the two different experimental systems, the following
hypothesis could be formulated. Cells have a basic level of cAMP, which determines the position of the
activation curve of HCN4 channels. With a continuous synthesis of c-di-GMP -as in the present study- the
V1/2 value is left shifted with respect to control cells, which do not synthesize the cyclic dinucleotide. During
a whole-cell recording the concentration of cAMP and of c-di-GMP presumably decrease together as a
result of a perfusion from the patch pipette. The V1/2 value is, at any time, reflected by the concerted
activity of both agents. The situation is different in the setting used by Lolicato and co workers (Lolicato et
al. 2014). In their case c-di-GMP was dyalized into the cell while cAMP was already diluted out. It is
reasonable to assume that the delayed arrival of c-di-GMP at its binding site with the concomitant decrease
in cAMP concentration masks any effect of the cyclic dinucleotide on HCN4 gating. One aspect of this
hypothesis deserves further thinking. In a recent paper, the HCN4 channel was exposed to a synthetic
peptide that stabilizes the unbound conformation of the CNBD (Saponaro et al., 2018). In the presence of
the peptide and 10 uM cAMP, they observed that the V1/2 was exactly the same as the control cells, i.e.
68
without the peptide and the cAMP. The observed backshift of the activation curve suggested that the
peptide was able to counteract the effect of cAMP. Interestingly, the fact that the measured V1/2 was not
more negative than the controls implies that in an HEK293T cell endogenous cAMP is not so crucial in
determining the activation voltage of the HCN4. So another possible explanation of the observed effect
may consider the fact that the c-di-GMP has always been present during the formation of the channel. This
may cause an alteration of the voltage dependence that is independent from the endogenous cAMP. This
second hypothesis implies an effect of c-di-GMP and CLP that has not been observed so far. For this reason,
before further speculating, it is more reasonable to test whether the direct effect of c-di-GMP on HNC4
gating is actually due to the relative dilution timing of the two messengers. This can be done in further
experiments by performing measurements with perforated patches.
Dilution problems may be an explanation also for the fact that the ability to counteract cAMP effect
seemed to be concentration dependent. In Lolicato et al. (2014), the c-di-GMP and the cAMP were
delivered via the pipette into the cytoplasm together. In the present experiments, on the contrary, the
whole-cell configuration causes a decrease in the concentration of the cytoplasmatic c-di-GMP, while the
concentration of cAMP is increasing. In the present study it was possible to measure a backshift of the
activation curve by a few mV only with non-saturating concentrations of cAMP in the recording pipette. The
results of these experiments suggest that the recordings conditions and the perfusion of the cells with
second messengers can be crucial for the response of the cells.
More conclusions from this study can be drawn about the synthetic phytochrome BphS and its antagonist
YhjH. The data show that the combined BphS-YhjH system is not properly light-regulated. Both the ELISA
assays and immune fluorescence measurements reveal a high dark activity of the system. Both assays were
unable to detect any difference in the c-di-GMP concentration between cells kept in the dark or exposed to
stimulating red light. Moreover both assays indicate that the c-di-GMP concentration in cells expressing
BphS-YhjH was about the same as in cells expressing the constitutively active enzyme Slr1143. It is well
known that the light regulated BphS enzyme is leaky meaning that it also synthesizes c-di-GMP in the dark.
For this reason it is generally co-expressed with the phosphodiesterase YhjH, which should balance the c-di-
GMP production in the dark. This means that the actual c-di-GMP concentration in a cell is a delicate
equilibrium between c-di-GMP synthesis and destruction. In this scenario an elevated c-di-GMP
concentration in the dark could result from an insufficient activity of the phosphodiesterase. This
interpretation is indirectly supported by the present data. In experiments in which BphS was expressed
without the YHjH phosphodiesterase, the resulting c-di-GMP concentration was not much different
compared to cells in which both enzymes were co-expressed. The results of these experiments imply that
the YHjH phosphodiesterase is not sufficiently active for balancing the dark activity of the BphS cyclase. In
the case of a large dark background in c-di-GMP synthesis it is not surprising that red light is not able to

69
stimulate an elevated level of the second messenger. The data strongly suggest that the expression and/or
function of the YHjH phosphodiesterase needs to be improved in order to make this system suitable as an
optogenetic tool.
The prominent dark activity of the BphS cyclase and the concomitant elevated c-di-GMP concentration in
these cells predict that also the activation curve of HCN4 should be shifted in these cells with respect to
non-transfected controls. This predicted shift however is not detected in the present experiments. The
voltage dependence of the HCN4 channel in HEK293 cells was not different between cells co-transfected
with Bphs-YhjH and control cells. The result of these data cannot be finally explained here. However, a
comparison between the different panels in Fig. 4.20 may suggest a possible explanation of the
conundrum. The fluorescent values on the x-axis of graphs A, B and E, which are an indirect measure of the
expression levels for the cyclases, show that the Slr1143-IRES-TdTomato reaches higher maximal expression
levels than the BphS-2A-YhjH-2A-TdTomato construct. For patch clamp experiments with HEK293 cells
expressing Slr1143 always the brightest cells were chosen for measurements. Based on the data of Fig. 4.20
it is reasonable to assume that these cells were also those with the highest concentration of c-di-GMP.
Hence the shift of the activation curve from Slr1143 expressing cells may be generated by high
concentrations of c-di-GMP. The electrical experiments with BphS-2A-YhjH expressing cells were done in a
different manner. In this case the cyclase/phosphdiestearse were co-transfected with a plasmid containing
GFP. In this case the fluorescence intensity is not a measure for the expression of the cyclase. In this
scenario it is reasonable to speculate that cells were choses for the electrical recordings in which the
BphS/YhjH expression was not optimal and hence the c-di-GMP concentration below a functional
concentration threshold. In further experiments it will be necessary to measure HCN4 channel gating in
Slr1143 and BphS-2A-YhjH expressing cells with the same protocol. Based on the data from Fig. 4.20, which
suggest a large range of expression between individual cells and a linear correlation between cyclase
expression and c-di-GMP concentration, the fluorescent tagged cyclase would be the method of choice.
The large cell to cell variability (Fig. 4.20) also implies that a much larger of cells has to be measured in
patch clamp experiments for a robust insight into the effect of the cyclase activity on HCN4 activity.
The main goal of the present study was the development of an optogentic tool, which is able to modulate
HCN4 activity by penetrating red light. The present work does not provide such a tool but presents some
major advances. The data strongly support that a precise regulation of c-di-GMP concentration by red light
requires a better compensation of the dark activity of the BphS enzyme. It has been shown in previous
studies that a tuning of the expression of YhjH is crucial for obtaining this desired effect (Ryu et al., 2014).
In the present study, YhjH is not contributing to the final concentration of c-di-GMP neither in cells kept in
the dark nor in those exposed to red light. It is therefore reasonable to think that the expression of the
phosphodiesterase must be increased.
70
One approach to achieve this goal could be obtained by transfecting a different amount of DNA for the two
proteins. For this purpose YhjH could be moved to a different plasmid, under the same promoter. In this
way one plasmid will contain only BphS and the other only YhjH. The two plasmids could be transfected
together into HEK293T by using different concentrations for each plasmid. For example the DNA for BphS
and YhjH could used in a 1:2 or 1:3 ratio in co-transfections. By optimizing this ratio it might be possible to
find a good balance between the two antagonistic enzymes and to achieve a robust increase in c-di-GMP
concentration in response to light.
An alternative approach could involve the tuning of protein synthesis, taking advantage of the work by
Ferreira and colleagues (Ferreira et al., 2013). These authors show different ways by which it is possible to
decrease the translation of a gene of interest. In one strategy the translation initiation site (TIS) could be
modified. This is a short sequence, which is recognized by the ribosome and is composed of three bases
upstream the methionine, the start codon and the first base after it. Many human genes present the
conserved motif (G/C)CCAUGGG as a TIS. The insertion of an UUU triplet right before the start codon
causes a decrease in the expression of the protein up to -50%. In this way it might be possible to favour the
expression of the phosphodiesterase over the cyclase. For a more fine regulation of the translation levels, a
small ORF, coding for only two amino acids, can be inserted 5 bases upstream the gene of interest (uORF).
By using different combinations of triplets before the start codon of the target gene and of the uORF, it is
possible to decrease the synthesis of a protein from-50% to -99%.
In addition to the previous method, which increase the activity the phosphodiesterase over the cyclase,
also improvement in the light sensitivity of the cyclase could help in the construction of the desired
optogenetic tool. Such a cyclase with an higher light-dependent activity, was recently developed by the
group of Prof. Gomelsky at the Wyoming University (unpublished data). In further work this protein might
be expressed at a very low concentration in cells. The dark activity of this protein might then be better
compensated by YhjH. Because of the increased light sensitivity the improved cyclase might then produce a
sufficient rise in c-di-GMP concentration for modulation of HCN4 gating.

71
6
MATERIALS AND METHODS
72
6.1 Molecular Biology
PCRS
PCRs were performed for different purposes: insertion of mutations, preparation of inserts for cloning,
screening of colonies by colony-PCR. Two thermal cyclers have been used in this work: BioRad Tm100 and
Biolab Cycler48 (Bio-Rad, Hercules, CA, USA; Biolab, Bebensee, Germany). The polymerases for the
reactions were Phusion and Taq from ThermoFisher (Waltham, MA, USA) and NEB (Ipswich, MA, USA). All
the reactions were prepared according to the manufacturer’s instructions. For GC-rich sequences, the
appropriate buffer was used. When DMSO was needed, its final concentration never exceeded 3%. The
oligonucleotides (Sigma-Aldrich, St. Louis, MO, USA) were diluted in sterile ddH2O to a final concentration
of 100 uM and kept at -20 °C.
Phusion polymerase was used to amplify a gene of interest, to add flanking sequences or for overlapping
PCRs. The thermal cycler protocols were designed according to the instructions provided with the enzyme.
The 3-steps protocol, with annealing temperature at Tm - 4°C, worked well in most of the cases. All the PCR
products were separated by gel electrophoreses on 0.8-1% agarose gels with 0.6 μg/mL MidoriGreen in 1x
TAE (Tris-Acetate-EDTA) buffer. The DNA was then gel-purified and quantified as described below.
Taq polymerase was chosen for colony-PCRs. Colonies were picked with a pipette tip and re-suspended in
10 µL of sterile ddH2O. 1 µL of each cell suspensions was then added to the reaction mixtures, while the
rest was left at 4°C. Thermal cycler 3-steps protocols were designed according to the manufacturer’s
instructions. Once the positive colonies were determined by gel electrophoreses, the respective cell
suspensions were re-inoculated in 8 to 130 mL of LB (Luria-Bertani) medium with appropriate antibiotic
selection and grown for 16 hours (250 r.p.m. at 37°C) for mini/midi preparations (see below).
GEL EXTRACTION
The bands of interest (PCR products or linearized plasmids) were cut out from agarose gels using an
ethanol-sterilized scalpel and transferred into 2 mL reaction tubes. Two different kits have been used in this
work: Zymoclean Gel DNA Recovery from ZymoResearch (Freiburg, Germany) and QIAquick PCR & Gel
Purification Kit from Quiagen (Hilden, Germany). The protocols of the two kits are the same:
1) Three volumes of the appropriate buffer (e.g. for 100 mg of gel slice 300 µl of buffer) were added to the
gel slices and the latter were melted at 50-55°C for 10 minutes. 2) The gel slices melted in the buffer were
loaded onto purification columns provided with the kit. 3) The columns were centrifuged for 1-2 minutes at
> 13000 x g (Sigma centrifuges, model 1-14) and the flow-through was discarded. 4) Columns were then
73
washed with the indicated buffer and centrifuged at 13000 x g. 5) The DNA was eluted with the
recommended volume of water. DNA concentration of the samples was determined as described below.
DNA CONCENTRATION QUANTIFICATION
DNA sample concentration was determined with a UV-Vis spectrophotometer (NANODROP ONEC from
ThermoFisher, Waltham, MA, USA). Water was used for the blank measurement; the same volume of DNA
samples was next loaded on the spectrophotometer. The drops of blank and DNA samples form a liquid
column of known height between two pedestals. Light from a xenon flashlamp passes through this column
and is detected by the internal spectrometer. A graph with the absorbance of the sample as a function of
the wavelengths appears on the screen within few seconds, together with a table containing the
concentrations of the samples in ng/µL, the 260/280 ratio and the 260/230 ratio.
TRANSFORMATION OF COMPETENT BACTERIAL CELLS
DNA was transformed in competent E. coli cells (Dh5α strain) via heat shock. 10 ng DNA was added to 50 µL
of competent cells and the mixture was incubated on ice for 30 minutes. Afterwards, the cells were left at
42°C for 1 minute (dry bath) and then brought back onto ice for 5 minutes. 200 µL LB medium without
antibiotics was added to the cells and the incubated on a shaker at 250 rpm for 30 minutes at 37°. Cell
suspensions were centrifuged at 4000 rpm (Sigma centrifuges, model 1-14) for 4 minutes and almost all the
medium was discarded. Cells were resuspended in the small volume of medium, which remained in the
tube ( 50 µL) by gently tapping the pellet. The re-suspended cells were then spread on a petri dish
containing solid LB-Agar (15 g Agar/1L LB) and the appropriate antibiotic. Cells were grown overnight (16
hours) on the LB-Agar layer.
DNA EXTRACTION FROM BACTERIAL CELLS
Plasmid DNA purification from E.coli cultures was done with miniprep or midiprep kits. For minipreps were
used two kits: GenElute Plasmid miniprep kit from Sigma-Aldrich (St. Louis, Missouri, USA) and ZR plasmid
miniprep kit from Zymo (Freiburg, Germany). For midipreps, NucleoBond Xtra Midi kit from Macherey-
Nagel (Duren, Germany) was employed. Cells taken from a colony or a glycerol stock were grown for 16
hours in 8 mL (miniprep) or 130 mL (midiprep) of LB medium (37°C, 250 rpm). The first passages of the two
protocols are basically the same and they include: centrifugation of the cells, resuspension of the cell pellet,
alkaline lysis at room temperature (RT) for 2-5 min and termination of the alkaline lysis with a
neutralization buffer. After this procedure a precipitate of cell debris is visible. The following steps are
different between miniprep and midiprep protocols. For a midiprep, the lysate is first passed through a
filter (provided with the kit) in order to eliminate cell debris, before going on a purification column (also
provided with the kit). The filter and the column were both washed with the proper buffers and then the
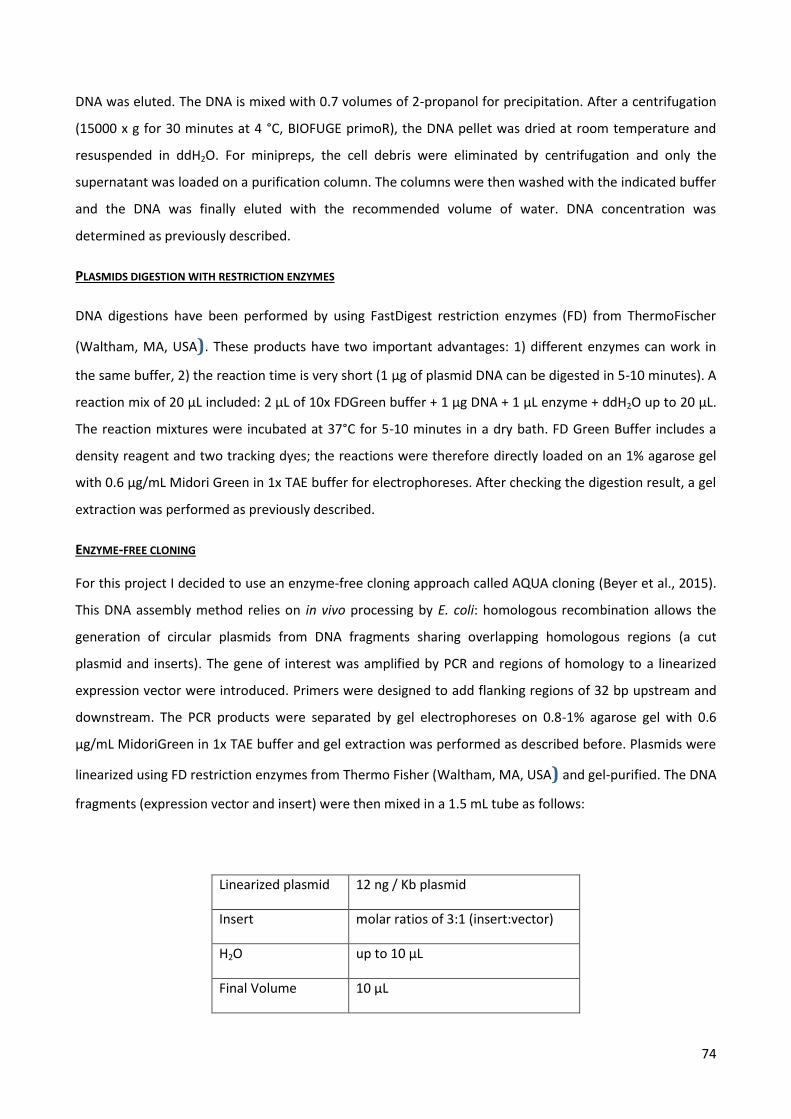
74
DNA was eluted. The DNA is mixed with 0.7 volumes of 2-propanol for precipitation. After a centrifugation
(15000 x g for 30 minutes at 4 °C, BIOFUGE primoR), the DNA pellet was dried at room temperature and
resuspended in ddH2O. For minipreps, the cell debris were eliminated by centrifugation and only the
supernatant was loaded on a purification column. The columns were then washed with the indicated buffer
and the DNA was finally eluted with the recommended volume of water. DNA concentration was
determined as previously described.
PLASMIDS DIGESTION WITH RESTRICTION ENZYMES
DNA digestions have been performed by using FastDigest restriction enzymes (FD) from ThermoFischer
(Waltham, MA, USA). These products have two important advantages: 1) different enzymes can work in
the same buffer, 2) the reaction time is very short (1 µg of plasmid DNA can be digested in 5-10 minutes). A
reaction mix of 20 µL included: 2 µL of 10x FDGreen buffer + 1 µg DNA + 1 µL enzyme + ddH2O up to 20 µL.
The reaction mixtures were incubated at 37°C for 5-10 minutes in a dry bath. FD Green Buffer includes a
density reagent and two tracking dyes; the reactions were therefore directly loaded on an 1% agarose gel
with 0.6 μg/mL Midori Green in 1x TAE buffer for electrophoreses. After checking the digestion result, a gel
extraction was performed as previously described.
ENZYME-FREE CLONING
For this project I decided to use an enzyme-free cloning approach called AQUA cloning (Beyer et al., 2015).
This DNA assembly method relies on in vivo processing by E. coli: homologous recombination allows the
generation of circular plasmids from DNA fragments sharing overlapping homologous regions (a cut
plasmid and inserts). The gene of interest was amplified by PCR and regions of homology to a linearized
expression vector were introduced. Primers were designed to add flanking regions of 32 bp upstream and
downstream. The PCR products were separated by gel electrophoreses on 0.8-1% agarose gel with 0.6
μg/mL MidoriGreen in 1x TAE buffer and gel extraction was performed as described before. Plasmids were
linearized using FD restriction enzymes from Thermo Fisher (Waltham, MA, USA) and gel-purified. The DNA
fragments (expression vector and insert) were then mixed in a 1.5 mL tube as follows:
Linearized plasmid 12 ng / Kb plasmid
Insert molar ratios of 3:1 (insert:vector)
H2O up to 10 µL
Final Volume 10 µL
75
The DNA mixture was incubated for 30 minutes at RT and 30 minutes at 50°C. The DNA was then added to a
50 µL aliquot of competent DH5α cells. The tubes containing the DNA-cell mixture were kept on ice for 30
minutes, after which a heat shock was performed. The reaction tubes were therefore transferred for 45
seconds to a dry bath at 42°C before transferring them back on ice for 10 more minutes. At this point 500
µL of LB medium was added to the cells, which were incubated on a shaker (250 r.p.m.) for 1 hour at 37°C.
After a quick centrifugation (4000 x g for 4 minutes Sigma centrifuges, model 1-14), most of the medium
was discarded and the cells were resuspended in 50 µL of LB. The small volume of medium with re-
suspended cells was then spread on LB-agar plates containing appropriate antibiotics. The next day the
colonies were screened via colony-PCR. Positive colonies were re-inoculated in LB medium with appropriate
antibiotic selection and grown for mini/midiprep. The DNA was then sequenced by EurofinsGenomics
(Luxembourg).
76
6.2 HEK293T cells culture and transfection
HEK293T CELL LINE MAINTENANCE
HEK293T cells were cultured in DMEM (Dulbecco’s Modified Eagle Medium, Euroclone, Pero, Italy) and
DMEM/F-12 (1:1 mixture of Dulbecco's Modified Eagle Medium and Nutrient Mixture F-12, Millipore,
Burlington, MA, USA) supplemented with 10% fetal bovine serum and 1% Pen Strep (100 U/mL of penicillin
and 100 µg/ml of streptomycin), both from Sigma-Aldrich. Cells were grown in 25 mm2 flasks (Sartstedt,
Numbrecht, Germany), stored in a 37 °C humidified incubator with 5% CO2. DMEM/F-12 without phenol-
red was used for experiments with red light. Cells were split every 3-4 days. After the medium was
removed, 1 mL of trypsin or accutase (both from Sigma-Aldrich, St. Louis, MO, USA) was added. Cells were
then incubated for 2 minutes at RT with trypsin or 4 minutes at 37 °C with accutase. The enzymatic
reaction was stopped by adding 5 mL of fresh and pre-heated medium. The desired amount of cell
suspension was added to a new flask pre-filled with 5 mL medium. The same cell suspension was also used
to seed the cells in 35 mm petri dishes (Sartstedt, Numbrech, Germany) pre-filled with 2 mL of fresh
medium. The latter cells were used for transfections. After 25 to 30 passages, the transfection efficiency
started to get worse. At this point new cells were thawed from a stock to start a new line. HEK293T cell
stocks were stored as aliquots in liquid nitrogen with medium and DMSO. When an aliquot was thawed, the
cells were immediately centrifuged to separate them from DMSO. The pellet was re-suspended in 1mL of
fresh medium and transferred to a new flask containing 5 mL of fresh medium.
TRANSFECTION OF HEK293T CELLS
Two transfection protocols have been used in this work for HEK293T cells.
1. Turbofect transfection protocol. The following transfection mix was prepared in a 1.5 mL reaction tube:
100 µL of serum-free medium, up to 1µg of each plasmid, 2µL of turbofect/µg DNA (turbofect transfection
reagent from ThermoFisher, Waltham, MA, USA). The transfection mix was vortexed and incubated at RT
for 20 minutes. After these 20 minutes the transfection mix was added drop-wise to petri dishes with a cell
confluence between 60% and 80%. The dishes were gently shaken to achieve even distribution of the
transfection mix. This transfection method does not require changing of the medium.
2. Calcium phosphate transfection method. Two 1.5 mL tubes were prepared. The first one was filled with
500 µL of 2x Hepes Buffer Solution (280 mM NaCl, 50 mM HEPES, 1.5 mM Na2HPO4, pH 7.09 with 5M
NaOH). The second tube was filled in the following order: up to 6 µg of each plasmid, 62 µL CaCl2 2M, H2O
up to 500 µL. The content of this tube was added drop-wise to the first one, while gently tapping the latter
to ensure good mixing. After incubation at RT for 10 minutes, 500 µL of the transfection mix was added in a
35 mm petri dish with a cell confluence between 60% and 80%. Cells were transferred back into the
incubator and the medium was changed after 4 hours.

77
6.3 Jurkat cells culture and transfection
JURKAT CELL LINE MAINTENANCE
Jurkat cells were cultured in RPMI (Roswell Park Memorial Institute 1640 medium, Millipore, Burlington,
MA, USA) supplemented with 10% fetal bovine serum and 1% Pen Strep (100 U/mL of penicillin and 100
µg/ml of streptomycin), both from Sigma-Aldrich. Cells were grown in 75 mm2 flasks (Sartstedt, Numbrech,
Germany), stored in a 37 °C humidified incubator with 5% CO2. RPMI without phenol-red was used for
experiments with NIR.
The cells were split every four days. Jurkat are not adherent cells so they don’t need to be detached from
the flask with enzymes. A new flask was prepared with 15 mL of fresh pre-heated medium, then 15 mL of
the cell culture was transferred to this new flask. The cells were visually checked with a microscope
periodically. Healthy Jurkat cells appear round, with small wing-shaped extensions. When the cells started
to look unhealthy (not round and without extensions) a new line was started as described for HEK293T.
TRANSFECTION OF JURKAT CELLS
Jurkat cells are more difficult to transfect than HEK293T cells. For the present work I used a protocol, which
had been established in previous work (Voos et al. 2018). The transfection reagent used in this protocol is
lipofectamine 2000 (Invitrogen, Carlsband, CA, USA).
The cell concentration in the culture flask was determined with a cell-counter (NanoEnTek, Seoul, Korea).
An aliquot of 50 µL of cell culture was mixed with 50 µL of Tryphan Blue, which stains dead cells. 10 µL of
this blue sample was loaded on a counting slide for inspection in the cell counter. The counter provides
information about cell concentration and viability. For transfections, 1.4 – 1.7 x 10⁶ cells were pelleted and
re-suspended in 100 µL of fresh pre-heated medium. In another 1.5 mL tube, 1µg of DNA (for double
transfections 0.5 µg of each DNA) was mixed with 6 µL lipofectamine 2000. After 5 minutes of incubation at
RT, 250 µL of serum-free medium was added. After one more minute of incubation at RT, the transfection
mix was transferred in the first tube to be mixed with the cells. This tube was then incubated at 37°C for 5
hours, after which the cells were seeded in 35 mm petri dishes together with 2 mL of fresh medium.
78
6.4 Electrophysiology
24 hours after transfection, HEK293T cells were split in 35mm petri dishes to obtain dispersed single cells.
After 3-4 hours cells were ready for patch-clamp experiments, which were performed at RT.
EXPERIMENTAL SETUP AND ANALYSIS
For experiments at TU Darmstadt the glass pipettes were prepared with a vertical puller (model P-P 830
from Narishige, Suginami, Japan). Borosilicate capillaries (1.5-1.8 x 1000 mm, Kimble, Vineland, NJ, USA)
were pulled and then coated with Sigmacote (Sigma-Aldrich, St. Louis, MO, USA). The capillaries were then
dried for 5 to 6 days. For recordings at the University of Milan, a horizontal puller (P-97 Flaming/Brown
from Sutter, Novato, CA, USA) was used to pull borosilicate capillaries (1.5mm O.D., 0.86 I.D. capillaries
from Sutter, Novato, CA, USA). Both pullers were set to obtain pipettes with a resistances of 3–5 MΩ.
Pipettes were filled with the intracellular solution, which contained: 10 mM NaCl, 130 mM KCl, 1 mM
egtazic acid (EGTA), 0.5 mM MgCl2, 2 mM ATP (Mg salt) and 5 mM HEPES–KOH buffer (pH 7.4). Where
indicated, Adenosine 3′,5′-cyclic monophosphate (cAMP, Sigma-Aldrich) was added to the intracellular
solution. The medium was removed from the 35 mm petri dish before recordings and substituted with the
extracellular solution, which contained: 110 mM NaCl, 30 mM KCl, 1.8 mM CaCl2, 0.5 mM MgCl2 and 5 mM
HEPES–KOH buffer (pH 7.4).
Fluorescent cells were approached with the glass pipette and sealed against the pipette tip by gentle
suction. After obtaining a good seal (seal resistance > 1GΩ), HCN4 currents were measured in the whole-
cell configuration. In Milan a Dagan 3900A amplifier (Degan, Minneapolis, MN, USA) and an Axon Digidata
1322 A/D converter (Axon Instruments, San Jose, CA, USA) were used for the recordings. The recorded
current traces were analyzed with Axon pClamp9. In TU Darmstadt the same measurements were
performed with a HEKA EPC9 (HEKA, Lambrecht/Pfalz, Germany), which includes in a single instrument the
amplifier and the A/D converter. Currents were in this case analyzed with PatchMaster v2x90.2 a software
from HEKA. To elicit and record HCN4 currents voltage step protocols were applied to the cells. Each
protocol was composed by many cycles, each of them divided in 3 segments. In the first and the last
segment the voltage was clamped at -30 mV (1 second) and -40 mV (7 seconds), respectively. Test voltages
were applied in the second segment (4.5 seconds), starting from -30 mV, in -15 mV increments. Usually,
protocols were composed of 10 cycles to cover a range of voltages from -30 to -165 mV.
The current traces were analyzed to investigate the voltage dependence of the channel. In the Results and
Discussion chapters, I explain the types of analysis that I performed and the rationale behind them. The
analysis and the preparation of the figure were done with the Originpro (OriginLab, Northampton, MA,
USA) or Igorpro (WaveMetrics, Lake Oswego, OR, USA).
79
6.5 ELISA assays for quantification of intracellular c-di-GMP
PREPARATION OF CELL EXTRACT SAMPLES
ELISA assays were performed in order to quantify the intracellular c-di-GMP concentration. For this purpose
cell extracts had to be prepared. Cells were transfected with the constructs of interest and after 24 hours
the transfection efficiency was checked under a microscope (usually 30-40 % of transfected cells). Cells
were detached from the dishes with accutase and the reaction was stopped with 2mL medium. Cells were
transferred into a 2 mL tube and centrifuged (800 x g, 3 min, BIOFUGE, primoR); the supernatant was
discarded. For the lysis of the collected cells three methods for different assays were used during the
course of this work. The reasons for using three different approaches are explained in Results and
Discussion. The three different methods are as follows:
1. Cells were resuspended in PBS to a final concentration of 1 x 10⁶ cells/mL. The cell membranes were
then broken by 3 freeze/thaw cycles.
2. Cells were resuspended in an 1% Triton buffer (150 mM NaCl, 2 mM EDTA, 1% Triton, 10 mM Tris-HCl pH
7.4) to a final concentration of 1 x 10⁶ cells/mL. The lysis buffer was added cold to the cell pellets. Cells
were resuspended by pipetting and vortexing. After that, cells were incubated on ice for 30 minutes.
3. Cell pellets were resuspended in a buffer containing acetonitrile, methanol and H2O (2:2:1) to a final
concentration of 1 x 10⁶ cells/mL. Cells were incubated on ice for 15 minutes and at 95°C for 5 minutes.
The lysates obtained with these methods were cleared of cell debris by centrifugation (5 min, 14000 x g,
4°C, BIOFUGE primoR). The supernatants were collected and stored at -20°C.
ELISA ASSAY
For this work the General Cyclic Diguanylate ELISA Kit (EIAab, Wuhan, China) was used. This assay is based
on the competitive immunoassay technique. General information about competitive ELISA can be found in
Results and Discussion, where I introduce this technique. The assay was performed according to the
manufacturer’s instructions. Before the assay all the reagents were brought to room temperature. Samples,
standards and reagents were loaded in two replicates in 96-well plate with a multi-channel pipette. The
incubation steps were performed at 37°C in a sterile incubator. During these incubation steps, the plate
was carefully sealed to avoid contamination. After each incubation step, the reagents were removed from
the wells by pipetting plus gently tapping the plate on a paper towel. After the last step of the assay
procedure, the absorbance values of the wells were measured with a special spectrophotometer designed
to read multi-well plates (Epoch2 from BioTek, Winooski, VT, USA). Absorbance values of the standards
were used to obtain a calibration curve, from which concentration values of the samples could be
extrapolated. For this analysis an online software called MyAssay was used (www.myassays.com).
80
6.6 Immuno-fluorescence of Jurkat Cells
PREPARATION OF THE CELLS
As explained in the Results and Discussion, I quantified the production of interferon β (IFN-β) in Jurkat cells
in response to the presence of c-di-GMP with immunofluorescence. Cells were transfected with the
constructs of interest as described in chapter 6.2. 24 hours after transfection, the following treatments
were applied:
1. Cells were transferred into 2 mL reaction tubes and centrifuged (1800 rpm, RT, 5 minutes, Sigma
centrifuges, model 1-14). The medium was discarded and the pellet resuspended in 1 mL PBS. After
centrifugation, the PBS supernatant was removed from the tube. All following centrifugation steps were
performed as the aforementioned one.
2. The pellet was resuspended in 1 mL of 4% Paraformaldehyde (in PBS). Cells were incubated at RT for 30
minutes on a shaker at 400 rpm.
3. Cells were isolated by centrifugation from the Paraformaldehyde supernatant and resuspended in 1 mL
of 0.2% Triton X-100 (in PBS). Cells were then incubated on a shaker with Triton X-100 at RT for 10
minutes (400 rpm). After this incubation the cells were pelleted and the Triton X-100 was discarded. This
step was repeated twice.
4. The cells were washed with 1 mL PBS.
5. After PBS was removed, the cells were resuspended in 0.5 mL of primary antibody (20 µg/mL, anti-IFN-β
rabbit polyclonal antibody, ThermoFisher), to which they were exposed overnight (16 hours, 4°C, 300
rpm).
6. The next day the samples were centrifuged to eliminate the antibody. The cell pellet was resuspended in
1 mL of Tween20 (Polyethylene glycol sorbitan monolaurate) 0.05% (in PBS) and centrifuged again.
7. The Tween20 was discarded and substituted with 500 µL secondary antibody (1 µg/mL, AlexaFluo goat
anti-rabbit, Invitrogen, Carlsbad, CA, USA). Cells were incubated with the antibody for 1 hour, at RT on a
shaker at 400 rpm. After this incubation the cells were pelleted.
8. The pellet was washed with 1 mL of Tween20 0.05% (in PBS) and centrifuged.
9. The cells were resuspended in 500 µL PBS.
81
IMAGING AT THE CONFOCAL MICROSCOPE
Jurkat cells were imaged on a confocal laser scanning microscope (CLSM) (LeicaTCS SP5; Leica mycrosystem
CMS GmbH, Wetzlar, Germany). The cell samples were examined using an immersion objective (HCX PL
APO 100x). Two laser lights were used for exciting the fluorescent tags. The first was an 488 nm Argon laser
with an intensity of 20%. The second was a green 561 nm laser at intensity of 40%. The filter used for this
type of analysis was a dual band pass filter (458-514 nm). For the green GFP-like emission signal the
detector HyD1 was used, while for the red signal was collected by HyD2 detector. Each detector covered a
range of wavelengths ±20 nm around the absorption peak. The cells were measured in PBS. Each cell
sample was loaded on a 25 mm coverslip fixed between two aluminum rings. The coverslip was then fixed
to the microscope plate.
Images of the cells were taken using the software LAS AF Version 2.60 (Leica Leica mycrosystem CMS
GmbH). The images were acquired with a scanning frequency of 200 Hz and the pixel size was set to
1024x1024. Pictures were then analyzed with the software Fiji (Bethesda, MD, USA) to quantify the
fluorescence intensities. The analysis that was done on the images acquired at the microscope is presented
in the Results and Discussion part.

82
7
BIBLIOGRAPHY
83
Aldridge M.e., Forest K.T. (2011) Bacterial phytochromes: More than meets the light. Critical Reviews in Biochemistry
and Molecular Biology, 46, 1: 67-88.
Arrigoni C., Schroeder I., Romani G., Van Etten J.L., Thiel G., Moroni A. (2013) The voltage-sensing domain of a
phosphatase gates the pore of a potassium channel. Journal of General Physiology 141 (3): 389-95
Bamberg E., Tittor J., Oesterhelt D. (1993) Light-driven proton or chloride pumping by halorhodopsin. Proceedings of
the National Academy of Sciences of the United States 90 (2): 639-643.
Banghart M., Borges K., Isacoff E., Trauner D., Kramer R.H. (2004) Light-activated ion channels for remote control of
neuronal firing. Nat Neurosci., 7(12):1381-6.
Barbuti A., DiFrancesco D. (2008) Control of cardiac rate by “funny” channels in health and disease. Ann. N.Y. Acad.
Sci., 1123: 213–223.
Baruscotti M., Barbuti A., Bucchi A. (2010) The cardiac pacemaker current. J Mol Cell Cardiol., 48(1): 55-64.
Bell D.C., Yao H., Saenger R.C., Riley J.H., Siegelbaum S.A. (2004) Changes in local S4 environment provide a voltage-
sensing mechanism for mammalian hyperpolarization-activated HCN channels. J Gen Physiol., 123(1): 5-19
Beyer H.M., Gonschorek P., Samodelov S.L., Meier M., Weber W., Zurbriggen M.D. (2015) AQUA cloning: c versatile
and simple enzyme-free cloning approach. PLoS One 11; 10(9): e0137652.
Bezanilla F. (2008) How membrane proteins sense voltage. Nature Reviews Molecular Cell Biology 9: 323-332.
Biel M., Wahl-Schott C., Michalakis S., Zong x. (2009) Hyperpolarization-activated cation channels: from genes to
function. Physiol Rev 89: 847–885.
Biel S., Aquila M., Hertel B., Berthold A., Neumann T., DiFrancesco D., Moroni A., Thiel G., Kauferstein S.(2016)
Mutation In S6 domain of HCN4 channel in patient with suspected Brugada syndrome modifies channel function.
Pflugers Arch.,468(10):1663-71.
Blunck R., Batulan Z. (2012) Mechanism of electromechanical coupling in voltage-gated potassium channels.
Frontiers in Pharmacology, 3: 1-16.
Börjesson S. I. and Elinder F. (2008) Structure, function, and modification of the voltage sensor in voltage-gated ion
channels. Cell Biochem Biophys 52: 149–174.
Boyden E.S., Zhang F., Bamberg E., Nagel G., Deisseroth K. (2005) Millisecond-timescale, genetically targeted optical
control of neural activity. Nature Neuroscience 8 (9): 1263-1268.
Boyden E.S. (2011) A history of optogenetics: the development of tools for controlling brain circuits with light. F1000
Biology Reports 2011, 3:11.
Boyle P.M., Karathanos T.V., Trayanova N.A. (2018) Cardiac Optogenetics: 2018. JACC Clin Electrophysiol., 4(2):155-
167.
Brown H.F., DiFrancesco D., S.J. Noble (1979) How does adrenaline accelerate the heart? Nature vol. 280: 235-236.
Burdette D.L., Monroe K.M., Sotelo-Troha K., Iwig J.S., Eckert B., Hyodo M., Hayakawa Y., Vance R.E. (2011) STING is
a direct innate immune sensor of cyclic di-GMP. Nature 478 (7370): 515-8.
Burdette, D. L., Vance, R. E. (2013) STING and the innate immune response to nucleic acids in the cytosol. Nature
Immunology, 14(1): 19–26.
84
Burgie E.S., Vierstra R.D. (2014) Phytochromes: an atomic perspective on photoactivation and signaling. The Plant
Cell, Vol. 26: 4568–4583.
Christen M., Christen B., Folcher M., Schauerte A., Jenal U. (2005) Identification and Characterization of a Cyclic di-
GMP-specific Phosphodiesterase and Its Allosteric Control by GTP. THE JOURNAL OF BIOLOGICAL CHEMISTRY Vol. 280,
No. 35: 30829 –30837.
Christie (2007) Phototropin Blue-Light Receptors. Annual Review of Plant Biology 58: 21–45.
Cosentino C., Alberio L., Gazzarrini S., Aquila M., Romano E., Cermenati S., Zuccolini P., Petersen J., Beltrame M.,
Van Etten J.L., Christie J.M., Thiel G., Moroni A. (2015) Engineering of a light-gated potassium channel. Science
348:707-710.
Crick F.H. (1979) Thinking about the brain. Scientific American 241 (3): 219-32.
D’Argenio D.A., Miller S.I. (2004) Cyclic di-GMP as a bacterial second messenger. Microbiology, 150: 2497–2502.
Deisseroth K. (2011) Optogenetics. Nature Methods 8: 26–29.
Deisseroth K. (2015) Optogenetics: 10 years of microbial opsins in neuroscience. Nature Neuroscience, volume 18,
Number 9.
DiFrancesco D., Ferroni A., Mazzanti M., Tromba C. (1986) Properties of the hyperpolarizing-activated current (if) in
cells isolated from the rabbit sino-atrial node. J. Physiol., 377, pp. 61-88.
DiFrancesco D., Tortora, P. (1991). Direct activation of cardiac pacemaker channels by intracellular cyclic AMP.
Nature, 351(6322): 145–147.
DiFrancesco D. (1993) Pacemaker Mechanisms in Cardiac Tissue. Annual Review of Physiology, 55(1), 455–472.
DiFrancesco D. (2010) The role of the funny current in pacemaker activity. Circ Res., 106(3):434-46.
DiFrancesco M.L., Gazzarrini S., Arrigoni C., Romani G., Thiel G., Moroni A. (2015) Engineering a Ca2+ sensitive (bio)
sensor from the pore-moduke of a potassium channel. Sensors 15:4913-4924.
DiVentura B., Kuhlman B (2016) Go in! Go out! Inducible control of nuclear localization. Curr Opin Chem Biol. 34: 62-
71
Fenno L.E., Yizhar O., Deisseroth K. (2011) The Development and Application of Optogenetics Annual. Review of.
Neuroscience 34: 389-412.
Folcher M., Oesterle S., Zwicky K., Thekkottil T., Heymoz J., Hohmann M., Christen M., Daoud El-Baba M.,
Buchmann P., Fussenegger M. (2014) Mind-controlled transgene expression by a wireless-powered optogenetic
designer cell implant. Nature Communications, 5(1).
Gross C., Saponaro A., Santoro B., Moroni A., Thiel G., Hamacher K. (2018) Mechanical transduction of cytoplasmic-
to-transmembrane-domain movements in a hyperpolarization-activated cyclic nucleotide-gated cation channel. J Biol
Chem., 293(33): 12908-12918
Hayoz S., Tiwari P.B., Piszczek G., Üren A., Brelidze T.I. (2017) Investigating cyclic nucleotide and cyclic dinucleotide
binding to HCN channels by surface plasmon resonance. PLoS One12(9): e0185359.
Hille, B. (2001) Ionic channels of excitable membranes. Sinauer Sunderland MA.
Kalia D., Merey G., Nakayama S., Zheng Y., Zhou J., Luo Y., Guo M., Roembke B.T., Sintim H.O. (2013) Nucleotide, c-di-
GMP, c-di-AMP, cGMP, cAMP, (p)ppGpp signaling in bacteria and implications in pathogenesis. Chem. Soc. Rev. 42: 305-341.
85
Larsson H. P., Baker O. S., Dhillon D. S., Isacoff E. Y. (1996) Transmembrane movement of the shaker K+ channel S4.
Neuron Vol. 16, 387–397.
Lee C.H., MacKinnon R. (2017) Structures of the human HCN1 hyperpolarization-activated channel. Cell 168: 111–120.
Lolicato M., Nardini M., Gazzarrini S., Möller S., Bertinetti D., Herber F.W., Bolognesi M., Martin H., Fasolini M.,
Bertrand J.A., Arrigoni C., Thiel G., Moroni A. (2011) Tetramerization dynamics of C-terminal domain underlies
isoform-specific cAMP gating in Hyperpolarization-activated Cyclic Nucleotide-gated channels. The journal of biological
chemistry Vol. 286, No. 52: 44811–44820
Long S. B., Campbell E. B., MacKinnon R. (2005) Voltage Sensor of Kv 1.2: structural basis of the electromechanical
coupling. Science Vol. 309: 903-908.
Ludwig A., Zong X., Jeglitsch M., Hofmann F., Biel M. (1998) A family of hyperpolarization-activated mammalian
cation channels. Nature, 393: 587–591.
Ludwig A., Zong X., Stieber J., Hullin R., Hofmann F., Biel M. (1999) Two pacemaker channels from human heart with
profoundly different activation kinetics. The EMBO Journal, 18(9): 2323–2329.
Männikko R., Elinder F., Larsson H. P. (2002) Voltage-sensing mechanism is conserved among ion channels gated by
opposite voltages. Nature Vol. 419, 837-841.
McWhirter S.M., Barbalat R., Monroe K.M., Fontana M.F., Hyodo M., Joncker N.T., Ishii K.J., Akira S., Colonna
M., Chen Z.J., Fitzgerald K.A., Hayakawa Y., Vance R.E. (2009) A host type I interferon response is induced by cytosolic
sensing of the bacterial second messenger cyclic-di-GMP. J Exp Med. 206(9):1899-911.
Mei Y., Zhang F. (2012) Molecular Tools and Approaches for Optogenetics. Biological psychiatry 71:1033–1038.
Nagel G., Szellas T., Huhn W., Kateriya S., Adeishvili N., Berthold P., Ollig D., Hegemann P., and Bamberg E. (2003)
Channelrhodopsin-2, a directly light-gated cation-selective membrane channel. Proceedings of the National Academy
of Sciences of the United States Vol. 100, No. 24: 13940–13945.
Niopek D., Benzinger D., Roensch J., Draebing T., Wehler P., Eils R., Di Ventura B. (2014) Engineering light-inducible
nuclear localization signals for precise spatiotemporal control of protein dynamics in living cells. Nat Commun. 2014
5:4404.
Niopek D., Wehler P., Roensch j. Eils R., Di Ventura B. (2016) Optogenetic control of nuclear protein export. Nat
Commun. 7:10624.
Pape H.C. (1996) Queer current and pacemaker: the hyperpolarization- activated cation current in neurons. Annu Rev.
Phyiol. 1996 58:299-327
Pham E., Mills E., Truong K. (2011) A Synthetic Photoactivated Protein to Generate Local or Global Ca2+ Signals.
Chemistry & Biology 18: 880–890.
Piatkevich K.D., Subach F.D., Verkhusha V.V. (2013) Engineering of bacterial phytochromes for near-infrared imaging,
sensing, and light-control in mammals. Chem. Soc. Rev.42, 3441
Plugge B., Gazzarrini S., Nelson M., Cerana R., Van Etten J.L., Derst C. DiFrancesco D., Moroni A. Thiel G. (2000) A
Potassium Channel Protein Encoded by Chlorella Virus PBCV-1. Science 287: 1641-44
Pusch M., Neher E. (1988) Rates of diffusional exchange between small cells and a measuring patch pipette. Pflugers
Arch. 411(2): 204-11.
Rockwell N.C. and Lagarias J.C. (2010) A Brief History of Phytochromes. ChemPhysChem, 11: 1172 – 1180.
86
Römling U., Galperin M.Y., Gomelsky M. (2013) Cyclic di-GMP: the First 25 Years of a Universal Bacterial Second
Messenger. Microbiol Mol Biol Rev. 77(1): 1–52.
Römling U., Galperin M.Y. (2017) Discovery of the second messenger cyclic di-GMP. Methods Mol Biol. 1657: 1-8.
Ross P., Weinhouse H., Aloni Y., Michaeli D., Weinberger-Ohana P., Mayer R., Braun S., de Vroom E., van der Marel
G.A., van Boom J.H., Benziman M. (1987) Regulation of cellulose synthesis in Acetobacter xylinum by cyclic diguanylic
acid. Nature 325(6101): 279-81.
Rost B.R., Schneider-Warme F., Schmitz D., Hegemann P. (2017) Optogenetic Tools for Subcellular Applications in
Neuroscience. Neuron, 96(3): 572-603.
Ryu M.H. and Gomelsky M. (2014) Near-infrared Light Responsive Synthetic c‑di-GMP Module for Optogenetic
Applications. ACS Synth. Biol., 3: 802−810.
Ryu M.H., Fomicheva A., Moskvin O.V., Gomelsky, M. (2017) Optogenetic Module for Dichromatic Control of c-di-
GMP Signaling. Journal of Bacteriology, 199 (18).
Santoro B., Grant S.G.N., Bartsch D., Kandel E.R. (1997) Interactive cloning with the SH3 domain of N-src identifies a
new brain specific ion channel protein, with homology to Eag and cyclic nucleotide-gated channels. PNAS, 94 (26):
14815-14820.
Santoro B., Liu D.T., Yao H., Bartsch D., Kandel E.R., Siegelbaum S.A., Tibbs G.R. (1998) Identification of a gene
encoding a hyperpolarization-activated pacemaker channel of brain. Cell, 93(5): 717-29.
Santoro B. and Tibbs G. (1999) The HCN Gene Family: molecular basis of the hyperpolarization-activated pacemaker
channels. Ann N Y Acad Sci., 868:741-64.
Saponaro A., Pauleta S.R., Cantini F., Matzapetakis M., Hammann C., Donadoni D., Hu L., Thiel G., Banci L., Santoro
B., Moroni A. (2014) Structural basis for the mutual antagonism of cAMP and TRIP8b in regulating HCN channel
function. Proc Natl Acad Sci U S A, 111(40):14577-82.
Saponaro A., Cantini F., Porro A., Bucchi A., DiFrancesco D., Maione V., Donadoni C., Introini B., Mesirca P., Mangoni
M.E., Thiel G., Banci L., Santoro B., Moroni A. (2018) A synthetic peptide that prevents cAMP regulation in
mammalian hyperpolarization-activated cyclic nucleotide-gated (HCN) channels. eLife 2018;7:e35753
Scicchitano P., Carbonara S., Ricci G., Mandurino C., Locorotondo M., Bulzis G., Gesualdo M., Zito A., Carbonara R.,
Dentamaro I., Riccioni G., Ciccone M.M. (2012) HCN Channels and Heart Rate. Molecules, 17(4): 4225-35.
Shao J., Xue S., Yu G., Yu Y., Yang X., Bai Y., Zhu S., Yang L., Yin J., Wang Y., Liao S., Guo S., Xie M., Fussenegger M.,
Ye H. (2017). Smartphone-controlled optogenetically engineered cells enable semiautomatic glucose homeostasis in
diabetic mice. Science Translational Medicine, 9 (387), eaal2298.
Shi W., Wymore R.,Yu H., Wu J., Wymore R.T., Pan Z., Robinson R.B., Dixon J.E., McKinnon D., Cohen I.S. (1999).
Distribution and prevalence of hyperpolarization-activated cation channel (HCN) mRNA expression in cardiac tissues.
Circ Res., 85(1): 1-6.
Sineshchekov O.A., Jung K.H., Spudich J.L. (2002) Two rhodopsins mediate phototaxis to low- and high-intensity light
in Chlamydomonas reinhardtii. Proc Natl Acad Sci U S A., 99(13): 8689-94.
Strickland D., Moffat K., Sosnick T.R. (2008) Light-activated DNA binding in a designed allosteric protein. PNAS, vol.
105, n 31: 10709–10714.
87
Takala H., Björling A., Berntsson O., Lehtivuori H., Niebling S.,Hoernke M., Kosheleva I., Henning R., Menzel
A., Ihalainen J.A., Westenhoff S. (2014) Signal amplification and transduction in phytochrome photosensors. Nature,
509(7499): 245-248.
Vaccari T., Moroni A., Rocchi M., Gorza L., Bianchi M.E., Beltrame M., DiFrancesco D. (1999) The human gene coding
for HCN2, a pacemaker channel of the heart. Biochim Biophys Acta 1446: 419–425.
Vemana S., Pandey S., Larsson H.P. (2004) S4 movement in a mammalian HCN channel. J Gen Physiol., 123(1): 21-32.
Voos P., Fuck S., Weipert F., Babel L., Tandl D., Meckel T., Hehlgans S., Fournier C., Moroni A., Rödel F., Thiel G.
(2018) Ionizing Radiation Induces Morphological Changes and Immunological Modulation of Jurkat Cells. Front
Immunol.,9: 922.
Wang Y., Wang F., Wang R., Zhao P., Xia Q. (2015). 2A self-cleaving peptide-based multi-gene expression system in
the silkworm Bombyx mori. Scientific Reports, 5 (1): 16273
Wagner J.R., Brunzelle J.S., Forest K.T., Vierstra R.D. (2005) A light-sensing knot revealed by the structure of the
chromophore-binding domain of phytochrome. Nature, 438(7066): 325-31.
Zagotta W.N., Olivier N.B., Black K.D., Young E.C., Olson R., Gouaux e. (2003) Structural basis for modulation and
agonist specificity of HCN pacemaker channels. Nature, vol 425: 200-205
Zemelman B.V., Lee G. A. and Miesenbock G. (2002) Selective Photostimulation of Genetically ChARGed Neurons.
Neuron, Vol. 33: 15–22.
Zhang F., Wang L.P., Brauner M., Liewald J.F., Kay K., Watzke N., Wood P.G., Bamberg E., Nagel G., Gottschalk
A., Deisseroth K. (2007) Multimodal fast optical interrogation of neural circuitry. Nature 5 ;446 (7136): 633-639.
Zhou Y., Morais-Cabral J.H., Kaufman A., MacKinnon R. (2001). Chemistry of ion coordination and hydration revealed
by a K+ channel–Fab complex at 2.0 Å resolution. Nature, 414: 43–48.