strategies for reducing risk with alessio rastani leadingtrader.com the science of using a stop-loss
TRANSCRIPT

Strategies For Reducing Riskwith Alessio Rastani
leadingtrader.com
The Science of Using A Stop-Loss

This presentation is neither a solicitation nor an offer to Buy/Sell stocks, futures or options.
No representation is being made that any account will or is likely to achieve profits or losses
similar to those discussed on this webinar. The past performance of any trading system
or methodology is not necessarily indicative of future results.
Strategies For Reducing Riskwith Alessio Rastani
leadingtrader.com
The Science of Using A Stop-Loss
leadingtrader.com
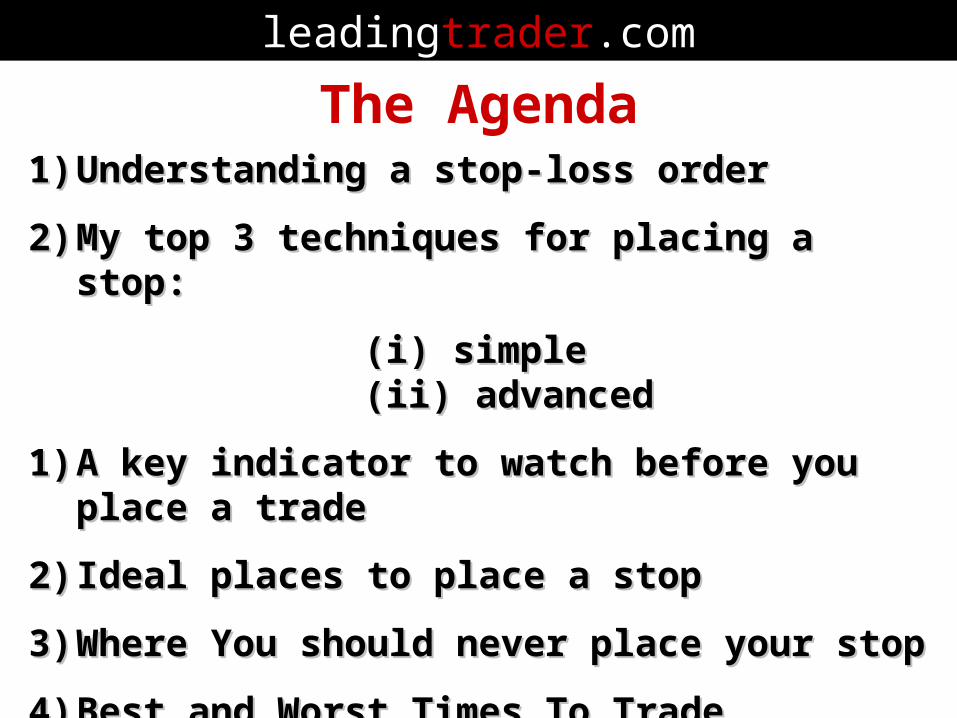
1)1) Understanding a stop-loss orderUnderstanding a stop-loss order
2)2) My top 3 techniques for placing a stop: My top 3 techniques for placing a stop:
(i) simple(i) simple(ii) advanced(ii) advanced
1)1) A key indicator to watch before you place a A key indicator to watch before you place a tradetrade
2)2) Ideal places to place a stopIdeal places to place a stop
3)3) Where You should never place your stopWhere You should never place your stop
4)4) Best and Worst Times To TradeBest and Worst Times To Trade
The Agenda

“You Can Never Go Broke Taking A Profit…” ~ Wall Street Saying


leadingtrader.com

How Most People TradeHow Most People TradeBUYBUY
PricePrice
SELLSELL
leadingtrader.com
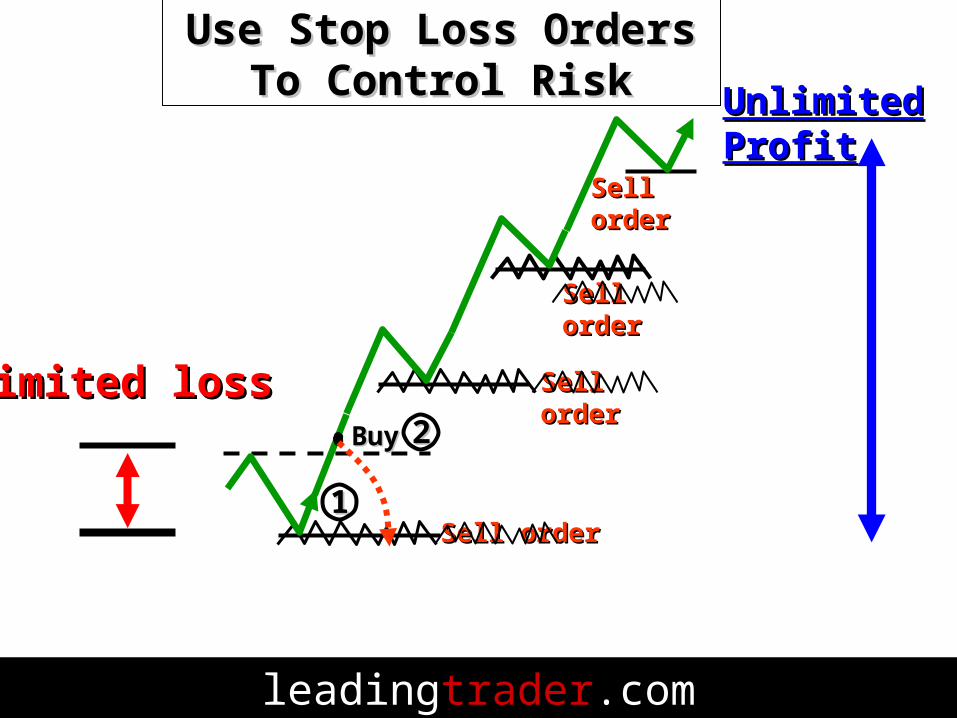
11Sell orderSell order
BuyBuy 22
Sell orderSell order
Sell orderSell order
Sell orderSell order
UnlimitedUnlimitedProfitProfit
Limited lossLimited loss
Use Stop Loss OrdersUse Stop Loss OrdersTo Control RiskTo Control Risk
leadingtrader.com

You can be wrong and still make money
• Win 9 times, and lose once• Win $100 x 9 = $900• Lose $1000 • Net: - $100
How Most People Trade (wrong way)How Most People Trade (wrong way)
leadingtrader.com
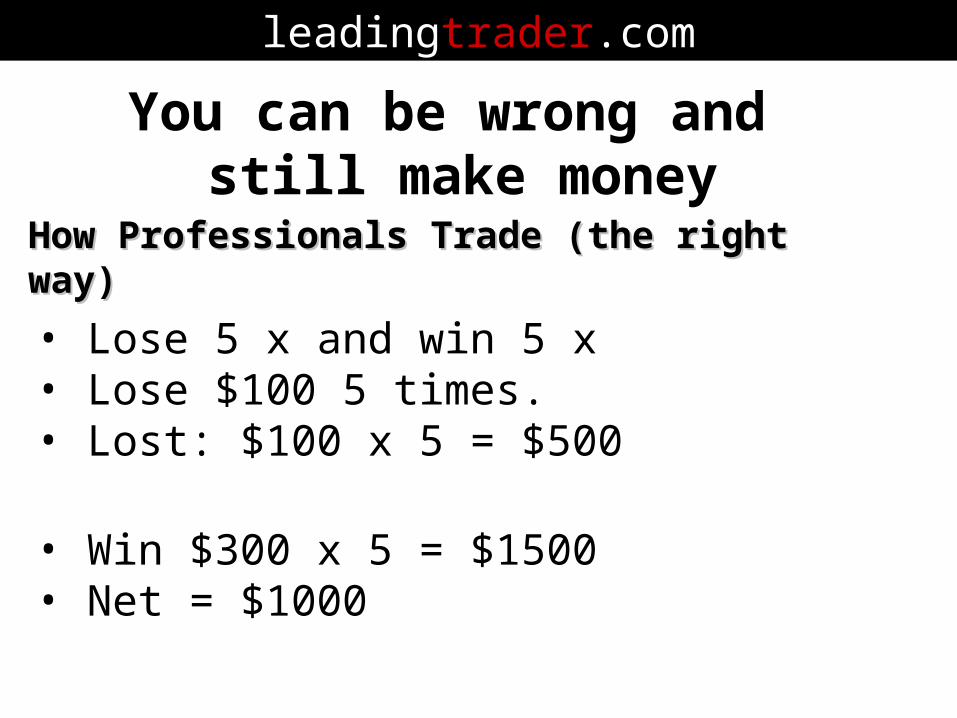
You can be wrong and still make money
• Lose 5 x and win 5 x• Lose $100 5 times.• Lost: $100 x 5 = $500
• Win $300 x 5 = $1500• Net = $1000
How Professionals Trade (the right way)How Professionals Trade (the right way)
leadingtrader.com

leadingtrader.com
1)1) An order placed with a broker to exit the market An order placed with a broker to exit the market (either to sell if you originally bought, or to buy (either to sell if you originally bought, or to buy back if you originally went short).back if you originally went short).
2)2) It is designed to LIMIT your LOSS and exposure It is designed to LIMIT your LOSS and exposure to RISK.to RISK.
3)3) It is not a choice. It is a MUST if you wish to It is not a choice. It is a MUST if you wish to protect your capital.protect your capital.
What is a Stop-Loss?

leadingtrader.com"Rule No.1 is never lose money. Rule No.2 is never forget rule number one.” Warren Buffett
PROTECT YOUR CAPITAL!

leadingtrader.com
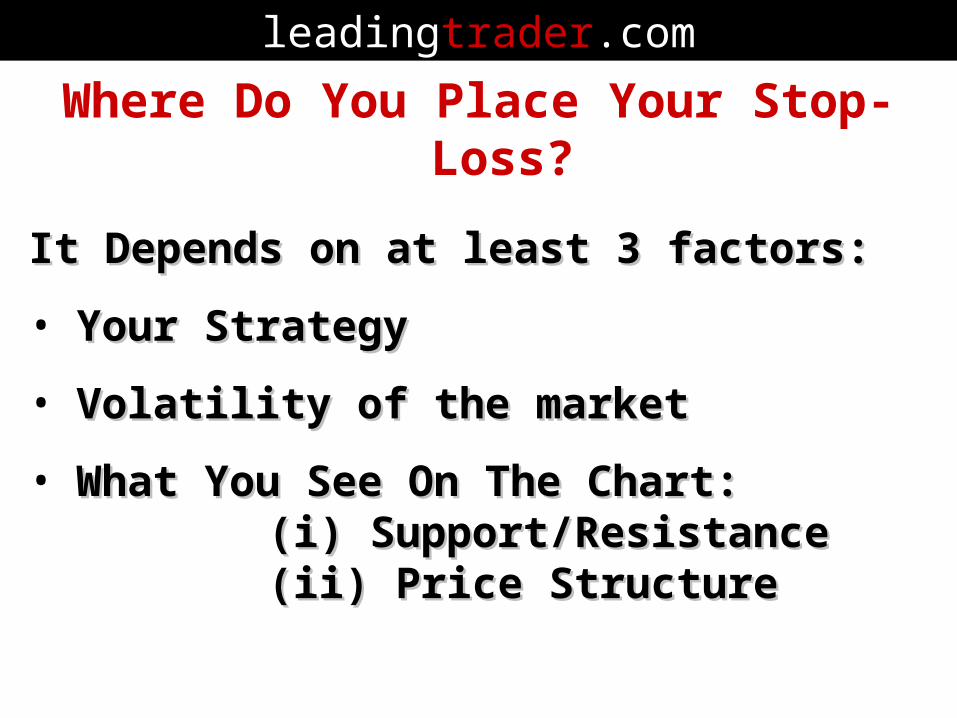
Where Do You Place Your Stop-loss?
leadingtrader.com
It Depends on at least 3 factors:It Depends on at least 3 factors:
• Your StrategyYour Strategy
• Volatility of the marketVolatility of the market
• What You See On The Chart: What You See On The Chart: (i) Support/Resistance(i) Support/Resistance(ii) Price Structure(ii) Price Structure
Where Do You Place Your Stop-Loss?

leadingtrader.com
IMPORTANT: Your stop-loss should be placed based on
the LOGICAL dynamics of the market!
leadingtrader.com
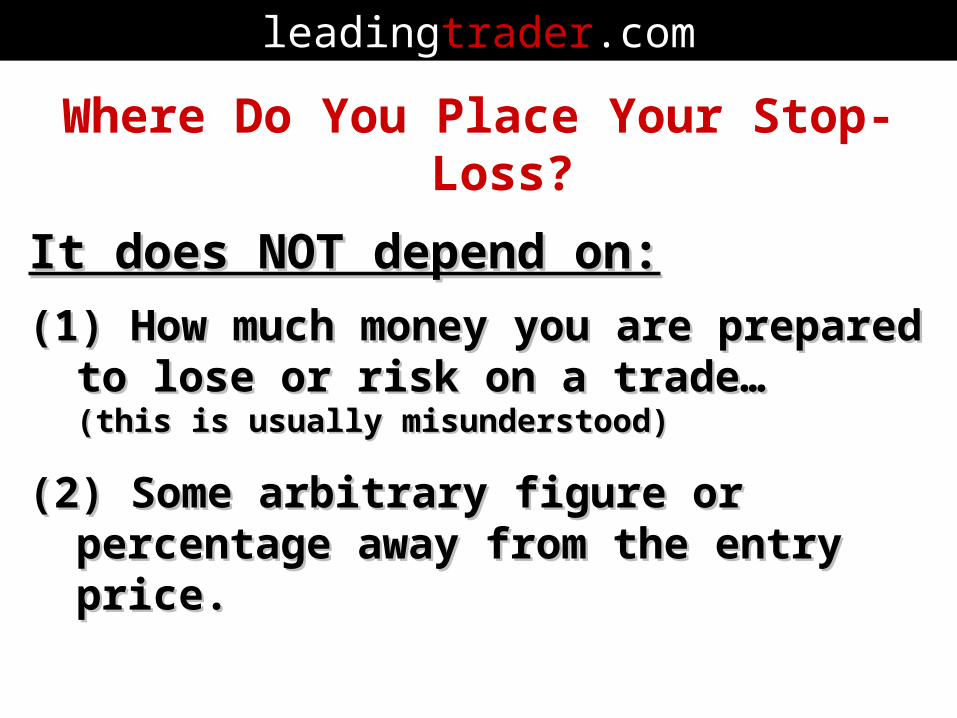
It does NOT depend on:It does NOT depend on:
(1)(1) How much money you are prepared to How much money you are prepared to lose or risk on a trade… lose or risk on a trade… (this is usually misunderstood)(this is usually misunderstood)
(2)(2) Some arbitrary figure or percentage Some arbitrary figure or percentage away from the entry price.away from the entry price.
Where Do You Place Your Stop-Loss?

leadingtrader.com
Wide Stops or Tight Stops?

leadingtrader.com
Very Tight Stops: too close to price(NOT RECOMMENDED) entry
Stop-loss

leadingtrader.com
Very Wide Stops:unnecessarily too far from the entryprice(NOT RECOMMENDED)
Stop-loss

leadingtrader.com
Wide Stop: A safe distance awayfrom the price
Stop-loss
entry

leadingtrader.com
Tip No.1 : Use wider stops and give it plenty of “wiggle room” (higher odds of success)

leadingtrader.com
Tip No. 2: Reduce your position size (e.g. trade FEWER contracts/shares or £/per
point) when using wide stops
leadingtrader.com
Logical Techniques For Placing A Stop-Loss
leadingtrader.com
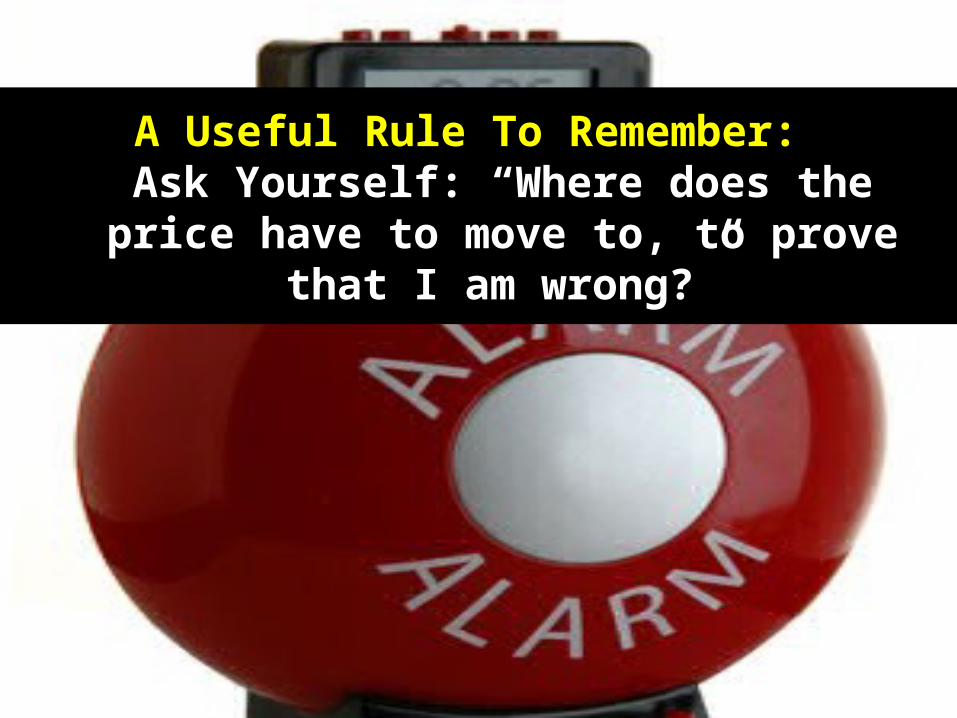
A Useful Rule To Remember: Ask Yourself: “Where does the price have
to move to, to prove that I am wrong?”

leadingtrader.com
BAD NEWS:The more “smart” you think you are, the
more money you will lose…(“smart” people don’t like to be wrong)

GOOD NEWS:The more honest you are to yourself, the
better a trader you will be…

leadingtrader.com
Logical Techniques For Placing A Stop-Loss

leadingtrader.com
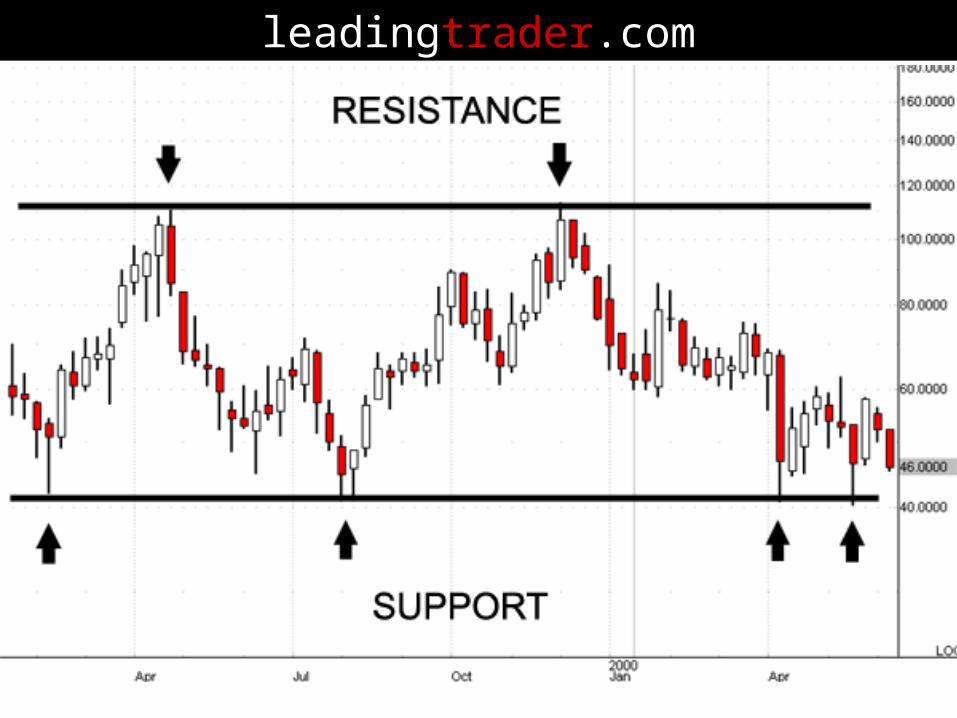
Strategy No.1:Price Structure: Support & Resistance

leadingtrader.com
Price Structure: Support & Resistance
Most common and basic place for stop-Most common and basic place for stop-loss:loss:
• Previous highs and lowsPrevious highs and lows
• Beneath support or above resistanceBeneath support or above resistance
leadingtrader.com
leadingtrader.com

leadingtrader.com
leadingtrader.com

leadingtrader.com
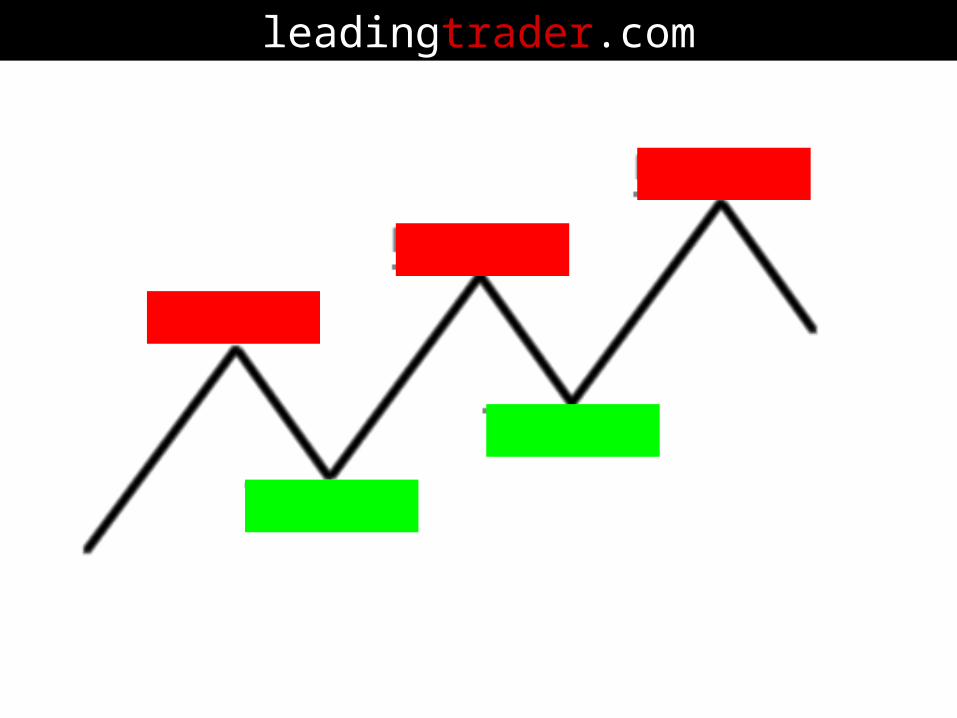
Stop-loss at recent previous lows(support)
Buy Entry at Breakout(from resistance)
Stop-loss at recent previous highs(resistance)
Short Entry at Breakout(from support)
leadingtrader.com
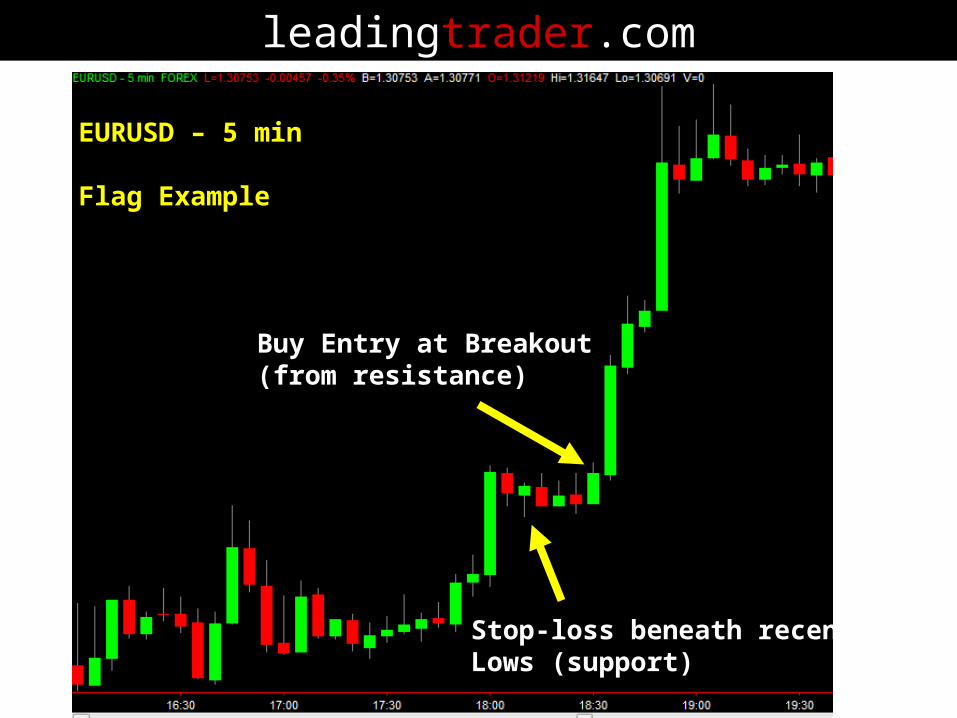
EURUSD – 5 min
Flag Example
Buy Entry at Breakout(from resistance)
Stop-loss beneath recentLows (support)

leadingtrader.com
Flag Example
Stop-loss beneath recentLows (support)
Buy Entry at Breakout(from resistance)

Strategy No.2:Volatility-based stops
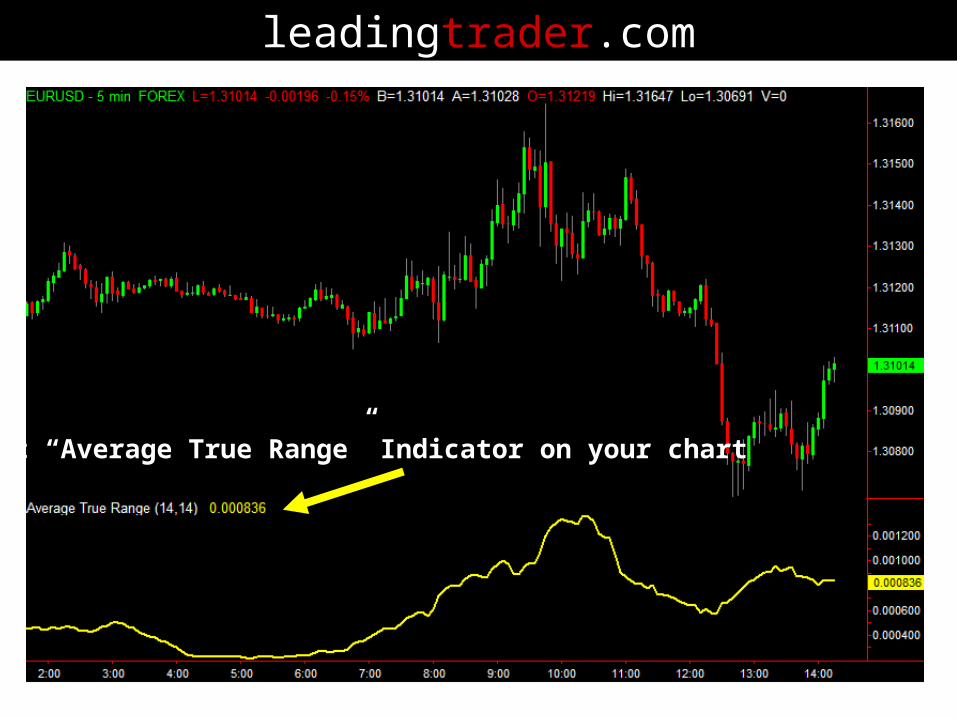
leadingtrader.com
Plot “Average True Range” Indicator on your chart
leadingtrader.com
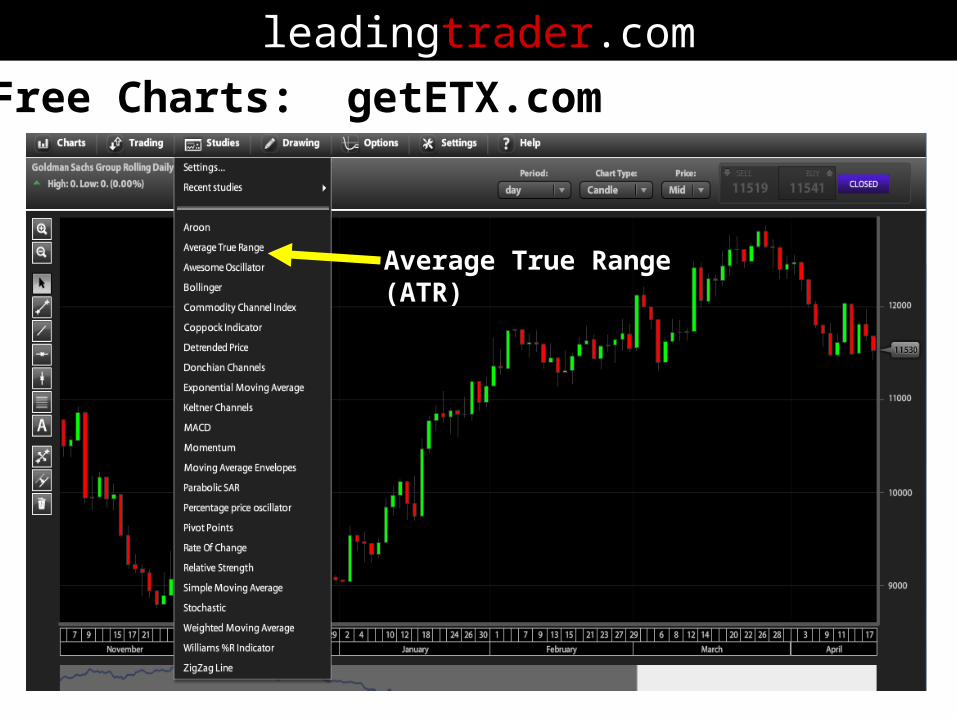
Average True Range(ATR)
Free Charts: getETX.com
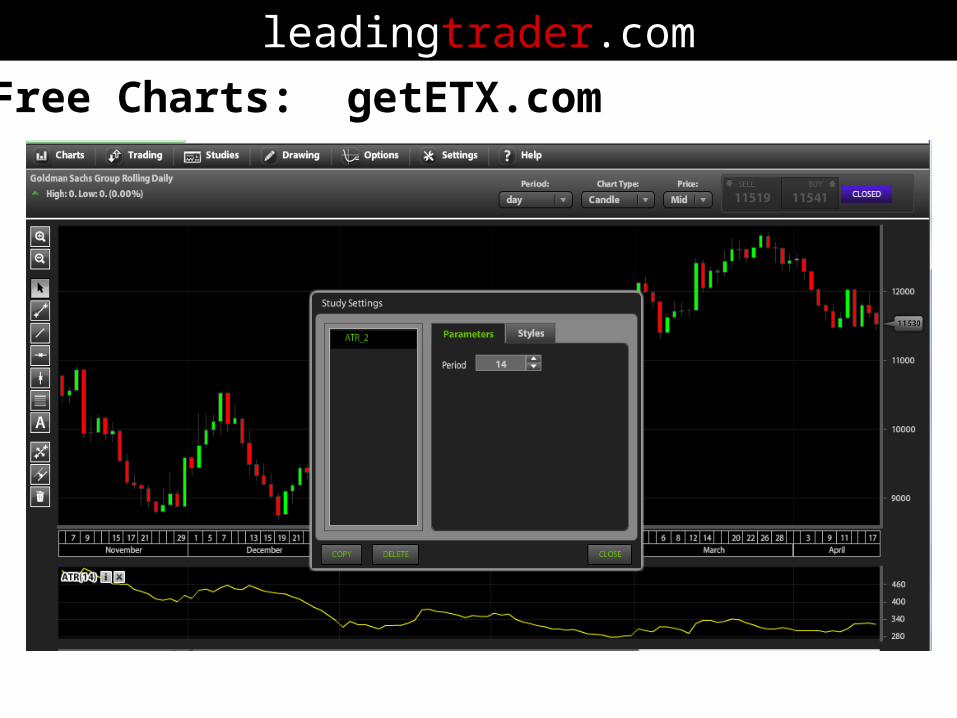
leadingtrader.com
Free Charts: getETX.com
leadingtrader.com
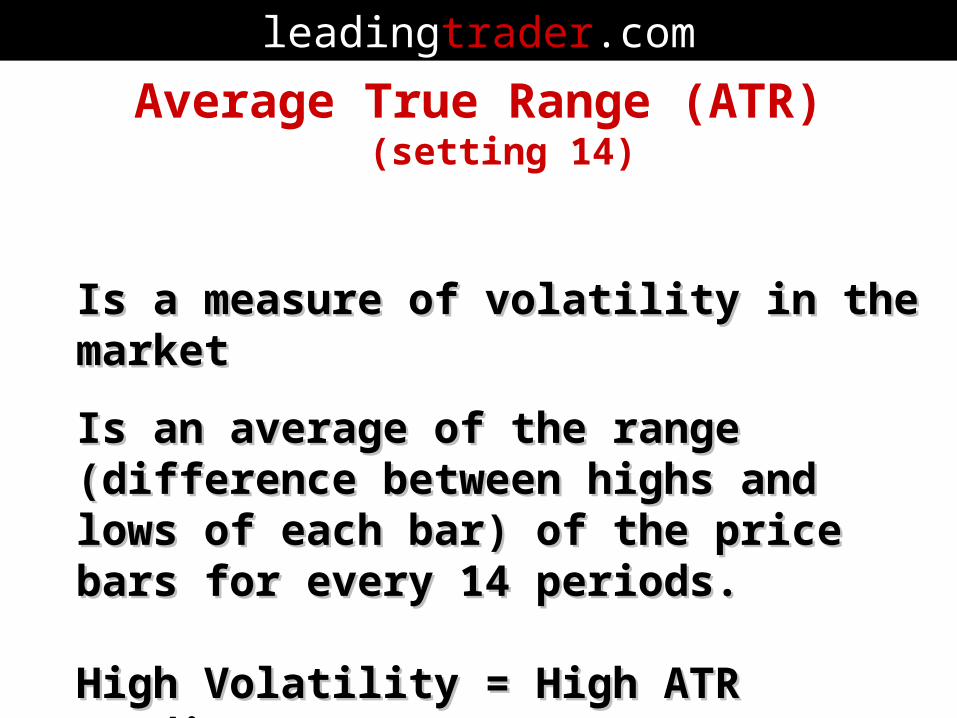
Average True Range (ATR)(setting 14)
Is a measure of volatility in the marketIs a measure of volatility in the market
Is an average of the range (difference Is an average of the range (difference between highs and lows of each bar) of between highs and lows of each bar) of the price bars for every 14 periods.the price bars for every 14 periods.
High Volatility = High ATR readingsHigh Volatility = High ATR readingsLow Volatility = Low ATR readingsLow Volatility = Low ATR readings

leadingtrader.com
Average True Range
Average True Rangeis 130 Dow points
Dow Jones 30 - Daily
leadingtrader.com
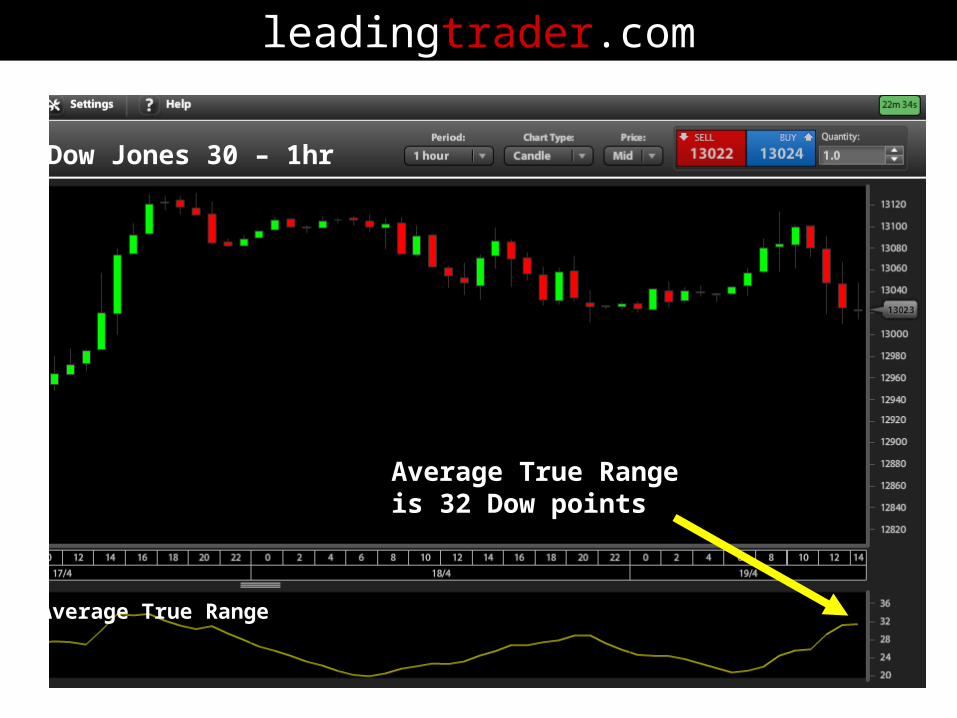
Average True Range
Dow Jones 30 – 1hr
Average True Rangeis 32 Dow points

leadingtrader.com
Average True Range
Dow Jones 30 – 5 min
What is ATR?

leadingtrader.com
Average True Range (ATR)(setting 14)
Rule For Stop-Loss Placement: 2 x ATRRule For Stop-Loss Placement: 2 x ATR
For example: For example: if ATR is equal to 10 points (or 10 if ATR is equal to 10 points (or 10 pips/cents) then use a stop-loss 20 points pips/cents) then use a stop-loss 20 points (or 20 pips/cents) away from your entry.(or 20 pips/cents) away from your entry.
Why? Because (ATR x 2) = (10 x 2) = 20Why? Because (ATR x 2) = (10 x 2) = 20

leadingtrader.com
Average True Range
Dow Jones 30 – 5 min chart
What is the stop-losssize based on ATR?

leadingtrader.com
Average True Range
Dow Jones 30 – 5 min chart
ATR x 2 means13 x 2 = 26 point stop-loss
leadingtrader.com
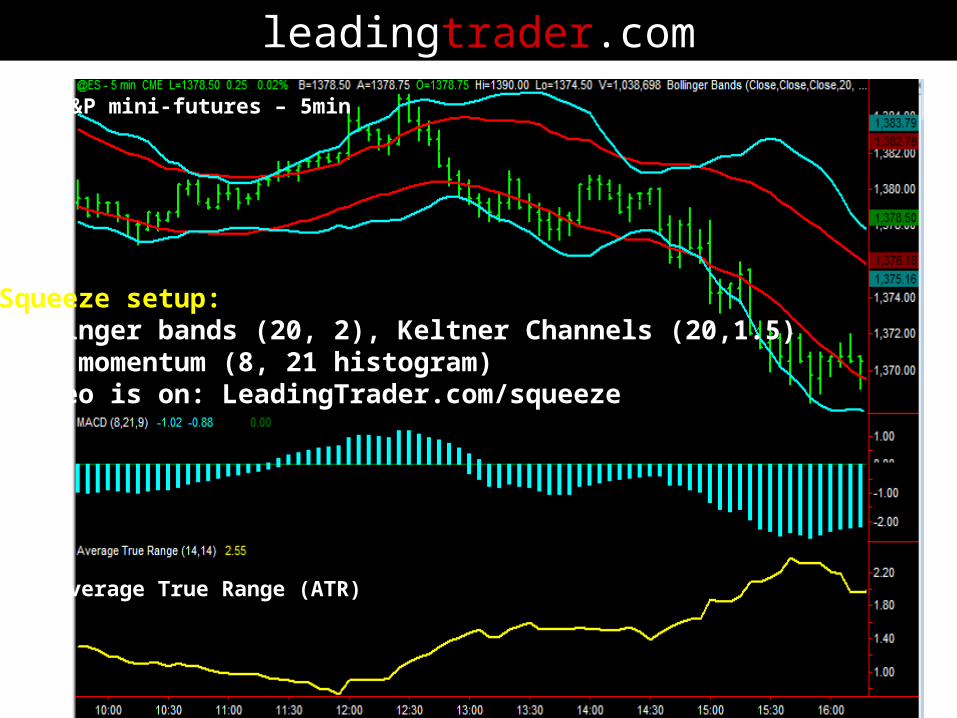
Squeeze setup:Bollinger bands (20, 2), Keltner Channels (20,1.5)MACD momentum (8, 21 histogram)(video is on: LeadingTrader.com/squeeze
Average True Range (ATR)
S&P mini-futures – 5min
leadingtrader.com
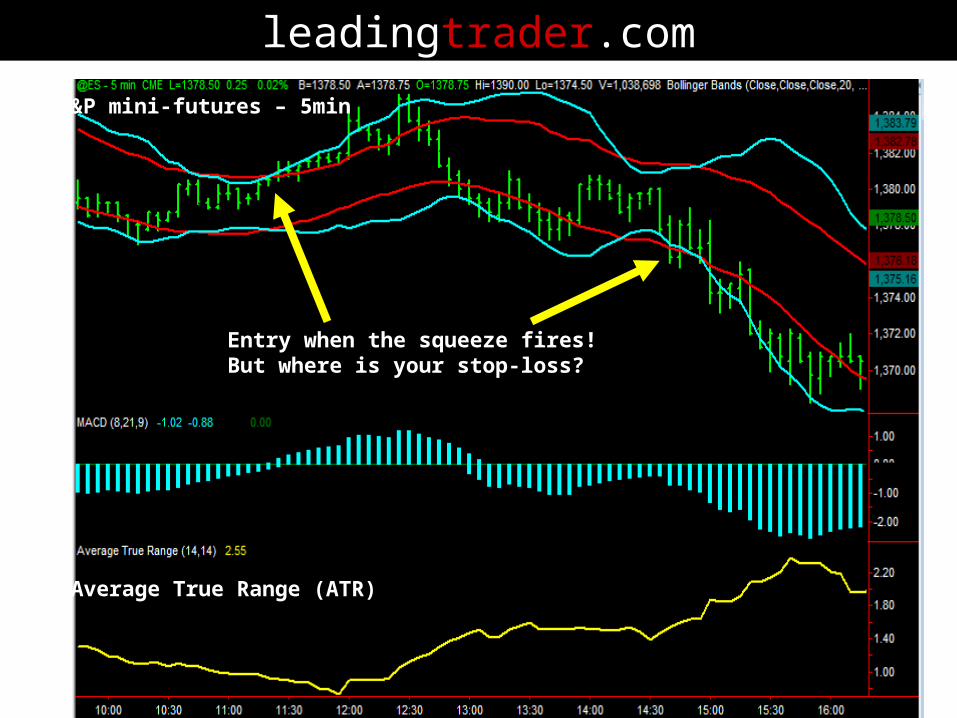
Average True Range (ATR)
S&P mini-futures – 5min
Entry when the squeeze fires!But where is your stop-loss?

leadingtrader.com
S&P mini-futures – 5min
For stops – you can use either:PRICE STRUCTURE (previous highs/lows)
OR use 2 X ATR
2 x ATR = 2 x 1.6 = 3.2 pt stop distance
2 x ATR = 2 x 1.0 = 2 pt. stop distance

leadingtrader.com
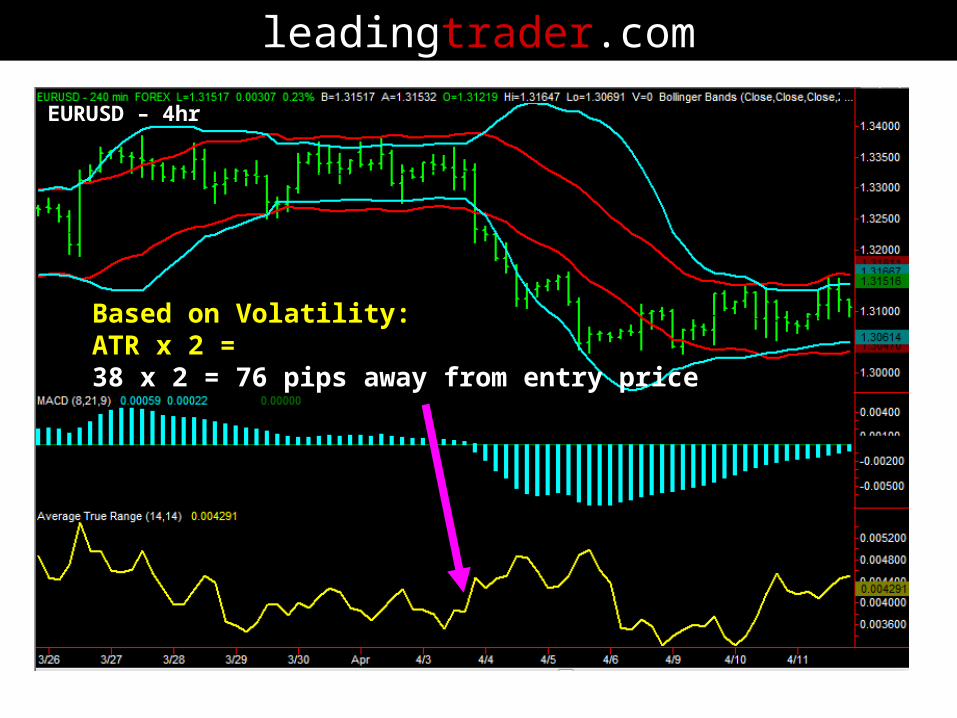
EURUSD – 4hr
Short Squeeze fires!Where is your stop?
leadingtrader.com
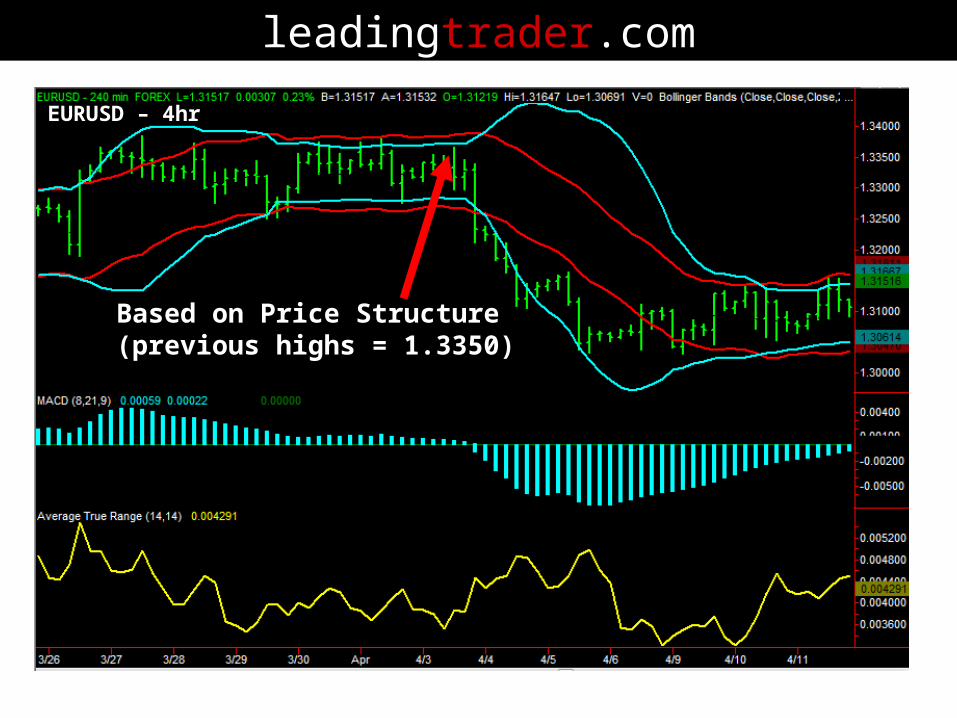
EURUSD – 4hr
Based on Price Structure(previous highs = 1.3350)
leadingtrader.com
EURUSD – 4hr
Based on Volatility:ATR x 2 = 38 x 2 = 76 pips away from entry price

leadingtrader.com
Risk Free trade: Once in profit, Don’t forget to move your stop to breakeven!
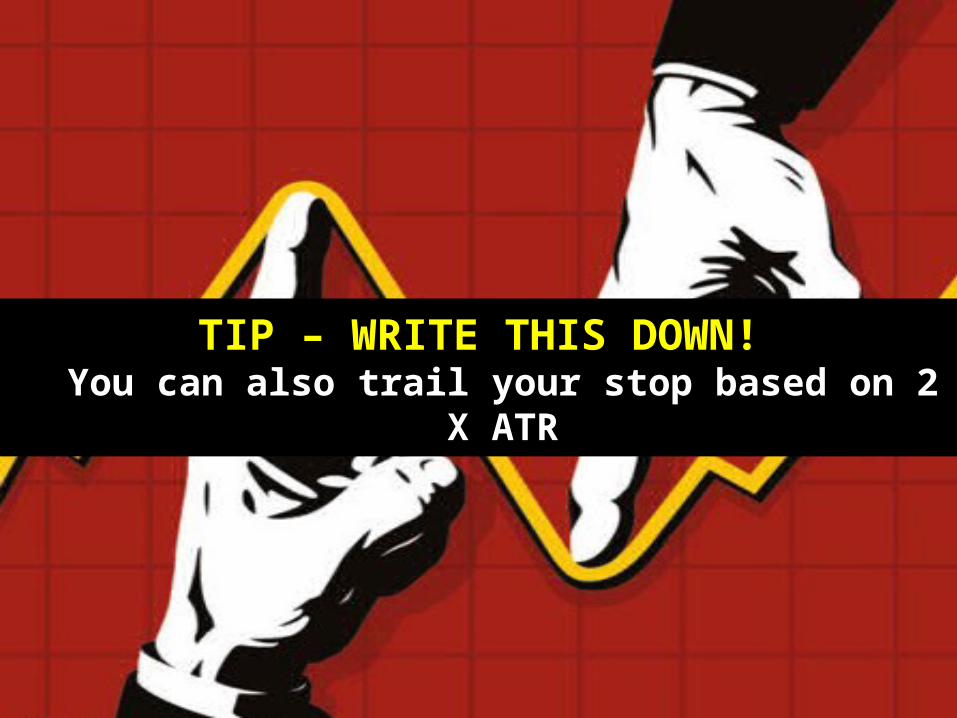
TIP – WRITE THIS DOWN!You can also trail your stop based on 2 X ATR

leadingtrader.com
You can trail your stop based on 2 X ATR
As the market moves in your favour,Trail your stop based on 2 x ATR

leadingtrader.com
Keltner Pullack Setup (K.P.)
leadingtrader.com
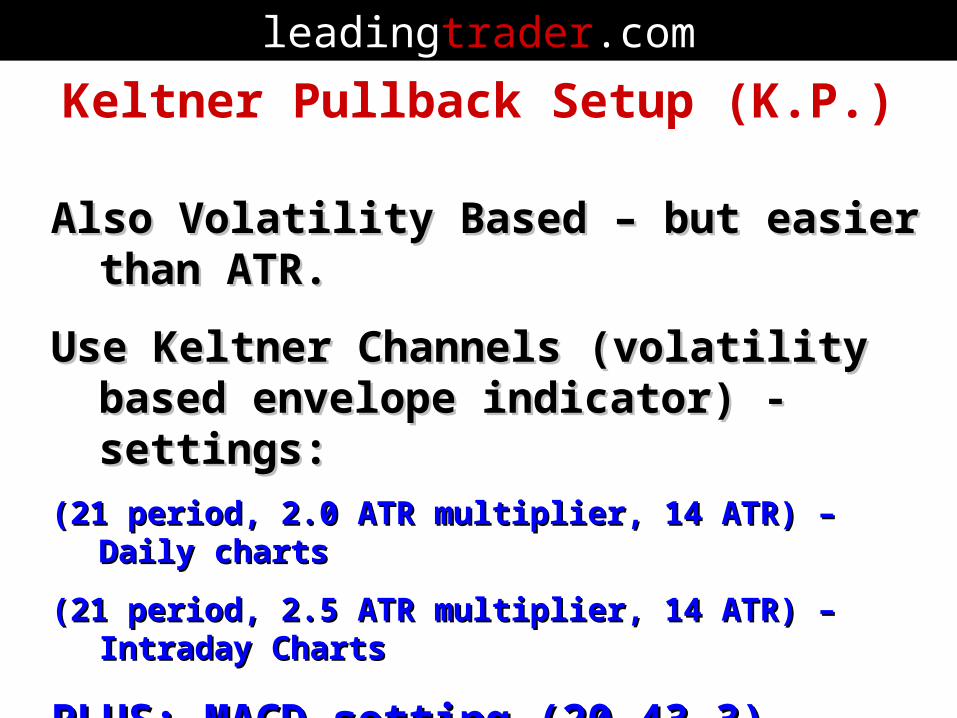
Keltner Pullback Setup (K.P.)
Also Volatility Based – but easier than ATR.Also Volatility Based – but easier than ATR.
Use Keltner Channels (volatility based Use Keltner Channels (volatility based envelope indicator) - settings:envelope indicator) - settings:
(21 period, 2.0 ATR multiplier, 14 ATR) – Daily charts(21 period, 2.0 ATR multiplier, 14 ATR) – Daily charts
(21 period, 2.5 ATR multiplier, 14 ATR) – Intraday Charts(21 period, 2.5 ATR multiplier, 14 ATR) – Intraday Charts
PLUS: MACD setting (20,43,3) PLUS: MACD setting (20,43,3)
(NOTE: On getETX.com charts, instead of MACD you can (NOTE: On getETX.com charts, instead of MACD you can use the use the “Awesome Oscillator” setting: 21,89“Awesome Oscillator” setting: 21,89))

leadingtrader.com
Keltner Channel settings:(21, 2.0) for Daily charts or (21, 2.5) for intraday
getETX.com

leadingtrader.com
As the market moves in your favour,Trail your stop based on 2 x ATR
Daily Chart settings

leadingtrader.com
Intraday Chart settings
leadingtrader.com
As the market moves in your favour,Trail your stop based on 2 x ATR
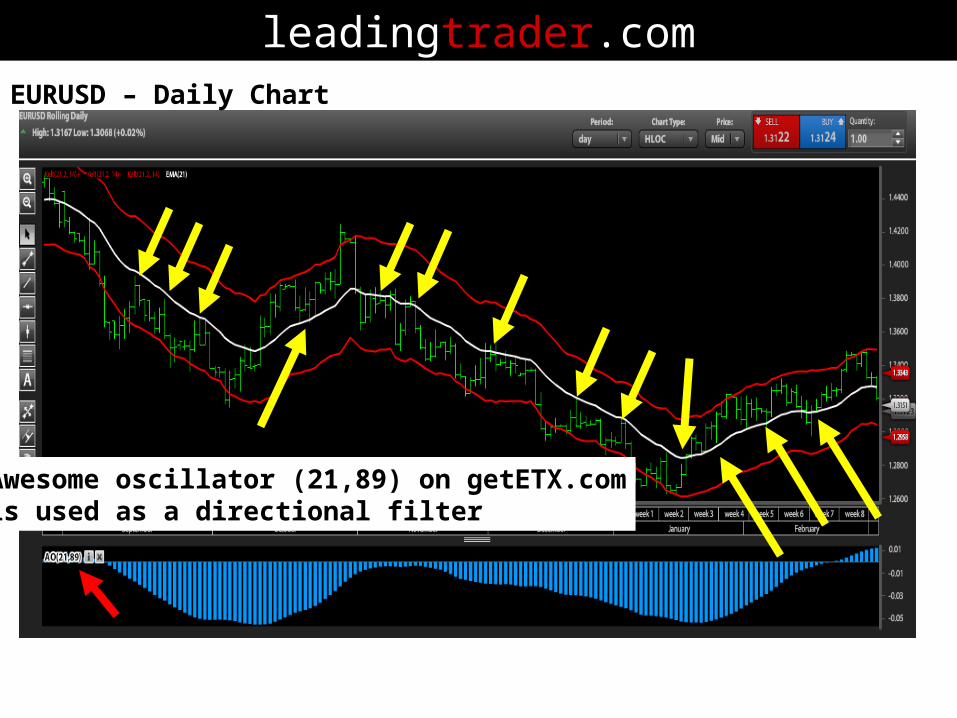
EURUSD – Daily Chart
Awesome oscillator (21,89) on getETX.comis used as a directional filter

leadingtrader.com
As the market moves in your favour,Trail your stop based on 2 x ATR
EURUSD – Daily Chart
Awesome oscillator (21,89) on getETX.comis used as a directional filter
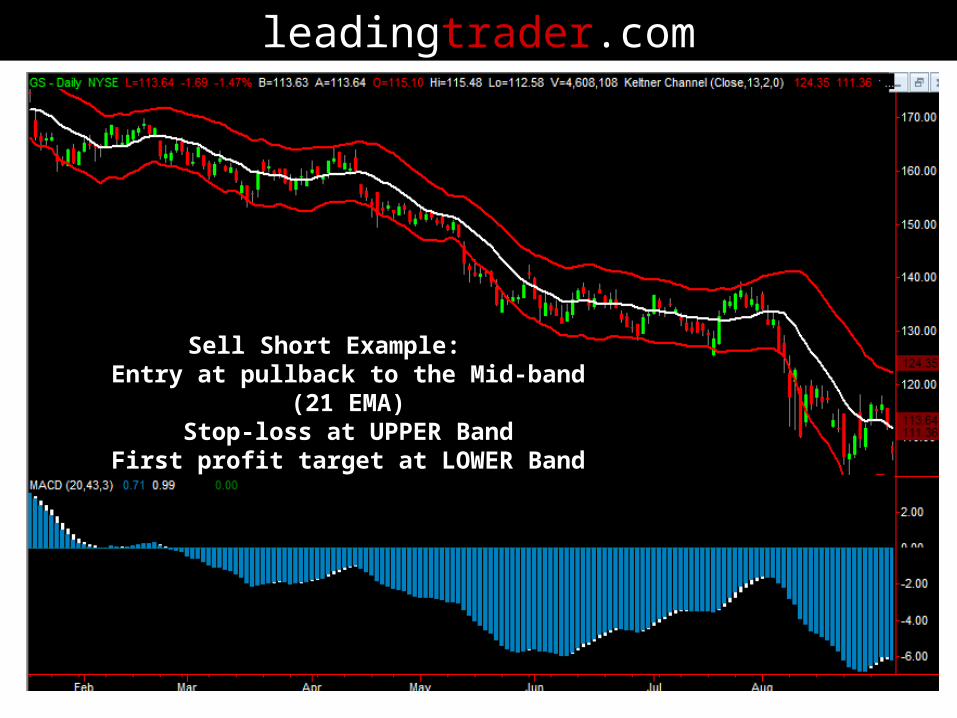
Sell Short Example:Entry at pullback to the Mid-band (21
EMA) (blue arrow)Stop-loss at UPPER Band (red arrow)
First profit target at LOWER Band (magenta arrow)

leadingtrader.com
As the market moves in your favour,Trail your stop based on 2 x ATR
LONG (Buy) Example:Entry at pullback to the Mid-band (21 EMA)
Stop-loss at LOWER BandFirst profit target at UPPER Band
LONG (Buy) Example:Entry at pullback to the Mid-band (21 EMA)
Stop-loss at LOWER BandFirst profit target at UPPER Band
leadingtrader.com
As the market moves in your favour,Trail your stop based on 2 x ATR
Sell Short Example:Entry at pullback to the Mid-band (21 EMA)
Stop-loss at UPPER BandFirst profit target at LOWER Band

leadingtrader.com
Where you should never place your stop
Too close to entry priceToo close to entry price
Ignoring the volatility (ATR) of the marketIgnoring the volatility (ATR) of the market
Close to an obvious point of support and Close to an obvious point of support and resistance (place the stop slightly beyond this resistance (place the stop slightly beyond this area)area)

leadingtrader.com
Best and Worst Times To Trade
Best Times: Best Times: Tuesday – Thursday 10am ET – 11:30am ET and Tuesday – Thursday 10am ET – 11:30am ET and then at 3pm ET – 4pm ET (last hour)then at 3pm ET – 4pm ET (last hour)
Worst Times:Worst Times:Too close to news announcementsToo close to news announcementsLunchtime Doldrums 11:30am – 2pm ETLunchtime Doldrums 11:30am – 2pm ETTypically the first half hour of market openTypically the first half hour of market openChoppy MarketsChoppy Markets

leadingtrader.com
Recommended Charts & Trading Platform:
All Countries (except USA):getETX.com (FREE)
USA:Tradestation - contact: Tony OrtizLeadingTrader.com/charting
France, Germany or Italy (FREE):LeadingTrader.com/charting

leadingtrader.com
THANK YOU very muchfor attending this webinar!
Next FREE Webinar: 2-Day Live Trading Webinar
with Alessio Rastani and Kevin BurtonThursday 3rd May and Friday 4th May