strategies for the enhancement of low- · pdf filefeed oscillations on methane conversion over...
TRANSCRIPT
POLITECNICO DI MILANO Dipartimento di Chimica, Materiali e Ingegneria Chimica
“Giulio Natta” Dottorato di ricerca in Chimica industriale e Ingegneria Chimica
Doctoral Thesis DJAMELA BOUNECHADA
(738602)
STRATEGIES FOR THE ENHANCEMENT OF LOW-
TEMPERATURE CATALYTIC OXIDATION OF METHANE EMISSIONS
Coordinator: prof. Tiziano Faravelli Tutor: prof. Pio Forzatti Advisor: prof. Gianpiero Groppi
XXIV cycle 2009 - 2011


Acknowledgments
Part of this work has been performed within the InGAS project (Proj. no. 218447),
financially supported by the European Commission, FP7 Programme, which is gratefully
acknowledged.
I would like to thank Prof. Pio Forzatti, head of the Laboratory of Catalysis and Catalytic
Processes (LCCP) at Politecnico di Milano, for giving me the opportunity to work in the field of
catalysis.
My warmest and deepest gratitude is expressed for my advisor, Prof. Gianpiero Groppi,
and his scientific guidance. Without your support this thesis might not have existed.
I owe my sincere thanks to Magnus and Per-Anders for their guidance during the six
months I spent at Chalmers University of Technology and for the nice time we spent together at the
ESRF in Grenoble. Your constant encouragement and constructive criticisms have been essential in
my writing.
I am also grateful to all my co-authors for the good collaboration.
Finally, a special thanks to my colleagues in Milan for sharing with me thousands of
coffees and to all KCK staff for making me feel at home.


List of publications
1. D. Bounechada, G. Groppi, P. Forzatti, K. Kallinen and T. Kinnunen, Effect of periodic
lean/rich switch on methane conversion over a Ce-Zr promoted Pd-Rh/Al2O3 catalyst in the exhausts of natural gas vehicles, accepted for publication in Appl. Catal. B: Environ.
2. D. Bounechada, P.-A. Carlsson, L. Kylhammar, S. Fouladvand, T. Pingel, E. Olsson and M. Skoglundh, Role of support and metal-support interaction on sulfur-promoted low-temperature oxidation of methane over Pt-based catalysts, submitted to J. Catal.
3. D. Bounechada, P.-A. Carlsson, L. Kylhammar, S. Fouladvand, T. Pingel, E. Olsson and M. Skoglundh, Role of support on NOx-assisted low-temperature oxidation of methane over Pt-based catalysts, in preparation.
Related publications not included in this thesis:
I. I. Nova, D. Bounechada, R. Maestri, E. Tronconi, A.K. Heibel, T.A. Collins and T. Boger, Influence of the substrate properties on the performances of NH3-SCR monolithic catalysts for the aftertreatment of diesel exhaust: an experimental and modeling Study, Ind. Eng. Chem. Res. Vol. 50 (2011) pp.299-309.
II. D. Bounechada, G. Groppi and K. Kallinen, Improved performance of a Pd/Rh based TWC under oscillating exhaust composition, Book of Abstracts of XVI GIC, September 19th – 23rd 2010, Mondello (Palermo), Italy (Oral presentation).
III. D. Bounechada, G. Groppi, P. Forzatti, K. Kallinen and T. Kinnunen, Effect of lean/rich feed oscillations on methane conversion over a Pd/Rh TWC, Book of Abstracts of EuropaCat X Congress, August 28th - September 2nd 2011, Glasgow, Scotland, UK (Poster presentation).
IV. D. Bounechada, G. Groppi, P. Forzatti, K. Kallinen and T. Kinnunen, Enhanced methane conversion under periodic operation over a Pd/Rh based TWC in the exhausts from NGVs, in preparation for Top. Catal., CAPoC 9, August 29th – 31st 2012, Brussels, Belgium (Oral presentation).
V. P.-A. Carlsson, S. Fouladvand, D. Bounechada, L. Kylhammar, J. Gustafson, E. Lundgren
and M. Skoglundh, Sulfur promoted methane oxidation over supported platinum catalysts, in preparation for Top. Catal., CAPoC 9, August 29th – 31st 2012, Brussels, Belgium (Poster presentation).


Table of contents
1. INTRODUCTION
1.1. BACKGROUND………………………………………………………………...... 1.2. OBJECTIVES……………………………………………………………………..
2. METHANE ABATEMENT FROM THE EXHAUSTS OF NATURAL GAS VEHICLES 2.1. CATALYSTS FOR METHANE OXIDATION…………………………………………
2.1.1. PALLADIUM-BASED CATALYSTS…………………………………………………… 2.1.2. PLATINUM-BASED CATALYSTS……………………………………………………… 2.1.3. NOBLE METAL-SUPPORT INTERACTION…………………………………………..
2.2. THREE-WAY CATALYSTS FOR STOICHIOMETRIC APPLICATIONS………………... 2.3. STRATEGIES FOR ENHANCED LOW TEMPERATURE METHANE OXIDATION………
3. RESEARCH APPROACH AND SCIENTIFIC METHODS 3.1. CATALYTIC MATERIALS………………………………………………………… 3.2. CHARACTERIZATION OF SUPPORTED NOBLE-METAL CATALYSTS………………. 3.3. CONTINUOUS GAS-FLOW REACTORS…………………………………………….
3.3.1. STAINLESS STEEL REACTOR………………………………………………………… 3.3.2. QUARTZ REACTOR……………………………………………………………………
3.4. FOURIER TRANSFORMED INFRARED SPECTROSCOPY…………………………….
4. RESULTS AND DISCUSSION 4.1. PERIODIC OPERATION AROUND STOICHIOMETRY……………………………….. 4.2. SULFUR AND NOX ASSISTED METHANE OXIDATION……………………………..
5. CONCLUSIONS
6. REFERENCES
1 1 2 3 3 4 5 6 6 7 9 9 10 11 11 12 13 15 15 18 23 27


1 Introduction
1.1. Background
According to a recent esteem of the European Environmental Agency (EEA) the European
transport sector is still strongly dependent on petroleum powered internal combustion engines (for
around 96 % of total) [1]. The main products of the combustion of hydrocarbon-based fuels are
carbon dioxide (CO2) and water (H2O), the first being a well-known greenhouse gas (GHG). In the
same report it is stated that the transport sector was responsible of 24% of all EU GHGs emissions
in 2009 [1]. Since according to the Intergovernmental Panel on Climate Change (IPCC) it is likely
that a connection exists between the increasing anthropogenic GHG emissions and the global
temperature rise observed in the last 50 years [2], maintaining the transport sector’s dependence on
oil is no longer sustainable. Besides CO2 and H2O, other compounds are present in the exhausts
which are hazardous for human health, e.g. particulate matter (PM), carbon monoxide (CO), non-
methane organic volatile compounds (NMVOCs), ozone (O3), nitrogen oxides (NOx) and sulfur
oxides (SOx) [1]. Efforts have been made in many countries to face these problems by the
introduction of more and more stringent emission regulations [3].
The replacement of traditional fossil fuels with renewable sources (e.g. biofuels, electricity
and potentially hydrogen) is expected to be the long term solution for the environmental issue.
However, today the available technologies for the exploitation of renewables do not allow to satisfy
the global energy demand. For this reason, the replacement of gasoline and diesel with natural gas
(NG) as fuel for cars has been regarded as the best temporary solution for the reduction of GHG
emissions. In fact, among all hydrocarbons methane (which is the main component of NG) has the
highest hydrogen/carbon ratio, which allows achieving a reduction of CO2 per km emissions.
Farther, NG engines produce lower PM than diesel engines, since NG does not contain aromatic
compounds, and contains less sulfur compounds than oil derived fuels [4]. Finally, the development
and optimization of natural gas vehicles (NGVs) is straightforward also in the view of the
replacement of natural gas with renewable CH4 (i.e. biogas) in the next future. However, the
presence of unburned methane in the exhausts represents a major drawback because of its high
Global Warming Potential (GWP).

2
Spark-ignited automotive gas engines can be divided into two categories, stoichiometric
and lean-burn, depending on the air/fuel ratio [5]. The lean-burn technology guarantees an efficient
fuel use and a reduction of CH4 and NOx emissions in comparison with stoichiometric engines.
However, complex exhausts aftertreatment systems are required to meet the emission standards.
Carbon monoxide and hydrocarbons are usually controlled by means of an oxidation catalyst,
whereas the most promising concepts for NOx abatement are lean NOx trap (LNT) and selective
catalytic reduction (SCR) by hydrocarbons or ammonia [6]. On the contrary, the catalytic systems
following stoichiometric engines rely predominately on three-way catalysts (TWCs), which allow
the simultaneous abatement of the main pollutants (NOx, CO and CH4). Being lambda (λ) the ratio
between the actual amount of air and the stoichiometric amount necessary for total fuel oxidation,
the lambda window for the best performance of TWCs is narrow: operating outside this window
would dramatically reduce the efficiency of the abatement system, which results in increased
emission levels. Under closed loop lambda control the fuel injection system of a NG engine is
regulated in order to optimize the performance of the catalytic converter by keeping the air to fuel
ratio around the stoichiometric value. Although well-established for the aftertreatment of the
exhausts from gasoline engines, this technology has not yet been optimized for NG applications.
Besides methane oxidation is challenging, especially at low temperatures, due to the high stability
of the methane molecule. Thus, new materials or strategies have to be considered in order to
improve catalytic performances.
1.2. Objectives
In this thesis different strategies for the enhancement of low-temperature catalytic
oxidation of methane emissions are investigated. The aim is to gain further understanding in the
mechanisms of methane oxidation, in particular in presence of reactive gases, and to clarify the role
of the support material and the metal-support interface.

2 Methane abatement from the exhausts of natural gas vehicles
New restrictions have been introduced for the emission of non-methane hydrocarbons
(NMHC) by Euro 5 regulation in 2009, limiting to 68 mg/km their release in the atmosphere [7].
However the limit of 100 mg/km for total hydrocarbons (THC) is still valid, so that also methane
emissions have to be limited. Besides, the standard for the emissions of nitrogen oxides from
passenger cars has become stricter (60 mg/km).
So far, two main strategies are used to meet these stringent emission regulations. Lean-
burn operation (λ = 1.7-1.8) allows to achieve high thermal efficiencies and low NOx emissions,
but at the same time the THC emissions increase, so that an oxidation catalyst is also required [4].
On the other hand, stoichiometric engines with exhaust gas recirculation (EGR), which keeps high
fuel efficiencies [4], and three-way catalysts, for the simultaneous abatement of CO, CH4 and NOx,
are regarded as the most promising strategy to meet the future emission standards [8].
2.1. Catalysts for methane oxidation
At present the most common strategy for the abatement of the undesired CO and unburned
CH4 is catalytic combustion. Generally, for n-alkanes, the shorter the chain length the higher is the
temperature needed for the oxidation to occur [9,10], that makes CH4 the most difficult to oxidize
among all the hydrocarbons. Besides, along with
the development of more and more efficient
engines the exhausts have become colder, so that
the low-temperature activity is no longer only a
cold-start problem (Fig. 2.1). In this scenario, the
main challenge for a modern oxidation catalyst is
the conversion of low amounts of CH4 (500-1000
ppm) at low temperatures (less than 500°C). The
presence of large amounts of H2O (10-15%) and
CO2 (15%), coming from complete combustion of
Fig. 2.1 – Light-off curves for methane and non-methane hydrocarbons and typical
NGV exhaust gas temperatures [10].

4
methane in the engine, might also have a negative impact on the catalytic activity [11]. Besides,
since traces of sulfur containing compounds not only from natural gas (about 1 ppm) but also from
lubricating oils can be present, resistance to sulfur poisoning is also needed.
Two families of catalysts for complete methane oxidation have been studied: noble metals
and transition metal oxides. However, research early focused on the first group, their higher
activity making them the most promising materials for low-temperature applications. Among noble
metals, palladium and platinum supported on high surface area metal oxides (e.g. silica or alumina)
are the most commonly used.
2.2.1. Palladium-based catalysts
Palladium-based catalysts are recognized to be the most active materials for methane
oxidation in lean-burn applications [9,10,12,13,14,15]. It is generally accepted that different
species of palladium oxide can be formed under oxygen excess depending on temperature, oxygen
partial pressure and Pd particle dispersion [16,17,18,19,20], and that both PdO and Pd can be
present at the same time on the catalyst [21,22,23,24]. A redox mechanism for methane oxidation
over palladium-based catalysts is likely, even if not yet disclosed. It has been proposed that
methane from the gas phase reacts with lattice oxygen and reduces oxidized palladium according to
a Mars-van Krevelen type of mechanism. Metallic Pd is subsequently re-oxidized by chemisorbed
oxygen, completing the redox cycle [25]. Alternatively, methane could adsorb on a coordinatively
unsaturated Pd site on the surface of a PdO crystallite. This would be followed by H-abstraction
through interaction with an adjacent Pd-O species and subsequently formation of Pd-OH species
(Fig. 2.2). Finally the active Pd/Pd-O pair could be recovered through combinative desorption of
two OH species [26]. In the light of the above reported mechanisms, the oxidation state of the
noble metal appears to be of major
importance for the activation of the
C-H bond, which is regarded as
Fig. 2.2 - Methane dissociation mechanism on a surface Pd–PdO site pair [26].
the rate-determining step for
methane oxidation [27].
Despite their high low-temperature activity, palladium-based catalysts present two major
drawbacks, i.e. the inhibition/poisoning by water [9,15] and the sensitivity towards sulfur
containing compounds [10,15,28,29,30]. The most likely mechanism for water inhibition involves
the blockage of active sites for methane dissociation by formation of stable surface hydroxides
[31,32,33,34,35].

5
As regarding the mechanism of sulfur
poisoning over Pd-based catalysts a distinction
should be made on the basis of the
sulfating/non-sulfating nature of the supporting
material used. Assuming that the origin of
catalyst deactivation is chemisorption of SOx
species on the active sites, the lower
deactivation observed over sulfating support
Fig. 2.3 – Mechanism of sulfur poisoning and successive regeneration for palladium catalysts
supported on sulfating or non-sulfating materials [10].
Materials (e.g. Al2O3) can be explained
considering that the support acts as a sink for
SO2/SO3 , shifting SOx away from the
palladium. On the contrary, more Pd-sulfates can be formed when a non-sulfating support (e.g.
SiO2) is used. Differences are observed also during catalyst regeneration by heating up to 650°C.
Palladium sulfates almost completely decompose in the case of non- sulfating support and the
original activity is recovered. On the contrary, sulfur stored in the sulfating support may diffuse to
palladium by (reverse) spillover, preventing a complete regeneration [10]. The exposure of the
catalyst to alternate reducing and lean atmospheres could lead to a more effective recovery of
catalytic activity after sulfur exposure [36].
2.2.2. Platinum-based catalysts
In contrast with palladium, the activity of platinum-based catalysts for methane oxidation
is poor under lean conditions due to oxygen self-poisoning [9,15]. It is commonly accepted that
methane oxidation on Pt occurs via a Langmuir-Hinshelwood (LH) type of mechanism involving
reaction between dissociated methane and oxygen species. Therefore, the inhibiting effect of
oxygen can be explained by a site competition between the two reactants [37] favoring the
adsorption of oxygen, due to its considerably higher sticking probability as compared to methane
[38,39]. To support the above described reaction mechanism, the existence of an optimum oxygen
coverage of Pt particles for C-H activation has been demonstrated [9,40,41,42,43,44,45].
Despite their lower activity, Pt-based catalysts remain of interest for lean-burn applications
due to their low sensitivity to water [15] and sulfur containing compounds [10,15,30,46], since
platinum does not form stable hydroxides or sulfates. On the contrary, it has been shown that the
addition of sulfur dioxide can even promote methane oxidation over platinum supported catalysts
[47,48,49]. Possible mechanisms for sulfur promotion will be discussed in this thesis (see Section
4.2).

6
2.2.3. Noble metal-support interaction
The deposition of metals on a support material with high (specific) surface area, like silica
or alumina, can significantly improve the catalytic activity, likely due to the increased metal
dispersion and stabilization against sintering. The support material can also modify catalytic
properties by influencing the morphology of the active particles attached to the support. Indeed,
according to Wulff construction, different crystal planes will be preferentially exposed on the
surface depending on the free energy of the surface facets and the interface energy with the support
[50], resulting in catalysts more or less reactive. Besides, many reactions are believed to occur only
at the metal-support interface, where a modified electron density resulting from charge transfer
phenomena may change the chemisorption properties of the metal [51,52,53]. This effect is referred
to as strong metal-support interaction (SMSI) and has been observed for noble metals supported on
both TiO2 and CeO2 [54,55]. Finally metal-support interactions are of major importance in spillover
processes i.e. transport of active species adsorbed on the metal surface to the surface of the support,
or vice versa, which can play a major role in the mechanism of methane oxidation [56].
2.3. Three-way catalysts for stoichiometric applications
The aftertreatment systems for the exhausts of stoichiometric engines mainly rely on three-
way catalysts (TWCs) technology adapted from gasoline applications. Noble metals are employed
as active components in TWCs, among which Pt and Pd or combinations of them are
predominantly used due to their high methane and CO oxidation activity [57]. Besides, rhodium
turned out to be the most effective among the noble metals for NOx abatement, due to its higher
ability to dissociate NO [58,59]. For this reason, small amounts of Rh are usually included into
TWCs formulations.
The periodic adjustment of the air to fuel ratio imposed by the oxygen feedback control
sensor, which is typical of stoichiometric engines, results in significant deviations from the
stoichiometric point. In order to reduce the impact of the perturbations on the conversion
efficiency, an oxygen storage compound (e.g. CeO2 and/or CexZryO solid solutions) is usually
included in TWC formulations. Indeed, due to its ability to act as oxygen buffer by
storing/releasing oxygen under lean/rich conditions respectively, in the presence of ceria the
operating lambda window can be widened [60,61,62]. Further, it has been proved that the
introduction of zirconia into ceria can improve the oxygen storage capacity (OSC) by producing
defects which facilitate the transport of oxygen from the bulk to the surface under reducing
conditions [63,64,65].
Recently, it has been recognized that segregating the noble metals in different washcoat
layers is an effective method to avoid detrimental metal-metal or metal-support interactions

7
[57,62]. Thus, many catalyst manufacturers have developed new 3D catalyst formulations to
optimize the specific catalytic functions. As an example, trimetallic TWCs (Pd with small amounts
of Pt and Rh) are prepared in two layers. Rhodium is located in a separate layer in order to avoid
alloy formation with palladium and is also segregate from CeO2, since the formation of cerium
rhodate can deactivate its deNOx function [66]. Finally, improvements in the OSC and CO
oxidation function have been found when palladium interacts with ceria, but some Pd has to remain
free in order to preserve the HC oxidation performances [67]. Although TWC technology in the
exhausts of gasoline-fueled engines is well established, further investigations are still needed for its
application to NGVs.
2.4. Strategies for enhanced low temperature methane oxidation
In order to reduce the precious metals content, i.e. the cost of the catalytic converter, and to
match stricter regulation requirements more effective oxidation strategies are needed. Several
methods to improve catalytic performances for low-temperature methane oxidation have been
proposed [68].
One strategy could be to modify the composition of the active phase by combining
different precious metals or by adding promoters. Differently promoted bi- and trimetallic systems
are commonly used for TWCs, as already described in Section 2.3. A considerable improvement of
the catalytic behavior over bimetallic Pt-Pd systems has been observed also for lean-burn
applications [69]. Besides, using ceria instead of alumina as support material leads to an increase of
the catalytic activity of platinum under lean conditions: the presence of highly active sites for
methane dissociation at the platinum-ceria interface has been suggested to explain the observed
lower light-off temperature [70].
Another strategy for the enhancement of methane conversion could be changing the
exhaust gas composition, e.g. by periodic operation. This technique consists in periodic alternation
of the feed gas between net oxidizing and net reducing compositions, which is customary for three-
way catalysts. A large number of papers have been devoted to the study of Pd and Pt based TWCs
under periodic operation [28,71,72,73,74,75,76] and in most of them improvements in hydrocarbon
conversion were found when working under oscillating conditions [71,72,73,75,76]. Some authors
proposed that the improved catalytic performances may origin from perturbations in the adsorbate
composition on the active sites caused by the alternation of rich and lean conditions [72,74,75].
However, most of the TWCs literature refers to the exhausts of gasoline vehicles, largely
represented by hydrocarbons of high molecular weight, which are relatively easy to oxidize,
whereas the chemistry of methane abatement over TWC is still unclear. On the contrary, the effect
of periodic lean/rich pulses on methane oxidation over catalysts for lean-burn applications has been

8
object of some recent studied over Pt/Al2O3 [14,42,43,44,77,78], Pt/CeO2 [78] and Pd/Al2O3 [14].
A temporary maximum for methane conversion was observed when switching gas composition,
whose duration varies depending on the OSC of the support [78]. The reason for the high activity
might be the presence of a favorable composition of the adsorbed species on the metal surface or an
optimal oxidation state of the noble metal surface, neither completely oxidized nor completely
reduced, which is considered to be more effective for methane dissociation [77].
Another strategy for the enhancement of methane conversion over Pt-based catalyst under
lean condition could be affecting the composition of the gas stream by the addition to the exhausts
of saturated hydrocarbons of higher molecular weight which can be easily oxidized. In fact a
decrease in the light-off temperature has been observed after the addition of C2-C4 alkanes over a
presulfated Pt/Al2O3 catalyst [79], likely due to the circumvention of oxygen inhibition. Finally, an
interesting promoting effect was observed for low-temperature methane oxidation by addition of
sulfur dioxide on Pt supported on Al2O3 [47,48] and CeO2 [49]. The origins of sulfur promotion
and the role played by the support will be further discussed in Section 4.2. However, it is possible
to anticipate that new active sites consisting of a polarized pair Ptδ+/(SO4)δ- at the metal-support
interface might be more effective in the breakage of C-H bond [80]. Although the presence of SO2
in the exhausts is undesired, a better understanding of this phenomenon could be useful for the
design of new catalysts with permanent higher activity towards methane oxidation.

3 Research approach and scientific methods
3.1. Catalytic materials
In Paper 1 a commercial Pd-Rh based catalyst (7.1 g/l of loading, Pd:Rh = 39:1) developed
by Ecocat has been tested. The catalyst support mainly consists of stabilized γ-Al2O3. In addition,
Ce-Zr mixed oxide (Zr/Ce = 3.5) were used to improve the oxygen storage capacity of the catalyst
and transition metal compounds were added as stabilizers and promoters. The catalyst was prepared
by mixing the supporting materials with precursor salts of the noble metals in a water slurry and
then coating a 400 CPSI/6 mils ceramic honeycomb to a layered structure. The washcoat material
content referred to the geometric area of the catalyst is 50 g/m2.
For the studies in Paper 2 and 3, three supported platinum catalysts with 4 wt.-% Pt loading
have been prepared by dry impregnation of silica, alumina and ceria. Each support was first
pretreated in air at 600°C for 4 hours and then dispersed in an aqueous solution consisting of
distilled water and the noble metal precursor ((NH3)4Pt(NO3)2). According to the incipient wetness
method, the volume of the liquid was restricted to the pore volume of the material, so that three
impregnation steps were necessary to obtain the desired Pt loading on the Pt/ceria sample, whereas
one step was enough for the Pt/silica and the Pt/alumina ones. Since platinum is positively charged
in the solution, the pH was adjusted by NH4OH addition in order to increase the interaction
between the platinum complex and the support. The isoelectric point of each oxide was taken into
account in the choice of pH value [81]. The obtained slurry was then stirred for 20 minutes, frozen
with liquid nitrogen and freeze-dried for 12 h. The main advantage of the freeze-drying technique
as compared to the most commonly used thermal evaporation is that the noble metal distribution is
maintained resulting in less agglomeration [82]. The obtained powder was finally calcined in air at
550°C for one hour. Monolithic samples were prepared by immersing 400 CPSI cordierite
monoliths in a water slurry consisting of the catalyst powder and a binder of the same nature of the
supporting material. The coated monoliths were then dried in air at 90°C for 10 min and calcined at
600°C for 2 min also in air, before repeating the coating procedure till 200 mg of coating was

10
deposited on each sample. Finally, the samples were calcined in air at 550°C for one hour to avoid
collapse of support and, thus, noble metal encapsulation during high temperature experiments.
3.2. Characterization of supported noble-metal catalysts
N2 physisorption measurements have been performed at -196°C (liquid nitrogen) over
powder samples of the three Pt-based catalysts (Paper 2 and 3). The specific surface area of
Pt/silica, Pt/alumina and Pt/ceria have been calculated to be 117, 173 and 156 m2/g, respectively,
according to the Brunauer-Emmett-Teller (BET) equation [83] for P/P0 = 0.05-0.20.
To be able to discern the effect of the different support materials, the catalysts used for the
comparison must have similar platinum dispersions. Different methods are usually applied for the
evaluation of precious metal (PM) dispersion.
Gas chemisorption: dispersion is calculated from the measurement of PM uptake of a
certain species (e.g. O2 for H2-O2 titration and CO for CO pulse method) on a pre-reduced
sample.
Line broadening of X-ray diffraction (XRD) peaks: particles size is calculated according to
the Scherrer equation [84].
Transmission electron microscopy (TEM): particles size is directly measured from high
resolution images [85].
However, the measurement of dispersion from XRD is generally difficult if small amounts of small
PM particles are supported, as in this case, because they generate too weak and too broad peaks.
Besides, it is difficult to apply gas chemisorption methods for the measurement of PM dispersion
on CeO2 containing supports. In fact, when H2-O2 titration is used, it is difficult to distinguish the
chemisorption on the PM from the redox of the support because of the high OSC of ceria. On the
other hand, when CO pulses are performed, CO is absorbed on the ceria as carbonates, so resulting
in a CO uptake higher than expected. Finally, the use of TEM could also be difficult because the
dark ceria contrast hinders the distinction of PM particles. A way to circumvent this problem is the
use of the high-angle annular dark-field imaging technique (HAADF) [86]. An annular dark field
detector collects scattered electrons from an annulus around the beam. If only very high angle,
incoherently scattered electrons are used to form the image, a high sensitivity towards variations in
the atomic number of atoms in the sample (Z-contrast images) can be obtained.
For the measurement of PM dispersion of the catalysts used in Paper 2 and 3, the particles
were imaged using high angle annular dark field imaging scanning TEM imaging mode providing
Z number contrast. The electron probe size used for these studies was about 0.2 nm. The results
(reported in Paper 2) show that platinum particles in the Pt/silica sample are generally larger than
the Pt particles in the Pt/alumina and Pt/ceria samples. However, a significant fraction of the

11
platinum crystals are very small, i.e. below two nm in all three samples, so that we can say with a
certain confidence that the observed effects are not ascribable to different PM dispersions.
3.3. Continuous gas-flow reactors
In this work two different flow reactor configurations were used for the investigation of the
effect of periodic lambda oscillation (Paper 1) and of the presence of SOx/NOx (Paper 2 and 3),
respectively.
3.3.1. Stainless steel reactor
A schematic representation of the experimental setup used in Paper 1 is given in Fig. 3.1.
A stainless steel tubular reactor
externally heated by an oven was
used (Fig. 3.2). The monolithic
sample (6x6 channels, length = 1.3
cm, volume = 0.832 cm3) was
wrapped by a quartz wool tape and
located in a properly designed
holder to avoid by-pass phenomena.
Fig. 3.1 – Schematic representation of the continuous gas flow reactor system used in Paper 1.
The upstream section of the reactor
was filled by quartz spheres to
allow complete mixing and preheating of gas feed. A sliding thermocouple was inserted into one of
the central channels of the monolith for the measurement of the axial gas temperature profile
during the experiments. An example of axial gas temperature profiles is given in Fig. 3.3 for
different oven temperatures. A second thermocouple was located immediately before the entrance
of the monolith sample. Each feed line was
equipped with a programmable mass flow
controller, regulated through a LabVIEW interface.
Furthermore, a HPLC pump/evaporator system is
used to feed H2O. H2O concentration was
continuously monitored by means of a humidity
-2 0 2 4 6 8 10 12350
400
450
500
550
600
650
Tem
pera
ture
[°C
]
z [mm]
flow Tave= 15°C
Fig. 3.3 – Axial gas temperature profiles at different oven temperatures (GHSV =
50000h-1).
Fig. 3.2 – Schematic representation of the stainless steel reactor.

12
sensor. The total gas flow was 700 cm3/min at NTP in all the experiments, corresponding to a gas
hourly space velocity (GHSV) of 50000 h-1 referred to the honeycomb catalyst volume. The desired
lambda values were obtained by stepwise variations of oxygen concentration, according to the
following expression derived from stoichiometric mass balances for a natural gas fuelled engine
[87]:
42222
2242
42242334
2 ,
,
CHHCONOOairOHCO
NOOHCOCHairO
yyyyyyyyyyyyyy
where yi is the molar fraction of i species. The changes in the oxygen concentration were
compensated by simultaneously switching N2 feed flow in order to maintain a constant total gas
flow during periodic operations. The lambda value was monitored by a lambda probe positioned
immediately upstream the reaction section. The analysis of inlet and outlet gas composition was
periodically accomplished using a Micro GC equipped by TCD detectors, a Molecular Sieve 5 Å
column for separation of N2, H2, O2, CH4 and CO (Ar carrier) and a Plot Q column for separation of
CO2 and H2O. However, since each GC analysis takes about 3 min, this kind of measurement is
reliable only under stationary conditions. In order to follow changes in the outlet gas concentrations
during transient operation, a series of continuous gas analyzers was therefore provided:
UV spectrometer (NO, NO2 and NH3);
thermal conductivity analyzer (H2);
paramagnetic analyzer (O2);
IR spectrometer (CH4, CO and CO2).
3.3.2. Quartz reactor
A schematic representation of the experimental rig used in Paper 2 and 3 is given in Fig. 3.4. In this
case the continuous gas-flow reactor
consists of an horizontal quartz tube
surrounded by a metal coil for resistive
heating of the gas flow and the
monolithic sample (Ø = 13 mm, length
Fig. 3.4 - Schematic representation of the continuous gas flow reactor system used in Paper 2 and 3.
= 15 mm). In order to reduce axial
temperature gradients, the reactor was
insulated with a quartz wool layer and the sample was placed in the isothermal zone of the reactor
with one blank cordierite monolith upstream and two downstream functioning as heat radiation
shields [88].
The temperature in each cordierite monolith and in the catalytic sample was measured by fixed
thermocouples. Each individual feed line was provided with a mass flow controller, regulated

13
through a LabVIEW program. In order to avoid the overshoot connected with the opening of the
mass flow controller, the gas flows were introduced to the reactor by means of three air actuated
four-way pulse valves. The analysis of the outlet gas composition was performed by a mass
spectrometer according to both the ion-molecule reaction (IMR) and the electron impact (EI)
methods, i.e. using primary ions or electrons, respectively, to ionize the sample gas. The main
advantage of IMR is a reduced fragmentations, due to its lower collision energy compared to EI
[89,90], which allows to selectively distinguish between molecules with the same mass to charge
ratio (m/z) through an accurate choice of the primary ions. In this work different methods were
used to follow different m/z:
IMR with Xe+ as primary ion: 14 (N), 28 (CO) and 64 (SO2);
IMR with Kr+ as primary ion: 17 (NH3) and 44 (N2O);
IMR with Hg+ as primary ion: 30 (NO) and 46 (NO2);
EI: 2 (H2), 15 (CH4), 18 (H2O), 28 (CO), 32 (O2 and S), 33 (HS), 44 (CO2 and N2O)
and 48 (SO)
3.4. Fourier transformed infrared spectroscopy
Infrared (IR) spectroscopy is commonly applied in catalysis for the identification of the
species adsorbed on the catalyst surface. This technique exploits the fact that molecules possess
discrete levels of vibrational energy and that the adsorption of photons with frequency in the mid-
infrared range (200-4000 cm-1) can provoke transitions between vibrational levels. However, not all
the vibrations can be observed. In order to be IR-active, a vibration has to produce a net change in
the dipole moment of the molecule. The intensity of the IR band is then proportional to the change
in the dipole moment. Besides, its frequency, that is equal to the frequency of the bond or group
that vibrates, increases with increasing bond strength and decreasing mass of the vibrating atoms
[91,92]. It is worth to note that after adsorption, the vibrational frequency of a molecule can change
as a consequence of electronic rearrangements influencing the bond strength. IR spectra are
obtained by detecting changes in transmittance (or absorption) intensity as a function of frequency.
In Fourier transformed infrared (FTIR) spectroscopy the entire wavelength range is
measured at once, thus allowing a faster analysis than in dispersive IR spectroscopy [91,92]. In this
work, diffuse reflectance infrared Fourier transformed spectroscopy (DRIFTS) was used to perform
in situ measurements. The main advantage of diffuse reflectance mode is the possibility to use
powder samples instead of the pressed disks required by transmission or total reflectance modes
[93]. This facilitates the procedure for samples preparation and also diffusion limitations of gaseous
species to and from the sample are avoided [92].

14
A schematic representation of the experimental setup used in Paper 2 and 3 for in situ
DRIFTS measurements is given in Fig. 3.5. A high-temperature reaction cell with KBr IR
transparent windows was used. The temperature of the sample holder was measured with a
thermocouple and individual mass flow controllers were used to introduce the gases. Moreover, to
facilitate precise transients, the SO2/NOx feed was introduced via an air actuated high-speed gas
valve.
Fig. 3.5 – Schematic representation of the DRIFTS system used in Paper 2 and 3.
The outlet gas composition was analyzed by a EI mass spectrometer following the m/z 2 (H2), 14
(N), 15 (CH4), 17 (NH3), 18 (H2O), 28 (CO), 30 (NO), 32 (O2 and S), 40 (Ar), 44 (CO2 and
N2O), 46 (NO2), 48 (SO), and 64 (SO2).

4 Results and discussion
In this work, different strategies for the improvement of low-temperature catalytic
oxidation of methane emissions are studied. In Paper 1 the effect of forced oscillations around
stoichiometry over a commercial Ce-Zr promoted Pd-Rh/Al2O3 catalyst for the abatement of
methane from the exhausts of NGVs is addressed, with the purpose to gain further
understanding on periodic operation as a strategy for the enhancement of catalytic activity. Since
this work has been performed within the INtegrated GAS powertrain (INGAS) project, financed by
the European Union, it should be regarded as a need-driven research rather than a primary study.
On the contrary, the second part of this work has the features of a more fundamental research. In
Paper 2 and 3 sulfur promoted and NOx assisted low-temperature methane oxidation are studied,
respectively, by comparing silica, alumina and ceria supported platinum catalysts with the purpose
to gain further understanding on the mechanisms of methane oxidation promotion. Spectroscopic in
situ measurements (FTIR) complete the picture, disclosing changes in the adsorbed species.
5.1. Periodic operation around stoichiometry
In Paper 1, the behavior of a commercial Ce-Zr promoted Pd-Rh/Al2O3 honeycomb
three-way catalyst for natural gas vehicles is studied under both stationary and periodic conditions,
with a special focus on methane conversion. The feed gas mixture is representative of the typical
composition of the exhausts from a stoichiometric CNG engine [94]: 0.15 vol.% CH4, 0.6 vol.%
CO, 0.1 vol.% H2, 0.13 vol.% NO, 0.58 vol.% O2, 10 vol.% H2O, 10.7 vol.% CO2 and balance N2.
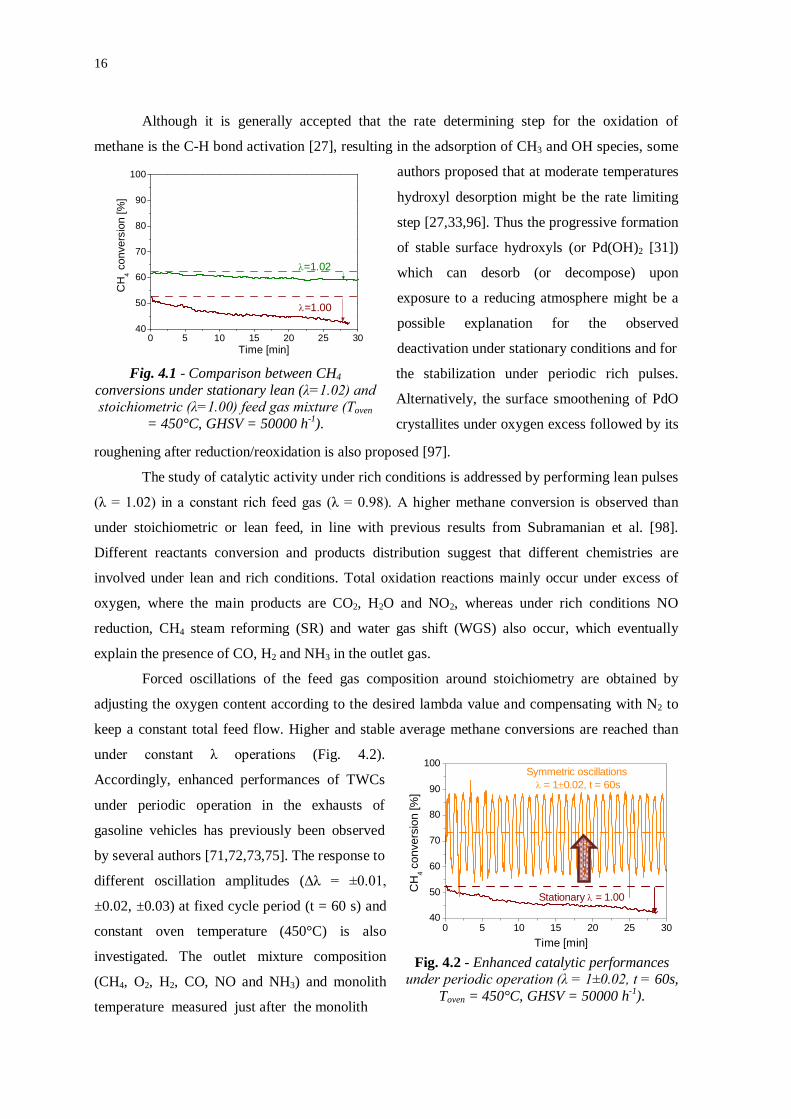
The exposure to a stationary stoichiometric or lean reaction mixture in presence of large
amounts of water and at Toven = 450°C leads to catalyst deactivation already after 30 min of time on
stream (Fig. 4.1). However the introduction of periodic rich pulses (λ = 0.98) in a constant lean
feed gas (λ = 1.02) can stabilize the catalytic performances, in line with what reported by Arosio et
al. [36] and Castellazzi et al. [95].
16
Although it is generally accepted that the rate determining step for the oxidation of
methane is the C-H bond activation [27], resulting in the adsorption of CH3 and OH species, some
authors proposed that at moderate temperatures
hydroxyl desorption might be the rate limiting
step [27,33,96]. Thus the progressive formation
of stable surface hydroxyls (or Pd(OH)2 [31])
which can desorb (or decompose) upon
exposure to a reducing atmosphere might be a
possible explanation for the observed
deactivation under stationary conditions and for
Fig. 4.1 - Comparison between CH4 conversions under stationary lean (λ=1.02) and stoichiometric (λ=1.00) feed gas mixture (Toven
= 450°C, GHSV = 50000 h-1).
the stabilization under periodic rich pulses.
Alternatively, the surface smoothening of PdO
crystallites under oxygen excess followed by its
roughening after reduction/reoxidation is also proposed [97].
The study of catalytic activity under rich conditions is addressed by performing lean pulses
(λ = 1.02) in a constant rich feed gas (λ = 0.98). A higher methane conversion is observed than
under stoichiometric or lean feed, in line with previous results from Subramanian et al. [98].
Different reactants conversion and products distribution suggest that different chemistries are
involved under lean and rich conditions. Total oxidation reactions mainly occur under excess of
oxygen, where the main products are CO2, H2O and NO2, whereas under rich conditions NO
reduction, CH4 steam reforming (SR) and water gas shift (WGS) also occur, which eventually
explain the presence of CO, H2 and NH3 in the outlet gas.
Forced oscillations of the feed gas composition around stoichiometry are obtained by
adjusting the oxygen content according to the desired lambda value and compensating with N2 to
keep a constant total feed flow. Higher and stable average methane conversions are reached than
under constant λ operations (Fig. 4.2).
Accordingly, enhanced performances of TWCs
under periodic operation in the exhausts of
gasoline vehicles has previously been observed
by several authors [71,72,73,75]. The response to
different oscillation amplitudes (∆λ = ±0.01,
±0.02, ±0.03) at fixed cycle period (t = 60 s) and
constant oven temperature (450°C) is also
investigated. The outlet mixture composition
(CH4, O2, H2, CO, NO and NH3) and monolith
temperature measured just after the monolith
Fig. 4.2 - Enhanced catalytic performances under periodic operation (λ = 1±0.02, t = 60s,
Toven = 450°C, GHSV = 50000 h-1).
0 5 10 15 20 25 3040
50
60
70
80
90
100
=1.00
Time [min]
CH
4 con
vers
ion
[%]
=1.02
0 5 10 15 20 25 3040
50
60
70
80
90
100
CH
4 con
vers
ion
[%]
Symmetric oscillations = 10.02, t = 60s
Stationary = 1.00
Time [min]

17
entrance during the single lean/rich cycle are shown in Fig. 4.3.
RICHPHASE
LEANPHASE
c)=10.03
280 300 320 340 360 380
Time [s]
CH4
CO
O2
H2
RICHPHASE
LEANPHASE
b)=10.02
320 340 360 380 400Time [s]
0,0
0,2
0,4
0,6
0,8
1,0
RICHPHASE
LEANPHASE
Mol
ar fr
actio
n [%
]
a)=10.01
0,00
0,02
0,04
0,06
0,08
Mol
ar fr
actio
n [%
]
300 320 340 360 380 400
450
460
470
480
T mon
olith
[°C
]
Time [s] Fig. 4.3 - Outlet molar fractions of CO-O2-H2 and CH4 and monolith temperature during a single
lean/rich cycle: a) λ = 1 ± 0.01, b) λ = 1 ± 0.02 and c) λ = 1 ± 0.03 (t = 60 s, Toven = 450°C, GHSV = 50000 h-1).
A delay in the oxygen outlet concentration is observed when passing from rich to lean
conditions. Similarly a delay in the H2 and CO outlet concentrations occurs when passing from lean
to rich. These experimental results are likely reflections of the catalyst redox processes, involving
both the noble metal [99,100,101,102] and the oxygen storage materials in the support
[103,104,105]. However, spectroscopic in situ measurements would be needed to confirm this
hypothesis.
Surprisingly, in contrast with O2, H2 and CO, the oscillation amplitude of outlet CH4
concentration oscillations decreases on increasing the amplitude of lambda oscillation. It is also
worth noting that the values of CH4 concentration during the lean phase decrease with the increase
of the oscillation amplitude, i.e. of the oxygen content. This is in line with the effect of O2 on CH4
conversion observed in the experiments at constant λ (Fig. 4.), supporting that under lean
conditions, but in proximity of the stoichiometric composition, CH4 combustion kinetics has a
slightly positive reaction order in O2 concentration, in line with results by Klingstedt et al. [28].
Also CH4 concentration levels reached during the rich phase markedly decrease with λ. However,
when oscillating around stoichiometry with limited λ variations (±0.01 and ±0.02), CH4 conversion
obtained during the rich phase is markedly higher than during the lean one. Results of stationary
experiments performed with a merely reducing feed (λ = 0.967), i.e. in absence of both O2 and NO,
allow to rule out the hypothesis of a connection between the observed enhancement of methane

18
conversion under rich conditions and a fast CH4 steam reforming over metal Pd. In fact, only a part
of CH4 conversion obtained for λ oscillations of ±0.03, when the only oxidant present in the rich
phase is NO, can be ascribed to steam reforming. This suggests a significant role of NO in CH4
conversion under slightly rich conditions, likely involving Rh [74,106]. Besides, CH4 conversion
achieved under rich conditions in presence of both NO and O2 (∆λ= ± 0.01 and ± 0.02) are much
higher than both that obtained with NO only and those expected from pure steam reforming,
confirming that O2 plays a major role in CH4 conversion under slightly rich operations. A
promoting role of O2 and NO on CH4 conversion could be ascribed to the occurrence of direct
combustion reactions, but this is unlikely due to competition with much more reactive CO and H2.
Alternatively, the higher conversion values observed in the presence of an oxidant (O2 and/or NO)
could be explained by the formation of a more active mixed PdO/Pd° state [26,107,108,109,110],
possibly promoted by the presence of Ce/Zr oxides, at least in the first section of the monolith bed
where O2 and NO have not been yet totally consumed.
In summary, Paper 1 shows that the performance of periodic rich pulses is an effective
method to keep high methane conversion under stationary lean exhausts. Besides, significant
enhancements of the catalytic activity can be obtained by periodic symmetric oscillations of the gas
composition around stoichiometry. The results support that such enhancement is connected with
the presence of a highly active mixed PdO/Pd° state, but spectroscopic investigations are required
to verify this hypothesis.
5.2. Sulfur and NOx assisted methane oxidation
On the basis of the analogy between SO2 and NO oxidation on Pt based catalysts and
SOx/NOx storage properties of the support materials, sulfur promoted (Paper 2) and NOx assisted
(Paper 3) low-temperature methane oxidation are studied by comparing silica, alumina and ceria
supported platinum catalysts. The aim is to gain further understanding on the mechanisms of
methane oxidation promotion. Besides transient flow-reactor experiments, in situ Fourier
transformed infrared spectroscopy experiments have been performed under transient reaction
conditions, which allowed following the changes in the surface coverage of the catalytic samples
during methane oxidation.
Before discussing the effect of SO2, NO and NO2, interesting information about the
existence of different active sites over the different catalysts can be deduced by temperature
programmed surface reaction (TPSR) experiments of pure CH4 oxidation with different oxygen
concentrations (500 ppm CH4 with 1500 ppm or 8 vol.% O2). Assuming that the main reaction path
for methane oxidation on platinum is governed by a Langmuir-Hinshelwood type of mechanism
involving reaction between dissociated methane and oxygen species, the oxygen self-poisoning

19
observed for both Pt/silica and Pt/alumina can be explained by a competitive adsorption between
O2 and CH4 on platinum sites [37] (type A and possibly B in Fig. 4.4) favoring the first due to its
higher sticking probability [38,39]. Contrarily, a positive effect of oxygen was observed for
Pt/ceria. It is likely that, in view of the semi-conductive nature of
ceria, the Pt/ceria system exhibits stronger metal support
interactions [54] that may modify the platinum sites, especially
sites close to the noble metal-support interface (type B in Fig.
Fig. 4.4 – Schematic representation of possible
active sites on Pt supported catalysts.
4.4) that are more active for methane dissociation or activation of
reactive oxygen atoms [111]. Besides, although no evidences for
methane dissociation on pure ceria have been found, the
existence of active sites on the ceria surface (type C in Fig. 4.4)
cannot be excluded. Thus, dissociated oxygen on platinum can either react with dissociated
methane on Pt itself or diffuse towards ceria and react on sites at the noble metal-support interface
[70], or spillover and possibly react on ceria [112].
Since silica is recognized to be resistant towards acidic compounds like SO2 and NOx
[113,114], i.e. neither sulfite/sulfate nor nitrite/nitrate species can be formed on the silica surface, it
is not surprising that the same CH4 conversion is observed
before and after SO2 and NOx exposure for the Pt/silica
sample (Fig. 4.5a). However, a clear inhibition effect is
observed in presence of SO2, which is partly oxidized into
SO3. Having in mind that CH4 oxidation occurs
exclusively on platinum for the Pt/silica sample, without
distinction between platinum sites (A) and interfacial sites
(B), the observed inhibiting effect might be due to a
competition between CH4 and SO2 adsorption (Fig. 4.6a)
as a first step for the respective subsequent oxidation
reactions, favoring SO2 due to its higher sticking
probability on platinum as compared to CH4 [70,115]. An
inhibition effect is observed also upon exposure to NO2 at
temperatures below 500°C. Since the dissociation energy
of the ON-O bond is lower than that of the O-O bond
[116], oxygen from NO2 dissociation might form a layer of
strongly chemisorbed oxygen (or even platinum oxide)
Fig. 4.5 - TPSR of 500 ppm CH4 with1500 ppm O2 (GHSV = 15000 h-
1) over a) 4% Pt/SiO2, b) 4% Pt/Al2O3 and c) 4% Pt/CeO2.
Heating ramps before SO2 exposure, with 20 ppm SO2 present and after
SO2 exposure.
[117,118], leading to oxygen self-poisoning, unless a sufficiently high temperature is reached
where oxygen desorption is favored (i.e. 500°C) (Fig. 4.6b).
0
20
40
0
20
40
60
100 200 300 400 500
0
20
40
60
80
100
b) Pt/alumina
a) Pt/silica
c) Pt/ceria fresh catalyst with SO2
after SO2 exposure
CH
4 con
vers
ion
[%]
Temperature [°C]

20
Unlike for Pt/silica, the oxidation of methane is promoted
by SO2 over Pt/alumina (Fig. 4.5b) due to formation of surface
sulfates (confirmed by IR spectra in Fig. 4.7), likely via a
platinum catalyzed reaction between the adsorbed SO3 and Al2O3
[119], which might work as new active sites more effective in the
breakage of the C-H bond. The general increasing trend of
methane conversion as a function of time on stream may be a
result of successive creation of these new active sites, which are
proposed to be composed of adjacent cationic (Ptδ+) and anionic
([SO42-]δ-) moieties at the noble metal-support interface (B) [80]
(Fig. 4.8a). Decomposition of interfacial sulfates by desorption
Fig. 4.6 - Schematic representation of SO2 (a) and NOx (b) effect on the
Pt/silica catalyst.
[120] or superficial migration of ad-SOx species from interfacial locations to regions far from the Pt
particles, resulting in a decrease of the number of
highly active sites, might explain the existence of a
maximum and not a progressively increasing methane
conversion when increasing the temperature. It is worth
noting that the promoting effect partially remains even
after SOx exposure. The importance of the active sites
located at the noble metal-support interface in the
promotion mechanism is confirmed by the temporary
enhancement of methane conversion observed when
introducing NOx in the feed gas at 500°C. In fact, new
active sites in the form of a polarized couple (Ptδ+ NO3δ-
) are proposed to be formed at the interface (B) via a
Fig. 4.7- Isothermal SO2 PR experiments (40 ppm SO2) on 4%
Pt/Al2O3 performed in the DRIFT cell with a continuous inlet feed: 500 ppm
CH4 and 1500 ppm O2.
platinum catalyzed mechanism (Fig. 4.8b). Being
nitrates unstable, i.e. highly reactive, at 500°C
[121,122], it is likely that as soon as the first C-H bond
has been broken dissociated methane species rapidly
reacts with the nitrate, thus explaining the lack of IR absorption bands associated with NOx species.
Then, CO2 from the reaction is easily adsorbed at the noble metal-support interface, where stable
carbonates are formed, as confirmed by DRIFTS results. The progressive filling of the platinum-
alumina boundaries by carbonates during NOx exposure eventually leads to a slight catalyst
deactivation.
As regarding the Pt/ceria catalyst, a promoting effect is observed during both SO2 and NOx
pulses at 500°C and the ignition ramps in presence of 20 ppm SO2 (Fig. 4.5c). Besides, during the
ignition ramp in presence of 50 ppm NO2 a maximum of CH4 conversion is observed between 230
SiO2
Pt
O2, SO2, CH4
A SO3
SiO2
Pt
O2, NO2, CH4
A NOO2
O∆
a)
b)
0,0
0,2
0,4
0,6
bulksulfates
surfacesulfates
surfacecarbonates/carboxylates
400°C
fresh sample after 5 min exposure after 20 min exposure after 80 min exposure after heating at 500°C
Abso
rban
ce [a
.u.]
2500 2250 2000 1750 1500 1250 1000
0,0
0,2
0,4
0,6
gaseous CO2
500°C
Wavenumber [cm-1]

21
Fig. 4.8 - Schematic representation of SO2 (a) and NOx (b) effect on the Pt/alumina catalyst.
Fig. 4.9- Schematic representation of SO2 (a) and NOx (b) effect on the Pt/ceria catalyst.
and 415°C, which will be referred to as low temperature promotion. All the observed promoting
effects diminish with SO2 or NOx exposure and eventually CH4 oxidation becomes inhibited.
Analogous to Pt/alumina, the temporary SO2/NOx promotion may be explained by the formation of
surface sulfates/nitrates at the noble metal-support interface (B) (Fig. 4.9 and Fig. 4.10). Since ceria
may accelerate the formation of ad-species via spillover processes, it is not surprising that the
promoting effect is stronger on Pt/ceria than on Pt/alumina. In contrast with sulfates, interfacial
nitrates responsible for the low temperature promotion become unstable when increasing the
temperature. Thus the presence of a plateau in CH4 conversion instead of a progressive increase
with increasing temperature is likely due to the decomposition of the interfacial active sites by NOx
desorption. The hysteresis observed in the extinction-ignition cycles in the presence of SO2/NO2
may be due to that Pt facilitates formation of interfacial ad-species at low temperature, whereas at
higher temperatures they form directly on the entire ceria surface and, to a lower extent, at the
noble metal-support boundaries. Besides, but only for SO2 promotion, considering that the sulfation
process is coupled with the reduction of cerium from Ce(IV) into Ce(III) [123], the hysteresis may
also be connected with different mechanisms of ceria re-oxidation depending on the temperature. In
fact, ceria can be oxidized by O2 from the gas phase at high temperatures, whereas at low

22
temperatures oxygen spillover is the main route
[70,112]. Moreover, the gradient in sulfate
concentration between the surface and bulk of ceria
may act as driving force for diffusion of sulfates into
the bulk [124], associated with a corresponding
diffusion of oxygen from the bulk to the surface of the
ceria resulting in oxidation of ceria sites [125]. Unlike
low temperature interfacial nitrates, NOx species
formed at 500°C are directly involved not only in
methane dissociation, but also in the oxidation reaction.
CO2 is formed as combustion product, which can be
adsorbed on the ceria surface in the form of carbonates.
Fig. 4.10 - Isothermal SO2 PR experiments (40 ppm SO2) on 4%
Pt/CeO2 performed in the DRIFT cell with a continuous inlet feed: 500 ppm
CH4 and 1500 ppm O2
The formation of concentration gradients during NOx
exposure may lead to diffusion of carbonates from the
surface to the bulk of ceria, as confirmed by the
DRIFTS results. Accordingly, the long- term
deactivation after SO2 and NOx exposure might be due to the blockage of the oxygen mobility and
the active sites on ceria (C) by bulk sulfation (Fig. 4.10) or carbonation of the support.
In summary Paper 2 and 3 show that the presence of coadsorbates (e.g. sulfates or nitrates)
is of major importance in the enhancement of low-temperature methane oxidation, likely due to the
promotion of the first H abstraction. In this picture, the choice of the support material on the basis
of its adsorption proprieties and its ability to interact with the noble metal is crucial in the design of
more active catalysts
0,0
0,2
0,4
0,6
0,8
1,0sulfites
bulksulfates
surfacesulfates
bulkcarbonateson Ce(III)
surfacecarbonates/carboxylates
Ce (III)
400°C
fresh sample after 5 min exposure after 20 min exposure after 80 min exposure after heating at 500°C
Abs
orba
nce
[a.u
.]
2500 2250 2000 1750 1500 1250 1000
0,0
0,2
0,4
0,6
0,8
1,0 500°C
Wavenumber [cm-1]

5 Conclusions
The replacement of gasoline and diesel with natural gas as fuel for cars allows achieving a
reduction of CO2 per km emissions, due to the higher hydrogen/carbon ratio of CH4. However, the
presence of unburned methane in the exhausts of natural gas vehicles represents a major drawback
because of its high global warming potential (GWP). At present the most common strategy for the
abatement of methane emissions is catalytic combustion. Ceramic monoliths coated with palladium
and platinum based catalysts are recognized to be the most promising materials for this purpose.
However, these noble metals present major drawbacks which could limit their use in real
applications. Despite its high activity under lean conditions, palladium is very sensitive to the
presence of water or sulfur in the exhausts, which may lead to catalyst deactivation. On the other
hand the performance of sulfur resistant platinum based catalysts is limited under lean conditions
due to oxygen inhibition. In this context, gaining further understanding in the mechanisms of CH4
oxidation promotion, in the nature of the active sites and in the role played by noble metal-support
interactions is mandatory to be able to design more active catalysts.
In this work different strategies for the enhancement of low-temperature catalytic activity
towards methane oxidation were investigated over a commercial Ce-Zr promoted Pd-Rh/Al2O3
catalyst and SiO2, Al2O3 and CeO2 supported Pt catalysts for NGVs applications.
The behavior of a commercial Ce-Zr promoted Pd-Rh/Al2O3 catalyst for the abatement of
methane from the exhausts of NGVs was studied under stationary stoichiometric (λ = 1.00) and
lean (λ = 1.02) conditions in the presence of large amounts of water. In both cases, after prolonged
exposure to the reaction mixture catalyst deactivation is observed. The introduction of rich pulses
(λ = 0.98) in a constant lean feed gas (λ = 1.02) results in the stabilization of catalytic
performances. The performance of a specular experiment, i.e. the introduction of lean pulses (λ =
1.02) in a constant rich feed gas (λ = 0.98), evidences that a higher methane conversion is obtained
under stationary reducing than stoichiometric or oxidizing conditions. Besides, the analysis of
reactants conversion and products distribution suggests that different chemistries are involved
under lean and rich conditions. Total oxidation reactions mainly occur under excess of oxygen,
whereas under rich conditions NO reduction, CH4 steam reforming and water gas shift also occur.
Forced oscillations of gas composition around stoichiometry were also performed by periodically

24
switching the feed from slightly rich to slightly lean compositions with different oscillation
amplitudes (±0.01, ±0.02 and ±0.03). The cycle average methane conversions are more stable and
higher than those obtained working under stationary stoichiometric conditions, proving that the
perturbation of the feed gas composition by periodic oscillations around stoichiometry is an
effective strategy for the enhancement of methane combustion over this catalyst. Since a markedly
higher CH4 conversion is observed at λ = 0.98 than at λ = 0.97, when oxygen is absent, O2 should
plays a major role in CH4 oxidation under slightly rich operations. The formation of a more active
mixed PdO/Pd° state, possibly promoted by the presence of Ce-Zr mixed oxides, might be
responsible for both the higher CH4 conversion observed during the rich than in the lean phase and
the stabilization of catalytic performances under periodic rich pulses.
On the basis of the analogy between SO2 and NO oxidation on Pt based catalysts and
SOx/NOx storage properties of the support materials, sulfur promoted and NOx assisted low-
temperature methane oxidation were studied by comparing silica, alumina and ceria supported
platinum catalysts with the purpose to gain further understanding on the mechanisms of methane
oxidation promotion. Transient flow-reactor and DRIFTS experiments in presence/absence of SO2
and NOx show that the catalytic activity is strongly dependent on the nature of the support material.
An inhibiting effect is observed in presence of SO2 on the Pt/silica sample, due to a competition
between CH4 and SO2 adsorption on the same active sites as a first step for the respective
subsequent oxidation reactions. An inhibition effect is observed also upon exposure to NO2 at low
temperature, likely due to a self-poisoning effect by oxygen from NO2 disproportion. These results
evidence that methane oxidation occurs exclusively on platinum sites for the silica supported
platinum. On the contrary, the oxidation of methane is promoted over Pt/alumina in presence of
SO2 via formation of sulfates at the noble metal-support interface, which work as highly active sites
for methane dissociation. The promoting effect is partially lost after sulfur exposure due to
migration of some ad-SOx species from interfacial locations to the support. The importance of
interfacial active sites in the promotion mechanism is confirmed by the temporary enhancement of
methane conversion observed when introducing NOx in the feed gas at 500°C. Similarly, the
formation of new active sites in the form of a polarized couple (Ptδ+ NO3δ-) is suggested. As soon as
methane has been dissociated, a reaction with unstable interfacial nitrates readily occurs releasing
NO in the gas phase and producing CO2. The latter can form carbonates at the interface, which are
likely responsible for long-term catalyst deactivation after NOx exposure by blockage of the active
sites at platinum-alumina boundaries. Finally, exposing Pt/ceria to SO2 (or NO2) leads to a
temporary promotion of the methane oxidation, once again via formation of sulfates (or nitrates) at
the noble metal-support interface. Since ceria may contribute to the overall oxidation kinetics via
spillover processes, the promoting effect observed on Pt/ceria is stronger than on Pt/alumina. The
long-term deactivation after sulfur exposure might be due to the blockage of the oxygen mobility

25
and the active sites on ceria by nearly complete sulfation (surface and bulk) of the support.
Similarly, catalyst deactivation after NOx exposure is likely induced by the migration of
carbonates, readily formed after reaction of nitrates with dissociated methane, from the surface to
the bulk of ceria.
To conclude, this thesis shows that both periodic oscillations of gas composition around
stoichiometry and the introduction of co-adsorbates on the catalyst surface are effective methods to
enhance low-temperature methane oxidation over noble metal supported catalysts. In Paper 1
evidences of a correlation between the improvements under periodic operation and catalyst redox
mechanism are found. Thus, the concentration of oxygen under reducing condition has been
disclosed to be an important parameter which cannot be neglected when using a closed loop
lambda control system. Paper 2 and 3 demonstrate that the choice of the support material on the
basis of its adsorption proprieties and its ability to interact with the noble metal is also crucial in the
design of more active catalysts. As a more general conclusion, further understanding in the nature
of the active sites and on the mechanisms of low-temperature methane oxidation promotion can be
useful for both the design of more active catalysts and the development of more effective operating
strategies.


6 References
1. ISSN 1725-9177, EEA Report No 7/2011 (2011).
2. IPCC Fourth Assessment Report: Climate Change 2007: Synthesis report (2007). 3. http://www.dieselnet.com/standards (2012). 4. H.M. Cho and B.-Q. He, Energy Conv. Manag. Vol. 48 (2007) pp.608-618. 5. N.-O. Nylund and A. Lawson, IANGV Emission Report (2000). 6. R.M. Heck and R.J. Farrauto, Appl. Catal. A: Gen. Vol. 221 (2001) pp.443-457. 7. Regulation (EC) 715/2007 (2007). 8. G.E. Hundleby, SAE Paper 892134 (1989). 9. R. Burch, P.K. Loader and F.J. Urbano, Catal. Today Vol. 27 (1996) pp.243-248. 10. J.K. Lampert, M.S. Kazi and R.J. Farrauto, Appl. Catal. B: Environ. Vol. 14 (1997) pp.211-
223. 11. P. Gélin and M. Primet, Appl. Catal. B: Environ. Vol. 39 (2002) pp.1-37. 12. Y.-H. Chin and D.E. Resasco, Catal. Vol. 14 (1999) pp.1-39. 13. M. Lyubovsky, L.L. Smith, M. Castaldi, H. Karim, B. Nentwick, S. Etemad, R. LaPierre and
W.C. Pfefferle, Catal. Today Vol. 83 (2003) pp.71-84. 14. P.-A. Carlsson, E. Fridell and M. Skoglundh, Catal. Lett. Vol. 115 (2007) pp.1-7. 15. P. Gélin, L. Urfels, M. Primet and E. Tena, Catal. Today Vol. 83 (2003) pp.45-57. 16. R.F. Hicks, H. Qi, M.L. Young and R.G. Lee, J. Catal. Vol. 122 (1990) pp.280-294. 17. P. Briot and M. Primet, Appl. Catal. Vol. 68 (1991) 301-314. 18. R.F. Hicks, H. Qi, M.L. Young and R.G. Lee, J. Catal. Vol. 122 (1990) pp.294. 19. K. Otto, L.P. Haack and J.E. deVries, Appl. Catal. B: Environ. Vol. 1 (1992) p.1.

28
20. T.E. Hoost and K. Otto, Appl. Catal. A: Gen. Vol. 92 (1992) p.39. 21. L.W. Konopny, A. Juan and D.E. Damiani, Appl. Catal. B: Environ. Vol. 15 (1998) pp.115-
127. 22. M. Santhosh Kumar, M.H. Aguirre, A. Weidenkaff and D. Ferri, J. Phys. Chem. C Vol. 114
(2010) pp.9439-9443. 23. A. Eyssler, P. Mandaliev, A. Winkler, P. Hug, O. Safonova, R. Figi, A. Weidenkaff and D.
Ferri, J. Phys. Chem. C Vol. 114 (2010) pp.4584-4594. 24. A. Eyssler, A. Winkler, P. Mandaliev, P. Hug, A. Weidenkaff and D. Ferri, Appl. Catal. B:
Environ. Vol. 106 (2011) pp.494-502. 25. C.A. Müller, M. Maciejewski, R.A. Koeppel, R. Tschan and A. Baiker, J. Phys. Chem. Vol.
100 (1996) pp.20006-20014. 26. K.-I. Fujimoto, F.H. Ribeiro, M. Avalos-Borja and E. Iglesia, J. Catal. Vol. 179 (1998) pp.431-
442. 27. R. Burch, D.J. Crittle and M.J. Hayes, Catal. Today Vol. 47 (1999) pp.229-234. 28. F. Klingstedt, A.K. Neyestanaki, R. Byggningsbacka, L.-E. Lindfors, M. Lundén, M. Petersson,
P. Tengström, T. Ollonqvist and J. Väyrynen, Appl. Catal. A: Gen. Vol. 209 (2001) pp.301-316.
29. G. Corro, O. Vazquez-Cuchillo, F. Banuelos, J.L.G. Fierro and M. Azomoza, Catal. Comm.
Vol. 8 (2007) pp.1977-1980. 30. H.S. Gandhi and M. Shelef, Appl. Catal. Vol. 77 (1991) pp.175-136. 31. C.F. Cullis, T.G. Nevell and D.L. Trimm, J. Chem. Soc. Faraday Trans. Vol. 68 (1972)
pp.1406-1412. 32. D. Ciuparu and L. Pfefferle, Appl. Catal. A: Gen. Vol. 209 (2001) pp.415-428. 33. D. Ciuparu, N. Katsikis and L. Pfefferle, Appl. Catal. A: Gen. Vol. 216 (2001) pp.209-215. 34. D. Ciuparu and L. Pfefferle, Catal. Today Vol. 77 (2002) pp.167-179. 35. D. Ciuparu, E. Perkins and L. Pfefferle, Appl. Catal. A: Gen. Vol. 263 (2004) pp.145-153. 36. F. Arosio, S. Colussi, A. Trovarelli and G. Groppi, Appl. Catal. B: Environ. Vol. 80 (2008)
pp.335-342. 37. R. Burch and M.J. Hayes, J. Mol. Catal. A: Chem. Vol. 100 (1995) pp.13-33. 38. A.-P. Elg, F. Eisert and A. Rosén, Surf. Sci. Vol. 382 (1997) pp.57-66. 39. D.T.P. Watson, J. van Dijk, J.J.W. Harris and D.A. King, Surf. Sci. Vol. 506 (2002) pp.243-
250.

29
40. S.H. Oh, P.J. Mitchell and R.M. Siewert, J. Catal. Vol. 132 (1991) pp.287-301. 41. P.-A. Carlsson, E. Fridell and M. Skoglundh, Catal. Lett. Vol. 115 (2007) pp.1-7. 42. P.-A. Carlsson, M. Nordström and M. Skoglundh, Top. Catal. Vol. 52 (2009) pp.1962-1966. 43. E. Becker, P.-A. Carlsson, H. Grönbeck and M. Skoglundh, J. Catal. Vol. 252 (2007) pp.11-17. 44. E. Becker, P.-A. Carlsson, L. Kylhammar, M.A. Newton and M. Skoglundh, J. Phys. Chem. C
Vol. 115 (2011) pp.944-951. 45. Y.-H. Chin, C. Buda, M. Neurock and E. Iglesia, J. Am. Chem. Soc. Vol. 133 (2011) pp.15958-
15978. 46. P. Hurtado, S. Ordóñez, A. Vega and F.V. Dìez, Chemosphere Vol. 55 (2004) pp.681-689. 47. V. Dupont, J.M. Jones, S.-H. Zhang, A. Westwood and M.V. Twigg, Chem. Eng. Sci. Vol. 59
(2004) pp.17-29. 48. G. Corro, C. Cano and J.L. Garcia Fierro, Catal. Comm. Vol. 9 (2008) pp.2601-2605. 49. L. Kylhammar, P.-A. Carlsson and M. Skoglundh, J. Catal. Vol. 284 (2011) pp.50-59. 50. I. Chorkendorff and J.W. Niemantsverdriet, Concepts of Modern Catalysis and Kinetics, Wiley-
VHC, Weinheim, (2003) pp.177-182. 51. G.M. Schwab, Disc. Far. Soc. Vol. 8 (1950) pp.166-171. 52. M. Boudart and G. Djega-Mariadassou, Kinetic of Heterogeneous Catalytic Reactions,
Princeton University Press, Princeton (1984). 53. S.J. Tauster, S.C. Fung and R.L. Garten, J. Amer. Chem. Soc. Vol. 100 (1978) pp.170-175. 54. P. Mariaudeau, J.F. Dutel, M. Dufaux and C. Naccache, Metal-Support and Metal-Additive
Effects in Catalysis, Elsevier, Amsterdam (1982) pp.95-104. 55. S. Bernal, J.J. Calvino, M.A. Cauqui, J.M. Gatica, C. Larese, J.A. Pérez Omil and J.M. Pintado,
Catal. Today Vol. 50 (1999) pp.175-206. 56. W.C. Jr. Conner and J.L. Falconer, Chem. Rev. Vol. 95 (1995) pp.759-788. 57. H.S. Gandhi, G.W. Graham and R.W. McCabe, J. Catal. Vol. 216 (2003) pp.433-442. 58. R.J. Gorte, L.D. Schmidt and J.L. Gland, Surf. Sci. Vol. 109 (1981) pp.367-380. 59. D.T. Wickham, B.A. Banse and B.E. Koel, Surf. Sci. Vol. 243 (1991) pp.83-95. 60. B. Harrison, A.F. Didwell and C. Hallett, Platinum Metals Rev. Vol. 32 (1988) pp. 73-83. 61. G. Fisher, J. Theis, M. Casarella and S. Mahan, SAE 931034 (1993). 62. R.J. Farrauto and R.M. Heck, Catal. Today Vol. 51 (1999) pp.351-360.

30
63. T. Murota, T. Hagasawa, S. Aozasa, H. Matsui and M. Motoyama, J. Alloys Comp. Vol. 193
(1993) pp. 298. 64. P. Fornasiero, R. DiMonte, G.R. Rao, J. Kaspar, S. Meriani, A. Trovarelli and M. Graziani, J.
Catal. Vol. 151 (1995) pp.168-177. 65. D. Duprez, C. Descorme, T. Birchem and E. Rohart, Top. Catal. Vols. 16/17 (2001) pp.49-56. 66. A. Punke, U. Dahle, S. Tauster, H. Rabinowitz and T. Yamada, SAE 950255 (1995). 67. Z. Hu, C.Z. Wan, Y.K. Lui, J. Dettling and J.J. Steger, Catal. Today Vol. 30 (1996) pp.83-89. 68. M. Skoglundh and E. Fridell, Top. Catal. Vol. 28 (2004) pp.79-87. 69. H. Yamamoto and H. Uchida, Catal. Today Vol. 45 (1998) pp.147-151. 70. P.-A. Carlsson and M. Skoglundh, Appl. Catal. B: Environ. Vol. 101 (2011) pp.669-675. 71. H. Muraki, H. Shinjoh, H. Sobukawa, K. Yokota and Y. Fujitani, Ind. Eng. Chem. Prod. Res.
Dev. Vol. 24 (1985) pp.43-49. 72. K. Cho, Ind. Eng. Chem. Res. Vol. 27 (1988) pp.30-36. 73. L. Padeste and A. Baiker, Ind. Eng. Chern. Res. Vol. 33 (1994) pp.1113-1119. 74. S. Tagliaferri, R.A. Köppel and A. Baiker, Appl. Catal. B: Environ. Vol. 15 (1998) pp.159-177. 75. M. Skoglundh, P. Thormählen, E. Fridell, F. Hajbolouri and E. Jobson, Chem. Eng. Sci. Vol. 54
(1999) pp.4559-4566. 76. P. Koci, M. Kubicek and M. Marek, Catal. Today Vol. 98 (2004) pp.345-355. 77. R. Burch and P.K. Loader, Appl. Catal. A: Gen. Vol. 122 (1995) pp.169-190. 78. E. Becker, P.-A. Carlsson and M. Skoglundh, Top. Catal. Vol. 52 (2009) pp.1957-1961. 79. G. Corro, C. Cano and J.L. Garcia Fierro, J. Mol. Catal. A: Chem. Vol. 281 (2008) pp.179-183. 80. R. Burch, E. Halpin, M. Hayes, K. Ruth and J.A. Sullivan, Appl. Catal. B: Environ. Vol. 19
(1998) pp.199-207. 81. J. Brunelle, Pure Appl. Chem. Vol. 50 (1978) pp.211-232. 82. D.W. Jr. Johnson, P.K. Gallagher, F.J. Schnettler and E.M. Vogel, Ceram. Bull. Vol. 56 (1977)
pp.758. 83. S. Brunauer, P.H. Emmett and E. Teller, J. Am. Chem. Soc. Vol. 60 (1938) pp.309-319. 84. P. Scherrer, Nachr. Ges. Wiss. Göttingen Vol. 26 (1918) pp.98-100. 85. O. Scherzer, J. Appl. Phys. Vol. 20 (1949) pp.20-29.

31
86. D.E. Jesson and S.J. Pennycook, Proc. R. Soc. Lond. A Vol. 449 (1995) pp.273-293. 87. C. Brinkmeier, PhD thesis, ICVT Stuttgart (2006). 88. C. Wang-Hansen, C.J. Kamp, M. Skoglundh, B. Andersson and P.-A. Carlsson, J. Phys. Chem.
C Vol. 115 (2011) pp.16098–16108. 89. U. Tegtmeyer, H.P. Weiss and R. Schlögl, Fresenius J. Anal. Chem. Vol. 347 (1993) pp.263-
268. 90. D. Bassi, P. Tosi and R. Schlögl, J. Vac. Sci. Technol. A Vol. 16 (1998) pp.114-122. 91. C.P. Sherman Hsu, Handbook of Instrumental Techniques for Analytical Chemistry, Settle
(1997) pp. 247-283. 92. J. W. Niemantsverdriet, Spectroscopy in catalysis: an introduction, Wiley-WCH, Weinheim
(2000) pp.201-210. 93. M.P. Fuller and P.R. Griffiths, Anal. Chem. Vol. 50 (1978) pp.1906-1910. 94. M.Q. Wang and H.S. Huang, ANL/ESD-40 (1999). 95. P. Castellazzi, G. Groppi, P. Forzatti, E. Finocchio and G. Busca, J. Catal. Vol. 275 (2010)
pp.218-227. 96. R. Burch, F.J. Urbano and P.K. Loader, Appl. Catal. A: Gen. Vol. 123 (1995) pp.173-184. 97. R.S. Monteiro, D. Zemlyanov, J.M. Storey and F.H. Ribeiro, J. Catal. Vol. 201 (2001) pp.37-
45. 98. S. Subramanian, R.J. Kudla and M.S. Chattha, Ind. Eng. Chem. Res. Vol. 31 (1992) pp.2460-
2465. 99. N.W. Hurst, S.J. Gentry, A. Jones and B.D. McNicol, Catal. Rev. Sci. Eng. Vol. 24 (1982)
pp.233-309. 100. S.C. Su, J.N. Carstens and A.T. Bell, J. Catal. Vol. 176 (1998) pp.125-135. 101. J.Y. Han, D.Y. Zemlyanov and F.H. Ribeiro, Surf. Sci. Vol. 600 (2006) pp.2752-2761. 102. M. Haneda, T. Mizushima and N. Kakuta, J. Phys. Chem. B Vol. 102 (1998) pp.6579-6587. 103. C. Bozo, E. Garbowski, N. Guilhaume and M. Primet, Stud. Surf. Sci. Catal. Vol. 130 (2000)
pp.581. 104. C. Bozo, N. Guilhaume and J.-M. Herrmann, J. Catal. Vol. 203 (2001) pp.393-406. 105. M. Boaro, F. Giordano, S. Recchia, V. Dal Santo, M. Giona and A. Trovarelli, Appl. Catal. B:
Environ. Vol. 52 (2004) pp.225-237. 106. M.V. Twigg, Catal. Today Vol. 117 (2006) pp.407-418.

32
107. D. Ciuparu, M.R. Liubovsky, E. Altman, L.D. Pfefferle and A. Datye, Catal. Rev. Vol. 44
(2002) pp.593-649. 108. J.N. Carstens, S.C. Su and A.T. Bell, J. Catal. Vol. 176 (1998) pp.136-142. 109. M. Lyubovsky and L. Pfefferle, Catal. Today Vol. 47 (1999) pp.29-44. 110. D. Ciuparu and L. Pfefferle, Appl. Catal. A: Gen. Vol. 218 (2001) pp.197-209. 111. W. Tang, Z. Hu, M. Wang, G.D. Stucky, H. Metiu and E.W. McFarland, J. Catal. Vol. 273
(2010) pp.125-137. 112. C. Li, Y. Chen, W. Li and Q. Xin, Stud. Surf. Sci. Catal. Vol. 77 (1993) pp.217-222. 113. R. Poisson, J.P. Brunelle and P. Nortier, Catalyst Supports and Supported Catalysts
Technology and Applied Concepts, Butterworths, Boston, (1987). 114. E. Xue, K. Seshan and J.R.H. Ross, Appl. Catal. B: Environ. Vol. 11 (1996) pp.65-79. 115. St. Astegger and E. Bechtold, Surf. Sci. Vol. 122 (1982) 491. 116. J.A. Dean, Lange’s Handbook of Chemistry, McGraw Hill Book Co., New York, NY (1985). 117. L. Olsson and E. Fridell, J. Catal. Vol. 210 (2002) pp.340-353. 118. J. Després, M. Elsener, M. Koebel, O. Kröcher, B. Schnyder and A. Wokaun, Appl. Catal. B:
Environ. Vol. 50 (2004) pp.73-82. 119. G. Corro, R. Montiel and C.L. V_azquez, Catal. Commun. Vol. 3 (2002) pp.533-539. 120. M. Skoglundh, A. Ljungqvist, M. Petersson, E. Fridell, N. Cruise, O. Augustsson and E.
Jobson, Appl. Catal. B: Environ. Vol. 30 (2001) pp.315-328. 121. E. Fridell, H. Persson, B. Westerberg, L. Olsson and M. Skoglundh, Catal. Lett. Vol. 66
(2000) pp.71-74. 122. S. Salasc, M. Skoglundh and E. Fridell, Appl. Catal. B: Environ. Vol. 36 (2002) pp.145-160. 123. M.Y. Smirnov, A.V. Kalinkin, A.V. Pashis, A.M. Sorokin, A.S. Noskov, K.C. Kharas and V.I.
Bukhtiyarov, J. Phys. Chem. B Vol. 109 (2005) pp.11712-11719. 124. O. Saur, M. Benistel, A.B.M. Saad, J.C. Lavelley, C.P. Tripp and B.A. Morrow, J. Catal. Vol.
99 (1986) pp.104-110. 125. C. Binet, A. Badri and J.-C. Lavalley, J. Phys. Chem. Vol. 98 (1994) pp.6392-6398.

Paper 1
Effect of periodic lean/rich switch on methane conversion over a Ce-Zr promoted Pd-Rh/Al2O3 catalyst in the exhausts of natural gas vehicles
D. Bounechada, G. Groppi, P. Forzatti, K. Kallinen and T. Kinnunen Accepted for publication in Applied Catalysis B: Environmental


1
Effect of periodic lean/rich switch on methane conversion over a Ce-Zr promoted Pd-Rh/Al2O3 catalyst in the exhausts of natural gas vehicles
Djamela Bounechada1, Gianpiero Groppi1*, Pio Forzatti1, Kauko Kallinen2, Toni Kinnunen2 1Dipartimento di Energia, Politecnico di Milano, 20133 Milano (Italy)
2Ecocat Oy, Typpitie 1, Oulu, 90620 (Finland) * Corresponding author. Tel.: +39 0223993258.
E-mail address: [email protected].
Abstract
The behaviour of a commercial Ce-Zr promoted Pd-Rh/Al2O3 catalyst for the abatement of methane from the exhausts of natural gas vehicles (NGVs) is studied in presence of large amounts of water under both stationary conditions and by periodically switching from lean to rich feed. Under stationary conditions with both stoichiometric (λ = 1.00) and lean (λ = 1.02) feed catalyst, deactivation is observed after prolonged exposure to the reaction mixture. Periodic rich pulses in a constant lean feed gas result in the stabilization of catalytic performances.
A higher methane conversion than that obtained with stoichiometric and lean feed mixtures is observed under rich conditions, during an experiment carried out by performing periodic lean pulses (λ = 1.02) in a constant rich feed gas (λ = 0.98). The analysis of reactant conversion and product distribution suggests that different chemistries are involved under lean and rich conditions. Only reactions of complete oxidation of H2, CO, CH4 and NO occur under excess of oxygen, whereas under rich conditions NO reduction, CH4 steam reforming and water gas shift also occur.
The effect of symmetric oscillation of the exhausts composition around stoichiometry is also addressed by periodically switching from slightly rich to slightly lean composition with different oscillation amplitudes (=±0.01; ±0.02; ±0.03). Higher and more stable methane conversion performances are obtained than those observed under constant λ operations. The presence of a more active mixed PdO/Pd° state is suggested to explain the enhancement of catalytic performances.
Keywords: Natural gas vehicle, methane oxidation, Pd-Rh based catalyst, periodic operation

2
1. Introduction
Natural gas vehicles (NGVs) have been introduced in the market since a long time. However, at present the low number of filling stations and the problems related to the storage of gaseous fuels limit their diffusion. Nevertheless, the use of compressed natural gas (CNG) in automotive applications is of wide interest primarily for the need to diversify energy sources and for the large worldwide resources of natural gas. Besides, NGVs represent a “green” alternative to gasoline and diesel engines because of the very low sulfur content and the reduced NOx and particulate emissions when operating under lean conditions. Furthermore CH4 (which is the main component of NG exhausts) has the highest hydrogen content, which allows achieving a reduction of CO2 per MJ emissions with respect to other hydrocarbon fuels. However, the abatement of unburned methane, which constitutes about 90% by volume of NG, still remains a demanding challenge in view of the 100 mg/km limit introduced in EU5/EU6 regulations for total hydrocarbon (THC), since the methane molecule is very stable and requires high temperatures to be oxidized.
Stoichiometric and lean burn combustion systems are commonly used in NGV, working respectively with a stoichiometric mixture of fuel and air and with an excess of oxygen [1]. The lean-burn technology guarantees an efficient fuel use and a reduction of CH4 emissions in comparison with stoichiometric engines. However it requires complex aftertreatment systems usually composed of a first catalyst for the oxidation of carbon containing compounds followed by a second catalyst for NOx reduction. On the contrary, the aftertreatment systems of the exhausts from stoichiometric engines are simpler, relying predominately on three-way catalysts (TWCs) technology adapted from gasoline applications. In both lean and stoichiometric systems noble metals are employed as active components, among which Pd is predominantly used due to its high activity in CH4 oxidation [2,3]. It is well known in the literature that the oxidation state of palladium plays a major role on CH4 oxidation activity of Pd catalysts [4]. Accordingly periodically oscillating lean/rich conditions, which are intrinsic in operation of TWCs and can be forced in operation strategies of lean systems [5], may seriously affect the emission abatement performances.
Although a large number of papers have been devoted to the study of TWCs under periodic operation, there is no agreement between the results: both improvements [6-10] and negative effect [11-13] in hydrocarbon conversion were found when working under oscillating conditions. However most of them refer to the exhausts of gasoline vehicles, largely represented by hydrocarbons of high molecular weight, which are relatively easy to oxidize, whereas only a few studies are devoted to periodic operation in the exhausts of NGVs [10].
In this work the activity of a commercial Ce-Zr promoted Pd-Rh/Al2O3 honeycomb catalyst was studied under stationary stoichiometric and lean conditions in presence of large amounts of water. The effect of periodic rich pulses in a constant lean gas mixture and periodic lean pulses in a constant rich gas mixture was also investigated. Symmetric oscillations of gas composition around

3
stoichiometry were also performed by periodically switching the feed from slightly rich to slightly lean compositions with different oscillation amplitudes.
2. Experimental
2.1. Catalyst
A commercial Pd-Rh based catalyst developed by Ecocat in the form of a 400 CPSI/6 mils washcoated ceramic honeycomb containing 7.1 g/l of Pd:Rh (39:1 of loading) has been used in this study. The washcoat material content referred to the geometric area of the catalyst is 50 g/m2. The catalyst coating consists of layered washcoat mainly containing stabilized Al2O3. In addition, Ce-Zr mixed oxide (Zr/Ce = 3.5) were used to improve the oxygen storage capacity (OSC) of the catalyst and transition metal compounds were used as stabilizers and promoters. The catalyst was prepared by mixing the washcoat materials with precursor salts in a water slurry and then coating to a layered structure.
2.2. Experimental setup
The experimental rig for reaction tests consists of 5 lines for the individual feeding of a multifuel mixture (composed of 3%vol. CH4, 12%vol. CO, 2%vol. H2 in N2), nitrogen monoxide (1.535%vol. NO in N2), air, carbon dioxide and nitrogen, all coming from cylinders. Each feed line is equipped with a programmable Brooks Instruments mass flow controller. Furthermore, a HPLC pump/evaporator system is used to feed H2O. H2O concentration was continuously monitored by means of a humidity sensor (Vaisala HUMICAPP – HMT334).
The desired lambda values were obtained by stepwise variations of oxygen concentration, according to the following expression derived from stoichiometric mass balances on a natural gas engine [14]:
42222
2242
42242334
2 ,
,
CHHCONOOairOHCO
NOOHCOCHairO
yyyyyyyyyyyyyy
(1)
where yi is the molar fraction of i species.
The individual gas streams were mixed, together with steam, immediately upstream the reaction section, where the lambda value was monitored by an ETAS LA4-4.9 Lambda Meter.
A standard feed gas mixture, representative of the typical exhausts composition from stoichiometric CNG [15], was used, consisting of 0.15 vol.% CH4, 0.6 vol.% CO, 0.1 vol.% H2, 0.13 vol.% NO, 0.58 vol.% O2, 10 vol.% H2O, 10.7 vol.% CO2 and balance N2 (see Tab. 1).

4
6x6 channels catalyst samples with a length of 1.3 cm and total volume of 0.832 cm3 were cut from the central part of the commercial catalyst and tested as detailed below. The total gas flow was 700 cm3/min at NTP in all the experiments, corresponding to a gas hourly space velocity (GHSV) of 50000 h-1 referred to the honeycomb catalyst volume.
The monolithic sample was placed inside a stainless steel tubular reactor (Fig. 1) externally heated by an oven. The upstream section of the reactor is filled by quartz spheres (2.6 mm of diameter) to allow complete mixing and preheating of gas feed. The sample was wrapped by a quartz wool tape and located in a properly designed holder to avoid by-pass phenomena.
A sliding thermocouple was inserted into one of the central channels of the monolith for the measurement of the axial gas temperature profile during the experiments. A second thermocouple was located immediately before the entrance of the monolith sample. A good reproducibility of the axial temperature profiles measured during steady state at the same experimental conditions was observed. Moreover, the axial profiles show a smooth maximum close to inlet section, likely associated with fast consumption of CO (and H2) which were completely converted at all the investigated temperatures. Overall temperature differences along the catalyst bed are within 10-15°C, i.e. much lower than the overall adiabatic temperature raise (92°C) of full reactants conversion, indicating that temperature effects are kept limited thanks to strong heat dispersion due to the small size of the catalyst sample. In the following, unless differently specified, monolith temperatures refer to the value measured by the sliding thermocouple immediately after the catalyst entrance.
The analysis of inlet and outlet gas composition was periodically accomplished using a Micro GC (3000 A, Agilent Technologies) equipped by TCD detectors, a Molecular Sieve 5 Å column for separation of N2, H2, O2, CH4 and CO (Ar carrier) and a Plot Q column for separation of CO2 and H2O. Furthermore, a UV spectrometer (ABB Limas-11HW) was installed for the continuous analysis of NO, NO2 and NH3. This was followed by a condenser for the abatement of NH3 and water and by a series of gas analysers (ABB A02020) for continuous monitoring of H2, O2, CH4, CO and CO2 outlet concentrations during testing under dynamic conditions. In particular, the analysis of H2, O2 and CH4-CO-CO2 was performed by using a thermal conductivity analyser (ABB Caldos-17), a paramagnetic analyser (ABB Magnos-106) and an IR spectrometer (ABB Uras-14), respectively. A periodic calibration was performed by means of sample gas with composition close to the feed one. The accuracy of the continuous gas analysers was within 0.25% and 1% of the calibration span gas. All the output of the analysers have been synchronized by taking into account the characteristic delay of any specific instrument calculated by means of blank experiments with concentration steps.
2.3. Catalytic activity tests
Before starting an experimental campaign, each monolithic sample underwent a conditioning treatment (degreening) in a stoichiometric flow mixture for 5h @ Toven = 600°C.

5
After degreening, nearly isothermal experiments were carried out under stationary stoichiometric (λ = 1.00) and lean (λ = 1.02) conditions. During this type of experiment the reaction mixture was fed to the reactor after preheating the oven at 200°C in order to avoid water condensation; then the heating of the catalyst was accomplished under the reaction mixture, until reaching an almost stationary temperature (Toven = 450°C). This temperature was kept constant for at least 30 minutes, during which the activity was recorded. This procedure was repeated after several hours of time on stream, to check the activity of the catalyst after prolonged exposure to the reaction mixture at different conditions.
The same procedure was adopted over a fresh catalyst sample to perform tests under both periodic pulses and symmetric oscillating λ conditions at an almost stationary oven temperature (450°C). Periodic pulses were accomplished by performing every 5 minutes 10 seconds long rich (or lean) pulses (λ = 0.98 and 1.02, respectively) on a stationary lean (or rich) feed gas mixture (λ = 1.02 and 0.98, respectively), as shown in Fig. 2a and b. Lambda changes were obtained by switching the O2 concentration from 0.20% (λ = 0.98) to 0.95% (λ = 1.02).
As regarding the symmetric oscillating experiments, lambda oscillation amplitudes around stoichiometry between ±0.01 and ±0.03 at constant cycle period (60 s) have been investigated (Fig. 2c). λ oscillations were obtained by periodically switching the set point of the oxygen mass flow controller, to values corresponding to an oxygen concentration oscillating between 0.38-0.76 vol.% (λ = 1±0.01), 0.2-0.95 vol.% (λ = 1±0.02) and 0-1.14 vol.% (λ = 1±0.03), respectively. The changes in the oxygen concentration were compensated by simultaneously switching N2 feed flow, so that a constant total gas flow of 700 cm3/min was maintained during periodic operations.
A sequence of experiments at different temperatures (in the range 200-550°C) was also performed under stationary rich conditions (λ = 0.967, absence of both O2 and NO). The reaction mixture was fed to the reactor after preheating the oven at 200°C, and then the reaction temperature was kept constant at 200°C for the time needed to reach a steady state outlet composition (30 min). Then, the catalyst was heated by imposing an increase of 50°C (10°C/min heating rate) in the oven temperature until a new steady state was reached. This procedure was repeated by imposing 50°C temperature steps until reaching a maximum oven temperature of 550°C.
3. Results and discussion
3.1. Testing under stationary lean and stoichiometric conditions
The methane combustion activity of the commercial Ce-Zr promoted Pd-Rh/Al2O3 catalyst provided by Ecocat was measured in a nearly isothermal experiment performed at stationary λ = 1.00 and Toven = 450°C; this corresponds to a measured temperature just after the monolith entrance of about 470°C, in view of the exothermicity of the reactions. CH4 conversion is plotted as a function of time in Fig. 3. A decrease in CH4 conversion is observed, passing from 52 to 43% after

6
30 min. Furthermore, after prolonged exposure to the reaction mixture (11.5 hours of operation at different temperatures), the same experiment at λ = 1.00 and Toven = 450°C was repeated and 15% of methane conversion was registered, which proves that the deactivation process went on to a significant extent.
A similar experiment was performed under stationary slightly lean conditions (λ = 1.02). The results, reported on the same figure (Fig. 3), show again a decrease in CH4 conversion, even if minor, passing from 62 to 59% after 30 min. Moreover, after prolonged exposure to the lean reaction mixture (90 hours of operation at different temperatures), methane conversion stabilizes around 10%, showing that the deactivation process proceeded as well under lean conditions to a significant extent.
It is worth to note that when working under lean conditions a higher activity for methane oxidation is obtained in comparison with the stoichiometric case (Fig. 3). This effect is likely ascribable to a positive effect of oxygen concentration when working close to stoichiometric conditions [10].
The decay in methane conversion observed at λ = 1.00 could be explained by reduction of palladium oxide due to the low oxygen partial pressure. In fact, the active form of palladium for low temperature oxidation of methane is considered to be either the oxide or a mixture of oxide and metal [16-18], as also confirmed by more recent EXAFS studies [19,20]. However, the reduction of palladium oxide in a stoichiometric atmosphere is unlikely since the catalyst contains oxygen storage materials which can act as oxygen buffer.
Furthermore, catalyst deactivation is also observed under excess of oxygen, as shown by the data collected at λ = 1.02, when a substantial reduction of palladium can be reasonably excluded.
Different mechanisms have been proposed in literature to explain the deactivation under stationary lean wet conditions over Pd-based catalysts, all invoking a negative effect of H2O. Cullis et al. [21] attributed the deactivation to the formation of inactive Pd(OH)2. Along similar lines Ciuparu et al. [22-25] by isotopic studies and FTIR measurements evidenced the formation of strongly bound hydroxyls from methane dissociation during combustion reaction over Pd based catalysts. Thus, assuming that the first H abstraction occurs on a Pd-O pair, the origin of catalyst deactivation could be the blockage of the first H abstraction by stable surface hydroxyls. Finally, a different explanation was provided by Monteiro et al. [26] who associated the deactivation in the presence of water with the surface smoothening of PdO crystallites after reaction in excess of O2, in line with previous literature suggestion [17,27]: the consequent decrease of active surface could account for catalyst deactivation.
In order to check the reversibility of the observed catalyst deactivation, an experiment was designed in view of a recent work by Arosio et al. [28,29] where deactivation due to exposure to H2O containing atmosphere was completely reversed upon reduction/oxidation cycles of Pd particles. The experiment was performed at an oven temperature of 450°C by carrying out a 10 s rich pulse after one hour of time on stream under constant lean conditions: CH4 conversion is reported in Fig. 4. An appreciable deactivation is observed during the first hour of time on stream (from 62% to 58% of CH4 conversion), whereas after the rich pulses the methane conversion is carried back to its

7
initial value, which proved that the deactivation process is reversible under periodic rich pulses due either to decomposition of Pd(OH)2 [28] and/or to roughening of the newly formed PdO surface [26].
3.2. Effect of periodic lambda variations during lean-rich operation
An experiment was carried on over the Pd/Rh-based catalyst at an oven temperature of 450°C by performing periodic 10 s long rich pulses (λ = 0.98) every 5 minutes in a stationary lean feed gas mixture (λ = 1.02). Experimental results in terms of CH4 conversion, O2-H2-CO and NO-NO2-NH3 outlet molar fractions are shown in Fig. 5a-c.
Under lean conditions, after a minimum following each rich pulse (60%), CH4 conversion increases till approaching an asymptotic value around 64% (Fig. 5a) while H2 (Fig. 5b) and CO (not shown) are completely converted. Overall these data confirm the stabilization effect obtained by performing periodic rich pulses. It is also worth of note that about 45% of O2 is converted (Fig. 5b), whereas only a small fraction (20%) of NO is consumed, accompanied by NO2 formation (0.006%), while NH3 is not detected (Fig. 5c).
Positive peaks in CH4 conversion appear during each rich pulse (see panel a) paralleled by negative peaks of O2 and NO outlet molar fraction. Simultaneously the appearance of small amounts of H2
and NH3 occurs. It is worth noting that, since the characteristic time of the ABB gas analysers is higher than the pulse duration (10 s), the real changes in composition during rich pulses are wider than those shown in Fig. 5 a-c.
In order to obtain a deeper insight into the behaviour of the catalyst under rich conditions an experiment was carried out at a Toven = 450°C by performing periodic 10 s long lean pulses (λ = 1.02) every 5 minutes in a stationary rich feed gas mixture (λ = 0.98). Results in terms of CH4 conversion, O2-H2-CO and NO-NO2-NH3 outlet molar fractions are shown in Fig. 5d- f.
The catalyst undergoes deactivation during the stationary rich period, CH4 conversion decreasing from 85 to 81% (Fig. 5d), which is however significantly higher than conversion under lean and stoichiometric conditions, in line with previous results from Subramanian et al. [30]. Besides, it is worth noticing the presence of CO (0.054%) in the outlet mixture, together with a net production of H2 (0.472% vs. 0.1% fed, Fig. 5e) and NH3 (0.054%, Fig. 5f) under rich conditions. On the opposite, NO and O2 are completely consumed. The fact that H2 is not consumed, but is rather produced under rich conditions suggests that a different chemistry should be involved under an oxygen deficient atmosphere; steam reforming and water gas shift have to be considered in order to explain hydrogen formation, as it will be discussed in the following. During lean pulses negative peaks of CH4 conversion are observed while CO and H2 are almost completely converted, NH3 is absent and positive peaks of NO and O2 are detected.
The different product distributions observed under lean and rich conditions could be explained as follows. For λ = 1.02 all the converted CH4, CO and H2 react with oxygen according to the

8
stoichiometries of complete oxidation to CO2 and H2O. Besides, since a small fraction of the inlet NO is converted and NO2 is detected at the reactor outlet, NO is partially oxidized to NO2.
On the opposite, under rich conditions NO is fully consumed, whereas CO is still present and a net production of H2 and NH3 is obtained. In order to explain the formation of NH3, the following stoichiometries could be proposed [31-34]:
OHNHHNO 23225 (2)
2322 2212 CONHOHHCONO (3)
Since NH3 production is about 40% of NO consumption, the remaining fraction of NO could likely be reduced to N2 or N2O by H2, CO and CH4 [35,36].
Finally the net production of hydrogen under fuel-rich conditions can be explained by the occurrence of steam reforming (SR) and water-gas shift (WGS) reactions:
224 3HCOOHCH (4)
222 HCOOHCO (5)
3.3. Operations under symmetric periodic lambda oscillations
In order to investigate the effect of periodic operation on methane conversion an experiment was performed at an oven temperature of 450°C with lambda symmetrically oscillating around the stoichiometric value (λ = 1 ± 0.02). A cycle period of 60 s has been used, so to avoid a significant dumping of oscillation measurements due to the characteristic times of the analysis system. The results of this experiment are reported in Fig. 6a, b and c in terms of CH4 conversion, O2-H2-CO and NO-NO2-NH3 outlet molar fractions, respectively. Oscillations in the CH4 conversion between 58-88% and in the outlet molar fractions of O2 (0-0.480%), H2 (0-0.454%), CO (0-0.047%), NO (0-0.106%), NO2 (0-0.006%) and NH3 (0-0.056%) were observed. It is worth noticing that the boundary values obtained during symmetric lambda oscillations for all the observed species are close to the values detected under rich and lean conditions in the periodic pulse experiments described above (see Fig. 5).
Another experiment was performed at Toven = 450°C by changing every 40 minutes the amplitude of lambda oscillation (= ±0.01, ±0.02 and ±0.03) and by keeping a constant cycle period (t = 60 s). CH4 conversion trends are shown in Fig. 7a. Marked oscillations in CH4 conversion are well evident with amplitude increasing with decreasing the extent of variations. Calculated cycle average CH4 conversion and H2 and CO outlet molar fractions are reported in Fig. 7b. A maximum in average CH4 conversion (69%) is obtained working with an oscillation amplitude of ±0.02, a slightly lower value (64%) is measured for ∆λ = ±0.01, whereas a more pronounced decrease of CH4 conversion (56%) is observed for ∆λ = ±0.03. On the other hand, a linear increase in both H2 and CO outlet molar fractions is observed while increasing the oscillation amplitude and a similar

9
trend is also observed for NH3 formation (not shown). It is worth to note that when operating with symmetric lambda oscillations around stoichiometry the cycle average methane conversions are more stable and higher than those obtained working under stationary stoichiometric (λ = 1.00) conditions (52%, see Fig. 3).
In order to better clarify the phenomena occurring during periodic operations it can be useful to look into details the single lean/rich cycle in terms of both outlet mixture composition and monolith temperature measured just after the monolith entrance. Panels a, b and c of Fig. 8 report O2-H2-CO and CH4 outlet molar fractions and monolith temperature during periodic symmetric lambda oscillations for λ = 1 ± 0.01, λ = 1 ± 0.02 and λ = 1 ± 0.03, respectively. In the following analysis one should take into account that the characteristic time of the analysis system causes the smoothing of an original square signal, as it has been demonstrated by blank experiments.
The inspection of the outlet gas composition shows that the oscillation amplitude of outlet O2, H2 and CO concentration increases with the amplitude of lambda oscillation (top panels in Fig. 8). Oxygen is always antiphase with hydrogen and carbon monoxide; similarly NOx, which are in phase with O2, are antiphase with ammonia (not shown). It is worth noting that a delay in the oxygen outlet concentration is observed when passing from rich to lean conditions (e.g. at 330 s in Fig. 8b, top panel). Similarly a delay in the H2 and CO outlet concentrations occurs when passing from lean to rich (e.g. at 360 s in Fig. 8b, top panel).
The observed delays can be explained considering that both palladium and ceria can undergo oxidation/reduction processes when switching forth and back from rich to lean mixtures.
When passing from the lean to the rich atmosphere, reduction of PdO by H2, CO and CH4 can take place, according to the following reactions:
OHPdHPdO 22 (6)
2COPdCOPdO (7)
OHCOPdCHPdO 224 44 (8)
Since reactions (6)-(8) are fast, it is likely that H2, CO and CH4 reduce the PdO particles in a shellwise manner according to a shrinking core mechanism [37,38]. Ce4+ → Ce3+ reduction is also possible, due to the higher redox potential of the couple than that of the Pd2+/Pd° couple [39]. However, ceria reduction is likely to occur via hydrogen dissociation on Pd and its successive spillover to the support [40,41], thus being a consecutive process with respect to reduction of palladium. Therefore, the observed delays in the H2 and CO outlet concentrations can be explained by the consumption of these reagents according to reactions (6) and (7) immediately after the switch from lean to rich conditions. On the opposite, a delay in CH4 outlet concentration cannot be appreciated because methane is not completely consumed during the lean phase (Fig. 8, central panels).
Similarly, when passing from the rich to the lean phase, metallic Pd is likely oxidized according to the following stoichiometry:

10
PdOOPd 221 (9)
where O2 could come directly from the gas phase [38,42] or from ceria lattice [43]. The occurrence of reaction (9), in concomitance with Ce3+ reoxidation [44], could therefore explain the observed delay in the O2 outlet concentration when switching from rich to lean conditions.
Notice that this description could be even further complicated by the presence of a front of palladium (and cerium) oxidation/reduction along the axial coordinate of the monolithic sample during the lean/rich cycles [45].
Surprisingly, in contrast with O2, H2 and CO, the oscillation amplitude of outlet CH4 concentration decreases on increasing the amplitude of lambda oscillation (Fig. 8, central panels).
For λ = 1±0.01 when switching from rich to lean conditions, the CH4 outlet molar fraction increases until reaching a maximum value (0.081%), corresponding to a conversion minimum of 46%. Then, when passing from the lean to the rich phase, a nearly specular decrease in the methane concentration is observed until reaching a minimum value (0.013%), which corresponds to a conversion maximum of 91%.
Similar trends of methane concentrations are observed for λ = 1±0.02, the boundary values for the lean and the rich phases being 0.073% and 0.023% (corresponding to 51% and 85% of CH4 conversion), respectively.
The dynamic of outlet CH4 concentration in the case of λ = 1±0.03 is more complex. A slight decrease is observed when switching from rich to lean conditions until reaching a value of 0.069% (corresponding to 54% CH4 conversion). On the other hand when passing from the lean to the rich phase the CH4 outlet concentration first decreases down to a minimum of 0.047% (corresponding to 69% CH4 conversion) while CO and H2 concentration keeps at zero. Then CH4 concentration starts to increase up to a maximum of 0.077% (corresponding to 48% CH4 conversion), and H2 and CO are detected. Therefore the maximum and the minimum CH4 conversions are obtained at the beginning and at the end of the rich phase, respectively, whereas an intermediate value is reached during the lean phase. Since in this case oxygen is not present in the rich phase, the initial decrease in the CH4 outlet concentration is likely due to the occurrence of PdO reduction by CH4 according to reaction (8) along with reaction (6) and (7), which are responsible for complete CO and H2 consumption.
It is worth noting that the values of CH4 conversion reached during the lean phase increase with λ (46%, 51% and 54% at λ = 1.01, 1.02 and 1.03, respectively). In all the cases complete conversion of CO and H2 is achieved (top panels), and a similar monolith temperature (around 470°C) was measured at the end of the lean phase (bottom panels). This is in line with the effect of O2 on CH4 conversion observed in the experiments at constant λ (Fig. 3), confirming that under lean conditions, but in proximity of the stoichiometric composition, CH4 combustion kinetics has a slightly positive reaction order in O2 concentration [10].
Also CH4 conversion levels reached during the rich phase markedly increase with λ (48%, 85% and 91% at λ = 0.97, 0.98 and 0.99, respectively). However, when oscillating around stoichiometry with

11
limited λ variations (±0.01 and ±0.02), CH4 conversion obtained during the rich phase is markedly higher than during the lean one. A simple explanation for this behaviour could rely on palladium reduction during the rich phase, complete O2 (and NO) consumption by oxidation of H2 and CO followed by steam reforming of CH4 over Pd metal, this latter reaction being faster than CH4 combustion under oxidising conditions. But data obtained with larger λ oscillations (±0.03), when O2 is absent in the rich phase, show an opposite trend with higher CH4 conversion in the lean than in the rich phase. Such evidence seems to rule out the hypothesis of higher steam reforming activity under reducing conditions with respect to CH4 oxidation under oxidising conditions and suggests a major role of O2 in CH4 conversion even during the rich phase.
However data interpretation could be biased by thermal effects. In fact inspection of bottom panels in Fig. 8 evidences that temperature measured inside the monolith at the end of the rich phase significantly increases with λ (T = 448°C, 466°C and 476°C at λ = 0.97, 0.98 and 0.99, respectively). Such a trend is consistent with the overall exothermicity of the reaction process, which obviously increases with the O2 content and could explain the slightly different conversions observed at λ = 0.98 and 0.99. Noteworthy at λ = 0.97, i.e. in the absence of O2, the temperature is markedly lower than in the corresponding lean phase (Fig 8c, bottom panel), thus being partly responsible of the observed decrease of CH4 conversion when switching from lean to rich conditions.
In order to obtain further evidences on the relevance of SR and WGS reactions over the Pd/Rh-based catalyst, a sequence of tests was performed at different temperatures under stationary rich conditions (λ = 0.967) in the absence of both O2 and NO. Steady state values of CH4, CO and H2 outlet molar fractions are reported in Fig. 9 versus the monolith temperature. A decrease in CO molar fraction is detected starting from 335°C, accompanied by an equimolar increase in H2 outlet concentration suggesting that WGS reaction occurs. A minimum of CO concentration (0.116%) is reached at 435°C, approaching thermodynamic equilibrium of WGS. It is worth noticing that at 435°C also methane concentration starts to decrease due to the onset of steam reforming. At higher temperatures CO and H2 outlet molar fractions increase while CH4 is rapidly consumed indicating that steam reforming effectively occurs, being likely promoted by Ce-Zr oxide [39] and Rh [46], which are included in catalyst formulation.
Interpolation of data of CH4 outlet concentration provides an estimate of about 0.014% at 448°C, corresponding to 24% of CH4 conversion, which is quite lower than 48% reached during the rich phase in symmetric periodic oscillation experiments with λ = 1 ± 0.03. This suggests a significant role of NO in CH4 conversion at λ = 0.97, likely involving Rh [46,47]. Similarly an estimate of 0.083% in pure steam reforming conditions at 470°C is obtained, corresponding to 45% of CH4 conversion, which is much lower than 85-90% achieved under rich conditions during symmetric periodic oscillation experiments with λ= 1 ± 0.01 and λ = 1 ± 0.02, confirming that O2 plays a major role in CH4 conversion under slightly rich operations.
A promoting role of O2 on CH4 conversion could be ascribed to the occurrence of direct combustion reaction, but this is unlikely due to competition with much more reactive CO and H2, which at λ=0.98 are present in a significant excess with respect to complete O2 (and NO) consumption.

12
Alternatively, the higher conversion values observed in the presence of O2 could be explained by the formation of a more active mixed PdO/Pd° state, possibly promoted by the presence of Ce-Zr-O, at least in the first section of the monolith bed where O2 has not been yet totally consumed. Although the discussion about which state of palladium, metallic [16,48-53] or oxide [17,54-61], is the most active towards CH4 combustion is still open, some evidences that the copresence of the two phases has a positive effect on the catalyst performance have been reported by several authors [4,18,62-64]. The presence of a more active mixed PdO/Pd° state rather than a fully oxidised one could be also responsible for the CH4 conversion enhancement observed when switching from the lean to the rich phase at small amplitude and of stabilisation of performances by periodic reducing pulses during stationary lean operation.
4. Conclusions
The performances of a commercial Ce-Zr promoted Pd-Rh/Al2O3 catalyst have been studied under both stationary and periodically switching lean/rich conditions.
Results show that operations under stationary lambda conditions lead to progressive decrease of CH4 conversion. Activity can be recovered by performing periodic rich pulses in a stationary lean feed gas mixture.
Higher and more stable average methane conversions than those obtained under constant λ (lean and stoichiometric) operations are reached when performing symmetric λ oscillations around stoichiometry. It is suggested that the higher conversion performances observed during oscillating conditions could be ascribable to the presence of a more active mixed PdO/Pd° state, but further spectroscopic investigations are needed to provide evidence about this picture.
Acknowledgments
This study has been performed within the INGAS-project, financially supported by the European Commission FP7 Programme (Proj. no. 218447), which is gratefully acknowledged.

13
References
[1] S.R. King, Technol. Today 20 (1992).
[2] P. Gélin, M. Primet, Appl. Catal. B: Environ. 39 (2002) 1-37.
[3] P. Gélin, L. Urfels, M. Primet, E. Tena, Catal. Today 83 (2003) 45-57.
[4] D. Ciuparu, M.R. Lyubovsky, E. Altman, L.D. Pfefferle, A. Datye, Catal. Rev. 44 (2002) 593-649.
[5] J.K. Lampert, M.S. Kazi, R.J. Farrauto, SAE 961971 (1996) 15-20.
[6] H. Muraki, H. Shinjoh, H. Sobukawa, K. Yokota, Y. Fujitani, Ind. Eng. Chem. Prod. Res. Dev. 24 (1985) 43-49.
[7] K. Cho, Ind. Eng. Chem. Res. 27 (1988) 30-36.
[8] L. Padeste, A. Baiker, Ind. Eng. Chern. Res. 33 (1994) 1113-1119.
[9] M. Skoglundh, P. Thormahlen, E. Fridell, F. Hajbolouri, E. Jobson, Chem. Eng. Sci. 54 (1999) 4559-4566.
[10] F. Klingstedt, A.K. Neyestanaki, R. Byggningsbacka, L.E. Lindfors, M. Lunden, M. Petersson, P. Tengstrom, T. Ollonqvist, J. Vayrynen, Appl. Catal. A: Gen. 209 (2001) 301-316.
[11] P.L. Silveston, Catal. Today 25 (1995) 175-195.
[12] L.L. Hegedus, J.C. Summers, J.C. Schlatter, K. Baron, J. Catal. 56 (1979) 321-335.
[13] J.C. Schlatter, R.M. Sinkevitch, P.J. Mitchell, Ind. Eng. Chem. Prod. Res. Dev. 22 (1983) 51-56.
[14] C. Brinkmeier, PhD thesis, ICVT Stuttgart (2006).
[15] M.Q. Wang, H.S. Huang, ANL/ESD-40, December 1999
[16] S.H. Oh, P.J. Mitchell, R.M. Siewert, J. Catal. 132 (1991) 287-301.
[17] R. Burch, F.J. Urbano, Appl. Catal. A: Gen. 124 (1995) 121-138.
[18] J.N. Carstens, S.C. Su, A.T. Bell, J. Catal. 176 (1998) 136-142.
[19] H. Yoshida, T. Nakajima, Y. Yazawa, T. Hattori, Appl. Catal. B: Environ. 71 (2007) 70-79.
[20] M. Santhosh Kumar, M.H. Aguirre, A. Weidenkaff, D. Ferri, J. Phys. Chem. C 114 (2010) 9439-9443.
[21] C.F. Cullis, T.G. Nevell, D.L. Trimm, J. Chem. Soc. Faraday Trans. 68 (1972) 1406-1412.
[22] D. Ciuparu, L. Pfefferle, Appl. Catal. A: Gen. 209 (2001) 415-428.
[23] D. Ciuparu, N. Katsikis, L. Pfefferle, Appl. Catal. A: Gen. 216 (2001) 209-215.
[24] D. Ciuparu, L. Pfefferle, Catal. Today 77 (2002) 167-179.

14
[25] D. Ciuparu, E. Perkins, L. Pfefferle, Appl. Catal. A: Gen. 263 (2004) 145-153.
[26] R.S. Monteiro, D. Zemlyanov, J.M. Storey, F.H. Ribeiro, J. Catal. 201 (2001) 37-45.
[27] D.L. Mowery, M.S. Graboski, T.R. Ohno, R.L. McCormick, Appl. Catal. B: Environ. 21 (1999) 157-169.
[28] F. Arosio, S. Colussi, A. Trovarelli, G. Groppi, Appl. Catal. B: Environ. 80 (2008) 335-342.
[29] P. Castellazzi, G. Groppi, P. Forzatti, E. Finocchio, G. Busca, J. Catal. 275 (2010) 218-227.
[30] S. Subramanian, R.J. Kudla, M.S. Chattha, Ind. Eng. Chem. Res. 31 (1992) 2460-2465.
[31] B.E. Nieuwenhuys, Adv. Catal. 44 (2000) 259.
[32] M.L. Unland, J. Catal. 31 (1973) 459-465.
[33] N.W. Cant, D.C. Chambers, I.O.Y. Liu, Catal. Today 93-95 (2004) 761-768.
[34] R.J.H. Voorhoeve, L.E. Trimble, D.J. Freed, Science 200 (1978) 759-761.
[35] M. Salaun, A. Kouakou, S. Da Costa, P. Da Costa, Appl. Catal. B: Environ. 88 (2009) 386-397.
[36] R. Marques, S. Capela, S. Da Costa, F. Delacroix, G. Djega-Mariadassou, P. Da Costa, Catal. Comm. 9 (2008) 1704-1708.
[37] N.W. Hurst, S.J. Gentry, A. Jones, B.D. McNicol, Catal. Rev. Sci. Eng. 24 (1982) 233-309.
[38] S.C. Su, J.N. Carstens, A.T. Bell, J. Catal. 176 (1998) 125-135.
[39] A. Trovarelli, Catal. Rev. Sci. Eng. 38 (1996) 439-520.
[40] C. Bozo, E. Garbowski, N. Guilhaume, M. Primet, Stud. Surf. Sci. Catal. 130 (2000) 581.
[41] C. Bozo, N. Guilhaume, J.-M. Herrmann, J. Catal. 203 (2001) 393-406.
[42] J.Y. Han, D.Y. Zemlyanov, F.H. Ribeiro, Surf. Sci. 600 (2006) 2752-2761.
[43] M. Haneda, T. Mizushima, N. Kakuta, J. Phys. Chem. B 102 (1998) 6579-6587.
[44] M. Boaro, F. Giordano, S. Recchia, V. Dal Santo, M. Giona, A. Trovarelli, Appl. Catal. B: Environ. 52 (2004) 225-237.
[45] B. Kimmerle, A. Baiker, J.-D. Grunwaldt, Phys. Chem. Chem. Phys. 12 (2010) 2288-2291.
[46] S. Tagliaferri, R.A. Köppel, A. Baiker, Appl. Catal. B: Environ. 15 (1998) 159-177.
[47] M.V. Twigg, Catal. Today 117 (2006) 407-418.
[48] R.F. Hicks, H. Qi, M.L. Young, R.G. Lee, J. Catal. 122 (1990) 280-294.
[49] S.H. Oh, P.J. Mitchell, Appl. Catal. B: Environ. 5 (1994) 165-179.
[50] M.R.A. Blomberg, P.E.M. Siegbahn, M. Svensson, J. Phys. Chem. 98 (1994) 2062-2071.
[51] M.R.A. Blomberg, P.E.M. Siegbahn, M. Svensson, J. Phys. Chem. 96 (1992) 5783-5789.

15
[52] E. Broclawik, R. Yamauchi, A. Endou, M. Kubo, A. Miyamoto, J. Chem. Phys. 104 (1996) 4098-4105.
[53] E. Broclawik, R. Yamauchi, A. Endou, M. Kubo, A. Miyamoto, Int. J. Quan. Chem. 61 (1997) 673-682.
[54] T.R. Baldwin, R. Burch, Appl. Catal. 66 (1990) 337-358.
[55] T.R. Baldwin, R. Burch, Appl. Catal. 66 (1990) 359-381.
[56] P. Briot, M. Primet, Appl. Catal. 68 (1991) 301-314.
[57] N. Mouaddib, C. Feumi-Jantou, E. Garbowski, M. Primet, Appl. Catal. A: Gen. 87 (1992) 129-144.
[58] R.J. Farrauto, M.C. Hobson, T. Kennelly, E.M. Waterman, Appl. Catal. A: Gen. 81 (1992) 227-237.
[59] E. Garbowski, C. Feumi-Jantou, N. Mouaddib, M. Primet, Appl. Catal. A: Gen. 109 (1994) 277-291.
[60] J.G. McCarty, Appl. Catal. A: Gen. 218 (2001) 197-209.
[61] R.J. Farrauto, J.K. Lampert, M.C. Hobson, E.M. Waterman, Appl. Catal. B: Environ. 6 (1995) 263-270.
[62] K. Fujimoto, F.H. Ribeiro, M. Avalos-Borja, E. Iglesia, J. Catal. 179 (1998) 431-442.
[63] M. Lyubovsky, L. Pfefferle, Catal. Today 47 (1999) 29-44.
[64] D. Ciuparu, L. Pfefferle, Appl. Catal. A: Gen. 218 (2001) 197-209.

16
CH4 CO H2 NO O2 H2O CO N2 λ GHSV
0.15 vol.%
0.6 vol.%
0.1 vol.%
0.13 vol.%
0-1.14 vol.%
10 vol.%
10.7 vol.%
Balance 0.97-1.03
50000 h-1
Tab. 1 - Standard mixture composition.

17
Fig. 1 - Stainless steel reactor.

18
Fig. 2 - Periodic pulses experiments accomplished by performing every 5 minutes a) 10 seconds long rich pulses (λ = 0.98) on a stationary lean feed gas mixture (λ = 1.02) and b) 10 seconds long
lean pulses (λ = 1.02) on a stationary rich feed gas mixture (λ = 0.98). c) Symmetric oscillating experiments: cycle periods of 60 s and lambda oscillation amplitudes between ±0.01 and ±0.03.
0 2 4 6 8 10 12 14 16
0,98
1,00
1,02
1,00
Time [min]
Lam
bda
[-]
a
5 min
10 sec
O2
O2
0 60 120 180 240 300
0,01-0,03
Time [s]
c
Lam
bda
[-]
O2
O2
0 2 4 6 8 10 12 14 16
0,98
1,00
1,02
O2
Time [min]
Lam
bda
[-]
b
O2
5 min
10 sec

19
Fig. 3 - Comparison between CH4 conversions under stationary lean (λ=1.02) and stoichiometric (λ=1.00) feed gas mixture, (Toven = 450°C).
0 5 10 15 20 25 3040
50
60
70
80
90
100
=1.00
Time [min]
CH
4 con
vers
ion
[%]
Toven
= 450°C
=1.02

20
Fig. 4 - Effect of a rich pulse (λ = 0.98) on CH4 conversions under stationary lean (λ = 1.02) feed gas mixture (Toven = 450°C).
0 20 40 60 80 100 12040
50
60
70
80
90
100
Time [min]
CH
4 con
vers
ion
[%]
Toven = 450°C
rich pulse

21
Fig. 5 - Periodic rich pulses (λ = 0.98, 10 s long every 5 min) on a stationary lean feed gas mixture (λ = 1.02): a) CH4 conversion, b) O2-H2-CO and c) NO-NO2-NH3 outlet molar fractions. Periodic lean pulses (λ = 1.02, 10 s long every 5 min) on a stationary rich feed gas mixture (λ = 0.98): d)
CH4 conversion, e) O2-H2-CO and f) NO-NO2-NH3 outlet molar fractions.
40
50
60
70
80
90
100 d
CH
4 con
vers
ion
[%]
a
0,0
0,1
0,2
0,3
0,4
0,5
0,6
O2
H2CO
b
Mol
ar fr
actio
n [%
]
H2
O2
e
0 5 10 15 20 25 300,00
0,03
0,06
0,09
0,12
NH3 NO2
NH3
NOc
Mol
ar fr
actio
n [%
]
Time [min]0 5 10 15 20 25 30
NOf
Time [min]

22
Fig. 6 - Symmetric λ oscillations (λ = 1 ± 0.02, t = 60 s): a) CH4 conversion, b) O2-H2-CO and c) NO-NO2-NH3 outlet molar fractions.
40
50
60
70
80
90
100
CH
4 con
vers
ion
[%]
0,0
0,1
0,2
0,3
0,4
0,5
0,6
O2
a
Mol
ar fr
actio
n [%
] b
0 5 10 15 20 25 300,00
0,03
0,06
0,09
0,12
NH3
NO2
NO
Mol
ar fr
actio
n [%
]
c
Time [min]
CO
H2

23
Fig. 7 - Periodic symmetric λ oscillations at Toven = 450°C with constant cycle period (t = 60 s) and different oscillation amplitude (±0.01, ±0.02 and ±0.03): a) CH4 conversion as function of time and
b) cycle average CH4 conversion and H2 and CO molar fractions as function of the oscillation amplitude.
0,01 0,02 0,0340
50
60
70
80
90
100b
Ave
rage
CH
4 con
vers
ion
[%]
Amplitude [-]
CH4
H2
CO
0,00
0,05
0,10
0,15
0,20
0,25
0,30
0,35
Average m
olar fraction [%]
0 25 50 75 100 125 15040
50
60
70
80
90
100 C
H4 c
onve
rsio
n [%
]
= 10.01
= 10.03
= 10.02
a
Time [min]

24
Fig. 8 - Outlet molar fractions of CO-O2-H2 and CH4 and monolith temperature during a single lean/rich cycle: a) λ = 1 ± 0.01, b) λ = 1 ± 0.02 and c) λ = 1 ± 0.03 (t = 60 s, Toven = 450°C).
c
= 1 0. 03
RICHPHASE
LEANPHASE
280 300 320 340 360 380Time [s]
CH4
CO O2
H2
bRICH
PHASELEAN
PHASE
300 320 340 360 380 400 420Time [s]
0,0
0,2
0,4
0,6
0,8
1,0
RICHPHASE
LEANPHASE
= 1 0. 01 = 1 0. 02
Mol
ar fr
actio
n [%
]
a
Toven = 450°C
0,00
0,02
0,04
0,06
0,08
0,10
Mol
ar fr
actio
n [%
]
300 320 340 360 380 400
450
460
470
480
T mon
olith
[°C
]
Time [s]

25
Fig. 9 – CH4, CO and H2 outlet molar fractions in function of the monolith temperature during a temperature step experiment in stationary conditions without O2 and NO (λ = 0.967).
200 250 300 350 400 450 5000,0
0,2
0,4
0,6
0,8
1,0
CO
H2
Tmonolith [°C]
CH4
Mol
ar fr
actio
n [%
]

26

Paper 2
Role of support and metal-support interaction on sulfur-promoted low-temperature oxidation of methane over Pt-based catalysts
D. Bounechada, P.-A. Carlsson, L. Kylhammar, S. Fouladvand, T. Pingel, E. Olsson and M. Skoglundh Submitted to Journal of Catalysis


Role of support and noble metal-support
interaction on sulfur promoted
low-temperature oxidation of methane over Pt
based catalysts
Djamela Buonechada, a,b Per-Anders Carlsson b,c,∗,Lisa Kylhammar, b,c Sheedeh Fouladvand, b,c Torben Pingel, b,d
Eva Olsson b,d and Magnus Skoglundh b,c
aDipartimento di Energia, Politecnico di Milano, 20133 Milano, ItalybCompetence Centre for Catalysis,
cDepartment of Chemical and Biological Engineering,dDepartment of Applied Physics,
Chalmers University of Technology, SE-412 96 Goteborg, Sweden
Abstract
The promoting effect of SO2 on the activity for methane oxidation over platinumsupported on silica, alumina and ceria has been studied by flow-reactor and in situinfrared spectroscopy experiments under transient inlet gas conditions. The catalyticactivity is clearly dependent on the support material and the noble metal-supportinteractions both in absence and presence of sulfur. On platinum, the competitivereactant adsorption favors oxygen dissociation such that oxygen self-poisoning isobserved for Pt/silica and Pt/alumina. Contrarily for Pt/ceria, the sensitivity to-wards high oxygen concentration is less pronounced and also, additional reactionchannels via sites on the platinum-ceria boundary and/or ceria surface considerablyfar from the Pt crystallites seem to be present. Upon addition of sulfur dioxide,the methane oxidation is inhibited for Pt/silica, enhanced for Pt/alumina and tem-porarily enhanced followed by long-term deactivation for Pt/ceria. The observationsare discussed in terms of competitive oxidation of SO2 and CH4 on Pt/silica, forma-tion of new active sites at the noble metal-support interface promoting dissociativeadsorption of methane on Pt/alumina and in the case of Pt/ceria formation ofpromoting surface sulfates followed by formation of deactivating bulk-like sulfatespecies.
Key words: Environmental catalysis; Promoted surface processes; Methanedissociation; In situ infrared spectroscopy; Nanoparticles; Platinum; Silica;Alumina; Ceria
Preprint submitted to Elsevier 3 February 2012

1 Introduction
The growing need to diversify energy sources motivates the development of gasengines to utilize the huge worldwide natural gas resources for transportationpurposes. By replacing common fuels like gasoline and diesel with naturalgas, typically containing 90-95% of CH4, a net reduction of CO2 emissions canbe achieved due to the low C/H ratio of methane. Furthermore, this wouldalso stimulate the production and use of biogas, which is a renewable non-fossil fuel. Despite these advantages there are still environmental challengesthat need to be met. For example the levels of unburned methane presentin the exhausts, typically up to 1000 ppm, must be lowered to comply withemission legislations. One preferred technology for emission control is catalyticaftertreatment of the exhausts. In the present case this is, however, especiallydifficult as methane is highly stable and thus difficult to catalytically activatefor further reactions at the low temperatures representative of modern engineexhausts. Thus, catalytic concepts and technologies for efficient oxidation ofmethane at low temperatures need to be developed.
Generally, the rate-limiting step for methane oxidation is considered to be theabstraction of the first hydrogen in the dissociative adsorption of methane[1]. Therefore, catalysts that can dissociate methane readily are usually alsoefficient for total methane oxidation. The most active elements for total oxida-tion of methane presently known are the noble metals [2]. Supported palladiumcatalysts show the highest activity for methane oxidation at low temperaturesin oxygen excess [3,4]. Unfortunately, palladium based catalysts may sufferfrom deactivation by sulfur containing compounds forming relatively stablepalladium sulfates [5,6]. Furthermore, the presence of water, even the smallamounts formed in the methane oxidation reaction under otherwise dry con-ditions [7], has been considered to inhibit the catalytic reaction [5,8]. This hasbeen attributed to hydration of the palladium surfaces [9]. On the contrary,platinum is less sensitive towards these poisons [5] but instead the overallactivity is generally lower for Pt than for Pd under oxygen excess due tooxygen self-poisoning [4,10,11] and/or oxide formation on the Pt crystallitesinhibiting the methane dissociation [11,14,15]. However, the inhibiting effectby oxygen on platinum can be circumvented by transient operation of the feedgas stoichiometry [12–16].
It has been shown that sulfur dioxide can promote the methane oxidation overplatinum supported on alumina [17,18] and more recently also for platinumsupported on ceria [19]. A similar promotional effect for propane oxidationover Pt/alumina has been observed in several studies [20–26] as well as for
∗ Corresponding author.Email address: [email protected] (Per-Anders Carlsson).
2

Ce0.67Zr0.33O2 [27] and Pt(111) [28]. In the case of Pt/ceria, Kylhammar et al.[19] observed a promotional effect between 300 and 450◦C under lean (largeoxygen excess) conditions, although as a function of time on stream the pro-moting effect diminish and instead the methane oxidation becomes inhibited.On the basis of in situ infrared spectroscopy experiments it was shown thatintroduction of SO2 results in an immediate formation of sulfate species on ce-ria that is accompanied by a corresponding instantaneous increase in methaneconversion. The results were discussed in terms of both breakage of oxygen self-poisoning/platinum oxides, effectively leading to a higher number of methanedissociation sites on Pt, and sulfate formation on ceria sites close to plat-inum that electronically can modify the platinum sites and/or form new sitesat the noble metal-support interface. Such sites were considered to polarizethe C-H bond in methane facilitating the dissociative adsorption. Interest-ingly, the spectroscopic analysis shows that despite the lean conditions, theceria is reduced upon SO2 exposure, indicating that oxidation of ceria withgas phase oxygen is kinetically hindered and that sulfate formation also mayblock spillover of oxygen that otherwise would oxidize the ceria. However,the mechanisms behind the promoting effect seem even more complex. Forexample, oxygen spillover can decrease the oxygen coverage and/or induce re-arrangement of adsorbates on the platinum surface and thereby facilitate thedissociative adsorption of methane on Pt. Thus sulfation of sites located at thenoble metal-support boundary as creation of new sites may not solely explainthe observed promoting effect but also may influence the reaction dynamics,especially processes related to spillover. The latter, for example, was proposedto lead to a settled oxygen dynamics in the platinum-ceria system, which canexplain the long-term poisoning effect of sulfur.
Here we study of the role of the support material and the noble metal-supportinteraction in sulfur promoted low-temperature oxidation of methane overplatinum based catalysts. This is realized through a comparative study of thecorrelation between the promoted methane oxidation and catalyst sulfationusing different catalytic systems i.e., platinum supported on silica, aluminaand ceria, each having significantly different affinity towards sulfate formation.
2 Experimental section
2.1 Catalyst preparation and characterization
Three types of supported platinum catalysts with a Pt loading of 4 wt.-% wereprepared by impregnation of SiO2 (Kromasil Silica KR-300-10, Akzo NobelEka Chemicals), Al2O3 (Puralox SBa 200, Sasol) and CeO2 (99.5 H.S.A. 514,Rhone-Poulenc) that first were pretreated in air at 600◦C for 4 hours. Each
3

support was dispersed in an aqueous solution consisting of distilled water andtetraammineplatinum(II)nitrate ((NH3)4Pt(NO3)2, Alfa Aesar GmbH & Co.KG). For the Pt/ceria samples, the impregnation was carried out in threesteps as to obtain the desired Pt loading. In order to increase the interactionbetween the platinum complex and the support, the pH of the solution wasadjusted by NH4OH addition taking into account the isoelectric point of eachoxide [29]. The obtained slurry was then stirred for 20 minutes, frozen withliquid nitrogen and freeze-dried for 12 h. The resulting powder was finallycalcined in air at 550◦C for one hour (heating rate of 5◦C/min).
Using the BET method for P/P0 = 0.05-0.20, the specific surface area for thePt/silica, Pt/alumina and Pt/ceria samples were calculated to be 117, 173and 156 m2/g, respectively. The Pt particle sizes of the different samples werestudied by transmission electron microscopy (TEM). The TEM samples wereprepared by morting the catalysts in an agate mortar. The catalysts were puton holey carbon film TEM grids. The particles were imaged using an FEITitan 80-300 TEM with a probe Cs (spherical abberation) corrector operatedat 300 kV and using a high angle annular dark field (HAADF) scanning TEMimaging mode providing Z number contrast. The electron probe size used forthese studies was about 0.2 nm.
Monolithic samples were prepared by immersing cordierite monoliths (∅ =13 mm, length = 15 mm, 400 cpsi, Corning Inc.) in a water slurry consist-ing of the catalyst powder and a binder. For the Pt/silica, Pt/alumina andPt/ceia powder samples, colloidal silica (Bindzil, AkzoNobel Eka Chemicals),boehmite (Disperal P2, Sasol Germany GmbH) and colloidal ceria (NyacolCeO2(Ac), Nyacol Nano Technologies), respectively, was used as binder. Thecoated monoliths were then dried in air at 90◦C for 10 min and calcined at600◦C for 2 min also in air. This procedure was repeated until 200 mg of coat-ing was attached to each sample. Finally, the samples were calcined in air at550◦C for one hour (heating rate of 5◦C/min).
2.2 Experimental equipment for catalytic studies
2.2.1 Continuous gas-flow reactor system
All experiments with monolith samples were performed using a continuousgas-flow reactor consisting of a horizontal quartz tube (∅ = 15 mm, length= 600 mm) surrounded by a metal coil (Kanthal) for resistive heating of thegas flow and the sample (effective heating length = 450 mm). The coil wasinsulated with quartz wool (SUPERWOOL 607 HT, Thermal Ceramics) andan outer layer of aluminum foil. In order to reduce axial temperature gra-dients, the sample was placed in the isothermal zone of the reactor between
4
two blank cordierite monoliths functioning as heat radiation shields [30]. Themonoliths were of the same size (∅ = 13 mm, length = 15 mm, 400 cpsi)and separated by smaller cordierite monoliths (3x3 channels, length = 5 mm,400 cpsi). The inlet gas temperature was measured by one fixed thermocouple(k-type, Pentronic), placed in the central channel of the upstream cordieritemonolith 12 mm from the catalyst front, and controlled with a PID regula-tor (Eurotherm 3508). The temperatures in the sample monolith and in thetwo downstream cordierite monoliths were measured by individual thermo-couples. The gas composition, i.e., CH4, O2, SO2 and Ar flows, was composedby individual mass flow controllers (Bronkhorst LOW-∆P-FLOW) and finallyintroduced to the reactor via three air actuated four-way pulse valves (Valco,VICI), which allows for rapid changes of the feed composition. The outlet gascomposition was analyzed by mass spectrometry (Airsense Compact, V&F).The ion-molecule reaction (IMR) method [31,32] was used to follow the massto charge ratio (m/z) 64 (SO2) using xenon for ionization, whereas m/z 2 (H2),15 (CH4), 18 (H2O), 28 (CO), 32 (O2 and S), 33 (HS), 44 (CO2) and 48 (SO)were measured through the electron impact (EI) method.
2.2.2 In situ Fourier transform infrared spectroscopy system
The in situ infrared Fourier transformed (FTIR) spectroscopy measurementswere performed with powder samples in diffuse reflectance mode (DRIFT)using a Bio-Rad FTS6000 spectrometer equipped with a high-temperaturereaction cell (Harrick Scientific, Praying Mantis) and an MCT detector. Thetemperature of the sample holder was measured with a thermocouple (k-type)and controlled with a PID regulator (Eurotherm 2416). Individual mass flowcontrollers (Bronkhorst LOW-∆P-FLOW) were used to introduce the gases.Moreover, to facilitate precise transients, the SO2 feed was introduced via anair actuated high-speed gas valve (Valco, VICI). The outlet gas compositionwas analyzed by mass spectrometry (Balzers QuadStar 420) following the m/z2 (H2), 15 (CH4), 18 (H2O), 28 (CO), 32 (O2 and S), 40 (Ar), 44 (CO2), 48(SO), and 64 (SO2).
2.3 Experimental procedure
2.3.1 Catalytic studies in continuous gas-flow reactor
In order to achieve a common starting point for the experiments, the sampleswere pretreated with 8 vol.-% O2 and 500 vol.-ppm CH4 (in the following vol.-% and vol.-ppm are denoted % and ppm, respectively) at 500◦C for one hourusing a total flow of 500 ml/min corresponding to a space velocity (GHSV) of15000 h−1. This GHSV was kept constant and Ar was used as carrier gas in
5

all flow-reactor experiments described in more detail below.
The temperature programmed reaction (TPReaction) experiments, startingwith pretreated samples, were performed by decreasing the temperature by5◦C/min from 500 to 100◦C, dwelling for 20 min and then increasing thetemperature to 500◦C and dwelling for another 20 min using the same gascomposition. This cooling-heating cycle was repeated three times (cycle 1-3)followed by another three cycles (cycle 4-6) where 20 ppm SO2 was added tothe feed and, finally, three cycles (cycle 7-9) without SO2.
The transient SO2 exposure experiments were performed using pretreated sam-ples by introducing 500 ppm CH4 and 1500 ppm O2 at the temperature tobe studied, i.e. 400 and 500◦C, for 60 min. Subsequently, the SO2 exposureexperiment was started by instantly introducing 100 ppm SO2 for a durationof 5 min to the feed and the response was followed until 25 min after thesulfur exposure period. In total, this sequence was repeated 24 times, whichcorresponds to 2 h of SO2 exposure.
2.3.2 In situ DRIFTS experiments
For each DRIFTS experiment, a new powder sample from the same prepara-tion batch was used. The sample was pretreated with with 8% O2 and 500ppm CH4 at 500◦C for one hour using a total flow of 100 ml/min. The wavenumber region 4000 - 1000 cm−1 was investigated with a spectral resolutionof 1 cm−1.
The transient SO2 exposure experiments were performed with pretreated sam-ples by introducing 500 ppm CH4 and 1500 ppm O2 in Ar at 500◦C and thenestablish the desired reaction temperature, i.e., 400 and 500◦C, for 30 min.Subsequently, the experiment was started by introducing pulses of SO2 (40ppm for 5 min) into the feed and the response was followed for 20 min there-after. This sequence was repeated four times after which the sample was ex-posed to SO2 for 60 min, in total corresponding to 80 min with SO2 exposure.After the experiment at 400◦C, the sample was heated to 500◦C with a heat-ing rate of 5◦C/min in a sulfur-free gas flow. The reference spectrum used forbackground subtraction was recorded in the reaction mixture 10 min beforethe first SO2 pulse. Sample spectra were then collected each second for thefirst SO2 pulse and every 30 s for the remaining pulses. For the experimentperformed at 400◦C, one spectrum per second was recorded during the finalheating ramp.
6

3 Results
3.1 Analysis of TEM micrographs
Fig. 1 shows representative TEM micrographs of the as prepared Pt/silica,Pt/alumina and Pt/ceria samples. For the Pt/silica sample (Fig. 1a), platinumcrystallites from one to ten nm in diameter are clearly visible. The proportionsof Pt particles of sizes larger and smaller than three nm are almost the same.A significant fraction of the platinum particles are smaller than two nm. Inthe Pt/alumina sample (Fig. 1b), Pt particles of sizes smaller than one and upto about three nm are visible. The vast majority of the platinum crystallitesare very small and below two nm in diameter. Finally, in the Pt/ceria sample(Fig. 1c) the platinum particles are considerably more difficult to discern duethe low contrast between the platinum and ceria. However, the Pt crystalsliteswith sizes smaller than one and up to about three nm in diameter can be seen.The platinum particles in the Pt/silica sample are generally larger than thePt particles in the Pt/alumina and Pt/ceria samples. However, a significantfraction of the platinum crystallites are very small, i.e. below two nm in allthree samples.
3.2 Continuous gas-flow reactor experiments
3.2.1 Temperature programmed reaction experiments
The results from the TPReaction experiments with different oxygen concentra-tions (8% and 1500 ppm) for the Pt/silica, Pt/alumina and Pt/ceria catalystsare shown in Fig. 2a-c, respectively. The figure displays the consumption ofmethane and in the case of 1500 ppm O2 also the consumption of oxygen ver-sus temperature. For both the Pt/silica and Pt/alumina samples, the methaneoxidation is negligible below 350◦C and above this temperature the observedmethane oxidation is generally higher for the experiments with low oxygenconcentration. With decreasing oxygen concentration at 500◦C, the methaneconsumption increases corresponding to an increase in methane conversionfrom 13 to 46% and from 19 to 37% for the Pt/silica and Pt/alumina sample,respectively. Contrarily, for the Pt/ceria sample, the methane oxidation startsaround 300◦C and increases correspondingly from 60 to 84% methane conver-sion at 500◦C with increasing oxygen concentration. Neither CO nor H2 couldbe detected indicating that total oxidation of methane is the dominating reac-tion under the present experimental conditions. This is further supported bythe fact that stoichiometric amounts of oxygen for total oxidation of methaneare consumed during the entire experiments. As will be shown, this is the
7

case for all experiments in this study. Moreover, a minor reversed hysteresis,i.e., ignition profile positioned at lower temperatures than the correspondingextinction profile, may be seen for the Pt/ceria sample.
The results from the TPReaction experiments with SO2 for Pt/silica, Pt/aluminaand Pt/ceria are shown, in Figs. 3 - 5. Fig. 3 displays the consumption ofmethane and oxygen as a function of increasing inlet gas temperature for oxi-dation of 500 ppm CH4 with 1500 ppm O2 for fresh samples (cycle 3), duringthe addition of 20 ppm SO2 to the feed (cycle 6) and after removal of SO2
from the feed (cycle 9). It can be seen that the oxidation of methane overthe fresh Pt/silica sample starts around 350◦C by an increase in consumedamounts of methane. As soon as SO2 is introduced into the feed an imme-diate decrease in methane consumption corresponding to a decrease from 41to 29% methane conversion at 500◦C is observed. The methane oxidation iscompletely recovered after removal of SO2 from the feed, ( cf. cycle 3 and9). The fresh Pt/alumina sample shows negligible methane oxidation below350◦C and a slightly lower CH4 consumption at 500◦C, corresponding to about34% conversion, as compared to the corresponding experiment for the freshPt/silica sample. However, feeding SO2 at 500◦C results in an increase of themethane consumption (this will be discussed in more detail below) and dur-ing both cooling and heating the consumed methane shows a local maximumaround 350◦C and higher consumption of methane at 500◦C, correspondingto around 60% conversion. After removal of SO2 from the feed, the methaneoxidation regresses somewhat, although the consumed methane is still higherthan for the fresh sample. The maximum consumption at 500◦C correspondsto 49% conversion and no local consumption maximum is observed. For thefresh Pt/ceria sample the methane oxidation is negligible below 300◦C andat 500 ◦C the methane consumption corresponds to around 64% conversion.Introducing SO2 to the feed results in an increase of the methane consumptionat low temperatures, however, at high temperatures the methane consump-tion is considerably lower than for the fresh sample. After removal of SO2 fromthe feed, the methane oxidation regresses even further showing only a minorconsumption corresponding to about 20% conversion at 500◦C.
To facilitate the analysis of the promoting effect of sulfur on methane oxi-dation, the methane consumption as a function of temperature for successivecooling-heating cycles for oxidation of 500 ppm CH4 with 1500 ppm O2 inthe presence of 20 ppm SO2 (cycle 4-6) is displayed in Fig. 4. The outlet SO2
concentration for these cycles is shown in Fig. 5. For the Pt/silica sampleboth the methane consumption and the outlet SO2 concentration during thethree cooling-heating cycles overlap and the methane consumption is shiftedtowards higher temperatures as compared to the previous cycle without SO2
(cycle 3 in Fig. 3). As shown in Fig. 5a, the sulfur dioxide is always present inthe product stream under 350◦C and for temperatures above 400◦C the ther-modynamic equilibrium for SO2 oxidation is approached. Contrarily, for the
8

Pt/alumina sample, a progressive increase of the methane consumption withtime on stream is seen both for the cooling and heating ramp experiments.The maximum methane consumption, corresponding to 63% conversion, isobserved after the sixth heating ramp. Furthermore, it can be noted that thelocal consumption maximum between 315 and 390◦C also increases as a func-tion of time on stream appearing most pronounced for cycle 6. Only negligibleamounts of SO2 can be detected below 250◦C during the first cooling rampin presence of sulfur (cycle 4 in 5b). During the subsequent heating rampremarkable amounts of SO2 are detected below 350◦C showing a maximumaround 160◦C. A low SO2 concentration can be seen also above 450◦C. Re-markable amounts of SO2 below 300◦C are detected also during cycles 5 and6 and this SO2 concentration increases with decreasing temperature. The be-havior is more complex at the higher temperatures. Depending on whetherthe temperature is decreased or increased, a pronounced peak of SO2 above400◦C is observed. Here the heating ramps result in a maximum at around495◦C whereas only minor amounts of SO2 can be detected during the cool-ing ramps. For the Pt/ceria sample the introduction of SO2 to the feed gasat 500◦C results in an instant increase in methane consumption correspond-ing to an increase in methane conversion from 64 to 72%. The profile of themethane consumption during the following cooling ramp (cycle 4) is similar asto cycle 3 (Fig. 3c), although somewhat shifted towards lower temperatures.A considerably stronger shift of the methane consumption towards lower tem-peratures is seen for the following heating ramp (cycle 4) and a correspondingmaximum methane conversion of 86% is reached at around 435◦C and main-tained up to 500◦C. For the remaining cycles in presence of SO2 (cycles 5 and6), the methane consumption decreases, primarily during the stationary tem-perature periods at 500◦C, passing from 86 to 62% and then to 42% methaneconversion. In contrast to the first three cycles (not shown), a clear extinction-ignition hysteresis is observed between 250 and 500◦C, with higher methaneconsumption at all temperatures for the heating ramps. Finally, for cycles 7-9after sulfur exposure the consumption of methane is generally low, around17% conversion at 500◦C and negligible below 400◦C (not shown). In the caseof the Pt/ceria sample, SO2 is not detected during the first cooling ramp inpresence of sulfur (Fig. 5c). However, for the following heating ramp SO2 isobserved below 250◦C with a maximum around 195◦C. Moving to cycle 5,some SO2 can be seen below 300◦C for the cooling ramp and for the heatingramp a net release of SO2 between 100 and 200◦C with a maximum around120◦C can be observed. Negligible concentration of SO2 is seen above 400◦C.The SO2 profiles during cycle 6 show the same trends although in generalhigher concentrations are observed.
9

3.2.2 Transient SO2 experiments
The results of the isothermal transient SO2 exposure experiments over Pt/silica,Pt/alumina and Pt/ceria performed at 400 and 500◦C are shown in Fig. 6. Thetwo top panels show the consumption of methane and oxygen as a function oftime while the two bottom panels show the outlet SO2 concentration at 500and 400◦C, respectively.
From Fig. 6a it is clear that the methane consumption over Pt/silica at 500◦Cdecreases abruptly when SO2 is introduced and then gradually recovers to theinitial conversion level during the following sulfur-free period. The concentra-tion of SO2 at the reactor outlet is around 23 ppm for each pulse. At 400◦C,the effects of SO2 on the methane consumption can hardly be discerned dueto the generally very low methane oxidation. For Pt/alumina (cf. Fig. 6b) themethane consumption increases in the presence of SO2 for both temperaturesinvestigated and this effect seems to become more and more pronounced asa function of time on stream. The methane consumption decreases graduallybetween the SO2 pulses although not to an as low level as at the start of theexperiment. This is especially clear at 500◦C, leading to an overall increase ofthe methane consumption during the time of the experiment. At 400◦C theconcentration of SO2 at the reactor outlet is minor during the entire experi-ment, whereas at 500◦C, SO2 is clearly detected at t = 4-12 h. The detectedSO2 is below the feed concentration throughout the experiment. Finally, forPt/ceria at both temperatures studied, the methane consumption increases inpresence of SO2 although this effect becomes less pronounced over the time ofthe experiment (cf. Fig. 6c). At 500◦C, the methane consumption decreasesrapidly during the sulfur-free periods leading to an overall deactivation of thecatalyst. In contrast, at 400◦C, the increase in CH4 consumption during SO2
pulses is even more pronounced throughout the entire experiment and thedecline in overall activity is slower. Furthermore, after the first three pulses,some of the increased methane oxidation remains leading to an overall increasein methane consumption for the first part of the experiment. In both casesSO2 cannot be detected at the reactor outlet.
3.3 In situ DRIFT spectroscopy measurements
3.3.1 Transient SO2 exposure experiments
The DRIFTS results during the isothermal transient SO2 exposure experi-ments over Pt/alumina and Pt/ceria are shown in Fig. 7 and 8, respectively.Panels a and b show the IR spectra collected for the fresh sample (t = 1 min),after the first (t = 11 min), fourth (t = 101 min) and fifth (t = 166 min) SO2
exposure at 400◦C and 500◦C, respectively. An IR spectrum collected after the
10

heating ramp (t = 192 min) is also shown in the a panels. The c and d panelsdisplay the integrated peak area in the regions 1250-1450 cm−1 assigned tosulfate species and 1450-1650 cm−1 assigned to carbonate/carboxylate speciesduring the experiments at 400 and 500◦C, respectively. The dashed areas rep-resent the periods with SO2 present in the feed. Due to the use of non-dilutedsamples, the absorption of infrared radiation in the region 1000 to 1200 cm−1
by alumina is nearly complete and thus this wavenumber region is not consid-ered in the forthcoming discussion of the results for Pt/alumina.
In Fig. 7a the spectrum collected at 400◦C after 1 min in pure Ar for thePt/alumina sample shows, as anticipated, no absorption bands, which reflectsno changes with respect to the initial condition, i.e. the reference spectrumused for background subtraction. The appearance of an IR absorption bandat 1372 cm−1 after the first SO2 pulse at t = 11 min indicates the formation ofsulfate species (SO42−) on the surface of alumina [20,25,26,33,34]. Althoughnot explicitly shown here, three negative absorption bands around 3750, 3670and 3560 cm−1, respectively, appear concomitantly. The bands have previ-ously been associated with hydroxyl groups on alumina [25,35,36] and thus,here, a removal or blockage of surface OH groups is likely. In the spectra col-lected after the fourth (t = 101 min) and the fifth pulses (t = 166 min), twonew negative bands appear at 1550 and 1590 cm−1, which may be associ-ated with asymmetric stretching of superficial carbonate/carboxylate species[24,37,38]. At the same time, an increase in the intensity of the absorptionband associated to superficial sulfates can be observed, accompanied by ashift from 1372 to 1395 cm−1. The observed shift may be explained either bythe combined effect of two overlapping bands that change in relative inten-sity or by a pure frequency shift of a single band induced by the change inthe strength of molecular interactions [39]. Moreover, the intensities of theIR bands associated to superficial OH groups increase with sulfur exposuresuggesting that sulfates may form primarily on OH superficial sites. Moreoverthe intensity for the IR band assigned to sulfates increases in the presence ofSO2 and remains during the sulfur-free periods, whereas the IR band assignedto carbonate/carboxylate species decreases during SO2 exposure and remainsafter sulfur exposure. This indicates that carbonate/carboxylate species areremoved as sulfates form. Finally, during the heating ramp no clear changescan be observed in the spectrum recorded at t = 192 min, indicating that thesuperficial sulfates formed at 400◦C are stable also at 500◦C. Considering theresults from the transient SO2 exposure experiment at 500◦C (7), it can benoticed that the spectrum collected after 1 min has not changed with respectto the reference spectrum. As in the previous case at 400◦C, the appearanceof an absorption band at 1372 cm1 after the first SO2 pulse (t = 11 min)indicates the formation of surface sulfates. Furthermore, a series of negativesharp absorption bands appear in the carbonate/carboxylate region of thespectrum (1450-1800 cm−1), whereas the negative broad double band at 2335and 2360 cm−1 is due to asymmetric stretching of gaseous CO2 [40,41]. Finally,
11

also at 500◦C, three negative absorption bands around 3750, 3670 and 3560cm−1 related to surface hydroxyl groups, can be observed upon SO2 introduc-tion. After longer exposure to SO2 (t = 101-166 min), a new absorption bandappears around 1205 cm−1, likely associated to bulk sulfates in the aluminasample [18,25,33,34,42]. A contemporary increase of the intensity of the ab-sorption band associated to superficial sulfates can be observed, accompaniedby a shift from 1372 to 1398 cm−1 and by an increase of the OH peaks. Theresults presented in 7d show again that the integrated peak area for sulfates(1250-1450 cm−1) increases in the presence of SO2 and remains high during thesulfur-free periods, whereas the area in the 1450-1800 cm−1 range decreasesduring SO2 pulses and remains low after sulfur exposure. This indicates thatdesorption of carbonate/carboxylate species is related to formation of sulfates.
The DRIFTS results for the transient SO2 exposure experiments over Pt/ceriaare shown in Fig. 8. Panel a shows the spectra collected at 400◦C. The spec-trum collected after 1 min shows no changes as compared to the referencespectra whereas after the first SO2 pulse (t = 11 min) two strong absorptionbands at 1076 and 1344 cm−1 and four weak negative bands at 1520, 1545,3638 and 3722 cm−1 can be distinguished. In line with previous work [19], wesuggest that the band at 1076 cm−1 is connected to sulfite and/or hydrogensulfite species on the ceria surface, even if the previously reported positions ofthese bands are systematically lower [34,43]. Further, a shoulder at 1101 cm−1
is visible, which probably is due to an overlap between the sulfite/hydrogensulfite band and another band related to bulk-like sulfate species [44]. Theband at 1344 cm−1 has often been assigned to surface sulfates [19,34,43–45].The negative IR absorption bands at around 1520 and 1545 cm−1 can be as-signed to superficial carbonate and/or carboxylate species [19,40,46–49] andindicate decomposition/desorption of such species. Finally, the bands at 3638and 3722 cm−1 can be related to hydroxyl groups on ceria [40,41,43]. This sug-gests that sulfates/sulfites are formed at superficial OH sites. Considering thespectra collected after the fourth (t = 101 min) and fifth SO2 pulse (t = 166min) three new absorption bands can be distinguished at 1190, 1615 and 2129cm−1, whereas the bands at 1344 and 1129 cm−1 shift to higher wave numbers(1365 and 2137 cm−1, respectively). The band at 1190 cm−1 could be assignedto bulk-like sulfates species [43,44]. However, the band at 1615 cm−1 is moredifficult to assign. Possibly, this band is related either to bulk carbonate, con-taining three cerium-oxygen bonds [46], or to adsorbed water. We mention thatabsorption at similar wavenumbers have been observed for water adsorbed onalumina [20,35,37,38]. Finally, the peak at 2129 cm−1 is likely connected to anelectronic transition in Ce(III) [46,40]. As a function of time on stream withsulfur exposure, the intensity of all bands related to sulfur derived species(1450-1000 cm−1) increases, together with the band connected to Ce(III), asclearly demonstrated by the integrated areas in Fig. 8c. At the same time, theconcentration of superficial carbonate/carboxylate species (1575-1450 cm−1)decreases and the negative bands associated to OH species become more neg-
12

ative in presence of SO2. Despite the constant total IR absorption when thesample is heated from 400 to 500◦C, the intensity of the band at 1190 cm−1
increases. This is accompanied by a decreased intensity of the band at 2129cm−1. Moreover, the increase in temperature leads to a decrease in both theabsorption at 1615 cm−1 (bulk carbonates) and the integrated area (superfi-cial carbonate/carboxylate species). The IR spectra collected at 500◦C duringthe transient SO2 exposure experiment for the Pt/ceria sample (8b) generallyshow the same adsorption bands as already observed at 400◦C. However, theadsorption in the region associated with carbonate/carboxylate differs, withno bands at 500◦C. Moreover, there are important differences in the relativeintensity of the peaks associated to sulfate species and Ce(III). The bandsconnected to bulk sulfates are much more pronounced and the peak around2137 cm−1 is less intense at 500◦C. Again the integrated area for the sulfurderived species (1450-1000 cm−1) increases in presence of SO2 and remainsconstant during the following sulfur-free periods. The opposite behaviour ob-served for the area of Ce(III) band indicates again that formation of sulfatesis accompanied by ceria reduction.
4 Discussion
In this study we focus on the role of the support material on sulfur promotedlow-temperature oxidation of methane over platinum based catalysts. Basedon transient flow-reactor and in situ DRIFTS experiments with silica, aluminaand ceria supported platinum catalysts, which affinity to form sulfates differsconsiderably [34,50], the importance of different surface processes on the metaland on the support phases could be clarified. It is clear from the TEM analysisthat for all three samples a significant fraction of the Pt crystallites are belowthree nm in diameter (cf. Fig. 1). This means that in all samples the majority ofthe Pt crystallites are sufficiently small as to be susceptible towards electronicmodifications by the support [51], which likely affect the catalytic properties.Before discussing the promotional effect, we pay attention to the influence ofoxygen concentration on the methane oxidation for the different samples. Thisis to motivate the considerably lower oxygen concentration used in this studyas compared to previous studies [15,19,52] and to start the discussion withgenerally accepted arguments concerning methane oxidation on platinum. Fora more sterling overview see the reviews by Burch et al. [1] and Gelin et al.[2] or other cited work, e.g. Refs. [11,14,15]
It has previously been shown that methane oxidation on Pt/Al2O3 strongly de-pends on the feed gas composition [12–15]. The results in this study supportthe existence of a highly active state corresponding to intermediate surfaceO/Pt ratio of the catalyst, whereas the methane dissociation seems to be hin-dered by a too high oxygen coverage. Here, the results from the TPReaction
13

experiments with different oxygen concentrations (Fig. 2) indicate that the in-fluence of the oxygen concentration on the oxidation of methane in excess oxy-gen is different for silica, alumina and ceria supported platinum. With increas-ing oxygen concentration, the methane oxidation is suppressed for Pt/silicaand Pt/alumina whereas for Pt/ceria the methane oxidation seems to increase.Due to the low methane oxidation activity at high oxygen concentration (8%)for the Pt/silica and Pt/alumina samples the lower concentration of 1500 ppmO2 was used for the sulfur experiments to ensure a proper analysis of the pro-moting and inhibiting effects of sulfur. Analysis of the oxygen balance showsthat all consumed oxygen well matches the expected stoichiometric consump-tion for complete methane oxidation. This is further supported by that neitherCO nor H2 could be detected in any experiment, which is indicative of totaloxidation. Thus it is unlikely that the results for Pt/ceria are biased by thatceria is not completely oxidised at the start of the experiment, which princi-pally may lead to that a significant amount of the supplied oxygen is storedin the ceria support rather than used for oxidation of methane on Pt. Thissupports that the results for Pt/ceria are not artifactual. Based on this wecan reason as follows. Assuming that the main reaction path for methane oxi-dation on Pt is dominated by the Langmuir-Hinshelwood (LH) type of mech-anism involving reaction between dissociated methane and oxygen species.The inhibiting effect of oxygen observed over both Pt/silica and Pt/aluminacan then be explained by a site competition between oxygen and methane [1]favoring the adsorption of oxygen due to its considerably higher sticking prob-ability as compared to methane [53,54]. Based on this, the methane oxidationrate may be high for partially oxygen covered surfaces where the coverage ofoxygen and carbon containing species is balanced [7]. This is in line with pre-vious results of Carlsson et al. [12,13] and Becker et al. [16,15], who found anoverall improvement of the oxidation rate of methane over Pt/Al2O3 duringperiodic operation of the gas composition. Considering now the support, itis known that the chemical state of the dispersed platinum crystallites canbe influenced by the physicochemical properties of the support material. Forexample, Yazawa et al. [55,56] showed that the more acidic support the morestable is the metallic state of platinum even under lean reaction conditions.This could explain the lower oxygen self-poisoning observed for Pt/aluminaas compared to the considerably less acidic Pt/silica [36]. Further, contrastingthe results for the Pt/ceria sample with those for Pt/silica and Pt/alumina,it is possible that the Pt/ceria system exhibits stronger metal support inter-actions [57] that may modify platinum sites, especially sites close to the noblemetal-support interface that are more active for methane dissociation or ac-tivation of reactive oxygen atoms. The latter is for example supported by theresults by Tang et al. [58], who observed that doping the CeO2 surface with Ptweakened the bond strength to neighboring oxygen in the oxide, making themmore reactive for methane oxidation. Besides, even if no evidences for methanedissociation on pure ceria have been found, the existence of active sites on theceria surface cannot be excluded. Thus we propose that dissociated oxygen
14

species on platinum can either react with dissociated methane species on Ptitself or diffuse towards the ceria and react on sites at the noble metal-supportinterface [52], or spill over and possibly react with dissociated methane on ce-ria [49]. The latter may occur via either a LH mechanism involving activatedoxygen species or via a Mars van Krevelen type of mechanism involving latticeoxygen. Accepting the latter, the observed increased methane oxidation withincreased oxygen concentration could be explained by an enhancement of bothoxygen surface transport mechanisms and ceria (re)oxidation with increasingoxygen concentration. However, a detailed analysis of the pure methane oxi-dation, as previously performed for Pt/alumina [13–15], is beyond the presentscope. Instead we focus the remaining discussion on methane oxidation overthe different noble metal-support systems in the presence of sulfur as to clarifythe processes that may be involved in sulfur promoted methane oxidation.
It is clear that the support material plays an important role in the promotionof the low-temperature oxidation of methane. As in this connection methaneoxidation is less studied compared to for example oxidation of propane, wewill make appropriate analogies with sulfur promoted propane oxidation inthe following discussion. It is well known that silica is nearly resistant towardsacidic compounds like SO2 and NO [59,60], i.e. neither sulfite/sulfate nor ni-trite/nitrate species are formed on the Pt/silica system [21,24,61]. For thisreason, the observed conversion of methane over the Pt/silica sample reachesthe same level before and after sulfur exposure (3), which is in line with previ-ous studies on propane oxidation [21,22,24,62]. However, in contrast to propaneoxidation, a clear inhibition effect can be observed in presence of SO2. Thisis especially clear in the transient SO2 exposure experiments (Fig. 6) wherethe activity drops during each period with sulfur and recovers thereafter. Thetransient responses also show a rapid SO2 breakthrough reflecting that negligi-ble amounts of sulfur are stored on the sample. The detected level of SO2 in thetransient SO2 exposure experiment is however significantly lower than the feedconcentrations, which is due to oxidation of SO2 into SO3 (unfortunately SO3
could not be detected with the present experimental set-up). The oxidationof SO2 is further supported by the TPReaction experiment (Fig. 5) indicatingan onset of the oxidation of SO2 at around 200◦C, which becomes significantat around 300◦C. The detected SO2 at the highest temperatures is due tothe equilibrium between SO2 and SO3. Furthermore, a detailed analysis of theconsumed amount of oxygen shows that slightly more oxygen than would havebeen used for stoichiometric total oxidation of methane is consumed, which isindicative of SO2 oxidation by dissociation of gas phase oxygen on platinum.Considering these observations, the drop in methane conversion is likely dueto a site competition between SO2 and CH4 adsorption as a first step in therespective subsequent oxidation reaction, favoring SO2 adsorption due to thehigher sticking probability of SO2 on platinum as compared to CH4 [52,63].The different response to SO2 for methane and propane oxidation over silicasupported Pt can be explained by the more even competition between SO2
15

and propane than for SO2 and methane. In the case of propane this leadsto lower inhibiting effect of SO2 on propane oxidation. Besides, in the case ofpropane oxidation, Burch et al. [22] proposed as part of the explanation for thepromotional effect that SO2 oxidation on platinum results in (partial) removalof oxygen from the platinum surface, which leads to an increase of activityfor oxidation of propane. However, the same authors did not observe any pro-motion by sulfur on propane oxidation on Pt/silica. Furthermore, our resultsshow that the methane oxidation over Pt/silica is inhibited in the presence ofSO2, despite the occurrence of SO2 oxidation. Therefore the enhancement ofhydrocarbon oxidation by removal of chemisorbed oxygen on Pt through SO2
oxidation seems unlikely or at least insufficient at the present experimentalconditions.
Unlike for Pt/silica, a significant enhancement of methane oxidation overthe Pt/alumina sample in presence of SO2 can be observed both as a low-temperature maximum and a general increase of the methane conversion dur-ing the TPReaction experiments (Fig. 3 and 4) and as an initial and generallyincreasing methane conversion during the transient SO2 exposure experiments.In the TPReaction experiment, the promoting effect increases for each cyclewith SO2 (Fig. 4) and remains, at least partially, even after the sulfur expo-sure periods (Fig. 3). Even if sulfur exposure has been reported to result innegligible or negative effects on the general performance of Pt/alumina cat-alysts [5,63], the present results are in line with the observations by Dupontet al. [17] and Corro et al. [18] who observed a promotional effect of SO2 onthe oxidation of propane over Pt/alumina. Moreover it corresponds well withthe analogous sulfur promoted propane oxidation over Pt/Al2O3, which hasbeen studied more extensively [21–26]. In the case of propane oxidation differ-ent explanations have been proposed for the promoting effect of SO2. Amongthem, the formation of new active sites that more effectively can break theC-H bond via dissociation seems most likely. Such active sites are proposedto be composed by adjacent cationic (Ptδ+) and anionic (SO2−
4 ) moieties atthe noble metal-support interface [22]. From the detected outlet concentrationof SO2 (Fig. 5) it is clear that much SO2 is stored during the first cycle andfor the remaining cycles with SO2 the system is, at least partly, regenerated.The observed minimum in SO2 concentration between 300 and 400◦C is dueto both formation of sulfates on alumina and the equilibrated SO2 oxidationdescribed above. As for Pt/silica, the detailed analysis of the consumed oxygenindicates significant SO2 oxidation by gas phase oxygen also for Pt/alumina.The formation of sulfates likely involves formation also of interfacial sulfates(Al2(SO4)3) through a platinum catalyzed reaction between the adsorbed SO3
and Al2O3 [26]. These interfacial sulfates can provide catalytic sites highlyactive for methane dissociation. Thus the general trend of increasing methaneconversion as a function of time on stream observed here may be a result ofsuccessive creation of these interfacial sites and the observed methane conver-sion at low-temperature (the maximum) is a result of methane dissociation
16
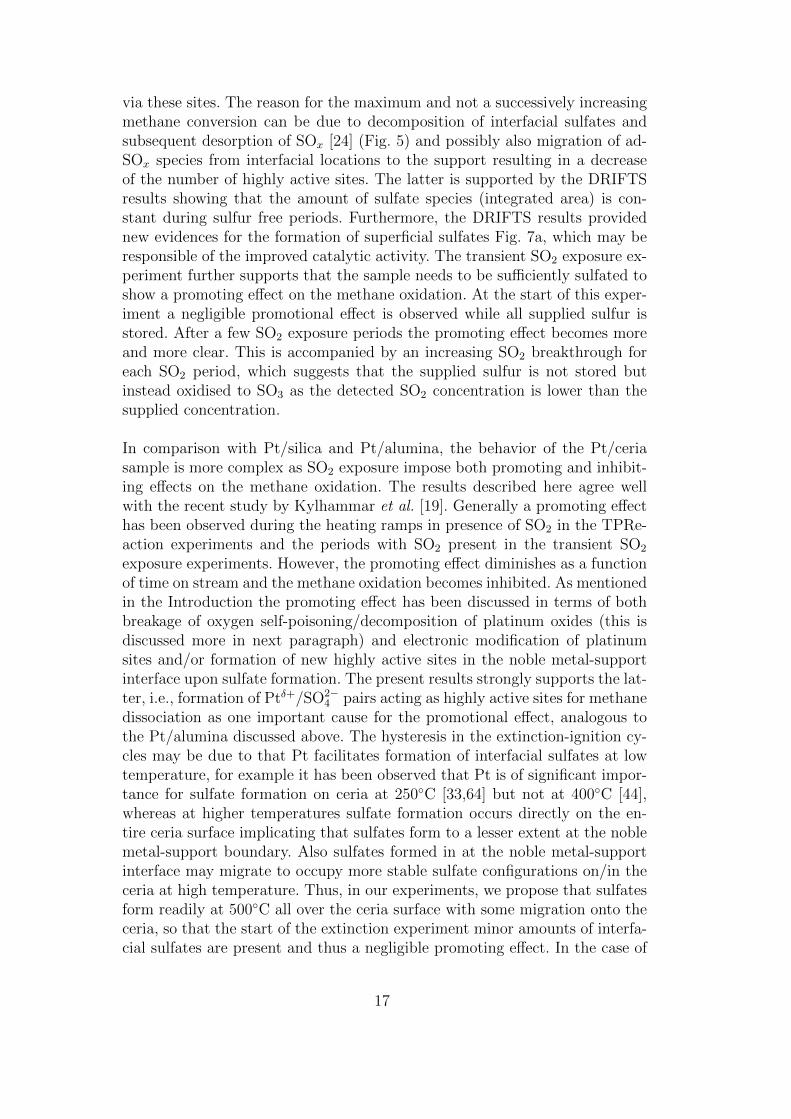
via these sites. The reason for the maximum and not a successively increasingmethane conversion can be due to decomposition of interfacial sulfates andsubsequent desorption of SOx [24] (Fig. 5) and possibly also migration of ad-SOx species from interfacial locations to the support resulting in a decreaseof the number of highly active sites. The latter is supported by the DRIFTSresults showing that the amount of sulfate species (integrated area) is con-stant during sulfur free periods. Furthermore, the DRIFTS results providednew evidences for the formation of superficial sulfates Fig. 7a, which may beresponsible of the improved catalytic activity. The transient SO2 exposure ex-periment further supports that the sample needs to be sufficiently sulfated toshow a promoting effect on the methane oxidation. At the start of this exper-iment a negligible promotional effect is observed while all supplied sulfur isstored. After a few SO2 exposure periods the promoting effect becomes moreand more clear. This is accompanied by an increasing SO2 breakthrough foreach SO2 period, which suggests that the supplied sulfur is not stored butinstead oxidised to SO3 as the detected SO2 concentration is lower than thesupplied concentration.
In comparison with Pt/silica and Pt/alumina, the behavior of the Pt/ceriasample is more complex as SO2 exposure impose both promoting and inhibit-ing effects on the methane oxidation. The results described here agree wellwith the recent study by Kylhammar et al. [19]. Generally a promoting effecthas been observed during the heating ramps in presence of SO2 in the TPRe-action experiments and the periods with SO2 present in the transient SO2
exposure experiments. However, the promoting effect diminishes as a functionof time on stream and the methane oxidation becomes inhibited. As mentionedin the Introduction the promoting effect has been discussed in terms of bothbreakage of oxygen self-poisoning/decomposition of platinum oxides (this isdiscussed more in next paragraph) and electronic modification of platinumsites and/or formation of new highly active sites in the noble metal-supportinterface upon sulfate formation. The present results strongly supports the lat-ter, i.e., formation of Ptδ+/SO2−
4 pairs acting as highly active sites for methanedissociation as one important cause for the promotional effect, analogous tothe Pt/alumina discussed above. The hysteresis in the extinction-ignition cy-cles may be due to that Pt facilitates formation of interfacial sulfates at lowtemperature, for example it has been observed that Pt is of significant impor-tance for sulfate formation on ceria at 250◦C [33,64] but not at 400◦C [44],whereas at higher temperatures sulfate formation occurs directly on the en-tire ceria surface implicating that sulfates form to a lesser extent at the noblemetal-support boundary. Also sulfates formed in at the noble metal-supportinterface may migrate to occupy more stable sulfate configurations on/in theceria at high temperature. Thus, in our experiments, we propose that sulfatesform readily at 500◦C all over the ceria surface with some migration onto theceria, so that the start of the extinction experiment minor amounts of interfa-cial sulfates are present and thus a negligible promoting effect. In the case of
17

possible active sites on the ceria support as such, these sites may be blockedby the presence of superficial sulfates. On the contrary, at low temperaturethe main path towards ceria sulfation is via platinum and thus adsorbed sul-fur oxides may accumulate preferentially at the Pt-ceria interface and thentransform into interfacial sulfates during the heating ramp. Therefore, the en-hancement in methane oxidation observed during the ignition experiment islikely related to the formation of new interfacial active sites.
The extinction-ignition hysteresis may result from the reduction-oxidation ofceria during the experiments. Sulfation of ceria in presence of SO2 and O2 isoften coupled with the reduction of cerium from Ce(IV) to Ce(III) [65]. As inour previous studies, this is considered more as a dynamic process, which isoperative as long as oxygen is consumed in the sulfate formation process, andcould thus explain the diminishing promotion over time. The hysteresis maythus be related to ceria (re-)oxidation as this process likely proceeds via differ-ent mechanisms at different temperatures. It is generally accepted that ceriacan be oxidized by O2 from the gas phase at high temperatures, whereas at lowtemperatures oxygen spillover is the main route [49,52]. Thus during ignition,the onset of oxygen spillover upon sulfate formation can in principle induce anincrease of the number of available platinum sites for methane dissociation bybreakage of oxygen self-poisoning and/or platinum oxides as discussed previ-ously [19]. However, a detailed analysis of the measured oxygen concentrationindicates that all consumed oxygen is used for total oxidation of methane andnot for oxidation of SO2. This implies that a significant part of the sulfateformation involves lattice oxygen present in the ceria structure rather thandissociated gas phase oxygen. Thus breakage of oxygen self-poisoning and/orplatinum oxides seems to play a minor role in this case. Further, the gradient insulfate concentration between the surface and bulk of ceria may act as drivingforce for diffusion of sulfates into the bulk [33], associated with a correspond-ing diffusion of oxygen from the bulk to the surface of the ceria resulting inoxidation of ceria sites [40]. This is further supported by the DRIFTS results,which show a connection between sulfate formation and ceria reduction. Theoccurrence of bulk diffusion phenomena during the heating process, accompa-nied by partial ceria (re-)oxidation, is therefore demonstrated, so explainingthe lower extent of ceria reduction at 500◦C. Finally, the diminishing SO2
promoting effect with time on stream as well as the catalyst deactivation af-ter sulfur exposure can be explained by a progressive saturation of the ceriasupport by sulfates, eventually blocking both active sites on ceria and oxygenmobility in the Pt/ceria system.
In summary the present study shows that by comparing results from platinumcatalysts with different support materials the noble metal-support interactionplays a major role in sulfur promoted low-temperature methane oxidation.Nevertheless the study also shows that the results for the different systemsshould, in many respects, be treated separately as each system also exhibit
18

distinct unique properties that govern different surface processes, in the case ofceria even bulk processes, influencing the methane oxidation. This is especiallyevident in the presence of sulfur, as both promoting and/or inhibiting effectshave been observed on the different catalysts.
5 Concluding remarks
The role of the support and noble metal-support interactions on sulfur pro-moted low-temperature methane oxidation have been studied by comparingsilica, alumina and ceria supported platinum catalysts. Transient flow-reactorexperiments with in presence and absence of SO2 show that the catalytic ac-tivity is strongly dependent on the nature of the support material. The resultssupport that methane oxidation occurs exclusively on platinum sites for thePt/silica sample for which SO2 exposure only leads to lower methane conver-sion due to a site competition between SO2 and CH4 adsorption as a first stepfor the respective subsequent oxidation reactions. Also for Pt/alumina, themethane oxidation proceeds on the platinum sites. However, the oxidation ofmethane is promoted upon SO2 exposure trough the formation of (surface) sul-fates, likely at the noble metal-support interface, that function as highly activesites for methane dissociation. For Pt/ceria, the oxidation of methane occursnot only on the platinum sites but likely also on sites located at the noblemetal-support interface. Moreover, ceria may contribute to the overall oxida-tion kinetics via spillover processes, for example oxygen spillover can reducethe effect of oxygen inhibition here observed for Pt/silica and Pt/alumina.Exposing Pt/ceria towards SO2 leads, in line with our previous study [19],to a temporary promotion of the methane oxidation, likely via formation of(surface) sulfates in the noble metal-support interface, followed by long-terminhibition due to nearly complete sulfation of the ceria support, i.e., forma-tion of surface and bulk sulfates. Furthermore, upon exposure to SO2 ceria isreduced. Eventually, due to bulk diffusion of surface sulfates, ceria becomessaturated and both the oxygen mobility and the active sites on ceria becomesblocked.
6 Acknowledgments
This study has been performed at the Competence Centre for Catalysis, whichis financially supported by Chalmers University of Technology, the SwedishEnergy Agency and the member companies: AB Volvo, Volvo Car Corporation,Scania CV AB, Saab Automobile Powertrain AB, Haldor Topsøe A/S andECAPS AB. Parts of the work have been performed within the InGAS project
19

which is financially supported by the European Commission, FP7 Programme(Proj. no. 218447). The authors gratefully acknowledge the funding from theKnut and Alice Wallenberg Foundation and the Swedish Research Councilfor the advanced transmission electron microscopes and for financial projectsupport (Dnr KAW 2005.0055 and Proj. no. 621-2008-3229).
References
[1] R. Burch and M. Hayes, J. Mol. Catal. A Chem. 100 (1995) 13.
[2] P. Gelin and M. Primet, Appl. Catal. B: Environ. 39 (2002) 1.
[3] S.H. Oh, P.J. Mitchell and R.M. Siewert, J. Catal. 132 (1991) 287.
[4] R. Burch and P.K. Loader, Appl. Catal. B: Environ. 5 (1994) 149.
[5] P. Gelin, L. Urfels, M. Primet and E. Tena, Catal. Today 83 (2003) 45.
[6] J.K. Lampert, M.S. Kazi and R.J. Farrauto, Appl. Catal. B: Environ. 14 (1997)211.
[7] R. Burch, P.K. Loader and F.J. Urbano, Catal. Today 27 (1996) 243.
[8] F.H. Ribeiro, M. Chow and R.A. Dallabetta, J. Catal. 146 (1994) 537.
[9] C.F. Cullis, T.G. Nevall and D.L. Trimm, J. Chem. Soc. Farad. Trans. 1(68)(1972) 1406.
[10] R. Burch and P.K. Loader, Appl. Catal. A: Gen. 122 (1995) 169.
[11] V.P. Zhdanov, P.-A. Carlsson, B. Kasemo, J. Chem. Phys. 126 (2007) 234705.
[12] P.-A. Carlsson, E. Fridell, M. Skoglundh, Catal. Lett. 115(1-2) (2007) 1.
[13] P.-A. Carlsson, M. Nordstrom and M. Skoglundh, Top. Catal. 52 (2009) 1962.
[14] E. Becker, P.-A. Carlsson, H. Gronbeck and M. Skoglundh, J. Catal. 252 (2007)11.
[15] E. Becker, P.-A. Carlsson, L. Kylhammar, M.A. Newton and M. Skoglundh, J.Phys. Chem. C 115 (2010) 944.
[16] E. Becker, P.-A. Carlsson and M. Skoglundh, Top. Catal. 52 (2009) 1957.
[17] V. Dupont, J.M. Jones, S.-H. Zhang, A. Westwood and M.V. Twigg, Chem.Eng. Sci. 59 (2004) 17.
[18] G. Corro, C. Cano and J.L. Garcia Fierro, Catal. Comm. 9 (2008) 2601.
[19] L. Kylhammar, P.-A. Carlsson and M. Skoglundh, J. Catal. 284 (2011) 50.
[20] H.C. Yao, H.K. Stepien and H.S. Gandhi, J. Catal. 67 (1981) 231-6.
20

[21] C.P. Hubbard, K. Otto, H.S. Gandhi and K.Y.S. Ng, J. Catal. 144 (1993) 484.
[22] R. Burch, E. Halpin, M. Hayes, K. Ruth and J.A. Sullivan, Appl. Catal. B:Environ. 19 (1998) 199.
[23] A. F. Lee, K. Wilson, R. Lampert, C. Hubbard, R. Hurley, R. McCabe and H.Gandhi, J. Catal. 184 (1999) 491.
[24] M. Skoglundh, A. Ljungqvist, M. Petersson, E. Fridell, N. Cruise, O. Augustssonand E. Jobson, Appl. Catal. B: Environ. 30 (2001) 315.
[25] A. Hinz, M. Skoglundh, E. Fridell and A. Andersson, J. Catal. 201 (2001) 247.
[26] G. Corro, R. Montiel and C.L. Vazquez, Catal. Commun. 3 (2002) 533.
[27] L. Zhang, D. Weng, B. Wang and X. Wu, Catal. Commun. 11 (2010) 1229.
[28] K. Wilson, C. Hardacre and R.M. Lambert, J. Phys. Chem. 99 (1995) 13755.
[29] J.P. Brunelle, Pure Appl. Chem. 50 (1978) 211.
[30] C. Wang-Hansen, C.J. Kamp, M. Skoglundh, B. Andersson and P.-A. Carlsson,J. Phys. Chem. C 115 (2011) 16098.
[31] U.H. Tegtmeyer, P. Weiss and R. Schlogel, Fressenious J. Anal. Chem. 347(1993) 263.
[32] D. Bassi, P. Tosi and R. Schlogel, J. Vac. Sci. Technol. 16(1) (1998) 114.
[33] O. Saur, M. Benistel, A.B.M. Saad, J.C. Lavelley, C.P. Tripp and B.A. Morrow,J. Catal. 99 (1986) 104.
[34] L. Kylhammar, P.-A. Carlsson, H. H. Ingelsten, H. Gronbeck and M. Skoglundh,Appl. Catal. B: Environ. 84 (2008) 268.
[35] A. Datta, R.G. Cavell, R.W. Tower and Z.M. George, J. Phys. Chem. 89 (1985)443.
[36] G. Busca, Phys. Chem. Chem. Phys. 1 (1999) 723.
[37] V. Ermini, E. Finocchio, S. Seshi, G. Busca and S. Rossini, Appl. Catal. A:Gen. 190 (2000) 157.
[38] P.-A. Carlsson, S. Mollner, K. Arnby and M. Skoglundh, Chem. Eng. Sci. 59(2004) 4313.
[39] S.R. Ryu, I. Noda and Y.M. Jung, Appl. Spectros. 64 (2010) 1017.
[40] C. Binet, A. Badri and J.-C. Lavalley, J. Phys. Chem. 98 (1994) 6392.
[41] E. Odier, Y. Shuurman and C. Mirodatos, Catal. Today 127 (2007) 230.
[42] M.B. Mitchell, V.N. Sheinker and M.G. White, J. Phys. Chem. 100 (1996) 7550.
[43] M. Waqif, P. Bazin, O. Saur, J.C. Lavalley, G. Blanchard and O. Touret, Appl.Catal. B: Environ. 11 (1997) 193.
21

[44] P. Bazin, O. Saur, J.C. Lavalley, G. Blanchard, V. Visciglio and O. Touret,Appl. Catal. B: Environ. 13 (1997) 265.
[45] T. Luo and R.J. Gorte, Appl. Catal. B: Environ. 53 (2004) 77.
[46] F. Bozon-Verduraz and A. Bensalem, J. Chem. Soc. Faraday Trans. 90 (1994)653.
[47] T. Shido and Y. Iwasawa, J. Catal. 136 (1992) 493.
[48] C. Li, Y. Sakata, T. Arai, K. Domen, K-i. Maruya and T. Onishi, J. Chem. Soc.Faraday Trans. 85 (1989) 929.
[49] C. Li, Y. Chen, W. Li and Q. Xin, Stud. Surf. Sci. Catal. 77 (1993) 217.
[50] L.J. Hoyos, H. Praliaud and M. Primet Appl. Catal. A: Gen. 98 (1993) 125.
[51] B. Roldan Cuenya, Thin Solid Films 518 (2010) 3127.
[52] P.-A. Carlsson and M. Skoglundh, Appl. Catal. B: Environ. 101 (2011) 669.
[53] A.-P. Elg, F. Eisert and A. Rosen, Surf. Sci. 382 (1997) 57.
[54] D. Watson, J. van Dijk, J. Harris and D. King, Surf. Sci. 506 (2002) 243.
[55] Y. Yazawa, N. Kagi, S. Komai, A. Satsuma, Y. Murakami and T. Hattori, Catal.Lett. 72 (2001) 157.
[56] Y. Yazawa, N. Takagi, H. Yoshida, S. Komai, A. Satsuma, T. Tanaka, S. Yoshidaand T. Hattori, A, Appl. Catal. A: Gen. 233 (2002) 103.
[57] P. Mariaudeau, J. Dutel, M. Defaux and C. Naccache, in: Metal-Support andMetal-Additive Effects in Catalysis, Elsevier, Amsterdam, 2002, pp. 95-104.
[58] W. Tang, Z. Hu, M. Wang, G.D. Stucky, H. Metiu and E.W. McFarland, J.Catal. 273 (2010) 125.
[59] R. Poisson, J.P. Brunelle and P. Nortier, Catalyst Supports and SupportedCatalysts Technology and Applied Concepts, Butterworths, Boston, 1987.
[60] E. Xu, K. Seshan and J.R.H. Ross, Appl. Catal. B: Environ. 11 (1996) 65.
[61] T. Wang, A. Vazquez, A. Kato and L.D. Schmidt, J. Catal. 78 (1982) 306.
[62] H.S. Gandhi and M. Shelef, Appl. Catal. 77 (1991) 175.
[63] St. Astegger and E. Bechtold, Surf. Sci. 122 (1982) 491.
[64] M. Happel, L. Kylhammar, P.-A. Carlsson, J. Libuda, H. Gronbeck and M.Skoglundh, Appl. Catal. B: Environ. 91 (2009) 679.
[65] M.Y. Smirnov, A.V. Kalinkin, A.V. Pashis, A.M. Sorokin, A.S. Noskov, K.C.Kharas and V.I. Bukhtiyarov, J. Phys. Chem. B 109 (2005) 11712.
22

10 nm
10 nm
10 nm
a)
b)
c)
Fig. 1. TEM micrographs as prepared a) 4%Pt/silica, b) 4%Pt/alumina and c)4%Pt/ceria samples.
23

600
400
200
0
Con
sum
ptio
n [p
pm]
500400300200100Temperature [°C]
400
300
200
100
0
600
400
200
0
Con
sum
ptio
n [p
pm]
400
300
200
100
0
600
400
200
0
Con
sum
ptio
n [p
pm]
400
300
200
100
0
a) Pt/silica
b) Pt/alumina
c) Pt/ceria
CH4
CH4
CH4
O2
O2
O2
Fig. 2. Temperature programmed reaction of 500 ppm CH4 with 8% (black lines) and1500 ppm (red lines) O2 over a) 4%Pt/silica, b) 4%Pt/alumina and c) 4%Pt/ceriaduring cooling (dashed lines) and heating (solid lines). The ramp rate for bothcooling and heating is 5◦C/min and the GHSV is 15000h−1.
24

600
300
0
Con
sum
ptio
n [p
pm]
500400300200Temperature [°C]
300
200
100
0
600
300
0
Con
sum
ptio
n [p
pm]
300
200
100
0
600
300
0
Con
sum
ptio
n [p
pm]
300
200
100
0
a) Pt/silica
b) Pt/alumina
c) Pt/ceria
CH4
O2
CH4
CH4
O2
O2
3 6 9
Fig. 3. Temperature programmed reaction of 500 ppm CH4 with 1500 ppm O2 overa) 4%Pt/silica, b) 4%Pt/alumina and c) 4%Pt/ceria (black lines), with 20 ppm SO2
present (red lines) and after SO2 exposure (blue lines). The ramp rate is 5◦C/minand the GHSV is 15000h−1. The color code for the consecutive cycle numbers areindicated.
25

800
600
400
200
0
Con
sum
ptio
n [p
pm]
500400300200Temperature [°C]
400
300
200
100
0
800
600
400
200
0
Con
sum
ptio
n [p
pm]
400
300
200
100
0
800
600
400
200
0
Con
sum
ptio
n [p
pm]
400
300
200
100
0
a) Pt/silica
a) Pt/alumina
a) Pt/ceria
CH4
CH4
CH4
O2
O2
O2
4 5 6
Fig. 4. Temperature programmed reaction of 500 ppm CH4 with 1500 ppm O2 in thepresence of 20 ppm SO2 over a) 4%Pt/silica, b) 4%Pt/alumina and c) 4%Pt/ceriaduring cooling (dashed lines) and heating (solid lines). The ramp rate for bothcooling and heating is 5◦C/min and the GHSV is 15000h−1. The color code for theconsecutive cycle numbers are indicated.
26

40
30
20
10
0500400300200100
Temperature [°C]
40
30
20
10
0
SO
2 c
once
ntra
tion
[ppm
]
20
10
0
a) Pt/silica
b) Pt/alumina
c) Pt/ceria
4 5 6
Fig. 5. Outlet SO2 concentration during temperature programmed reaction of 500ppm CH4 with 1500 ppm O2 in the presence of 20 ppm SO2 over a) 4%Pt/silica, b)4%Pt/alumina and c) 4%Pt/ceria during cooling (dashed lines) and heating (solidlines). The ramp rate for both cooling and heating is 5◦C/min and the GHSV is15000h−1. The color code for the consecutive cycle numbers are indicated.
27
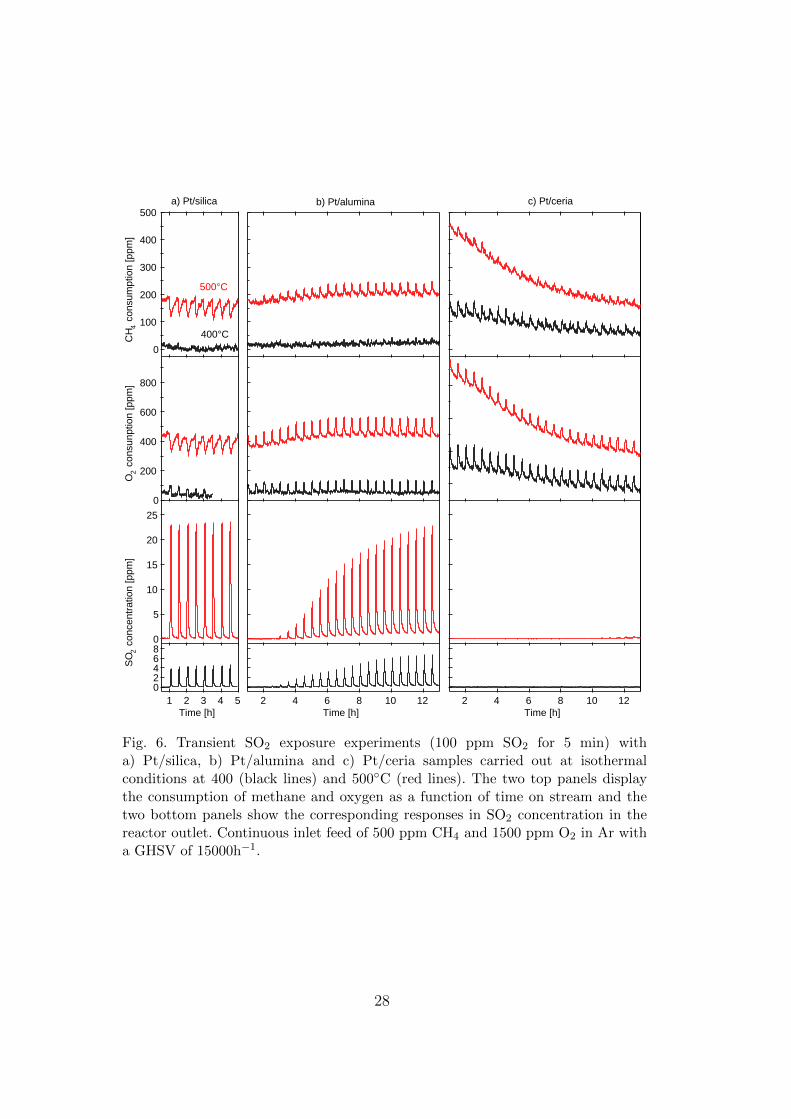
86420
54321Time [h]
25
20
15
10
5
0
SO
2 c
once
ntra
tion
[ppm
]
800
600
400
200
0
O2 c
onsu
nptio
n [p
pm]
500
400
300
200
100
0
CH
4 c
onsu
mpt
ion
[ppm
]
12108642Time [h]
12108642Time [h]
a) Pt/silica b) Pt/alumina c) Pt/ceria
500°C
400°C
Fig. 6. Transient SO2 exposure experiments (100 ppm SO2 for 5 min) witha) Pt/silica, b) Pt/alumina and c) Pt/ceria samples carried out at isothermalconditions at 400 (black lines) and 500◦C (red lines). The two top panels displaythe consumption of methane and oxygen as a function of time on stream and thetwo bottom panels show the corresponding responses in SO2 concentration in thereactor outlet. Continuous inlet feed of 500 ppm CH4 and 1500 ppm O2 in Ar witha GHSV of 15000h−1.
28

0,0
0,2
0,4
0,6 b) 400°C
a) 400°C 1 min 11 min 101 min 166 min 192 min
Abs
orba
nce
[a.u
.]
1550
1395
1590
-6-4-20
20
40
60
2
Pea
k ar
ea [a
.u.]
1
T ra
mp
2500 2250 2000 1750 1500 1250 1000
0,0
0,2
0,4
0,6
a) 500°C 1 min 11 min 101 min 166 min
Wavenumber [cm-1]
2335
2360
1205
0 40 80 120 160 200
-6-4-20
20
40
60 b) 500°C
2
1
Time [min]
Fig. 7. Transient SO2 exposure experiments (40 ppm SO2) on 4% Pt/aluminaperformed in the DRIFT cell. Continuous inlet feed of 500 ppm CH4 and 1500ppm O2. The left panels show the IR spectra collected on the fresh sample (t =1 min) and after the first (t = 11 min), fourth (t = 101 min) and fifth (t = 166min) SO2 pulse at a) 400 and b) 500 ◦C. Also, an IR spectrum recorded after theheating ramp (t = 192 min) is shown. Right panels show the integrated peak areafor sulfate (indicated 1) and carbonate/carboxylate (indicated 2) species during thecorresponding experiments.
29

0,0
0,2
0,4
0,6
0,8
1,0 a) 400°C
1615
1101
1190
1 min 11 min 101 min 166 min 192 min
Abs
orba
nce
[a.u
.]
1365
1520
1545
2137
-2
0
50
100
150 b) 400°C
3
2
1
T ra
mp
Pea
k ar
ea [a
.u.]
2500 2250 2000 1750 1500 1250 1000
0,0
0,2
0,4
0,6
0,8
1,0 b) 500°Ca) 500°C
1 min 11 min 101 min 166 min
Wavenumber [cm-1]0 40 80 120 160 200
-2
0
50
100
150
3
1
Time [min]
Fig. 8. Transient SO2 exposure experiments (40 ppm SO2) on 4% Pt/ceria performedin the DRIFT cell. Continuous inlet feed of 500 ppm CH4 and 1500 ppm O2. Theleft panels show the IR spectra collected on the fresh sample (t = 1 min) andafter the first (t = 11 min), fourth (t = 101 min) and fifth (t = 166 min) SO2
pulse at a) 400 and b) 500 ◦C. Also, an IR spectrum recorded after the heatingramp (t = 192 min) is shown. Right panels show the integrated peak area forsulfate/sulfite (indicated 1) and carbonate/carboxylate (indicated 2) species duringthe corresponding experiments.
30

Paper 3
Role of support on NOx-assisted low-temperature oxidation of methane over Pt-based catalysts D. Bounechada, P.-A. Carlsson, L. Kylhammar, S. Fouladvand, T. Pingel, E. Olsson and M. Skoglundh In preparation


1
Role of support on NOx-assisted low-temperature oxidation of methane over Pt-based catalysts
Djamela Bounechada1,2, Per-Ander Carlsson2,3, Lisa Kylhammar2,3, Sheedeh Fouladvand2,3, Torben Pingel3,4, Eva Olsson3,4, Magnus Skoglundh2,3
1 Dipartimento di Energia, Politecnico di Milano, 20133 Milano (Italy) 2 Competence Centre for Catalysis,
3 Department of Chemical and Biological Engineering, 4 Department of Applied Physics,
Chalmers University of Technology, SE-412 96 Göteborg (Sweden)
Abstract
The effect of NO and NO2 on low-temperature methane oxidation has been studied over Pt supported on silica, alumina and ceria by means of transient experiments in the presence and absence of NOx. Results show a clear dependence of the catalytic activity on the nature of the support material and on its interaction with noble metal. Upon addition of NO2, an inhibiting effect is observed for the Pt/silica catalyst, likely due to the formation of an oxygen layer on the platinum surface (or alternatively of platinum oxide). For both Pt/alumina and Pt/ceria catalysts the presence of NOx results in a temporary enhancement of methane oxidation, followed by long-term deactivation. Formation of nitrates at the noble metal-support interface, acting as new active sites for the first H abstraction, is suggested to explain the promoting effect. The consecutive formation of carbonates on the support material might be responsible of the catalyst deactivation, due to the blockage of active sites and of oxygen mobility.
Keywords: Environmental catalysis; Promoted surface processes; Methane dissociation; In situ infrared spectroscopy; Nanoparticles; Platinum; Silica; Alumina; Ceria
1. Introduction
The use of natural gas as fuel for cars has been spreading in the last decade. The lower sulfur content together with the reduced NOx and particulate emissions make lean-burn gas engines a valid “green” alternative to the conventional gasoline or diesel ones [1]. Furthermore, the low carbon to hydrogen ratio of natural gas, whose main component is CH4, allows also the reduction of CO2 emissions. However, the presence of unburned methane in the exhausts represents a problem
2
because of the high Global Warming Potential (GWP) of this molecule. Furthermore, the higher stability of CH4 in comparison with the higher hydrocarbons coming from gasoline engines makes its combustion more difficult, so that the design of catalytic materials exhibiting high activity towards low temperature methane oxidation still remains a challenge.
Nowadays, the most active catalysts for this purpose are noble metals supported on metal oxides. Among noble metals, platinum and palladium are the most commonly used and studied catalysts. Since metallic platinum is more active than platinum oxide, platinum-based catalysts exhibit higher reactivity than palladium ones in the combustion of methane under reducing atmospheres [2]. On the contrary, the use of palladium is preferred under lean conditions [3,4,5], since platinum suffers of oxygen self-poisoning. However, stable palladium sulfates can be formed in the presence of sulfur, leading to premature catalyst deactivation [4,6]. Thus, the use of the more sulfur tolerant Pt-based catalysts under lean conditions still remains of interest [4,5].
In order to reduce the precious metals content and therefore the cost of the catalyst, more effective oxidation strategies are needed. Several methods to improve catalytic performances have been proposed. One could be modifying the composition of the active phase by combining different precious metal or by adding promoters. Yamamoto et al [7] observed a considerable improvement of the catalytic behavior over bimetallic Pt-Pd systems in comparison with monometallic Pt and Pd prepared according to the same procedure. Shinjoh et al. [8] found that Ba addition to Pt catalyst suppresses the hydrocarbon chemisorption on the Pt catalyst, so promoting the oxidation of hydrocarbons. Another strategy for the enhancement of catalyst performance could be affecting the composition of the exhaust gas, for instance by periodic operation. This technique consists in periodic alternation of the feed gas between net oxidizing and net reducing compositions and is usually applied to three way catalysts (TWCs). Several authors proposed that the improved catalytic performances may origin from an optimal mixing in the composition of the adsorbed species on the active sites caused by the alternation of rich and lean pulses [9,10,11]. Another approach could be the addition to the exhausts of saturated hydrocarbons of higher molecular weight which can be easily oxidized. The consequent circumvention of inhibition by oxygen could explain the decrease in the light-off temperature observed by Corro et al. [12] after addition of C2-C4 alkanes over a pre-sulfated Pt/Al2O3. Finally, an interesting promoting effect was observed for low-temperature methane oxidation by addition of sulfur dioxide on Pt supported on Al2O3 [13,14,15] and CeO2 [15,16]. Although the addition of SO2 to the exhausts cannot be realistically considered because of the toxicity and corrosivity of this species, the comprehension of this phenomenon still remains of interest for the design of catalysts with permanent high activity towards methane oxidation.
In a previous work [15], the effect of SO2 has been studied over three different platinum-based catalysts, supported on SiO2, Al2O3 and CeO2. The formation of sulfates at the noble metal-support interface was found to play a major role on sulfur-promoted low-temperature oxidation of methane.
It was also previously shown that the mechanism of sulfur oxides storage into SOx trap involves SO2 oxidation to SO3 over Pt and its subsequent adsorption on the support as a sulfate [17]. It is worth noticing that this mechanism is very similar to that proposed for NOx storage on Pt/BaO

3
systems [18,19]. Furthermore, Burch et al. [20] shown that oxidation of CH4 by NO over Pt/SiO2 and Pt/Al2O3 occurs at much lower temperature than the corresponding CH4/O2 reaction.
In view of the above mentioned affinities between NOx and SOx, the study of the effect of NO and NO2 on methane oxidation reaction could be useful in the understanding of the mechanisms of low-temperature promotion and of the role played by the Pt-support interface. In this work the influence of NOx on catalytic methane oxidation has been addressed over three Pt-based catalysts, supported on SiO2, Al2O3 and CeO2.
2. Experimental
2.1. Catalyst preparation and characterization
Three catalyst samples were prepared by impregnation of SiO2, Al2O3 and CeO2 with a platinum precursor solution according to the incipient wetness method, in order to obtain samples with 4 wt% Pt. Monolithic samples of each catalyst were prepared by using the dip-coating technique: 200 mg of coating (composed of catalyst powder and binder) were attached on cordierite monoliths. Detailed information about the material used, the catalysts preparation procedures and characterization technique can be found in a previous work [15]. Here we just mention that the specific surface area for the Pt/silica, Pt/alumina and Pt/ceria catalysts were calculated to be 117, 173 and 156 m2/g, respectively. Further, the results of transmission electron microscopy (TEM) showed that a significant fraction of the platinum crystals are very small, i.e. below 2 nm in all three samples.
2.2. Experimental setup
2.2.1. Continuous gas-flow reactor system
Experiments with monolith samples were performed using a continuous gas-flow reactor described in a previous work [15]. Individual mass flow controllers (LOW-∆P-FLOW, Bronkhorst) were used to compose the gas feed. The O2, NOx and CH4 flows were introduced to the reactor through three air actuated high speed 4-way pulse valves (Valco, VICI) which allowed precise changes in the gas composition.
For the measurement of the outlet gas composition, the experimental rig was equipped with a mass spectrometer (Airsense Compact, V&F). The Ion-Molecule Reaction (IMR) ionization method was used to follow the mass to charge ratios (m/z) 30 (NO) and 46 (NO2), 17 (NH3) and 44 (N2O), 14 (N) and 28 (CO) by using mercury, xenon and krypton as primary gas, respectively. M/z 2 (H2), 15

4
(CH4), 18 (H2O), 32 (O2) and 44 (CO2 and N2O) were measured according to the Electron Impact (EI) ionization method.
2.2.2. In situ Fourier transformed infrared spectroscopy
In situ infrared Fourier transformed (FTIR) measurements were performed with powder samples in diffuse reflectance mode using a Bio-Rad FTS6000 spectrometer equipped with a high-temperature reaction cell (Praying Mantis, Harrick Scientific) and a MCT detector. Spectra were collected in the wavenumber region between 4000 and 1000 cm-1 with a resolution of 1 cm-1. The temperature of the sample holder was measured with a thermocouple (k-type) and controlled with a PID regulator (2416, Eurotherm). Individual mass flow controllers (LOW-∆P-FLOW, Bronkhorst) were used to introduce the gases. Moreover, to facilitate precise transients, the NOx feed was introduced via an air actuated high-speed gas valve (Valco, VICI). The outlet gas composition was analyzed by a mass spectrometer (QuadStar 420, Balzers) following the m/z 2 (H2), 14 (N), 15 (CH4), 17 (NH3), 18 (H2O), 28 (CO), 30 (NO), 32 (O2), 40 (Ar), 44 (CO2 and N2O), and 46 (NO2).
2.3. Experimental procedures
2.3.1. Catalytic activity studies in continuous gas-flow reactor
In order to achieve a common starting point for the experiments, all samples were pretreated with 8 vol.-% O2 and 500 ppm CH4 at 500°C for 1 h using a total flow of 500 ml/min, corresponding to a gas hourly space velocity (GHSV) of 15000 h-1. This GHSV was kept constant and Ar was used as carrier gas in all flow-reactor experiments described in more detail below.
The temperature programmed reaction (TPReaction) experiments, starting with pretreated samples, were performed by decreasing the temperature by 5°C/min from 500 to 100°C, dwelling for 20 min and then increasing the temperature to 500°C and dwelling for another 20 min with 1500 ppm O2 and 500 ppm CH4 in the feed gas. This cooling-heating cycle was repeated two times (cycle 1-2) followed by another cycle (3) where 50 ppm NO (or NO2) was added to the feed and, finally, two cycles (cycle 4-5) again without NOx.
The transient NO (or NO2) exposure experiments were performed using pretreated samples by introducing 500 ppm CH4 and 1500 ppm O2 at 500°C, for 60 min. Subsequently the NOx exposure experiment was started by instantly introducing 100 ppm NO (or NO2) for a duration of 5 min to the reaction mixture and the response was followed until 25 min after the NOx exposure period. In total, this sequence was repeated 24 times, which corresponds to 2 h of NOx exposure.

5
2.3.2. In situ DRIFTS experiments
For each DRIFTS experiment, a new powder sample from the same preparation batch was used. The sample was pretreated with 8 vol.-% O2 and 1500 ppm CH4 at 500°C for one hour using a total flow of 100 ml/min. The wave number region 4000-1000 cm-1 was investigated with a spectral resolution of 1 cm-1.
The transient NO (or NO2) exposure experiments were performed with pretreated samples by introducing 500 ppm CH4 and 1500 ppm O2 in Ar at 500°C. Subsequently the experiment was started by introducing NO (or NO2) pulses (40 ppm for 5 min) in the reaction mixture and the response was followed for 20 min thereafter. This sequence was repeated four times after which the sample was exposed to NOx for 60 min, in total corresponding to 80 min with NOx exposure. The reference spectrum used for background subtraction was recorded in the reaction mixture 10 min before the first NOx pulse. Sample spectra were then collected each second for the first NOx pulse and every 30 s for the remaining pulses.
3. Results
3.1. Continuous gas flow reactor experiments
3.1.1. Temperature programmed reaction experiments
The results from the TPReaction experiments with NO and NO2 over the Pt/silica, Pt/alumina and Pt/ceria catalysts are reported in Fig. 1a-c, respectively. The methane conversion is reported as a function of the increasing inlet gas temperature for the oxidation of 500 ppm CH4 with 1500 ppm O2 for the fresh sample (cycle 2), during the addition of 50 ppm NO or NO2 to the feed gas (cycle 3) and after the removal of NOx from the feed (cycle 5).
The activity of the fresh Pt/silica sample towards methane oxidation is negligible below 350°C (Fig. 1a). The methane conversion starts to increase with the increasing temperature until reaching 37% at 500°C. The addition of 50 ppm NO to the feed gas does not affect methane conversion, as the ignition profiles of cycle 2 and 3 overlap (left panel), whereas ignition profile in the presence of 50 ppm NO2 is slightly shifted towards higher temperature (right panel). In both the experiments methane conversion after the removal of NOx (cycle 5) is equal to that observed for the fresh sample (cycle 2).
The methane conversion over the fresh Pt/alumina sample starts around 350°C and reaches a maximum of 38% and 44% at 500°C (Fig. 1b). The different maximum conversions observed in the two experiments are likely related to slightly different washcoat loadings on the two samples. As soon as NO is added at 500°C a sudden increase in methane conversion is observed up to 41%, followed by a slight decline until the original conversion value (38%) before cooling the reactor. During the dwelling time at 500°C after the third cooling/heating cycle in the presence of NO, a

6
further decay in methane conversion is observed from 38 to 35%, whereas as soon as NO is excluded from the feed gas mixture, the catalytic activity stabilizes around the latter value. In a similar way, as soon as NO2 is introduced in the feed gas at 500°C methane conversion increases up to 47%, then slightly decreases until the original conversion value (44%) is recovered before cooling the reactor. Besides, a lower methane conversion is reached at the end of the third heating ramp in presence of NO2 (42%), but any further activity decay is observed during the stationary at 500°C. In both the experiments the ignition profiles for cycle 2 and 3 overlap, whereas methane conversion after the removal of NOx (cycle 5) is slightly shifted toward higher temperatures.
Methane conversion over the fresh Pt/ceria sample is negligible at temperature below 300°C and reaches a maximum around 76% at 500°C (Fig. 1c). An instantaneous increase in methane conversion up to 82% is observed in correspondence with the addition of 50 ppm NO to the feed gas mixture at 500°C, followed by a decrease from 82 to 71% before the cooling ramp. A further decay is observed during the stationary at 500°C after the heating ramp in presence of NO with methane conversion passing from 66 to 61%. Furthermore, after the exclusion of NO from the feed gas mixture an instantaneous drop in methane conversion is seen from 61 to 54%. Similarly, when adding 50 ppm NO2 to the feed gas methane conversion instantaneously increases up to 83%. Then, a decay in the catalytic activity is observed during the stationaries at 500°C in the presence of NO2 before and after the third cooling/heating cycle from 83 to 75% and from 69 to 64%, respectively. Besides, after the exclusion of NO2 from the feed gas methane conversion instantaneously drops from 64 to 56%. A decrease in catalyst performances in presence of NO is clearly visible in the temperature range of 413-500°C (cf. cycles 2 and 3, left panel). On the contrary, when NO2 is present in the feed gas a higher methane conversion is observed between 230 and 380°C (right panel). Further, the ignition profiles of cycle 2 and 3 overlap between 380 and 430°C, whereas for higher temperatures the highest activity is obtained over the fresh sample. Finally, in both the experiments the conversion of methane after NOx exposure is lower (around 52% at 500°C) and negligible below 350°C (cf. cycles 2 and 5).
The O2 consumption during the TPReaction experiments has been calculated both on the basis of the O2 outlet concentration (O2
in – O2out) and according to CH4 oxidation stoichiometry (O2
in-2(CH4
in-CH4out)). The O2 consumption profiles during the cooling/heating ramps in presence of 50
ppm NO or NO2 (cycle 3) are shown in Fig. 2a-c for the Pt/silica, Pt/alumina and Pt/ceria samples, respectively, as a function of the inlet reactor temperature.
The O2 consumption profiles calculated according to the above described methods almost overlap for all the samples during the cooling/heating ramps in the presence of NO (Fig. 2, left panels) and during the cooling ramp in the presence of NO2 (Fig. 2, right panels). On the contrary, the three catalysts show different behavior during the heating ramps in the presence of NO2. For both the Pt/alumina and the Pt/ceria samples the O2 consumption profiles calculated from the O2 outlet concentration are markedly lower than those calculated according to the CH4 oxidation stoichiometry for the whole investigated range of temperatures. It is worth to note that at low temperatures even negative values of O2 consumption are calculated, i.e. O2 is produced. Finally, for the Pt/silica sample the O2 consumption profiles still overlap.

7
The NO and NO2 outlet concentration profiles during the cooling/heating ramps in presence of 50 ppm NO or NO2 (cycle 3) for the Pt/silica, Pt/alumina and Pt/ceria samples are shown in Fig. 3a-c, respectively, as a function of the inlet reactor temperature.
With reference to the TPReaction experiments with NO for the Pt/silica sample (Fig. 3a, left panel), a decrease in NO outlet concentration is observed during the heating ramp starting from 100°C, together with an increase in NO2, until a minimum of NO and a contemporary maximum of NO2 are reached around 225°C. Then the NO and NO2 outlet concentrations start to increase and decrease, respectively, approaching the thermodynamic equilibrium for the NO oxidation reaction above 240°C. Besides, the NOx outlet concentration profiles during the cooling and the heating ramps are almost overlapped. During the TPReaction experiments with NO2 (Fig. 3a, right panel), the NO2 outlet concentration continuously decreases during the heating ramp, whereas on the contrary the NO outlet concentration continuously increases. Once again, the NOx outlet concentration profiles during the cooling and the heating ramps are almost overlapped.
In the case of the TPReaction experiments with NO for the Pt/alumina sample (Fig. 3b, left panel), the trend for the NO concentration during the cooling ramp is similar to that obtained over the Pt/silica sample, even if the minimum is here higher and somehow shifted towards higher temperature (240°C). The NO2 profile during the cooling ramp is lower than that for Pt/silica and characterized by a maximum around 255°C; moreover, NO2 is not detected below 150°C. Even if thermodynamic equilibrium for NO oxidation is always approached above 400°C, higher NOx outlet concentrations are detected during the heating ramp than during the cooling ramp for the whole investigated range of temperatures. For the heating ramp two maxima for NO concentration are seen at 180 and 365°C, the first associated to a net release of NO, and a minimum is present at 275°C. Finally, the NO2 profile also show two maxima (at 240 and 325°C), whereas no NO2 is detected below 140°C. With reference to the TPReaction experiments with NO2 (Fig. 3b, right panel), the NO outlet concentration decreases during the cooling ramp, as for the Pt/silica. However, here the NO2 concentration detected during the cooling ramp is lower as compared to the Pt/silica sample and a maximum is observed around 190°C. Although thermodynamic equilibrium for NO2 disproportion is always approached above 450°C, the NOx profiles during the heating ramp are above those obtained during the cooling ramp for the whole investigated range of temperatures. During the heating ramps two maxima of NO concentration can be distinguished around 150 and 355°C and a minimum is seen around 235°C. Finally, the NO2 profile also show two maxima (around 180 and 300°C), the second associated with a net release of NO2, and a minimum is seen around 225°C.
In the case of the TPReaction experiments with NO for Pt/ceria (Fig. 3c, left panel), NO2 is not detected during the cooling ramp but only between 200 and 400°C during the heating ramp, with a maximum around 305°C. The NO concentration decreases during the cooling ramp, passes through a minimum around 305°C and increases again. Finally, two maxima at 185 and 335°C are observed for the NO outlet concentration during the heating ramp and a net release of NO is registered in the range of temperature between 120 and 400°C. For the TPReaction experiments with NO2 (Fig. 2c, right panel), NO2 is not detected during the cooling ramp and it is present only between 100 and

8
385°C during the heating ramp, with a maximum release at 275°C. The NO outlet concentration decreases during the cooling ramp, with a plateau between 290 and 225°C. On the contrary, two maxima of NO concentration are detected during the heating ramp around 180 and 340°C and a minimum is present around 245°C.
3.1.2. Transient NOx experiments
The results of the transient NOx exposure experiments over Pt/silica, Pt/alumina and Pt/ceria carried out at 500°C are shown in Fig. 4a-c, respectively. Top and bottom panels show CH4 and O2 consumption during NOx pulsing, respectively.
For the Pt/silica sample, no changes in methane consumption can be distinguished when pulsing 100 ppm NO or NO2 at 500°C (Fig. 4a, top panel). The sample undergoes a slight deactivation during the first two hours of time on stream, then a nearly constant value of methane consumption is maintained. The concentration of NOx at the reactor outlet during the transient NO and NO2 exposure experiments is around 94 and 83 ppm respectively, and it is the same for all the pulses. In both the experiments the contribution of NO2 to the total NOx outlet concentration is of minor relevance (around 2 ppm), since the thermodynamic equilibrium of the NO oxidation reaction strongly favors NO at 500°C. The O2 outlet concentration is nearly constant during the transient NO exposure experiment, following methane oxidation stoichiometry. On the contrary, an appreciable decrease in the O2 consumption is observed in correspondence of NO2 pulses.
For the transient NOx exposure experiments performed over the Pt/alumina sample, the methane consumption slightly increases in the presence of both NO and NO2 (Fig. 4b, top panel). An overall decrease of methane consumption is observed during the first three hours of the experiments, then the activity is maintained. Once again the concentration of NO2 at the reactor outlet is minor during both the transient NOx exposure experiments (around 2 ppm), whereas total NOx outlet concentration is around 90 and 93 ppm respectively, and it is the same for all the pulses. An appreciable increase of the O2 consumption occurs during the NO pulses, becoming less pronounced after three hours of time on stream. On the contrary, the O2 consumption decreases in the presence of NO2 and this effect seems to be more pronounced the longer the exposure.
Finally, for both the transient NOx exposure experiments over Pt/ceria the methane consumption increases in presence of NOx, whereas it decreases rapidly during the NOx-free periods leading to an overall deactivation of the catalyst (Fig. 4c, top panel). In both cases the concentration of NO2 at the reactor outlet is minor (around 2 ppm), whereas the total NOx outlet concentration is 100 and 88 ppm for the transient NO and NO2 exposure experiments respectively, and it is the same for all the pulses. The O2 consumption clearly increases during the NOx pulses, even if in a minor extent when pulsing NO2.
9
3.2. In situ DRIFT spectroscopy measurements
The DRIFTS results of the transient NOx exposure experiments at 500°C for Pt/alumina and Pt/ceria are shown in Fig. 5 and 6, respectively. Panels a show the IR spectra collected during the same experiments, whereas panels b display the corresponding total absorbance (Gram-Schmidt signal) in the wavenumber region between 4000 and 1000 cm-1. The dashed area on panels b represents the periods with NOx presented in the feed.
Fig. 4a show the IR spectra collected on the fresh Pt/alumina sample (t = 1 min), during the third (t = 53.1 min) and the fifth (t = 161.5 min) pulse, and after the third (t = 76.5 min) and the fifth pulse (t = 165.5 min), for the transient NO (top) and NO2 (bottom) exposure experiments respectively. The background spectra (not reported) show that the infrared radiation is completely absorbed by Al2O3 between 1200 and 1000 cm-1 with the present experimental setup, due to the use of non-diluted samples. Therefore, this wavelength range won’t be considered when discussing the results on Pt/alumina samples.
The spectrum collected after 1 min during the transient NO exposure experiment presents no absorption bands, which reflects no changes with respect to the background spectrum (Fig. 4a, top panel). The appearance of a double negative broad band at 2360 and 2335 cm-1 at the beginning of the third NO pulse (t = 53.1 min) can be easily associated to asymmetric stretching of gaseous CO2 [21,22,23]. In the spectrum collected at the end of the firth pulse (t = 161.5 min) a new positive band can be clearly distinguished at 1556 cm-1, that we associate with carbonates on the alumina surface [24]. At the same time, two new positive bands appear at 3767 and 3714 cm-1 (not shown) related to surface OH groups [25,26,27,28]. It is worth noticing that the spectra collected after the third and the fifth pulse (t = 76.5 and 165.5 min) overlap with those collected during the corresponding pulse, which means that all the superficial species formed in presence of NO are stable even after NO exposure at 500°C. Finally, during the whole experiment the Gram-Schmidt intensity does not change significantly (Fig. 5b, top panel), indicating that only negligible amounts of surface species are formed.
As regarding the transient NO2 exposure experiment at 500°C, the spectrum collected after 1 min overlap with the background spectrum, since no absorption bands can be detected (Fig. 5a, bottom panel). Once again a double positive broad band appears at 2362 and 2337 cm-1 at the beginning of the third NO2 pulse (t = 53.1 min), easily associated to asymmetric stretching of gaseous CO2. Further, two series of positive sharp adsorption bands appear in the carbonate/carboxylate region of the spectrum (1800-1400 cm-1) and in the region of surface OH groups (3900-3550 cm-1). The spectrum collected after the third pulse (t = 76.5 min) shows the disappearance of all the peaks previously observed. After longer exposure to NO2 (t = 161.5 min), a new adsorption band appears around 1551 cm-1, likely associated to surface carbonates, whose intensity slightly decreases after NO2 exposure (t = 165.5 min). The value of the Gram-Schmidt intensity is nearly constant during the whole experiment, showing a slight increase only during long exposure to NO2 (Fig. 5b, bottom panel), likely because of surface carbonates formation in a minor extent. Finally, positive peaks of

10
total absorbance appear during the experiment, in correspondence with the detection of the double positive broad band associated with gaseous CO2.
As regarding Pt/ceria, Fig. 6a shows the IR spectra collected on the fresh sample (t = 1 min), during the first (t = 2.1 min), the second (t = 28.1 min) and the fifth pulse (t = 103.1 min), and after the fifth pulse (t = 166.5 min) for the transient NO (top) and NO2 (bottom) exposure experiments.
Since the results obtained during the NO and NO2 pulsing are qualitatively similar, they will be described together. The spectrum collected after 1 min does not present any absorption band, reflecting no changes with respect to the background. During the first NOx pulse (t = 2.1 min) four absorption bands can be distinguished at 1519 (with a shoulder at 1478 cm-1), 1220, 1128 and 1018 cm-1, whereas three weak negative bands are localized at 2365, 2331 and 1094 cm-1. According to literature, the absorption bands at 1519, 1478, 1220, 1128 and 1018 cm-1 can be associated with the formation of various superficial carbonate and/or carboxylate species [16,21,29,30,31,32,33,34]. Accordingly, a sudden increase in the Gram-Schmidt signal is observed immediately upon NOx introduction (Fig. 6b). Besides, the negative absorbance values found around 1094 cm-1 (Fig. 6a) could be associated with desorption of methoxy species [33], whereas the double negative band at 2365 and 2331 cm-1 is related to gaseous CO2 [21]. Looking at the IR spectrum collected during the second NOx pulse (t = 28.1 min), the bands at 1519, 1478 and 1220 cm-1 decrease their intensities, whereas a new weak absorption band appears around 1341 cm-1, likely associated with bulk-like carbonate species [32,33,35], and the peak at 1128 cm-1 disappears. More difficult is the assignment of the new weak negative band registered at 1145 cm-1: we suggest that this band is associated with desorption of methoxy species. A further decrease in the intensities of the absorption bands at 1519, 1478 and 1220 cm-1 is observed during the fifth NOx pulse (t = 103.1 min). On the contrary, the peak at 1341 cm-1 increases significantly. Besides, a new adsorption band around 1063 cm-1 is detected, likely related to bulk-like carbonate species onto ceria [32,33]. Finally, in all the spectra collected during the NOx-free periods (e.g. t = 166.5) the carbonate/carboxylate bands at 1519, 1478 and 1220 cm-1 completely disappear, whereas the bands at 1341, 1063 and 1018 cm-1 further increase their intensities. Hence, the sudden decrease in the Gram-Schmidt signal observed after the NOx pulses (Fig. 6b) is due to the loss of superficial carbonate/carboxylate species.
4. Discussion
In a previous work, based on continuous gas flow reactor and in situ DRIFTS experiments over silica, alumina and ceria supported platinum catalysts, we found that methane oxidation strongly depends on the nature of the support material [15]. The major role played by the support and the noble metal-support interaction was even more evident in the experiments performed in presence of SO2, where inhibiting, promoting and deactivating effects (or a combination of them) were observed on the different catalysts. In this work the effect of NO and NO2 on methane oxidation is studied over the same silica, alumina and ceria supported platinum catalysts. The aim is to gain further understanding on the mechanisms of the promoted methane oxidation, on the basis of the

11
analogy between SO2 and NO oxidation on platinum and SOx/NOx storage properties of the support materials [17].
Before discussing NOx effect on methane oxidation, it is useful to recall that methane oxidation for Pt supported catalysts mainly proceeds via a Langmuir-Hinshelwood (LH) mechanism over the platinum particles, so that similar activities are observed during the TPReaction experiments over fresh samples of silica and alumina supported Pt. The higher activity exhibited by the fresh Pt/ceria catalyst in comparison with Pt/silica and Pt/alumina may be due to the availability of extra active sites at the noble metal-support interface and/or on the surface of ceria, via either a LH or a Mars van Krevelen (MVK) mechanism. Further, oxygen mobility and spillover processes are recognized to play a major role in the activity of ceria supported catalysts [36,37,38]. This work shows how low-temperature performances of Pt supported catalysts in presence of NOx are also dependent on the nature of the support material and on noble metal-support interactions.
The long-term catalytic activity for the Pt/silica sample is not affected by NOx exposure, as the methane conversion profiles during TPReaction experiments for the fresh sample and after NOx exposure are overlapped (Fig. 1a). Similarly, methane consumption observed over Pt supported on silica before and after SO2 exposure was the same [15]. This is not surprising since silica is known to be inert towards acidic compounds like SOx and NOx [39,40], i.e. no sulfites/sulfates and nitrites/nitrates are expected to be formed on this support [24,41,42]. Accordingly, the NOx outlet concentration profiles evidence that NOx are not stored during reaction (Fig. 3a). Since methane oxidation was inhibited in the presence of SO2 due to a competition between SO2 and CH4 to be oxidized on the same active sites [15], one would expect a similar competition between CH4 and NO oxidation, as previously reported for propane oxidation [43]. On the contrary, the same methane conversion is here observed in absence and presence of NO (Fig. 1a, left panel). However, the inhibiting effect of NO on propane oxidation was observed at low temperatures (below 300°C) where NO is oxidized to NO2 and methane oxidation is negligible. Methane conversion over Pt/silica becomes important only above 400°C, where NO oxidation is limited by thermodynamic equilibrium (Fig. 3a, left panel) and thus not able to influence methane conversion. On the contrary, a lower methane conversion is observed during the TPReaction experiment in the presence of nitrogen dioxide above 400°C (Fig. 1a, right panel), where NO2 itself almost completely dissociates into NO and O (Fig. 3a, right panel). Since the dissociation energy of the ON-O bond (∆Hf298 = 305 kj/mol) is lower than that of the O-O bond (∆Hf298 = 498.34 kj/mol) [44], NO2 can be considered a stronger oxidizing agent than O2. The observed inhibiting effect on CH4 oxidation might therefore be explained by the formation of a layer of strongly chemisorbed oxygen on platinum (or platinum oxide) in line with what reported in literature [45,46]. As a further evidence, O2 is consumed according to the CH4 oxidation stoichiometry during the cooling/heating ramps in presence of NO2 (Fig. 2a, right panel), i.e. oxygen from NO2 dissociation remains on platinum. The appearance of negative peaks of O2 consumption in correspondence with NO2 pulses at 500°C (Fig. 4a, bottom panel) proves that at high temperature oxygen from NO2 dissociation is able to desorb as molecular oxygen, so that active sites on platinum are again available for methane dissociation and the inhibiting effect is no longer observed. Another possible explanation for CH4 oxidation inhibition

12
could be the competition between CH4 and NO2 adsorption on the same active sites, which would be in line with what observed in the simultaneous presence of CH4 and SO2 [15]. However, the results of the transient NO2 exposure experiment on Pt/silica seem to be in contrast with this hypothesis, since methane consumption is not influenced by NO2 pulsing (Fig. 4a, top panel). This apparent incongruence could be solved taking into account that O2 desorbs at 500°C, so that for each O2 released two active sites becomes again available for methane dissociation. Following this reasoning, inhibiting and promoting effects, associated with NO2 dissociation and successive O2 desorption, respectively, are balanced at this temperature so that neither a lower nor a higher methane conversion is observed.
A very different behavior is observed for the Pt/alumina catalyst. The ignition profiles during the TPReaction in presence of NO or NO2 do not show any inhibiting effect, but they overlap with those on the fresh samples (Fig. 1b). On the light of these results, the hypothesis of a competition between NO2 and CH4 adsorption on the same active sites seems to be less likely, since in that case an inhibiting effect would have been observed in presence of NO2. On the contrary, the behavior of the Pt/alumina sample suggests that a high oxygen coverage of platinum particles (or formation of platinum oxide) is likely responsible for the inhibiting effect observed over Pt/silica. In fact, in view of the agreement between the O2 consumption profiles (Fig. 2b, right panel), we suggest that all the oxygen coming from NO2 dissociation is likely involved in the process of nitrites/nitrates formation via spillover from the platinum particles to the support, thus preventing oxygen self-poisoning. Thus, the ability of the alumina support to store NOx species in the form of nitrites and/or nitrates, as evidenced by the NOx outlet concentration profiles during the cooling ramp (Fig. 3b, right panel), is of major importance in avoiding CH4 oxidation inhibition. On the other hand, during the heating ramp in presence of NO2 adsorbed nitrites/nitrates become unstable and desorb, releasing NOx and O2 in the gas phase (Fig. 3b and 2b, right panels), once again cleaning platinum surface from oxygen.
To contrast with results on Pt/silica, a slight promoting effect is observed in correspondence with NOx pulses during the transient NOx exposure experiments for the Pt/alumina catalyst (Fig. 4b, top panel). A promoting effect of NO on methane oxidation was already observed by Irusta et al. [47] in the gas-phase and by Vassallo et al. [48] for both Co- and H-mordenite catalyzed reaction. Since no NO conversion was observed, NO was proposed to act as a homogeneous chain initiator, so promoting the reaction between CH4 and O2 in the gas phase. Hence, a similar promoting effect would be expected independently from the support material. However, here we do not see any promoting effect on the Pt/silica sample in presence of NO so that the homogeneous mechanism can be ruled out. We propose that nitrates can be formed from reaction of NO with the highly reactive oxygen at the platinum-alumina interface. These nitrates can then attract electron density from platinum so forming a polarized couple (Ptδ+ NO3
δ-), able to enhance the abstraction of the first hydrogen from CH4, which is considered to be the rate determining step for methane oxidation reaction [20]. A similar mechanism was already invoked to explain the SO2-promoted CH4 oxidation over Pt/alumina [15]: in that case adjacent cationic (Ptδ+) and anionic (SO4
δ- ) moieties were proposed as new active sites. However the promoting effect was increasing with sulfur

13
exposure and a higher methane conversion was observed even after the exclusion of SO2 from the feed gas, which is not the case of NOx. Here a slight deactivation is observed during NOx exposure at 500°C for the TPReaction experiments and the peaks for methane conversion during NOx pulses are less pronounced with time on stream. Further a lower methane conversion is observed after the exclusion of NOx from the feed gas. Being the nitrates on alumina unstable at 500°C [49,50], i.e. highly reactive, it is likely that as soon as the C-H bond has been broken dissociate methane reacts with the nitrate at the interface. Nitrates formation, C-H breakage and nitrates decomposition are supposed to occur rapidly since total NOx concentration at the reactor outlet is almost identical to the inlet concentration. As further evidence, no nitrates absorption bands are detected in the DRIFTS experiments, i.e. if nitrates are formed their life-time is too short to be detected. On the contrary, an absorption band associated with carbonates appears during NOx pulses, with increasing intensity with NOx exposure, and remains even during the NOx-free periods (Fig. 5a). We propose that CO2 from the reaction between CH4 and nitrates is easily adsorbed at the noble metal-support interface, where it forms stable carbonates, similarly to what reported in literature for Pt/BaO/Al2O3 NOx traps [51]. Thus, the observed deactivation after NOx exposure could be due to the blockage by carbonates of the active sites at the platinum-alumina interface. Since we are suggesting a promoting mechanism via nitrates formation, and NOx storage is known to be favored in presence of NO2 than NO [18,52], it could sound surprising that the CH4 oxidation enhancement is observed to the same extent as a consequence of NO or NO2 exposure. However, NO-NO2 thermodynamic equilibrium strongly favors NO at 500°C, so that similar amounts of (unstable) NOx species are expected to form and leading to the same extent of CH4 oxidation promotion.
Finally, both promoting and deactivating effects of NOx are observed for the Pt/ceria catalyst. Methane conversion is not affected by the presence of NO during the TPReaction experiment, whereas in presence of NO2 methane oxidation starts at lower temperatures (230°C) and is enhanced up to 415°C (Fig. 1c). On the contrary, above 415°C a lower methane conversion is observed in presence of either NO or NO2. It is worth to note that this low temperature promoting effect of NO2 is visible only during the heating ramp. NOx outlet concentration profiles evidence that NOx can be stored on ceria during the cooling ramp in presence of NO2 (Fig. 3c, right panel). The overlap of O2 consumption profiles suggests that oxygen from NO2 dissociation is involved in the process of nitrite/nitrates formation over Pt/ceria, similarly to Pt/alumina, so avoiding oxygen self-poisoning or formation of platinum oxide. The hysteresis in the extinction-ignition cycles may be explained by a favored formation of interfacial nitrates via Pt at low temperatures, whereas at higher temperatures nitrates formation can occur on the entire ceria surface implicating that nitrates form to a lesser extent at the noble metal-support boundary. As already said, nitrates at the platinum-ceria interface could give origin to adjacent cationic (Ptδ+) and anionic (NO3
δ-) moieties, by attracting the electron density from the close platinum. These new active sites, which are stable at low temperature, become able to break the C-H bond around 230°C, so resulting in the anticipation of methane conversion in presence of NO2 if compared with the fresh sample (almost 100°C before). Since only a minor amount of NOx can be stored in presence of NO (Fig. 3c, left panel), the low temperature promoting effect can’t be seen during NO TPReaction. Possibly for a

14
similar reason, i.e. a lower NOx storage capacity [53], the low temperature promoting effect is not observed on the Pt/alumina sample. The fact that a plateau in methane conversion is observed instead of a constant increase with increasing temperature can be explained considering that nitrates become unstable in the same range of temperature. Thus, as the active sites at the interface are decomposed and NOx are released, the promoting effect diminishes, in line with the NO2 and O2 desorption observed between 195 and 315°C (Fig. 3c and 2c, right panels). According to the above explained mechanism, nitrates formed at low temperature are not directly involved as reactants in methane oxidation, but mainly act as promoter for the first H abstraction.
It is worth to note that methane consumption markedly increases during NOx pulses at 500°C for the Pt/ceria catalyst (Fig. 4c, top panel), to a higher extent than for the Pt/alumina catalyst. Similar mechanisms are likely involved in the high temperature CH4 oxidation enhancement over the Pt/ceria and the Pt/alumina catalysts. Unstable nitrates are rapidly formed at the Pt-support interface (to the same extent during NO and NO2 pulsing for thermodynamic reasons), which promote C-H breakage and quickly react with dissociated methane. Since no nitrates are detected during the DRIFTS experiments and the total NOx outlet and inlet concentrations are the same, these steps are supposed to be fast. Then a portion of the CO2 produced by this reaction is likely adsorbed at the interface and forms superficial carbonates. This is in line with the appearance of many absorption bands in the carbonates region during NOx pulses in the DRIFTS experiments (Fig. 6a), decreasing in successive pulses. In a second moment new peaks at 1341 and 1063 cm-1 appear, with increasing intensity with time, which persist even after NOx pulses. In view of their high stability, we propose the new bands to be associated with polydentate carbonates with a bulk-like structure [54]. The assignment of these species is further supported by the fact that the above mentioned wave numbers are close to those reported in literature for the bands related to cerium carbonate Ce(CO3)2 [55]. Besides, it is likely that bulk species form via migration of carbonates from the surface to the bulk of ceria, as supported by their appearance order and their opposite increasing/decreasing trends with NOx exposure. It is recognized that the presence of carbonates can somewhat poison NOx adsorption [51] and therefore the formation of the new active sites and the consequent adsorption of further carbonates, that is the reason of the observed decrease of superficial carbonates with time. It is worth noticing that during the NOx-free periods the absorption bands associated with superficial carbonates completely disappear. This could sound surprising, but it has already been demonstrated that the bond strength of carbonates on Pt/CeO2, and therefore their stability, depends on the composition of the feed gas [56], so that the presence/absence of NOx might make the difference.
In previews works [15,16] we showed that spillover mechanisms and oxygen mobility over the Pt/ceria system play a major role in the mechanism of sulfur promotion. Since the formation of sulfates on ceria was accompanied by ceria reduction, the availability of oxygen for ceria reoxidation was of crucial importance. Here, the formation of carbonates does not imply a change in ceria oxidation state, so that the promoting effect is less pronounced. However, oxygen spillover mechanisms remain of major importance to obtain high catalytic performances, so that the catalyst deactivation observed after NOx exposure might be due to the progressive blockage of oxygen mobility and of active sites on ceria by the bulk-like carbonates [57]. This would be also in line

15
with our previous works [15,16], where bulk-like sulfates were proposed to play a similar role in catalyst deactivation after SO2 exposure.
In summary here we demonstrated that the presence of nitrates as coadsorbates is of major importance in the enhancement of low-temperature methane oxidation, likely due to the promotion of the first H abstraction. In this picture, the choice of the support material on the basis of its adsorption proprieties and its ability to interact with the noble metal is crucial in the design of more active catalysts.
5. Concluding remarks
Platinum catalysts supported on silica, alumina and ceria are found to behave differently in presence of NOx, likely due to the different noble metal-support interactions and ability to store nitrite/nitrate characteristic of each support material. The inhibiting effect observed for the Pt/silica catalyst in presence of NO2 is thought to be an oxygen self-poisoning effect, via the formation strongly bonded oxygen on platinum (or platinum oxide) with oxygen coming from NO2 dissociation. The choice of a support material able to store nitrites/nitrates, e.g. alumina and ceria, allows to avoid inhibition, since oxygen from NO2 disproportion is directly involved in the NOx storage process. The enhancement of methane oxidation by NOx observed over both Pt/alumina and Pt/ceria catalysts is likely due to the formation of new active sites, in the form of a polarized couple Ptδ+- NO3
δ- at the noble metal-support interface, highly active for the C-H bond breakage. Although at low temperatures interfacial nitrates act as spectators in the promoting mechanism, nitrates formed at high temperature are unstable and might direct react with dissociated methane. A portion of the CO2 produced in this reaction is adsorbed on the support as surface carbonates, which are likely responsible of long-term catalyst deactivation. Carbonates diffusion from the surface to the bulk of the ceria supports eventually leads to catalyst deactivation due to the blockage of oxygen mobility, thus proving the major role played by this phenomenon in low-temperature methane oxidation over Pt/ceria.
Acknowledgments
This study has been performed at the Competence Centre for Catalysis, which is financially supported by Chalmers University of Technology, the Swedish Energy Agency and the member companies: AB Volvo, Volvo Car Corporation, Scania CV AB, Saab Automobile Powertrain AB, Haldor Topsøe A/S and ECAPS AB. Parts of the work have been performed within the InGAS project which is financially supported by the European Commission, FP7 Programme (Proj. no. 218447). The authors gratefully acknowledge the funding from the Knut and Alice Wallenberg Foundation and the Swedish Research Council for the advanced transmission electron microscopes.

16
References
[1] P. Gelin and M. Primet, Appl. Catal. B: Environ. 39 (2002) 1-37.
[2] R. Burch and P.K. Loader, Appl. Catal. B: Environ. 5 (1994) 149-164.
[3] R. Burch, P.K. Loader and F.J. Urbano, Catal. Today 27 (1996) 243-248.
[4] J.K. Lampert, M.S. Kazi and R.J. Farrauto, Appl. Catal. B: Environ. 14 (1997) 211-223.
[5] P. Gélin, L. Urfels, M. Primet and E. Tena, Catal. Today 83 (2003) 45-57.
[6] L.J. Hoyos, H. Praliaud and M. Primet Appl. Catal. A: Gen. 98 (1993) 125-138.
[7] H. Yamamoto and H. Uchida, Catal. Today 45 (1998) 147-151.
[8] H. Shinjoh, T. Tanabe, H. Sobukawa and M. Sugiura, Topics Catal. 16/17 (2001) 95-99.
[9] K. Cho, Ind. Eng. Chem. Res. 27 (1988) 30-36.
[10] S. Tagliaferri, R.A. Köppel and A. Baiker, Appl. Catal. B: Environ. 15 (1998) 159-177.
[11] M. Skoglundh, P. Thormahlen, E. Fridell, F. Hajbolouri and E. Jobson, Chem. Eng. Sci. 54 (1999) 4559-4566.
[12] G. Corro, C. Cano and J.L.G. Fierro J. Mol. Catal. A: Chemical 281 (2008) 179–183.
[13] V. Dupont, J.M. Jones, S.H. Zhang, A. Westwood and M.V. Twigg, Chem. Eng. Sci. 59 (2004) 17-29.
[14] G. Corro, C. Cano and J.L.G. Fierro, Catal. Comm. 9 (2008) 2601-2605.
[15] D. Bounechada, P.-A. Carlsson, L. Kylhammar, S. Fouladvand, T. Pingel, E. Olsson and M. Skoglundh, submitted to J. Catal.
[16] L. Kylhammar, P.-A. Carlsson and M. Skoglundh, J. Catal. 284 (2011) 50-59.
[17] L. Kylhammar, P.-A. Carlsson, H.H. Ingelsten, H. Gronbeck and M. Skoglundh, Appl. Catal. B: Environ. 84 (2008) 268–276.
[18] L. Olsson, H. Persson, E. Fridell, M. Skoglundh and B. Andersson, J. Phys. Chem. B 105 (2001) 6895–6906.
[19] I. Nova, L. Lietti, L. Castoldi, E. Tronconi and P. Forzatti, J. Catal. 239 (2006) 244–254.
[20] R. Burch, M.J. Hayes, J. Molec. Catal. A: Chemical 100 (1995) 13-33.
[21] E. Odier, Y. Schuurman and C. Mirodatos, Catal. Tod. 127 (2007) 230-237.
[22] P.A. Carlsson, S. Mollner, K. Arnby and M. Skoglundh, Chem. Eng. Sci. 59 (2004) 4313-4323.
[23] V. Ermini, E. Finocchio, S. Sechi, G. Busca and S. Rossini, Appl. Catal. A: Gen. 190 (2000) 157-167.

17
[24] M. Skoglundh, A. Ljungqvist, M. Petersson, E. Fridell, N. Cruise, O. Augustsson and E.
Jobson, Appl. Catal. B: Environ. 30 (2001) 315-328.
[25] T. Venkov, M. Dimitrov and K. Hadjiivanov, J. Molec. Catal. A: Chemical 243 (2006) 8-16.
[26] A. Datta, R.G. Cavell, R.W. Tower and Z.M. George, J. Phys. Chem. 89 (1985) 443-449.
[27] G. Busca, Phys. Chem. Chem. Phys. 1 (1999) 723-736.
[28] A. Hinz, M. Skoglundh, E. Fridell and A. Andersson, J. Catal. 201 (2011) 247-257.
[29] C. Li, Y. Sakata, T. Arai, K. Domen, K.I. Maruya and T. Onishi, J. Chem. Soc. Faraday Trans. I 85 (1989) 929-943.
[30] T. Shido and Y. Iwasawa, J. Catal. 136 (1992) 493-503.
[31] C. Li, Y. Chen., W. Li and Q. Xin, Studies in Surf. Sci. Catal. 77 (1993) 217-222.
[32] F. Bozon-Verduraz and A. Bensalem, J. Chem. Soc. Faraday Trans. 90 (1994) 653-657.
[33] C. Binet, A. Badri and J.C. Lavalley, J. Phys. Chem. 98 (1994) 6392-6398.
[34] F. Prinetto, M. Manzoli, S. Morandi, F. Frola, G. Ghiotti, L. Castoldi, L. Lietti, and P. Forzatti, J. Phys. Chem. C 114 (2010) 1127-1138.
[35] M. Haneda, T. Morita, Y. Nagao, Y. Kintaichi and H. Hamada, Phys. Chem. Chem. Phys. 3 (2001) 4696-4700.
[36] A. Trovarelli, Catal. Rev. Sci. Eng. 38 (1996) 439-520.
[37] C. Li, Y. Song, Y. Chen, Q. Xin, X. Han and W. Li, Stud. Surf. Sci. Catal. 112 (1997) 439-446.
[38] C. Bozo, N. Guilhaume and J.-M. Herrmann, J. Catal. 203 (2001) 393-406.
[39] R. Poisson, J. Brunelle and P. Nortier, Catalyst Supports and Supported Catalysts Technology and Applied Concepts, A.B. Stiles ed.; Butterworths (1987) 11.
[40] E. Xue, K. Seshan and J. Ross, Appl. Catal. B: Environ. 11 (1996) 65-79.
[41] C. Hubbard, K. Otto, H. Gandhi and K. Ng, J. Catal. 144 (1993) 484-494.
[42] T. Wang, A. Vazquez and L.D. Schmidt, J. Catal. 78 (1982) 306-318.
[43] D.C. Chambers and N.W. Cant, Appl. Catal. B: Environ. 41 (2003) 61-70.
[44] J.A. Dean, Lange’s Handbook of Chemestry, McGraw Hill Book Co., New York, NY (1985).
[45] L. Olsson and E. Fridell, J. Catal. 210 (2002) 340-353.
[46] J. Després, M. Elsener, M. Koebel, O. Kröcher, B. Schnyder and A. Wokaun, Appl. Catal. B: Environ. 50 (2004) 73-82.
[47] S. Irusta, E.A. Lombardo and E.E. Mirò, Catal. Lett. 29 (1994) 339-348.
[48] J. Vassallo, E. Mirò and J. Petunchi, Appl. Catal. B: Environ. 7 (1995) 65-78.

18
[49] E. Fridell, H. Persson, B. Westerberg, L. Olsson and M. Skoglundh, Catal. Lett. 66 (2000) 71-
74.
[50] S. Salasc, M. Skoglundh and E. Fridell, Appl. Catal. B: Environ. 36 (2002) 145-160.
[51] S.S. Chaugule, V.F. Kispersky, J.L. Ratts, A. Yezerets, N.W. Currier, F.H. Ribeiro and W.N. Delgass, Appl. Catal. B: Environ. 107 (2011) 26-33.
[52] I. Nova, L. Castoldi, L. Lietti, E. Tronconi, P. Forzatti, F. Prinetto and G. Ghiotti, J. Catal. 222 (2004) 377-388.
[53] M. Piacentini, M. Maciejewski and A. Baiker, Appl. Catal. B: Environ. 72 (2007) 105-117.
[54] G. Busca and V. Lorenzelli, Mat. Chem. 7 (1982) 89-126.
[55] J. Goldsmith and S. Ross, Spectrochim. Acta A 23 (1967) 1909.
[56] F. C. Meunier, D. Tibiletti, A. Goguet, D. Reid and R. Burch, Appl. Catal. A: Gen. 289 (2005) 104-112.
[57] L.G. Appel, J.G. Eon and M. Schmal, Catal. Lett. 56 (1998) 199-202.

19
Fig. 1- Temperature programmed reaction of 500 ppm CH4 with 1500 ppm O2 over a) 4% Pt/SiO2, b) 4% Pt/Al2O3 and c) 4% Pt/CeO2 (red lines), with 50 ppm NOx present (green lines) and after NOx
exposure (violet lines). The NO/NOx ratio in the feed gas is 1 and 0 in the left and right panels, respectively. The ramp rate is 5°C/min and the GHSV is 15000 h-1. The color code for the
consecutive cycle numbers are indicated.
0
20
40 2 3 5
0
20
40
100 200 300 400 500
0
20
40
60
80
100
CH
4 con
vers
ion
[%]
a) Pt/silica
b) Pt/alumina
c) Pt/ceria
Temperature [°C]100 200 300 400 500

20
Fig. 2 - Temperature programmed reaction of 500 ppm CH4 with 1500 ppm O2 in the presence of 50 ppm NOx over a) 4% Pt/SiO2, b) 4% Pt/Al2O3 and c) 4% Pt/CeO2 during cooling (black lines)
and heating (green lines). O2 consumption calculated on the basis of O2 outlet concentration (solid lines) and of CH4 conversion (dashed lines) are compared. The NO/NOx ratio in the feed gas is 1
and 0 in the left and right panels, respectively. The ramp rate is 5°C/min and the GHSV is 15000 h-
1.
0
200
400
0
200
400
100 200 300 400 500
0
200
400
600
800
1000
O2 c
onsu
mpt
ion
[ppm
]
a) Pt/silica
b) Pt/alumina
c) Pt/ceria
Temperature [°C]100 200 300 400 500

21
Fig. 3 - Outlet NO and NO2 concentrations during temperature programmed reaction of 500 ppm CH4 with 1500 ppm O2 in the presence of 50 ppm NOx (cycle 3) over a) 4% Pt/SiO2, b) 4%
Pt/Al2O3 and c) 4% Pt/CeO2 during cooling (dashed lines) and heating (solid lines). The NO/NOx ratio in the feed gas is 1 and 0 in the left and right panels, respectively. The ramp rate is 5°C/min
and the GHSV is 15000h-1.
0
50
100
c) Pt/ceria
b) Pt/alumina
a) Pt/silica
0
50
100
NO NO2
NO
x con
cent
ratio
n [p
pm]
100 200 300 400 500
100 200 300 400 5000
50
100
150
200
Temperature[°C]

22
Fig. 4 – CH4 (top) and O2 consumption (bottom) during transient NO (green lines) and NO2 (violet lines) exposure experiments (100 ppm NO or NO2 for 5 min) for a) Pt/silica, b) Pt/alumina and c) Pt/ceria samples carried out at isothermal conditions at 500°C. Continuous inlet feed of 500 ppm
CH4 and 1500 ppm O2 in Ar with a GHSV of 15000h-1.
100
200
300
400
500
CH4
O2
100 ppm NO 100 ppm NO2
Con
sum
ptio
n [p
pm] CH
4
CH4
a) Pt/silica b) Pt/alumina
c) Pt/ceria
0 2 4 6 8 10 12
200
400
600
800
1000
0 2 4 6 8 10 12
O2
O2
Time [h]0 2 4 6

23
Fig. 5 - Transient NO and NO2 exposure experiments (40 ppm NO or NO2) on 4% Pt/alumina performed in the DRIFT cell. Continuous inlet feed of 0.05% CH4 and 0.15% O2. The left panels
show the IR spectra collected on the fresh sample (t = 1 min), during the third (t = 53.1 min) and the fifth (t = 161.5 min) pulse, and after the third (t = 76.5 min) and the fifth (t = 165.5 min) pulse at
500°C. Right panels show the total absorbance between 4000 and 1000 cm-1 (Gram-Schmidt) during the corresponding experiments.
1 min
53.1 min
76.5 min161.5 min
165.5 min
a 40 ppm NO
Abso
rban
ce [a
.u.]
1556
0,02
0,000
0,001
0,002
0,003 b 40 ppm NO
GS
[V]
2500 2250 2000 1750 1500 1250 1000
a 40 ppm NO2
1551
Wavenumber [cm-1]
2337
2362
1 min
53.1 min
76.5 min161.5 min
165.5 min
0 20 40 60 80 100 120 140 160
0,000
0,001
0,002
0,003 b 40 ppm NO2
Time [min]

24
Fig. 6 - Transient NO and NO2 exposure experiments (40 ppm NO or NO2) on 4% Pt/ceria performed in the DRIFT cell. Continuous inlet feed of 0.05% CH4 and 0.15% O2. The left panels
show the IR spectra collected on the fresh sample (t = 1 min), during the first (t = 2.1 min), second (t = 28.1 min) and the fifth (t = 103.1 min) pulse, and after the fifth pulse (t = 165.5 min) at 500°C. Right panels show the total absorbance between 4000 and 1000 cm-1 (Gram-Schmidt) during the
corresponding experiments.
a 40 ppm NO
Abso
rban
ce [a
.u.]
1519 13
41
1220
1145
1128
1094
2331
2365
1478
1 min
2.1 min
28.1 min
103.1 min165.5 min
0,05
1018
0,000
0,001
0,002
0,003
b 40 ppm NO
GS
[V]
2500 2250 2000 1750 1500 1250 1000
a 40 ppm NO2
Wavenumber [cm-1]
1 min
2.1 min
28.1 min
103.1 min165.5 min
0 20 40 60 80 100 120 140 160
0,000
0,001
0,002
0,003
b 40 ppm NO2
Time [min]