strategies in east-central europe economic hardship ... · dieses dokument ist ausschließlich für...
TRANSCRIPT

www.ssoar.info
Economic hardship, migration, and survivalstrategies in East-Central EuropeWallace, Claire
Veröffentlichungsversion / Published VersionArbeitspapier / working paper
Empfohlene Zitierung / Suggested Citation:Wallace, Claire ; Institut für Höhere Studien (IHS), Wien (Ed.): Economic hardship, migration, and survival strategies inEast-Central Europe. Wien, 1999 (Reihe Soziologie / Institut für Höhere Studien, Abt. Soziologie 35). URN: http://nbn-resolving.de/urn:nbn:de:0168-ssoar-221896
Nutzungsbedingungen:Dieser Text wird unter einer Deposit-Lizenz (KeineWeiterverbreitung - keine Bearbeitung) zur Verfügung gestellt.Gewährt wird ein nicht exklusives, nicht übertragbares,persönliches und beschränktes Recht auf Nutzung diesesDokuments. Dieses Dokument ist ausschließlich fürden persönlichen, nicht-kommerziellen Gebrauch bestimmt.Auf sämtlichen Kopien dieses Dokuments müssen alleUrheberrechtshinweise und sonstigen Hinweise auf gesetzlichenSchutz beibehalten werden. Sie dürfen dieses Dokumentnicht in irgendeiner Weise abändern, noch dürfen Siedieses Dokument für öffentliche oder kommerzielle Zweckevervielfältigen, öffentlich ausstellen, aufführen, vertreiben oderanderweitig nutzen.Mit der Verwendung dieses Dokuments erkennen Sie dieNutzungsbedingungen an.
Terms of use:This document is made available under Deposit Licence (NoRedistribution - no modifications). We grant a non-exclusive, non-transferable, individual and limited right to using this document.This document is solely intended for your personal, non-commercial use. All of the copies of this documents must retainall copyright information and other information regarding legalprotection. You are not allowed to alter this document in anyway, to copy it for public or commercial purposes, to exhibit thedocument in public, to perform, distribute or otherwise use thedocument in public.By using this particular document, you accept the above-statedconditions of use.

Institut für Höhere Studien (IHS), Wien Institute for Advanced Studies, Vienna
Reihe Soziologie / Sociological Series No. 35
Economic Hardship, Migration, and Survival Strategies in East-Central Europe
Claire Wallace

Economic Hardship, Migration, and Survival Strategies in East-Central Europe
Claire Wallace
Reihe Soziologie / Sociological Series No. 35
March 1999
Claire Wallace Institut für Höhere Studien Stumpergasse 56, A-1060 Wien Phone: +43/1/599 91-213 e-mail: [email protected] Fax: +43/1/599 91-191
Institut für Höhere Studien (1HS), Wien Institute for Advanced Studies, Vienna

The Sociological Series is published by the Department of Sociology of the Austrian Institute for Advanced Studies (IHS) in Vienna. The series is meant to share work in progress in a timely way before formal publication. It includes papers by the Department’s teaching and research staff, visiting professors, graduate students, visiting fellows, and invited participants in seminars, workshops, and conferences. As usual, authors bear full responsibility for the content of their contributions.
All rights are reserved.

Abstract
This paper begins by looking at the characteristics associated with poverty in East-Central Europe, using a longitudinal cross-sectional sample survey of 11 countries conducted between 1991 and 1998 at five time points. There is a trend analysis of changes in levels of poverty in different countries using three indicators of poverty. These indicate very different patterns of poverty for the different post-communist countries, with the people of some countries (the Central European countries) getting gradually richer and the people of other countries (the former Soviet Union) getting poorer.
The paper then considers the characteristics of those who have suffered economic hardship.
The second part of the paper looks at the characteristics of those who expressed an interest in migration, this time concentrating on the Central European countries which have petitioned to join the European Union. The people who are poorest are not necessarily the ones who will migrate — indeed migration could be seen as an entrepreneurial strategy for improving living standards. Drawing upon qualitative interviews with migrants the paper goes on to look at the circumstances of migrants arguing that they should be situated in the context of household strategies and social networks in the region.
Zusammenfassung
Im ersten Teil dieses Papers werden unter Bezug auf eine Querschnittsumfrage in elf Ländern, die zwischen 1991 und 1998 zu fünf Zeitpunkten durchgeführt wurde, die charakteristischen Merkmale von Armut in Osteuropa diskutiert. Eine Trendanalyse der Veränderungen in der Ausprägung von Armut in den verschiedenen Ländern unterscheidet drei Indikatoren. Sie weisen auf sehr unterschiedliche Arten von Armut in den postkommunistischen Ländern hin, wobei die Bewohnerinnen zentraleuropäischer Länder allmählich reicher und jene der früheren Sowjetunion ärmer werden.
Danach werden die Charakteristika jener, die ökonomische Notlagen erleben, präsentiert.
Der zweite Teil des Papers behandelt die Merkmale jener Personen, die Interesse an Migration zeigen, und konzentriert sich dabei auf die zentraleuropäischen Länder, welche die Aufnahme in die Europäische Union anstreben. Es zeigt sich, daß nicht unbedingt die ärmsten Personen Interesse an Migration haben; vielmehr kann Migration als unternehmerische Strategie zur Verbesserung des Lebensstandards betrachtet werden.
Basierend auf qualitativen Interviews werden abschließend die Lebensumstände von Migrantlnnen im Kontext von Haushaltsstrategien und regionalen sozialen Netzwerken beschrieben.

AcknowledgementsWe would like to thank the Paul Lazarsfeld Gesellschaft for the use of the surveys and also the International Organisation for Migration, the Austrian National Bank JubliSumsfonds, and the Central European University for their sponsorship of various parts of the research. In particular I would like to thank Dr. Christian Haerpfer for his help.This paper was also presented at the UNESCO conference “Poverty from an international point of view”, The Hague, Netherlands 22nd and 23rd October 1998.

Contents
Introduction 1
PART A: THE PICTURE OF POVERTY 3Economic conditions in different post-communist countries Subjective indicators of poverty in East-Central Europe 7 Who is worse off? 13
PART B; RESPONSES TO POVERTY 23Migration as a response to poverty? 23 Actual migration behaviour: qualitative studies 33 Conclusions 40
Reference List 42Appendix 44

!

I H S — Wallace / Migration and Survival Strategies in East-Central Europe — 1
Introduction
The transformation of communist societies after 1989 was thought at first to put all of the countries of East-Central Europe on the road to democracy and a market economy. It is now clear that the impact of transformation has been very different in the different countries of the region and that these differences mean that there are divergent paths of transition for different groups of countries.1 It is not even certain that all the transitions in these countries are heading in the direction of democratic and market societies. In some cases, they seem to be going in quite another direction, towards authoritarian nationalist or quasi-communist regimes, for example. In some countries the economy has declined steadily since the “revolutions” as have the living standards of their citizens. In other countries there has been an improvement in living standards since the regime change, although not always continuous. The transformation of societies in East Central Europe has thus meant impoverishment rather than improvement for many people. However, it has also brought increased, even undreamed of, wealth to other people. In this paper we look at what outcome there has been for different groups of countries and what are the different population groups who are "winners" or “losers” of the transition. However, we also consider this in the context of one possible reaction - migration.
It was believed at first that the stark contrasts in living standards between the different East- Central European countries and the European Union would mean that millions of people would sweep across the borders into Western Europe as soon as those borders were opened. It was feared that these migrants would cause increasing burdens on the already straitened European welfare states. This has not happened. These fears have been revived in the context of the recent crisis in the Russian economy. Our contention is that these views were misfounded because they were based upon flawed and simplified models of migration. In particular they did not distinguish between short-term economic migration and emigration, and they failed to take into account the role of individual migrants in relation to their household.
Although some migration has taken place, there has been a dramatic increase in mobility. There are a great many people crossing borders, and many more border crossing points have been opened to cope with this. Mobility increases the economic and cultural communication between peoples but does not necessarily introduce strains on the welfare state. On the contrary, the costs of reproduction are born by the sending countries. It improves trade. It can be the seedbed of new entrepreneurial activities. It has helped many households in countries with collapsing economies to survive. Often it takes place in the
1 Wallace and Haerpfer 1998a.

2 — Wallace / Migration and Survival Strategies in East-Central Europe — I H S
context of the informal rather than the formal economy. However, it can also lead to rising xenophobia and increasingly exploitative treatment of migrants.2
In our research we have considered the subjective views of people in Central and Eastern European countries their own opinions about how the changes have affected them. We have also conducted surveys about migration potential and participation in the informal economy.3 These cross-sectional representative surveys have been conducted on a regular basis since 1991. These data are complemented by qualitative data in which we look at the experiences of different kinds of migrants4 and the survival strategies of households in selected countries.5 In order to understand the role of migration as a part of a survival strategy against economic hardship and falling living standards, it is important to conduct empirical research amongst the people of Eastern and Central Europe to find out what they are really doing, instead of relying only upon macro-economic indicators. Here we have first looked at macro-economic indicators, but then we have looked at the subjective views of the people of Central and Eastern Europe about their own situation. Finally, we have considered the strategies adopted by households to survive in the formal and informal economies. In other words, it is important to reconstruct the economy from the bottom up.
2 Sik 1998, Haerpfer and Wallace 1997.3 IOM report 1998, Haerpfer 1998.4 Wallace et al. 1997, Wallace et al. 1998.5 New studies underway which involve a qualitative study of households in Ukraine, Belarus, Bulgaria and Hungary are funded by the European Union INTAS scheme and the Jubllaumsfonds of the Austrian National Bank.

I H S — Wallace / Migration and Survival Strategies in East-Central Europe — 3
PART A: THE PICTURE OF POVERTY
Economic conditions in different post-communist countries
We have already indicated that there are increasing divergences between different postcommunist countries.6 This is illustrated in chart 1 which shows the GDP per capita in different countries (US dollar equivalents, Purchasing Power Parity Measures). This is a useful economic indicator, because it shows the real wealth of the citizens of each country in comparative perspective.7 We can see that the post-communist countries fall into three main groups. In the first group we have the advanced transition countries: Slovenia, Slovakia, Poland, Hungary, and the Czech Republic. Four out of these five countries are candidates for entry into the European Union and they could be said to be among the most successful of the reform countries. In these countries the GDP per capita income has risen since 1990, although usually after an initial slump. Slovakia, with her problems of democratic reform has, nevertheless, enjoyed economic growth similar to her Central European neighbours. Slovenia and the Czech Republic are the wealthiest countries, with GDP per capita not far behind the European Union average. However, they are still two or three times lower than the nearest EU neighbours - Austria and Germany - which happen to be some of the wealthiest EU countries. These countries all have direct borders with Germany and Austria, and their citizens can cross freely for short periods of time. Many are employed on short-term labour contracts in Germany and Austria8 although such employment seems to have declined in the last couple of years as more economic opportunities have opened up at home.
Chart 1 GDP per capita in different countries 1997
25000
6 Wallace and Haerpfer 1998.7 Statistics are from the WIIW, the Wiener Institut fiir Internationale Wirtschaftsvergleiche, especially from the report No. 248, June 1998. The PPP measures are calculated by WIIW.8 Honekopp 1997.

4 — Wallace / Migration and Survival Strategies in East-Central Europe — I H S
Elsewhere, we have analysed this group of countries on the borders of the European Union as a Central European buffer zone in terms of migration.9 This is because these are the outer borders of the Schengen group of countries and increasingly became targets for transit migrants and illegal border crossers or human traffickers from outside of the region, or even outside of Europe altogether. Bilateral agreements made with Schengen countries mean that these illegal migrants can be deported to the last country which they entered legally - in many cases the buffer zone countries.10 In addition, whilst the citizens of these countries could enter the European Union for some months quite legally and indeed were encouraged to do so through various scholarship and mobility schemes, the citizens of countries to the east and south of the buffer zone could not. They could only get as far as the buffer zone itself. In this way the buffer zone became an important meeting point for westerners wanting to establish themselves further east (multinational companies for example, English teachers) and easterners wanting to establish themselves further west. Russians, Caucasians and even Chinese set up businesses in the buffer zone more easily than they could have done in Sweden or Germany. The relative prosperity of the buffer zone in turn attracted migrant workers from further east. The buffer zone countries were thus forced to develop migration policies, and these tended to be modelled on the European Union, especially their western neighbours, Germany and Austria. Temporary guest workers became the model for certain kinds of labour migration, and policies were established for refugees and asylum seekers.
The next group of countries is represented by the southern East-Central European countries: Bulgaria, Romania, and Croatia. In these countries the transition process has not been so successful and has been further impeded by the Yugoslav War in the early 1990s and the international embargo introduced as a result.11 In these countries there has been some growth, but it has been uneven. In Romania and Bulgaria there has been a decline in the last two years as the road to reform has proven to be rather uneven, moving sometimes backwards and sometimes forwards. In these countries there is nevertheless considerable aspiration to become part of Europe and a desire to have market economies and democratic regimes.12 Although Croatia has enjoyed continuing economic growth since the ending of the war, the people there are very dissatisfied with the regime they find themselves in.13
The third group of countries are those of the former Soviet Union, represented in this graphic by Ukraine. In these countries, the GDP per capita has declined radically since 1990. In Ukraine it has fallen from 4490 to 2174 USD between 1990 and 1997. This represents a potentially catastrophic decline in living standards. Not surprisingly, the people in Ukraine are
9 Wallace, Chmouliar, and Sidorenko 1996.10 See IOM reports on transit migration11 As well as affecting the Federal Republic of Yugoslavia directly, this embargo had deleterious effects upon the neighbouring economies of Bulgaria, which depended upon Yugoslavia for trade, and this also encouraged the growth of cross-border smuggling to beat the embargo.12 Haerpfer 1998.13 Ibid. 1998

I H S — Wallace / Migration and Survival Strategies in East-Central Europe — 5
in general sceptical of market and democratic reforms; many of them preferred the security of the past communist system.14
In addition to these countries, our own surveys included the Federal Republic of Yugoslavia (Serbia and Montenegro) and also Belarus. There are few other surveys or statistics about these countries, but the situation in FRY tends to be similar to that in Croatia except even more extreme (extreme dissatisfaction with the current economy and political regime). The situation in Belarus fits more closely to that of Ukraine and Russia, although the economic crisis has not been as dramatic there. Belarus resembles more the authoritarian communist regimes of the past and claims to have economic success. At any rate, her citizens are not as dissatisfied as those in Ukraine and Russia.
The post-1989 transformations have resulted in high and rising unemployment in the countries of Eastern and Central Europe. Chart 2 shows the relative unemployment rates, which are highest in the Southern European countries, still rather high in the Central European group of countries and very low in the former Soviet Union. In the former Soviet Union the preferred strategy is to lay off people for “unpaid holidays" or not to pay the workers for periods of time rather than putting them out of work. Many people are therefore in work but not receiving any money. Even if they are receiving money, their incomes are mostly insufficient to live on. This indicator of unemployment is therefore rather meaningless in the former Soviet Union.
Chart 2 Unemployment in Eastern and Central Europe 1997
18 .
14 Ibid. 1998

6 — Wallace / Migration and Survival Strategies in East-Central Europe — I H S
In addition to these differences described so far, each of these countries have experienced rising divergences in wealth within the population. The creation of new classes of entrepreneurs as well as unemployed means that there are both winners and losers from the reforms. A recent survey estimated the losers to be between 30 per cent and 60 per cent of the populations of Hungary, Poland, and the Czech Republic.15 The losers include pensioners and others relying on state benefits, large families for whom family allowance has declined in value, the low skilled, the low educated and people living in deprived regions. It is clear from this and other surveys that the urban, educated and younger people support the regime change the most and see themselves as gaining the most from it. This is especially the case if they are self-employed or working in the new private sector.16
At the same time as increasing numbers of people come to depend upon the state for support, the state itself has been cut back due to privatisation measures but also in order to create a more market-oriented welfare state with work incentives.17 The fiscal basis of the state is undermined in some countries where it is difficult to collect taxes and where the informal economy takes over larger and larger parts of the economy - this is the case in some southern European countries and the countries of the former Soviet Union. In all countries there is a "fiscal crisis" as the revenues of the state are declining but the numbers of people dependent on the state are increasing.
The privatisation of welfare services such as health and education takes place either officially as part of a privatisation strategy or unofficially as citizens have to buy their own medicines and educational resources when the state is unable to provide them any longer.
All of these factors have resulted in increasing inequality and greater hardship for many people in Eastern and Central Europe. The transformation from communism has taken place at their expense.
However, the official economic indicators are often unsatisfactory. They make a general picture rather than looking at specific population groups. Also, they measure only some aspects of the formal economy and leave many others unmeasured. Income, for example, is only of limited use in countries where incomes were low but people enjoyed social goods from their employment such as housing, heating, children's nurseries and holiday homes. Furthermore, the official economic measures are only able to look at what people do in their main registered employment. Other employment they may hold which may be not registered and in which they may not pay social security or taxes is unrecorded. In addition, many people are able to survive on account of various kinds of household production - growing vegetables, keeping animals for domestic use and so on. These things could be called
15 Ferge, Sik et al. 1996.16 Wallace 1997.17 This was the conclusion of a series of studies carried out at the Institute for Advanced Studies in Vienna, funded by the OECD.

I H S — Wallace / Migration and Survival Strategies in East-Central Europe — 7
“informal economic activity" and whilst they do not appear in official statistics, they represent the difference between survival and non-survival, poverty and wealth for many households18. For these reasons, we also need to look at other data in order to understand the economic conditions of people in post-communist Europe, and here we turn first to surveys and then to qualitative data to fill out the picture of what is happening in post-communist societies.
In chart 3 we illustrate how we are using the idea of formal and informal sectors. The formal economy includes both the formal market sector (regulated, taxed, governed by formal laws) and the state sector which remains very important in each country. The informal sectors include the illegal marketised sector (small scale trading, extra jobs etc.), which takes place outside the law and is untaxed, as well as household production or self-provisioning. The relative importance of these sectors differs between countries and between households. Households survive by manipulating resources within and between each of these sectors. Recent research by Piirainen19 and by Rose20 indicates that the most successful strategies involve using resources from more than one sector together. Indeed, Piirainen argues that this is potentially a way in which people can not only survive but improve and consolidate their position in the social structure.
Subjective indicators of poverty in East-Central Europe
The surveys upon which we draw were carried out by the Paul Lazarsfeld Gesellschaft between 1991 and 1998 and looked at attitudes to economic and political reform, economic conditions, and other values in 11 post-communist countries: Poland, Hungary, the Czech Republic, Slovakia, Slovenia, Croatia, the Federal Republic of Yugoslavia, Romania, Bulgaria, Belarus, and Ukraine (see Appendix 1 for account of surveys). These were cross- sectional sample surveys, carried out according to a standardised method, so that we can make generalisations for the population. In 1998 a number of questions about migration were added and some of these we analyse in this paper (only those for the Central European buffer zone). In the first part of this analysis we have used three indicators of poverty based on three separate questions in the survey: whether households are worse off than they were in the past before the regime changes in 1989; if they are able to live from the income from their main job; if they are able to save money or if they had to borrow money to get by. Here we begin by looking at trend data for different countries.
a. Are they worse off than before?
One basic micro-economic indicator for the extent of economic coping of post-communist households is the analysis of the general economic state of the individual household before 1989 in comparison with the effects of an adaptation of household strategies after 1989. We
18 Rose and Haerpfer 1992.19 Piirainen 1997.20 Rose and Haerpfer 1992.
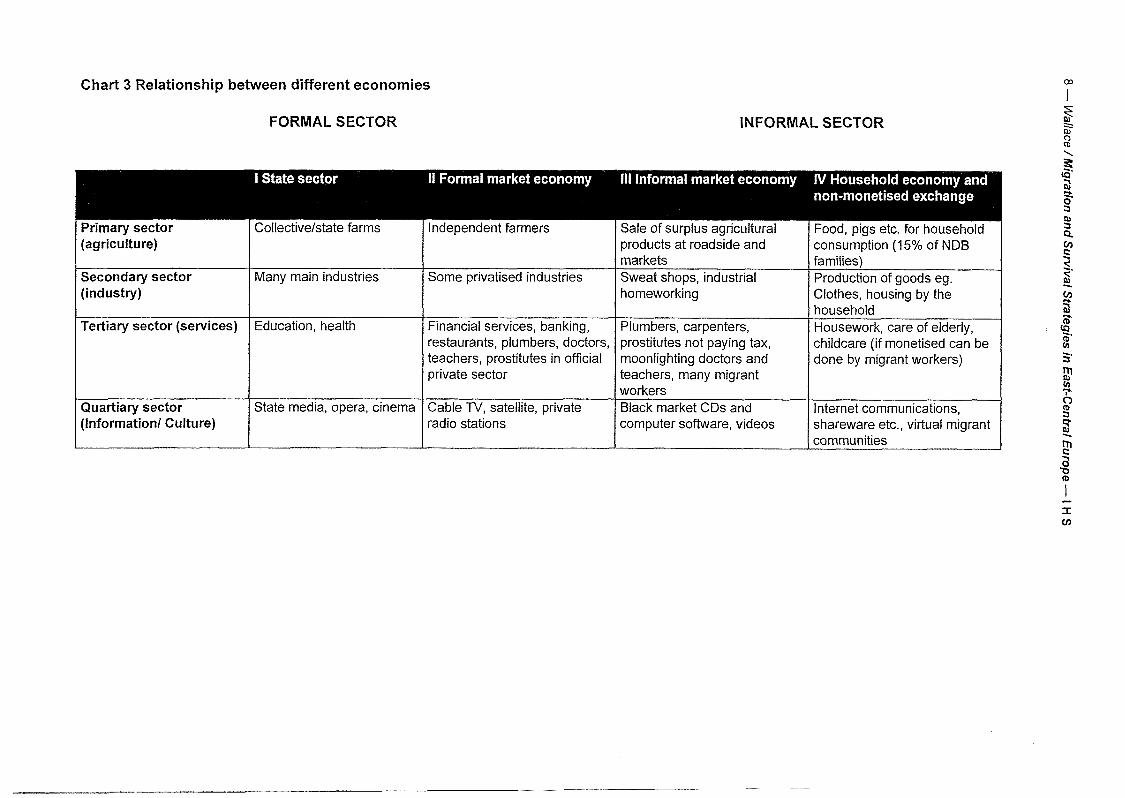
Chart 3 Relationship between different economies
FORMAL SECTOR INFORMAL SECTOR
1 State sector II Formal market economy III Informal market economy IV Household economy and non-monetised exchange
Primary sector (agriculture)
Collective/state farms Independent farmers Sale of surplus agricultural products at roadside and markets
Food, pigs etc. for household consumption (15% of NDB families)
Secondary sector (industry)
Many main industries Some privatised industries Sweat shops, industrial homeworking
Production of goods eg. Clothes, housing by the household
Tertiary sector (services) Education, health Financial services, banking, restaurants, plumbers, doctors, teachers, prostitutes in official private sector
Plumbers, carpenters, prostitutes not paying tax, moonlighting doctors and teachers, many migrant workers
Housework, care of elderly, childcare (if monetised can be done by migrant workers)
Quartiary sector (Information/ Culture)
State media, opera, cinema Cable TV, satellite, private radio stations
Black market CDs and computer software, videos
Internet communications, shareware etc., virtual migrant communities
Wallace
/ M
igration and
Survival Strategies in
East-Central Europe
— I H
S

I H S — Wallace / Migration and Survival Strategies in East-Central Europe — 9
analysed this phenomenon by asking all respondents, If the overall economic situation of the own household got better or worse during the period since 1989 (see table 1). The results are shocking: approximately 60 per cent of all post-communist households in Central and Eastern Europe are worse off today than before 1989, That is, they are losers of the process of economic transformation from a planned economy towards a market economy. Nevertheless, the general impression concerning that micro-economic indicator is that the share of households which are either in the same economic condition compared to 1989 or better off than before has increased between 1991 and 1998, albeit very slowly.
Table 1: Actual economic performance of households is better or the same than 1989Q: How do you compare your overall household economic situation with 9 years ago? Better today; the same; or worse today.
NDB 1 1991
NDB 2 1992
NDB3 NDB4 1994 1996
(% now better or the same)
NDB 5 1998 Change
NDB — Mean 38 37 34 38 36 -2
1. Czech Republic 47 49 50 61 54 7
2. Slovenia 20 38 47 55 50 30
3. Poland 39 32 38 50 49 10
4. Slovakia 32 38 37 41 46 14
5. Russia 44 47 32 38 44 0
6. Romania 53 47 44 34 41 -8
7. Bulgaria 34 46 41 41 40 6
8. Croatia * * 30 30 30 0
9. Hungary 32 27 25 28 28 -4
10. Belarus * 29 18 18 21 -8
11. FR Yugoslavia* * * * * 14 *
12. Ukraine •* 20 12 22 10 -10
in 1991, only 37 per cent of all households in Central and Eastern Europe had the same or a better situation compared to their standard of living before 1989. Between 1992 and 1996 that figure oscillated around 40 per cent of all post-communist households, whereas we have 42 per cent of households, either better off or in the same condition as before the regime changes, in spring 1998.
However, we find important differences between the Central European buffer zone countries (Czech Republic, Slovakia, Hungary, Poland, and Slovenia), where more people are able to live on their incomes and the situation is generally improving, the Southern European countries (Bulgaria, Romania, Croatia, and FRY), where things have not got much better and

10 — Wallace / Migration and Survival Strategies in East-Central Europe — I H S
may even have got worse, and the Eastern European block of countries (Belarus, Ukraine and Russia), where things have definitely got worse.
b. Participation in formal and informal economies
The informal economy always played an important part in communist societies, where it was an essential complement to the official economy. However, in post-communist societies, rather than disappearing, it took on a new importance. In the words of Endre Sik, there was a transformation from second economy to informal economy as the nature of the dominant economy changed and entrepreneurial activities were no longer illegal - indeed they were encouraged.21 In some countries, the informal economy is gradually transformed into formal economy as a taxation system is established, laws governing industry and commerce are elaborated and implemented, associational life and “civil society" starts to represent the interests of various elements of the market society, and capitalism, from being illegitimate, becomes legitimate. This does not mean that the informal economy disappears - but it is no longer an essential part of daily life for the majority of households. However, in countries where this has not happened, the informal economy takes over larger and larger areas of economic life. Where the state is weak or has lost control over the economy, transparent laws governing economic life are either not passed or are not implemented and were organisations which can represent different interest groups - trade unions, consumer societies, employers associations - are non existent or not able to oppose the development of private interest groups, then the informal economy becomes more and more important. Where capitalism is not governed by laws which are rational and legitimised, it is governed by informal values, social capital, and informal forms of organisation.22 As this develops, it is perhaps more and more difficult for the state to wrest back control of the economy, private interest groups (mafia, powerful families, and networks etc.) become more and more powerful. The absence left by the collapse of the state economy is filled with a private, illegal economy.
For this reason, we developed an indicator which could show the share of the newly established formal or regular economy compared to all economic activities. The higher the penetration of the new economic system with the formal economy, which is regular jobs, payment of taxes and social insurance etc., the more advanced is the process of transition towards a full-fledged market economy. If the informal sector is very big, which means that people do not pay taxes, do not contribute to social and health insurance schemes, have irregular jobs, than the structure of the emerging market economy is lagging behind. The first aim of the following indicator is to get an impression of how many households are already integrated in the formal and regular economy and what the size of the informal economy in a given post-communist country is.
21 Sik 1993.22 Wallace et al. 1997.

I H S — Wallace / Migration and Survival Strategies in East-Central Europe — 11
We measured the extent of penetration of the economic structure by the formal and regular
economy by asking the households if they are able to get enough money by a regular job within the formal economy. If they are not, then they must use a portfolio of supplementary or alternative activities in the informal economy in order to have a satisfying standard of living. At the beginning of the New Democracies Barometer in 1991, an average of 37 percent of all Central and Eastern European households was able to enjoy a satisfactory standard of living on the basis of a regular income that is either a regular salary or a pension or other public transfers as part of social and welfare policies (see table 11). This share of households which could live basically with one or more regular incomes grew over time to 39 per cent in 1992 and to 42 per cent in 1994. Since 1994 that percentage remained roughly at the same level of about 40 per cent of all households which could get by exclusively with a regular salary or other forms of regular income. The most recent New Democracies Barometer in spring 1998 showed that 42 per cent of all Central and Eastern European households could survive as part of the official economy on the one hand and the official welfare state on the other. That result has the important implication that almost 70 per cent o f all Central and Eastern European households are unable to get by financially on the basis of regular salaries or regular pensions. These households are forced to develop a whole portfolio of micro- economic activities beyond and outside the official economy in order to survive the process of economic transformation.
Once again, we find important differences between groups of countries. Whereas in the Central European buffer zone countries at least half are able to live on their regular salaries, this falls below half in the Southern European countries, and in Ukraine only 8 per cent are able to do so. In Croatia, Bulgaria, Russia, Romania, and Ukraine, the formal economy as a means of livelihood was declining, sometimes quite steeply. In the Central European buffer zone countries, the growing share of people who are able to live from their regular incomes and the decline in importance of the informal economy means that the regular market economy is becoming more and more established as the main means of livelihood. These are the successful transition countries. However, in Romania, Bulgaria, Belarus, and Ukraine more than 80 per cent of people depend upon income outside of their regular jobs and salaries. We could say that in these societies, the regular market economy has not penetrated very far, at least in the lives of ordinary people, and the irregular economy is an important means of survival. We can see in the differences between 1991 and 1998 that it is by implication actually growing as a means of survival. Less and less people can get by on their regular salaries in the Southern-East European countries and in the former Soviet Union.

12 — Wallace / Migration and Survival Strategies in East-Central Europe — I H S
Table 2: Getting by with regular job/incomeQ: Do you get enough money from your regular job to buy what you really need?
ND B1 NDB 2 NDB 3 NDB 4 NDB 5 1991 1992 1994 1996 1998 Change
(% reporting earning enough)
NDB — Mean 37 34 35 34 34 -3
1. Slovenia 41 58 58 45 63 22
2. Czech 46 53 58 55 58 12
3. Slovakia 39 38 46 32 53 14
4. Poland 38 34 43 41 52 14
5. Hungary 25 26 34 37 49 24
6. FR Yugoslavia * * * 38 *
7. Croatia * 28 27 18 26 -2
8. Belarus * 22 20 * 22 0
9. Bulgaria 28 29 24 36 17 -11
10. Romania 44 44 45 48 16 -28
11. Russia 31' 13 15 13 11 -20
12. Ukraine * 23 17 12 8 -15
c. Profiting, surviving or suffering?
Another subjective indicator of economic well-being that we used was to ask whether people had managed to save money, to just "get by" or spent their savings in the last year. This is a useful indicator of who might be worse off, who better off, and complements the indicators described so far.
Once more, we find that it is in the Central European buffer zone countries that people have been able to get by or even save money in the last year. Between 42 per cent and 77 per cent of the people in the different countries were able to get by in the last year. In the southern European countries the numbers are lower, but there has still been an increase in prosperity as measured by this indicator in all countries except for Romania, where people are worse off than they were in 1992 and 1994. In Romania and Ukraine the numbers able to get by or to profit were sinking, although in most countries, households managed to make ends meet by combining various different economies and different economic resources from outside their main jobs.

I H S — Wallace /Migration and Survival Strategies in East-Central Europe — 13
Table 3: The share of households getting by and making savings with household portfolioQ. In the past year has your family made savings or just got by or spent some savings or borrowed money or spent savings and borrowed money?
NDB 1 NDB2 NDB 3 NDB 4 NDB 5 1991 1992 1994 1996 1998 Change
(% making savings and getting by)
NDB - Mean 63 63 65 61 64 + 1
1. Hungary 68 64 67 66 77 9
2. Czech 71 72 72 75 76 5
3. Poland 74 62 69 60 74 0
4. Slovenia 69 70 78 69 68 0
5. FR Yugoslavia ★ * * * 67 *
6. Slovakia 62 65 67 68 66 4
7. Russia 62 75 77 66 * +4
8. Croatia ★ 58 62 57 65 7
9. Belarus * 61 62 45 61 0
10. Bulgaria 42 45 46 45 53 11
11. Romania 56 61 61 * 51 -5
12. Ukraine ★ 55 55 * 42 -13
Who is worse off?
So far, we have looked at general trends in poverty and the rise or decline of the informal sector in different countries. However, we also need to know within countries who is better off and who is worse off to see if this affects their inclination to migrate. For this we used the pooled data set to look at the effects of different socio-economic variables. We considered demographic indicators - gender, age, education, town size, and marital status. Next we considered the internal demography of the household - the presence of children and number of members. Then we considered the impact of employment using a variety of variables and finally the different sources of income of the household, both formal and informal. Thus, we considered in which sectors people were working, their experience of unemployment (as a household and as individuals) and what was their most important source of income inside and outside the different economic sectors described in chart 3.
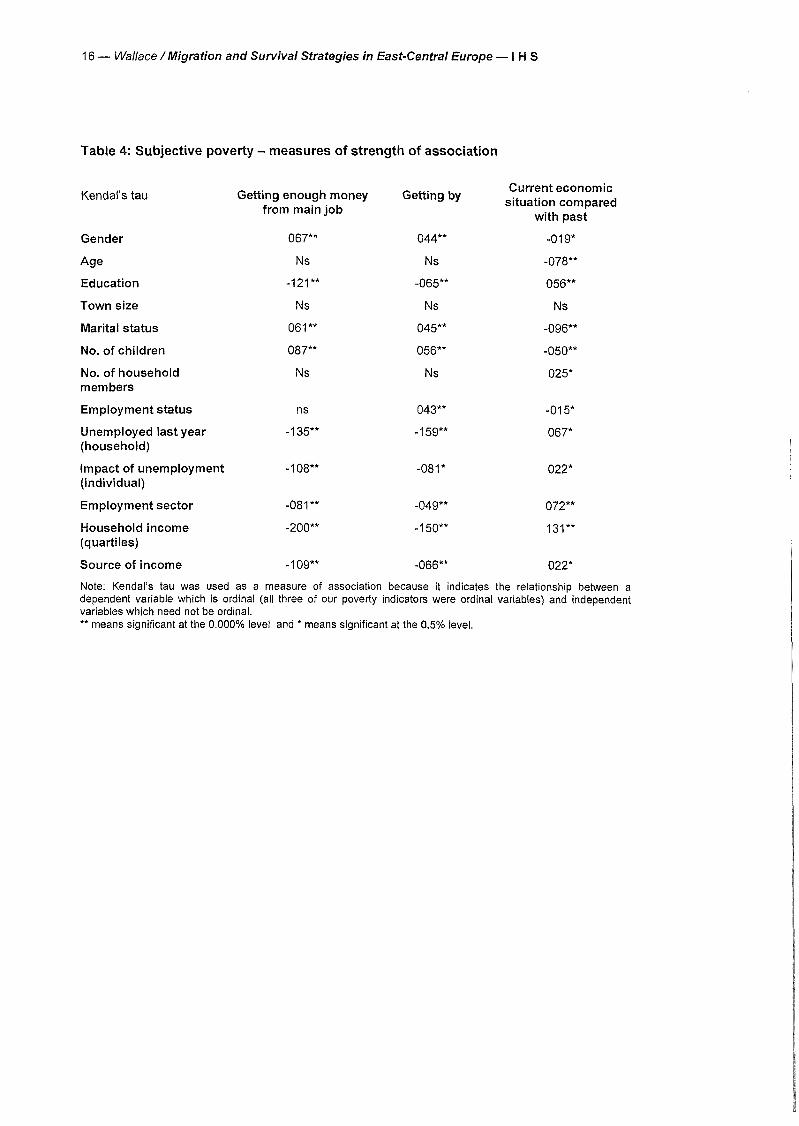
In table 4 we can see the overall measures of association - that is which variables were most strongly linked with the dependent variable - and in tables 5-7 we can see in more detail how they were linked by looking at the percentages. We have taken as dependent variables our three indicators of poverty which we already outlined in this paper.

14 — Wallace /Migration and Survival Strategies in East-Central Europe — I H S
We can see that gender is associated with poverty, with women being more likely to see themselves as poor on two of these indicators. However, in the case of the third indicator - situation now as compared with the past - there was very little association. Gender is a weak predictor of poverty.
Age, by contrast, is not an indicator of poverty at all. There was no significant association between age and poverty on two of the indicators of poverty, and on the third one it is unreliable - the young people in the sample would have been only children 9 years ago.
Education is a quite strong predictor of poverty, with the less educated being the worse off at present and feeling that they were better off in the past. This is a very strong and consistent finding. The former communist regimes did privilege and protect the position of ordinary working people. Under post-communist regimes, these people have lost out. This corresponds with other findings which show that the most educated feel that they have profited most from the changes.23
The indicator town size did not predict anything about poverty. There was no association between living in a rural or an urban area with subjective views of poverty.
The variable marital status was quite a good predictor of poverty. Single people were definitely better off, being more likely to feel that they get enough money from their main jobs, were able to get by without spending their savings and borrowing money and were less likely to think their position in the past was better. Widows are the worst off on this variable, followed by the divorced.
The number of children was also a good predictor of poverty - those with more children were worse off and those with no children were best off. However, there was no association with the number of household members.
The employment status of the respondent did not show a strong association using our measure of association, but this is because this was a large and complex table so the measure of association was not very reliable. In fact, we can see from the percentage tables that there were big differences between different groups. Those employed full time were clearly the best off, especially the self-employed. The self-employed were our wealthiest group by far. The unemployed, pensioners, and those employed part time were the worse off (we assume that housewives and students are mainly living from someone else's income rather than their own). Having an income from employment is obviously a very important source of wealth. The self-employed were also less likely to say that they were better off in the past. They have benefited from the changes.
23 Wallace 1997.

I H S — Wallace / Migration and Survival Strategies in East-Central Europe — 15
From this table and from other data it is evident that it is important not just to be employed, but also in which sector one is employed. Here we have to distinguish between the state sector and the private sector. However, the private sector is itself subdivided. The private sector can include privatised industries, which are sometimes not much different from state ones for their employees, and new private firms, which can be very different. The state and privatised industries may offer secure jobs at low salaries, whilst the new private sector employment offers highly paid jobs which are also very insecure.24 The new businesses started by self-employed entrepreneurs also seem to fall into this category of having perhaps higher income, but insecure employment.25 In the same way we need to distinguish between independent farms and those working on collective farms, whether state-owned or newly- released from state control. Employment sector was quite a strong indicator of subjective poverty, and here again we need to look at the tables, which were quite complex. Those in the new private sector were the best off, followed by the independent farmers. The worse off were those on collective farms and the civil servants (police, teachers, doctors, etc.). These people are also likely to think that they were better off in the past.
In terms of income, we can see a very strong association between the amount of income the household has and how poor they feel. Those with high income feel less poor, those with low income more poor. Those with low income are more likely to feel that they were better off in the past. There is also a strong association with sources of income. Those dependent upon informal economies for their main income - growing food, using friends and family help, or earning money on the side - are likely to be poor. The best off (those who could save money) were the ones with a main job, who received benefits from their employment and who speculated in currency by having foreign currency savings. Having a second job was also likely to significantly improve the wealth of the household.
We could say from these indicators, that the poor are the low educated, those with large numbers of children, the unemployed (especially if there was some unemployment in the household), those depending upon self-provisioning and help from friends and family as a survival strategy, pensioners, and state sector employees. In other words, all people dependent upon the declining state sector and welfare services for their main incomes. The newly wealthy are the self-employed, those with at least one job and possibly second jobs and foreign currency savings, the single and those with no children.
24 Roberts et al. 1995.25 Roberts et al. in another study in Ukraine, Slovakia, Bulgaria, Armenia, and Georgia found however that amongst young people, entrepreneurship was sometimes a way of compensating for lack of a job. This study is not yet published.
16 — Wallace / Migration and Survival Strategies in East-Central Europe — I H S
Table 4: Subjective poverty - measures of strength of association
Kendal’s tau
Gender
AgeEducation
Town size
Marital status
No. of childrenNo. of household members
Employment statusUnemployed last year (household)
Impact of unemployment (individual)
Employment sector
Household income (quartiles)
Source of income
Getting enough money Getting by from main job
067** 044**
Ns Ns
-121** -065**
Ns Ns
061** 045**
087** 056**
Ns Ns
ns 043**
-135** -159**
-108** -081*
-081** -049**
-200** -150**
-109** -066**
Note: Kendal's tau was used as a measure of association because it indicates dependent variable which Is ordinal (all three of our poverty indicators were ordinal variables which need not be ordinal.** means significant at the 0.000% level and * means significant at the 0.5% level.
Current economic situation compared
with past
-019*
-078**
056**
Ns
-096**
-050**
025*
-015*
067*
022 *
072**
131**
022*
the relationship between a variables) and independent

I H S — Wallace / Migration and Survival Strategies in East-Central Europe — 17
Table 5: Getting enough money from main job (%)
Not enough Not enough at allGenderMale 37 24Female 39 29
Age
18-19 33 3520-29 38 2730-39 36 2740-49 40 2650-59 38 2560+ 36 29
Education
Elementary 36 38Vocational 41 24Secondary 38 26University 34 20
Town size
<5000 38 29<20 000 39 25<100 000 38 28>100 000 39 29
Marital Status
Single 37 23Married/cohabiting 38 26Divorced 33 38Widowed 43 33
No of children
None 38 231 39 312 34 333 or more 31 40
No of household members1 32 292 40 263 41 294 34 305+ 39 31
Employment status
Employed full time 40 26Employed part time 34 49Self employed 28 13Pensioner 32 30Unemployed 28 57Housewife/student 19 25
T ogether
6168
6865 6366 63 65
74656454
67 64 6668
60647176
6170 6771
6166706470
668341628544

18 — Wallace / Migration and Survival Strategies in East-Central Europe — I H S
Table 5 continued
Unemployed (household Not enoughimpact)
Self 37Other in family 36None 38
Impact of unemployment (individual)
Currently unemployed 29Formerly unemployed 38Employed all year 38Outside labour force 27
Employment sector
Civil servant 35State enterprise 46Privatised enterprise 35New private 36Collective farm 42Independent farmer 33
Income (Quartiles)
1 332 343 444 39
Sources of income
Growing food 41Repairing house 45Favours 16Help of friends/family 33Foreign currency 35Second job 35Money on side 32Main job 38Pension/benefit 36Benefits from work 25
Not enough at all
393423
57372523
352529203524
45403018
35 2144 42 283645 23 27 44
Together
767061
86757550
7071 6456 7757
78747457
76 66 60 75 63 7177 61 63 69
I H S — Wallace / Migration and Survival Strategies in East-Central Europe — 19
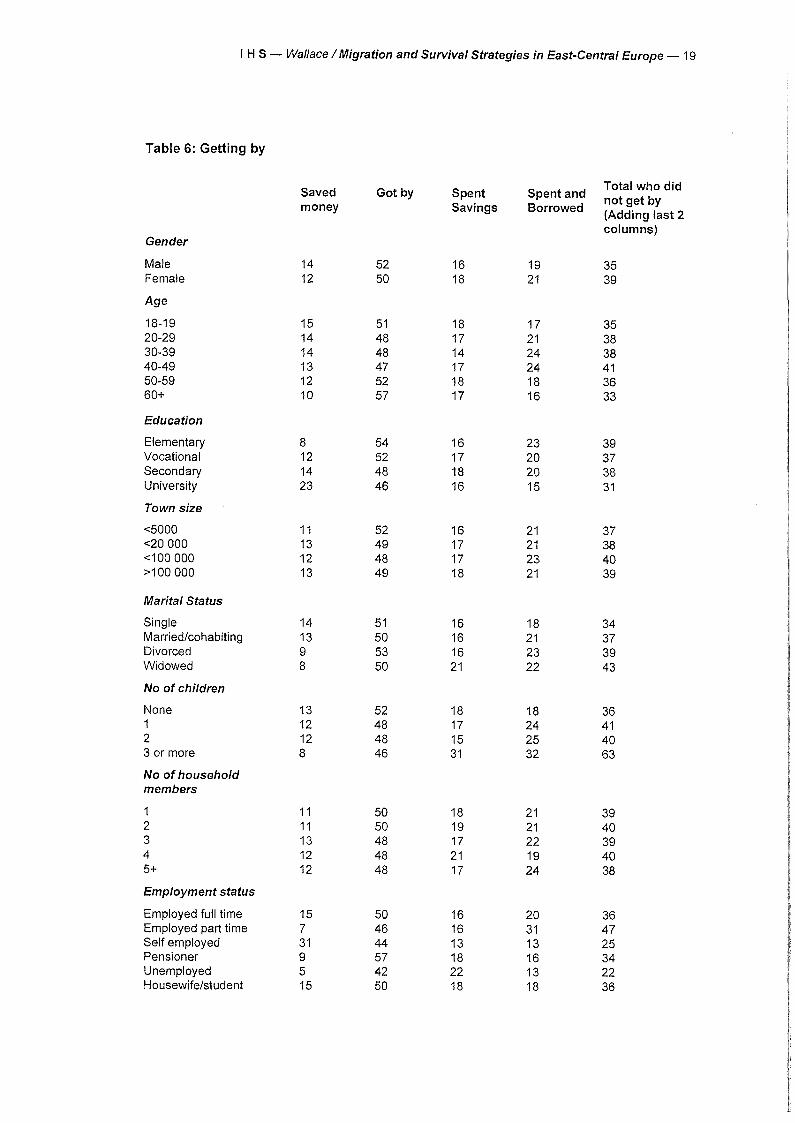
Table 6: Getting by
Gender
Savedmoney
Got by SpentSavings
Spent and Borrowed
Total who did not get by (Adding last 2 columns)
Male 14 52 16 19 35Female 12 50 18 21 39
Age
18-19 15 51 18 17 3520-29 14 48 17 21 3830-39 14 48 14 24 3840-49 13 47 17 24 4150-59 12 52 18 18 3660+ 10 57 17 16 33
Education
Elementary 8 54 16 23 39Vocational 12 52 17 20 37Secondary 14 48 18 20 38University 23 46 16 15 31
Town size
<5000 11 52 16 21 37<20 000 13 49 17 21 38<100 000 12 48 17 23 40>100 000 13 49 18 21 39
Marital Status
Single 14 51 16 18 34Married/cohabiting 13 50 16 21 37Divorced 9 53 16 23 39Widowed 8 50 21 22 43
No of children
None 13 52 18 18 361 12 48 17 24 412 12 48 15 25 403 or more 8 46 31 32 63
No of household members
1 11 50 18 21 392 11 50 19 21 403 13 48 17 22 394 12 48 21 19 405+ 12 48 17 24 38
Employment status
Employed full time 15 50 16 20 36Employed part time 7 46 16 31 47Self employed 31 44 13 13 25Pensioner 9 57 18 16 34Unemployed 5 42 22 13 22Housewife/student 15 50 18 18 36
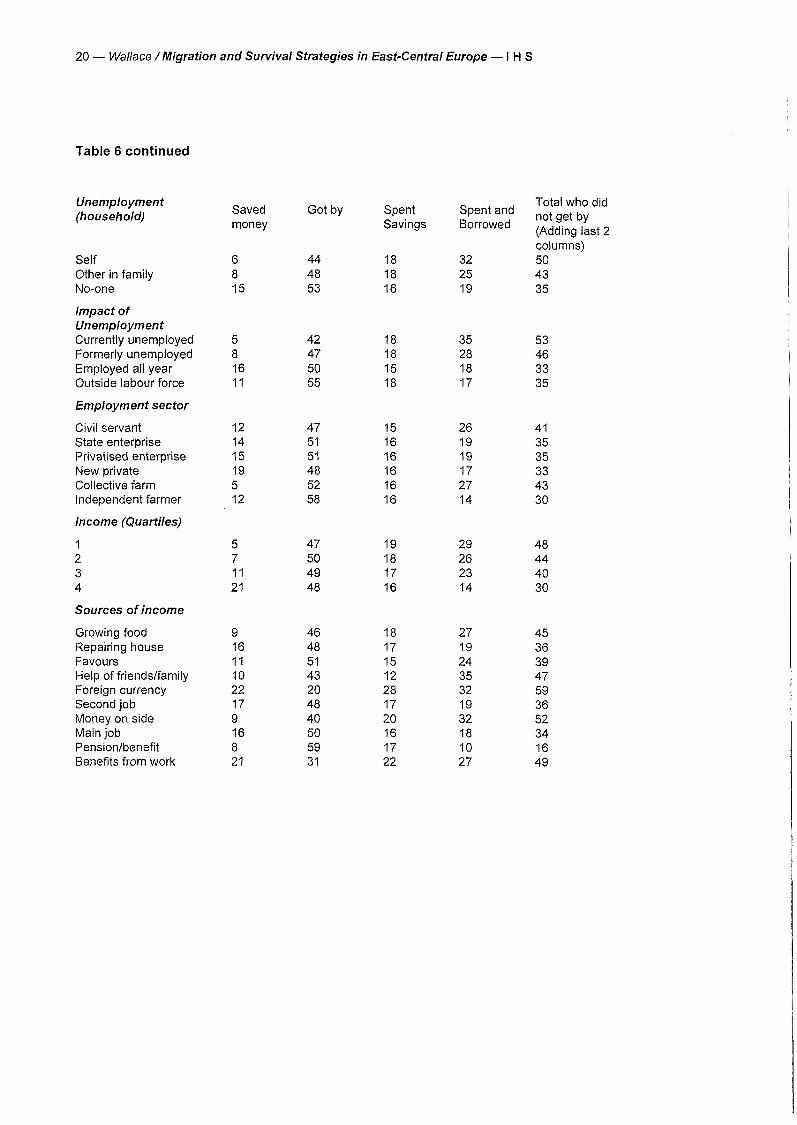
20 — Wallace / Migration and Survival Strategies in East-Central Europe — I H S
Table 6 continued
Unemployment(household) Saved
moneyGot by Spent
SavingsSpent and Borrowed
Total who did not get by (Adding last 2 columns)
Self 6 44 18 32 50Other in family 8 48 18 25 43No-one 15 53 16 19 35
Impact of UnemploymentCurrently unemployed 5 42 18 35 53Formerly unemployed 8 47 18 28 46Employed all year 16 50 15 18 33Outside labour force 11 55 18 17 35
Employment sector
Civil servant 12 47 15 26 41State enterprise 14 51 16 19 35Privatised enterprise 15 51 16 19 35New private 19 48 16 17 33Collective farm 5 52 16 27 43Independent farmer 12 58 16 14 30
Income (Quartiles)
1 5 47 19 29 482 7 50 18 26 443 11 49 17 23 404 21 48 16 14 30
Sources of income
Growing food 9 46 18 27 45Repairing house 16 48 17 19 36Favours 11 51 15 24 39Help of friends/family 10 43 12 35 47Foreign currency 22 20 28 32 59Second job 17 48 17 19 36Money on side 9 40 20 32 52Main job 16 50 16 18 34Pension/benefit 8 59 17 10 16Benefits from work 21 31 22 27 49
I H S — Wallace / Migration and Survival Strategies in East-Central Europe
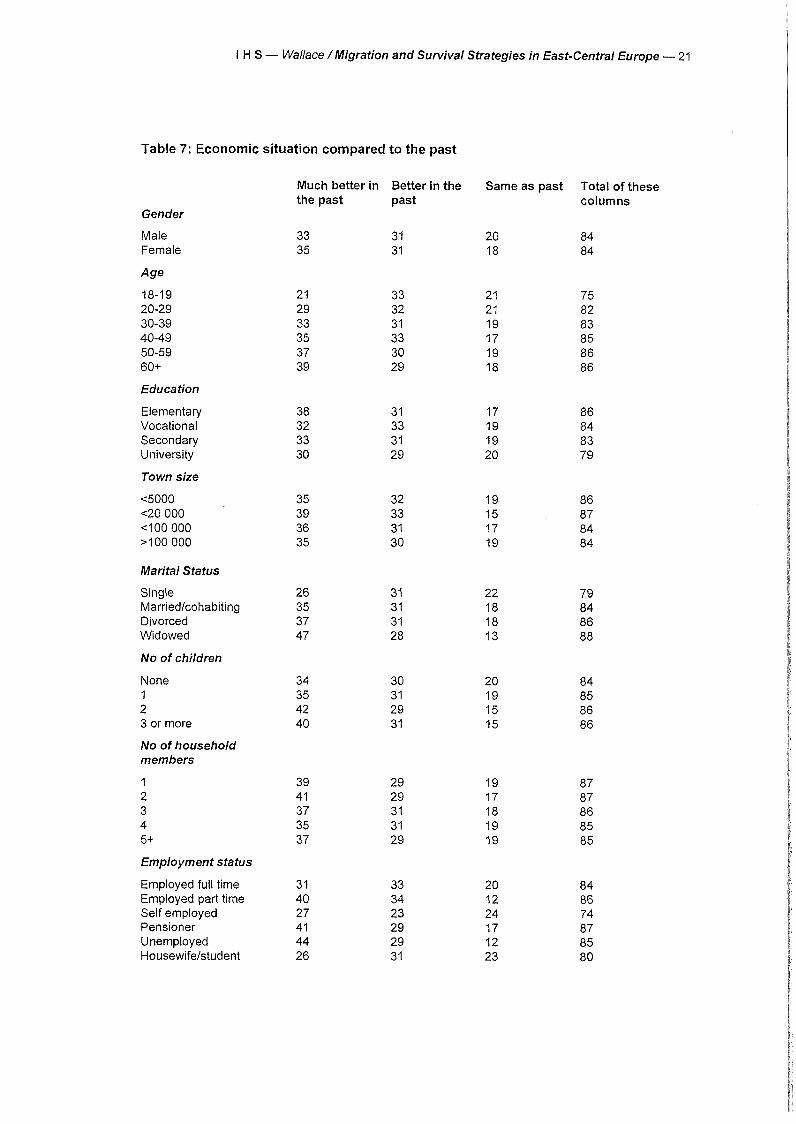
Table 7: Economic situation compared to the past
Much better in the past
Gender
Male 33Female 35
Age
18-19 2120-29 2930-39 3340-49 3550-59 3760+ 39
Education
Elementary 38Vocational 32Secondary 33University 30
Town size
<5000 35<20 000 39<100 000 36>100 000 35
Better in the Same as past Total of thesepast columns
31 20 8431 18 84
33 21 7532 21 82 31 19 8333 17 8530 19 86 29 18 86
31 17 86 33 19 8431 19 8329 20 79
32 19 8633 15 87 31 17 8430 19 84
Marital Status
Single 26 31 22 79Married/cohabiting 35 31 18 84Divorced 37 31 18 86Widowed 47 28 13 88
No of children
None 34 30 20 841 35 31 19 852 42 29 15 863 or more 40 31 15 86
No of household members
1 39 29 19 872 41 29 17 873 37 31 18 864 35 31 19 855+ 37 29 19 85
Employment status
Employed full time 31 33 20 84Employed part time 40 34 12 86Self employed 27 23 24 74Pensioner 41 29 17 87Unemployed 44 29 12 85Housewife/student 26 31 23 80

22 — Wallace / Migration and Survival Strategies in East-Central Europe — I H S
Table 7 continued
Unemployment Much better in Better in the Sai(household) the past past
Self 39 31 15Other in family 38 32 16No-one 32 31 20
Impact ofUnemployment
Currently unemployed 44 29 12Formerly unemployed 35 33 19Employed all year 31 32 20Outside labour force 35 30 19
Employment sector
Civil servant 41 34 14State enterprise 32 32 20Privatised enterprise 27 33 22New private 27 32 22Collective farm 37 37 15Independent farmer 43 22 20
Income (Quartiles)
1 44 30 152 41 29 163 35 32 194 27 30 22
Sources of income
Growing food 42 28 18Repairing house 23 31 24Favours 32 28 20Help of friends/family 36 31 19Foreign currency 39 26 20Second job 35 29 19Money on side 34 31 18Main job 30 33 20Pension/benefit 38 31 16Benefits from work 15 38 19
Total of these columns
8586 83
85878384
898782818985
89868679
88788086858383838572
I H S — Wallace / Migration and Survival Strategies in East-Centra! Europe — 23
PART B. RESPONSES TO POVERTY
Migration as a response to poverty?
Given that in most countries many peoples living standards have declined since 1989, and in some countries nearly everybody's living standards had declined, we need to ask why have more people not migrated?
Before embarking on the analysis of migration, we wish to make two major criticisms of migration studies. The first is that migration studies have traditionally not distinguished between short-term and long-term migration. Migration is assumed to mean that individuals move permanently from one country to another country. However, our study indicated that few people would like to do that. On the other hand, relatively large numbers would like to go for short periods of time, and there was a different pattern for these different kinds of migration. These kinds of migration need to be analysed separately, and this has important implications for the forms of mobility in Europe. The second criticism is that migration studies generally look at the behaviour of individuals, assuming that they will try to improve their economic position. They do not situate individuals in the context of their ethnicity, social networks, and especially their household situation. Our studies found that it was important to situate people in their social context, not just their economic context, in order to understand the patterns of migration that were taking place.
Here we consider the migration potential from the Central European buffer zone countries - Poland, Hungary, Slovakia, Czech Republic, and Slovenia. We know from other studies that the people from these countries are the most likely to want to work abroad rather than migrate.26 In other words, people wanted to supplement their income by working abroad for short periods rather than moving abroad altogether. People will move out of the buffer zone towards their nearest western countries to work and into the buffer zone from those countries to the east and south. In Ukraine, working abroad is already something of an established activity.27
We can now look at the migration potential using the same indicators that we have used so far to look at poverty. Were the poor people the ones most likely to migrate?
If we look at table 8 we can see the measures of association giving us the strength of each independent variable against the dependent variable. Here we have also included our three indicators of subjective poverty used throughout this paper. In this way we can compare what affects poverty with what affects migration potential.
26 International Organisation for Migration 1998.27 Drbohlav 1996, Wallace et al. 1998.

24 — Wallace /Migration and Survival Strategies in East-Central Europe — I H S
First of ail we notice that gender is a strong indicator of migration potential - many are most likely to migrate to work for a few months or a few years and are slightly more likely to emigrate. This is therefore different to the indicators of poverty - there it was women who felt the most poor.
Age is an extremely strong indicator of migration potential. The younger are most likely to want to migrate. By contrast, age had little impact upon poverty.
Education is also an extremely strong indicator of migration potential. The most educated are the most likely to migrate, and this is exactly the opposite direction for that of poverty.
Town size is also quite a stronger factor in migration potential - those in larger cities are the most likely to migrate, whereas this had little effect on poverty.
Marital status had a very strong effect on those wanting to migrate for short periods, but not on those wanting to emigrate. The single people are most likely to want to go for a few months to work in the European Union, the married people for a few years. This would be consistent with our idea that migration forms part of a household strategy. Working abroad is a way of supporting a family in the home country. This is also reflected in the fact that the number of children is also quite strongly associated with migration potential - those with children are most likely to want to migrate as well as to emigrate.
Employment status is quite strongly associated with short-term migration but only weakly with emigration. It is the students, the part-time workers, and the unemployed, who are most likely to want to go abroad for short periods of time as well as to emigrate. Having a full-time job is a disincentive for going abroad. This is also reinforced by the two variables which looked at unemployment. Here the individual experience of unemployment has an extremely strong effect on wanting to work abroad, whilst household unemployment has a less strong effect. The employment sector, however, was not significant at all.
Household income is extremely strongly associated with the likelihood of going abroad. The more poor was the household, the more likely they were to want to go abroad. This also
reflects poverty. The main source of income was also extremely strongly associated with migration potential. Not surprisingly, those relying mainly upon foreign currency accounts were most likely to want to go abroad. Those able to earn their main income from their main job are less likely to want to work abroad, whilst for those having to make up their income from other sources, going abroad was more attractive.
If we now turn to our subjective poverty indicators, we can see that not getting enough money from the main job is strongly associated with all kinds of migration, especially longer-term migration. Getting by is more weakly associated with migration - migration was seen as solution for debt. However, whether a family was better or worse off than in the past had little
I H S — Wallace / Migration and Survival Strategies in East-Central Europe — 25
or no impact on their desire to go abroad. It was present circumstances that were most important.
Thus, there were important differences between indicators for poverty and indicators for migration. Whilst women were poorer, it was men who wanted to migrate. Whilst the elderly were poorer, it was the young who wanted to go abroad. Whilst the lower educated were the poorest, it was the highly educated who wanted to leave. Finally it was those from the cities who were the most keen to go.
However, there were also important financial pressures which did encourage people to consider going abroad. The number of children they had and the number of people in the household were important as well as tow income. Most important of all was if they were unemployed (or had been unemployed) and if they were unable to earn enough from their main jobs. Some households even lived mainly from their foreign currency earnings (but this was only 51 people from the whole sample - for most people foreign currency earnings were a supplementary income).
We could say therefore that being poor was not a sufficient factor for wanting to emigrate. It was only when people had low incomes in association with a variety of other factors (age, education, sex) that they were likely to think of migration as a solution. We could predict however that the level of earnings and the level of unemployment in the Central and Eastern European countries would have an impact upon people's incentives to migrate.

26 — Wallace / Migration and Survival Strategies in East-Central Europe — 1 H S
Table 8: Migration potential - measures of strength of association
Kendal's tau Work in EU few Work in EU few years Emigratemonths
Gender 083** 087** 054**Age 270** 246** 158**Education -150** -152** -117**Town size -063** -075** -051**Marital status 173** 158** 099**No of children -072** -076** -064**No of household -144** -140** -072**membersEmployment status 056** 044** 027*Unemployed last year 139** 144** 092**(household)Impact of unemployment 199** 186** 126**(individual)Employment sector Ns ns NsHH Income (quartiles) -108** -105** -071**Source of income 129** 129** 093**
Not getting enough from -073** -099** -082**main jobGetting by -029* -048** -041**Current economic ns 028* 028*situation
Note: Kendal’s tau was used as a measure of association because it indicates the relationship between a dependent variable which is ordinal (all three of our poverty indicators were ordinal variables) and independent variables which need not be ordinal.** means significant at the 0.000% level and * means significant at the 0.5% level.

I H S — Wallace / Migration and Survival Strategies in East-Central Europe
Table 9; Working in EU for a few months
GenderYes definitely Yes probably Alt
Male 20 22 42Female 16 18 34
Age
18-19 30 30 6020-29 27 28 5530-39 23 25 4840-49 17 23 4050-59 12 15 2760+ 5 6 11
Education
Elementary 11 14 25Vocational 17 20 37Secondary 21 23 44University 22 25 47
Town size
<5000 16 19 35<20 000 18 23 41<100 000 21 22 43>100 000 20 22 42
Marital Status
Single 27 26 53Married/cohabiting 16 20 36Divorced 14 14 28Widowed 7 8 15
No of children
None 16 18 341 21 23 442 21 24 453 or more
No of household members
17 23 40
1 12 13 252 12 14 263 19 24 434 24 23 475+ 22 24 46
Employment status
Employed full time 19 25 44Employed part time 28 25 53Self employed 21 19 40Pensioner 5 6 11Unemployed 22 22 44Housewife/student 27 27 54

28 — Wallace / Migration and Survival Strategies in East-Central Europe — I H S
Table 9 continued
Unemployment Yes definitely Yes probably Altogether yes(household)
Self 28 23 51Other In household 20 23 43None 14 19 33Impact of UnemploymentCurrently unemployed 28 23 51Formerly unemployed 29 22 51Employed all year 18 24 42Outside labour force 10 13 23
Employment sector
Civil servant 22 24 46State enterprise 17 25 42Privatised enterprise 17 24 41New private 23 26 49Collective farm 12 23 35Independent farmer 16 23 39
Income (Quartiles)
1 17 15 322 - 18 21 393 21 24 454 22 26 48
Sources of income
Growing food 21 16 37Repairing house 22 23 45Favours 19 33 52Help of friends/family 28 24 52Foreign currency 36 13 49Second job 28 24 52Money on side 27 31 58Main job 18 25 43Pension/benefit 7 8 15Benefits from work 30 28 58
Not enough money frommain job
Not enough 20 25 45Not at all enough 25 24 49
Getting by
Saved money 18 19 37Got by 15 20 35Spent savings 20 20 40Borrowed money 18 20 38Spent and borrowed 23 22 45
Economic situation wasbetter in the past
Much better 19 20 39Somewhat better 16 21 37The same 15 19 34
I H S — Wallace / Migration and Survival Strategies in East-Central Europe
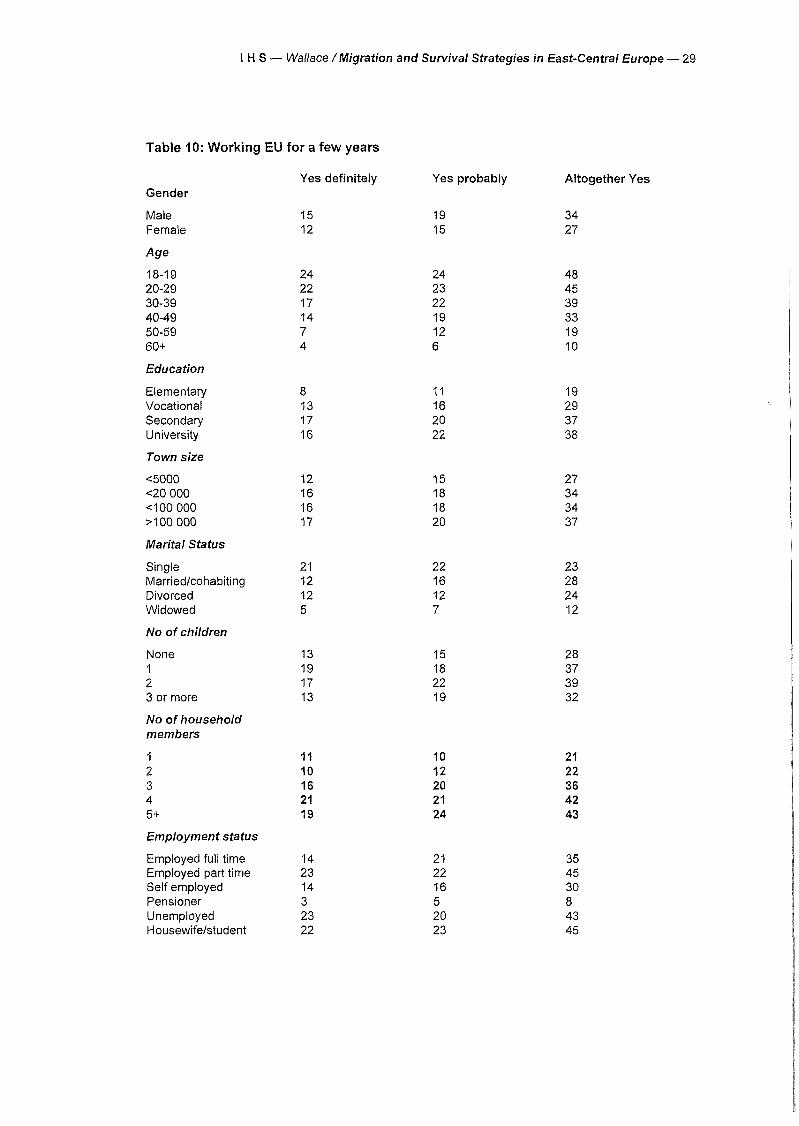
Table 10: Working EU for a few years
GenderYes definitely Yes probably Alt
Male 15 19 34Female 12 15 27
Age
18-19 24 24 4820-29 22 23 4530-39 17 22 3940-49 14 19 3350-59 7 12 1960+ 4 6 10
Education
Elementary 8 11 19Vocational 13 16 29Secondary 17 20 37University 16 22 38
Town size
<5000 12 15 27<20 000 16 18 34<100 000 16 18 34>100 000 17 20 37
Marital Status
Single 21 22 23Married/cohabiting 12 16 28Divorced 12 12 24Widowed 5 7 12
No of children
None 13 15 281 19 18 372 17 22 393 or more
No of household members
13 19 32
1 11 10 212 10 12 223 16 20 364 21 21 425+ 19 24 43
Employment status
Employed full time 14 21 35Employed part time 23 22 45Self employed 14 16 30Pensioner 3 5 8Unemployed 23 20 43Housewife/student 22 23 45

30 — Wallace / Migration and Survival Strategies in East-Central Europe — I H S
Table 10 continued
Unemployment(household)
Yes definitely Yes probably Alt!
Self 23 21 44Other in family 17 21 38No-one 10 14 24
Impact of Unemployment
Currently unemployed 24 20 44Formerly unemployed 22 21 43Employed all year 14 19 33Outside labour force 8 10 18
Employment sector
Civil servant 17 23 40State enterprise 13 20 33Privatised enterprise 12 17 29New private 18 21 39Collective farm 12 17 29Independent farmer
Household income (Quartiles)
17 23 40
1 12 13 252 15 17 323 16 21 374 18 21 39
Source of income
Growing food 17 13 30Repairing house 15 20 35Favours 18 19 37Help of friends/family 23 22 45Foreign currency 36 8 44Second job 22 27 49Money on side 26 27 53Main job 14 21 35Pension/benefit 4 6 10Benefits from work
Not enough money from main job
27 20 47
Not enough 15 21 36Not at all enough 21 22 43
Getting by
Saved money 12 16 28Got by 11 16 27Spent savings 16 18 34Borrowed money 16 18 34Spent and borrowed
Economic situation was better in the past
21 17 38
Much better 16 17 33Somewhat better 12 16 28The same 10 15 25

I H S — Wallace / Migration and Survival Strategies in East-Central Europe
Table 11: Emigrate
Yes definitely Yes probably Altogether YesGender
Male 7 8 15Female 5 7 12
Age
18-19 11 9 2020-29 11 12 2330-39 8 11 1940-49 4 7 1150-59 3 5 860+ 2 2 4
Education
Elementary 3 4 7Vocational 5 8 13Secondary 8 9 17University 7 11 18
Town size
<5000 5 8 13<20 000 7 9 16<100 000 6 8 14>100 000 8 9 17
Marital Status
Single 10 10 20Married/cohabiting 5 7 12Divorced 4 6 10Widowed 2 3 5
No of children
None 6 6 121 9 10 192 7 10 173 or more 6 10 16
No of household members
1 7 6 132 6 5 113 7 12 194 10 11 215+ 8 11 19
Employment status
Employed full time 6 9 15Employed part time 9 14 23Self employed 8 8 16Pensioner 1 2 3Unemployed 11 12 23Housewife/student 10 11 21
Unemployment (household)
Self 11 12 14Other in family 7 10 14No-one 4 6 12

32 — Wallace / Migration and Survival Strategies in East-Central Europe — I H S
Table 11 continued
impact of Unemployment Yes definitely Yes probably Altogether Yes(individual)
Currently unemployed 11 12 23Formerly unemployed 12 11 23Employed all year 6 9 15Outside labour force 3 4 7
Employment sector
Civil servant 5 12 17State enterprise 5 9 14Privatised enterprise 5 7 12New private 8 9 17Collective farm 3 10 13Independent farmer 5 9 14
Income (Quartiles)1 5 6 112 8 10 183 7 10 174 7 10 17
Sources o f income
Growing food 7 7 14Repairing house 5 10 15Favours 7 10 17Help of friends/family 11 9 20Foreign currency 19 13 32Second job 12 11 23Money on side 16 12 28Main job 6 9 15Pension/benefit 1 2 3Benefits from work 18 6 24
Subjective Poverty Not enough money from main job
Not enough 7 10 17Not at all enough 10 11 21
Getting by
Saved money 5 7 12Got by 4 7 11Spent savings 8 9 17Borrowed money 8 9 17Spent and borrowed 10 8 18
Economic situation was better in the past
Much better 7 10 17Somewhat better 6 7 13The same 4 7 11

1 H S — Wallace / Migration and Survival Strategies in East-Central Europe — 33
Actual migration behaviour: qualitative studies
The actual migration behaviour (as opposed to potential behaviour that we have looked at so far) can only be assessed through studies of people who have actually migrated for shorter or longer periods of time. Here we can draw upon a range of qualitative studies, including 350 life interviews with labour migrants and cross border traders in Poland, Czech Republic, Hungary, and Slovakia.28
A further explanation for why more people did not want to migrate can be found by looking at the household strategy rather than the individual migrant behaviour.29 If we take this into account, we can see that the single migrant is often earning money for a household rather than for his or herself, and his or her trip abroad forms part of a broader work strategy. For example, migrant Ukrainian workers which we interviewed in the Czech Republic and
Slovakia explained that they would stay abroad for the length of time they were legally allowed to stay in the Czech Republic or Slovakia (according to the stamp in their passports they were visiting as tourists) and to work, for the most part illegally, for that time. They would then go home and their place would be filled by a father or brother who take on the next "shift" so to speak. They would go home also in order to help with the harvest or to take care of cows, sheep, rabbits, and hens which helped the household to survive. On the way they would convert some of their money into goods which their wives would then sell on the markets at home (retail goods were hard to buy in Ukraine at that time and were cheaper in Poland, Hungary, and the Czech Republic), In this way, the one person who was working abroad was only one part of a household survival strategy which would involve a variety of ways of getting by.
The reason many did not leave permanently, was because they had a variety of other sources of income as well and they were all needed in order to survive. Thus, the migrant workers and traders would usually have a state-paid job as well and with this they secured their pensions, health and social security contributions. The formal economy was still important even if is importance had declined for many people as a means of livelihood. In
addition, the migrant workers and traders often owned property as part of the family unit, which might include apartments and houses which they built in the countryside, a dacha or a plot of land. This would form the basis of the family wealth and was usually shared between a number of family members. Thus for example, the grandmother/grandfather might work the family plot and produce vegetables in the country house helped by unemployed grandchildren, whilst the father worked abroad and the mother brought goods across the
28 50 interviews in each country: Poland, Slovakia, and Hungary were carried out in 1995/6 and 200 in the Czech Republic between 1993 and 1995. Where possible, these interviews were carried out in naturalistic settings by interviewers using the same language as the respondent. There was an attempt to interview respondents from the range of ethnic groups which were arriving in the country, and this varied from country to country.29 Stark 1991, Wallace et al. 1998.

34 — Wallace / Migration and Survival Strategies in East-Central Europe — I H S
border to sell at home. The migration strategy involved supporting this life-style, not giving it
up.
There was a clear incentive, giving the income differentials seen in chart 1, for at least some people to work abroad, but not to move abroad. By moving on his or her own side of the border, the migrant worker could enjoy the benefits of the purchasing power of their income and still take advantage of social security, health provision etc. provided in their own country.
The opening of borders involved improved communications across borders. The train connections were improved and the Central European countries embarked on an extensive road building programme, subsidised often by the European Union in order to better connect themselves with the West. These improved communications means that it is relatively easy for migrants to move backwards and forwards frequently across the borders (notwithstanding increased surveillance and control at the borders).
Another factor is the legislation which exists governing migrants. The apparently open borders admit some people more easily than others. Usually the people from the
neighbouring countries are able to enter without visas as “tourists" for a certain amount of time. However, this means that they can also undertake various kinds of economic activity. Working permits are limited in time and granted usually on a quota basis in most countries. There are always more workers than working permits in the buffer zone in ratios that have been estimated as 1:1 or even 1:10. The legislation governing import and export of goods likewise tends to affect the behaviour of migrants. Usually border crossers can take with them a reasonable amount of goods for their own use, but must pay tax if they want to trade. Ukraine, however, tried to restrict even this by introducing a tax of 30% on consumer goods that migrants brought back for their own use. This encouraged a lot of smuggling and bribery at the border. Usually border crossers are therefore able to bring only small amounts of goods backwards and forwards for trading. These kinds of restrictions encourage people to come for only short periods of time, but also to go backwards and forwards frequently.
Therefore, these new patterns of mobility are encouraged by the stake which the migrant holds in their own countries plus the ease of transportation, making frequent crossings possible. This kind of cross-border commuting probably represents a “normal" condition between countries and is further normalised by a range of regulations governing the conditions and terms of work of guest workers from the East in Austria and Germany, but also in the central European buffer zone, where such regulations as quotas, working permits, and so on have also been introduced in the last years. This was under “normal” circumstances.
However, the biggest migration potential comes not from those countries which border the European Union, but rather from the former Yugoslavia (excluding Slovenia). In these countries very high numbers of people would like to leave, not just temporarily, but

I H S — Wallace / Migration and Survival Strategies in East-Central Europe — 35
permanently. We could see this as abnormal conditions, because the people are driven out not just by economic slump (in fact incomes have risen in Croatia since the war) but by political conditions. People fleeing from Bosnia, Serbia, Croatia, and Kosovo make up a large number of the migrants in the buffer zone. In some cases they are escaping the effects of war and ethnic cleansing, but in other cases they are escaping military service and the consequences of economic collapse. They are mostly young, well educated and multi-lingual people who see no future for themselves at home. With increasing restrictions on asylum seekers and refugees in western Europe, they often settle in the buffer zone. However, few of them apply for asylum - in most cases they find jobs or start businesses. These are usually longer-term residents and may be either legally or illegally resident.
In the case of these highly educated young migrants, they can also form virtual transmigrant communities as they keep in touch with people back home and in other parts of the world through internet and email. They can exchange news and information in this way, some of which may be censored back in their own country.
Other groups who are more permanently resident are those recent settlers from the far East. The Vietnamese, formerly in Central Europe on work contracts, have often turned themselves in to traders and small business people in order to be able to stay, and they are joined by more recent arrivals from mainland China. The Chinese are normally traders and businesspeople and, having originally settled in Hungary in the 1980s, can now be found in most Central European countries.30
However, the most common form of migration was temporary, and here two categories stood out on which we focused our studies: cross-border traders and labour migrants. Below we give a brief account of the results of our studies for each group.
a. Cross-border traders31
Cross-border trading had already been a way of importing scarce goods under the old systems, but it increased during the perestroika period of the 1980s and really took off once the borders opened. From then on trading was no longer illegal, but the official import and export system was too inefficient to meet consumer demand. Furthermore, the previously existing COMECON mutual trading arrangements broke down as soon as hard currency transactions were demanded, leading to scarcities of many traditional goods in the shops. Consumer demand was met by hundreds of thousands of people carrying suitcases across the border and hence the name "suitcase traders". By the 1990s from being a specialist phenomenon this had become a mass phenomenon.
30 Nyiri 199531 Wallace et al. 1997

36 — Wallace / Migration and Survival Strategies in East-Central Europe — I H S
In the Central European buffer zone countries, cross-border trading (mainly carried out by Polish people and later Yugoslavs) was gradually replaced by more normal forms of import and export carried on through the formal market economy. Nevertheless, cross-border shopping continued to be very important on both the eastern and western side of the buffer zone as price differentials and selective shortages made this kind of activity attractive or even
a necessity.
In the countries of the former Soviet Union cross-border trading until 1992 consisted in bringing goods from their countries to be sold in the buffer zone. However, after 1992, rapid
inflation and economic crisis meant that the supply of goods ran out (factories no longer produced anything) and prices rose until they were above those in the buffer zone. Instead of coming to sell, Ukrainians, Russians and Belarusians came to shop. They bought food, textiles, toothpaste, soap, shampoo, and other comestibles. From this time onwards the economic crisis started to bite deep into people's living standards and so many households were forced to engage in this kind of trading, petty buying, and selling, even if they did not want to, just to make ends meet. At this period it also became more difficult to buy and sell in the buffer zone as the regularising of the retail trade meant that retailers did not want competition from street traders and bazaars. In addition, the buffer zone countries introduced more and more restrictions on travel and started to collect taxes, making cross-border traders illegal. Cross border traders risked a lot to buy or sell goods in the buffer zone, but they nevertheless continued to come in large numbers, driven by economic necessity.
Only in Poland were there less restrictions on trading and indeed trading with the eastern neighbours was encouraged. Large bazaars continued to exist and to attract people from very far afield and Polish manufacturers started to produce goods for this eastern trade, especially textiles. By 1996, this eastern trade (mostly in the form of suitcase trading) was estimated to be the third largest “industry” in Poland, accounting for billions of dollars of exports. The incorporation of Poland into the European Union has caused troubles in this respect. The EU has forced Poland to introduce more restrictions (for example visas) on her eastern borders, and this caused a series of demonstrations by Polish businesspeople. The Polish regime, advised by free marketeer Leszek Balcierowicz, is more in favour of unrestricted cross-border traffic.
The southern European countries mostly traded in Hungary and would come to shop at the “Chinese markets” in Budapest and on the border. The embargo on FRY for a period
encouraged the generation of black-market trading in this region, and the crisis in Bulgaria in 1996 lead to food shortages and buying in from outside there. Bulgaria on the other hand, is a major exporter of black market CDs and computer software, usually also through suitcase trading.
Our studies found that where legal protection for traders did not exist or where it was actually antipathetic to the activities of small-scale traders, traders introduced their own rules of trust
I H S — Wallace /Migration and Survival Strategies in East-Central Europe — 37
and exchange based on social capital and cemented by ties of ethnicity, friendship, or kinship. The point is that trading was an extremely risky business. Traders were often breaking the law in more ways than one, and the increased control of trading which have developed in the buffer zone in the last years mean that they constantly run the risk of being arrested, deported, having their goods confiscated, or having to pay a bribe. Under these circumstances there was a problem of building trust. Since trust could not be build upon regulations, it needed to be reinforced by informal rules and social connections. The social networks developed in this way were often reinforced by rules of kinship and ethnicity - although different ethnic groups operated in different ways. The Chinese and Vietnamese had very strong ethnic bonds; the Ukrainians were looser. The Caucasians had very close- knit and extended families whereas those from other countries tended to have a more nuclear type of families which both limits the number of connections which can be fielded but also limits the number of people to whom resources must be distributed.
Small-scale traders mostly go only to the nearest abroad (although we found trading networks extending to the Far East, the United Arab Emirates, and particularly to Turkey). Therefore traders from Romania, Bulgaria, and FRY are found in Hungary. Traders from Belarus, Ukraine, and the Baltics or Russia are found in Poland, traders from trans- Carpathian Ukraine are found in Slovakia and so on. They are able to use pre-existing family and ethnic connections which had been severed by communism in countries where the borders have moved several times just in the life time of some of our respondents.
Small scale trading was therefore used to supplement the incomes of many households in post-communist Europe and is still important in those countries where the formal market economy has not been able to substitute for the retreat of the state sector. In this way transmigrant communities are formed which span one or even several countries and may involve new ethnic communities or simply reactivate older ones.
b. Labour migration
Our study of labour migration is mainly based upon interviews with 210 migrant workers who came to the buffer zone rather than left it. The relative prosperity of the buffer zone countries has created an expanding labour market which coexists alongside high unemployment. This is because the emphasis on the sphere of production in communist societies has tended to continue into post-communist ones, and although many people have moved over to the service sector, it still remains underdeveloped. Despite important changes, most native workers still work in traditional areas of the economy, and the labour market is rather inflexible. This means that there are vacancies for foreigners in the expanding service sector and also in the small business sector, traditionally a sector employing casual and informal workers, which may look less attractive to native workers with regular jobs and social security. The construction industry, for example, has blossomed in many Central European
38 — Wallace / Migration and Survival Strategies in East-Central Europe — I H S
countries with a boom in private house building, and this is where many migrant workers work. Other areas where they work is in service, tourist, and catering firms, which have expanded since these countries opened up but often offer only casual work.
One of the main findings of the survey of labour migration in Central Europe is that labour migrants formed a flexible sector in the labour market. However, they were not only confined to the bottom rungs of the labour market. Some groups of workers - Ukrainians and Romanians for example — did tend to work in the lower rungs of the labour market, living in temporary camps and barracks and earning much less money than native workers. They were often subject to exploitation from gang organisers who would take a large part of their money and might not even pay them at all. However, other groups of workers found jobs in the service sector - such as catering for tourists, video and computer businesses etc. — and here knowledge of foreign languages and a good education were a distinct advantage. A significant group of foreign workers in fact came from Western countries - especially the USA and Great Britain. Some migrant workers started small businesses - this was also a way of getting a residence permit. These businesses may have specialised in import and export, using the contacts of the migrant abroad as a business asset. This was the case with Caucasian, Chinese, and Vietnamese people.
The supply of these well-educated and multi-lingual young migrants was boosted by the hostilities in the Balkan peninsula, so that many young people left the countries of the former Yugoslavia, especially Bosnia, Serbia, and Croatia, because the economic collapse meant that they could not find suitable jobs or education there. Some were trying to avoid military service or were in cross-ethnic relationships. These were in a good position to start businesses or find jobs with multi-national and foreign companies. They formed a rather privileged migrant group and along with the westerners and business community were often earning more than native workers. Most often migrant workers were in small firms, whereas native workers were in large firms, and migrant workers were almost always In the new private sector whilst native workers were in the state or privatised sectors. We could say therefore that the flexible employment sector employing foreigners existed alongside of the normal labour market for natives. It was a parrallel labour market with vertical as well as horizontally drawn segmentation.
The sending countries (former Yugoslavia apart) tended often to be the countries with which each of the Central European nations had historical connections with and where family and ethnic ties continued. In Poland, the main (officially registered) migrant workers were from Ukraine followed by Vietnam, Belarus, Great Britain, and Russia (in that order).32 In the Czech Republic, they were Ukraine, Poland, USA, and Germany. In Hungary, they were Romania, the Former Soviet Union, former Yugoslavia, Poland, USA, UK, and Germany. In Slovakia they were Ukraine, Poland, USA, and former Yugoslavia. In most cases, the main
32 OECD/SOPEMI 1996.
I H S — Wallace / Migration and Survival Strategies in East-Central Europe — 39
country was one which was not just nearby but which had some historical and linguistic connection with the receiving country.
The highest number of work permits for foreigners in 1995 was in the Czech Republic, where some 70 000 were registered, and this was followed by 20 000 in Hungary, 11 — 12000 in Poland and only 3 — 4000 in Slovakia. However, many people are not registered officially and from the interviews there were various reasons - the problems of applying for permission, the fact that they preferred not to pay social insurance, and exploitation by unscrupulous work organisers were some of the reasons. Some people had legally entered the country but were working illegally, and many were doing more than one job - perhaps one job legally and others illegally. Others may have begun legally but out-stayed their period of legal residence.
Since there was little official recruitment of foreign workers (in contrast to the strategy adopted by Germany for example), the foreign workers tended to be recruited by informal means and networks. In some cases this was a labour contractor who went to look for Ukrainian or Polish workers - usually of the same nationality. In other cases, they came and stayed with friends or family and then relied on the "slave markets” - places where workers would stand around and where employers knew where to find them. In other cases they found work through friends or relatives who lived in the other country. As was the case with trading, social capital was very important in creating and mediating these informal relationships. But as with trading, social capital could also be a form of exploitation, especially since workers were mostly illegal and not protected by the laws of the land.
In most cases they relied upon the welfare states in their home country. Since they were not insured in the place where they were working, they had to go home when they were sick. For the same reasons they could not bring children because they would be unable to go to school or enjoy medical facilities in the receiving countries unless they did so privately. Migrant workers were usually young and single or they had left their families behind them.
As with the traders, the migrant workers were found in the informal private parts of chart 3 and therefore outside of official control and also outside of official protection, which made them vulnerable to exploitation of various kinds - from the enforcers of the law (in the form of bribes), from their own employers, from various organised and unorganised criminai groups and extortionists. As with the traders, the sources of trust were often based upon social connections which might include ethnic and kinship networks.
40 — Wallace / Migration and Survival Strategies in East-Central Europe — I H S
Conclusions
Now to bring together the different parts of this paper. To summarise the first part of the paper, we could say that although very many people are suffering economic hardship in Eastern and Central Europe, not very many are migrating. There are a number of explanations for this.
First, the characteristics of those in poverty and those who would like to migrate only overlap at certain points. The most poor (state sector employees, those with large families, those surviving mainly from self-provisioning or welfare benefits, pensioners, those with low education) do not see migration as an option. Rather, it is the more privileged groups - the highly educated, those living in cities, the younger people - who are more likely to migrate, especially if they find themselves with low incomes or unemployed. Indeed, many of the characteristics of potential migrants are the same as those of the "new entrepreneurs" - the self employed.33 We could say therefore that migration is actually an enterprising strategy which could also help to augment household or individual mobility as well as only surviving.
Secondly, we need to take into account that most people in Europe live in households, and these households in communist countries were traditionally close-knit - different members depended upon each other for support. Thus the migration of one member was actually often a way of supporting the rest of the household back in the sending country.
Thirdly, we need to distinguish between short-term and long-term migration. Not many people wanted to go abroad for long periods, but large numbers wanted to work abroad for short periods. In this way they could keep their properties, networks, and social security in their home country whilst supplementing their income. We would suggest that this is the most common migration strategy.
Fourthly, migrants resort to social capital (social networks and connections) as a way of organising their travels because it is a way of securing trust in an extremely risky environment. This trust can be cemented through social networks (reciprocal or patron-client versions), through kinship, and through ethnic networks. The extent to which people would resort to one or the other will depend upon which ethnic group they are from and how extensive their kinship networks are.
This new mobility in Central and Eastern Europe helps to form various kinds of transmigrant communities - communities spanning more than one country. In the case of Central and Eastern Europe, this was sometimes a new community and one that might span very large distances. This was the case with Chinese, Vietnamese, and Caucasian settlers. It was also the case with Western migrants from, for example, the USA. Other migrant groups travelled
33 Wallace and Haerpfer 1998.

I H S — Wallace / Migration and Survival Strategies in East-Central Europe — 41
only short distances - those going from Ukraine to the Czech Republic and Slovakia for example. In these cases it was more often the case that they were reviving older affinities of language, culture, ethnicity, and sometimes even kinship because the borders are often of recent invention and arbitrarily drawn in this region. In some cases this was assisted by information technology, which allowed for the development of virtual trans-migrant communities.
42 — Wallace /Migration and Survival Strategies in East-Central Europe — I H S
Reference List
Drbohlav, D. (1996). Labour Migration in Central Europe (with special reference to Poland, the Czech Republic, Slovakia and Hungary) - Contemporary Trends. Charles University, Prague.
Ferge, Z., Sik, E., & Vecernik, J. (1996). Social Costs of Transition. Report. Vienna: Insitute of Human Sciences.
Haerpfer, C. (1998). Report on NDBV. Vienna: Occasional Papers of the Austrian Society for European Politics.
Haerpfer, C., & Wallace, C. (1997). Attitudes to Migrants and Minorities in Eastern and Central Europe. Vienna: Institute for Advanced Studies. Working paper series.
Hönekopp. (1997). Labour Migration from Germany to Central and Eastern Europe. (Report No. 23). Institut für Arbeitsmarkt und Berufsforschung Nürnberg.
International Organisation for Migration. (1998) Migration Potential in Eastern and Central Europe Geneva, Switzerland: IOM.
International Organisation for Migration. (1994) Series of Reports on Transit Migration in Eastern and Central Europe Geneva: International Organisation for Migration.
Nyiri, P. D. (1995). From Settlement to Community (Five years of the Chinese in Hungary). M. Fullerton, E. Sik, & J. Toth (Editors), Refugees and Migrants: Hungary at the Crossroad (pp. 191-126). Budapest: Hungarian Academy of Sciences.
OECD/SOPEMI. (1996). Annual Report on Migration: OECD, Paris
Roberts, K., & Jung, B. (1995). Poland's First Post-Communist Generation. Aldershot, Hants, Ashgate, USA: Avebury.
Rose, R., & Haerpfer, C. W. (1992) New Democracies between State and Market (Report No. Studies in Public Policy No. 204). University of Strathclyde: Centre for the Study of Public Policy.
Sik, E. (1993). From the Second Economy to the Informal Economy. Journal of Public Policy,
12(2), 153-175.

I H S — Wallace / Migration and Survival Strategies in East-Central Europe — 43
Sik, E. (1998). The social, economic and legal aspects of migration in contemporary Hungary in relation to access to the European Union. Budapest: Centre for Migration and Refugee Studies, Hungarian Academy of Sciences.
Stark, O. (1991). The Migration of Labour. Cambridge, Mass.: Blackwells.
Wallace, C. (1997). Who is for Capitalism, Who is for Communism? Attitudes to Economic Change in 10 Post-communist countries. (Report No. 44) Vienna: Institute for Advanced Studies.
Wallace, C., Bedzir, V., & Chmouliar, O. (1998). Some Characteristics of Labour Migration in the Central European Buffer Zone. Institut für Höhere Studien, Vienna: Sociology Series no. 25
Wallace, C., Chmouliar, O., & Bedzir, V. (1997) Spending, Savina and Investing Social Capital. Shuttle traders in East-Central Europe. (Report No. East European Series No.43). Vienna: Institute of Advanced Studies.
Wallace, C., Chmouliar, O., & Sidorenko, E. (1996). The eastern frontier of western Europe: mobility in the Buffer Zone. New Community. 22 (2), 259-286.
Wallace, Claire, Haerpfer, Christian, 1998a. Three Paths of Transformation in Post-Communist Central Europe. (Sociological Series No.28) Vienna:Institute for Advanced Studies
Wallace, Claire, Haerpfer, Christian, 1998b. Some Characteristics of the New Middle Class in Central and Eastern Europe: a 10 Nation Study, (Sociological Series No.30) Vienna: Institute for Advanced Studies.

44 — Wallace / Migration and Survival Strategies in East-Central Europe — I H S
Appendix
The Austrian Paul Lazarsfeld Society for Social Research (PLG) has conducted a longitudinal large-scale and cross-national survey on economic and political changes in Central and Eastern Europe with an average of 10.000 interviews per year since 1991. The first and foremost aim of that annual survey is the regular monitoring of mass public reactions in postcommunist Central and Eastern Europe to the economic, social, and political transformations since the demise of communism and the subjective quality of life, especially standard of living of post-communist citizens. The following countries are covered in this longitudinal study:
1. Belarus * 1992 1994 1996 19982. Bulgaria 1991 1992 1994 1996 19983, Czech Republic 1991 1992 1994 1996 19984. Croatia * 1992 1994 1996 19985. Federal Republic
of Yugoslavia * * 19986. Hungary 1991 1992 1994 1996 19987. Poland 1991 1992 1994 1996 19988. Romania 1991 1992 1994 1996 19989. Slovakia 1991 1992 1994 1996 199810.Slovenia 1991 1992 1994 1996 199812. Ukraine * 1992 1994 1996 199813. Russia * * 1994 ★ it
The cross-national survey of the Paul Lazarsfeld Society is called the NEW DEMOCRACIES BAROMETER (=NDB) and was conducted in 1991 (=New Democracies Barometer I), in 1992 (=New Democracies Barometer II), in 1994 (=New Democracies Barometer III), in 1996 (=New Democracies Barometer IV). The last round ofthat longitudinal 10-Nation-Study took place in February/March 1998 (=New Democracies Barometer V).
The fieldwork of the New Democracies Barometer is subcontracted to national partners of the Paul Lazarsfeld Society in the 11 countries covered. All eleven national partners have to fulfil the so-called ESOMAR standards and are either academic institutes in the social sciences or commercial private enterprises. In each of the 11 countries, 1000 respondents are surveyed in face-to-face interviews. The basic sampling procedure in each country follows ESOMAR principles of a multi-stage, random probability sample in which the population is stratified regionally and within regions according to urban-rural divisions and town size. One hundred or more primary sampling units (PSU) are drawn in each country. Within each PSU individual respondents are chosen on the basis of standard random procedures, such as the Kish matrix, or selecting the household member next having a birthday.


Institut für Höhere Studien Institute for Advanced StudiesStumpergasse 56
A-1060 Vienna
Austria
Phone:+43-1-599 91-216
Fax: +43-1-599 91-191