strategies to maximize special education staar achievement ... · next, the 2001 essentials of...
TRANSCRIPT

Strategies to Maximize Special Education STAAR
Achievement
By
William L. Johnson, Ed.D., LMFT
Tyler Independent School District
Tyler, TX 75701
(903) 262-1000
&
Annabel M. Johnson, Ph.D.
Jared W. Johnson, B.S.
2015 Annual Conference of the Science
Teachers Association of Texas (STAT)
November 12-14, 2015
Fort Worth, Texas 76102

2
Abstract:
This document is from presentations at the 2015 annual conference of the
Science Teachers Association of Texas (STAT). The two presentations (each listed
as featured sessions at the state conference) examined strategies used in a three-
tiered program designed to maximize Texas end-of-course chemistry achievement
for special population students: inclusion (IN) special education students,
economically disadvantaged (EDS) students, limited English proficiency (LEP)
students, and 504 students. The three-tiered program was based on school
culture findings, productive classroom management, and testing strategies. The
presenter developed the program over five years studying over 500 students
consisting of 80% high school sophomores and 20% high school juniors. The
overall passing rate for the combined pilot and state chemistry testing was in the
90% passing range. For the last and only year of Texas end-of-course STAAR state
chemistry testing (because of changes in the state law of Texas), the presenter
had more commended students on the chemistry STAAR state test than any other
chemistry teacher at the 6A Robert E. Lee High School in Tyler, Texas. This was in
comparison to teachers with largely pre-AP, AP, and IB students. The presenter’s
students were from the on-level, special education, economically disadvantaged,
limited English proficiency, and 504 populations. These results indicate that the
presenter’s students made significant academic progress using the three-tiered
program components noted in the conference presentations. This document will
share specific strategies the presenter has used to maximize special population
student achievement and state end-of-course test scores.

3

4

5
6

7

8

9

10

11

12

13

14

15

16

17

18

19

20

21

22

23

24

25

26

27

28

29

30

31

32

33

34

35

36

37

38

39

40

41

42

43

44

45

46

47

48

49
Summary of Presentations
As the power point slides showed, the two presentations focused on strategies to maximize
special education STAAR achievement. Although these strategies focused on maximizing state
test scores, the content was generic in nature and was applicable to improving achievement in
both middle school and high school special education classrooms. The three-tiered program
was based on school culture findings, productive classroom management, and testing
strategies.
Furthermore, the success of these program components has been based on the school
production research literature. The research of John Hattie has been especially significant
(Hattie, 1992, 2003, 2009, & 2012) in the formulation of the program. Information about Dr.
Hattie’s research follows with special note of his research in special education. A review of the
power point presentation will follow the information about Hattie’s research.
What Works for Special Education Students
John Hattie’s most recent book, Visible Learning for Teachers: Maximizing Impact on
Learning (2012) was based on his 15 years’ research synthesis of more than 800 meta analyses
of 50,000 research articles, 150,000 effect sizes, and 240 million students. His research was the
largest study of education in the history of the word, and he identified what actually works in
schools to improve learning for all students. On the basis of his research in special education
settings, Hattie (1992) found that special education students could achieve as much as
“normal” students if they had special education trained teachers. This was a key to the special
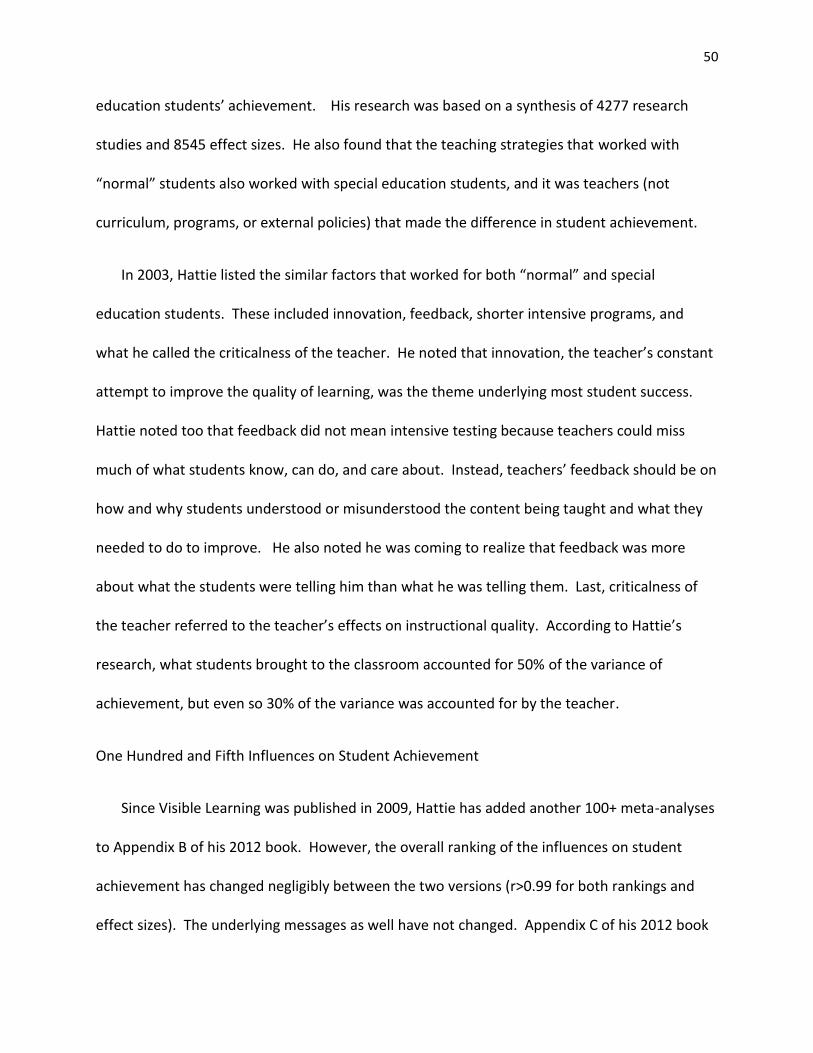
50
education students’ achievement. His research was based on a synthesis of 4277 research
studies and 8545 effect sizes. He also found that the teaching strategies that worked with
“normal” students also worked with special education students, and it was teachers (not
curriculum, programs, or external policies) that made the difference in student achievement.
In 2003, Hattie listed the similar factors that worked for both “normal” and special
education students. These included innovation, feedback, shorter intensive programs, and
what he called the criticalness of the teacher. He noted that innovation, the teacher’s constant
attempt to improve the quality of learning, was the theme underlying most student success.
Hattie noted too that feedback did not mean intensive testing because teachers could miss
much of what students know, can do, and care about. Instead, teachers’ feedback should be on
how and why students understood or misunderstood the content being taught and what they
needed to do to improve. He also noted he was coming to realize that feedback was more
about what the students were telling him than what he was telling them. Last, criticalness of
the teacher referred to the teacher’s effects on instructional quality. According to Hattie’s
research, what students brought to the classroom accounted for 50% of the variance of
achievement, but even so 30% of the variance was accounted for by the teacher.
One Hundred and Fifth Influences on Student Achievement
Since Visible Learning was published in 2009, Hattie has added another 100+ meta-analyses
to Appendix B of his 2012 book. However, the overall ranking of the influences on student
achievement has changed negligibly between the two versions (r>0.99 for both rankings and
effect sizes). The underlying messages as well have not changed. Appendix C of his 2012 book

51
rank ordered the 150 influences that have had the greatest effect size on student achievement.
Interestingly, about a half-dozen of the top 150 influences refer to special education students
or special education programs. For example, the number two influence on student
achievement was “Piagetian programs” (effect size 1.28). However, these programs have not
been used extensively in the United States. “Response to intervention” (effect size 1.07) was
number three on his list, and Hattie’s “Comprehensive interventions for learning disabled
students” (effect size 0.77) was his number eight influence. Both are top strategies used in
special education instruction. According to Hattie (2012), feedback was also one of the most
powerful influences on learning and achievement. See Waack (2013) for a glossary of Hattie’s
top ten influences on student achievement. Interestingly, “Home environment” and “Socio-
economic status” were numbers 44 and 45 on the rank-ordered listing of the 150 influences. In
other words, dozens of influences had greater effect sizes than students’ backgrounds. What
does this say about the ideas that special education students cannot learn? Our work with
special education over the past decade has shown that special education students are very
capable of learning and achieving with a teacher trained in special education.
Effect of School Variables on Special Education Students
In his 2012 book, Hattie’s research showed that some school variables like buildings, school
size, and curriculum were among the least beneficial influences on student achievement
(compared to the effect size of the teacher). Yet these influences still seem to dominate our
debates. We like to talk about things that really don’t have very large effect sizes, such as all
the structural things and the way schools are organized. The most powerful effects, however,

52
are related to features in the school: the climate of the classroom, peer influences, and the lack
of disruptive students. Excellent teachers know how to build classroom climates. We have
seen these teachers greeting students at their classroom doors between classes and seating
students alphabetically so they can learn their students’ names. These teachers also identify
their class leaders so that group can be a positive influence on the other students. The great
teachers can identify the most important ways to represent the subject material they teach.
That’s why they are great teachers. Also, they are keenly aware that learning is primarily a
social activity. Learning is all about building relationships, but don’t forget that the intent is to
build classroom cohesion and set the tone for student engagement, persistence, and learning
(Hattie, 2012, 187). A classroom climate is critical for special education students, and that is
why school features have such large effect sizes.
Power Point Slides
The power point slides first showed the percentage distribution of children ages 3-21
served under the Individuals with Disabilities Education Act (IDEA), Part B, by disability type.
These types were discussed along with the characteristics of children in several of the groups.
Next, the 2001 Essentials of Cross Battery Assessment by Dawn Flanagan and Samuel Ortiz
(Alan S. Kaufman & Nadeen L. Kaufman, Series Editors) was discussed to clarify how the theory
of cognition related to special education testing and placement. This was followed by a review
of Hattie’s research findings about special education students. Next, the effect size of several
strategies from Hattie’s 150 influences on achievement were reviewed (Hattie, 2012). Then
information about teaching strategies used with special population students was reviewed

53
along with the placement of special population students. This discussion encompassed several
slides focusing on soft skills needed by special population students to achieve in school as well
as process skills and their importance.
This was followed by a discussion of why students fail, then a discussion of special education
accommodations and modifications. The continuing topics dealt with decoding the school and
classroom, decoding the student, and decoding the state tests. There was then a discussion of
how to build a classroom culture so all special population students could succeed. This
included why the great teachers are great teachers. Next, there was a discussion of Robert
Marzano’s meta-analysis from his Classroom Management that Works book. His four
management factors along with the average effect sizes of each and the percentile decrease in
classroom disruptions was noted. This led to a discussion about classroom rules and the ten
components of a preventive discipline program. A positive climate has to be built for special
population students to work and achieve. This was followed by student engagement examples
and characteristics of students with emotional problems. Next there was a discussion of test
taking strategies and a brief explanation of how item response theory (IRT) has been used in
the development of state and national tests. The intent was to show what students need to
know about tests and testing. This is an overlooked area in state test preparation. Last, the
presenter took questions from the audience at the conclusion of the sessions. Also, both of the
presentations were noted as featured sessions in the CAST conference program.

54
References
Ball, D.L., & Cohen, J.K. (1995, April). What does the educational system bring to learning a
new pedagogy of reading or mathematics. Paper presented at the annual meeting of
the annual meeting of the American Educational Research Association, San Francisco.
Becker, L.E. (2009). Effect size calculators. Retrieved from http://www.uccs.edu/~faculty/
1becker/.
Bill & Melinda Gates Foundation (January 2013). Ensuring fair and reliable measures of
effective teaching. Seattle, WA.
Chrispeels, J.H. (1992). Purposeful restructuring: Creating a culture for learning and
achievement in elementary schools. Washington, DC: Farmer Press.
Coe, R. (2002). It’s the effect size, stupid: What effect size is and why it is important: Retrieved
from http://www.leeds.ac.uk/educol/documents/00002182.htm.
Coleman, J. (1998). Social capital in the creation of human capital. American Journal of
Sociology, 94, S95-S120.
Darling-Hammond, L. (2000). Teacher quality and student achievement: A review of state
policy evidence. Education Policy Analysis Archives. No 1. Available http://
olam.ed.asu.edu/epaa/v8n1/.
Edmonds, R. (1979). Effective schools for the urban poor. Educational Leadership, 37, 20-24.
Fasco, S.N. (2006). Special education services and response to intervention: What, why, and
How? Nonpartisan Education Review, 2(9). Retrieved from http://npe.education
news.org/Review/Essays/v2n9.htm.
Ferguson, R. (1991). Paying for public education: New evidence on how and why money
matters. Harvard Journal of Legislation 28.

55
Flanagan, D.P., & Ortiz, S. (2001). Essentials of Cross-Battery Assessment. New York:
John Wiley & Sons, Inc.
Grissom, J., Loeb, S., & Master, B. (2013). Effective instructional time use for school leaders:
Longitudinal evidence for observations of principals. Educational Researcher, 42(8),
433-444.
Hale, J.B., Naglieri, J.A., Kaufman, A.S., & Kavale, K.A. (2004). Specific learning disability
classification in the new individuals with disabilities education act: The danger
of good ideas. The School Psychologist, 58, 6-13.
Hattie, J. (1992). What works in special education. Presentation to the Special Education
Conference, Auckland, NZ. Retrieved from http://www.education.auckland.ac.nz/
webdav/site/education/shared/hattie/docs/special-education.pdf.
Hattie, J. (2003). Teachers make a difference: What is the research evidence? Paper
presented at the Australian Council for Educational Research Annual Conference
on Building Teacher Quality, Melbourne, AU.
Hattie, J. (2009). Visible learning: A synthesis of over 800+ meta-analyses to achievement.
London: Routledge.
Hattie, J. (2012). Visible learning for teachers: Maximizing impact on learning. London:
Routledge.
Hattie, J., & Timperley, H. (2007). The power of feedback. Review of Educational Research,
77(1), 81-112.
Johnson, W.L., & Johnson, A.B. (1999). Assessing perception of school climate among
Jordanian students in English-speaking schools. Psychological Reports, 84, 395-397.

56
Johnson, W.L., & Johnson, A.B. (1999). World-class schools in the 21st century. Bulletin
National Association of Secondary School Principals, 83(606): 26-31.
Johnson, W.L., & Johnson, A.B. (2010). An innovative program that results in science
school improvement. Texas Study of Secondary Education, 19(2), 21-23.
Johnson, W.L., & Johnson, A.B. (2012). Predicting student success on the Texas chemistry
STAAR test: A logistic regression analysis. Retrieved from www.google.com.
Johnson, W.L., & Johnson, A.B. (2012). Preparing for the STAAR test: The third generation
correlates of effective schools. Texas Study of Secondary Education, 21(2), 5-8.
Johnson, W.L., Johnson, A.B., Hunt, M.J., & Gilliam, B. (2002). The second generation correlates
effective schools. Texas Study of Secondary Education, 11(1), 3-6.
Johnson, W.L., Snyder, K.J, & Johnson, A.B. (1991). Instructional leadership for productive
schools. Teacher Education and Practice, 1, 51-58.
Kaplan, L.S., & Evans, M.W., Sr., (1997). Changing school environment: Restructuring one
Virginia high school. NASSP Bulletin, 81(589), 1-9.
Klotz, M.B., & Canter, A. (2006). Response to intervention (RTI): A primer for parents.
Retrieved from http://www.nasponline.org/resources/factsheets/rtiprimer.aspx.
Lezotte, L.W. (1991). Correlates of effective schools: The first and second generation.
Okemos, MI: Effective Schools Products, Ltd.
Myers, L.S., Gagmst, G., & Guarino, A.J. (2006). Applied multivariate research design and
interpretation. Thousand Oaks, CA: Sage Publications.
National Staff Development Council (1995). Standards for staff development. Oxford, OH:
Author.

57
Peters, J. (2004). School environment: Putting staff No. 1 connects students. Retrieved from
http://www.aasa.olrg/publications/saarticledetil.cfm?mninumber=&pf=1&snitem-
number=.
Snyder, K.J., Anderson, R.H., & Johnson, W.L. (1992). A tool kit for managing productive
schools. Educational Leadership, 49(5): 76-80.
Spillane, J.P., & Thompson, C.L. (1997). Reconstructing conceptions of local capacity: The
local education agency’s capacity for ambitious instructional reform. Evaluation
and Policy Analysis, 19, 185-203.
Waack, S. (2013). Glossary of Hattie’s influences on student achievement. Retrieved from
htto://visible-learning.org/glossary/.

58
Bios:
Dr. William Johnson, a patentee in chemistry, teaches chemistry at Robert E. Lee High School in Tyler,
Texas. Having served as a consultant in industry/education and published over 250 articles, he has
presented at more than 50 conferences. While earning his doctorate from Texas Tech University, he was
a Jones Fellow. Annabel M. Johnson, Ph.D., is a former university professor and administrator. She has a
Ph.D. from Texas Tech University where she served as Acting Graduate Dean of the College of Family
Studies while she earned her Ph.D. degree. The Drs. Johnson have consulted in special education on-site
with international governments. Jared W. Johnson, B.S. in Business, is a graduate of Stephen F. Austin
University. He is an expert in the areas of computer design and graphics.