strategy execution champions - ica.gov.ae · palladium balanced scorecard hall of fame report 20143...
TRANSCRIPT

Strategy Execution ChampionsThe Palladium Balanced Scorecard Hall of Fame Report 2014


1P a l l a d i u m B a l a n c e d S c o r e c a r d H a l l o f F a m e R e p o r t 2 0 1 4
Strategy Execution ChampionsThe Palladium Balanced Scorecard Hall of Fame Report 2014In this tenth annual Balanced Scorecard Hall of Fame Report, we pay tribute to the 15 organizations that were inducted into the Palladium Balanced Scorecard Hall of Fame for Executing Strategy® in 2013. This diverse group represents a broad spectrum of industries from the public and private sectors throughout the world. All are exemplars of strategy management discipline, achieved through their application of the Kaplan-Norton approach to strategy execution as embodied in the Palladium Execution Premium Process (XPP). The remarkable execution premiums these winners have achieved attest to the power of disciplined strategy management when it is successfully linked to operations.
I N T R O D U C T I O NIntroduction . . . . . . . . . . . . . . . . . . . . . . . . . . . . . . . . . . . . . . . . . . . . . . . . . .2
P R O F I L E S Abu Dhabi Education Council . . . . . . . . . . . . . . . . . . . . . . . . . . . . . . . . .6
Abu Dhabi Sewerage Services Company. . . . . . . . . . . . . . . . . . . . . . .8
Allianz Italy. . . . . . . . . . . . . . . . . . . . . . . . . . . . . . . . . . . . . . . . . . . . . . . . . . .10
Arabian Automobiles . . . . . . . . . . . . . . . . . . . . . . . . . . . . . . . . . . . . . . . . .12
Bank Hapoalim . . . . . . . . . . . . . . . . . . . . . . . . . . . . . . . . . . . . . . . . . . . . . . .14
Canadian Tourism Commission . . . . . . . . . . . . . . . . . . . . . . . . . . . . . .16
City of Bucheon, South Korea . . . . . . . . . . . . . . . . . . . . . . . . . . . . . . . .18
Emirates ID Authority . . . . . . . . . . . . . . . . . . . . . . . . . . . . . . . . . . . . . . . .20
Korea South-East Power Company . . . . . . . . . . . . . . . . . . . . . . . . . . .22
Powder River Energy Corporation . . . . . . . . . . . . . . . . . . . . . . . . . . . .24
Roads & Transport Authority, Dubai . . . . . . . . . . . . . . . . . . . . . . . . . .26
7-Eleven Australia . . . . . . . . . . . . . . . . . . . . . . . . . . . . . . . . . . . . . . . . . . . .28
Songpa-Gu. . . . . . . . . . . . . . . . . . . . . . . . . . . . . . . . . . . . . . . . . . . . . . . . . . . .30
City of Tamarac, Florida . . . . . . . . . . . . . . . . . . . . . . . . . . . . . . . . . . . . . .32
Turkcell Superonline . . . . . . . . . . . . . . . . . . . . . . . . . . . . . . . . . . . . . . . . .34

2 S t r a t e g y E x e c u t i o n C h a m p i o n s
Introduction to the 2014 Balanced Scorecard Hall of Fame ReportRandall Russell Director of the Hall of Fame Program
Welcome to the 2014 Hall of Fame Report featuring 15 organizations that were inducted into the Palladium Balanced Scorecard Hall of Fame for Executing Strategy® in 2013. Again, this year, the organizations entering the Hall of Fame represent a diverse set of industries and geographies. Eight of them are government organizations, five are from the private sector, and two are utilities. Six of them are from the Middle East region which is no surprise given the fact that, according to the most recent study of management tools by Bain & Company1, the Balanced Scorecard is the most popular management tool in that region.
As you read these case studies you will discover three dominant story lines that emerge from the cases. These three story lines include the big bang, the use of communication to drive change, and the use of evidence-based decision making.
In Pursuit of the Big Bang
In over half of these case examples the scorecard was adopted to help overcome a new and significant set of strategic challenges. Each of these cases was in pursuit of strategic opportunities that represented the possibility of a “big bang” strategic result. They all were inducted into the Hall of Fame because they provide useful examples of how to leverage the Kaplan-Norton scorecard framework in this strategic context.
• In 2011 7-Eleven Australia was extending its product line to include gasoline sales for the first time. This shift represented a high-risk high-reward scenario that would pit this convenience store chain against the major grocery chains that were also pursuing this opportunity for strategic differentiation, in addition to the incumbent stand-alone gas stations. 7-Eleven
enjoyed great success by including both suppliers and franchisees in its communication approach.
• The Abu Dhabi Education Council (ADEC) was strategically positioned to deliver greatly improved educational services to the population it serves. Since ADEC became operational in 2006 it grew its core staff over tenfold and dramatically improved performance of the 470+ educational institutions it oversees.
• When the Canadian Tourism Commission (CTC) launched its scorecard program in 2005 it knew the upcoming 2010 Winter Olympics represented a tremendous opportunity to attract tourists and drive attendance. Driver models were developed to show how CTC’s efforts could be most effective, and by the time of the Olympics they were able to document $1 billion in incremental tourism revenue.
• The Emirates ID Authority (EIDA) was tasked with registering the entire population of the United Arab Emirates, which doubled in size between 2005 and 2009 from four to eight million.
• Powder River Energy faced an unprecedented growth in demand for electrical services due to the boom in energy production in the region.
In each of these cases the leadership teams understood the new opportunities they faced and chose the Balanced Scorecard to help them achieve great success.
Communication Drives Change
All Hall of Fame organizations are strong communicators. Communication is one of the most immediate and powerful opportunities Hall of Fame organizations use to improve internal alignment. And, in many cases, communication is used to reach external audiences as well. Given the wide variety of communication tools and channels available today, organizations have it within their control to become as transparent as they like. Sharing the story of the strategy is a way to engage the interests of various audiences and shape attitudes and behaviors of specific target populations. This year’s Hall of Fame cohort demonstrates a variety of approaches to transparency.
• Allianz Italy involved employees and field agents in the development of an important program aimed at
1 Management Tools & Trends 2013, Bain & Company
3P a l l a d i u m B a l a n c e d S c o r e c a r d H a l l o f F a m e R e p o r t 2 0 1 4
transforming the entire organization. OneAllianz was co-created in the interest of increasing acceptance of the new strategy and of aligning initiatives across the organization to deliver new products and sales support tools. They even engaged with sales people working for competitors to build a strong pipeline of recruiting candidates.
• Arabian Automobiles uses visual aids for communicating strategic priorities that include banners, framed vision, mission, and quality policy statements, table-top flags, and calendars and diaries featuring the key messages for the upcoming period. In addition, as a part of cascading the corporate strategy and promoting ownership across all employees, strategy cards have been issued outlining the corporate vision, mission, and the business unit’s strategy map.
• Korea South-East Power is especially interested in transparency and invested in educating its employees on the use of SMART principles, which help everyone become expert at using a system of measures that are Specific, Measureable, Attainable, Relevant, and Time-Bound. By providing education to all employees they were able to thoroughly install the new methodology by setting the stage for a significant change in values that was reinforced by the use of a system of rewards and recognition.
Evidence-Based Decision Making
The Balanced Scorecard does more than provide a method for describing strategy and making it measurable. It also prepares the ground for testing strategic hypotheses to allow cause-effect relationships to be examined and for evidence-based decision making to take place. To take full advantage of this powerful capability the set of measures must be populated with data—over a long enough period—so that the hypotheses can be evaluated. Hall of Fame organizations typically have three or more years of experience with the use of this methodology. Therefore these leaders in strategy execution are able to demonstrate how to achieve this capability.
• Since 2009 Bank Hapoalim has carried out an annual process of strategy revision and planning. The process culminates in five days of intense discussions known as the Moriah (“peak”) discussions. During
these discussions, key strategic issues are presented and the aligned work plans and initiatives for the next three years are approved. These are the most significant strategic discussions at the bank and are based on detailed knowledge of past performance against measurement targets and an understanding of how specific strategic initiatives contributed to past achievements. This evidence of how the strategy works is used to establish personal accountability that is rewarded when key targets are achieved.
• Turkcell Superonline monitors its strategic achievements at an especially intense level. The executive team holds weekly operational reviews for the day-to-day business issues and meets monthly and quarterly to review strategic performance. In the monthly meetings the accent is put on the Superindicators and the ten strategic initiatives that drive the majority of the strategy’s success. Every quarter, competitors’ behavior is also monitored and strategic actions and priorities are evaluated according to the environmental changes.
Other Lessons
Another theme that was present in about half the cases was an explicit emphasis on how values can provide a mechanism for achieving transformational change. This was especially true in some of the government organizations where attention was paid to shifting the organization from a bureaucratic to a performance-driven culture. The Abu Dhabi Sewerage Services Company (ADSSC) is a case in point. ADSSC adopted a comprehensive and interdependent approach in developing its performance management system. It established an Organizational Excellence Model, an integrative framework that provides a holistic view of numerous management perspectives, including leading performance management practices focused on strategy (such as strategy maps), risk (such as risk maps), performance (such as the Abu Dhabi Award for Excellence in Government Performance), integrated management standards (such as ISO 9001), and an organizational excellence component (based on benchmarking). Together, these tools provided a behaviorally-grounded approach that allowed ADSSC to set direction and eliminate behaviors that were not complementary to the cultural shift they were committed to bringing about.

4 S t r a t e g y E x e c u t i o n C h a m p i o n s
Rise of the Cities?
Finally, three cities—two in South Korea and one in the US—are included in this report. In the 2013 Hall of Fame Report, only one city was represented. The question arises whether the number of cities this year suggests that cities are beginning to implement the Balanced Scorecard in greater numbers. We’ll keep a close eye on this sector to see what is shaping up. For now, we’ll simply observe that in each of the three cities in this cycle the common theme is to improve the quality of life for citizens by increasing the rate of new business formation, improving the quality of education, and responding to changing demographics at the city level.
Another advanced practice observed in this cohort was the use of the scorecard system to extend the strategy out to the end customer as well as back to other parts of the extended value chain. For example, Roads & Transport Authority (RTA) was established to coordinate and streamline transportation within Dubai and across the other emirates in the UAE as well. To achieve this mission, they actively influence behavior of individuals and coordinate actions of all transportation providers. They work to increase demand for public transportation and smooth the flow and reduce the accident rate of automobile transportation.
Palladium Balanced Scorecard Hall of Fame for Executing Strategy® by Industry, 2000–2013
© 2013 Palladium Group, Inc.

5P a l l a d i u m B a l a n c e d S c o r e c a r d H a l l o f F a m e R e p o r t 2 0 1 4
Here’s how they approached these challenges:
• Bucheon is a satellite city of Seoul, South Korea. At the turn of the century it became more difficult to attract and retain companies due to the national development policy and a rise in real estate prices. Companies were moving to areas with lower costs. To protect its tax base and to remain an attractive place to live, Bucheon decided it needed a new strategy that fit the times. City leadership engaged in benchmark studies and visited Charlotte, North Carolina, which became a member of the Hall of Fame in 2000. Since implementing its strategy with the Balanced Scorecard, Bucheon has become a citizen-centered city and is acknowledged as the best place to live in the country.
• Songpa-Gu is also in South Korea. Before adopting the Balanced Scorecard, the culture of city government was conventional and conservative. To implement a new strategy, the administrative system had to shift from being function-oriented to strategy-oriented. In the interest of introducing change, the new mayor wanted to raise awareness of the need for a new mission and vision that required a shift in culture in order to be successful. She transformed the city government by establishing a performance-oriented culture. Today the scorecard is used to motivate the workforce to improve performance. Incentives are used to recognize and reward performance. The highest-achieving departments and individuals share financial rewards and other forms of recognition and nonfinancial rewards are also used.
• Tamarac, Florida is the third city in this group. Its story supports two of the themes noted earlier: the role of values in transforming an organization and the use of evidence-based decision making to gain strategic benefits over the long term. In 2008 an external evaluation of the city’s management approach concluded that it was a data rich yet information poor (DRIP) organization. While they were achieving some improvements in management outcomes, the data that were generated did not always lead to improved decision making. After implementing the scorecard approach and adopting the principles of a Strategy-Focused Organization, they have created a four-step annual process that is used to manage the strategy and get the most value from the information they capture. The four steps in the annual process are input to the strategy formulation process, strategy development, organizational alignment, and performance monitoring and analysis.
This group of fifteen organizations represents a truly global and diverse set of case studies. The common thread is that they have chosen a direction (strategy), they have communicated the desired direction to all relevant stakeholders (alignment), and they continue to monitor progress over time to allow course corrections and to provide input to the next strategy review cycle (evidence-based decision making). There is much to be learned here even if you are not in the same industry as any of these organizations. They are united in their common pursuit of strategy execution. Join them.

6 S t r a t e g y E x e c u t i o n C h a m p i o n s
Abu Dhabi Education Council
Abu Dhabi Education Council (ADEC) is a government entity charged with regulating and operating all public schools and
regulating all private education entities within the emirate of Abu Dhabi. ADEC’s mandate also extends to establishing academic institutions and educational bodies in coordination with the Ministry of Higher Education and Scientific Research and with the approval from the Executive Council of Abu Dhabi. Since its formation in 2005, ADEC has been working toward ensuring that education is fit to enable an innovation-based, knowledge-producing society. The transformation effort has involved approximately 350,000 students, 22,000 teachers, and more than 470 educational institutions across public and private school sectors. The Balanced Scorecard (BSC) enables ADEC to create synergies between these sectors, creating a common performance agenda in support of a unified ADEC strategy.
Economic Vision 2030
ADEC was formed under the directive of His Highness Sheikh Khalifa Bin Zayed Al Nahyan, who is the United Arab Emirate (UAE) president, the Supreme Commander of the Armed Forces, and the Ruler of Abu Dhabi, with a goal to deliver a high-quality education system that enables all students to reach their full potential to support Abu Dhabi’s growth and prosperity, and to develop the human capital of the emirate.
When it became operational in 2006, ADEC’s 56 employees oversaw the delivery of education in Abu Dhabi from an operational perspective and through a simple organizational structure. However, in 2007 the government of Abu Dhabi launched an ambitious Economic Vision 2030 effort that aims to create a secure society with an open, dynamic economy by implementing three key pillars: infrastructure development and environmental sustainability, optimization of government operations, and social and
human resource development. The latter is considered the preeminent pillar, and the government’s number one priority was ensuring that the highest quality education system (along with health services) is available to Abu Dhabi residents.
Emphasis on education is intended to transform the role of ADEC in the UAE. As one measure of this transformation, in 2013 ADEC had about 620 employees, a more-than-tenfold increase from 2006. These employees are located within four strategic business units (pre-primary to year 12; private schools; higher education; and support services). Together these units comprise 29 divisions.
Strategic Evaluation and Planning
Developing these business units was one outcome of a comprehensive strategic evaluation and planning exercise that was conducted in 2009. Facilitated by the Office of Planning and Strategic Affairs (which is ADEC’s version of an Office of Strategy Management), the senior management team identified several challenges that ADEC had to overcome if the education system was to be reformed and an education system developed that would enable ADEC to make its crucial contribution to delivering the 2030 vision. Challenges included the poor quality of course curricula, teacher qualifications, the conditions of school buildings, and the lack of an overarching governance model for education. The strategic plan developed to deal with these issues would also attempt to significantly improve the percentage of grade 12 students that were able to enter tertiary education without remedial programs (most required a one-year program before entering university).
Strategic Themes
Given that ADEC assumes a regulatory role for higher education and private schools while also regulating and operating public schools, different value propositions were developed for each sector. ADEC’s executive leadership team, chaired by His Highness General Sheikh Mohamed Bin Zayed Al Nahyan, did not believe that overall corporate and stakeholder value would be achieved through just the governance of these three sectors. Rather, benefits would be realized by aligning the sectors behind a common corporate vision, “to be recognized as a world-class education system that supports learners in achieving their full potential to compete in the global market.”
7P a l l a d i u m B a l a n c e d S c o r e c a r d H a l l o f F a m e R e p o r t 2 0 1 4
After an exhaustive review, the BSC was chosen as the management framework to enable unification around this purpose.
During 2010 a suite of strategy maps and BSCs was developed, starting at the corporate level and cascading to the three education sectors and 29 divisions. To ensure a common focus, the three-sector strategic plans were distilled into two strategic themes on the strategy map: schools and higher education. This way, all sectors were aligned behind a common ADEC strategy.
Alignment, Up and Down
As a public entity, ADEC has settled on three, as opposed to the more conventional four, scorecard perspectives, with enablers at the base, service delivery at the top, and internal processes in the middle. Importantly, the service delivery perspective captures seven outcomes required by the Abu Dhabi General Secretariat of the Executive Council (GSEC), to which ADEC reports. In turn, GSEC’s outcomes (such as “an education system that supports student-centered learning and delivers excellent student outcomes”) are drawn from its own performance management framework that supports the high-level government goals that are described in Abu Dhabi’s all-of-government strategy map. The overarching mission measure is to become “a world-leading educated population able to lead the society and economy of Abu Dhabi.” ADEC’s strategic objectives are directly aligned to those of the emirate’s government.
ADEC has driven strategic alignment to the individual employee level. Since 2012, every ADEC employee has set, with their line manager, measures and targets that are based on the three strategic perspectives. The performance management form has sections on perspectives, objectives, measures, weights, targets, and achievement. The end-of-year evaluation drives individual performance results and their professional development needs.
Strategic Initiatives
ADEC recognizes the pivotal role that well-managed strategic initiatives play in strategy execution. A robust initiative prioritization process is in place that assesses candidate initiatives according to relevance, impact on strategic objectives, and urgency criteria. Many initiatives within ADEC are complex
and interdependent so a robust selection and management process is essential. Initiative selection includes a 10-stage project-planning form that includes ownership, milestones, budget, and risk. The aggregate budget from all approved initiatives constitutes the corporate strategic budget.
Initiatives are discussed during the quarterly senior management review of the corporate and cascaded scorecards. A version of the quarterly strategic review is submitted to the office of the Crown Prince, detailing performance to the corporate scorecard, trend analysis, and the progress of major initiatives, thus strengthening the link between the work of ADEC and the aspirations of Abu Dhabi.
“In a nutshell, the Balanced Scorecard has become embedded in our corporate culture and day-to-day operations and has extensively helped us in understanding the overall picture and visualizing ADEC’s direction,” comments Director General His Excellency Dr. Magheer Al Khali. “With this framework we were able to communicate ADEC strategy to the entire organization and are continuing to achieve the desired results that will help in improving the quality and standards of Abu Dhabi’s education system.”
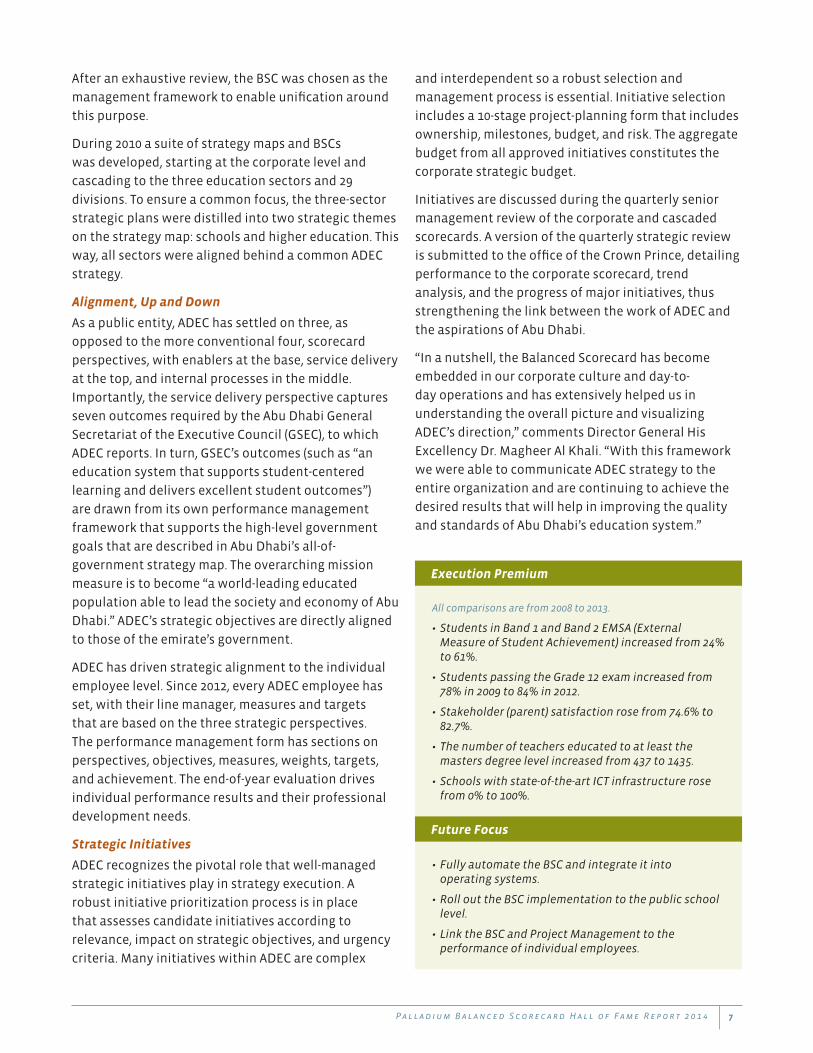
All comparisons are from 2008 to 2013.
• Students in Band 1 and Band 2 EMSA (External Measure of Student Achievement) increased from 24% to 61%.
• Students passing the Grade 12 exam increased from 78% in 2009 to 84% in 2012.
• Stakeholder (parent) satisfaction rose from 74.6% to 82.7%.
• The number of teachers educated to at least the masters degree level increased from 437 to 1435.
• Schools with state-of-the-art ICT infrastructure rose from 0% to 100%.
Execution Premium
• Fully automate the BSC and integrate it into operating systems.
• Roll out the BSC implementation to the public school level.
• Link the BSC and Project Management to the performance of individual employees.
Future Focus

8 S t r a t e g y E x e c u t i o n C h a m p i o n s
Abu Dhabi Sewerage Services Company
Owned by the Abu Dhabi Government, Abu Dhabi Sewerage Services Company (ADSSC) is responsible for all
sewerage services in the emirate of Abu Dhabi, an area of more than 67,000 km2. With an operational budget of over AED 1 billion (approximately USD 300 million), ADSSC owns, operates, and maintains five large sewage treatment plants (STPs), 31 package STPs, 298 pumping stations, and over 7,000 km of main and collection sewer lines. With over 600 employees, ADSSC is also responsible for planning and implementing system expansions required to support the rapid growth of the emirate population. Through the Balanced Scorecard, ADSSC has been able to move from a bureaucratic to a performance-driven culture and more closely involve various stakeholders in performance management and improvement.
Overstretched System, Fast-Growing Population
Established in 2005 as an independent sanitation operator, ADSSC inherited an old and overextended asset base, with a waste treatment capacity working 60% above what it could handle effectively. Leaks in the drainage pipes, bad odors in residential areas, and complaints from residents were everyday occurrences.
On top of that, projections for Abu Dhabi conservatively estimated 3.5 million residents by the year 2030, more than three times the 2005 figure (in 2012 it stood at 2.3 million). ADSSC was faced not only with a substantial increase in sewerage services demand, but with significant pressure to reduce reliance on government subsidies as well.
A Big STEP Forward
Infrastructure improvement through growth, enhancement, and upgrade of the sewerage system, while maintaining the current assets, became the basis of ADSSC’s strategy. To make it happen, a decision was made to build the Strategic Tunnel Enhancement Program (STEP), a groundbreaking deep-level sewage interceptor tunnel, catering to the immediate, short-term, and long-term wastewater and drainage needs of Abu Dhabi. Following a model used in Singapore, STEP offered many advantages, including a massive increase in capacity, a significant reduction in odor, and a lower chance that the system would overflow and flood the
streets. Although the STEP project would upgrade the emirate’s strained sewage network, such a complex breakthrough initiative would only become a reality if ADSSC’s leadership could address a key management challenge: how to inject a performance-driven culture into a bureaucratic organization.
Organizational Excellence Model
ADSSC adopted a comprehensive and interactive approach in developing its performance management system, the ADSSC Organizational Excellence Model. This integrative framework provides a holistic view of numerous management perspectives, including leading performance management practices focused on strategy (such as strategy maps), risk (such as risk maps), performance (such as the Abu Dhabi Award for Excellence in Government Performance), integrated management standards (such as ISO 9001), and an organizational excellence component (such as benchmarking).
Strategic Planning
The first strategic plan was issued in December 2007. Since then the company has developed a structured five-year strategic plan in accordance with the prescribed framework from the Abu Dhabi Executive Council (the executive authority of the emirate of Abu Dhabi).
In 2009, ADSSC incorporated the Balanced Scorecard into its corporate and cascaded plans, ensuring that all vital initiatives and service levels could be properly tracked, monitored, and evaluated. As of late 2010, ADSSC was tracking about 150 strategic measures across the organization via its computerized ARP (Automation and Reporting Program) Balanced Scorecard system. Corporate and divisional/departmental performance meetings are held each month to review and discuss underperforming areas for immediate mitigation actions, while executive committee meetings with the board of directors take place on a quarterly basis to check and fine-tune the evolution of the strategic priorities and initiatives.
Executing Strategy With the Help of Partners and Stakeholders
As a relatively small organization, ADSSC relies heavily on external stakeholders to deliver services to the community. ADSSC has embarked on a number of mega-infrastructure projects involving a large number of suppliers, consultants, and contractors and also works

9P a l l a d i u m B a l a n c e d S c o r e c a r d H a l l o f F a m e R e p o r t 2 0 1 4
closely with multiple government agencies and entities as well as government-owned master developers. As a result, one of the most important ADSSC strategic priorities (managed as a strategic theme) is enhancing coordination and collaboration with all groups of external stakeholders. ADSSC launched a strategic initiative, the Partners & Stakeholders Management Program, through which stakeholders are invited to interact in various ways, such as satisfaction surveys, focus groups, interviews, etc., in order to better understand and analyze the functioning of these relationships.
Process Benchmarking
Since launching the BSC, ADSSC has faced numerous implementation obstacles, both internally and externally. Key obstacles include:• Achieving BSC buy-in at the operational level, while
delivering ambitious capital projects and operating a severely overloaded network
• Ongoing changes in governmental plans in view of external developments
• Numerous changes in ADSSC ownership and composition of the board of directors
• Transforming organizational culture from bureaucratic to performance-driven
One of the interventions used to overcome these and other obstacles was a program to benchmark its implementation of the BSC with two leading utilities that faced similar issues to those of ADSSC. This benchmarking exercise was undertaken to learn from the experiences of other leading wastewater utilities dealing with unanticipated issues and challenges associated with implementing a complex process for monitoring and managing continuous improvement.
The benchmarking methodology provided a detailed review of each utility’s performance measurement program. Workshops were convened to discuss issues and facilitate information sharing. Each workshop featured presentations by ADSSC managers and staff as well as from the other benchmarked utilities. The ability to match performance measures with strategic objectives for the utility’s key processes, and then examine the detailed elements of the processes, was a powerful tool to evaluate performance indicators, but also to identify process best practices and inform strategic initiatives.
Supporting a Government Scorecard
The BSC directly supports the high-level government outcomes described in the Abu Dhabi Whole-of-Government Scorecard (developed in 2007). ADSSC is the co-champion (together with Abu Dhabi Water and Electricity Authority [ADWEA]) of two government outcomes, both of which aim to serve the community and the environment. Both objectives sit atop the ADSSC Strategy Map: 1) reliable, secure, safe, and cost-effective provision of water, electricity, gas, and sewerage services; and 2) the provision of water, electricity, gas, and sewerage networks that comply with environmental regulations and standards. ADSSC’s vision is to be recognized by communities, businesses, and regulators as a world leader in the provision of sewerage services in support of the emirate’s vision to be among the top five governments globally.
• Significant increase in the single most important measure of ADSSC’s mandate—Utilization of its Treatment Assets Capacity—from 60% above the capacity that these assets could handle in 2008, to 29% below the capacity in 2012.
• Significant increase in design treatment capacity from 516,014 m3/day in 2009, to 1,100,862 m3/day by the end of 2012.
• Increased customer satisfaction level from 76% in 2009 to 93% in 2012.
• Significant reduction in customer complaints response time from an average of 19 days in 2009 to 0.8 days in 2012.
• Significant increase in employee satisfaction from 57% in 2009 to 75% in 2012.
• Awarded “Golden Employer” status for increasing percentage of nationals in the workforce from 45% in 2009 to 73% in 2012.
Execution Premium
• Link compensation to performance at all levels of organization.
• Use the Automation and Reporting Program (ARP) in all external and internal reporting as a single source of the truth.
• Update existing process and risk maps.
• Integrate all Enterprise Resource Planning (ERP) applications and continue to make progress toward an integrated business intelligence model.
Future Focus

10 S t r a t e g y E x e c u t i o n C h a m p i o n s
Allianz ItalyAllianz Italy, a subsidiary of Allianz Group, is one of the
leading insurance companies in the Italian market. It has approximately 5,000 employees, 2,200 agents, and 1,500 financial advisors. Allianz Italy generates more than 10% of the Group revenues and operating profit, which makes it the second-largest country entity of the Group. A Balanced Scorecard (BSC) implementation has enabled Allianz Italy to succeed in a fiercely competitive market and overcome myriad cultural issues.
The Turnaround Story
The transformation journey started in 2007 when Allianz Italy merged its three operating companies (Allianz Subalpina, Lloyd Adriatico, and RAS) into a single organization. This generated all the usual post-merger integration challenges. At the same time the company faced—as with the other insurance players in Italy—competitive pressures originated by new Italian legislation that aimed to increase competition in the motor liability and property-casualty insurance markets.
In the same period, the agent market was dealing with a structural crisis. Market data showed a progressive reduction in the number of agents and agencies due partly to the natural aging of the agent population, but also to the decreased profitability of the agencies. This trend created the awareness among the agents for the need to change; in this respect, the model through which they worked for multiple insurers became an appealing solution for some of them.
In addition, Allianz Italy was focused on successfully executing the integration process and creating a unified central structure with common products and processes. As such, observing the deterioration of the property-casualty business, the company reacted by leveraging its DNA, characterized by strong technical capabilities, and by adopting a profit-protection strategy. This allowed the firm to defend its profitability, but at the cost of losing premiums and deteriorating relationships with agents.
A New CEO
In May 2010, George Sartorel became the new CEO of Allianz Italy. He built upon previous experiences in Allianz Australia and Allianz Turkey, where he was involved in the development of BSC systems. On arriving at Allianz Italy, Sartorel strongly supported the adoption of the BSC approach to enable shared strategic planning and to link strategy to operational execution.
Two-Phase BSC Implementation
Allianz Italy built its scorecard framework in two phases.
Phase 1: Building the core elements of the strategy execution model (2010 to 2011)
The first priority of Sartorel was to design a new strategy that would enable Allianz Italy to return to a growth track. Strategy was generated from within, using a very participative approach including numerous meetings and workshops with senior executives and business managers through the first half of 2011. The new plan was articulated in the definition of the mission, vision, key initiatives, and targets and was presented and depicted in a strategy map. The new strategy to achieve the vision of “becoming Italy’s world-class insurer” was captured in four themes:
1. A new go-to-market strategy aimed at customer acquisition through multi-access and cross-channel integration, a modular product offering architecture, dynamic pricing, and a digital platform for servicing customers “anywhere and anytime.”
2. A new distribution model, which included the integration of three existing sales networks and the design of a new agent partnership model enabled by the digital agency platform, in order to grow agents’ business and improve their efficiency.
3. Leading technical and operations competencies, by means of smarter pricing, excellence in actuarial and underwriting processes, and best-in-class claims operations.
4. Cost leadership for competitive advantage, through the digitalization of the business model and the promotion of a Smart Spend culture.
In December 2011, the first strategy review meeting took place. Around that time the company began

11P a l l a d i u m B a l a n c e d S c o r e c a r d H a l l o f F a m e R e p o r t 2 0 1 4
to cascade the strategy to the three main business areas and to key functional areas that would drive company growth (direct channel, sales force and agent recruitment, and customer acquisition).
A Project Portfolio Governance (PPG) process was established to assess strategy alignment and prioritize all existing and proposed initiatives. Strategic initiatives are submitted to the PPG evaluation only if they demonstrate a positive return on investment and impact one or more strategic objectives. The Allianz Italy strategic portfolio consists of only a few high-impact strategic initiatives that account for about 75% of the total investment budget of the company. Both the CEO and the CFO attend monthly portfolio review meetings in order to ensure continuous strategic alignment and adjust priorities as needed.
The Office of Strategy Management (OSM) was established to govern the main strategy management processes, including market watch, strategy planning and translation, strategy review and dynamic adaption, and organizational alignment to the strategy.
Phase 2: Focusing on cultural change (2012 to 2013)
The next phase saw the involvement of the entire organization—including agents—in driving the effective realization of the strategy. The main challenges at that time were low engagement of employees and the reluctance of agents to support the new strategy that could be perceived as a threat to their business model (e.g., risk of disintermediation brought by digital direct contact between Allianz Italy and the customers).
To tackle these challenges the main work streams in the second phase were:
• Implementation of an intense communication campaign to build strategic awareness and engage the employees with the strategy. GoAll!, a change and communication program targeted at all employees with interventions such as letters and videos from the CEO, quarterly meetings of the CEO with the top 500 executives to discuss strategic issues and outline results, and more than 50 one-day plenary workshops per year attended by groups of about 80 people and covering the whole employee base (where staff receive BSC training).
• Both employees and agents were involved in the development of the most important transformational
program, called OneAllianz. This form of co-creation of the future led to a rapid increase in the acceptance rate among the agents. Also, one engagement program, “Allianz on the Road,” was launched to visit all the agents in their respective cities. Two exhibition trucks visited 61 cities in just two months. In the first truck the agents attended presentations about the new strategy and aligned initiatives, new products, and new sales support tools. The second truck engaged with sales people working for competitors, to whom the strategy and value proposition of Allianz Italy were presented, with the intention of building a sound pipeline of candidates for recruiting.
George Sartorel explains the reason for the organization’s strategy execution success: “The Execution Premium cycle helped us become more structured, organized, and disciplined, and this enabled us to engage everyone. Our strategy map is like a jigsaw puzzle and every employee now owns a piece of it. It’s like having 5,000 brains at work formulating strategy and 10,000 hands implementing it daily in all their activities, decisions, and behavior.”
• Reversed the downtrend in property-casualty revenues and, for the first time in five years, started to grow (+1.4% in 2011–2012) while the market was still shrinking (-1.5% in 2012).
• Operating profit almost doubled from €662 million in 2010 to €1,136 million in 2012.
• Combined Ratio enhanced from 99.6% to 85% from 2010 to 2012.
• Agents’ Net Promoter Score jumped from -68.2% to 1.3% from 2010 to 2012.
• Employee’s Engagement Index increased from 68% to 77% in just two years.
Execution Premium
• Extension of the framework, including additional areas such as risk management, completion of the cascade to all units, and including leading indicators in the process perspective following the release of the new Business Intelligence/Enterprise Data Warehouse system.
• Change management actions, aimed at enriching the use of the BSC, by the business managers and increasing the strategic awareness across the organization.
Future Focus

12 S t r a t e g y E x e c u t i o n C h a m p i o n s
Arabian AutomobilesArabian Automobiles (now a part of AW
Rostamani – Automotive) was founded in 1968 in Dubai, with a vision to become a leading brand within the automotive industry in the United Arab Emirates (UAE). Today, with over 3,000 employees in 16 locations, Arabian Automobiles partners with global brands such as Nissan, Infiniti, and Renault and achieved US$1.3 billion revenue in 2012. A Balanced Scorecard (BSC) user since 1994, Arabian Automobiles achieved the greatest success since a BSC restructuring in 2006.
Aggressively Tackling the Financial Crisis
During 2009, the industries of UAE, as with most other countries, were feeling the effect of the global economic crisis. Second only to realty in negative impact, the auto industry saw a 45% dip in sales overall, which forced most in the sector to step back and restructure their business strategies. In this wave of consolidation, while most other companies adopted a conservative strategy, Arabian Automobiles embraced an expansive approach.
In a strategy refresh performed in 2010, Arabian Automobiles established a vision for 2015 comprised of two elements. One of them was doubling the company’s revenue to US $2 billion (from its US $1 billion in 2010) and the other was to establish itself as a world class company. This emerged from a series of brainstorming exercises involving senior managers from across the business units. In these workshops, they defined what “world-class” meant to the organization (based largely on industry benchmarks) and designed a roadmap to achieve the vision that was based on robust strategy execution, capitalizing on global expansion, and building strong processes throughout the 16 business units.
This evolved into a comprehensive framework with five pillars: a healthy financial foundation, operational excellence, emphasis on people and leadership, compliance, and a supportive organizational culture. These were buttressed by a sixth element, robust strategy, which stresses that it is success against all of
the objectives within each of the four BSC perspectives that would ultimately deliver the vision.
BSC — Take Two
Although the updated strategy maps and scorecards were launched in 2010, the BSC concept and methodology was not new to the organization. The BSC was first introduced in 1994. While the early years of BSC usage did deliver tangible benefits the organization faced some challenges early on, notably around buy-in across the units. This was largely the result of the BSC management being outsourced so that the business managers could focus exclusively on building organizational core competences. They didn’t take ownership of the approach.
Creating an OSM
Following Arabian Automobiles’ integration into the AW Rostamani Group in 2006, the BSC was reformatted and relaunched. A critical change made was the establishment of the Business Excellence Division, which was effectively the Office of Strategy Management (OSM). Reporting directly to the CEO, the seven-person OSM has responsibility for strategy planning and execution, new business development, and quality and process management.
The OSM ensures that each unit is delivering on annualized “key themes.” Arabian Automobile’s senior leadership team specifies key themes to focus on each year. For example, 2013 was identified as the year for “operational excellence” and “people and leadership.” Business improvement initiatives for these two themes take precedence and the OSM conducts a detailed assessment of initiatives, proposed by business units, to ensure alignment with the corporate vision and to assess budget requirements.
Approved initiatives are funded through a dedicated strategy execution (StratEx) fund and initiative progress is monitored through monthly BSC reviews across all business units that include business unit heads, departmental heads, and OSM staff. Significant milestones are monitored and strategic issues discussed during a quarterly BSC review, chaired by the CEO. A mid-year review is then held in which all units share their business results against targets and, where appropriate, interventions for major problems can be identified and approved. Finally there’s an annual retreat, where strategic priorities for the following year are set.

13P a l l a d i u m B a l a n c e d S c o r e c a r d H a l l o f F a m e R e p o r t 2 0 1 4
Annual BSC Awards
An annual BSC award is one of the powerful annual innovations at Arabian Automobiles used to align cascaded goals to the corporate vision. Managed by the OSM, the award is presented by the CEO to the department that has most successfully delivered to its BSC plan over the preceding year; success criteria include achievement against each of the BSC objectives and targets weighted across all four BSC perspectives, action plans implemented, and the quality of their performance analysis. Supported by the board of directors, this coveted award has become a prestigious accolade for all participating business units.
At the management level, an annual retreat provides an opportunity where business unit heads are expected to suggest big ideas that will drive the automotive business to become the industry benchmark. A feasibility study for each of these big ideas considers current industry benchmarks, competitor activity analysis, innovation in products and services, financial viability, and projected outcomes and also clearly describes how the idea is aligned to the corporate vision. From these big ideas emerges a range of strategic initiatives that directly impact strategic objectives and describe how to close performance gaps in key strategic measures.
Aligning Employees
To cascade alignment of strategy with individual members of the work force, Arabian Automobiles has aligned employee goals with the corporate vision through the performance management system (PMS). Each employee has specific performance measures that are linked to business unit strategic objectives and to corporate goals. Updated during the mid-year review to ensure continued alignment, the PMS provides a transparent view of each individual’s contribution to the company’s growth and is aimed at establishing a sense of strategic performance ownership within the employee base.
Incentive compensation is also used to better align the performance of employees with the strategy, with 40% of overall compensation being dependent on individual and business unit performance. Although the plan is to assess performance against all four BSC perspectives and strategic initiative implementation, currently only financial and customer outcome strategic measures are assessed for bonus purposes.
Communication
Employee buy-in and commitment to the strategic goals is also enabled through a robust approach to communications. As examples, an executive summary from the CEO’s desk is sent to business units each year, highlighting the following year’s priorities, strategic themes, and key expectations. Visual aids for communicating strategic priorities include banners, a framed vision, mission and quality policy statements, table-top flags, and calendars and diaries featuring the key messages for the upcoming period are given to company employees across all business unit offices. In addition, as a part of cascading the corporate strategy and promoting ownership across all employees, strategy cards have been issued comprising of the corporate vision, mission, and the business unit’s strategy map.
Moreover, the CEO hosts a monthly “coffee with the CEO” gathering, which is an open platform for all employees to share their thoughts about the company and its strategy and to convey day-to-day front line challenges. The CEO views this event as crucial for securing buy-in to the strategy and for getting the message across that strategy “is everyone’s everyday job.”
All figures compare 2006 with 2012.
• Revenue and gross profit increased by 83%, while operating profit increased by 63%.
• Customer satisfaction jumped from 52% to 80%.
• Employee retention increased from 82% to 92%.
• Technician productivity (vehicle repair) grew from 58% to 84% and appointment lead time (vehicle service) decreased from 27 days to just 1 day.
Execution Premium
• Development of a companywide process improvement culture to better align operations with strategy, comprising total quality management and six sigma practices.
• Expansion of the accountability of employees across perspectives of internal process and learning and growth, especially through better alignment of compensation with all four perspectives.
• Further increasing the revenue share from the international business division.
Future Focus

14 S t r a t e g y E x e c u t i o n C h a m p i o n s
Bank HapoalimFounded in 1921, Bank
Hapoalim has played a pivotal role in the rapid growth of Israel’s economy and is now the country’s largest bank. With 12,000 employees serving more than two million customers in 20 countries, the Bank Hapoalim Group includes Israel’s leading credit card company, is heavily involved in investment banking, provides trust services and portfolio management and, all together, is a thriving global private banking service. Its Balanced Scorecard (BSC) implementation has enabled greater alignment and synergy across the enterprise and as a consequence has helped it achieve aggressive strategic targets.
One Company, One Strategy
Before implementing the BSC in 2009, Bank Hapoalim already boasted a strong operational planning capability. But it was not fully realizing its highest level strategic plans and objectives, encumbered by organizational fragmentation and divisional misalignment. The flagship consumer and commercial banking departments, for instance, were operating very independently and support divisions were nearly out of sync with the corporate strategy. A fundamental refocusing of how performance was measured and managed was needed so that all departments would work together with greater collaboration and transparency.
Senior executives, led by CEO Zion Kenan and head of retail banking Arik Pinto (in his capacity as head of corporate strategy), realized that only by making strategy execution a sustainable competency throughout the enterprise would they be able to bring to bear the bank’s strategic potential and make the whole greater than the sum of the parts. Their greatest challenge was the fact that the divisions within the bank were unaccustomed to having their performance measured by an “outside” entity (the corporate center) or being assessed in terms of their contribution to the bank’s group strategy. The lack of alignment between the goals of the divisions and those of the corporate organization had been identified as a root
cause of earlier challenges in enterprise performance management.
To inculcate the link between corporate and the divisions, and also to demonstrate the potential power of the BSC, in 2010 the Office of Strategy Management identified improvement opportunities within the medium-sized business sector. Strengthening this segment was seen as vital to achieving growth in commercial banking (a key corporate objective). Through the corporate BSC, aggressive targets were set and a new branch initiative was launched. All the relevant units at the bank worked together to achieve the growth objective and were assigned their own growth-related targets and milestones. The support divisions became accountable for strategic objectives such as the establishment of a network of business branches (Logistics Division), establishing profiles of target staff categories (Human Resources Division), and providing the necessary infrastructure support (Technology Division). The success of the project was reflected in growing customer acquisition, revenue growth, and growing market share (from 25.1% to 33.6%) within this sector.
Strategic Themes
As the culture of collaboration and alignment improved, so did enterprise-wide engagement with five strategic themes. Together the themes represent the overarching strategy and are used to communicate the value of operating as one bank.
Within Bank Hapoalim, each objective and initiative has a manager who is assigned responsibility for execution. At the theme level, two managers from different divisions are assigned co-ownership and accountability for delivery.
Managing with the BSC — All the Way to the Board
Since 2009, the bank has carried out an annual process of strategic revision and planning. The process
Aligning managerial compensation has been central to achieving alignment between corporate and the divisions. A formal process exists in which the targets for strategic performance measures of the 120 most senior managers are determined on the basis of the BSC targets.

15P a l l a d i u m B a l a n c e d S c o r e c a r d H a l l o f F a m e R e p o r t 2 0 1 4
culminates in five days of intense discussions known as the Moriah (“peak”) discussions. During these discussions, key strategic issues are presented and the aligned work plans and initiatives for the next three years are approved by the Board of Management and the Board of Directors. These are the most significant strategic discussions at the bank. Under a directive from the CEO, every work plan that is presented and approved at the Moriah discussions is translated into targets and objectives using the BSC methodology.
Performance Conversations
Before launching the BSC, there was no connection between the bank’s strategic objective of retaining market share and the tactical objectives around customer acquisition and minimization of customer departures that were presented to the managers of the Retail Division. Indeed, from 2001 until 2008 Bank Hapoalim lost over half of a percentage point in market share every year (from 37% to 31.5%).
During those years, the annual customer acquisition target was 24,000, which was not enough to cover the losses. During the 2010 BSC discussions, this mismatch was identified as a strategic issue and the Retail Division proposed raising the target to 28,000—a highly challenging target. However, in order to achieve the desired market share it would have been necessary to set a customer acquisition target of no less than 44,000.
Accordingly, the Retail Division prepared work plans, customer acquisition activities, approaches to reduce customer attrition, and a plan to prepare the branches that would help them deliver these stretch targets. The results were impressive. In 2010, performance exceeded the stretch target that was set. Since then the net customer acquisition target and performance has grown each year. The bank ended 2013 with 74,500 new customers and a market share of 31.7%, while its two main competitors saw their market share fall from 25% to 23.4% and 16% to 13.7%, respectively.
Also, consider the following example showing how the BSC has led to greater collaboration and alignment behind corporate goals. A key focus from 2011 to 2013 was the transfer of business customers from receiving service at the retail branches to designated business branches. This would increase the focus on commercial customers and support growth in market share and in revenues from the target segment. This process represented a serious challenge because of the need
to synchronize a single work process between two large divisions, while maintaining the level of customer satisfaction of those who were transferred. During the discussions, problems in the process were anticipated and decisions were reached on how the process should be implemented. The process ended successfully, with the bank managing to increase the market share among commercial customers and to increase customer satisfaction.
Incentive Compensation
Aligning managerial compensation has been central to achieving alignment between corporate and the divisions. A formal process exists in which the targets for strategic performance measures of the 120 most senior managers are determined on the basis of the BSC targets.
Each year, performance data from each manager’s measurement targets are gathered and the score is weighted to a standardized score. The manager who receives the highest score is assigned a score of 100; the other managers are graded in line with this score and relative compensation for the manager is determined from the senior managers’ compensation basket. Accordingly, the bank ensures that the manager’s contribution to promoting the organization’s strategic objectives is aligned to the compensation which he receives.
All comparisons are 2009 to 2013.
• Regained position as largest bank in Israel, based on market capitalization.
• Market share of commercial banking rose from 25.1% to 33.6%.
• Satisfaction among retail customers rose from 75% to 83.9% and for commercial customers from 3.61 to 4.6 (on a five-point scale).
Execution Premium
• Testing the cause-effect assumptions of the strategy maps and using data to test the logic of its strategy.
• Robust, data-driven analysis of the relationship between objectives at devolved levels and the corporate-level strategic objectives of the bank.
• Improving strategy communications. The bank is cascading the strategy further down into the organization and working to align all the employees in the organization to the strategy.
Future Focus

16 S t r a t e g y E x e c u t i o n C h a m p i o n s
Canadian Tourism Commission
The Canadian Tourism Commission (CTC), a
federal crown corporation, is Canada’s national tourism marketing organization, developing campaigns that promote Canada as a premier international vacation destination. Before the 2010 Winter Olympics in Vancouver, CTC faced internal difficulties and external pressure to refine its strategic direction and demonstrate how it creates results and provides value to the Canadian tourism industry. CTC used Balanced Scorecard fundamentals to clarify its purpose as an organization and demonstrate strong return on investment.
A New CEO Defines the Need for Strategic Clarity
When Michele McKenzie began in her role as CTC’s CEO in 2004, she found an organization lacking clarity around its purpose and how it provided value for Canada and the Canadian tourism industry. Stakeholders with different expectations created internal discord over CTC’s mission, such that when Ms. McKenzie asked the employees to articulate CTC’s core business, she was met with a myriad of different responses. Clearly, CTC needed to provide a better explanation of its role within Canada’s tourism industry to its stakeholders, employees, and partners.
CTC also had the challenge of proving to its shareholders—the Canadian taxpayers and federal government—that it provided a positive return on taxpayer funding, especially as public funding was becoming more scarce. In 2005, an audit was performed on CTC by the Office of the Auditor General. As a
result of this process, CTC was called to concretely demonstrate the benefits the organization provided to the Canadian taxpayers. At that time, the organization did not clearly articulate the causal path between its marketing campaigns and Canadian tourism outcomes, nor did CTC demonstrate how factors outside of its control influenced the impact of its activities.
The upcoming 2010 Winter Olympics in Vancouver put Canada in the international spotlight, giving CTC a once-in-a-lifetime opportunity and responsibility to showcase Canada to millions of potential visitors and to prove its value as an organization.
Driver Models Show Clear Causal Linkages within the Strategy
CTC chose the Balanced Scorecard (BSC) as its framework for articulating and managing strategy. Pivotal aspects of CTC’s BSC included greater clarity into strategic intent through specific objectives and initiatives, a set of balanced measures to accurately demonstrate return on marketing investment, and a framework for performance conversations and decision making. Particularly notable was CTC’s use of the multi-perspective structure of the BSC to explicitly explore detailed linkages between strategic outcomes and CTC’s operational activities that drive these outcomes.
To accurately measure marketing return, CTC had to be clear about the factors it could influence in the tourism industry. CTC took a driver modeling approach to decompose outcomes of the Canadian tourism industry into various drivers, creating what CTC calls an Outcomes Logic Model. The model contained four domains—CTC Outputs, CTC Outcomes and Performance Measures, Canadian Tourism Industry Outcomes, and Societal Outcomes—in decreasing order of CTC control. Measures were attached to each of these domains and linked by cause-and-effect relationships. For example, advertising campaigns (CTC Output) drive increased awareness (CTC Outcomes and Performance Measures), which leads to an increased number of visitors (Canadian Tourism Industry Outcomes), and ultimately tourism GDP (Societal Outcomes). With this industry-wide driver-level view, CTC was able to clarify its role and assess its scope of impact on the larger value chain of Canadian tourism and economic development.
CTC used another unique driver modeling approach to describe its impact on the end-consumer, the tourist.
Using the Strategy Map and Outcomes Logic Model, CTC leadership was able to show their staff how the organization and its 110 employees each contributed to the ultimate outcomes the organization and its stakeholders desired.

17P a l l a d i u m B a l a n c e d S c o r e c a r d H a l l o f F a m e R e p o r t 2 0 1 4
Here, CTC detailed the decision-making journey of a potential traveler, from the initial idea of taking a vacation to the final purchase decision. CTC identified the many points along this process it could impact to influence the final purchase decision. This process gave the organization additional clarity on where to focus its strategy to optimally impact the purchase decision.
CTC leadership had ownership over the BSC, but realized they needed to “get staff on board” in order to be truly effective. Ms. McKenzie explains the leadership team needed to “. . . help [employees] understand how our strategy was advancing the priorities of the federal government, our shareholder.” Employees excelled at their day jobs—creating marketing campaigns—but did not have a “gut feel” for integrating strategic thinking into everyday activities. Using the Strategy Map and Outcomes Logic Model, CTC leadership was able to show their staff how the organization and its 110 employees each contributed to the ultimate outcomes the organization and its stakeholders desired. The driver and process models helped employees understand the causal logic between their daily activities and business outcomes. As a result, staff were better able to articulate the value behind each marketing campaign.
Involving Partners with Strategy
CTC has also aligned its key partners and contractors with its strategy. In addition to its own direct-to-market campaigns, CTC has created marketing tools and platforms that partner organizations in the provinces and territories can leverage to drive their marketing campaigns. For CTC’s partners, the BSC has provided increased transparency and credibility. CTC regularly consults its partners on strategic decisions, and as a result, its partners have been able to better understand and align their efforts with CTC’s strategy.
In addition to alignment of its regional partners, CTC also needed to align the contractors that implemented marketing campaigns created by CTC. The organization developed performance agreements with these key contractors that included specific actions and measures tied to the CTC BSC. When targeted performance was met, CTC awarded incentive pay to its contractors. This created an explicit mutual understanding of expected performance and contribution to strategy, ensuring a successful start-to-end marketing process.
Preparing for the Future
Since the development of its BSC, CTC has tested the robustness of its strategy through annual scenario planning exercises. Because tourism is influenced by many factors outside of CTC’s control, the organization has carefully and widely examined its range of strategic options, allowing CTC to explore different opportunities and plan for risks. CTC scans its environment annually to fully understand its business environment, including the impact of policy issues and potential threats pertinent to the tourism industry.
Demonstrating Clear Value
Using the BSC framework, CTC has been able to demonstrate substantial ROI on its campaigns and has established itself as an industry leader to its stakeholders and financial sponsors. As CTC’s Strategy Management Advisor, Zemin Kheatani, describes the situation, “there is clarity around not only what we are trying to achieve, but also on how we plan on achieving it.” This strategic clarity has led them to an effective shift in their marketing strategy, which contributed to a very successful 2010 Winter Olympics in Vancouver; in that year, the organization recorded $1 billion in incremental tourism revenue and more than 500,000 trip bookings from the UK, France, and Germany as a direct result of CTC’s work.
All results are from 2008 to 2010, except where noted.
• Attributable tourism export revenue jumped 300% from $323 million to $1.35 billion.
• Number of customers converted from direct-to-consumer advertising more than doubled from 502,000 to 1.2 million.
• Consolidated marketing campaign ROI nearly doubled from 45:1 to 82:1.
• Ranking on FutureBrand’s Country Brand Index improved from #12 in 2006 to #1 in 2010 and 2011.
• Employee engagement scores increased from 52% in 2009 to 71% in 2010.
Execution Premium
• Formalize the initiative management process that is aligned with the BSC.
• Directly measure the value created from partnership programs, further increasing strategic alignment with CTC partners.
Future Focus

18 S t r a t e g y E x e c u t i o n C h a m p i o n s
City of Bucheon, South Korea
In 1999 the City of Bucheon implemented a performance management system generally
known as MBO (Management by Objectives). But over the course of several years, the city’s leadership and management teams began to question the value of the effort. Criticism centered on the emphasis placed on performance rather than on the activities that produced the outcomes. They thought it placed too much emphasis on only the successful initiatives that produced outcomes rather than on the system of activities that constitute the day-to-day work of the various city departments. MBO resulted in a mind-set that the organization would be successful as long as individuals worked hard on their own jobs even though there was limited understanding of the organization’s vision and objectives. It was focusing on the short term. Bucheon saw members competitively develop new policies, creating an inconsistent direction for city policy. In 2004 they began a search for a better way to manage the city.
City on a Mission
Bucheon is a satellite city of Seoul, with a population of nearly 900,000. Bucheon had many companies that matured during Korea’s industrial development period in the 1970s and ’80s. Entering the new millennium in 2000, however, it became difficult to attract and retain companies due to national development policy and a rise in real estate prices. Companies were moving to areas with lower costs.
A population loss occurred even before the loss of companies, flashing a red light for the city in securing future revenue. Bucheon needed a new strategy that fit the times. City officials became aware of the Balanced Scorecard (BSC) and began to learn more about it and whether it would be suitable for use in Bucheon. A Policy Evaluation Research Group was formed to assist
in the evaluation phase. Part of the evaluation activity involved making visits to other cities using the BSC. Charlotte, North Carolina, had recently been inducted into the BSC Hall of Fame so, to learn more, a site visit was arranged. Since then many other site visits have occurred and, in recent years, Bucheon has become the destination for other cities that want to learn how to become more citizen-focused.
A pilot project was launched to provide the first test of suitability. In 2005, Bucheon became the first city in South Korea to adopt the BSC by building its citizen-centered strategy system.
Bucheon established the vision to be “Number One Citizen Satisfaction in the Nation, Cultural City Bucheon.” As the strategy and scorecards were cascaded throughout the workforce, the 2,100 employees began to set goals that aligned to the vision, and a new incentive system was introduced to ensure alignment with the strategy.
Building a BSC-Based City
Citizens everywhere are curious about city operations being carried out in their neighborhoods and the progress being made. The citizens of Bucheon are no different. When building the computerized BSC system in 2007 to manage the Bucheon strategy, the reporting system was linked to the Bucheon City website allowing all residents to view the activities that were underway. The computerized system made it easy for citizens to learn about the vision and core strategy of Bucheon and the performance indicators for each department. As a result, citizens began to develop a better understanding of the city government and actively participate in it.
Phase Two: A Strategy Refresh
During the first five years of implementation many performance improvements were achieved and, importantly, the city became increasingly comfortable relying on this management approach. In 2010, there was a change at the top of the organization; a new mayor was elected. The new mayor had confidence in the scorecard system and was eager to demonstrate his commitment. He chose to grow the core performance management team from three to four people to staff key strategy processes, especially in the areas of vision definition and goal clarification. This change occurred in 2011.
19P a l l a d i u m B a l a n c e d S c o r e c a r d H a l l o f F a m e R e p o r t 2 0 1 4
During this period there was a shift within the strategy placing greater emphasis on the role of citizens in establishing the vision for the city and actively managing performance. Performance indicators provide a very tangible linkage between the citizenry and the city government; indicators provide the means of communication by which citizen interests are identified and city resources used to achieve higher levels of citizen satisfaction.
Bucheon is becoming a performance-oriented organization from the outside (citizens’ view) in. For example, the enterprise support department has the strategy indicator “number of attractive factories” and the environment policy department has a strategy indicator for the “number of crackdowns on wastewater discharge industries.” These conflict indicators are coordinated from within the citizens’ perspective of the strategy. It simply won’t do to achieve performance improvements in one category that conflict with other, interdependent objectives.
Citizen-Centered Strategy: Citizens Are the Mayor!
In July 2010 with the launch of the new mayor’s five-year term, Bucheon took an ambitious stance and declared that “citizens are the mayor.” This powerful declaration was made in response to the city government’s core value that it can no longer satisfy citizens with administration-centered policies. Instead, true progress could only come about by building a “citizen-driven strategy.”
The new strategic emphasis on input from citizens is ambitious and challenging at times. While expectations of quality of life were rising, neither the workers’ response nor civil service patterns of behavior had changed for years. For example, citizens wanted a clean and pleasant residential area, but there were problems such as trash pileups in alleys, neglect of broken outdoor fitness equipment in nearby parks, and the city government failing to meet the demands of residents.
The process was improved by allowing citizens to express their complaints via the Bucheon City Twitter account as a real-time form of input. Citizens can now “tweet” the ID number—and picture—of broken fitness equipment. City workers will quickly arrive on-site to check and remedy the situation. They will later reply to the tweet with a picture of the repaired equipment. Ninety-two percent of Twitter complaints are being
remedied on the same day. Due to the quick response and ability to confirm the results via photos, the Civil Service Satisfaction Rate has significantly improved.
Since 2012, in order to “operate a citizen-centered BSC,” Bucheon citizens directly participate in core strategy establishment, performance indicator development, performance evaluation, result feedback, and other processes, thus firmly establishing a system that actively includes citizen input.
The Journey Continues
Since 2010, Bucheon has secured an unparalleled position among local governments with its rising citizen satisfaction rate and other social indicators. Bucheon is emerging as the cultural icon of the nation and was chosen as the country’s “Number One City to Live In” in a national competition. In 2012, Bucheon had the honor of winning the 8th Korea BSC Strategy Execution Grand Prize.
The vision, mission, and core values of Bucheon under the leadership of the mayor take into consideration the city’s ideology, surroundings and environment, and citizens’ preferences and are reflected in the 2012-2022 Development Plan.
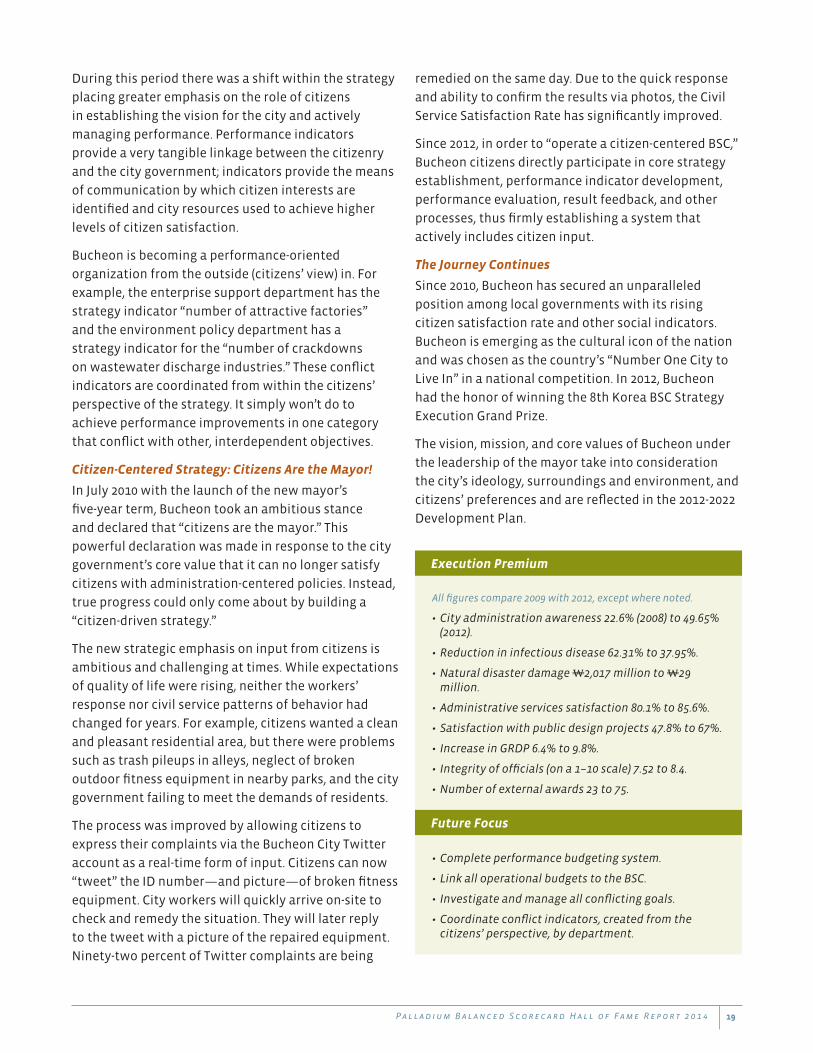
All figures compare 2009 with 2012, except where noted.
• City administration awareness 22.6% (2008) to 49.65% (2012).
• Reduction in infectious disease 62.31% to 37.95%.
• Natural disaster damage ӗ2,017 million to ӗ29 million.
• Administrative services satisfaction 80.1% to 85.6%.
• Satisfaction with public design projects 47.8% to 67%.
• Increase in GRDP 6.4% to 9.8%.
• Integrity of officials (on a 1–10 scale) 7.52 to 8.4.
• Number of external awards 23 to 75.
Execution Premium
• Complete performance budgeting system.
• Link all operational budgets to the BSC.
• Investigate and manage all conflicting goals.
• Coordinate conflict indicators, created from the citizens’ perspective, by department.
Future Focus
20 S t r a t e g y E x e c u t i o n C h a m p i o n s
Emirates ID AuthorityWith 934 employees distributed among 60
registration centers across the seven Emirates of the United Arab Emirates (UAE), Emirates ID Authority (EIDA) is a federal entity that is mandated to develop, record, and maintain a sophisticated, state-of-the-art population register and identity management system for the entire population of the country, including both nationals and ex-pat residents. A series of well-executed strategic plans is enabling EIDA to successfully deliver its mandate.
Enrolling a Nation
Established in 2005 to create a national population register that stores biometric and biographic information for all residents and citizens in the UAE, EIDA completed a preliminary strategy development exercise in early 2007, which culminated in the identification of clear goals designed to address the organization’s initial infrastructure, technology, and organizational requirements. While this strategy had been effective in the start-up phase, by 2009 the senior team realized that achieving the Authority’s mandate required a more dynamic strategy that would also accommodate an operational model that would continue to evolve.
A comprehensive review of the strategic objectives and priorities of the Authority was also necessary in light of the dramatic increase in the UAE population (from about 4 million in 2005 to almost 8 million in 2009) and the instructions given by the country’s leadership to identify and register every resident and citizen. Failure to reach the number of registrants targeted by the pre-2009 plan (only 20% of the UAE population had been enrolled since 2005), limited capacity of centers to accommodate large numbers of registrants, and inadequate mechanisms for linking with external entities (thereby preventing automatic data updates) were among the key challenges that had to be addressed by the new plan.
Moreover, although it delivered significant successes in line with expectations, EIDA’s previous plan did not effectively establish the linkages between strategy and
the operational system. This resulted in some lack of clarity within the organization as to how day-to-day activities contributed to the strategic objectives of the organization. A more robust process for prioritizing initiatives was also needed. This resulted in delays in initiative implementation and, in some cases, cancellation of initiatives. Finally, the previous plan did not clearly articulate specific execution and reporting mechanisms needed to ensure efficient strategy implementation. This led to a lack of regular information sharing and in turn the inability for management to make proactive decisions.
Together . . . Towards Achieving the Objectives
Grasping the importance and complexity of the challenge, EIDA’s leadership team prepared itself for the task ahead: Emirates ID Authority was one of the first UAE federal entities to implement a customized strategy development and execution process based on the Balanced Scorecard that also aligned to the management framework developed by the UAE Prime Minister’s Office (PMO) for managing federal entities. The incorporation of strategy management best practices into EIDA’s strategy management efforts not only ensured compliance with government guidelines, but also enabled EIDA to adopt a framework that enables improved decision making with both qualitative and quantitative analysis, ensuring linkage and integration of the high-level mandate, strategy, and operational activities.
“Together . . . Towards Achieving the Objectives” was the slogan adopted as the memorable and straightforward title of EIDA’s expected performance for the 2010–2013 timeframe, the primary goals of which were to enroll the whole population of the United Arab Emirates and significantly improve the quality of the services provided at registration centers. These were not insignificant challenges given the dramatic growth in the UAE population over this period.
This cycle of activity began with a systematic and formal strategy development process. This included the preparation of many analytical and review studies to provide an in-depth understanding of EIDA’s challenges and potential for further development. Based on the strengths, weaknesses, opportunities, and threats—and key inputs identified through these analyses and studies—EIDA devised high-level strategic objectives

21P a l l a d i u m B a l a n c e d S c o r e c a r d H a l l o f F a m e R e p o r t 2 0 1 4
that would contribute to four strategic intents. For example, an objective to “Enroll and maintain an accurate, comprehensive and up-to-date population register” supported the strategic intent of “Contribute to national and individual security as the primary identity provider in the UAE.”
As a fundamental part of EIDA’s methodology for strategy execution, these high-level strategic objectives were translated into a strategy map supported by a Balanced Scorecard. The scorecard framework had been used as a management approach to monitor and measure performance across all departments and as a powerful tool for internal and external communication.
The Office of Strategic Support
The 2010–2013 strategy was formalized and approved in February 2010. EIDA’s next challenge was the timely rollout and effective execution of the plan. To facilitate this process, the Strategy Support Office (SSO) was formed, headed by the director general of EIDA. Over 24 months, the SSO collaborated on various aspects of strategy execution, change management, and stakeholder management. This work required involvement in internal initiatives ranging from supporting the development of departmental operating plans to enhancement and monitoring of enrollment and card delivery processes. The SSO played a critical role in the execution, oversight, and close monitoring of numerous initiatives aimed at executing EIDA’s strategy. The setup of the SSO’s working model as a task force, supporting stakeholders from across departments, was a key functional aspect that led to the success of the 2010–2013 strategy. Such a model enabled key initiatives to benefit from a combination of the analytical and problem-solving skills of the SSO team and the technical know-how of vendor and department project teams.
Strategy Delivered
The 2010–2013 strategy of EIDA yielded successful outcomes, thanks to well-planned and disciplined execution. The entire population of the UAE is now enrolled in the population register and the satisfaction of customers reached record levels. Key factors that contributed to EIDA’s overall success were leadership commitment, clear visualization of expected outcomes,
simplified decision models based on facts rather than feelings, constant and periodical reviews, and, where required, adjustment of plans to accommodate the changing internal and external environments.
The Next Step of the Journey
Developed during 2013, EIDA’s new 2014–2016 strategic plan focuses on another set of very ambitious targets including shifting the strategic focus to the integration of the personal authentication platform across both public and private sectors, the enablement of government decisions with innovative population demographics, the reliability of the personal data stored at the population register, and the efficiency, effectiveness, and efficacy of the EIDA enterprise.
• Increased enrollment of the UAE population by more than 400% in less than three years (from 17% in 2009 to 98% in 2013).
• Achieved the #1 position in the world for biometric civil registry with 103 million fingerprints in record time (less than three years).
• Increased customer satisfaction (from 64% in 2010 to 91% in 2013).
• Reduced average waiting time per customer in registration centers by 83.3% (from 60 minutes in 2009 to less than 10 minutes in 2013).
• First federal entity to achieve 100% of workforce nationalization.
• Decreased the employee turnover rate by 42% (from 12% in 2009 to 5% in 2013).
• Increased employee satisfaction (from 57% in 2009 to 88% in 2013).
Execution Premium
• Automated personal scorecards to all employees.
• A state-of-the-art, cloud-based business intelligence platform to speed up management decisions across all organizational levels.
• Individual performance recognition framework.
• A strategic risk management framework.
• A stakeholders’ engagement model focused on the identification, monitoring, and management of the activities performed by the external partners that have a direct impact on EIDA’s strategic objectives, targets, and initiatives.
Future Focus

22 S t r a t e g y E x e c u t i o n C h a m p i o n s
Korea South-East Power Company
Faced with serious economic
challenges and a first-ever deficit, the government-owned Korea South-East Power Co. (KOSEP) turned to the Balanced Scorecard to lead them into the future. Through the leadership of the CEO, KOSEP turned the fortunes of the company around and built a prosperous future with an engaged and motivated workforce.
Korea South-East Power Co.
Owned by the government of Korea, KOSEP was established in 2001 as part of the restructuring of the Korean electric power industry. With five power plants in Korea, the company produces 10% of the country’s power needs, employs 1,947 people, and manages nearly US$7 billion in assets. It generated US$4.4 billion in sales in 2012.
Addressing the Challenges of the Global Market
With the rise of exchange rates due to the global financial crisis and a jump in the price of bituminous coal, a large deficit was projected for 2008, the first time in the company’s history. In addition, a change in government policy led to significant concern among the staff that they would be privatized. This concern generated feelings of job insecurity. As a government-owned enterprise, KOSEP’s personnel, budget, and organization are controlled by external decision makers, which limits the company’s flexibility to make major changes. In addition, the government’s control of electricity prices and its resistance to entering new businesses that may compete with the private sector made the challenges facing the company even more difficult to address.
In addition, the company policy had been to extend employment contracts to the CEO and Executive Director for two-year cycles. This led to frequent leadership changes and resulted in a lack of consistency and clarity in the vision, values, mission, strategy, and strategic objectives. This further exacerbated employee confusion and morale.
Faced with this situation and demands from the government shareholder to address poor business performance, the new President and CEO, Do-Soo Jang, instigated widespread system remodeling and adopted the Balanced Scorecard to manage the organization’s strategy.
Leading from the Front Is Key to Success
With his executive team, Mr. Jang established a range of support systems for the business as it moved to execute its strategy, including increasing the allocation of resources. The CEO and executive team took steps to make the execution process more transparent to the employees. This drive to increase transparency included educating employees on SMART (specific, measurable, attainable, relevant, and time-bound) principles and applying the methodology to strategic measures; this common language was used to help them understand the execution results.
To achieve the 2012 business objectives, the CEO established key strategic initiatives and measures that were used to strengthen competitiveness. By driving improvement measures across the organization, including workforce, finance, organization, operations, and governance, and creating integrated competitiveness of each partially optimized sector, the CEO actively led the change agenda.
Building the Organizational Capacity to Execute
The CEO has been instrumental in leading and promoting a set of structured activities that have helped the organization internalize a new set of core values. These new values have increased the organization’s capacity for change. For example, by making changes in the senior team and aligning the leadership development program to their needs for strategy execution, KOSEP has been able to build the organizational capacity to excel at executing the strategy. Importantly, the effort to align the organization to the strategy did not end with the
“KOSEP, through strategy execution using the BSC, has performed amazingly. By applying the BSC the company is focusing its efforts on the early achievement of KOSEP’s vision of becoming a Global Power Leader.” —Do-Soo Jang, President and CEO

23P a l l a d i u m B a l a n c e d S c o r e c a r d H a l l o f F a m e R e p o r t 2 0 1 4
senior team. The CEO introduced a 130% Stretch Goal program for strategic measures identified in the BSC and introduced an educational program for employees, “Future CEO Training Course,” to motivate the team members and develop their focus and skills relevant to strategy execution.
Further, KOSEP has redesigned its performance management system to align with the BSC. This is supported by a comprehensive program of cascading the mentoring program throughout the organization with mentoring and coaching taking place between executives and supervisors. Together with the development efforts, this allows KOSEP to actively manage performance and quickly address any issues that arise. This has also been supported by the alignment of the reward and recognition system to the BSC. Additionally, KOSEP instigated a system of stretch targets for employees that aligned to the strategic measures identified in the BSC, driving improvements in morale and promoting consistency in the achievement of these strategic measures.
Engaging in the Strategic Journey
To further engage the employees in strategy execution and celebrate success, KOSEP holds corporate-wide business strategy meetings presided over by the CEO in July and December of each year. At these meetings the company’s performance is analyzed and the strategic objectives from the strategy for the following year are communicated. Through monthly corporate-wide management meetings, KOSEP actively manages both the lead and lag indicators identified in the BSC. Additional unit management meetings are held on a monthly basis to analyze the performance of the business divisions and support units and to share successes and examples from other business units. These meetings are also used to analyze the causes of any weaknesses, to draw out plans to improve performance, and to make decisions about resource allocation to address these issues. According to Mr. Jang, “The BSC System was adopted in order to communicate with members about strategy design and strategy execution. With this foundation, by clearly assigning the company and team objectives, and by holding monthly business performance review meetings, the CEO and each department’s director have been able to directly review strategy execution.”
The results that KOSEP has achieved through implementing the BSC have been outstanding. Mr. Jang stated, “Through this approach, in the short-term, KOSEP was able to turn its deficit into profit in one year and, in the long-term, established itself as the government’s best de facto thermal power company. For four consecutive years after introducing the BSC, the company has achieved its best results in these measures: short-term profit, OPM (resource utilization and management), facility utilization rate, labor productivity, and the lowest generation costs and lowest bituminous coal price. In addition, KOSEP received a grade ‘A’ rating for both the institution and its director for two consecutive years in 2011 and 2012 in the government’s business performance evaluation.”
Mr. Jang went on to say, “KOSEP, through strategy execution using the BSC, has performed amazingly. By applying the BSC the company is focusing its efforts on the early achievement of KOSEP’s vision of becoming a Global Power Leader.”
All numbers are for the period 2008–2012.
• Sales have increased by more than 54%.
• Net profits have risen from a loss of ӗ1,395,000 in 2008 to a profit of ӗ1,791,000 in 2012.
• Staff satisfaction increased 39% from 5.8 to 8.0.
• The talent development program has expanded from 30 employees to include 103 people and has increased the number of development hours for each employee by 152%.
• Facility utilization improved by 28%.
• Customer satisfaction has increased by 34% from 72 to 96.4.
• Investment in the development of KOSEP’s people has nearly doubled.
Execution Premium
• Complete the integration between the u-BSC (performance management system) and e-HR (HR System) within KOSEP.
• Extend all aspects of the BSC system to KOSEP’s international operations and interests.
• Strengthen the link between the ERP system to the BSC.
• Incorporate risk into the BSC sophistication plan preparation.
Future Focus
24 S t r a t e g y E x e c u t i o n C h a m p i o n s
Powder River Energy Corporation
The Powder River Energy Corporation (PRECorp) is a
member-owned electric cooperative providing service to over 12,000 customers in Northeast Wyoming. Faced with an unprecedented influx of new business, PRECorp struggled to meet heightened demands. The cooperative used the Balanced Scorecard as the framework for aligning its members, business units, and employees to a single strategy for success. PRECorp was incorporated in 1945 as the Tri-County Electric Association (TCEA), initially providing electric power to residential and agricultural customers. In the 1960s and ’70s, the region experienced major growth in energy development, primarily from large open-pit coal mining. TCEA was able to successfully shift its major business from residential to industrial customers. In 1996, TCEA merged with Sheridan-Johnson Rural Electrification Association (REA) to form PRECorp.
Energy Market Booms Create Instability
In 2007, the region experienced a tremendous boom in energy development. This brought new business that drove demand for quick access to large amounts of electrical power in remote, underdeveloped regions. In the past, PRECorp was successful at managing multiple waves of increased service requests. This time, the cooperative’s typical pace of operations was challenged to scale rapidly enough to meet the largest increase in demand it had ever experienced. Connections to the grid lagged behind schedule, and internal processes were both insufficient to meet high volume demands and inconsistent across the three different office locations. Employees were not adequately trained and lacked the direction from managers needed to smoothly and successfully deliver energy to new members on time.
PRECorp’s leadership realized it needed to do business differently in order to keep up with the changing
market. The boom in demand brought attention to PRECorp’s lack of nimble, scalable, and flexible operations to weather unpredictable market cycles, as well as the importance of consistent internal processes across the entire cooperative. In order to get its business back on track, PRECorp needed to align its members, business units, and employees—150 individuals in three offices covering 16,000 square miles—with a single strategy. Although CEO Mike Easley had a variety of tools available to achieve needed alignment, the holistic way in which the Palladium Execution Premium Process™ enables alignment of an organization was a “major epiphany.”
Aligning Membership
To become better aligned with membership needs, PRECorp developed open two-way communication regarding its strategy. The cooperative published a monthly newsletter that outlined various issues facing PRECorp and featured a column by the CEO. Members were invited to contact the CEO directly with questions or concerns regarding PRECorp’s strategy, and many did so. PRECorp created monthly sessions where member groups could voice and discuss issues and concerns. Membership “pain points” were translated into performance measures that PRECorp actively tracked and improved, creating a tight connection between its internal processes and positive membership results. The variety of communication channels and frequency of touchpoints with customers allowed PRECorp to stay in rhythm with membership, helping the cooperative maintain a customer satisfaction score that is 3.6% higher than cooperative peers and 11% higher than investor-owned utilities.
Aligning Offices and Business Units
PRECorp wanted to better align its business units with its strategy, but faced several challenges including a lack of sufficient and consistent baseline data, a vast service area, and disparate processes across its business units and offices. Because of these factors, PRECorp set out to define clear, cooperative-wide measures and processes. This undertaking brought together different departments to review and discuss the best ways to conduct and measure various processes, which were then carefully documented and shared with other groups across the cooperative. The exercise provided a foundation for all offices and business units to have a common understanding

25P a l l a d i u m B a l a n c e d S c o r e c a r d H a l l o f F a m e R e p o r t 2 0 1 4
of processes and a more effective way to manage performance. It also helped identify the set of strategic measures used as part of PRECorp’s Balanced Scorecards. The addition of cooperative-wide strategic targets provided clarity around PRECorp’s performance expectations and further enhanced accountability.
To make this new set of measures and targets visible and useful at various levels of the organization, PRECorp developed interactive dashboards with custom views for the executive team, departments, and individual employees. Departments reported results through these dashboards, helping leadership keep close tabs on performance and allowing them to make better strategic decisions. Dashboards also contained interactive charts and graphs, making strategy more accessible and motivating business units and individuals to have greater impact on the strategy.
Aligning People
During PRECorp’s growth phase, the pool of employees expanded, creating growing pains in many areas. The “old guard” were entrenched in PRECorp’s past successes, while the new employees introduced a changing corporate culture. Meanwhile, transitions away from the cooperative’s legacy processes revealed gaps in employee capabilities that delayed the implementation of much needed internal improvements.
The BSC was able to “provide [our team] a means to better understand the benefits we could realize by becoming more strategically aligned,” CEO Mike Easley explains. The leadership team tied individual employee goals and personal development plans to PRECorp objectives, and employees could track and review their development progress using personal scorecards. In 2013, an average of five personal goals were set per employee. Performance incentives were linked to both cooperative performance and scores on individual performance reviews.
In 2012, PRECorp set out to refresh its strategy and saw this as an opportunity to better engage employees. Over one-third of PRECorp employees participated in a new round of efforts to improve internal alignment. Teams of employees engaged in scenario planning exercises using key environmental and economic factors to analyze and play out potential future scenarios. Other teams examined PRECorp’s core
values from internal, member, and community perspectives. Insights from these teams were presented to the board of directors as input to PRECorp’s strategy refresh, creating a strong sense of team ownership of PRECorp’s strategy. These efforts have led to measureable improvements in employee motivation and strategic understanding. According to CEO Mike Easley, “when asking an operations journeyman lineman ‘what are you working on today,’ they respond ‘P10, achieving excelling in our core business’ and then go on to describe what the core business is defined as within the organization.”
Weathering the Boom-Bust Cycles with Strategic Alignment
In 2010, shortly after PRECorp had developed and begun using its strategy map and scorecard, the energy development sector began to experience new major market shifts, such as decreasing production of methane gas and demand for coal, resulting in a decline in demand for PRECorp’s services. Challenges lie ahead as declining industrial and commercial demand requires covering infrastructure maintenance costs with a shrinking revenue base. However, PRECorp feels better prepared to tackle this challenge—and others—given the enhanced alignment achieved within the business, with stakeholders, and among employees.
All results are from 2008 to 2013.
• Work order closeout process time decreased 93%: from 3 years to 70 days.
• Outage duration (SAIDI) decreased 57%: from 200 to 86 minutes.
• Construction time frames decreased 69% for residential members and 64% for commercial members.
• Employee personal scorecard participation and completion increased from 77% to 90%.
Execution Premium
• Enhance data collection in order to update the scorecard in real time.
• Integrate the strategy map within dashboard software such that strategic measures underlying the strategy map are more easily accessible.
• Develop a public-facing BSC that members can use to monitor performance.
Future Focus
26 S t r a t e g y E x e c u t i o n C h a m p i o n s
Roads & Transport Authority, Dubai
The Roads & Transport Authority (RTA) is responsible for the management of transport, roads, and traffic in the emirate of Dubai, between Dubai and other emirates of the UAE, and with neighboring countries. Established in 2005, RTA grew from fewer than 3,000 employees to more to 6,000 employees by 2012. A Balanced Scorecard (BSC) implementation has enabled RTA to create a line of sight on performance from the Dubai government level to the individual employee.
Significant Challenges
The RTA was established to consolidate all of the responsibilities for transportation in Dubai. As such, the organization inherited a fragmented system that included many significant challenges. Demand for public transportation was very low compared with that in other developed countries; the average number of annual traffic fatalities was far greater than that in comparison countries such as the UK and Sweden; and traffic congestion was costing the emirate about AED 4.8 billion (US$1.3 billion) in annual losses. Moreover, rapid economic, construction, and population growth was intensifying the problems.
Beginning the Strategy Journey
Within the first few weeks of RTA’s existence the executive leadership team crafted a vision to provide “Safe and smooth transport for all,” and also agreed on a mission statement, a set of values, as well as on high-level goals and strategic objectives. Benchmarking of best practices from Singapore, the USA, Canada, and Australia was used to inform the creation of these strategic objectives. Workshops with business unit leaders were used to debate and confirm the articulation of these strategic choices.
Due to the dramatic economic and societal changes in Dubai, the RTA’s strategic choices had to be flexible and dynamic. In 2007 the leadership team defined a methodology around the “issuance, sustainability, follow up, and continuous development of the strategic plan.” It also devised similar methodologies for other
complementary areas such as change management and the management of operational processes.
Introducing the BSC
Although already guided by a clear set of strategic goals, RTA developed its first formal strategic plan in 2007, which was updated as a result of the global financial crisis into a 2009–2013 plan. RTA created its first enterprise strategy map and scorecard for the 2009–2013 plan. Based on rigorous external and internal scanning, and ongoing attention to the defined goals of Dubai, RTA’s senior team identified eight high-level strategic goals, organized into three categories: community needs (to create an integrated Dubai), transport (to anticipate the shift from automobiles to public transport), and internal efficiency (to achieve financial sustainability within three years). The high-level goals were then translated into objectives in the strategy map. In the internal perspective of the strategy map the objectives were organized to form three strategic themes: customer management, operations management, and community and regulations.
Launching an OSM
The development of the 2009 strategic plan was achieved through extensive use of workshops with senior management teams to ensure engagement of all leaders and to establish a robust process for strategy formulation and implementation. These efforts were facilitated by the strategic planning department (SPD), whose 27 employees constitute the RTA’s Office of Strategy Management (OSM).
Initiative Management
Within RTA, the OSM is responsible for overseeing initiative management. Management of the portfolio of strategic initiatives was initiated in 2008 and a robust prioritization process was used to identify a portfolio of initiatives during the senior management workshops that took place that year. The process begins by establishing an understanding of the relative importance of the RTA strategic goals, mapped against the anticipated socioeconomic impact for Dubai. Given that all goals are important in the delivery of RTA’s strategy, the prioritization is translated into a three-phase strategy roadmap. Initiatives that support the highest priority goals receive preference in terms of the implementation timeline. Nevertheless, it is expected that all goals will be achieved at some time during the

27P a l l a d i u m B a l a n c e d S c o r e c a r d H a l l o f F a m e R e p o r t 2 0 1 4
lifespan of the plan. As an example, given the safety challenges and low demand for public transportation that RTA inherited, it is no surprise that “safety and environmental sustainability,” as well as “shifting from automobiles to public transport,” figured prominently in phase one priorities.
Cascading the BSC
RTA’s corporate scorecard has been cascaded to the four agencies of Traffic & Roads Agency, Public Transport Agency, Rail Agency, and Licensing Agency. The strategy also guides the efforts of the Dubai Taxi Corporation as well as the three support areas of Corporate Administrative Support Services, Corporate Technical Support Services, and Strategy and Corporate Governance. Each agency and sector has its own mission and vision statements and BSC, and shares a number of goals, objectives, and initiatives with the enterprise strategy. Furthermore, agencies and sectors are required to implement projects that are linked to the initiatives. All departments under the various agencies prepare operational (execution) plans that show the planned projects for the initiative, which are then approved by SPD. Furthermore, SPD monitors the implementation of these projects through project measurement indicators and with senior executives in monthly and/or quarterly reviews. Today, about 785 projects are underway to support 85 corporate initiatives.
Individual Alignment
To complete the cascade through individual performance plans (IPPs), RTA employee objectives are aligned with the achievements and implementation of the projects in the agency/sector operational plans, which directly support the achievement of the strategy. Furthermore, RTA pays bonuses and other financial rewards based on IPP performance, which is the main criterion for employee promotion. As a result, 262 employees were promoted in 2012.
External Alignment
RTA also ensures that external stakeholders, such as customers, suppliers, and strategic partners, are included in the strategy execution process. To this end, RTA’s most recent strategic plan (2012–2015)
was published, marketed, delivered, and explained to various stakeholder groups through targeted communication channels.
Aligning RTA with the Strategy of Dubai
According to H.E. Mattar Al Tayer, “On a yearly basis I, along with the leadership team, review the strategic plans based on new challenges, priorities, and directions set by His Highness Sheikh Mohammed Bin Rashid Al Maktoum (UAE vice president, prime minister, and the ruler of Dubai). We all have to understand our responsibility and our contribution in achieving the vision. This we cannot achieve without proper alignment and translation, which has enabled us to set accurate plans, and develop, operate, and maintain world-class road networks and transportation systems.” The RTA strategy and scorecard help steer efforts to achieve the vision of the emirate.
All comparisons from 2009 and 2012.
• The number of road and public transport fatalities decreased from 12.7 per 100,000 population to six.
• Demand for public transportation doubled from 6% to 12.3%.
• Resolution of customer complaints jumped from 51.8% to 87%.
• Employee satisfaction rose from 65% to 72.4%.
• Training hours/employee grew from 10 to 25.
• Stations (metro, bus, marine, and parking) with integrated tickets/cards availability reached 98% from a 0% start.
• Electronic service adoption rose from 23% to 88%.
Execution Premium
• Enhance benchmarking studies to improve the use of the BSC framework and methodology.
• Provide iDashboards that are accessible by all departments.
• Further integration of the performance management system with other complementary management capabilities (e.g., gain better leverage with the survey system).
Future Focus

28 S t r a t e g y E x e c u t i o n C h a m p i o n s
7-Eleven AustraliaOne of the largest convenience franchises internationally, 7-Eleven has built its reputation on
providing excellence to its franchisees and its customers. In 2011, 7-Eleven in Australia looked to the Balanced Scorecard to shape its aggressive growth strategy and buck the trend of decline in the Australian retail sector. By focusing on the strategy map, 7-Eleven Australia found a key communication tool to align their entire team and stakeholders and drive breakthrough results in this challenging environment.
7-Eleven Stores Pty. Ltd.
A private company owned by the Withers/Barlow family, 7-Eleven Australia operates and franchises 7-Eleven stores in Australia from the U.S.-based 7-Eleven, Inc. 7-Eleven worldwide is the largest operator of convenience stores, with over 50,000 stores globally. The first Australian store was opened in August 1977 and today 7-Eleven Stores Pty. Ltd. has approximately 416 franchisees, employs 320 staff, and operates approximately 600 stores across Queensland, New South Wales, Victoria, and the Australian Capital Territory. They conduct more than 130 million transactions a year, serving an average of six customers per second, and generating sales of approximately AU$3.4 billion per year.
7-Eleven Australia has now expanded into gasoline sales, which is a business heavily dominated by the two largest supermarkets in Australia with almost 70% market share between them. They have aggressively promoted this channel to drive customer cross-shopping and boost loyalty to their supermarket brands. One mechanism used is to offer gasoline discounting to attract supermarket shoppers to their brand of gas and convenience store to drive fuel volume. As a result, gasoline discounting between these two majors is prevalent in the market.
Driven by the need to grow in this aggressive marketplace, 7-Eleven decided to adopt the Balanced Scorecard to create a framework to shape its future strategy. It also used it to communicate strategy to
team members to help them understand how they could contribute to the future growth of the business. 7-Eleven Australia attributes this approach as a key factor that led to the opportunity identification and eventual purchase of the Mobil retail business within Australia and subsequent rebranding of the stores as 7-Eleven stores. According to Mike Smith, Non-Executive Director of 7-Eleven Australia, “In Australia, 7-Eleven had a history of continuous growth but with each evolution in the market the strategy became more complex and the operating environment more sophisticated. The board was losing sight of the strategic direction of the business and found it difficult to see through very detailed reporting of operational performance.”
Managing the Measures
A significant differentiator for 7-Eleven is the strategy map they created. During the past few years of its implementation, the 7-Eleven strategy map has provided a central focus for management discussions of business updates, franchisee meetings, and supplier conferences. It has become the common language that is used to communicate across these stakeholder groups. Ensuring absolute clarity within the executive team about the difference between terms such as perspectives, objectives, themes, and strategic initiatives has been critical in ensuring alignment and clarity of messages, in simple language, to the broader teams. Importantly, while remaining very consistent over the past few years, the strategy map has been adapted based on feedback and input from customers and stakeholders. An example of this is when the strategy map was first presented to the franchisee conference, the executive team received feedback that franchisees didn’t see themselves in the strategy map. Subsequent iterations of the map included two new objectives: grow franchisee profitability and create delighted franchisees.
As input to this process, proposed new objectives are reviewed to achieve agreement on what meaningful measures could be used to track performance. When required, new measures are created. As a result of scorecard integration across the business, any measures agreed to in one department are then made available across the business to ensure visibility and are available to be cascaded to populate weekly and monthly reporting processes.

29P a l l a d i u m B a l a n c e d S c o r e c a r d H a l l o f F a m e R e p o r t 2 0 1 4
Strategic initiatives are identified and approved during the strategic planning process and are assigned a senior executive sponsor who is responsible for delivering the initiative. The accountable executive has the task each month of sitting down with the project management office and going through the initiative status, assessing progress against milestones, and highlighting support required to deliver the initiative. Further, these initiatives are foundational to the budgeting process so that resources, both financial and human, are allocated based on the importance of the individual strategic initiatives. The success of this approach is seen in the results and the very high achievement ratio against challenging targets.
Each month the enterprise scorecard is distributed to the executive team. In all management meetings and action planning sessions, the lag and lead measures are discussed to ensure that any underperforming strategic measures are on track, with accountability and time frames set. This is now part of the DNA of the monthly management meetings.
In an effort to ensure transparency of strategy execution, management communication within the business is continually emphasizing the objectives and strategic themes set for the organization. Besides the monthly meetings in the business units, 7-Eleven uses its Employee Business Update, an annual event where all employees are brought together from around the country, to highlight the strategy and showcase progress against its delivery. Understanding of the company’s strategy, as shown through the organizational effectiveness polling, improved dramatically in the time since the BSC has been in place.
One of the most obvious benefits the executive team has observed is the dialogue and interaction with the board on strategy development and approval. Prior to the implementation of the BSC, strategy sessions took longer to conduct and agreement on business direction was more difficult to achieve. By using the BSC framework, executive management and the board now have a common language and framework to be able to discuss, challenge, and agree on the strategic direction for the business.
Award-Winning Results
The implementation of the BSC has been instrumental in 7-Eleven being recognized with the following industry awards: • Australian Retailers Association (ARA)–Visa Australian
Retailer of the Year 2011 • Australasian Association of Convenience Stores
(AACS)–Major Retailer Head Office of the Year 2012 • Australasian Association of Convenience Stores
(AACS)–Major Retail Franchised Store of the Year 2012 • Franchise Council of Australia (FCA)–Established
Franchisor of the Year 2012
According to Mike Smith, “Perhaps the best testament to the success of the management team in using the Balanced Scorecard and strategy mapping is the market leadership of the business against formidable competition. Even so, the board recognizes that management has not only understood these processes and used them expertly and enthusiastically, but they turned them into part of the DNA of the business. In the board’s view, this is a very significant achievement since this is a major driver to the success of the business.”
All numbers represent changes in the 2011–2013 timeframe.
• EBIT has increased by 65% and EBITDA:TCE (EBITDA:Tangible Common Equity ratio) increased from 87% to 157.4%.
• Gross profit per store per day has risen by 60%.
• Customer satisfaction has increased across the board with perceived value for money rising more than 10%, like transactions increasing by 25%, and franchisee satisfaction by 8%.
• Total Retail Income from new products or services has risen by 66%.
Execution Premium
• Strengthening the project management capability across the organization to continuously improve delivery of key business projects and strategic initiatives.
• Integration of the newly adopted Palladium ESM® Balanced Scorecard management software into the reporting cycle.
• Expand the current number of operational scorecards (Merchandise/Marketing, Operations, and Fuel) to include HR and Finance.
Future Focus

30 S t r a t e g y E x e c u t i o n C h a m p i o n s
Songpa-GuFour years ago a new mayor was elected in Songpa-gu, South Korea. Upon entering office Mayor Park Chun-Hee conducted a diagnosis of the
administrative organization and the personnel structure before proposing a new strategic direction. The new mission was to “Achieve the happiness+ of Songpa-gu residents.” Happiness+ represents the maximization of happiness by achieving the highest satisfaction of Songpa-gu residents with their quality of life. During the mayor’s four-year term, she has established a strategy map with the focus on the new mission and, to implement the strategy, the administrative system has shifted from being function-oriented to strategy-oriented.
Background
Songpa-gu is located in the southeastern part of Seoul, South Korea. With an area of 34 km², its population is about 680,000 people. Songpa-gu is well-known for hosting the 1988 Seoul Olympics. It was awarded the LivCom Award in 2009 by the United Nations Environment Program (UNEP) as the most liveable city in the world; Songpa-gu is a beautiful place.
Before adopting the Balanced Scorecard (BSC), the culture of city government was conventional and conservative. People working in the city government preferred the status quo and were reluctant to embrace a new approach. However, in the interest of introducing change, the new mayor wanted to raise awareness of the need for a new mission and vision that required a shift in culture in order to be successful. She planned to transform the city government by establishing a performance-oriented culture. To effect this shift, the BSC was introduced as the management tool that would change the culture and be used to implement the new strategy at the same time. The new mayor and several members of the senior leadership team were united in their effort to be successful.
The Implementation Approach
Through the mayor’s active commitment at the beginning of the implementation, combined with direct involvement of other senior officials during the first stages of adopting the BSC, this leadership team
was able to gain traction early in the process. Without such commitment from the top, many organizations struggle to establish credibility and look for early wins to convert those who are reluctant to join in the change agenda.
By building a performance-oriented organizational culture, the leadership team established a clear and specific direction for governmental operations that was aligned with the new mission, vision, and strategic objectives within the Songpa-gu strategy map and scorecards.
The mission of Happiness+ was translated into a vision of leading Seoul by becoming a green growth city, a leading city in child development and education, and a city—internationally recognized—for being safe. To achieve this vision, the strategy (2010–2014) set the direction to create jobs, improve an already pleasant environment, make traffic more convenient, deliver “Smart” education, make welfare effective, provide a healthy community, and lead by providing an innovative city administration.
Initiatives Generate Strategic Value
In 2010, to accomplish the strategic initiative “Creating Jobs,” the mayor created a new Job Support Office to launch the initiative. The Office began its work by consolidating several related but uncoordinated efforts scattered across the organization. By bringing together a set of disparate activities—all having something to do with job creation—the Office was able to gain better leverage from these resources. Focusing and integrating resources has been helpful in supporting the creation of new jobs and in improving self-sustaining social enterprises across the city. The impact of the Job Support Office has been recognized by the Prime Minister with a Job Creation Award along with other expressions of appreciation from across the broader community.
Another initiative has been to increase the local fertility rate. In a society of low birth rates, the birthrate in Songpa-gu had steadily decreased over recent years. To solve this problem, Songpa-gu created the vision of “Child Care Representative of Korea • Education City” and established a long-term strategic objective of creating a “Songpa-gu filled with children’s voices.” Cascading the strategy to the Women and Childcare Department, the Educational Cooperation Department, and the Senior and Youth Department,

31P a l l a d i u m B a l a n c e d S c o r e c a r d H a l l o f F a m e R e p o r t 2 0 1 4
a key performance indicator titled “Songpa-gu’s birthrate” was constructed.
As part of this strategy cascade, the Women and Childcare Department focused its efforts on a key process to improve the perception of giving birth and pushed for stronger institutional support to reduce the burden of raising children. These efforts have been successful and the fertility rate is now moving in the desired direction.
Using Target Setting to Drive Continuous Improvement
Scorecard targets are set for all performance indicators and performance is measured each quarter. Also, performance goals are classified into two major categories (maintenance management and goal achievement) based on the nature of the indicators and type of business the measure and target apply to. Wherever they are used, reasonable target values are being established. In most cases this means that even stretch targets represent no more than a five percent expected increase on a year-over-year basis.
The targets of all Songpa-gu performance indicators are set after a review of performance over the past three years. Benchmark standards achieved by other similar agencies are used for comparisons and are finalized only after a face-to-face verification process has been completed with the performance management committee (a group of external experts).
Improvements Across the Organization
Since the BSC was introduced, improvements have been achieved in several areas including:
• Improved internal communication—Songpa-gu is providing a forum for discussion through communication channels between executives and employees such as briefings, workshops, training, etc., that increase employee understanding and identification with the organization’s vision and strategy.
• Improvements in employee morale—The scorecard is used to motivate the workforce to improve performance. Incentives are used to recognize and reward performance. The highest-achieving departments and individuals share financial rewards and other forms of recognition and non-financial rewards are used as well (e.g., overseas training, river cruises, etc.).
• Improvements in strategic management capabilities—A Performance Management Committee has been established to review and learn from the performance management system, to exchange ideas, and to work together to improve its use.
The Road Forward
There were many challenges during the early stages of implementing the BSC performance management system due to the perception that public services cannot be quantitatively measured. But, after four years, each department is now aligned with the strategic objectives and Songpa-gu has become an organization that successfully executes its core business strategy. In the future, Songpa-gu plans to continue to improve its use of the BSC with a focus on strategic objectives to achieve its mission, “Songpa-gu’s Happiness+.” Today the perception is that the BSC is an effective management tool to prepare for the future.
All comparisons are from 2008 (pre-BSC) and 2012 (post-BSC).
• Financial Measures:– Exports grew from US$1.125 billion to US$1.336 billion.– Tax levy grew from ӗ709,039 million to ӗ752,026 million.
• Citizen Measures:– The annual survey of citizen satisfaction shows these
improvements:- Parks and Landscape—82% to 95%- Residential Environment—76% to 86%- Administrative Services—80% to 89%- Public Library Recommendations—68% to 85%
• Internal Processes:– Integrity Policy Achievement—87% to 92%– Faster Complaint Handling—21% to 30%
• Learning and Growth:– Employee Training Satisfaction—75% to 82%– Employee Welfare Satisfaction—74% to 82%
Execution Premium
• Songpa-gu plans to enhance its strategy execution capabilities through internal competition and maximization of cooperation.
• To achieve the district’s strategic initiative of “World Health Organization International Safe City Status ‘Strengthening’” by orchestrating collaboration between health care, government safety, and welfare policies.
• To increase the accountability of the government and residents’ awareness, residents will participate in performance assessment through the “Residents Evaluation Board.”
Future Focus
32 S t r a t e g y E x e c u t i o n C h a m p i o n s
City of Tamarac, FloridaTamarac, Florida was incorporated in 1963 primarily as a retirement community.
Since then the composition of the citizen population has shifted significantly. It has become more culturally diverse, and includes a much younger population and families with children. As a result its needs have changed dramatically. The response by city government has been to develop the capabilities of a High-Performing Organization (HPO) and, most recently, to become a Strategy-Focused Organization to extend these capabilities further.
The Journey to Strategy Execution
Tamarac covers 12 square miles and is home to over 60,000 residents and 2,000 businesses. In the past 25 years the median age of its residents has decreased steadily from 65 in 1990, to 53 in 2000, to 47 in 2010. This and other shifts in the demographic profile of the community posed significant challenges to the city government to respond to changing needs. In addition, the recession of the past seven years has adversely affected ad valorem tax revenue. Physically, the city is 97% built out, which limits opportunities for new development revenue in the city.
In response to these challenges, beginning in 2004, the city manager and members of the executive leadership team committed to become a high-performing organization (HPO) to enhance their ability to respond to changing citizen needs. The leadership team employed a new set of management approaches including long-term planning, performance measurement, data analysis, and management by data. City leaders understood that by becoming a HPO they would do a better job of listening to customers, empowering employees, developing a clearly designed vision, and focusing on financial sustainability, all in the interest of generating improved results. During the period of 2003–2008 results did, in fact, improve. However, in 2008 an external evaluation of the city’s management approach concluded that it was a data rich yet information poor (DRIP) organization.
While they were achieving some improvements in management outcomes, the data that were generated did not always lead to improved decision making. There were many new measures in place, and yet it was not clear which measures were tied directly to which outcomes of interest. The key takeaway from this analysis was that these data-intensive efforts had to be better organized so the vision and the strategy could be executed more effectively; data used for short- versus long-term decision making had to be better understood so that specific decision making processes could focus on the right information.
The next step in the journey to becoming a HPO embraced the Balanced Scorecard framework to ensure that the strategy was well managed and other decisions that were more tactical or operational would be properly understood in the context of strategy.
Next Step in the Journey: The Four-Step Strategy Planning and Execution Process
What was missing was an integrated framework that allowed leadership and management to distinguish between strategic (longer-term) measures and operational (shorter-term) indicators, both of which were used in decision making. Beginning in 2008 the leadership team adopted the Balanced Scorecard framework and, over the next few years, it adapted this framework to create a four-step strategic planning process deployed throughout the organization that resulted in achievement of strategic action items, performance measures, and division and departmental scorecard measures.
The first step in the process—strategy input—takes place during October–December of each year. Input is gathered from across the organization and incorporated in the planning process. Transactional and biennial surveys are used to generate input from the citizenry as well. The leadership team performs a comprehensive environmental analysis and integrates the results from a workforce-led SWOT (strengths,
“The BSC framework has created a culture of management by data, employee empowerment, and accountability. It is simple, and it works.” —Michael Cernech, City Manager at Tamarac
33P a l l a d i u m B a l a n c e d S c o r e c a r d H a l l o f F a m e R e p o r t 2 0 1 4
weaknesses, opportunities, and threats) analysis to identify changes in the city and its environment that may affect the strategy. Past performance is also evaluated during this step.
Step two—strategy development—begins with a review of the vision, mission, and values of the city. Next, a set of measures and targets are identified and confirmed. Action items—the strategic initiatives needed to achieve the targets and goals—are also identified. The formal strategy is then validated and agreed to. This stage occurs during January–February.
A recent example of target setting shows how this work is performed as an iterative process. While setting strategic targets for the utility department, Tamarac set a very ambitious 10% target for the measure “percent unaccounted water.” However, the state only requires a 5% target. Upon further review it was determined that a 7.5% target would provide a healthy balance of financial and environmental benefit. It is more ambitious than required by state standards but does not put an unnecessary burden on city resources.
During the third step the strategy is used to achieve organizational alignment. Information about the strategy—objectives, measures, targets, and action plans—is cascaded throughout the organization via communication programs that ensure each division, department, and individual worker becomes aligned with the strategy.
Individual strategic measures and targets are assigned to members of the executive team who are evaluated based on the achievement of the designated measures and targets. This makes the strategy personal and ensures accountability. But the strategy is made personal for all members of the workforce as well. For example Tri-Fold cards are used to communicate the strategy to each person in city government. These cards provide a constant reminder of the vision, mission, and values as well as the strategic goals and core competencies that are being called forth. Supervisors work with individual employees to ensure their personal objectives align with the strategy and this information is captured on the Tri-Fold card.
No new projects are funded unless they align clearly with the strategic goals. And all vendor projects are required to align with the vision, mission, and values of Tamarac and with the scorecard. This stage occurs primarily during the months of March–September.
Step four is a continual process of monitoring that occurs throughout the year. It provides input to the annual strategy refresh which takes place at the end of the year. Leadership maintains an “open door” policy to allow employees to openly communicate what they learn from the direct contact they have with customers (citizens) in order to continually improve the services that are provided to the community.
How is it working?
In the words of Michael Cernech, City Manager at Tamarac, “The BSC framework has created a culture of management by data, employee empowerment, and accountability. It is simple, and it works.”
All data represent changes from 2010 to 2013.
• Customer satisfaction has increased from 93% to 98%.
• Bond rating has improved from AA- to AA.
• The percentage of residents who find neighborhood meetings informative or very informative has risen from 78% to 92%.
• The percentage of strategic goals that meet or exceed expectations has risen from 67% to 94%.
• The ratio of satisfied to dissatisfied employees has improved from 9.2/1 to 16.3/1.
Execution Premium
• Implement a new integrated performance management software tool to allow better data collection and reporting to enable the scorecards to be published on the city web page.
• Continue to review, forecast, and benchmark performance targets to foster ongoing organizational process improvements. The city focuses planning efforts on understanding the two-, three-, six-, and ten-year periods ahead and performs detailed financial planning in anticipation of the next two years with an annual update based on actuals.
Future Focus

34 S t r a t e g y E x e c u t i o n C h a m p i o n s
Turkcell SuperonlineSpeed is in the DNA of 10-year-old Turkcell Superonline—
a wholly owned subsidiary of the Turkcell Group—the only Turkish company to be listed on the New York Stock Exchange and the leading communications and technology company in Turkey. A regional player, Turkcell Superonline has market leadership in five of the nine countries in which it operates, with more than 71 million subscribers. Not only does Turkcell Superonline—the fixed side of Turkcell Group—offer one of the world’s fastest Internet services, it also provides an excellent example of how to successfully pursue the fast track to profitability and deliver a swift and flawless rollout of its ambitious fiber infrastructure.
Establishing the Company
Turkcell Superonline’s genesis dates back to 2004 and the birth of Tellcom, a 100% Turkcell Group subsidiary, occurring right after the privatization of Turkey’s fixed telecom industry. Tellcom’s expected contribution was to help Turkcell decrease its transmission costs and thus improve its competitiveness in the mature Turkish mobile market. To do so, Tellcom built a position as an infrastructure operator that helped reduce Turkcell’s dependency on the national incumbent Turk Telekom (which held monopoly status pre-privatization). To this end, Tellcom obtained the relevant long distance telephones, Internet service provider, and infrastructure operating licenses that focused on carrying most of Turkcell’s international traffic—previously transported by the incumbent—and competed mainly in the wholesale business.
A Case for Change: First Wave — Building the Fiber Road (2008–2012)
A vibrant economy together with a sizeable and young market with very high Internet usage potential and low broadband penetration3 were the key factors that pushed the company to build its own fiber network. The CEO and top executives led the first wave—transforming Tellcom from a wholesale telecom
service provider to a telecom operator with its own next-generation fiber infrastructure, which started in 2008. In the ultra-fast broadband market that Tellcom was about to enter, the target segment was no longer just the wholesale business, but also households and corporations. In 2009, Tellcom merged with Superonline, one of Turkey’s leading Internet providers.
Turkcell Superonline initiated the “fiber age” in Turkey, offering Internet service at a speed of 1,000 Mbps: the most advanced Internet access technology in the world, then provided in only seven other countries. The company enjoyed tremendous growth from 2008 to 2012, building from scratch a fiber network of over 30,000 kilometers covering 75 cities, with 1.4 million households connected and 425,000 fiber internet subscribers.
Implementing the BSC
The company was aware that seizing first mover advantage would require mastering execution in planning and rolling out the fiber network and chose the BSC to assist in the process. The senior team believed the BSC would provide a valuable strategy management framework for growing the business in line with its 2008 crafted vision, “to become an innovative telecom operator with its own infrastructure,” and to ensure alignment both within the company and with its shareholder, Turkcell Group.
The CEO Murat Erkan and the top executives, receiving great support from Turkcell Group CEO Süreyya Ciliv, defined the Turkcell Superonline vision and led the transformation of the company from a reseller telecom service provider to a telecom operator with its own fiber network. Seven focus areas were identified and strategic measures (Superindicators) defined to assess progress. The top ten strategic initiatives were defined and aligned to the strategy map. Strategy maps were developed for the three market segments: residential, corporate, and wholesale. Cascading also reached the functional and support units.
Creating an OSM
At first the Strategic Planning Department, reporting to the CEO, was empowered to lead the BSC effort with critical involvement of the CFO. This department was renamed the Office of Strategy Management and Strategic Marketing in 2011 and gained more responsibilities to execute, coordinate, and facilitate

35P a l l a d i u m B a l a n c e d S c o r e c a r d H a l l o f F a m e R e p o r t 2 0 1 4
the whole strategy management process. The department started to report to the CMO as well, since the customer was a strategic focus in the next strategy wave instead of infrastructural expansion; thus the department created synergies with the marketing team in order to support fast and accurate decisions.
The executive team holds weekly operational reviews for the day-to-day business issues and meets monthly and quarterly to review strategic performance. In the monthly meetings the accent is put on the Superindicators and the ten strategic initiatives. Every quarter, competitors’ behavior is also monitored and strategic actions and priorities are evaluated according to the environmental changes. Finally, there is an annual strategy review to adjust the strategy execution roadmap. All these follow-up events at Turkcell Superonline are aligned and closely coordinated with Turkcell Group’s strategy review process.
Employee Involvement
In pursuit of strategic alignment it was essential to strengthen the motivation and belief of the employees and also to upgrade their capabilities and skills as needed. There are two main mechanisms in place to achieve these objectives. One is a comprehensive strategy communication plan, which puts an emphasis on creating awareness of the strategic directions and enables continuous sharing of strategic priorities and achievements both at the Turkcell Group and Turkcell Superonline levels. The other is the strong linkage of the strategy to the individual objectives, compensation, talent management, and development plans. It is worth noting how horizontal alignment is reinforced through cross-functional strategic measures in the individuals’ scorecards. For instance, the network department’s objective of increasing homepass (fiber infrastructure coverage) is also included in the scorecard of the regulatory and legal team, since its achievement is influenced by the ability of this team to get the permissions of right-of-ways to deploy the network.
Second Wave: from “Good to Great” in Customer and Operational Excellence (2013–2018)
In 2012 the CEO announced a second wave aimed at becoming “the indispensable technology partner by easing the life of our customers with innovative
solutions in the digital world.” The new vision involved switching from the infrastructure orientation to a customer-oriented approach. Emphasis on customer and operational excellence themes shaped the new strategy. Its success is measured in terms of take-up rate (conversion of homepass into subscribers), customer satisfaction and retention, profit, and cash flow. The company set the key milestones to accomplish the return of investment in accordance with customer satisfaction. Turkcell Superonline revised the strategy maps, strategic measures, and strategic initiatives to reflect the second wave directions.
All figures compare 2008 with 2013.
• Total revenue increased fourfold, from 158 to 925 million Turkish Liras in four years.
• EBITDA turned from negative 42 million to positive 238 million Turkish Liras.
• Network coverage jumped from 64,000 homepass users to more than 1.7 million in just four years.
• Market share in terms of fixed Internet subscribers (including ADSL, fiber, and cable Internet) grew from 3% in 2010 to 11.3% in 2013.
• Almost 60% decrease in call center usage from 2010 to 2012, showing the improvement of the operational activities.
• Employee satisfaction rate is 16% above the average value in Turkey.
Execution Premium
• Development of a more systematic initiative management system to better link budgeting, resource allocation, and decision making to the strategy and enhance the follow-up on the initiatives.
• Work on the cultural change required to succeed in the execution of the second wave strategy, focused on Return on Investment (ROI) and Customer Excellence.
• Introduction of the scenario-based strategic planning for a more accurate and agile adaptation of Turkcell Superonline’s strategy in an increasingly competitive landscape.
• Focus on actively managing customer risks in order to keep churn levels under control as competition becomes stronger in the broadband market.
Future Focus


The Palladium Balanced Scorecard Hall of Fame for Executing Strategy® Class of 2013
Product #HoF2014
Abu Dhabi Education Council
Abu Dhabi Sewerage Services Company
Allianz Italy
Arabian Automobiles
Bank Hapoalim
Canadian Tourism Commission
City of Bucheon, South Korea
Emirates ID Authority
Korea South-East Power Company
Powder River Energy Corporation
Roads & Transport Authority, Dubai
7-Eleven Australia
Songpa-Gu
City of Tamarac, Florida
Turkcell Superonline