strategy update and full year 2012 results€¦ · 31 dec 12 usd 31 dec 11 gbp 31 dec 12 gbp 31 dec...
TRANSCRIPT

Strategy update and full year 2012 results
Amsterdam 11 February 2013

Main topics 2012 H1 2012
Downward valuation of €173.8m
Dividend cut to €3.20 - €3.40
Q3 2012
Stabilisation and restructuring
• Sale US Announced 7 January 2013, closing Q1 2013
• Action plan UK shopping centres Announced today, closing Q1 2013
• Cost reduction plan Plan ready and in execution
• Strategy update Today
FY 2012
NRI Improvement US and UK due to measures implemented in H2 2012
Like for like growth Total portfolio 0%, core portfolio 3.1%
Occupancy 89.2% (Q3 2012: 88.5%)
EPS €3.91 (forecast of at least €3.80)
NAV €64.09 (Q3 2012: €63.72)
Dividend €3.30 (forecast €3.20 - €3.40)
Sales proceeds €1.2bn at 2% above book value in last 12 months (including US and UK)
2

Sale US and UK
Pricing
Net exit yield
Acquirer(s)
Closing transaction
Exit
Other
3
Net proceeds: €815m NAV: limited positive impact
LTV: below 20%
UK portfolio: Full exit before year end
£243m at -4% to book value
5.75%
Various
Q1 2013
2013
Two assets remaining (book value £23m)
NB Total net proceeds may differ due to FX movements on unhedged position
US portfolio: Full exit was realised within 6 months
$720m at +5% to book value
2.7%
Lone Star
Q1 2013
2013

Strategy
update
4
Itis - Finland

Trends
5
"Convenience will be king as shopping habits evolve into a multichannel approach rather than one-stop shopping.“ “There’s a tremendous opportunity to grow through new formats, such as Walmart Express. Express has been created to offer convenient access for fill-in and stock-up shopping trips, especially in rural and urban areas.” “Customers increasingly live in smaller households and want shopping to be convenient and to avoid travelling long distances as much as possible."

Our view on the market
6
The market favours operationally and financially strong players with a clear profile
Changing consumer patterns driven by demographics, (socio)economic cycles and technology
Mature real estate markets with multi dimensional competition
Demanding retailers looking for multi channel approach and best value per sqm
Tight financing markets with lower risk appetite, higher return and liquidity requirements

Our response
Focus on core markets: Belgium, Finland, the Netherlands and Paris
Excellence in operations
Solid and sustainable balance sheet
Back to predictable returns
7
Wereldhave aims to be an excellent operator of dominant regional centres in North-Western Europe

Our approach
Phase I: Derisk (2012 – 2013)
Exit non-core markets
Healthy balance sheet
Cost reduction
Phase II: Regroup (2013 – 2015)
Operational excellence
Controlled development pipeline
Maximise value Itis
Reinvest in core markets
Alignment with all stakeholders
Phase III: Growth (2015 onwards)
8
Wereldhave will be a focused real estate player with a strong retail angle

Phase II: Regroup (2013 – 2015)
9
1. Operational excellence
2. Controlled development pipeline
3. Maximise value Itis
4. Reinvest in core markets
5. Alignment with all stakeholders
Achieve like-for-like rental growth above indexation
Become low cost operator with value-add skills
Leverage on expertise of core country organisations
Realise projected returns
Build a sequential development pipeline
Complete redevelopment and expansion programme
Realise projected returns
Use available capital for growth in the four core markets
Dispose non-core assets
Create an entrepreneurial, transparent and result oriented culture
Update governance structure
Establish sustainability agenda

Phase II: Targets (2013 – 2015)
1. Operational excellence
2. Controlled development pipeline
3. Maximise value Itis
4. Reinvest in core markets
5. Alignment with all stakeholders
10
Average retail LFL growth of 125bps above indexation
≥98% occupancy
Overhead reduction to ≤€14m
Strengthen talent development
Standardise best practices between core countries
Retail €330m and offices €110m
Expected average yield on cost 6.5%
From 2015 ≤10% investment portfolio
Redevelopment completed mid 2014 within budget (€95m)
Rent level 2015 €33m, yield on cost of 7%
Acquisitions of €400m
Disposals of €150m
Expand and strengthen Supervisory Board
Evaluate anti-takeover structure
Integrate sustainability in overall strategy

Four core
markets
11
Belle-Ile - Belgium

Four core markets, predominantly retail
12
Belgium
Finland
Netherlands
Paris
Retail
Offices
Solid macro economic fundamentals
High GDP per capita
High and stable credit rating
Population growth
In-depth market knowledge
Expertise in each real estate market
Deep understanding of consumers
Embedded relationships with tenants
Leverage on current presence
Increase efficiencies through operational excellence
Gain from cross-border synergies
Pursue internal and external growth opportunities
Gain from Paris exposure and expertise
2nd largest market in Europe
Strong fundamentals
Leverage on track record and team
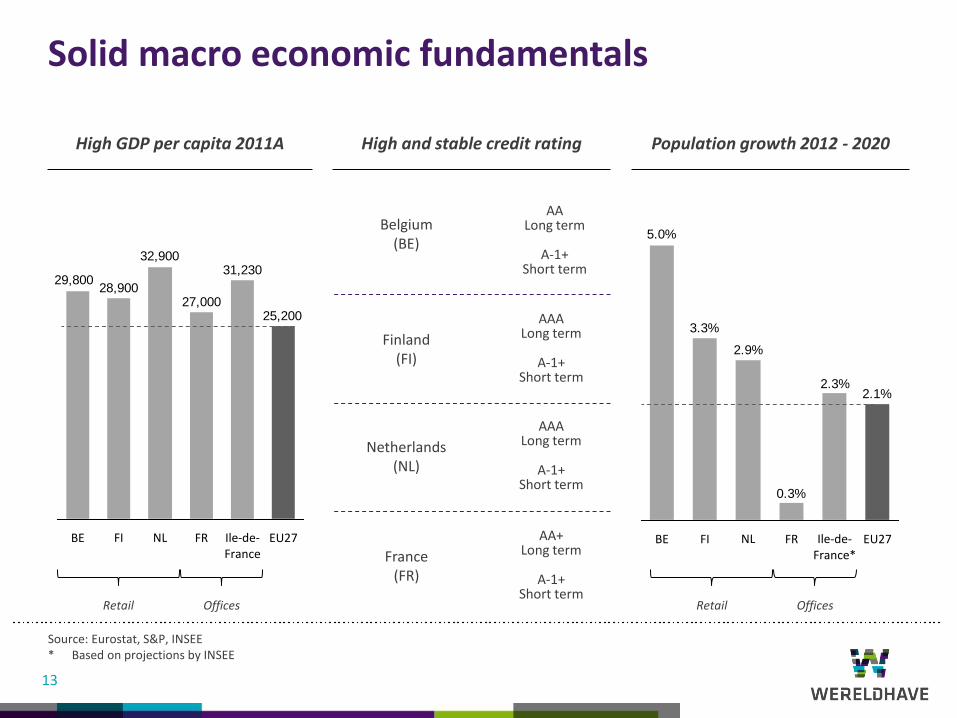
Solid macro economic fundamentals
13
High GDP per capita 2011A Population growth 2012 - 2020 High and stable credit rating
AAA Long term
A-1+
Short term
AA Long term
A-1+
Short term
AAA Long term
A-1+
Short term
Netherlands (NL)
Belgium (BE)
Finland (FI)
AA+ Long term
A-1+
Short term
France (FR)
25,200
31,230
27,000
32,900
29,80028,900
EU27 Ile-de-France
FR NL BE FI
2.1%2.3%
2.9%
3.3%
5.0%
0.3%
EU27 Ile-de-France*
FR FI BE NL
Retail Offices Retail Offices
Source: Eurostat, S&P, INSEE * Based on projections by INSEE

Retail
strategy
14
De Eggert - The Netherlands

Wereldhave offers convenient shopping
15
Our criteria:
90% of shopping needs
Top-of-mind in their catchment areas
Catchment areas of at least 100,000 inhabitants within 10 minutes drive time
Easy accessibility
Strong national and international brands in combination with local heroes
Fully embedded food, beverage and entertainment functions
Our centres are well positioned to cope with current market trends: offering of daily needs, proximity and accessibility

Retail structures in core countries differ
16
Belgium
Predominantly out-of-town retail, next to highways
Scarcity of modern retail parks and shopping centres
Prohibitive planning for out-of-town retail, rising demand for (inner-)city developments
Finland
Diverse retail structure
50% of total retail GLA situated in Helsinki metropolitan area and focus on super regional centres
New developments driven by strong consumer demand
The Netherlands
Dense retail structure
Hardly any shopping centres over 50,000 sqm GLA
Focus on food and daily goods by small and medium sized and regional shopping centres

Acquisition criteria
17
Wereldhave aims to expand in its core retail markets:
Critical mass
Dynamic reletting strategy
Regional dominance
Acquisitions need to fit Wereldhave's criteria for convenient shopping
For each core retail country Wereldhave has identified acquisition targets:
Belgium Top-20 cities
Finland Top-10 cities
Netherlands Top-30 cities

Strategy per country
18
Finland €495m
Belgium €555m
Spain €97m
Paris €291m
25%
Netherlands €543m
28%
28%
15%
4%
Current portfolio
Segmentation based on investment properties in operation and under construction (valuation per 31 Dec 2012)

Belgium
Nivelles - Belgium
19

Continuation of growth in Belgium
20
Wereldhave’s Belgium portfolio originally comprised three shopping centres: Nivelles, Belle-Ile and Tournai
All three centres are dominant in their catchment area and have high occupancy rates
Over the years Ghent, Genk and Waterloo were added to the portfolio and a balanced (re)development pipeline
was established
Nivelles was redeveloped at 8% yield on cost (€20m value uplift), the expertise will be used to upgrade Tournai
In the period 2013 – 2015 Wereldhave will finalise Ghent and redevelop Genk, Tournai I and Nivelles II
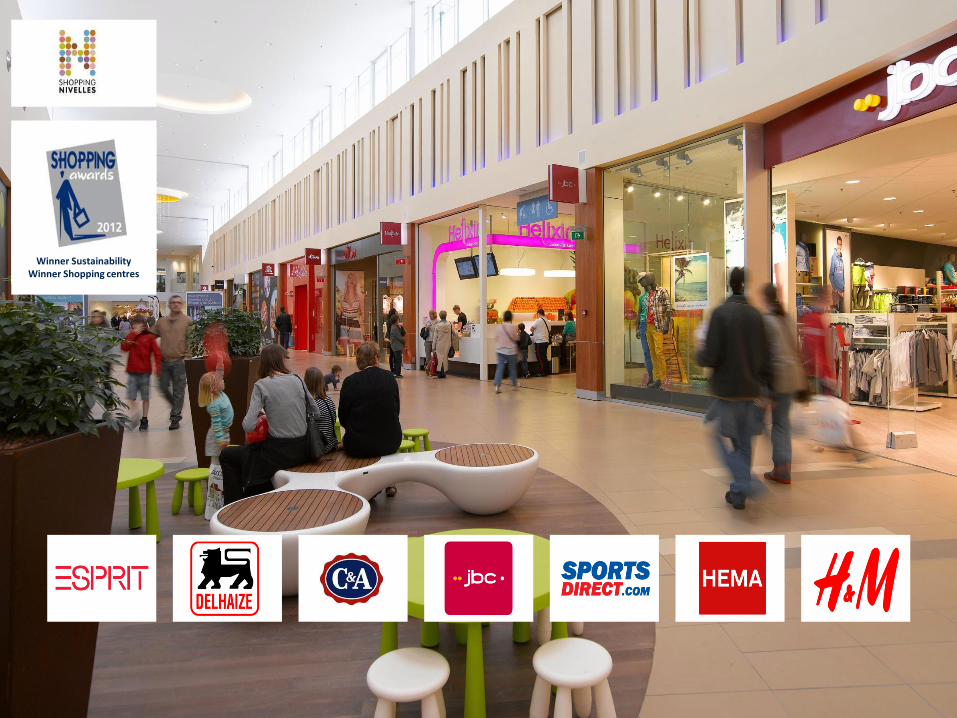
Winner Sustainability Winner Shopping centres

Overview of redevelopment planning
22
Assets
Ghent
Remarks 2014 2015 2013
(Re-)development
Total capex
Net yield
For the period 2013 – 2015: €140m
Expected total rent increase 2013 – 2017: 6.5% - 7.0% yield on cost
Redev. of former student restaurant in retail and student home, total inv. €15m, €4m capex so far, expected net yield of 6.25-6.75%
Refurbishment and extension of Genk Shopping 1, total investments €84m, €34m capex so far, expected net yield of 6.5-7.0%
Genk
Retail Park Tournai, total investments €16m, €3m capex so far, expected net yield of 7.0-7.25%
Tournai I
Nivelles Retail Park, total investments €12m, €2m capex so far, expected net yield of 7.0-7.25%
Nivelles II
Inner City retail scheme, total investments €55m, €25m capex so far, expected net yield of 6.75-7.25%
Waterloo
Refurbishment and extension of Tournai Les Bastions, total investments €65m, €2m capex so far ,expected net yield of 6.5-7.0%
Tournai II
Extension of Belle-Ile, total investments €25m, expected net yield of 6.5-7.0%
Belle-Ile

Belgium artist impressions
23
Genk Shopping 1 Genk Shopping 1
Ghent Forum Overpoort Les Bastions, Tournai

Belgium: Targets 2013 – 2015
24
Portfolio
Footfall
Tenant rotation
Like for like growth
Occupancy
Development pipeline
Investments
Yield on cost
Growing
≥ 5%
≥ 220bps above indexation
≥ 98%
€140m
≥ 6.5% - 7.0%*
* Yield on cost for the period 2013 – 2017

Finland
25
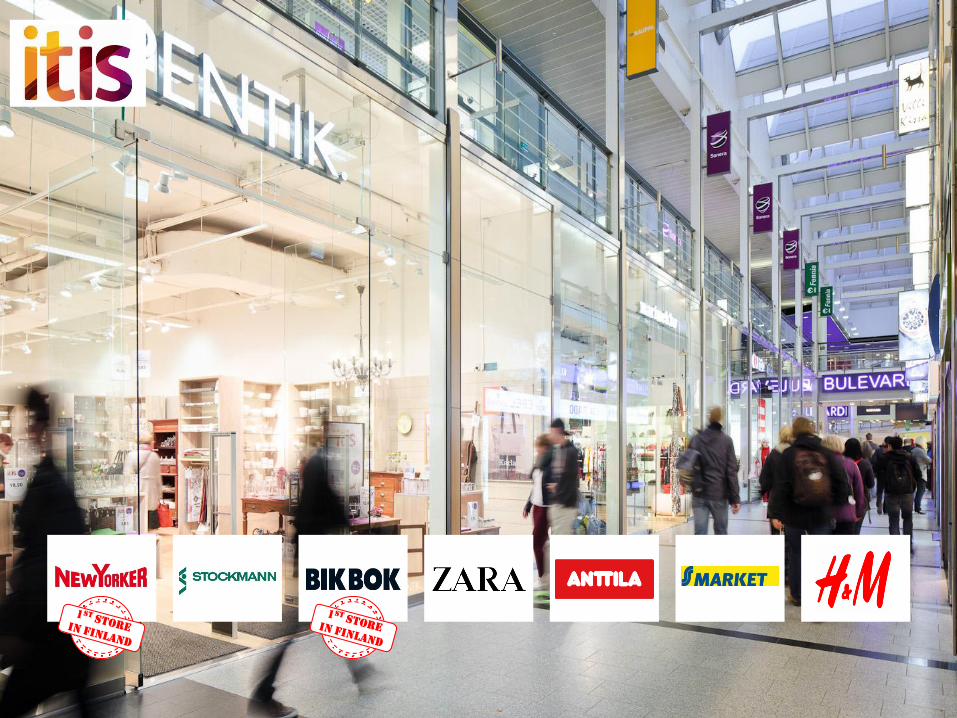
Itis - Finland

Maximise value Itis
26
Acquired in 2002, largest centre in Nordics
Performance has always been solid (acquired for €322m, current value in operation €450m)
Renovations and extensions in order to become the leading shopping centre in Finland
Focus on completion mid 2014 at a yield on cost of 7.0%

28
Pasaassi before refurbishment Pasaassi finalised

Overview of redevelopment planning
29
Projects
Net yield Expected total rent increase: €6.5m** (7.0% yield on cost)
Bulevardi
External
Pasaassi
Total capex For the period 2012 – 2014: €95m*
Old Stockmann
Car parking
3328
222325
+32%
2011A 2015E 2014E 2013E 2012A
Net operating income
(€m)
Diagonal
Piazza
Remarks
Executed in three parts, shops remain open
Emphasis on Tallinna square
Ready in Q1 2013
Targeting strong brands entering Finland
Sequential execution
New Yorker and Bik Bok first store in Finland at Itis
Relocation of Stockmann in November 2013
Refresh- & refurbishment
2014 2013 2011 2012
* 2012 on balance sheet €37m ** Excluding indexation

Overview of redevelopment planning
30
Pasaasi
Diagonal
Bulevard
Stockmann
Level 1
Tenant relocation programme

Finland: Targets 2013 – 2015
31
Portfolio
Footfall
Tenant rotation
Like for like growth
Occupancy
Development pipeline
Investments
Yield on cost
Growing
≥5%
≥ 200bps above indexation
≥ 99%
€95m
≥ 7.0%

The Netherlands
Kronenburg - The Netherlands
32

Transformation of the Dutch centres
33
Wereldhave’s Dutch centres need to be repositioned in the next 2-3 years
Despite difficult economic circumstances, these shopping centres have shown solid performance due to:
Stable footfall
Top-of-mind within their catchment area
High occupancy (97%)
Each centre has been reviewed by analysing catchment area, spending power, competition, tenant mix and
target lay-out
Renovation plans have been generated to improve footfall and turnover
In the next 2 years Wereldhave will speed up execution

Overview of the refresh & development planning
34
Assets
Kronenburg Arnhem
De Koperwiek Capelle a/d IJssel
De Roselaar Roosendaal
Etten-Leur
Winkelhof Leiderdorp
Koningshoek Maassluis
De Eggert Purmerend
Woensel XL Eindhoven
Creating a heart: central square
Lay-out, Interior design & architecture
Services & Facilities
Marketing & promotion
Redevelopment plans for 2015 going forward Timing mostly depending on permit processes
Extension of 15,000 sqm in total in several phases
2,000 sqm for extension of existing anchor tenants and additional 3,000 sqm in combination with creating a central square
Additional 1,000 sqm to facilitate additional anchor tenant(s) and improving tenant mix
Redesign public space, improve tenant mix and extend centre by adding 1,000 sqm
Extension of 7,000 sqm that will significantly improve turnover and attractiveness
Relocate anchor tenants and offer extensions of 7,000 sqm to strengthen market dominants
Refurbishment and partly restructuring of layout and adding 1,500 sqm to attract new anchor tenant(s)
Increase share or divest
Total capex
Net yield
2014 2015 2013
Refresh- & refurbishment
For 2013 – 2015: €60m of which €40m refresh- & refurbishment and €20m new developments
Expected total rent increase: €9.4m, yield on cost of 2013 – 2017: 6.0%
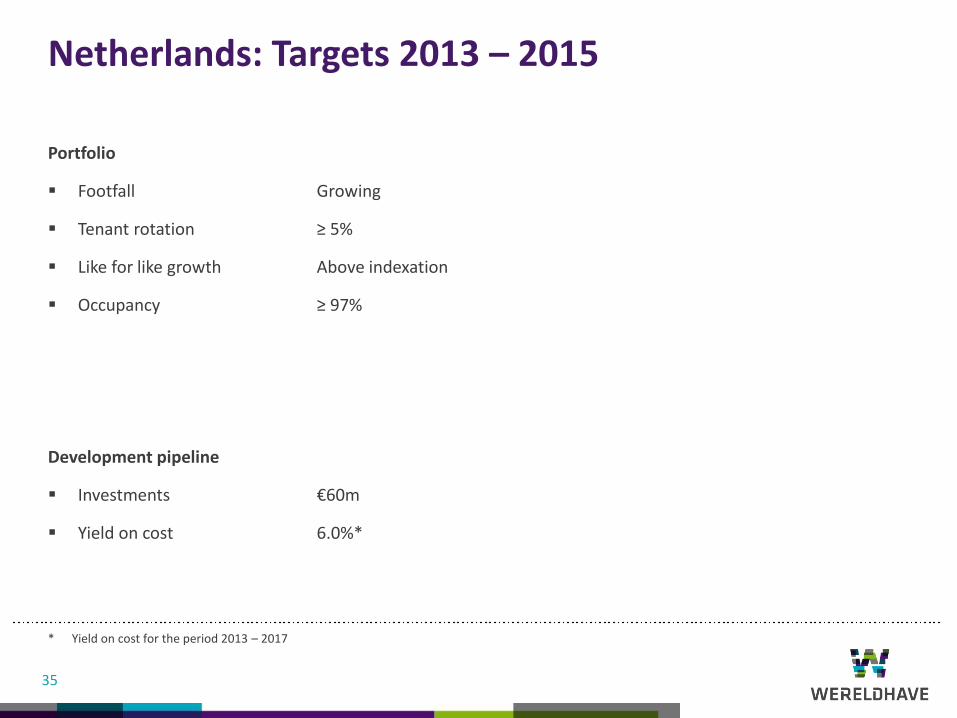
Netherlands: Targets 2013 – 2015
35
Portfolio
Footfall
Tenant rotation
Like for like growth
Occupancy
Development pipeline
Investments
Yield on cost
Growing
≥ 5%
Above indexation
≥ 97%
€60m
6.0%*
* Yield on cost for the period 2013 – 2017
Paris
Joinville - Paris
36

Wereldhave will leverage on its track record in Paris
37
In the past 10 years we have successfully (re)developed offices in Paris
In €m Acquisition Cost price (€m)
Yr disposal Price/valuation (€m)
Profit (€m)
Return
Clichy 2002 64 2006 106 42 66%
Joinville* 2010 71 2013 91 21 29%
Ilot Kleber 1999 78 146 68 88%
Le Cap 2001 23 40 17 73%
Noda** 2011 138
We will continue our activities in the Paris office market in 2013 – 2015:
Greater Paris
Offices only
Limited overhead
Sold
Po
rtfo
lio
* Joinville: as per 31 December 2012 €58.0m capitalised ** Noda: as per 31 December 2012 €58.5m capitalised

Spain
Plaza de la Lealtad - Spain
38

Spain: on hold
39
In €m Book value 2009
Book value 2012
Fernando el Santo and Arroyo de la Vega 66 62
Rivas and Planetocio 84 36
Total 150 98
Wereldhave’s current portfolio consists of:
Plaza de la Lealtad was sold in December 2012 for €15.2m and 5.9% net exit yield (book gain €1m)
Wereldhave Spain in 2013 – 2015:
On hold
Limited exposure (4% of balance sheet)
Limited overhead
Organisation
Itis - Finland
40

Clear management structure and governance
41
Management structure
Management Board with a CEO and CFO
Management Team consisting of Dirk Anbeek, CFO, Hans Vermeeren and Richard Beentjes. Supported by
country directors Luc Plasman, Michel Janet and Jaakko Ristola
Governance
Expand and strengthen Supervisory Board
Introduce nomination and remuneration committee
Align remuneration of key personnel from 2013 onwards
Evaluate anti takeover structure

Culture: towards a result oriented organisation
42
Corporate culture
Create an entrepreneurial, transparent and result oriented culture
Standardise best practices between core retail countries
Increase commercial focus and value-add skills
Strengthen talent development
New Group & Dutch office (WTC Schiphol), stimulating new culture
Organisation
Operational cost reduction from €21m in 2012 to ≤€14m in 2014
Become cost efficient operator
Empower countries, develop staff and drive Capital and HR centrally

Organisation: Management Team
43
Dirk Anbeek
Hans Vermeeren
Richard Beentjes
Luc Plasman
Michel Janet
Jaakko Ristola
CEO Responsible for strategy, investor relations, human resources, acquisitions and disposals 6 years experience in real estate and 13 years in retail
CFO Responsible for finance & control, tax, treasury, ICT
Managing Director Responsible for The Netherlands and group retail operations 16 years experience in real estate
Managing Director Responsible for legal, transaction coordination, communications 27 years experience in real estate
Managing Director Responsible for Belgium and group developments 25 years experience in real estate
Managing Director Responsible for offices Paris and Spain 35 years experience in real estate
Managing Director Responsible for Finland 14 years experience in real estate
Man
agem
ent
Bo
ard

Reduction of overhead expenses
44
Overhead reduction is generated by savings on direct costs (a.o. personnel), indirect costs (external advisory
and temporary hires) and the exit of US & UK
€20.8m
€16.0m €14.0m
€1.9m
€6.7m
€2.0m
2012A Overhead reduction 2013E Overhead reduction 2014E
Restructuring costs
Other
overhead
expenses
€22.7m

Debt profile
45
LTV
Solvency ratio
ICR
Secured
Ambitions
Optimise debt profile in H1 2013
Maintain and further exploit diversified funding base
LTV 30 – 40% on the medium term
31 Dec 2012
44%
54%
4.6x
4.6%
Covenant
≤ 60%
≥ 40%
≥2x
≤ 40%
39%
22%
18%
18%
3%
Revolving credit facilities
USPP
Convertible bond
Convertible bond
Debenture
Total €1.3bn

Our approach
Phase I: Derisk (2012 – 2013)
Exit non-core markets
Healthy balance sheet
Cost reduction
Phase II: Regroup (2013 – 2015)
Operational excellence
Controlled development pipeline
Maximise value Itis
Reinvest in core markets
Alignment with all stakeholders
Phase III: Growth (2015 onwards)
46
Wereldhave: an operationally and financially strong player with a clear profile

47
Full year results
2012
Itis - Finland

Main topics 2012 H1 2012
Downward valuation of €173.8m
Dividend cut to €3.20 - €3.40
Q3 2012
Stabilisation and restructuring
• Sale US Announced 7 January 2013, closing Q1 2013
• Action plan UK shopping centres Announced today, closing Q1 2013
• Cost reduction plan Plan ready and in execution
• Strategy update Today
FY 2012
NRI Improvement US and UK due to measures implemented in H2 2012
Like for like growth Total portfolio 0%, core portfolio 3.1%
Occupancy 89.2% (Q3 2012: 88.5%)
EPS €3.91 (forecast of at least €3.80)
NAV €64.09 (Q3 2012: €63.72)
Dividend €3.30 (forecast €3.20 - €3.40)
Sales proceeds €1.2bn at 2% above book value in last 12 months (including US and UK)
48

Key results 2012
49
FY 2012 FY 2011 % growth % LFL growth
Total NRI core portfolio €89.9m €87.0m 3.3% 3.9%
Total NRI non-core portfolio €17.8m €23.7m (24.9)% (0.3)%
Total NRI UK and US €43.3m €50.8m (14.8)% (9.7)%
Total net rental income €151.0m €161.5m (6.5)% 0.0%
Occupancy 89.2 % 91.4 % (2.4)%
Direct result per share €3.91 €4.93 (20.7)%
NAV per share €64.09 €73.44 (12.7)%
Dividend per share €3.30 €4.70 (29.8)%
LTV 44% 41% 7.3%
Investment properties in operation* €2,616m €2,830m (7.6)%
Revaluation result €(197.0)m €(51.3)m
* Investment properties in operation including investments held for sale Core portfolio consists of retail FI, NL, BE & offices Paris and ES; Non-core portfolio consists of non-core NL, BE, FR and ES

Quarterly results
50
FY 2011 Q1 2012 Q2 2012 Q3 2012 Q4 2012 FY 2012
Total net rental income €161.5m €38.4m €38.3m €38.6m €35.7m €151.0m
Occupancy 91.4 % 91.1% 88.3% 88.5% 89.2% 89.2 %
Direct result per share €4.93 €1.10 €0.97 €0.98 €0.86 €3.91
Indirect result per share €(2.55) €0.01 €(8.01) €(0.45) €0.00 €(8.45)
Total result per share €2.38 €1.11 €(7.04) €0.53 €0.86 €(4.54)
NAV per share €73.44 €73.91 €63.45 €63.72 €64.09 €64.09
LTV 41% 41% 47% 47% 44% 44%
Investment properties in operation* €2,830m €2,765m €2,816m €2,756m €2,616m €2,616m
Revaluation result €(51.3)m €0.8m €(174.6)m €(7.9)m €(15.3)m €(197.0)m
* Investment properties in operation including investments held for sale

Country update
Strong LFL growth in retail and office portfolios
Strong LFL growth
Developments at Passaasi have been finalised and Stockmann area under construction
Economic headwind impacting retail 2013 LFL
Joinville pre sold at >25% profit margin
Additional leasing at Saint Denis resulting in healthy LFL
Conditions remain tough and LFL decline expected to continue in 2013
Plaza de la Lealtad office building sold for €15.2m with a profit of €1m
Sale of Ealing Broadway, office portfolio and Dolphin Poole
Closing of the US sale expected in Q1 2013
51
Belgium
Finland
Netherlands
Paris
Spain
UK
US

Outlook
52
2013 guidance:
Disposals will lead to a decrease in net rental income
Development projects will start to contribute as of 2014
Decrease in general cost of €6.7m will contribute directly
Optimise debt profile in H1 2013
Direct result 2013 will depend on timing of reinvestment in core markets. However quality prevails over timing
Dividend over the year 2013 is expected to be stable at €3.30 per share
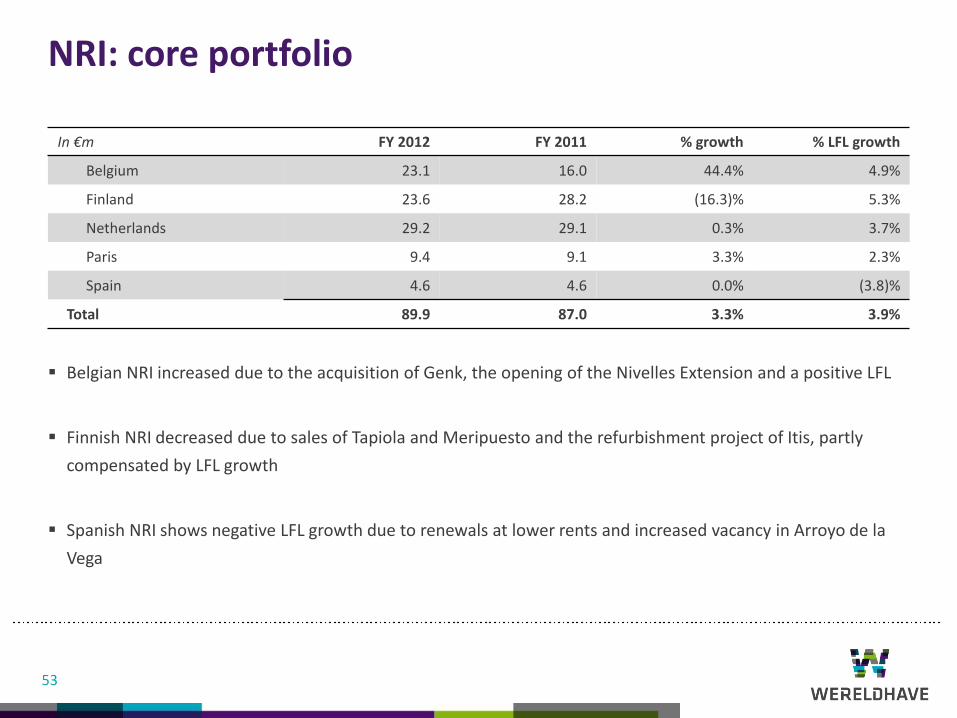
NRI: core portfolio
53
In €m FY 2012 FY 2011 % growth % LFL growth
Belgium 23.1 16.0 44.4% 4.9%
Finland 23.6 28.2 (16.3)% 5.3%
Netherlands 29.2 29.1 0.3% 3.7%
Paris 9.4 9.1 3.3% 2.3%
Spain 4.6 4.6 0.0% (3.8)%
Total 89.9 87.0 3.3% 3.9%
Belgian NRI increased due to the acquisition of Genk, the opening of the Nivelles Extension and a positive LFL
Finnish NRI decreased due to sales of Tapiola and Meripuesto and the refurbishment project of Itis, partly
compensated by LFL growth
Spanish NRI shows negative LFL growth due to renewals at lower rents and increased vacancy in Arroyo de la
Vega

NRI: non-core portfolio
54
In €m FY 2012 FY 2011 % growth % LFL growth
Belgium 8.6 8.6 0.0% 3.8%
Netherlands 5.8 9.0 (35.6)% 0.0%
France 1.1 3.1 (64.5)% n.a.
Spain 2.3 3.0 (23.3)% (12.8)%
Total 17.8 23.7 (24.9)% (0.3)%
UK 23.1 18.0 28.3% (3.9)%
US 20.2 32.8 (38.4)% (11.8)%
Total 43.3 50.8 (14.8)% (9.7)%
The Dutch NRI decreased due to sales and LFL came out at 0.0%
The Spanish NRI decreased due to renewals at lower rents and the refurbishment of Planetocio
The US NRI decreased mainly due to the sale of The Mint and Diamond View Tower and the renewal of the
lease in Broadway Tower
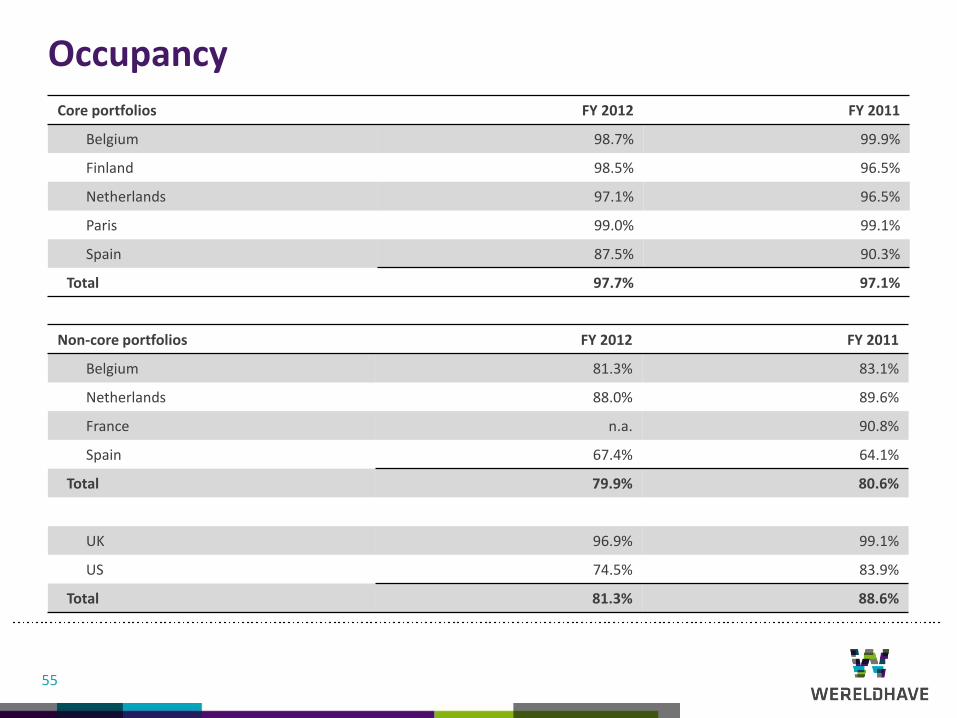
Occupancy
55
Core portfolios FY 2012 FY 2011
Belgium 98.7% 99.9%
Finland 98.5% 96.5%
Netherlands 97.1% 96.5%
Paris 99.0% 99.1%
Spain 87.5% 90.3%
Total 97.7% 97.1%
Non-core portfolios FY 2012 FY 2011
Belgium 81.3% 83.1%
Netherlands 88.0% 89.6%
France n.a. 90.8%
Spain 67.4% 64.1%
Total 79.9% 80.6%
UK 96.9% 99.1%
US 74.5% 83.9%
Total 81.3% 88.6%

Overhead expenses
56
Overhead expenses increased by €6.7m in 2012 due to:
Restructuring cost: €1.9m
Increase in (temporary) staff €3.2m
Advisory fees €1.2m
Other €0.4m
Overhead will decrease to €14m due to reduction in staff, savings on advisory fees and sale of the US and UK
€15.0m €16.0m
€22.7m
€16.0m €14.0m
€6.7m
2010A 2011A Change 2012A 2013E 2014E

Direct result per share
57
Decrease result standing portfolio mainly driven by increase in US vacancy and renewals at lower rents, the
refurbishment of Itis and increased overhead expenses
Acquisitions relate to Ealing Broadway, Genk, Nivelles and Eilan. The contribution of Eilan in 2012 amounts to
-/- €6m (Including interest)
€4.93
€3.91
€0.54 €0.11
€0.73 €0.14
2011A Standingportfolio
Acquisitions Disposals Currency 2012A
( )
( )

NAV per share
58
EPRA NAV
2011: €76.40
2012: €68.26
EPRA NNNAV
2011: €75.25
2012: €66.08
€73.44
€64.09
€4.70 €3.91
€8.45
€0.02 €0.13
2011A Dividend 2011 Direct result Indirect result Currency Other 2012A
( )
( )
( )

Appendix
59
De Eggert - The Netherlands
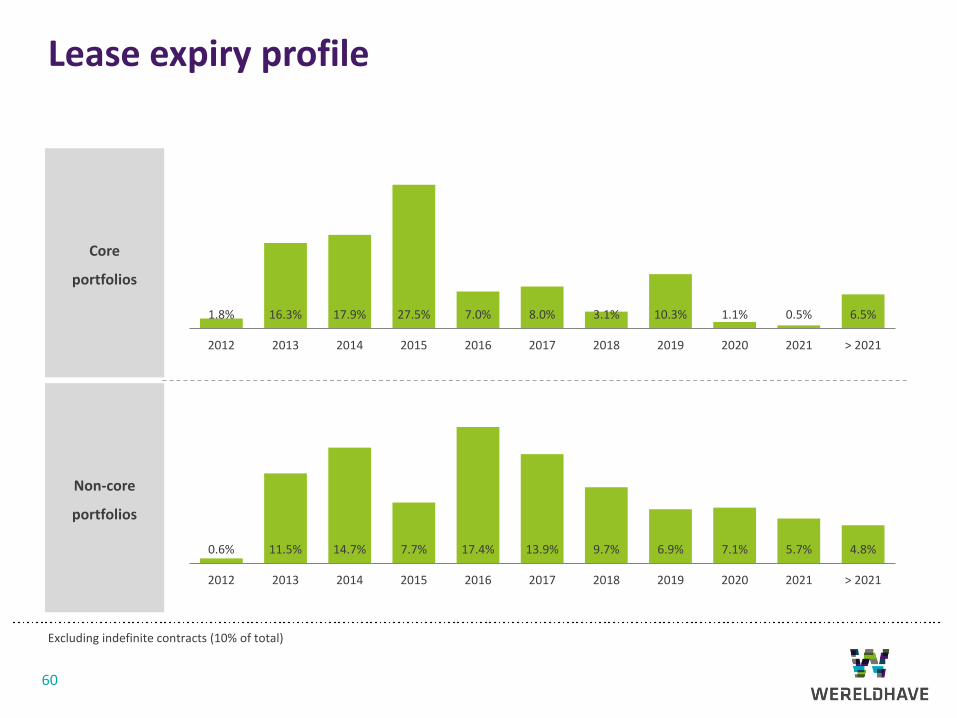
Lease expiry profile
60
Core
portfolios
Non-core
portfolios
1.8% 16.3% 17.9% 27.5% 7.0% 8.0% 3.1% 10.3% 1.1% 0.5% 6.5%
2012 2013 2014 2015 2016 2017 2018 2019 2020 2021 > 2021
0.6% 11.5% 14.7% 7.7% 17.4% 13.9% 9.7% 6.9% 7.1% 5.7% 4.8%
2012 2013 2014 2015 2016 2017 2018 2019 2020 2021 > 2021
Excluding indefinite contracts (10% of total)

Lease expiry profile per sector
61
1.2% 9.8% 10.6% 15.8% 4.1% 4.6% 2.9% 0.4% 1.0% 1.8% 6.7% 0.2%
4.1%
4.7%
2.8%
6.0% 4.7%
2.6% 7.4%
2.5% 1.9%
0.6%
0.06%
0.90%
0.53%
0.39%
1.13%
0.11%
0.08%
0.16%
0.00% 0.00%
0.22%
2012 2013 2014 2015 2016 2017 2018 2019 2020 2021 > 2021
Other
Office
Retail
Excluding indefinite contracts (10% of total)

Belgium retail portfolio: 2012 performance Core markets
62
Cap rate = Net market rent divided by gross market rent value including transaction costs
Key parameters FY 2012 FY 2011
Net rental income €23.1m €16.0m
Cap rate 6.4% 6.3%
Occupancy 98.7% 99.9%
Investment properties in operation
€377.5m €257.0m
Investment properties under construction
€55.2m €74.4m
Acquisitions €74.0m -
Net proceeds disposals - -

Finland retail portfolio: 2012 performance Core markets
63
Cap rate = Net market rent divided by gross market rent value including transaction costs
Key parameters FY 2012 FY 2011
Net rental income €23.6m €28.2m
Cap rate 6.1% 5.8%
Occupancy 98.5% 96.5%
Investment properties in operation
€458.3m €456.5m
Investment properties under construction
€36.7m €6.5m
Acquisitions - -
Net proceeds disposals - €45.0m
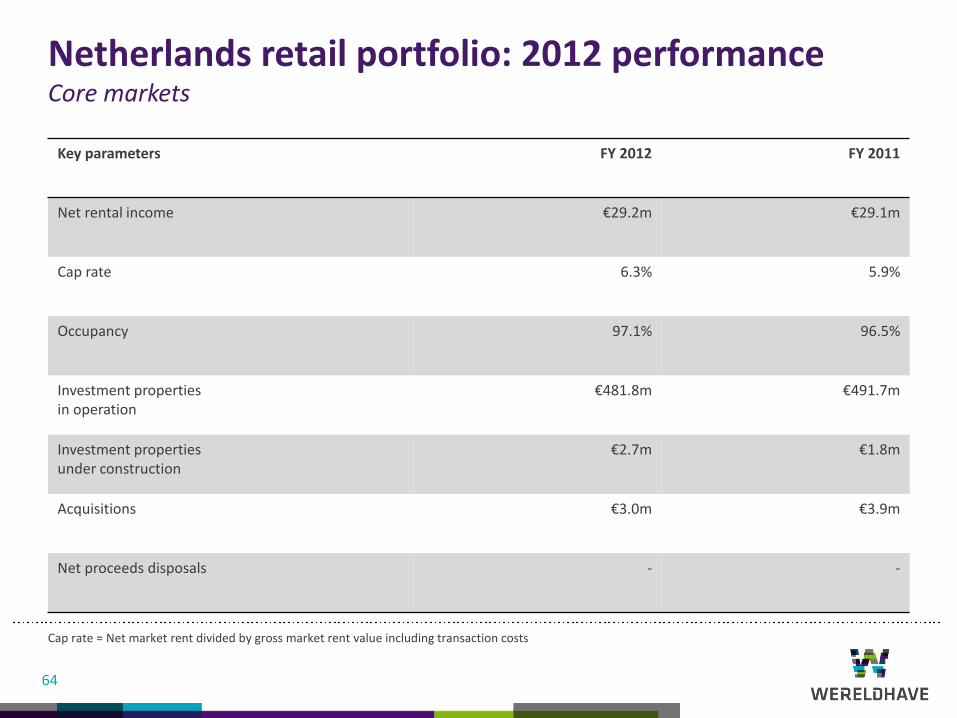
Netherlands retail portfolio: 2012 performance Core markets
64
Cap rate = Net market rent divided by gross market rent value including transaction costs
Key parameters FY 2012 FY 2011
Net rental income €29.2m €29.1m
Cap rate 6.3% 5.9%
Occupancy 97.1% 96.5%
Investment properties in operation
€481.8m €491.7m
Investment properties under construction
€2.7m €1.8m
Acquisitions €3.0m €3.9m
Net proceeds disposals - -

Paris portfolio: 2012 performance Core markets
65
Cap rate = Net market rent divided by gross market rent value including transaction costs
Key parameters FY 2012 FY 2011
Net rental income €9.4m €9.1m
Cap rate 6.1% 5.8%
Occupancy 99.0% 99.1%
Investment properties in operation
€174.7m €163.8m
Investment properties under construction
€116.4m €3.5m
Acquisitions - -
Net proceeds disposals - -

Valuation: Core and non-core portfolios
66
Core portfolios – In €m FY 2012 FY 2011 % growth % LFL growth
Belgium 377.5 257.0 46.9% 6.5%
Finland 458.3 456.5 0.4% 0.4%
Netherlands 481.8 491.7 (2.0)% (2.0)%
Paris 174.7 163.8 6.6% 6.6%
Spain 61.9 77.9 (20.5)% (2.6)%
Total 1,554.2 1,446.9 7.4% 1.2%
Non-core portfolios – In €m FY 2012 FY 2011 % growth % LFL growth
Belgium 122.3 141.4 (13.5)% (6.0)%
Netherlands 58.9 76.5 (23.0)% (22.5)%
France - 17.4 - -
Spain 35.5 58.1 (38.8)% (38.8)%
Total 216.7 293.4 (26.1)% (18.0)%
UK 310.2 415.7 (25.4)% (11.9)%
US 535.1 674.2 (20.6)% (12.5)%
Total 845.3 1,089.9 (22.4)% (12.2)%
NB Valuations include investments held for sale

Yield movements & cap rates
67
In % Retail Office Other Cap rate
Belgium +0.1 (0.3) - 6.4%
Finland +0.3 - - 6.1%
Netherlands +0.4 +0.3 (1.4) 6.4%
Paris - +0.3 - 6.1%
Spain +5.2 +0.3 +2.0 8.4%
UK +0.6 (1.7) - 7.1%
Cap rate 6.5% 6.6% 7.7% 6.5%
Effect US portfolio to discontinued operations -/- 15 bps on total portfolio
Cap rate movement total portfolio (excl. US) +29 bps in 12M 2012 (+14 bps in Q4 2012)
Valuation result:
(3.5)% yield movement
(2.7)% market rent and other

Finance
68
Key parameters FY 2012 FY 2011 Covenants
Interest bearing debt * €1,282m €1,289m
Average cost of debt** 2.7% 3.0%
Fixed vs floating debt 49% / 51% 44% / 56%
LTV 44% 41% ≤60%
ICR 4.6x 5.4x ≥2.0x
39%
22%
18%
18% 3%
Revolving credit facilities USPP
Convertible bond Convertible bond
Debenture
75
268
464
274
30 26 61
0
81 48 41
99
2013 2014 2015 2016 2017 2018 2019 2020 >2021
Debt
Undrawn
Diversification debt profile Maturity profile (€m)
* Nominal value of interest bearing debt ** Net financial expenses including US

Currency hedge
69
Coverage of USD and GBP exposure changed due to:
Sale of assets
Repayment of interest bearing debt
Coverage has increased in Q1 2013 to secure income from US and UK sales
45%
54% 54% 58%
USD31 Dec 12
USD31 Dec 11
GBP31 Dec 12
GBP31 Dec 11
A change of 10% on period-end exchange rates has an impact of €2.25 (or 3.5%) on the NAV per share
A change of 10% of average exchange rates (USD+GBP) has an impact of € 0.09 (or 2.3%) on direct result per share
0.5% change in interest rates EPS change: €0.15 (equal to 3.8% of direct result)

P&L 2012
70
(In €' 000) 2012 2011 Δ
Theoretical Rent 234,357 231,024 3,333
Vacancy (28,228) (22,787) (5,441)
Gross Rent 206,129 208,237 (2,108)
Service Costs (net) (3,463) (3,008) (455)
Property Expenses * (51,712) (43,743) (7,969)
Total Property Expenses (55,175) (46,751) (8,424)
Net Rental Income 150,954 161,486 (10,532)
General costs (22,719) (15,982) (6,737)
Other income and expense 1,578 1,770 (192)
Operational result 129,813 147,274 (17,461)
Interest Expenses * (35,226) (32,633) (2,593)
Direct Result before tax 94,587 114,641 (20,054)
Taxes on direct Result (774) (1,302) 528
Direct Result 93,813 113,339 (19,526)
Valuations Results * (197,033) (51,331) (145,702)
Result on Disposal 7,896 (4,097) 11,993
Interest Expenses (other) (4,054) (4,415) 361
Other Indirect Inc. & Exp. (15,007) 17 (15,024)
Other Financial Inc. & Exp. 1,197 (3,717) 4,914
Taxes on Indirect Result 26,094 13,189 12,905
Indirect Result (180,907) (50,354) (130,553)
Result (87,094) 62,985 (150,079)
Result shareholders (98,439) 51,296 (149,735)
Result non-controlling interest 11,345 11,689 (344)
Result (87,094) 62,985 (150,079)
Direct result per share 3.91 4.93 (1.02)
Result per share (4.54) 2.38 (6.92)
* 2011 adjusted for change in accounting policies leasehold

Contact details
Press:
Richard Beentjes
T +31 70 346 93 25
Analysts:
Jaap-Jan Fit
T +31 70 307 45 43