strathprints institutional repository - core · # the author(s) 2014. this article ... (prasad and...
TRANSCRIPT

Strathprints Institutional Repository
Saleh, Salah H A and Tanyimboh, Tiku (2014) Optimal design of water distribution systems basedon entropy and topology. Water Resources Management. ISSN 0920-4741
Strathprints is designed to allow users to access the research output of the University of Strathclyde.Copyright c© and Moral Rights for the papers on this site are retained by the individual authorsand/or other copyright owners. You may not engage in further distribution of the material for anyprofitmaking activities or any commercial gain. You may freely distribute both the url (http://strathprints.strath.ac.uk/) and the content of this paper for research or study, educational, ornot-for-profit purposes without prior permission or charge.
Any correspondence concerning this service should be sent to Strathprints administrator:mailto:[email protected]
http://strathprints.strath.ac.uk/

Optimal Design of Water Distribution SystemsBased on Entropy and Topology
Salah H. A. Saleh & Tiku T. Tanyimboh
Received: 22 December 2013 /Accepted: 22 May 2014# The Author(s) 2014. This article is published with open access at Springerlink.com
Abstract A new multi-objective evolutionary optimization approach for joint topology and pipesize design of water distribution systems is presented. The algorithm proposed considers simul-taneously the adequacy of flow and pressure at the demand nodes; the initial construction cost; thenetwork topology; and a measure of hydraulic capacity reliability. The optimization procedure isbased on a general measure of hydraulic performance that combines statistical entropy, networkconnectivity and hydraulic feasibility. The topological properties of the solutions are accounted forand arbitrary assumptions regarding the quality of infeasible solutions are not applied. In otherwords, both feasible and infeasible solutions participate in the evolutionary processes; solutionssurvive and reproduce or perish strictly according to their Pareto-optimality. Removing artificialbarriers in this way frees the algorithm to evolve optimal solutions quickly. Furthermore, anyredundant binary codes that result from crossover or mutation are eliminated gradually in aseamless and generic way that avoids the arbitrary loss of potentially useful genetic material andpreserves the quality of the information that is transmitted from one generation to the next. Theapproach proposed is entirely generic: we have not introduced any additional parameters thatrequire calibration on a case-by-case basis. Detailed and extensive results for two test problems areincluded that suggest the approach is highly effective. In general, the frontier-optimal solutionsachieved include topologies that are fully branched, partially- and fully-looped and, for networkswith multiple sources, completely separate sub-networks.
Keywords Statisticalentropy.Reliability-baseddesign .Evolutionaryoptimization.Redundantbinary codes
1 Introduction
The planning for a water distribution system may include topology design and sizing ofcomponents to evaluate the hydraulic properties of the system. Since failures may occur due to
Water Resour ManageDOI 10.1007/s11269-014-0687-y
S. H. A. Saleh : T. T. Tanyimboh (*)Department of Civil and Environmental Engineering, University of Strathclyde Glasgow, 107 Rottenrow,Glasgow G4 0NG, UKe-mail: [email protected]
S. H. A. Salehe-mail: [email protected]

pipe material deterioration with time or sudden increase in pressure, for example, the system’sreliability is worth considering also. With regard to the topology, branched systems are suitablefor small and low-density rural areas, while fully or partially looped systems are proper forurban areas (Swamee and Sharma 2008). Branched systems have the disadvantage that a breakin any pipe puts all consumers downstream out of service. In fully looped systems, eachdemand node can be supplied from the source(s) through at least two independent paths. Twosupply paths are said to be independent if they do not have a pipe in common. In the literature,the joint effects of topology and pipe size optimization were dealt with typically as twoseparate stages in which topology design followed by pipe sizing was carried out (Roweland Barnes 1982; Morgan and Goulter 1982, Kessler et al. 1990, Cembrowicz 1992).However, such methods neglect the strong coupling between topology and components designto varying degrees.
Also, the relationship between topology, pipe sizes and hydraulic reliability is strong.However, previous studies that included reliability generally did not optimize the topology.Various reliability measures that are easy to calculate have been suggested including statisticalentropy (Tanyimboh and Templeman 1993), resilience index (Todini 2000), network resilience(Prasad and Park 2004), modified resilience index (Jayaram and Srinivasan 2008) and surpluspower factor (Vaabel et al. 2006). Among these measures, statistical entropy has been shown tobe the most consistent (Reca et al. 2008; Raad et al. 2010; Baños et al. 2011; Tanyimboh et al.2011; Saleh et al. 2012). For water distribution systems, the statistical entropymay be considereda measure of the uniformity of the pipe flow rates (Tanyimboh and Templeman 1993).
Awumah et al. (1989) developed a two-stage model for optimizing the pipe sizes andtopology. In the first stage, a topology model determines whether a link is to be included usinginteger programming. In the second stage, pipe diameters are adjusted. Awumah and Goulter(1992) also proposed an alternative approach using statistical entropy theory. Tanyimboh andSheahan (2002) also used statistical entropy in an approach in which the topology, pipe sizing,reliability and redundancy were considered in successive stages.
Evolutionary optimization algorithms have been used also (Davidson and Goulter 1995;Walters and Smith 1995; Geem et al. 2000; Afshar and Jabbari 2007). Evolutionary algorithmsoften generate infeasible solutions when solving problems that involve constraints. Case-specific constraint-violation penalties (Kougias and Theodossiou 2013) that requirecalibration are frequently introduced to address this issue. Saleh and Tanyimboh (2013)introduced an approach that optimizes both the topology and pipe sizes. The algorithmprovides a single optimal solution and reliability aspects beyond the topology were notaddressed.
This paper describes a new multi-objective evolutionary approach for the simultaneoustopology, pipe size and entropy-based optimization of water distribution systems. Unlikeprevious entropy-based approaches such as Tanyimboh and Sheahan (2002), the pipe flowdirections and candidate topologies are not specified in advance. Also, the algorithm promotesfull exploitation of all feasible and infeasible solutions generated to guide the search. Ouralgorithm includes a robust measure for the infeasibility of any solution and a seamless genericprocedure for redundant binary codes. Results for two test problems in the literature areincluded.
2 Optimization Approach
The difficulties associated with constraint-violation penalties that are commonly used inevolutionary algorithms include time-consuming trial runs and parameter calibration (Dridi
S.H.A. Saleh, T.T. Tanyimboh

et al. 2008). On the other hand, penalty-free methods eliminate the need to design penaltyfunctions and are relatively straightforward to implement without sacrificing the computationalefficiency (Siew and Tanyimboh 2012). Also, penalty-free methods can maintain infeasiblesolutions that may have useful properties that may not be common in feasible solutions insuccessive generations of the optimization. Other constraint handling methods have beenproposed (Deb et al. 2002). For example, Ray et al. (2001) suggested three stages ofnondomination ranking using different combinations of the objective and constraintfunctions. Constraint handling in Deb et al. (2002) involves a binary tournament in whichfeasible solutions automatically dominate infeasible solutions. We developed a penalty-freestrategy that exploits all efficient solutions generated, without introducing additional measuresaimed at reducing the propagation of infeasible solutions.
2.1 Details of the Optimization Model
We used the EPANET 2 hydraulic simulation model (Rossman 2000) to determine thehydraulic properties of all solutions generated in the optimization process and to ensure thesolutions satisfy conservation of mass and energy. The optimization model minimizes theinitial construction cost, f1, the infeasibility measure, f2, and the number of pipes, f3, asexplained below.
f 1 ¼Xij
f Lij;Dij
� � ð1Þ
f 2 ¼ l þ hþ S�−Sð Þ þ S�g−S�
� �: l ¼
Xi¼1
N
max 0;Rreqi −Rið Þ; h ¼
Xi
max 0;Hreqi −Hið Þ
ð2Þ
f 3 ¼Xij
pij ð3Þ
in which N=number of nodes; for pipe ij, Lij=length; Dij=diameter; pij=1 if pipe ij is includedin the topology and pij=0 otherwise; Hi and Hi
req=available and required residual head atdemand node i, respectively; Ri and Ri
req=actual and required number of independent supplypaths to node i, respectively; S=entropy; S*=maximum entropy; and Sg
* = global maximumentropy.
The function l in Eq. 2 represents the total topological infeasibility of a candidate solution.The topological infeasibility at node i was taken as the shortfall in the number of independentsupply paths Ri. The required number of independent supply paths, Ri
req, is typically 1 and 2,respectively, for branched and fully looped configurations. The function h in Eq. 2 representsthe residual head infeasibility. If Hi≥Hi
req for all demand nodes, then the solution is hydrau-lically feasible. The required residual headHi
req is the head at a node above which demands aresatisfied in full. Hi
req is typically not less than a minimum of about 7 m (OFWAT 2008).For any feasible topology that has loops, there are multiple feasible sets of flow directions
each of which has a maximum entropy value. S* is the theoretical maximum value of entropyfor a particular feasible set of flow directions while Sg
* is the global maximum entropy valueconsidering all permissible topologies. The global maximum entropy value Sg
* is not known apriori; our algorithm evolves the global maximum entropy solution by assuming it correspondsto the largest entropy value it has so far identified. The infeasibility measure f2 seeks feasible
Optimal Design of Water Distribution Systems Based on Entropy

solutions that have high values of entropy (a proxy for hydraulic reliability and redundancy).Minimizing the infeasibility measure f2 promotes the inclusion of a range of maximum entropysolutions for which, by definition, S=S*, in the nondominated set in addition to Sg
*.To complete the characterization of the infeasibility function f2, the entropy functions are
described here briefly (Tanyimboh and Templeman 1993).
S ¼ S0 þXN
i¼1PiSi; ð4Þ
S=entropy; S0=entropy of source supplies; Si=entropy of node i; Pi=Ti/T=fraction of thetotal flow through the network that reaches node i; Ti=total flow that reaches node i; T=totaldemand;
S0 ¼ −Xi∈I
Q0i
Tln
Q0i
T
� �; ð5Þ
Q0i=inflow rate at source node i; I=the set of source supply nodes;
Si ¼ −Qi0
Tiln
Qi0
Ti
� �−
Xij∈out Nið Þ
Qij
T iln
Qij
T i
� �; i ¼ 1; :::::;N ; ð6Þ
Qi0=demand at node i;Qij=flow rate in pipe ij; and out(Ni)=set of all pipe flows from node i.For a typical node with, say, two incident pipes downstream, it can be shown that Si≤ln(3)≈
1.1 (Shannon 1948). Given that Pi=Ti/T≤1.0, it is expected that the value of the networkentropy S in Eq. 4 will be relatively small for the typical water distribution system. Therefore,it is expected that the contributions of the entropy terms (S*−S) and (Sg
*−S*) to the infeasi-bility measure f2 in Eq. 2 will be relatively small. The objective function f2 may be consideredan entropy-augmented infeasibility measure. Minimizing f2 aims simultaneously to satisfyresidual head and topology requirements and maximize entropy. Eqs. 4–6 are an extension ofthe statistical entropy function that is a measure of uncertainty (Shannon 1948). In a probabi-listic system the uncertainty is a maximum if all possible system states or outcomes areequally likely. Conversely, the uncertainty decreases as the probabilities associated with thestates or outcomes become more unequal. The term [(S*−S)+(Sg*−S*)]=(Sg*−S) in the infeasi-bility measure f2 may be considered an estimate of the unrealized entropy potential; bydefinition its value is zero for S=S*=Sg
*.
2.2 Practical Topology Confirmation and Redundant Binary Codes
We developed a topology confirmation algorithm coded in C, to enable a consistent and bias-free fitness assessment of all feasible and infeasible solutions. The total number of paths NPisupplying demand node i from all sources collectively was determined with regard to the pipeflow directions obtained from EPANET 2. We used an efficient path enumeration algorithmproposed by Yassin-Kassab et al. (1999). If NPi=0, the node cannot be supplied. If NPi=1, thenode can be supplied. If NPi≥2, for all nodes, a path inter-dependency investigation is carriedout to check whether the network is fully looped. We adopted a practical procedure that doesnot involve an exhaustive enumeration of all the paths supplying each node. For a pair ofindependent supply paths, removing a pipe from one path does not affect the other path.Therefore, the procedure entails removing all pipes one at a time and in each case observingwhether all nodes can be reached. If all nodes can be supplied from one or more sources afterthe removal of all pipes one by one with replacement, then all nodes have at least twoindependent supply paths. It is worth observing that EPANET 2 sets default values of node
S.H.A. Saleh, T.T. Tanyimboh

pressures and pipe flows within parts of a network that are not connected to a source. Weaddressed this by assigning zero flows and pressures, respectively, to such pipes and nodes.
In order to represent the vector of decision variables in a genetic algorithm, an n-bit binarystring gives rise to 2n different n-bit codes and, depending on the number of decision variables,some codes may be redundant. We assumed redundant codes represent closed pipes whoseflow-carrying capacity is zero. The closed pipes are allocated pipe sizes taken from just abovethe upper end of the real set of available pipe diameters. The data required to implement theprocedure are the unit costs for the fictitious or assumed diameters. As the fictitious diametershave no functional value, it is anticipated they will become extinct through evolution andnatural selection. The benefits of this novel approach are that it is entirely generic and verypractical; additional parameters that require special calibration are not introduced and pre-optimization trial runs are not required. The premature loss of potentially useful genes is thusavoided, and the genetic code that is transmitted in successive generations is not degraded(Herrera et al. 1998).
3 Computational Solution
We used the Nondominated Sorting Genetic Algorithm (NSGA) II that has been usedextensively, and its merits have been reported elsewhere (Deb et al. 2002; Dridi et al. 2008).Selection for crossover was carried out with a binary tournament. Single-point crossover wasused to produce two offspring from two parents. Once the offspring population was created,the mutation operator reversed the selected bits. The optimization problem was posed as:
Minimize f ¼ f 1; f 2; f 3ð ÞT ð7ÞThe decision variables are the pipe diameters Dij and link selection variables pij for the
entire network. To make all three objectives in Eq. 7 roughly similar in magnitude, each fim, i.e.
the value of objective m for solution i, was normalized as
f nmi ¼ f mi − fmmin
� �= f mmax− f
mmin
� �;∀i;∀m ð8Þ
In the generation in question, fminm and fmax
m = minimum and maximum value of objective m,respectively; and fni
m = normalized value of objective m for solution i.In each generation of the optimization algorithm, each solution in the population is analysed
using EPANET 2. The resulting pipe flow rates are used to calculate the entropy (Eq. 4). Ingeneral, numerical nonlinear optimization is required to calculate the maximum value of theentropy S*. However, computationally efficient path entropy methods that do not involvenumerical optimization directly are available. We used the “simplified path entropy method”developed by Ang and Jowitt (2005) for the single-source network example (Section 4.1) andan algorithm known as the “α-method” developed by Yassin-Kassab et al. (1999) for themultiple-source network example (Section 4.2). Application of the α-method involves solvinga non-linear system of equations and, for a two-source network, it reduces to the solution of asingle nonlinear equation for which we used the bisection method (Press et al. 2003).
4 Results and Discussion
Two networks from the literature were considered. The Hazen-Williams roughness coefficientfor all pipes is 130. For each network, the optimization algorithm was executed 30 times on a
Optimal Design of Water Distribution Systems Based on Entropy

(a)Network 1
(b) Network 2
Fig. 1 Topologies of Networks 1 and 2 with all the candidate pipes
S.H.A. Saleh, T.T. Tanyimboh

desktop personal computer (Processor: Intel Core 2 Duo, CPU: 2.99 GHz, RAM: 3.21 GB).The population size, cross-over probability and stopping criterion were: 100, 1.0 and 106
hydraulic simulations, respectively. The 100 solutions in each of the 30 nondominated setsachieved were then merged. Out of the 30×100 i.e. 3,000 solutions the final set of 100nondominated solutions was obtained by a screening procedure that considers the Pareto-optimality and diversity (i.e. crowding distance) of the solutions in the objective space (as inNSGA II). The convergence point in the optimization was taken as the point after which there
Table 1 Results and convergence statistics for 30 optimization runs
(a) Network 1
Properties Minimum Mean Median Maximum Standard deviation
GME entropy 3.380570 3.560733 3.561684 3.592494 0.041524
SME entropy 2.401622 2.489328 2.476941 2.660135 0.059723
GME cost (£106) 2.177413 2.787246 2.730261 3.552885 0.349057
SME cost (£106) 1.181715 1.293399 1.292801 1.496615 0.074389
Number of fully looped feasible solutions(out of 100)
36 48.533 50 57 5.778
Number of partially looped and branchedfeasible solutions per 100
0 6.2 5 13 3.219
Smallest surplus residual head for feasiblesolutions (m)
0.007 0.629 0.464 2.691 0.654
Function evaluations (FEs) for convergence 314,700 733,413 806,050 979,200 208,529
Extinction of all fictitious pipes (FEs) 1,500 4,600 3,850 17,300 3,725
Extinction of 750 mm pipes (FEs) 500 2,050 1,650 8,500 1,594
Extinction of 700 mm pipes (FEs) 900 2,583 1,950 5,700 1,406
Extinction of 650 mm pipes (FEs) 900 4,003 2,600 17,300 3,885
Hypervolume 0.653 0.661 0.660 0.682 0.004
CPU time for convergence (minutes) 27.35 63.75 70.06 85.11 18.13
(b) Network 2
Properties Minimum Mean Median Maximum Standard deviation
GME entropy 4.476402 4.872415 4.895875 5.190007 0.185378
SME entropy 2.981072 3.140691 3.136344 3.306349 0.089291
GME cost (millions of CU) 5.626414 6.814409 6.843641 7.738914 0.561343
SME cost (millions of CU) 2.253554 2.549198 2.502468 2.925169 0.179179
Number of fully looped feasible solutions(out of 100)
37 46.207 46 52 2.631
Number of partially looped and branchedfeasible solutions per 100
2 8.586 9 14 3.275
Smallest surplus residual head for feasiblesolutions (m)
0.002 0.082 0.058 0.335 0.083
Function evaluations (FEs) for convergence 552,000 905,224 949,800 997,500 106,861
Extinction of all fictitious pipes (FEs) 13,400 39,314 41,100 80,600 14,452
Extinction of 800 mm pipes (FEs) 5,400 25,914 24,600 78,200 16,222
Extinction of 750 mm pipes (FEs) 11,800 39,028 41,100 80,600 14,800
Hypervolume 0.642 0.645 0.645 0.648 0.002
CPU time for convergence (minutes) 69.10 113.32 118.90 124.87 13.38
Optimal Design of Water Distribution Systems Based on Entropy

was no further improvement in both the entropy and cost for the feasible solution with thehighest entropy value.
Given a set of nondominated solutions, the hypervolume is a measure of the fraction of theobjective space dominated by the said solutions. Its value increases as the achieved solutionsapproach the real Pareto-optimal front. The value increases also as the range of solutions in thenondominated set increases or their distribution becomes more uniform. Larger hypervolumevalues are thus preferred (Knowles 2005). The hypervolume was calculated after normalizingthe objectives according to Eq. 8, for each optimization run and the union of all the 30 runs.
4.1 Sample Network 1
The network shown in Fig. 1a (Awumah et al. 1990) has one supply node, 17 pipes and 11demand nodes. The elevation of the nodes is 0 m. The head at the supply node is 100 m.Hi
req=30 m for all demand nodes. All pipes have length of 1,000 m. Ri
req=2 specifies a fully loopedtopology. We used 12 pipe diameters (100, 125, 150, 200, 250, 300, 350, 400, 450, 500, 550and 600 mm) i.e. 1317=8.65×10¹⁸ solutions including pipe omission. Given 106 hydraulicsimulations the sampling ratio was 106/8.65×1018=8.65×10−12. Each solution was represent-ed by a 68-bit chromosome based on a 4-bit pipe-size representation scheme. A 4-bit binarystring produces 24=16 codes three of which are redundant as there are 13 pipe-size alterna-tives. We allocated three assumed pipe diameters of 650, 700 and 750 mm to the threeredundant codes. The pipe costs were taken as 800D1.5 (£/m) where D is the pipe diameter(in metres). The absolute probability of bit mutation was 1/68≈0.015.
Table 1 shows the general characteristics of the optimization algorithm. The minimum costachieved for the global maximum entropy (GME) solution was £2,177,413. The maximumvalue of entropy for the GME solutionwas 3.592494. Themean number of function evaluationsand CPU time required to achieve convergence were 733,413 and about 64 min, respectively.There is a multiplicity of maximum entropy values and one of the aims of the optimization is to
Cost
(£106)
Layout and head infeasibility (102) Entropy
Fig. 2 Pareto-optimal fronts for Network 1 showing 30 optimization runs
S.H.A. Saleh, T.T. Tanyimboh

provide a wide range of maximum entropy solutions. The maximum entropy value that is thesmallest gives rise to the smallestMaximum Entropy (SME) solution. Theminimum cost of the
Fig. 3 a Topologies and flow directions of fully looped hydraulically feasible maximum entropy families forNetwork 1. The solid circles represent nodes with the smallest residual heads. b Topologies and flow directions ofbranched and partially looped hydraulically feasible maximum entropy families for Network 1. The solid circlesrepresent nodes with the smallest residual heads. c Topologies of looped and partially looped feasible solutionsfor Network 2. The rectangles represent sources. d Topologies of branched and partially branched feasiblesolutions for Network 2. The rectangles represent sources
Optimal Design of Water Distribution Systems Based on Entropy

SME solution was £1,181,715. The maximum value of entropy for the SME solution was2.660135. The minimum surplus head at the critical node was 0.007 m. The optimization modelincludes multiple conflicting objectives. Therefore, it is not guaranteed that any minimum nodepressure constraints will be active. Furthermore, the slack for a limitingminimum node pressureconstraint need not be exactly zero, due to the discrete pipe diameters.
Fig. 3 (continued)
S.H.A. Saleh, T.T. Tanyimboh

Figure 2 shows the frontier-optimal solutions achieved of which the most infeasiblesolution has cost = 0; entropy = 0; topological infeasibility = 24 (i.e. 2 independent pathsper node × 12 nodes); and residual head infeasibility = 330 m (i.e. 11 demand nodes × 30 m ofresidual head for each demand node). This solution survives until the end of the optimizationbecause the algorithm is bias-free with respect to constraint violations. Any crossover betweenthis solution and another solution will likely create new layouts. Also, the hypervolume valuefor the final merged Pareto-optimal front was 0.676. This is similar to the values in Table 1 forthe individual optimization runs.
Fig. 3 (continued)
R2 = 0.976 (Network 1)
R2 = 0.978 (Network 2)
0
1
2
3
4
5
6
0 1 2 3 4 5 6Entropy
Max
imum
Ent
ropy
Infeasible designs (Network 1)
Feasible designs (Network 1)
Infeasible designs (Network 2)
Feasible designs (Network 2)
Fig. 4 Achieved vs theoretical maximum entropy values of Networks 1 and 2
Optimal Design of Water Distribution Systems Based on Entropy

Tables 2 and 3 (in the appendix) illustrate the range of feasible solutions achieved. The finalPareto-optimal set has 23 hydraulically feasible fully-looped solutions and 11 different fullylooped topologies (see Fig. 3a). All infeasible solutions in the final Pareto-optimal set werefound to be topologically infeasible (i.e. ∃i:Ri<Rireq=2), of which only three were hydrauli-cally feasible (i.e. Hi≥Hi
req=30 m; ∀i) (see Fig. 3b). Fig. 4 provides further confirmation thatthe solutions achieved are essentially maximum entropy solutions.
Figure 5 shows the progress of the optimization. The fictitious pipe diameters wereeliminated in the early stages consistently (Fig. 5b-c). Prior to their complete elimination,fictitious pipe diameters were present in both hydraulically feasible and infeasible solutions.Also, the observed rates of elimination reflected the pipe sizes and costs (Table 1 and Fig. 5c).On average the larger more expensive assumed diameters were eliminated more quickly. Theseresults suggest convergence of the algorithm is very quick and the proposed procedure forhandling redundant binary strings is highly effective.
4.2 Sample Network 2
The network shown in Fig. 1b has two supply nodes, 18 demand nodes and 37 pipes. Thenode demands, required residual heads, pipe lengths and costs are available in Morgan andGoulter (1985). There are 13 pipe sizes, i.e. 1437=2.55×1042 solutions including pipeomission. Given 106 hydraulic simulations the sampling ratio was 106/2.55×1042=3.92×10−37. A 4-bit binary substring for each pipe size gave a chromosome with length of 148bits. The absolute probability of bit mutation was 1/148. With 14 options for each pipe, two
0
0.05
0.1
0.15
0.2
0.25
0.3
0.35
0.4
0.45
0.5
0 200 400 600 800 1000
Function evaluations (103)
Min
imum
AIM
0
50
100
150
200
250
300
0 2 4 6 8 10 12 14 16 18 20Function evaluations (103)
Tota
l num
ber o
f fic
titio
us p
ipes
0
1
2
3
4
5
6
0 200 400 600 800 1000
Function evaluations (103)
Ave
rage
cos
t (£1
06 )
MinMeanMax
0
15
30
45
60
75
90
0 2 4 6 8 10 12 14 16 18 20
Function evaluations (103)
sepipsuoi titc iffo reb
m unn ae
M
650 mm
700 mm
750 mm
a
b
c
d
Fig. 5 Illustration of convergence characteristics with Network 1. (a) and (b) show 30 individual optimizationruns while (c) and (d) show averages based on the 30 optimization runs. AIM abbreviates the entropy-augmentedinfeasibility measure
S.H.A. Saleh, T.T. Tanyimboh

0
1
2
3
4
5
6
7
8
9
0 200 400 600 800 1000 1200 1400
Layout and head infeasibility
Cos
t (10
6 cur
renc
y un
its) Infeasible designs
Feasible designs
(a) Infeasibility vs. cost
0
1
2
3
4
5
6
0 200 400 600 800 1000 1200 1400
Layout and head infeasibility
Entro
py
Infeasible designsFeasible designs
(b) Infeasibility vs. entropy
0
1
2
3
4
5
6
7
8
9
0 1 2 3 4 5 6
Entropy
Cos
t (10
6 cu
rren
cy u
nits
) Infeasible designsFeasible designs
(c) Entropy vs. cost
Fig. 6 Pareto-optimal fronts forNetwork 2 based on the union ofthe results of 30 optimization runs
Optimal Design of Water Distribution Systems Based on Entropy

codes (out of 24=16) were redundant. Two fictitious pipe diameters of 750 mm and 800 mm, withcosts of 520.9/m and 591.7/m respectively, were allocated to the two redundant codes by extendingthe cost function of the real pipe diameters. The costs are in generic currency units (CU).
Table 1 summarizes the results achieved. The final Pareto-optimal front had 31 feasiblesolutions based on 26 layouts (Fig. 3c) that are fully non-dendritic (i.e. layouts with no deadends). Additionally, seven branched and partially-branched feasible solutions were achieved(Fig. 3d). The cheapest fully-looped feasible solution (Layout 24 in Fig. 3c) with a cost of2,374,070 CU (Solution 29 in Table 4) had 12 pipes removed. The most expensive fully-looped feasible solution (Layout 2 in Fig. 3c) with a cost of 7,738,914 CU (Solution 4 inTable 4) had one pipe removed. Figure 6 shows the relationship between the cost, entropy andinfeasibility.
5 Conclusions
A new approach to the simultaneous topology and reliability-based pipe-size optimization ofwater distribution systems has been developed. The method provides a multiplicity of cost-effective candidate solutions distributed among a diverse range of optimal topologies. We usedstatistical entropy as a computationally efficient surrogate measure of the hydraulic reliability/redundancy and reduced the computational complexity by introducing a new entropy-aug-mented infeasibility measure. Our optimization model includes the following essential fea-tures: (a) entropy maximization within individual feasible sets of flow directions; (b) entropymaximization across all feasible sets of flow directions within individual topologies; (c)entropy maximization across all topologies; (d) minimization of initial construction cost; (e)promotion of a wide variety of alternative solutions; (f) satisfaction of minimum topologicaladequacy (i.e. supply node and demand node reachability); (g) satisfaction of minimumtopological redundancy (i.e. alternative independent supply paths); and (h) adequacy of nodalflows and pressures.
Clearly, many complex objectives and constraints are involved. The entropy-augmentedinfeasibility measure introduced here simplifies the optimization and reduces the computa-tional complexity considerably as the objectives have been reduced to only three (Saxenaet al. 2013; Deb et al. 2002). The optimization problem addressed has six objectives. Sinhaet al. (2013) emphasize that the computational solution of a six-objective optimizationproblem is a ‘formidable task’ for most evolutionary multi-objective optimization algo-rithms that aim to generate the entire Pareto-optimal front. Some of the challenges include:difficulties in achieving at once both diversity of solutions and convergence on the truePareto-optimal front; and difficulties arising from the inability to visualize the Pareto-optimal front geometrically.
The genetic algorithm approach proposed allows full exploitation of all the efficient feasibleand infeasible solutions generated in the optimization. Any redundant binary codes created areeliminated in a seamless and generic way through natural selection. This avoids arbitrary lossof potentially useful genetic material and preserves the quality of the information that istransmitted from one generation to the next. The results for the two test problems consideredare sufficiently encouraging to suggest further research to improve and extend the algorithmsproposed may be beneficial.
Aknowledgments The first author’s PhD programme was funded by the Government of Libya. This researchwas funded in part by the UK Engineering and Physical Sciences Research Council (EPSRC Grant ReferenceEP/G055564/1).
S.H.A. Saleh, T.T. Tanyimboh

Appendix
Table 2 Nondominated feasible solutions achieved for Network 1
(a) Fully looped feasible solutions
Solutionnumber
Cost (£106) aSurplushead (m)
bCriticalnode
Achievedentropy(S)
Maximumentropy(ME)
ME − S GME − ME dMEfamily
1 2.52235 19.734 9 3.592494 3.592800c 0.000306 0.000000 1
2 1.592572 9.817 10 3.257305 3.330590 0.073285 0.262210 2
3 1.823409 2.083 11 3.439667 3.489588 0.049921 0.103213 3
4 2.756591 21.594 8 3.581014 3.581115 0.000101 0.011685 4
5 1.977641 11.642 6 3.545526 3.546760 0.001234 0.046041 5
6 3.138684 38.903 9 3.449581 3.449665 0.000084 0.143135 6
7 3.067751 38.729 9 3.449580 3.449665 0.000085 0.143135 6
8 2.930185 36.096 9 3.449268 3.449665 0.000397 0.143135 6
9 2.235305 8.626 9 3.448149 3.449665 0.001517 0.143135 6
10 1.871266 5.864 10 3.395190 3.398060 0.002870 0.194740 7
11 1.292923 1.350 2 2.850790 2.891747 0.040958 0.701053 8
12 1.271386 3.443 10 2.647933 2.723657 0.075724 0.869144 9
13 2.969728 33.350 2 3.265855 3.269803 0.003947 0.322998 10
14 1.173127 1.910 10 2.367236 2.469176 0.101940 1.123624 11
15 2.849506 35.237 3 2.940251 2.940255 0.000004 0.652545 12
16 2.839981 34.462 3 2.940250 2.940255 0.000005 0.652545 12
17 2.769049 34.041 3 2.940247 2.940255 0.000008 0.652545 12
18 2.729939 32.628 3 2.940223 2.940255 0.000033 0.652545 12
19 2.683465 32.394 3 2.940159 2.940255 0.000097 0.652545 12
20 2.605798 30.773 3 2.940102 2.940255 0.000154 0.652545 12
21 2.535235 23.781 3 2.939597 2.940255 0.000659 0.652545 12
22 1.529674 9.394 9 2.614232 2.624432 0.010200 0.968369 13
23 1.721305 6.330 10 2.419348 2.425825 0.006477 1.166975 14
(b) Branched or partially looped feasible solutions
Solutionnumber
Cost (£106) Surplushead (m)
Criticalnode
Achievedentropy (S)
Maximumentropy(ME)
ME − S GME − ME MEfamily
24 1.508359 18.840 8 2.447343 2.447345 0.000002 1.145456 15
25 1.075510 0.842 11 2.387568 2.404150 0.016582 1.188651 16
26 1.050212 0.503 11 2.360799 2.360799 0.000000 1.232002 17
a Refers to the excess residual head at the node with the smallest residual headb Refers to the node with the smallest residual headc The global (i.e. greatest) maximum entropy (GME) value foundd The maximum entropy family here refers to any subset of solutions whose topology and pipe flow directions areidentical
Optimal Design of Water Distribution Systems Based on Entropy

Tab
le3
Detailsof
selected
nondom
inated
feasiblesolutio
nsachieved
forNetwork1
Pipes
Pipe
diam
eters(m
m)a
Least-costsolutio
nsGMEsolutio
n
Fully
branched
Partly
branched
Fully
looped
Three
loops
Four
loops
Five
loops
Sixloops
1–12
200
200
200
350
450
350
350
450
1–2
150
200
150
300
550
250
125
400
1–4
––
–300
300
300
300
300
2–5
–200
150
200
350
300
125
450
3–12
400
400
400
300
200
300
350
200
3–4
350
150
300
–300
300
350
350
3–6
200
350
250
300
400
–200
300
4–5
150
100
150
200
400
300
300
550
4–7
300
–300
100
200
200
350
200
5–8
––
250
–350
150
125
6–7
–300
–200
300
400
200
400
6–9
200
150
200
200
100
250
200
100
7–8
250
250
250
–350
350
200
450
7–10
200
200
––
––
100
200
8–11
200
200
250
200
300
200
200
300
9–10
––
250
200
200
200
125
250
10–11
––
100
100
350
250
300
300
Cost(£10
6)
1.050
1.076
1.173
1.272
2.235
1.871
1.593
2.522
Criticalnode
1111
1010
910
109
Surplushead
atcriticalnode
(m)
+0.50
+0.84
+1.91
+3.44
+8.63
+5.86
+9.82
+19.73
Num
berof
pipes
1112
1314
1516
1717
Num
berof
loops
01
23
45
66
Entropy
2.361
2.389
2.367
2.648
3.448
3.395
3.257
3.593
S.H.A. Saleh, T.T. Tanyimboh
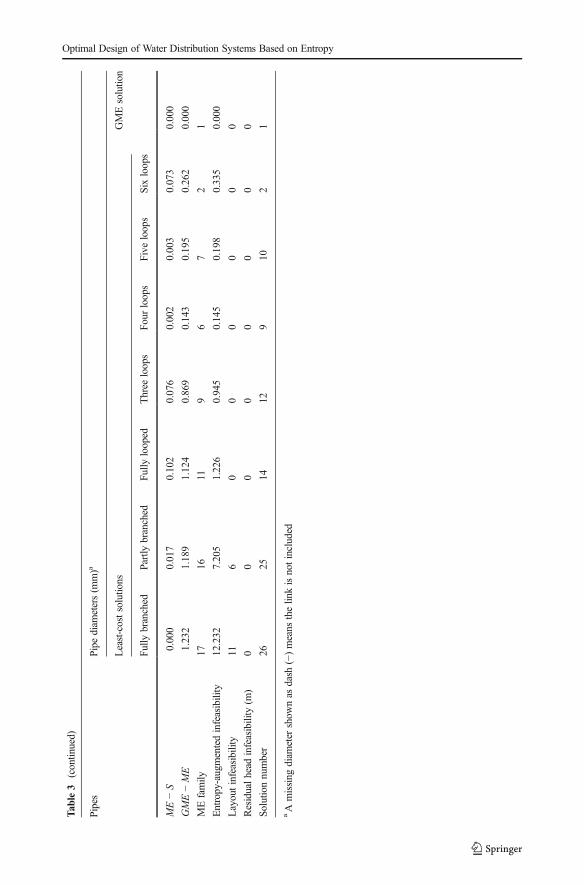
Tab
le3
(contin
ued)
Pipes
Pipe
diam
eters(m
m)a
Least-costsolutio
nsGMEsolutio
n
Fully
branched
Partly
branched
Fully
looped
Three
loops
Four
loops
Five
loops
Sixloops
ME−S
0.000
0.017
0.102
0.076
0.002
0.003
0.073
0.000
GME−ME
1.232
1.189
1.124
0.869
0.143
0.195
0.262
0.000
MEfamily
1716
119
67
21
Entropy-augmentedinfeasibility
12.232
7.205
1.226
0.945
0.145
0.198
0.335
0.000
Layoutinfeasibility
116
00
00
00
Residualhead
infeasibility
(m)
00
00
00
00
Solutio
nnumber
2625
1412
910
21
aA
missing
diam
eter
show
nas
dash
(−)means
thelinkisnotincluded
Optimal Design of Water Distribution Systems Based on Entropy

Tab
le4
Nondominated
feasiblesolutio
nsachieved
forNetwork2
(a)Loopedandpartially
looped
feasiblesolutio
ns
Solutio
nnumber
Cost(CU)
a Surplus
head
(m)
Criticalnode
Achievedentropy(S)
Maxim
umentropy(M
E)
ME−S
GME−ME
Layoutnumber
17,209,000
0.306
155.171049
b5.557610
0.386561
0.000000
1
26,563,651
0.267
195.109483
5.277704
0.168221
0.279906
1
36,392,398
0.643
195.051366
5.281130
0.229764
0.276480
1
47,738,914
0.470
155.190007
5.541571
0.351563
0.016039
2
56,756,341
0.175
195.137941
5.280588
0.142647
0.277022
2
66,672,388
0.669
195.075552
5.284013
0.208461
0.273597
2
77,601,494
0.148
155.181323
5.536762
0.355439
0.020848
3
87,399,096
0.082
155.130746
5.422957
0.292211
0.134653
4
96,376,680
0.411
155.022152
5.232052
0.209900
0.325558
5
106,894,839
0.024
155.061369
5.437145
0.375776
0.120465
6
114,916,521
0.293
154.594931
4.709163
0.114232
0.848447
7
125,307,348
0.628
84.672370
5.062133
0.389763
0.495477
8
134,957,599
0.853
154.641112
4.786899
0.145787
0.770711
9
144,774,924
1.594
154.498214
4.604216
0.106002
0.953394
10
154,698,694
0.701
154.498006
4.604195
0.106189
0.953415
10
165,552,754
1.241
154.655285
5.039450
0.384165
0.518160
11
175,025,859
3.256
134.556314
4.818961
0.262647
0.738649
12
184,394,286
0.515
174.320600
4.434738
0.114138
1.122872
13
194,235,979
3.219
204.177757
4.350449
0.172692
1.207161
14
203,372,806
2.753
73.836534
3.997189
0.160655
1.560421
15
213,230,154
1.063
13.802677
3.851815
0.049138
1.705795
16
223,960,139
0.866
73.956164
4.051982
0.095818
1.505628
17
233,538,884
0.162
73.800675
3.955395
0.154720
1.602215
18
244,433,439
6.644
73.976741
4.238134
0.261393
1.319476
19
253,426,289
3.712
73.693540
3.974741
0.281202
1.582869
20
S.H.A. Saleh, T.T. Tanyimboh

Tab
le4
(contin
ued)
264,039,451
1.481
173.795224
3.891766
0.096542
1.665844
21
273,107,144
1.568
133.503619
3.723526
0.219906
1.834085
22
282,454,604
0.435
203.287140
3.317104
0.029964
2.240506
23
292,374,070
0.066
193.203094
3.359538
0.156445
2.198072
24
302,561,895
1.473
193.179116
3.291627
0.112511
2.265983
25
312,460,335
1.141
83.130207
3.137692
0.007485
2.419918
26
(b)Branchedandpartially
branched
feasiblesolutio
nsc
Solutionnumber
Cost(CU)
Surplushead
(m)
Criticalnode
Achievedentropy(S)
Maxim
umentropy(M
E)
ME−S
GME−ME
Layoutnumber
322,197,697
1.550
43.079714
3.120364
0.040650
2.437246
27
331,922,166
1.045
202.980528
2.992726
0.012198
2.564884
28
342,027,732
0.040
172.968468
2.990397
0.021929
2.567213
29
351,991,802
0.045
172.957860
2.983705
0.025845
2.573905
30
363,052,542
1.358
12.954783
2.963028
0.008244
2.594582
31
373,042,543
0.371
42.942952
2.963028
0.020076
2.594582
32
381,808,731
0.371
42.915428
2.915428
0.000000
2.642182
33
aRefersto
theexcess
residualhead
atthenode
with
thesm
allestresidualhead
bThe
globalmaxim
umentropy(G
ME)valuefound
cA
branched
configurationin
thiscontextisonethathasadead
end
Optimal Design of Water Distribution Systems Based on Entropy

Open Access This article is distributed under the terms of the Creative Commons Attribution License whichpermits any use, distribution, and reproduction in any medium, provided the original author(s) and the source arecredited.
References
Afshar MH, Jabbari I (2007) Simultaneous layout and size optimization of pipe networks using geneticalgorithms. Arab J Sc Eng 33(2B):391–409
Ang WK, Jowitt PW (2005) Path entropy method for multiple-source water distribution networks. Eng Optim37(7):705–715
Awumah K, Goulter I (1992) Maximizing entropy-defined reliability of water distribution networks Eng.Optimization 20(1):57–80
Awumah K, Bhatt SK, Goulter IC (1989) An integer programming model for layout design of water distributionnetworks. Eng Optim 15(1):57–70
Awumah K, Goulter I, Bhatt SK (1991) Entropy-based redundancy measures in water distribution networkdesign. J Hydraul Eng 117(5):595–614
Baños R, Reca J, Martínez J, Gil C, Márquez A (2011) Resilience indexes for water distribution network design:a performance analysis under demand uncertainty. Water Resour Manag 25(10):2351–2366
Cembrowicz RG (1992) Water supply systems optimization for developing countries. In: Coulbeck B, Evans E(eds) Pipeline systems. Kluwer, London, pp 59–76
Davidson JW, Goulter IC (1995) Evolution program for design of rectilinear branched networks. J Comput CivEng 9(2):112–121
Deb K, Pratap A, Agarwal S, Meyarivan T (2002) A fast and elitist multiobjective genetic algorithm: NSGA-II.IEEE Trans Evol Comput 6(2):182–197
Dridi L, ParizeauM, Maihot A, Villeneuve J-P (2008) Using evolutionary optimization techniques for schedulingwater pipe renewal considering a short planning horizon. Comput-Aided Civ Infrastruct Eng 23(8):625–635
Geem ZW, Kim JH, Yoon YN (2000) Optimal layout of pipe networks using harmony search. Proceedings of 4thInternational Conf. on Hydro-Science and Engineering Seoul, South Korea
Herrera F, Lozano M, Verdegay JL (1998) Tackling real-coded genetic algorithms: operators and tools forbehavioural analysis. Artif Intell Rev 12:265–319
Jayaram N, Srinivasan K (2008) Performance-based optimal design and rehabilitation of water distributionnetworks using life cycle costing. Water Resour Res 44(1)
Kessler A, Ormsbee L, Shamir U (1990) A methodology for least-cost design of invulnerable water distributionnetworks. Civ Eng Syst 7(1):20–28.
Knowles J (2005) A hybrid algorithm with on-line landscape approximation for expensive multiobjectiveoptimization problems. IEEE Trans Evol Comput 10(1):50–66
Kougias IP, Theodossiou NP (2013) Multi-objective pump scheduling optimization using harmony searchalgorithm and polyphonic HSA. Water Resour Manag 27(5):1249–1261
Morgan DR, Goulter IC (1982) Least cost layout and design of looped water distribution systems. Proceedings of9th International Symposium on Urban Hydrology, Hydraulics and Sediment control, Lexington, KY, USA,27–30
Morgan DR, Goulter IC (1985) Optimal urban water distribution design. Water Resour Res 21(5):642–652OFWAT (2008) Guaranteed Standards Scheme [Website accessed 26 February 2013] http://www.ofwat.gov.uk/
consumerissues/rightsresponsibilities/waterpressure.Prasad TD, Park NS (2004) Multi-objective genetic algorithms for design of water distribution networks. J Water
Resour Plan Manag 130(1):73–82Press WH, Teukolski SA, Vetterling WT, Flannery BP (2003) Numerical Recipes in FORTRAN 77, Vol. 1,
Cambridge University Press, p. 346–7Raad DN, Sinske AN, van Vuuren JH (2010) Comparison of four reliability surrogate measures for water
distribution systems design. Water Resour Res 46(5):W05524Ray T, Tai K, SeowC (2001) An evolutionary algorithm for multiobjective optimization. EngOptim 33(3):399–424Reca J, Martinez J, Banos R, Gil C (2008) Optimal design of gravity-fed looped water distribution networks
considering the resilience index. J Water Resour Plan Manag 134(3):234–238Rossman LA (2000) EPANET 2 users manual. Water supply and water resources division, national risk
management research laboratory. U.S. EPA, CincinnatiRowel WF, Barnes JW (1982) Obtaining the layout of water distribution systems. J Hydraul Div ASCE 108(1):
137–148
S.H.A. Saleh, T.T. Tanyimboh
Saleh HAS, Tanyimboh TT (2013) Coupled topology and pipe size optimization of water distribution systems.Water Resour Manag. doi:10.1007/s11269-013-0439-4
Saleh S, Barlow E, Tanyimboh TT (2012) Unbiased and accurate assessment of surrogate measures of hydraulicreliability of water distribution systems. 14th Water Distribution Systems Analysis Conference, Adelaide,Australia, ISBN 978-1-922197-58-9, 148–157
Saxena KS, Duro JA, Tiwari A, Deb K (2013) Objective reduction in many-objective optimization: linear andnon-linear algorithms. Trans Evol Comput 17(1):77–99
Shannon C (1948) A math. theory of communication. Bell Syst Tech J 27(3):379–428Siew C, Tanyimboh TT (2012) Penalty-free feasibility boundary convergent multi-objective evolutionary
algorithm for the optimization of water distribution systems. Water Resour Manag 26(15):4485–4507Sinha A, Saxena DK, Deb K, Tiwari A (2013) Using objective reduction and interactive procedure to handle
many-objective optimization problems. Appl Soft Comput 13(1):415–427Swamee PK, Sharma AK (2008) Design of water supply pipe networks. Wiley, New JerseyTanyimboh TT, Sheahan C (2002) A maximum entropy based approach to the layout optimization of water
distribution systems. Civ EngEnviron Syst 19(3):223–254Tanyimboh TT, Templeman AB (1993) Calculating maximum entropy flows in networks. J Oper Res Soc 44(4):
383–396Tanyimboh TT, Tietavainen MT, Saleh S (2011) Reliability assessment of water distribution systems with
statistical entropy and other surrogate measures. Water Sci Technol Water Supply 11(4):437–443Todini E (2000) Looped water distribution networks design using a resilience index based approach. Urban
Water 2(2):115–122Vaabel J, Ainola L, Koppel T (2006) Hydraulic power analysis for determination of characteristics of a water
distribution system. Proceedings of 8th Annual Water Distribution Systems Analysis Symposium,Cincinnati, Ohio, USA
Walters GA, Smith DK (1995) Evolutionary design algorithm for optimal layout of tree networks. Eng Optim24(4):261–281
Yassin-Kassab A, Templeman AB, Tanyimboh TT (1999) Calculating maximum entropy flows in multi-source,multi-demand networks. Eng Optim 31(6):695–729
Optimal Design of Water Distribution Systems Based on Entropy