straw rocket - oak ridge institute for science and education
TRANSCRIPT

Straw Rocket Submitted by: Chunhong Lin, Science
Benjamin Tasker Middle School, Bowie, MD
Target Grade: 6th Grade Science
Time Required: 110 minutes
Standards
Next Generation Science Standards (NGSS):
• MS-ETS1-3: Analyze data from tests to determine similarities and differences among several design solutions to identify the best characteristics of each that can be combined into a new solution to better meet the criteria for success.
Lesson Objectives
Students will:
• Collect and analyze data to identify relationships between different variables. • Use the data collected from their rocket to explain the effect of the length of nose cone on the
distance travelled using their knowledge of forces and motion.
Central Focus
Throughout this lesson, students will collaborate in small groups to construct straw rockets to test and graph the effect changes to the rockets’ nose cone length will have on the distance the rocket will travel. By the end of this lesson, students will complete an investigation on the phenomenon of sending rockets into space by relating it to force, motion, and design manipulation. Students can participate in this lesson plan in a virtual or in-person environment.
Key words: physics, scientific process, graphing, data collecting, online, at home, NASA, space, motion
Background Information
Within this lesson, students will do the following: 1. Organize data
a. Students organize given data (via tables, charts, or graphs) from tests intended to determine the effectiveness of three or more alternative solutions to a problem.
2. Identify relationships
a. Students use appropriate analysis techniques (e.g., qualitative or quantitative analysis; basic statistical techniques of data and error analysis) to analyse the data and identify relationships within the datasets, including relationships between the design solutions and the given criteria and constraints.
3. Interpret data a. Students use the analysed data to identify evidence of similarities and differences in
features of the solutions. b. Based on the analysed data, students make a claim for which characteristics of each
design best meet the given criteria and constraints. c. Students use the analysed data to identify the best features in each design that can be
compiled into a new (improved) redesigned solution.
• During this lesson, students should be able to design and conduct a scientific investigation and develop descriptions, explanations, predictions, and models using evidence.
• This lesson addresses a common student misconception: the weight of the rocket is the only factor that affects the distance a rocket travels.
• Students should be made aware of and introduced to different possible variables to conduct the investigation.
Preparation:
• If this is a virtual learning lesson, the teacher should post the Straw Rocket Templates on Google Classroom at least one day ahead of the date of the lab for students to print out.
• Print the Straw Rocket Templates if the class is in person. • Post Make a Straw Rocket lab on Google Classroom before the class starts. • Teachers can use links for the Padlet and Jamboard discussions that are provided below, or they
can create their own links. o Make a Straw Rocket Group Communication (padlet.com) o Group 1 Make a Straw Rocket Discussion (padlet.com) o Make a Straw Rocket Gallery Walk - Google Jamboard
• The exit ticket can be printed off for each student. It can also be displayed on a board while students write answers down on a blank sheet of paper.
Testing variables:
• During this lesson, students will complete multiple tests to identify which variables are affecting the rocket.
• Each variable should be tested one at a time, multiple times. • Students will have the opportunity to test each of the following variables:
o Nose shape o Angle of launch o Number of the fins o Weight of the rocket (weighted the rocket with paper clips)
o Length of the tube (rocket body) o Weight of the nose cone
• It is important for students to identify the independent and dependent variables as well as the control.
o In each of these experiments, the change in the rocket design will be the independent variable because changing this variable will result in the rocket flying different distances.
o The dependent variable is the distance the rocket travelled, because it is dependent on the characteristics of the rocket.
o Students can graph this relationship by creating a bar graph of the average flight distance (y axis) of each rocket vs. the type (x axis) of rocket.
o Students must also be aware of which variables need to remain constant in order for the tests to be reliable.
o It is important to identify the control, which is the rocket prior to any change. If students want to change the nose shape, they should first test the rockets
with a standard rocket shape that they will use as the control for the full experiment.
It is important that each variable is tested one at a time. If students want to test both the nose and angle of launch, they should first test the standard nose on the control and then make their changes to test their new design.
To test the angle launch, student must first test their original control with NO changes (no new nose). Next, they will test their chosen different angel with no other changes to the rocket (no new nose).
Design Errors:
• Discuss the two types of errors present in any experiment. o Systematic errors are due to identified causes and can, in principle, be eliminated.
Ex: Incorrect reading of measurements or measurement rounding o Random errors are caused by random circumstances during the measurement process.
Ex: Rocket distance measured or tossed by a different person • Encourage students to identify source of errors to explain why their rocket will not travel the
same distance every trial. Teacher Tips:
• If possible, use ¼” tape for taping the rockets. The smaller size works more easily and can be applied without over-taping areas.
• Do not distribute the straws until all the students are finished with their rocket and you are ready to have the class begin the launches.
• If this is an in-person class, have the students line up in a horizontal line to launch the rockets. If this is a virtual learning class, have students use the soda straw to launch their rocket, following the instruction on the Straw Rocket Templates or the video tutorial.
• Having a launch countdown as a group is always fun!
Credit Resources:
• NASA Engineering in the Classroom • TeachingEngineering
Materials
• Engage: o Video Falcon Heavy Rocket Launch
https://www.bbc.co.uk/news/science-environment-42969020 o Make a Straw Rocket Lab (lesson attachment--fillable slides)
• Explore: o Make a Straw Rocket Lab o Straw Rocket Templates with procedure o Video tutorial
https://www.youtube.com/watch?v=aTd2f59TSVo&t=1s o Student Communication Station on Padlet
• Explain: o Group Discussion on Padlet o Students Make a Straw Rocket Lab o Group presentation and Gallery Walk on Google Jamboard
• Elaborate: o Students Make a Straw Rocket Lab
• Evaluate: o Reflection exit ticket
• Materials needed for rocket: o Sharpened Pencils (1 per person) o Scotch Tape Rolls – 1/4” tape if possible (2 per group) o Drinking Straws (1 per person) o Meter Sticks or Tape Measures (2 per group) o LCD projector and computer with internet access to find pictures or video of rockets
• Materials to be printed or posted in the classroom: o Soda Straw Rocket Template – 1 per student o Soda Straw Rocket Data Log – 1 per pair of students o Soda Straw Rocket Data Analysis Graph – 1 per pair of students o Soda Straw Rocket Analysis – 1 per student
Instruction
Introduction (15 minutes, slide 3)
• Discuss the following prompts with students:

o Launching from Earth into a solar system destination is exciting. How do we know we can get where we want to go?
o What do you know about rockets? o Have you ever observed a rocket launching? If yes, tell the class about it.
• Next, ask the following prompts and allow students to write their answer: o Who is Elon Musk? What is his future plan? o Elon Musk has a plan of landing on Mars, but how do we launch to Mars?
• Play the video Falcon Heavy Rocket Launch. o The video Falcon Heavy Rocket Launch shows SpaceX successfully launching its first two
people into orbit, ushering in a new age of human spaceflight in the United States. • After watching the video, have students draw a model of the rocket launch and write their
observations and questions on a sheet of paper. o The models that the students create should have labels and explanations of systems. o Throughout the unit, be sure to refer to students’ original ideas as more understanding
is reached. o Students will revisit their initial models after they learn and explain how different
factors affect the distance the rocket travels.
Engagement (15 minutes, slide 4)
• Place students in Think-Pair-Share groups: o Individually think: What did you observe from this video, what questions do you have? o Pair: Discuss your observations and questions with your partner. o Share: Share your and partner’s observations and questions with entire class.
• In the Think-Pair-Share groups, have the students discuss the following questions: o What did you notice about the rockets and the launches? Do they have something in
common? Encourage students to draw their observation and explanation on a sheet of paper.
o Look directly at the nose cone of the rocket. Are there any differences? o What would happen if a different cone is used? If it was shorter, longer, or no cone?
• Provide each student with the Make a Straw Rocket Lab. • Direct students to slide 5. • Have students write a hypothesis to the research question, “What would happen to the distance
a rocket will travel if changes were made to the length of a rocket’s nose cone?” • Select a few students to read their hypotheses to the class.
Exploration (30 minutes)
• Place students in groups of four. • Prior to starting the lab, discuss the following questions with students to check for any
misconceptions: o In the scientific inquiry process, after asking questions and forming hypotheses, what
comes next?
o Based on the question you ask, what is the independent variable and what is the dependent variable?
o In this experiment, other than the treatment group, we should have a control group. What’s the purpose of having a control group?
o How should we determine the control group? o To test only the nose cone length, what variables need to remain the same in our
experiment? • Give students the Straw Rocket Template. • Using the Straw Rocket Templates and slides 5-6, instruct students to begin building their
rockets. • Encourage students to create a different rocket and collect the data.
o Each student within the group can build a rocket with a different length of nose cone. o Each will launch a rocket with a certain length for 3 trials and record the distances it
traveled (in centimeters) on the Data Log (slide 7-8.) o Remind students that they should only be testing for ONE variable, so they should
create a standard of tossing and measuring to eliminate errors. Ex: Have students determine one how hard and long they will blow the rocket
when launching. Ex: Have students pick an angle from which the rocket will be shot each time.
o Encourage students to write any observations they want to remember as they perform the investigations (such as direction).
o They can write their observations on their lab (slides).
Construction tips:
• One student can hold the tube tight on the pencil and the other student can apply the tape to the paper tube.
• Students build the rocket on the pencil. Tell them not to remove it from the pencil until you are ready to distribute the straws.
• If this lesson is done virtually, have students communicate in breakout rooms or communication stations on Padlet.
• Remind students they should cut the paper for the rocket body based on the length they decide, which should be between 10 cm to 20 cm.
• See the photo on the next page for the sample Padlet communication station.
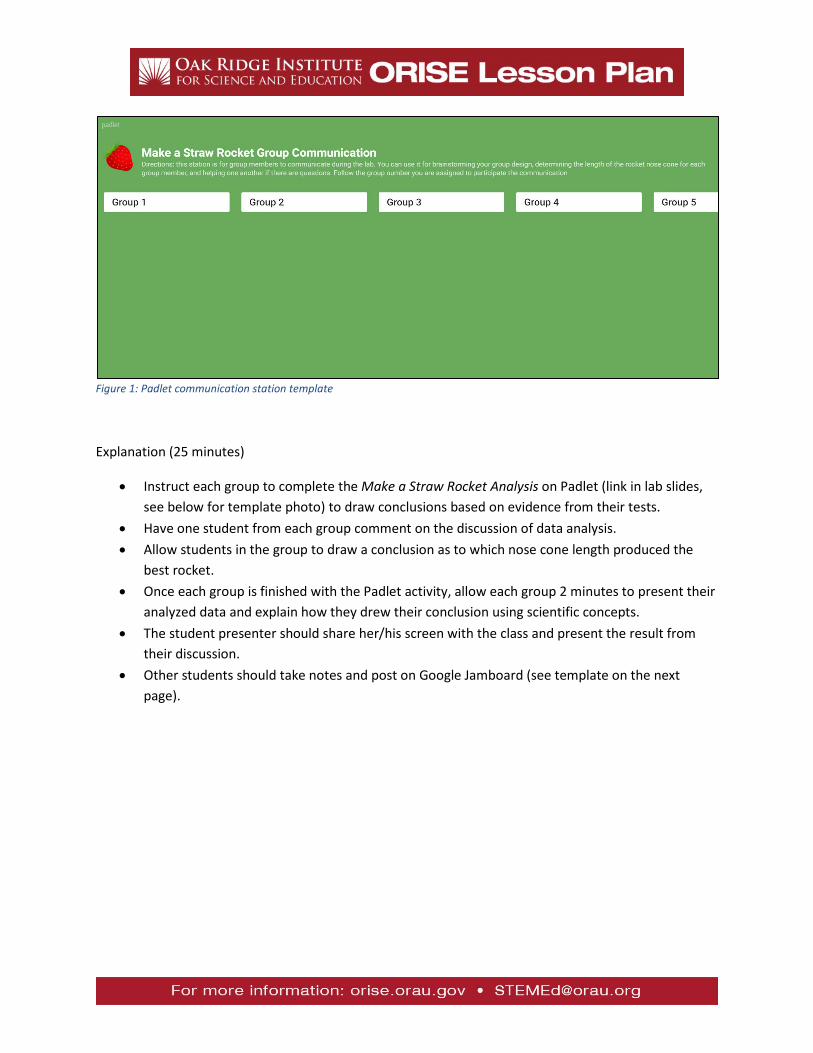
Figure 1: Padlet communication station template
Explanation (25 minutes)
• Instruct each group to complete the Make a Straw Rocket Analysis on Padlet (link in lab slides, see below for template photo) to draw conclusions based on evidence from their tests.
• Have one student from each group comment on the discussion of data analysis. • Allow students in the group to draw a conclusion as to which nose cone length produced the
best rocket. • Once each group is finished with the Padlet activity, allow each group 2 minutes to present their
analyzed data and explain how they drew their conclusion using scientific concepts. • The student presenter should share her/his screen with the class and present the result from
their discussion. • Other students should take notes and post on Google Jamboard (see template on the next
page).
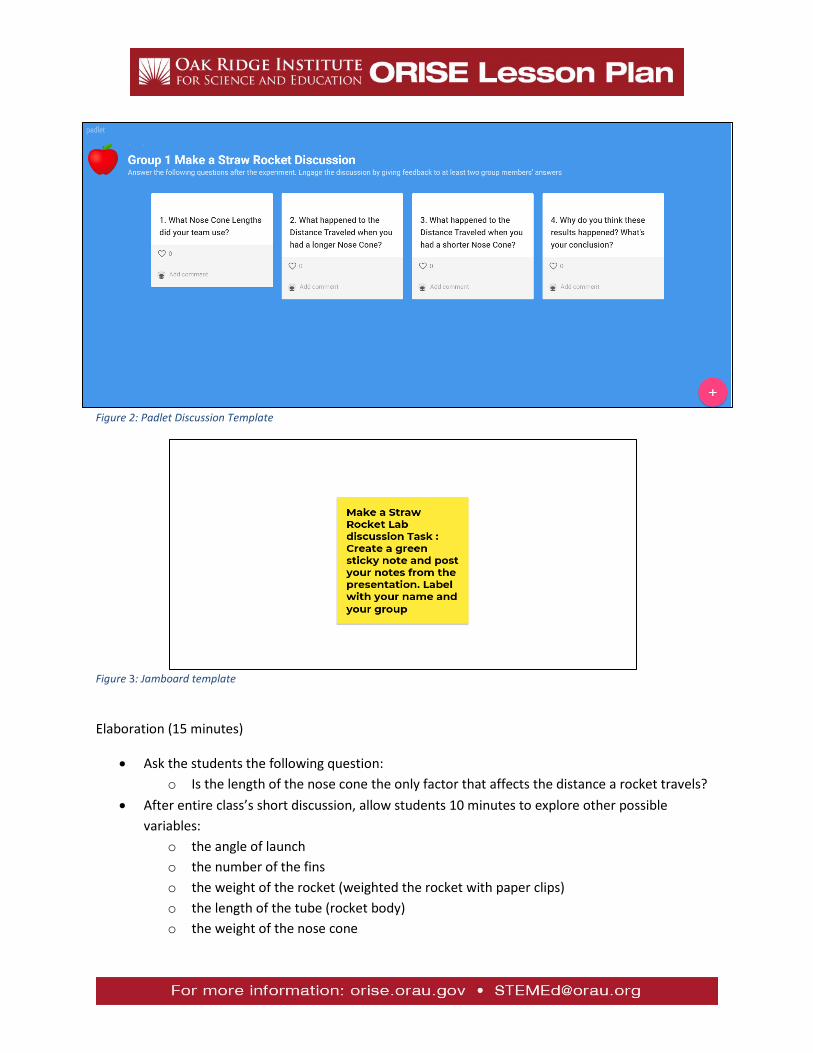
Figure 2: Padlet Discussion Template
Figure 3: Jamboard template
Elaboration (15 minutes)
• Ask the students the following question: o Is the length of the nose cone the only factor that affects the distance a rocket travels?
• After entire class’s short discussion, allow students 10 minutes to explore other possible variables:
o the angle of launch o the number of the fins o the weight of the rocket (weighted the rocket with paper clips) o the length of the tube (rocket body) o the weight of the nose cone
Evaluation (10 minutes)
• Allow students eight minutes to complete the reflection exit ticket. • Cold call two students to summarize today’s learning.
Differentiation
Refer to the PGCPS UDL website to identify specific strategies or technologies to address specific needs of individual students: https://ektron.pgcps.org/UDL/index.aspx?id=129046
Advanced Learners
• Extend the learning by providing further investigation and research. • Have students analyze data to identify the best features in each design that can be compiled
into a new (improved) redesigned solution. • Have students facilitate the discussion and present their work.
English Language Learners
• Provide pictures of each design step for students to follow. • Pair students with native language peer. • Individually help students when needed. Provide copies of the worksheets and instructions in
the student’s L1.
Students with Disabilities
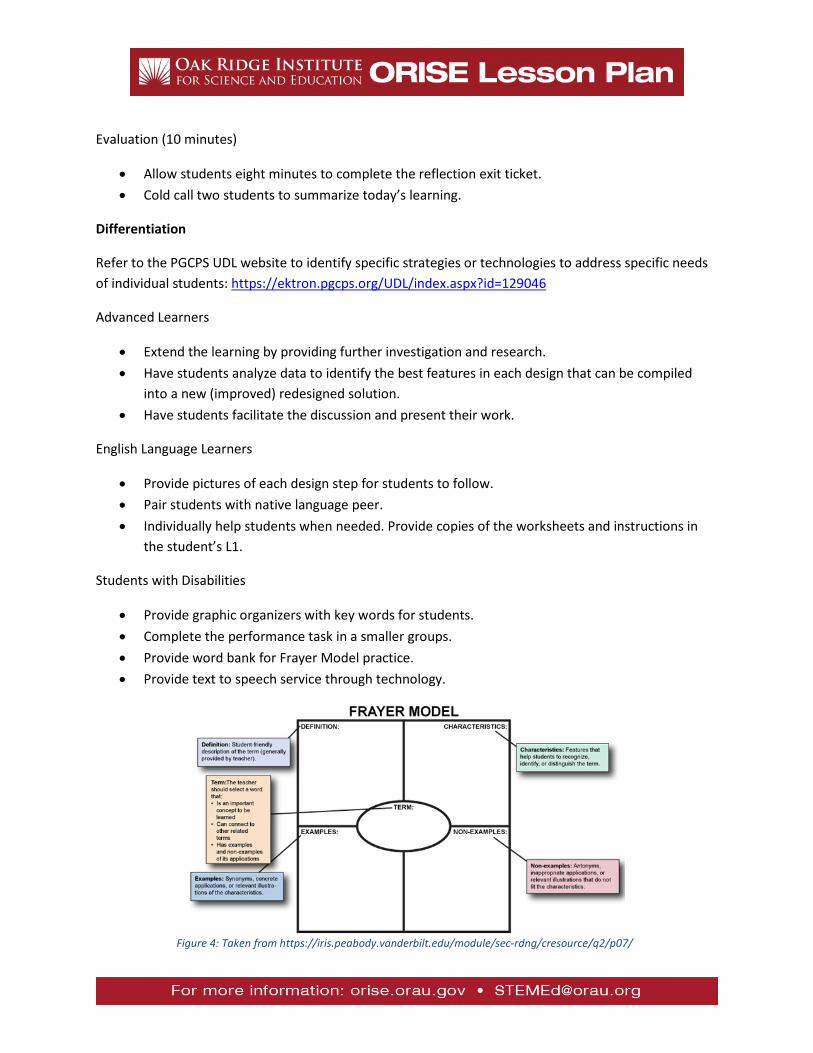
• Provide graphic organizers with key words for students. • Complete the performance task in a smaller groups. • Provide word bank for Frayer Model practice. • Provide text to speech service through technology.
Figure 4: Taken from https://iris.peabody.vanderbilt.edu/module/sec-rdng/cresource/q2/p07/
Assessment Formative assessment:
• Throughout the lesson, the teacher can gauge students’ understanding based on the class discussion responses.
• Activities like the Think-Pair-Share will reveal student thinking to the teacher. • By looking at each student’s drawn model during the introduction, the teacher can understand
students’ prior understanding of the topic. • By looking at the responses on each Padlet and Jamboard, the teacher can check student’s
learning progress throughout the lesson. Summative assessment:
• At the end of the lesson, the students will each turn in their lab individually, which will be scored using the rubric found on slide 13.
• The exit ticket can be used to measure the students’ understanding of the design process and the variables at play in the experiment.

Make a Straw RocketK-12 Students
Create a paper rocket that can be launched from a soda straw – then, modify the design to make the rocket fly farther!
K-12 Students | Make a Straw Rocket Page 1/3
jpl.nasa.gov/edu/learn
MaterialsPencil
Scissors
Tape
Soda straw (plastic or reusable)
Meter stick or measuring tape
Rocket template and data log
1. Cut out and shape the rocket bodyCut out the rectangle. This will be the body tube of the rocket. Wrap the rectangle around a pencil length-wise and tape the rectangle so that it forms a tube.
2. Cut out and attach the finsCut out the two fin units. Align the bottom of the rectangle that extends between the fins with the end of the rocket body, and tape the fin to the body tube. Do the same thing for the other fin on the opposite side, making a “fin sandwich.”
3. Bend the finsBend the fins on each fin unit 90 degrees so that they are each at a right angle to each other. When you look along the back of the rocket, the fins should form a “+” mark.
4. Make and measure the nose coneTwist the top of the body tube into a nose cone around the sharpened end of your pencil. Measure your nose cone from its base to its tip and record the length on the data log and on the rocket itself.
5. Prepare to launch!Remove the pencil and replace it with a soda straw. Be sure your launch area is clear of people and hazards. Then, blow into the straw to launch your rocket! Record the distance the rocket travels on your data log.
FIN
FIN
ROCKET BODY
Make a Straw Rocket Name:Section: Teacher:
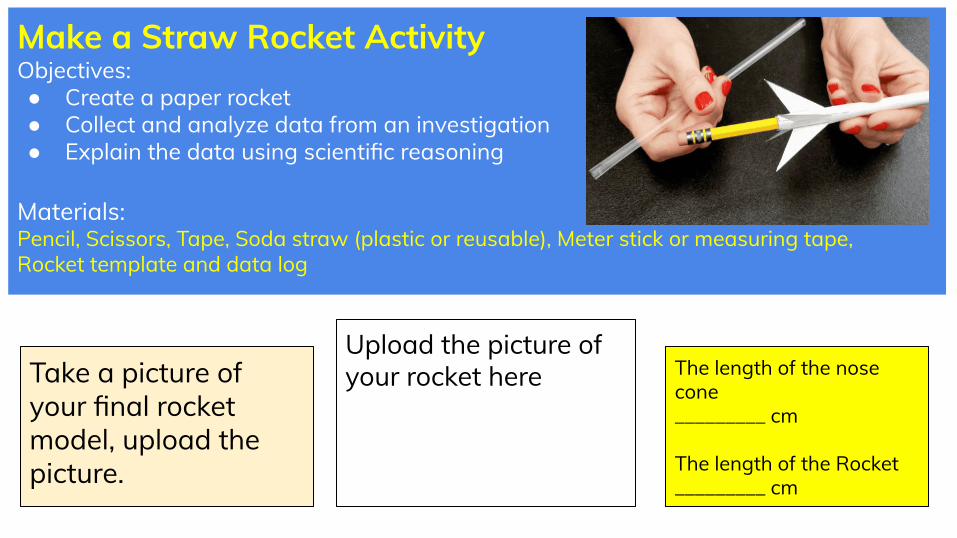
Make a Straw Rocket ActivityObjectives: ● Create a paper rocket● Collect and analyze data from an investigation● Explain the data using scientific reasoning
Materials: Pencil, Scissors, Tape, Soda straw (plastic or reusable), Meter stick or measuring tape, Rocket template and data log
Take a picture of your final rocket model, upload the picture.
Upload the picture of your rocket here The length of the nose
cone_________ cm
The length of the Rocket _________ cm
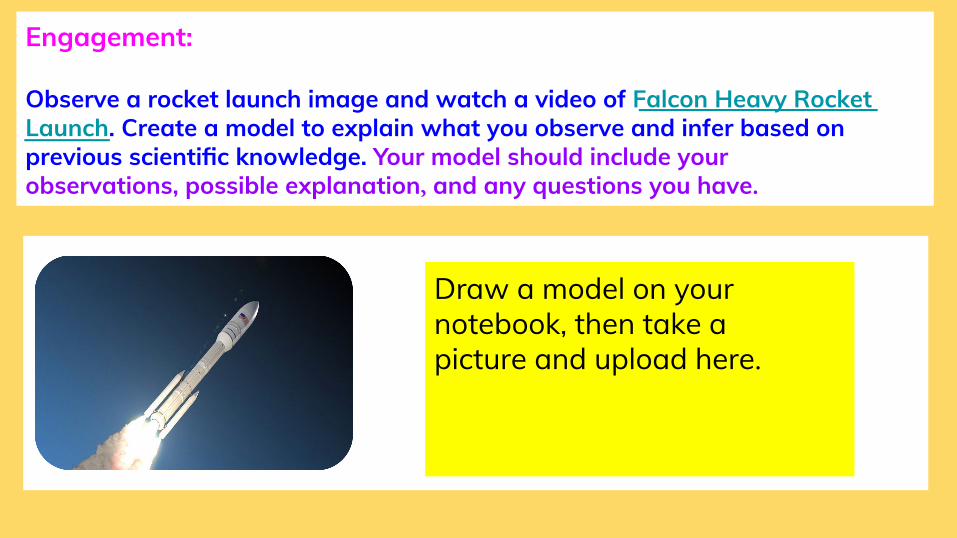
Engagement:
Observe a rocket launch image and watch a video of Falcon Heavy Rocket Launch. Create a model to explain what you observe and infer based on previous scientific knowledge. Your model should include your observations, possible explanation, and any questions you have.
Draw a model on your notebook, then take a picture and upload here.

Think-Pair-Share ● Individually think: What did you observe from this video? What
questions do you have?● Pair: Discuss your observations and questions with your table partner.● Share: Share your and partner’s observations and questions with entire
class.
Background Information:You will build your own straw rockets and test them on the Straw Rocket Launcher. Just like early rocket pioneer Robert Goddard, your team will conduct scientific experiments by varying the design of your rocket.
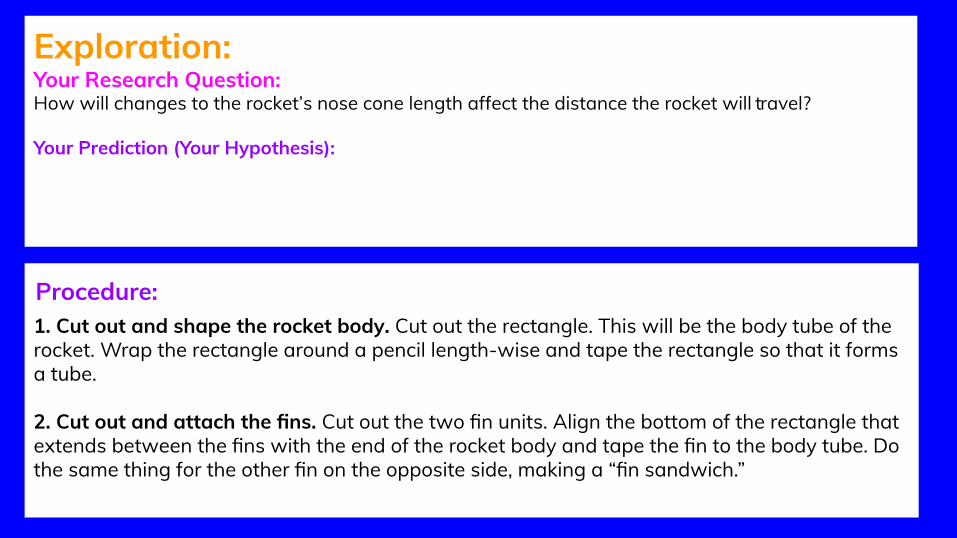
Exploration: Your Research Question:How will changes to the rocket’s nose cone length affect the distance the rocket will travel?
Your Prediction (Your Hypothesis):
1. Cut out and shape the rocket body. Cut out the rectangle. This will be the body tube of the rocket. Wrap the rectangle around a pencil length-wise and tape the rectangle so that it forms a tube.
2. Cut out and attach the fins. Cut out the two fin units. Align the bottom of the rectangle that extends between the fins with the end of the rocket body and tape the fin to the body tube. Do the same thing for the other fin on the opposite side, making a “fin sandwich.”
Procedure:
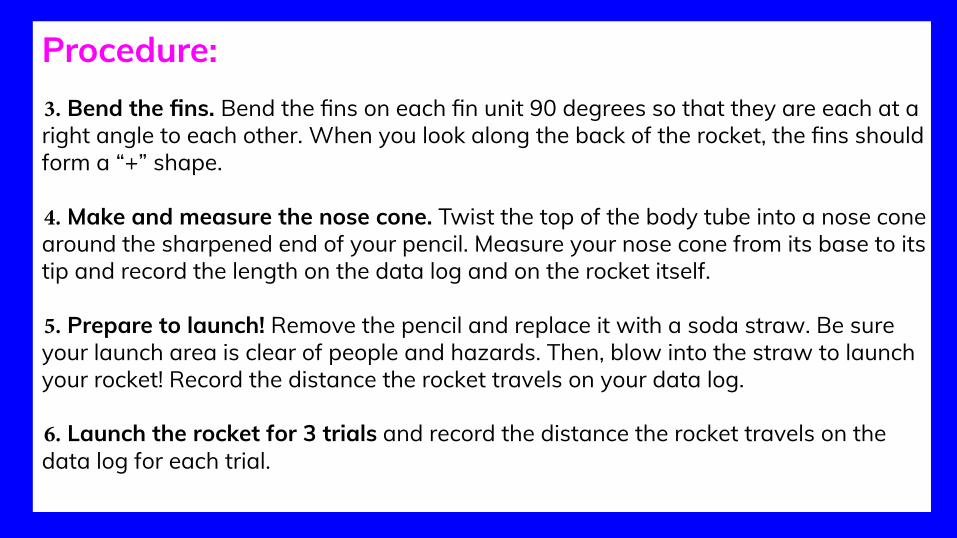
Procedure:3. Bend the fins. Bend the fins on each fin unit 90 degrees so that they are each at a right angle to each other. When you look along the back of the rocket, the fins should form a “+” shape.
4. Make and measure the nose cone. Twist the top of the body tube into a nose cone around the sharpened end of your pencil. Measure your nose cone from its base to its tip and record the length on the data log and on the rocket itself.
5. Prepare to launch! Remove the pencil and replace it with a soda straw. Be sure your launch area is clear of people and hazards. Then, blow into the straw to launch your rocket! Record the distance the rocket travels on your data log.
6. Launch the rocket for 3 trials and record the distance the rocket travels on the data log for each trial.
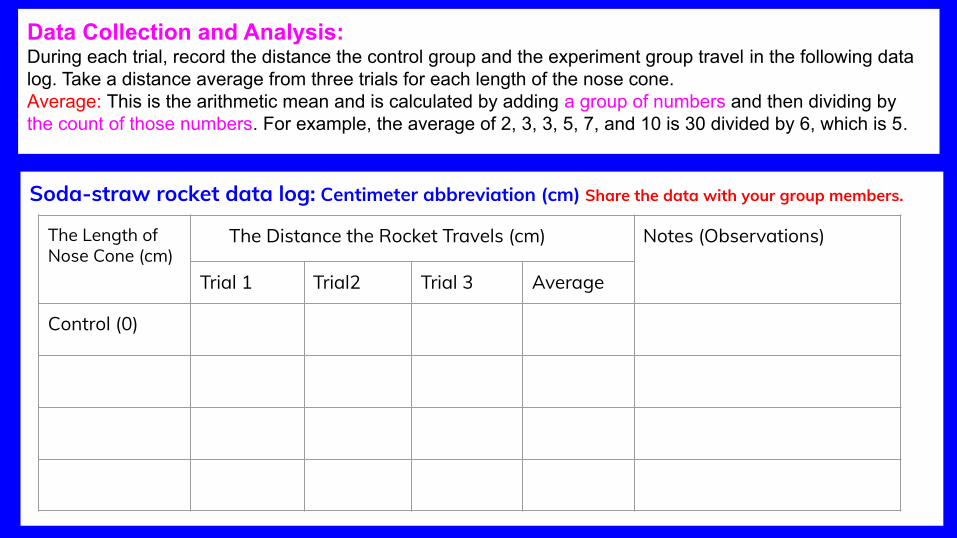
Data Collection and Analysis: During each trial, record the distance the control group and the experiment group travel in the following data log. Take a distance average from three trials for each length of the nose cone. Average: This is the arithmetic mean and is calculated by adding a group of numbers and then dividing by the count of those numbers. For example, the average of 2, 3, 3, 5, 7, and 10 is 30 divided by 6, which is 5.
Soda-straw rocket data log: Centimeter abbreviation (cm) Share the data with your group members.
The Length of Nose Cone (cm)
The Distance the Rocket Travels (cm) Notes (Observations)
Trial 1 Trial2 Trial 3 Average
Control (0)

Graph:
After the teacher’s demo, graph your data from the data table on the Data Analysis Sheet or draw the graph in your notebook.
Take a picture of your graph and upload it here.
Group Discussion:
Have a group discussion on Padlet.
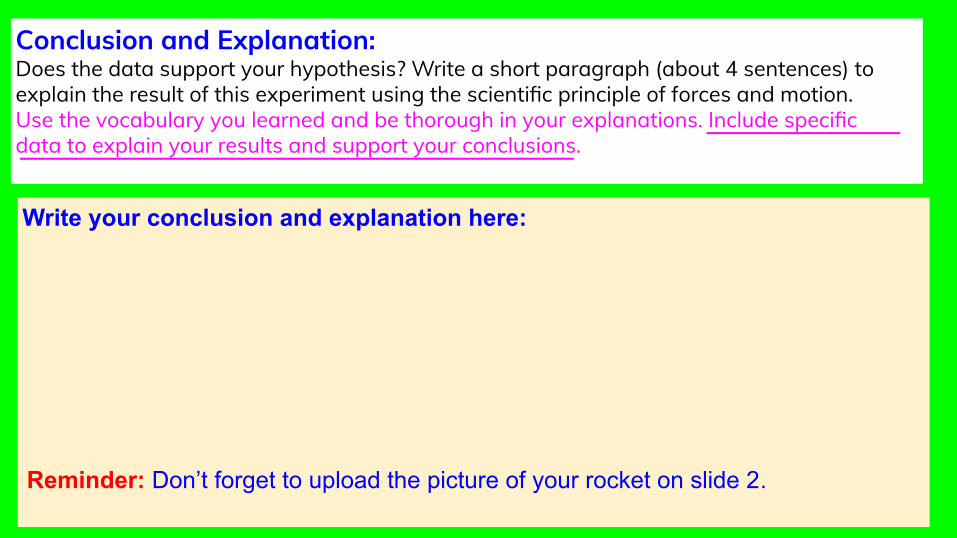
Conclusion and Explanation:Does the data support your hypothesis? Write a short paragraph (about 4 sentences) to explain the result of this experiment using the scientific principle of forces and motion. Use the vocabulary you learned and be thorough in your explanations. Include specific data to explain your results and support your conclusions.
Write your conclusion and explanation here:
Reminder: Don’t forget to upload the picture of your rocket on slide 2.
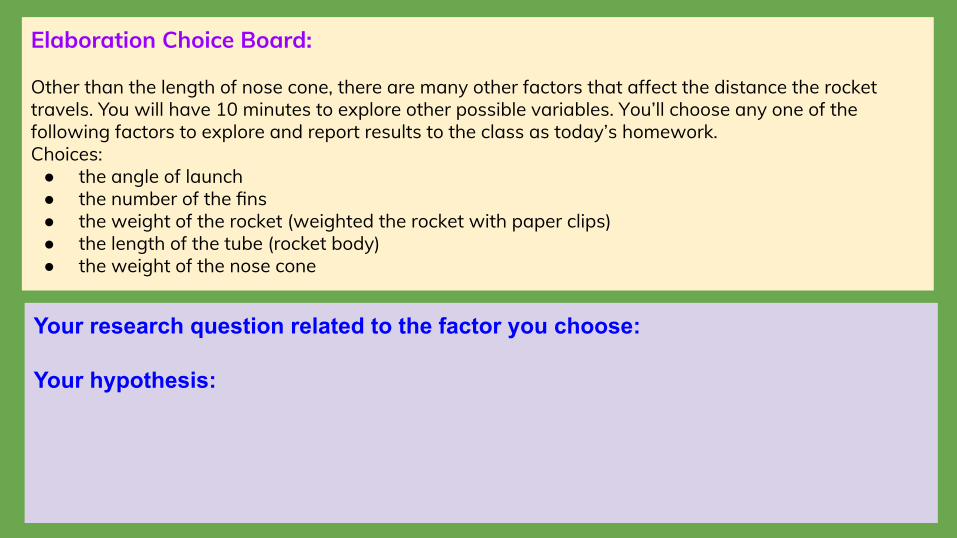
Elaboration Choice Board:
Other than the length of nose cone, there are many other factors that affect the distance the rocket travels. You will have 10 minutes to explore other possible variables. You’ll choose any one of the following factors to explore and report results to the class as today’s homework. Choices:
● the angle of launch● the number of the fins● the weight of the rocket (weighted the rocket with paper clips)● the length of the tube (rocket body)● the weight of the nose cone
Your research question related to the factor you choose:
Your hypothesis:

Data Collection and Analysis for the variable you choose Design an investigation based on your research questions. Conduct the experiment, collect data, take average, and analyze the data. Draw a conclusion here:
Soda-straw rocket data log: Centimeter abbreviation (cm) This part is homework.
The Distance the Rocket Travels (cm) Notes (Observations)
Trial 1 Trial2 Trial 3 Average
The factor you choose
Control (0)

Evaluation:
Complete the Straw Rockets Exit Ticket and turn it in before you leave class.
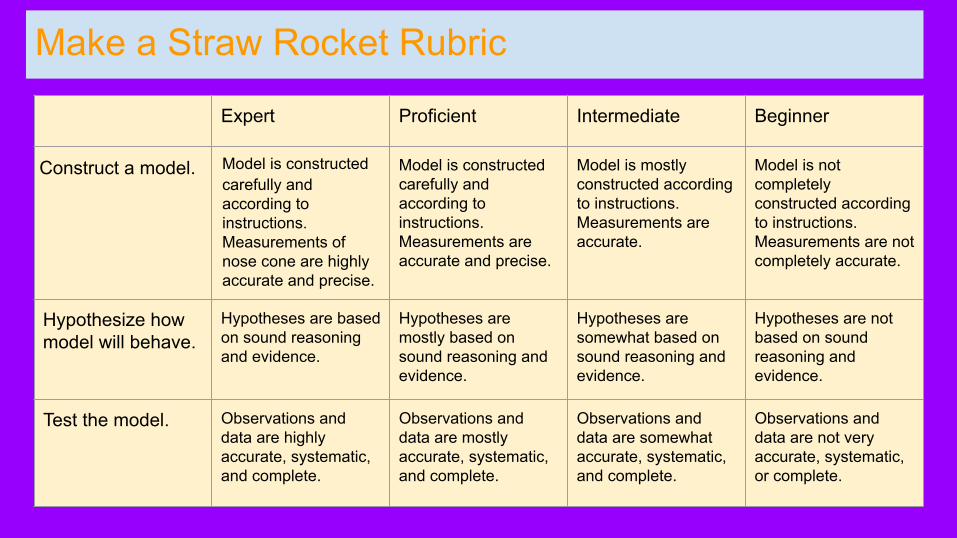
Make a Straw Rocket Rubric
Expert Proficient Intermediate Beginner
Construct a model. Model is constructed carefully and according to instructions. Measurements of nose cone are highly accurate and precise.
Model is constructed carefully and according to instructions. Measurements are accurate and precise.
Model is mostly constructed according to instructions. Measurements are accurate.
Model is not completely constructed according to instructions. Measurements are not completely accurate.
Hypothesize how model will behave.
Hypotheses are based on sound reasoning and evidence.
Hypotheses are mostly based on sound reasoning and evidence.
Hypotheses are somewhat based on sound reasoning and evidence.
Hypotheses are not based on sound reasoning and evidence.
Test the model. Observations and data are highly accurate, systematic, and complete.
Observations and data are mostly accurate, systematic, and complete.
Observations and data are somewhat accurate, systematic, and complete.
Observations and data are not very accurate, systematic, or complete.
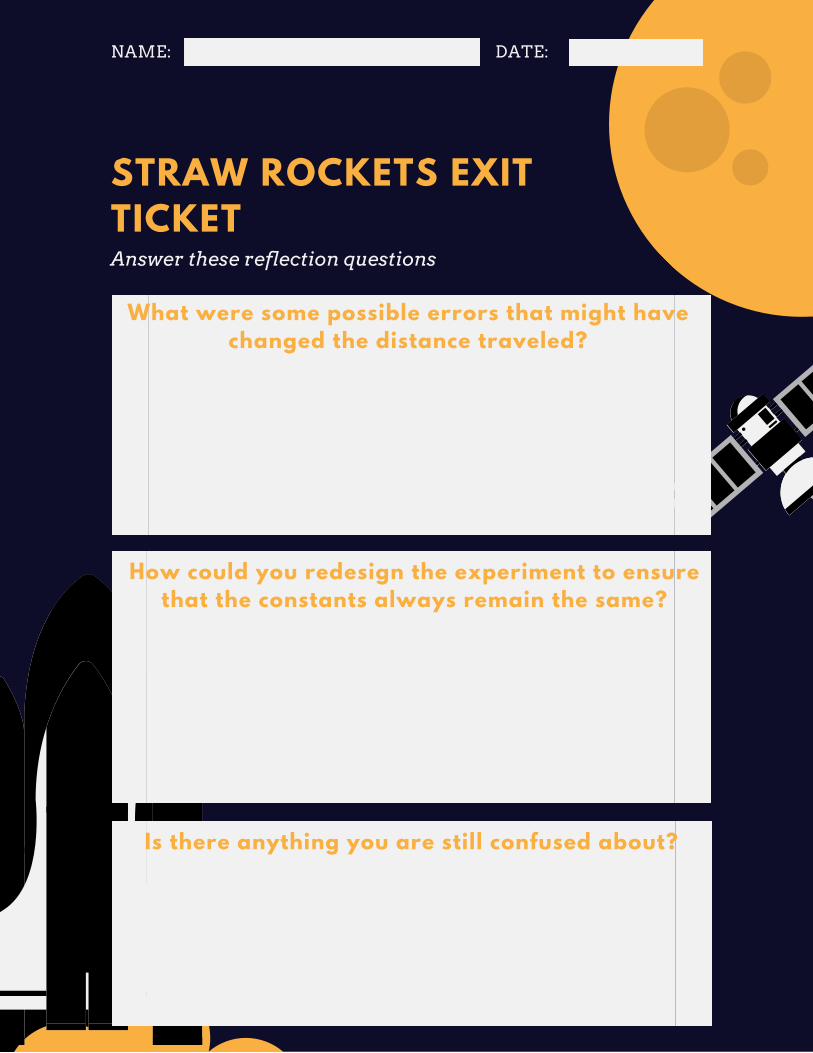
STRAW ROCKETS EXITTICKETAnswer these reflection questions
NAME: DATE:
What were some possible errors that might havechanged the distance traveled?
How could you redesign the experiment to ensurethat the constants always remain the same?
Is there anything you are still confused about?