streamlined annual financial report 2013
TRANSCRIPT

VALUE ACCOUNTS Holdings Limited
Streamlined annual financial report 2013Value Accounts Holdings
17 September 2013
[Draft for discussion purposes]

VALUE ACCOUNTS Holdings Limited
© 2013 PricewaterhouseCoopers. All rights reserved.
PwC refers to the Australian member firm, and may sometimes refer to the PwC network. Each member firm is a separate legal entity. Please see www.pwc.com/structure for further details.
This publication has been prepared for general reference only and does not constitute professional advice. It is not intended to be and is not comprehensive in relation to its subject matter. This publication is not intended to cover all aspects of Australian Accounting Standards, or to be used as a substitute for reading any relevant accounting standard, professional pronouncement or guidance, the Corporations Act 2001 (Cth) or any other relevant material. Specific company structure, facts and circumstances will have a material impact on the preparation and content of financial reports. No person should undertake or refrain from any action based on this publication or otherwise rely on this publication. This publication should not be used as a substitute for consultation with a professional adviser with knowledge of information relevant to your particular circumstances. No representation or warranty (express or implied) is given as to the accuracy or completeness of the information contained in this publication. To the extent permitted by law PwC, its members, employees and agents do not accept or assume any liability, responsibility or duty of care for any use of or reliance on this publication.
Liability is limited by the Accountant’s Scheme under the Professional Standards Legislation.
PwC Australia helps organisations and individuals create the value they’re looking for. We’re a member of the PwC network of firms in 158 countries with close to 169,000 people. We’re committed to delivering quality in assurance, tax and advisory services. Tell us what matters to you and find out more by visiting us at www.pwc.com.au
WL_127006391

PwC VALUE ACCOUNTS Holdings Limited 1
Welcome to our newest addition to the VALUE ACCOUNTS series.
Unlike the other publications in this series, this edition is not intended to be a reference tool. Instead, we want to create a discussion around the effectiveness of financial reporting, and how it can be improved.
It is widely accepted that financial reports are too complex. This is being driven by several factors:
• The ‘checklist’ approach taken by many current accounting standards, which list detailed disclosures rather than relying on broad disclosure objectives
• Relevant information being obscured by large amounts of standing data and boilerplate disclosures
• A strong focus on completeness of disclosures by auditors and regulators alike, which discourages preparers from considering materiality and relevance when preparing their financial statements.
We would like to demonstrate what entities could do right now to improve the readability and relevance of their financial statements, while still complying with all applicable accounting standards and the Corporations Act 2001. At the same time, we want to demonstrate where the present accounting regime constrains entities from taking what we believe would be a more effective approach.
This is not meant to be a final answer, but a first step in what we believe is the right direction. We welcome your involvement in the discussion – please contact us on [email protected]
I hope that this publication will create vigorous debate and provide entities with useful ideas of how to improve their own financial statements.
Jan McCahey Partner PwC Australia September 2013
Foreword
PwC

PwC VALUE ACCOUNTS Holdings Limited 2
This publication presents illustrative general purpose financial statements of a fictitious listed company, VALUE ACCOUNTS Holdings Limited.
This publication illustrates how financial statements and associated notes could be restructured to make the statements more relevant and accessible, while still complying with Australian laws and standards. It is not intended to be a comprehensive collection of illustrative disclosures for all possible circumstances, but as a basis for discussion on effective financial reporting.
Focusing on material and relevant information
The main body of the notes now only includes information that is material and relevant to the operations and the financial position and performance of VALUE ACCOUNTS Holdings Limited. Information is considered material and relevant if:
• the amount in question is significant because of its size or its nature• it is important to understanding the results of the company • it helps to explain the impact of significant changes in our business – for example, our acquisitions
and impairment write-downs • it relates to an aspect of our operations that is important to our future performance.
Information about items that are material but not relevant (eg financial assets at fair value through profit or loss, available-for-sale financial assets and equity-accounted investments) is provided in the Appendix. Information that is not material has been removed. However, judgements about materiality will not be the same for every company. For example, a company with significant related party transactions or share-based payments may need to place information on those items more prominently that we have done in this example.
We have also included additional information where we felt it was important for an understanding of the performance of the company. In particular, we have included a net debt reconciliation in note A3(d), even though this disclosure is not currently required.
How the illustrative statements were prepared
The main body of the notes now only includes information that is material and relevant

PwC VALUE ACCOUNTS Holdings Limited 3
How the notes to the financial statements are organised
The notes which provide the information needed to understand the financial statements are organised into the following sections.
The notes have been reorganised so that related items are disclosed together
Related items are disclosed together: for example, information about financial assets and financial liabilities is disclosed in one section, and information about non-financial assets and non-financial liabilities in another.
Information that is more critical to understanding the performance of the group is presented prominently. Information about the composition of the group as a whole (business combinations and discontinued operations) is presented in a separate section. Segment information is provided upfront, as we consider this to be the most important disclosure for users.
The presentation in these illustrative financial statements does not follow the order of notes suggested in AASB 101 Presentation of Financial Statements. However, the language in the standard is not prescriptive and we believe it is not mandatory to follow the suggested order. We also note that the IASB is considering removing the guidance on note order from the equivalent international standard, IAS 1.
Please note that the amounts disclosed in this publication are purely for illustrative purposes and may not necessarily be consistent throughout the publication.
A How numbers are calculated
B Risk
C Group structure
D Unrecognised items
Appendix

PwC VALUE ACCOUNTS Holdings Limited 4
VALUE ACCOUNTS Holdings LimitedABN XY XYZ XYZ XYZ
Annual financial statements – 30 June 2013

PwC VALUE ACCOUNTS Holdings Limited 5
Contents (1 of 2 pages)
Consolidated income statement 7
Consolidated statement of comprehensive income
8
Consolidated balance sheet 9
Consolidated statement of changes in equity
11
Consolidated statement of cash flows 13
C1 Business combination 70
C2 Discontinued operation 72
C3 Non-controlling interests 74
C4 Joint operation 75
Significant changes in the current reporting period
17 Variation from preliminary financial report
17
D1 Contingent liabilities 77
D2 Contingent assets 77
D3 Commitments 77
D4 Unrecognised tax amounts 78
D5 Debt defeasance 79
D6 Events occurring after the reporting period
79
D7 Non-cash investing and financing activities
81
A1 Segment information 19
A2 Profit and loss information 25
A3 Financial assets and financial liabilities
30
A4 Non-financial assets and liabilities
41
A5 Contributed equity 51
B1 Critical estimates, judgements and errors
55
B2 Financial risks 57
B3 Capital management 67

PwC VALUE ACCOUNTS Holdings Limited 6
Contents (2 of 2 pages)
E1 Profit and loss information 87
E2 Other financial assets and financial liabilities
90
E3 Other non-financial assets and liabilities
94
E4 Assets and liabilities classified as held for sale
101
E5 Other reserves 102
E6 Retained earnings 105
E7 Reconciliation of profit after income tax to net cash inflow from operating activities
106
F1 Related party transactions 108
F2 Significant subsidiaries 110
F3 Key management personnel disclosures
110
F4 Share-based payments 116
F5 Remuneration of auditors 120
F6 Assets pledged as security 121
F7 Deed of cross guarantee 122
F8 Parent entity financial information 124
F9 Summary of accounting policies 125
VALUE ACCOUNTS Holdings Limited is a company limited by shares, incorporated and domiciled in Australia. Its registered office and principal place of business is:
VALUE ACCOUNTS Holdings Limited 350 Harbour Street Sydney NSW 2000.
All press releases, financial reports and other information are available at our Shareholders’ Centre on our website: www.valueaccounts.com.au.
These financial statements were authorised for issue by the directors on 23 August 2013. The directors have the power to amend and reissue the financial statements.

PwC VALUE ACCOUNTS Holdings Limited 7
Income statement
Notes2013
$’0002012
$’000
Revenue from continuing operations A1 Sale of goods A2(a) 117,200 80,540
Services A2(a) 80,450 60,900
Other revenue A2(a) 14,890 15,840
212,540 157,280
Other income E1(a) 6,573 2,281
Expenses A2(b), E1(b)
Cost of sales of goods (49,096) (42,290)
Cost of providing services (53,253) (36,364)
Other expenses from ordinary activities
Distribution (25,544) (16,585)
Marketing (14,475) (8,510)
Occupancy (3,516) (2,410)
Administration (8,275) (5,610)
Other (4,124) (1,327)
Finance costs E1(b) (7,335) (6,194)
Share of net profit of associates and joint venture entity accounted for using the equity method E2(d) 450 370
Profit before income tax 53,945 40,641
Income tax expense A2(c) (17,075) (11,889)
Profit from continuing operations 36,870 28,752
Profit from discontinued operation C2 715 399
Profit for the period 37,585 29,151
Profit is attributable to:
Owners of VALUE ACCOUNTS Holdings Limited 34,580 26,832
Non-controlling interests 3,005 2,319
37,585 29,151
Cents Cents
Earnings per share for profit from continuing operations attributable to the ordinary equity holders of the company: E1(c) Basic earnings per share 64.9 51.1
Diluted earnings per share 63.8 50.9
Earnings per share for profit attributable to the ordinary equity holders of the company: E1(c) Basic earnings per share 66.3 51.8
Diluted earnings per share 65.1 51.7
The above consolidated income statement should be read in conjunction with the accompanying notes.
PwC VALUE ACCOUNTS Holdings Limited 8
Statement of comprehensive income
Notes2013
$’0002012
$’000
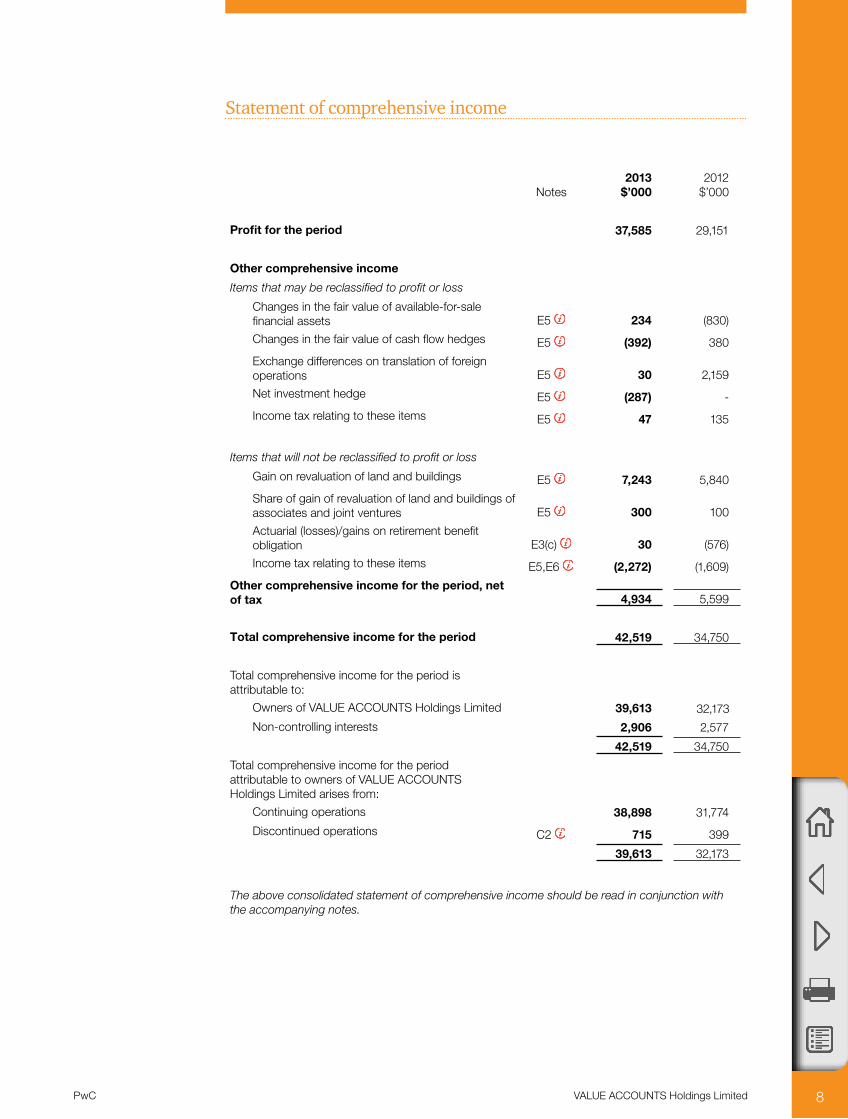
Profit for the period 37,585 29,151
Other comprehensive income
Items that may be reclassified to profit or loss
Changes in the fair value of available-for-sale financial assets E5 234 (830)
Changes in the fair value of cash flow hedges E5 (392) 380
Exchange differences on translation of foreign operations E5 30 2,159
Net investment hedge E5 (287) -
Income tax relating to these items E5 47 135
Items that will not be reclassified to profit or loss
Gain on revaluation of land and buildings E5 7,243 5,840
Share of gain of revaluation of land and buildings of associates and joint ventures E5 300 100
Actuarial (losses)/gains on retirement benefit obligation E3(c) 30 (576)
Income tax relating to these items E5,E6 (2,272) (1,609)
Other comprehensive income for the period, net of tax 4,934 5,599
Total comprehensive income for the period 42,519 34,750
Total comprehensive income for the period is attributable to:
Owners of VALUE ACCOUNTS Holdings Limited 39,613 32,173
Non-controlling interests 2,906 2,577
42,519 34,750
Total comprehensive income for the period attributable to owners of VALUE ACCOUNTS Holdings Limited arises from:
Continuing operations 38,898 31,774
Discontinued operations C2 715 399
39,613 32,173
The above consolidated statement of comprehensive income should be read in conjunction with the accompanying notes.

PwC VALUE ACCOUNTS Holdings Limited 9
Balance sheet
Notes2013
$’0002012
$’000
1 July 2011
$’000 *
ASSETS Current assets
Cash and cash equivalents E2(a) 45,407 24,693 17,095
Trade and other receivables A3(a) 18,935 12,184 8,243
Inventories A4(a) 22,153 16,672 13,700
Financial assets at fair value through profit or loss E2(b) 11,300 10,915 10,370
Derivative financial instruments B2 1,088 640 -98,883 65,104 49,408
Assets classified as held for sale E4 250 4,955 -
Total current assets 99,133 70,059 49,408
Non-current assets
Receivables A3(a) 2,476 1,380 6,011
Investments accounted for using the equity method E2(d) 3,775 3,275 3,025
Available-for-sale financial assets E2(c) 11,110 5,828 5,997
Held-to-maturity investments 1,210 - -
Derivative financial instruments B2 308 712 -
Property, plant and equipment A4(b) 132,095 100,080 88,145
Investment properties E3(a) 13,300 10,050 8,205
Deferred tax assets E3(b) 7,107 4,675 3,490
Intangible assets A4(c) 24,550 20,945 20,910
Total non-current assets 195,931 146,945 135,783
Total assets 295,064 217,004 185,191
LIABILITIES
Current liabilities
Trade and other payables A3(b) 16,700 12,477 12,930
Borrowings A3(c) 8,980 8,555 7,869
Derivative financial instruments B2 610 621 289
Current tax liabilities 1,737 1,117 989
Provisions A4(d) 3,162 1,710 1,170
Deferred revenue A2(a) 2,395 2,370 2,290
33,584 26,850 25,537
Liabilities directly associated with assets classified as held for sale - 500 -
Total current liabilities 33,584 27,350 25,537
* See note B1(b) for details regarding the restatement as a result of an error.

PwC VALUE ACCOUNTS Holdings Limited 10
Balance sheet (continued)
Notes2013
$’0002012
$’000
1 July 2011
$’000 *
Non-current liabilities
Borrowings A3(c) 91,464 61,525 58,250
Deferred tax liabilities E3(b) 12,736 6,638 3,811
Provisions A4(d) 3,443 2,270 2,196
Retirement benefit obligations E3(c) 3,225 1,532 1,215
Total non-current liabilities 110,868 71,965 65,472
Total liabilities 144,452 99,315 91,009
Net assets 150,612 117,689 94,182
EQUITY
Contributed equity A5 75,063 63,426 62,368
Other reserves E5 16,927 11,545 5,479
Retained earnings E6 49,160 37,029 21,395
Capital and reserves attributable to owners of VALUE ACCOUNTS Holdings Limited 141,150 112,000 89,242
Non-controlling interests 9,462 5,689 4,940
Total equity 150,612 117,689 94,182
* See note B1(b) for details regarding the restatement as a result of an error.
The above consolidated balance sheet should be read in conjunction with the accompanying notes.
11VALUE ACCOUNTS Holdings LimitedPwC
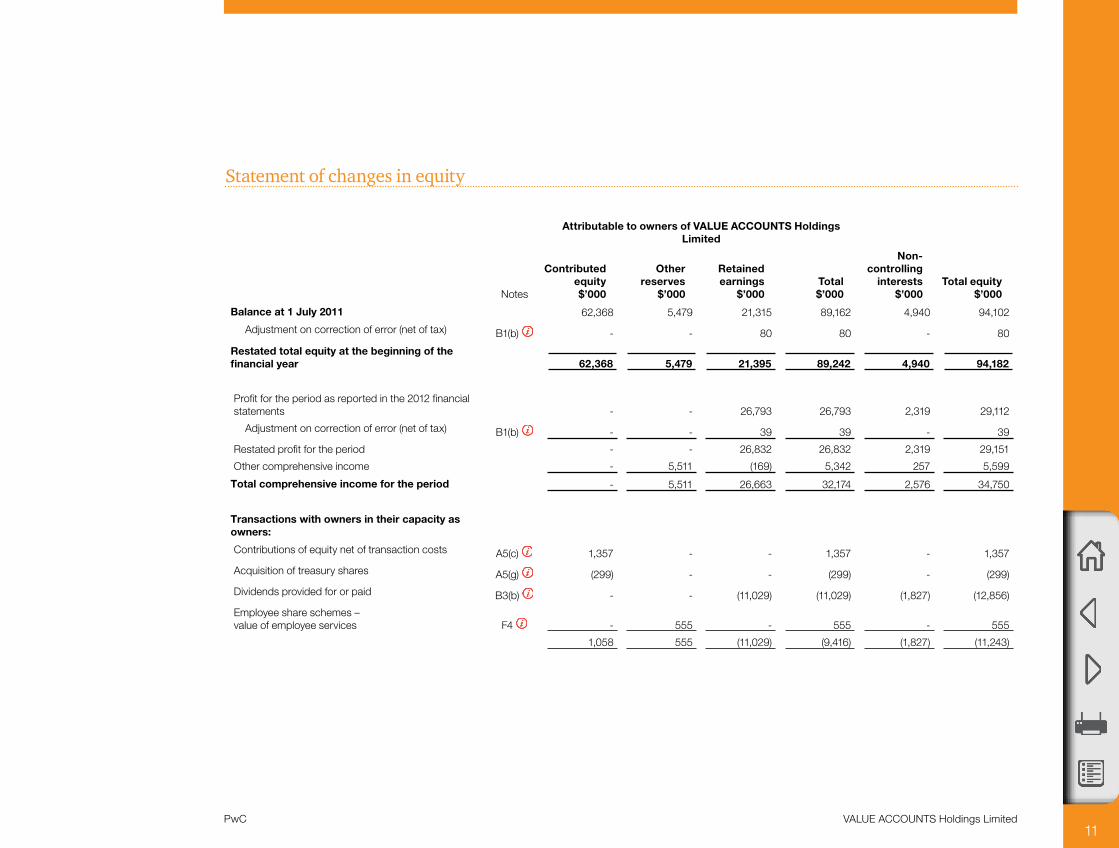
Statement of changes in equity
Attributable to owners of VALUE ACCOUNTS Holdings Limited
Notes
Contributed equity $’000
Other reserves
$’000
Retained earnings
$’000Total $’000
Non- controlling
interests $’000
Total equity $’000
Balance at 1 July 2011 62,368 5,479 21,315 89,162 4,940 94,102
Adjustment on correction of error (net of tax) B1(b) - - 80 80 - 80
Restated total equity at the beginning of the financial year 62,368 5,479 21,395 89,242 4,940 94,182
Profit for the period as reported in the 2012 financial statements - - 26,793 26,793 2,319 29,112
Adjustment on correction of error (net of tax) B1(b) - - 39 39 - 39
Restated profit for the period - - 26,832 26,832 2,319 29,151
Other comprehensive income - 5,511 (169) 5,342 257 5,599
Total comprehensive income for the period - 5,511 26,663 32,174 2,576 34,750
Transactions with owners in their capacity as owners:
Contributions of equity net of transaction costs A5(c) 1,357 - - 1,357 - 1,357
Acquisition of treasury shares A5(g) (299) - - (299) - (299)
Dividends provided for or paid B3(b) - - (11,029) (11,029) (1,827) (12,856)
Employee share schemes – value of employee services F4 - 555 - 555 - 555
1,058 555 (11,029) (9,416) (1,827) (11,243)

12VALUE ACCOUNTS Holdings LimitedPwC
Attributable to owners of VALUE ACCOUNTS Holdings Limited
Notes
Contributed equity $’000
Other reserves
$’000
Retained earnings
$’000Total $’000
Non- controlling
interests $’000
Total equity $’000
Balance at 30 June 2012 63,426 11,545 37,029 112,000 5,689 117,689
Profit for the period - - 34,580 34,580 3,005 37,585
Other comprehensive income - 4,788 245 5,033 (99) 4,934
Total comprehensive income for the period - 4,788 34,825 39,613 2,906 42,519
Transactions with owners in their capacity as owners:
Contributions of equity, net of transaction costs and tax A5(c) 10,836 - - 10,836 - 10,836
Acquisition of treasury shares A5(g) (1,217) - - (1,217) - (1,217)
Buy-back of preference shares, net of tax A5(l) (1,523) - 143 (1,380) - (1,380)
Value of conversion rights on convertible notes A3(c) 2,450 - - 2,450 - 2,450
Non-controlling interests on acquisition of subsidiary - - - - 5,051 5,051
Transactions with non-controlling interests C3(b) - (333) - (333) (1,167) (1,500)
Dividends provided for or paid B3(b) - - (22,837) (22,837) (3,017) (25,854)
Employee share schemes – value of employee services F4 - 2,018 - 2,018 - 2,018
Issue of treasury shares to employees A5(g) 1,091 (1,091) - - - -
11,637 594 (22,694) (10,463) 867 (9,596)
Balance at 30 June 2013 75,063 16,927 49,160 141,150 9,462 150,612
The above consolidated statement of changes in equity should be read in conjunction with the accompanying notes.
Statement of changes in equity (continued)

13VALUE ACCOUNTS Holdings LimitedPwC
Statement of cash flows
Notes2013
$’0002012
$’000Cash flows from operating activities Receipts from customers (inclusive of goods and services tax) 195,202 144,693Payments to suppliers and employees (inclusive of goods and services tax) (142,322) (105,506)
52,880 39,187Payments for financial assets at fair value through profit or loss (135) (1,235)Proceeds from disposal of financial assets at fair value through profit or loss 600 -Insurance recovery relating to fire 300 -Transaction costs relating to acquisition of subsidiary C1(a) (750) -Other revenue 7,490 7,484Interest paid (6,617) (4,044)Income taxes paid (16,442) (12,326)Net cash inflow from operating activities E7 37,326 29,066
Cash flows from investing activities Payment for acquisition of subsidiary, net of cash acquired C1(b) (12,815) -Payments for property, plant and equipment A4(b) (25,387) (17,602)Payments for investment property E3(a) (1,900) -Payments for available-for-sale financial assets E2(c) (4,447) (933)Payments for held-to-maturity investments (1,210) -Payment of development costs (880) (720)Loans to related parties F1 (1,180) (730)Proceeds from sale of machinery hire division C2(b) 2,860 -Proceeds from sale of property, plant and equipment A4(b) 4,585 639Proceeds from sale of available-for-sale financial assets E2(c) 1,375 272Repayment of loans by related parties F1 469 626Joint venture entity distributions received E2(d) 110 120Dividends received 3,350 4,400Interest received 4,350 4,300Net cash (outflow) from investing activities (30,720) (9,628)

14VALUE ACCOUNTS Holdings LimitedPwC
Notes2013
$’0002012
$’000Cash flows from financing activities Proceeds from issues of shares and other equity securities A5(c) 12,413 -Proceeds from calls on shares and calls in arrears A5(c) 1,500 -Proceeds from borrowings A3(c) 45,903 26,746Payments for shares bought back A5(l) (1,350) -Payments for shares acquired by the VALUE ACCOUNTS Employee Share Trust A5(g) (1,217) (299)Share issue and buy-back transaction costs A5(l) (245) -Repayment of borrowings A3(c) (16,135) (24,835)Finance lease payments A3(c) (125) -Transactions with non-controlling interests C3(b) (1,500) -Dividends paid to company’s shareholders B3(b) (22,271) (10,470)Dividends paid to non-controlling interests in subsidiaries (3,017) (1,828)Net cash inflow (outflow) from financing activities 13,956 (10,686)
Net increase (decrease) in cash and cash equivalents 20,562 8,752Cash and cash equivalents at the beginning of the financial year 22,443 13,475Effects of exchange rate changes on cash and cash equivalents (248) 216Cash and cash equivalents at end of year 42,757 22,443
Non-cash financing and investing activities D7
The above consolidated statement of cash flows should be read in conjunction with the accompanying notes.
Statement of cash flows (continued)

PwC VALUE ACCOUNTS Holdings Limited 15
Notes to the financial statements

PwC VALUE ACCOUNTS Holdings Limited 16
Notes to the financial statements
These are the consolidated financial statements of VALUE ACCOUNTS Holdings Limited and its subsidiaries. A list of major subsidiaries is included in the Appendix.
The financial statements are presented in the Australian currency.
The notes are set out in the following main sections:
A How numbers are calculated: provides a breakdown of those individual line items in the financial statements that the directors consider most relevant in the context of the operations of the group, or where there have been significant changes that required specific explanations; the section further explains what accounting policies have been applied to determine these line items and how the amounts were affected by significant estimates and judgements made in calculating the final numbers.
B Risk: discusses the group’s exposure to various financial risks, explain how these affect the group’s financial position and performance and what the group does to manage these risks.
C Group structure: explains significant aspects of the group structure and how changes have affected the financial position and performance of the group.
D Unrecognised items: provides information about items that are not recognised in the financial statements but could potentially have a significant impact on the group’s financial position and performance.
Appendix: Information that the directors do not consider to be relevant to understanding the financial performance and position of the group, but that must be disclosed to comply with the accounting standards and other pronouncements is included here. The Appendix also lists all of the significant accounting policies applied in the preparation of these financial statements. It is grouped into two sections:
Section E provides information about the basis of calculation of line items in the financial statements that the directors do not consider significant in the context of the group’s operations.
Section F covers other information that is not directly related to specific line items in the financial statements, including information about related party transactions, share-based payments, assets pledged as security and other statutory information.

PwC VALUE ACCOUNTS Holdings Limited 17PwC
Significant changes in the current reporting period
The financial position and performance of the group was particularly affected by the following events and transactions during the reporting period:
z The opening of a chain of furniture retail stores by VALUE ACCOUNTS Retail Limited since July 2012. This resulted in increased inventory levels as at June 2013 and the recognition of leasehold improvements for the furnishings in the stores.
z The acquisition of VALUE ACCOUNTS Electronics Pty Ltd in October 2012 which resulted in an increase in property, plant and equipment and the recognition of goodwill and other intangible assets.
z The sale of the machinery hire division in August 2012.
z A fire in Maitland in September 2012 which resulted in the impairment of a number of assets.
z A review of the furniture manufacturing operations which resulted in redundancies and a goodwill impairment charge.
For a detailed discussion of the group’s performance and financial position please refer to our operating and financial review on pages [x] to [y].
Variation from preliminary final report
After the release of the company’s preliminary report to the ASX, a subsidiary settled a number of product warranty claims made during the year. The cost of settling these claims was considerably less than had been anticipated when the preliminary results were announced. This saving has been reflected in the final results which show a consolidated profit of $1,229,000 greater than previously announced.

PwC VALUE ACCOUNTS Holdings Limited 18
A How numbers are calculated Provides a breakdown of those individual line items in the
financial statements that the directors consider most relevant
in the context of the operations of the group, or where
there have been significant changes that required specific
explanations; the section further explains what accounting
policies have been applied to determine these line items and
how the amounts were affected by significant estimates and
judgements made in calculating the final numbers.
A1 Segment information 19
A2 Profit and loss information 25
A3 Financial assets and financial liabilities 30
A4 Non-financial assets and liabilities 41
A5 Contributed equity 51
PwC VALUE ACCOUNTS Holdings Limited 19
This section provides additional information about those individual line items in the financial statements that the directors consider most relevant in the context of the operations of the entity, including:
(a) Accounting policies that are relevant for an understanding of the items recognised in the financial statements. These cover situations where the accounting standards either allow a choice or do not deal with a particular type of transaction.
(b) Analysis and sub-totals, including segment information.
(c) Information about estimates and judgements made in relation to particular items.
A1 Segment information
(a) Description of segments
The group’s strategic steering committee examines the group’s performance both from a product and geographic perspective and has identified six reportable segments of its business:
1,2: Furniture manufacturing – Australia and Indonesia: this part of the business manufactures and sells commercial office furniture, hardwood side boards, chairs and tables in Australia and Indonesia. The committee monitors the performance in those two regions separately.
3 Furniture retail – since July 2012, the manufacturing business has been supplemented by a chain of retail stores in Australia.
4,5 IT consulting – business IT management, design, implementation and support services are provided in Australia and in a number of South-East Asian countries. Performance is monitored separately for those two regions.
6 Electronic equipment – Although this part of the business is not large enough to be required to be reported under the accounting standards, it has been included here as it is seen as a potential growth segment which is expected to materially contribute to group revenue in the future. This segment was established following the acquisition of VALUE ACCOUNTS Electronics Pty Ltd in October 2012.
All other segments – The development of residential land, currently in the Koolabah Estate in Queensland and the Eureka Estate in New South Wales, the purchase and resale of commercial properties, principally in Brisbane and Sydney and the management of investment properties are not reportable operating segments, as they are not separately included in the reports provided to the strategic steering committee. The results of these operations are included in the ‘all other segments’ column.
The machinery hire division was sold effective from 1 September 2012.
A How numbers are calculated

20VALUE ACCOUNTS Holdings LimitedPwC
(b) Segment results
Furniture – manufacture
Furniture - retail IT consulting
Electronic equipment
All other segments TotalAustralia Indonesia Australia Australia
South – East Asia Australia
2013 $’000 $’000 $’000 $’000 $’000 $’000 $’000 $’000
Total segment revenue 55,100 35,100 31,600 33,300 16,900 13,850 16,600 202,450
Inter-segment revenue (1,200) (700) (900) (800) (300) (500) (400) (4,800)
Revenue from external customers 53,900 34,400 30,700 32,500 16,600 13,350 16,200 197,650
Adjusted EBITDA 13,780 12,400 15,900 16,000 7,700 2,900 4,653 73,333
Depreciation and amortisation 4,250 2,161 2,274 700 430 275 240 10,330
Goodwill impairment - 2,410 - - - - - 2,410
Impairment of assets by fire (note A2(b)) 1,210 - - - - - - 1,210
Income tax expense 4,017 3,350 2,665 2,092 750 800 556 14,230
Share of profit from associates and joint venture entity 70 - - 250 - - 130 450
Total segment assets 61,830 45,500 51,600 31,640 23,510 22,590 27,571 264,241
Total assets includes:
Investments in associates and joint venture entity 550 - - 2,250 - - 975 3,775
Additions to non-current assets (other than financial assets and deferred tax) 8,947 5,685 3,725 2,600 11,350 1,300 1,580 25,187
Total segment liabilities 6,805 4,600 5,750 3,700 2,400 5,100 1,745 30,100

21VALUE ACCOUNTS Holdings LimitedPwC
(b) Segment results (continued)
Furniture – manufacture
Furniture - retail IT consulting
Electronic equipment
Australia Indonesia Australia Australia
South – East Asia Australia
All other segments Total
2012 $’000 $’000 $’000 $’000 $’000 $’000 $’000 $’000
Total segment revenue 60,350 36,860 - 22,600 14,790 - 10,400 145,000
Inter-segment revenue (1,150) (1,100) - (600) (610) - (100) (3,560)
Revenue from external customers 59,200 35,760 - 22,000 14,180 - 10,300 141,440
Adjusted EBITDA 15,310 10,990 - 12,680 9,380 - 4,780 53,140
Depreciation and amortisation 3,190 2,068 - 1,243 1,547 - 670 7,718
Litigation settlement relating to claim against the land development division 370 370
Income tax expense 3,805 2,170 - 2,724 1,542 - 760 10,001
Share of profit from associates and joint venture entity 60 - - 220 - - 90 370
Total segment assets 61,900 45,700 - 30,523 23,325 - 29,101 190,549
Total assets includes:
Investments in associates and joint venture entity 490 - - 1,900 - - 885 3,275
Additions to non-current assets (other than financial assets and deferred tax) 5,970 4,370 - 3,887 1,695 - 1,115 17,037
Total segment liabilities 6,990 4,850 - 4,879 2,270 - 2,490 21,479
PwC VALUE ACCOUNTS Holdings Limited 22
(c) Understanding the segment results
(i) Segment revenue
Sales between segments are carried out at arm’s length and are eliminated on consolidation. The revenue from external parties is measured in the same way as in the income statement.
Revenues from external customers come from the sale of furniture on a wholesale and retail basis, from the provision of IT consulting services and from the sale of electronic equipment. The revenue from wholesale sales of furniture relates only to the group’s own brand, Pina Colada Furniture. The retail sales relate to the group’s own brand as well as other major retail brands.
Revenues of approximately $26,320,000 (2012 – $24,280,000) are derived from a single external customer. These revenues are attributed to the Australian furniture manufacturing segment.
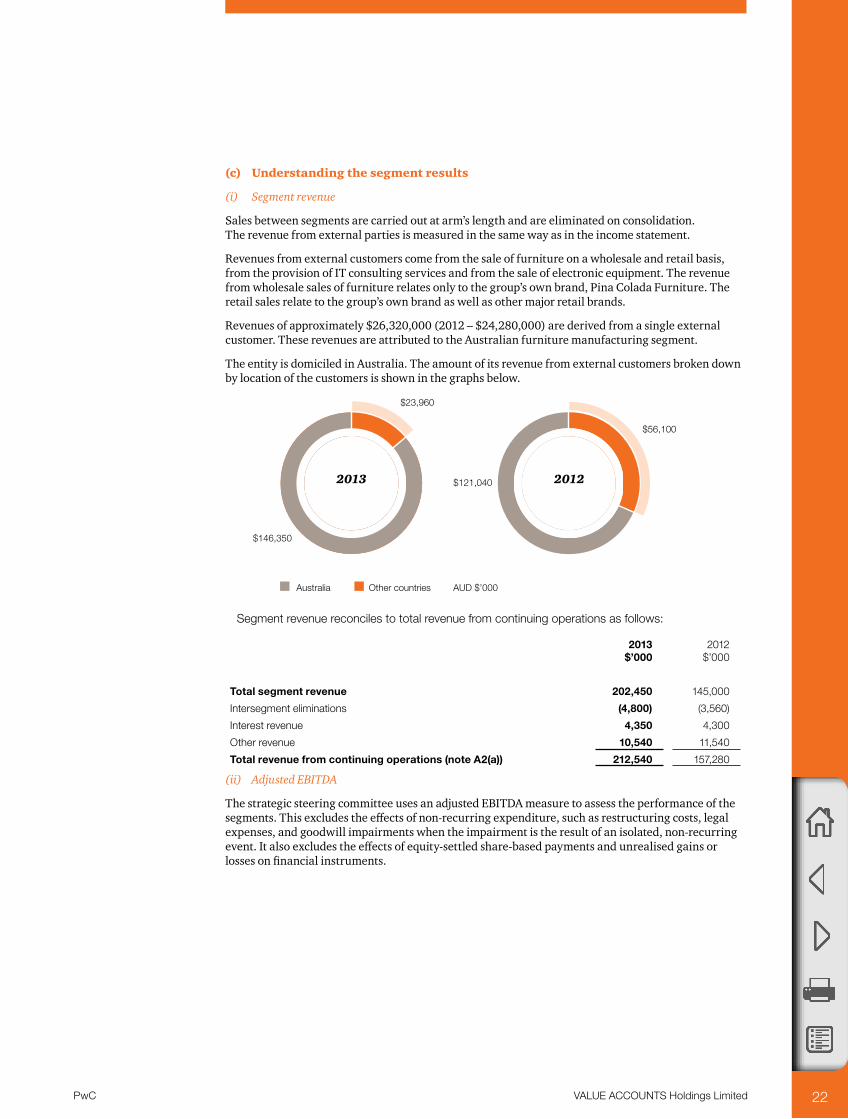
The entity is domiciled in Australia. The amount of its revenue from external customers broken down by location of the customers is shown in the graphs below.
Segment revenue reconciles to total revenue from continuing operations as follows:
2013 $’000
2012 $’000
Total segment revenue 202,450 145,000
Intersegment eliminations (4,800) (3,560)
Interest revenue 4,350 4,300
Other revenue 10,540 11,540
Total revenue from continuing operations (note A2(a)) 212,540 157,280
(ii) Adjusted EBITDA
The strategic steering committee uses an adjusted EBITDA measure to assess the performance of the segments. This excludes the effects of non-recurring expenditure, such as restructuring costs, legal expenses, and goodwill impairments when the impairment is the result of an isolated, non-recurring event. It also excludes the effects of equity-settled share-based payments and unrealised gains or losses on financial instruments.
$56,100
$121,040 2012
Australia Other countries AUD $’000
2013
$23,960
$146,350
PwC VALUE ACCOUNTS Holdings Limited 23
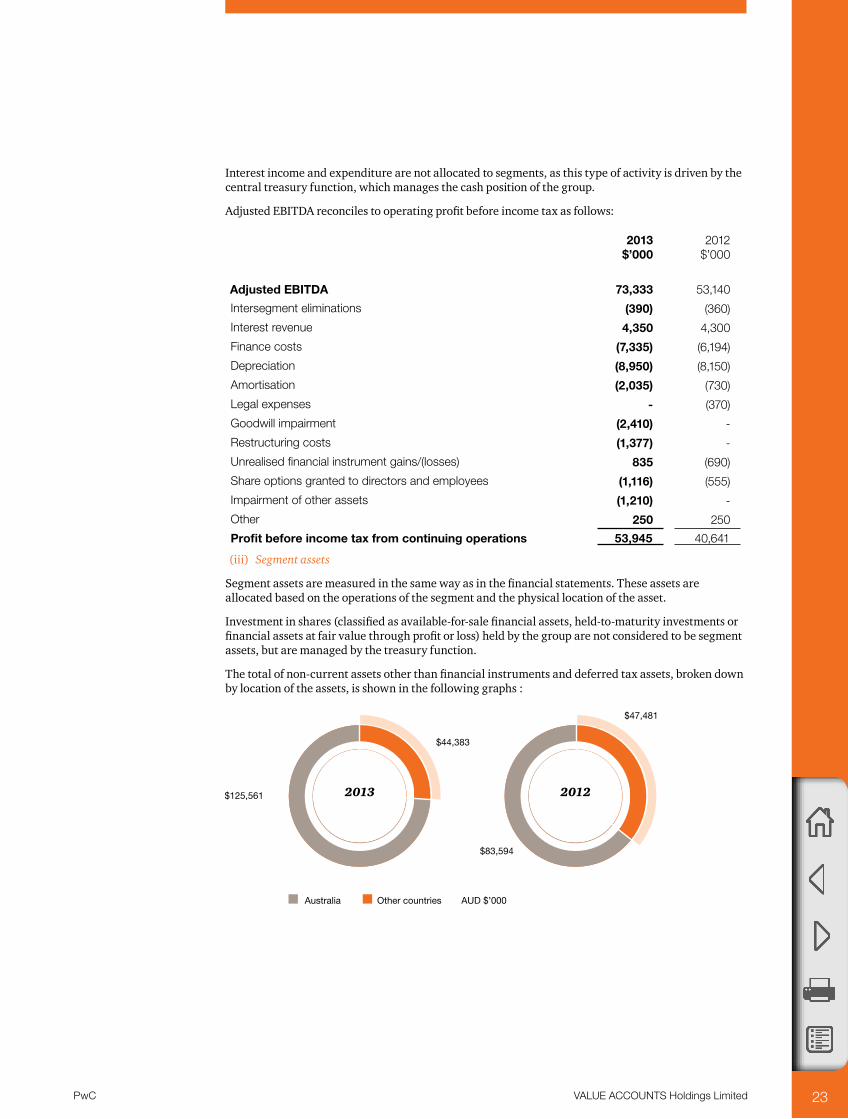
Interest income and expenditure are not allocated to segments, as this type of activity is driven by the central treasury function, which manages the cash position of the group.
Adjusted EBITDA reconciles to operating profit before income tax as follows:
2013 $’000
2012 $’000
Adjusted EBITDA 73,333 53,140
Intersegment eliminations (390) (360)
Interest revenue 4,350 4,300
Finance costs (7,335) (6,194)
Depreciation (8,950) (8,150)
Amortisation (2,035) (730)
Legal expenses - (370)
Goodwill impairment (2,410) -
Restructuring costs (1,377) -
Unrealised financial instrument gains/(losses) 835 (690)
Share options granted to directors and employees (1,116) (555)
Impairment of other assets (1,210) -
Other 250 250
Profit before income tax from continuing operations 53,945 40,641
(iii) Segment assets
Segment assets are measured in the same way as in the financial statements. These assets are allocated based on the operations of the segment and the physical location of the asset.
Investment in shares (classified as available-for-sale financial assets, held-to-maturity investments or financial assets at fair value through profit or loss) held by the group are not considered to be segment assets, but are managed by the treasury function.
The total of non-current assets other than financial instruments and deferred tax assets, broken down by location of the assets, is shown in the following graphs :
2013 2012
$44,383
$125,561
$47,481
$83,594
Australia Other countries AUD $’000

PwC VALUE ACCOUNTS Holdings Limited 24
Reportable segments’ assets are reconciled to total assets as follows:
2013 $’000
2012 $’000
Segment assets 264,241 190,549
Intersegment eliminations (1,300) (1.270)
Discontinued operation (machinery hire – see note C2) - 4,955
Unallocated:
Deferred tax assets 7,107 4,675
Available-for-sale financial assets 11,110 5,828
Held-to-maturity investments 1,210 -
Financial assets at fair value through profit or loss 11,300 10,915
Derivative financial instruments 1,396 1,352
Total assets as per the balance sheet 295,064 217,004
(iv) Segment liabilities
Segment liabilities are measured in the same way as in the financial statements. These liabilities are allocated based on the operations of the segment.
The group’s borrowings and derivative financial instruments are not considered to be segment liabilities, but are managed by the treasury function.
Reportable segment liabilities are reconciled to total liabilities as follows:
2013 $’000
2012 $’000
Segment liabilities 30,100 21,479
Intersegment eliminations (1,175) (1,120)
Discontinued operation (machinery hire – see note C2) - 500
Unallocated:
Deferred tax liabilities 12,736 6,638
Current tax liabilities 1,737 1,117
Current borrowings 8,980 8,555
Non-current borrowings 91,464 61,525
Derivative financial instruments 610 621
Total liabilities as per the balance sheet 144,452 99,315
(v) Error in Australian Furniture Manufacture segment
Due to a misinterpretation of the terms and conditions of a major leasing contract, segment assets of the Australian Furniture Manufacture segment for the year ended 30 June 2012 were overstated by $11,300,000. The error also had the effect of overstating adjusted EBITDA for the year ended 30 June 2012 for that segment by $750,000.
The error has been corrected by restating each of the affected segment information line items for the prior year, as described above.
Further information on the error is set out in note B1(b).

PwC VALUE ACCOUNTS Holdings Limited 25
A2 Profit and loss information
This note provides further information about individual line items in the profit and loss statement, including
• abreakdownofrevenuebytype• individuallysignificantitems• incometaxexpense• relevantaccountingpolicies• estimatesandjudgementsmadeindeterminingtheseitems.
Further profit and loss information, including a breakdown of other income and an analysis of expenses by nature is provided in the Appendix.
(a) Revenue
2013 $’000
2012 $’000
From continuing operations
Sales revenue
Sale of goods 117,200 80,540
Services 80,450 60,900
197,650 141,440
Other revenue
Rents and sub-lease rentals 7,240 7,240
Interest from financial assets not at fair value through profit or loss 4,350 4,300
Dividends 3,300 4,300
14,890 15,840
212,540 157,280
(i) Accounting for revenue from major business activities
Revenue is recognised for the major business activities using the methods outlined below.
Sale of goods – wholesale
Timing of recognition: the group manufactures and sells a range of furniture in the wholesale market. Sales are recognised when products are delivered to the wholesaler, the wholesaler has full discretion over the channel and price to sell the products, and there is no unfulfilled obligation that could affect the wholesaler’s acceptance of the products. Delivery occurs when the products have been shipped to the specified location, the risks of obsolescence and loss have been transferred to the wholesaler, and either the wholesaler has accepted the products in accordance with the sales contract, the acceptance provisions have lapsed, or the group has objective evidence that all criteria for acceptance have been satisfied.
Measurement of revenue: The furniture is often sold with volume discounts and customers have a right to return faulty products in the wholesale market. Revenue from sales is based on the price specified in the sales contracts, net of the estimated volume discounts and returns at the time of sale. Accumulated experience is used to estimate and provide for the discounts and returns. The volume discounts are assessed based on anticipated annual purchases. No element of financing is deemed present as the sales are made with a credit term of 30 days, which is consistent with market practice.
Sale of goods – retail
Timing of recognition: The group operates a chain of retail stores selling household furniture. Revenue from the sale of goods is recognised when a group entity sells a product to the customer.

PwC VALUE ACCOUNTS Holdings Limited 26
Measurement of revenue: It is the group’s policy to sell its products to the end customer with a right of return within 28 days. Accumulated experience is used to estimate and provide for such returns at the time of sale.
Deferred revenue: Customer loyalty programme
Timing of recognition: The group operates a loyalty programme where customers accumulate points for purchases made which entitle them to discounts on future purchases. Revenue from the award points is recognised when the points are redeemed.
Measurement of revenue: The amount of revenue is based on the number of points redeemed relative to the total number expected to be redeemed. Award points expire 12 months after the initial sale.
Consulting
Timing of recognition: Revenue from consulting services is recognised in the accounting period in which the services are rendered. For fixed-price contracts, revenue is recognised based on the actual service provided to the reporting date as a proportion of the total services to be provided (percentage of completion method).
Measurement of revenue: Estimates of revenues, costs or extent of progress toward completion are revised if circumstances change. Any resulting increases or decreases in estimated revenues or costs are reflected in profit or loss in the period in which the circumstances that give rise to the revision become known by management.
Land development and resale
Timing of recognition: Revenue is recognised when the risks and rewards have been transferred and the entity does not retain either continuing managerial involvement to the degree usually associated with ownership, or effective control over the units sold. Due to the nature of the agreements entered into by the group, this occurs on settlement.
Measurement of revenue: The revenue is measured at the amount receivable under the contract. It is discounted to present value if deferred payments have been agreed and the impact of discounting is material.
(ii) Critical judgements in calculating amounts
The group has recognised revenue amounting to $2,950,000 for sale of furniture to a wholesale customer during 2013. The buyer has the right to rescind the sale if there is 5% dissatisfaction with the quality of the first 100 pieces of furniture sold. This specific warranty was given because it is a new product line specifically designed for this customer. The group is confident that the quality of the product is such that the dissatisfaction rate will be well below 5% and accordingly, rescission of the contract is not expected. It is therefore appropriate to recognise revenue on this transaction during 2013. The profit recognised for this sale was $1,625,000. The group would suffer an estimated pre-tax loss of $1,760,000 in its 2013 financial statements if the sale is cancelled, $1,625,000 being the reversal of 2013 profits and $135,000 of costs connected with returning the stock to the warehouse.

PwC VALUE ACCOUNTS Holdings Limited 27
(b) Individually significant items
The following items are significant to the financial performance of the group, and so are listed separately here.
Notes
2013 $’000
2012 $’000
Net gain on sale of freehold land (i) 1,270 -
Restructuring costs A4(d) (1,377) -
Impairment of goodwill A4(c) (2,410) -
Impairment of other assets (ii)
Office and warehouse building (465) -
Plant and equipment (210) -
Inventories (535) -
Total impairment losses – other assets (1,210) -
Insurance recovery 300 -
Net loss on disposal of plant and equipment (iii) - (230)
Litigation settlement relating to claim against the land development division (iv) - (370)
(i) Sale of freehold land
Following the rezoning of land held by VALUE ACCOUNTS Consulting Limited, the entity sold a large parcel of freehold land at a significant profit and realised a gain of $1,270,000.
(ii) Impairment of other assets
A fire in Maitland in September 2012 damaged a major office and warehouse building owned by VALUE ACCOUNTS Manufacturing Limited. The fire also destroyed equipment and inventories stored in the warehouse. An insurance recovery of $300,000 has been received and recognised as other income.
(iii) Disposal of plant and equipment
VALUE ACCOUNTS Manufacturing upgraded its plant and equipment by installing a large new production line in its Maitland factory. There were several items of old equipment that had to be removed to make place for the new plant. Since the items were using superseded technology, the entity was not able to sell them at their carrying amounts but incurred a loss of $230,000 on disposal.
(iv) Litigation settlement
VALUE ACCOUNTS Development Limited paid $370,000 as settlement for a claim lodged against the company following the termination of the Melaleuca development in Northern NSW.
(c) Income tax expense
This note provides an analysis of the group’s income tax expense, shows what amounts are recognised directly in equity and in other comprehensive income, and how the tax expense is affected by non-assessable and non-deductible items. It also explains how the group accounts for investment allowances and similar tax incentives, and explains significant estimates made in relation to the group’s tax position.
PwC VALUE ACCOUNTS Holdings Limited 28
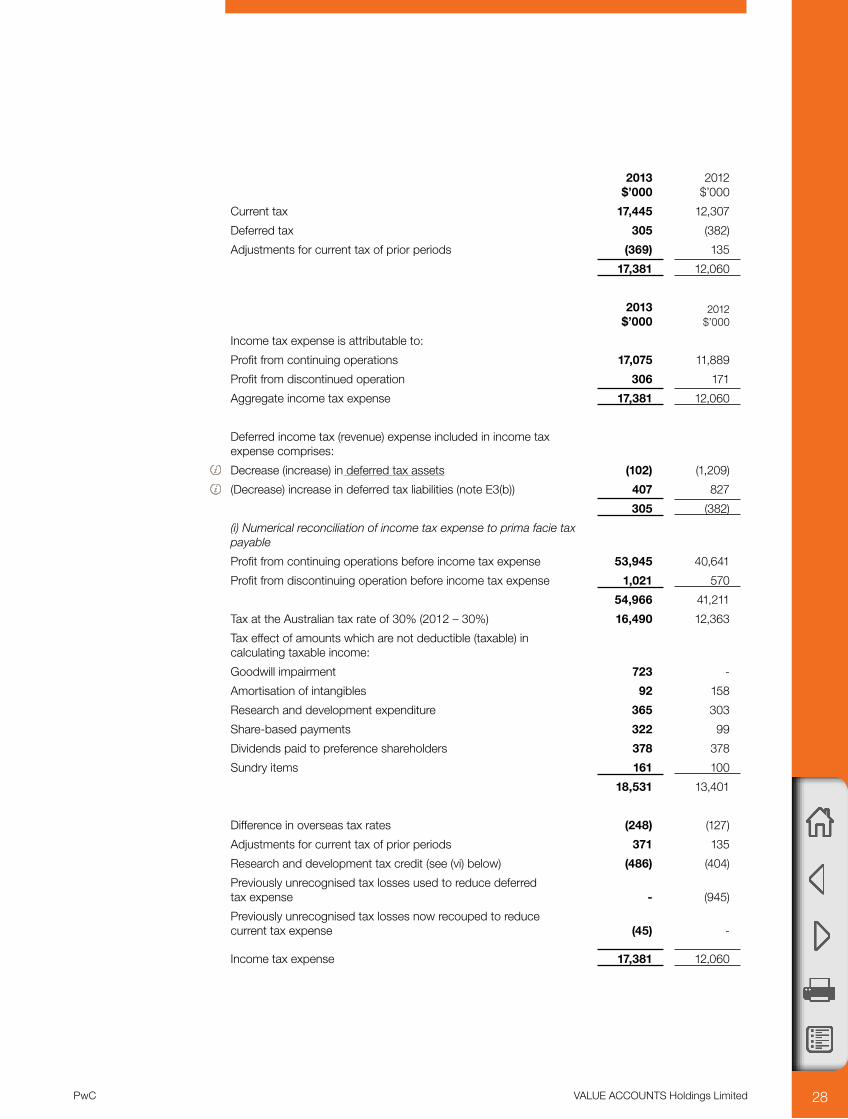
2013 $’000
2012 $’000
Current tax 17,445 12,307
Deferred tax 305 (382)
Adjustments for current tax of prior periods (369) 135
17,381 12,060
2013 $’000
2012 $’000
Income tax expense is attributable to:
Profit from continuing operations 17,075 11,889
Profit from discontinued operation 306 171
Aggregate income tax expense 17,381 12,060
Deferred income tax (revenue) expense included in income tax expense comprises:
Decrease (increase) in deferred tax assets (102) (1,209)
(Decrease) increase in deferred tax liabilities (note E3(b)) 407 827
305 (382)
(i) Numerical reconciliation of income tax expense to prima facie tax payable
Profit from continuing operations before income tax expense 53,945 40,641
Profit from discontinuing operation before income tax expense 1,021 570
54,966 41,211
Tax at the Australian tax rate of 30% (2012 – 30%) 16,490 12,363
Tax effect of amounts which are not deductible (taxable) in calculating taxable income:
Goodwill impairment 723 -
Amortisation of intangibles 92 158
Research and development expenditure 365 303
Share-based payments 322 99
Dividends paid to preference shareholders 378 378
Sundry items 161 100
18,531 13,401
Difference in overseas tax rates (248) (127)
Adjustments for current tax of prior periods 371 135
Research and development tax credit (see (vi) below) (486) (404)
Previously unrecognised tax losses used to reduce deferred tax expense - (945)
Previously unrecognised tax losses now recouped to reduce current tax expense (45) -
Income tax expense 17,381 12,060

PwC VALUE ACCOUNTS Holdings Limited 29
Notes2013
$’0002012
$’000
(ii) Amounts recognised directly in equity
Aggregate current and deferred tax arising in the reporting period and not recognised in net profit or loss or other comprehensive income but directly debited or credited to equity:
Current tax – credited directly to equity A5(d) (14) -
Net deferred tax – debited (credited) directly to equity
B1(b), E3(b) 990 12
976 12
(iii) Significant estimatesIn calculating the tax expense for the current period, the group has treated certain expenditure as being deductible for tax purposes. However, the tax legislation in relation to these expenditure is not clear and the group has applied for a private ruling to confirm their interpretation. If the ruling should not be favourable, this would increase the group’s current tax payable and current tax expense by $580,000 respectively. The impact in the prior year would have been $345,000.
(iv) Other relevant information
Further information about the group’s tax amounts can be found:
• Deferred tax assets and liabilities• Unrecognised tax amounts

30VALUE ACCOUNTS Holdings LimitedPwC
A3 Financial assets and financial liabilities
This note provides further information about the group’s financial instruments, including:
• An overview of all financial instruments held by the group• Disaggregated information for those instruments that the directors consider to be most significant in the context of the group’s operations• Specific accounting policies where relevant• Information about determining the fair value of the instruments, including judgements and estimation uncertainty involved.
The group holds the following financial instruments.
Financial assets Notes
Available for sale
$’000
Assets at fair value
through profit or
loss $’000
Derivatives used for hedging
$’000
Financial assets at
amortised cost
$’000Total $’000
2013
Cash and cash equivalents E2(a) - - - 45,507 45,407
Trade and other receivables * (a) - - - 20,911 20,911
Financial assets at fair value through profit or loss E2(b)
- 11,300 - - 11,300
Derivative financial instruments B2 - 1,088 308 - 1,396
Available-for-sale financial assets E2(c) 11,110 - - - 11,110
Held-to-maturity investments - - - 1,210 1,210
11,110 12,388 308 67,628 91,334
2012
Cash and cash equivalents E2(a) - - - 24,693 24,693
Trade and other receivables * (a) - - - 13,089 13,089
Financial assets at fair value through profit or loss E2(b) - 10,915 - - 10,915
Derivative financial instruments B2 - 640 712 - 1,352
Available-for-sale financial assets E2(c) 5,828 - - - 5,828
5,828 11,555 712 37,782 55,817
* excluding prepayments
31VALUE ACCOUNTS Holdings LimitedPwC
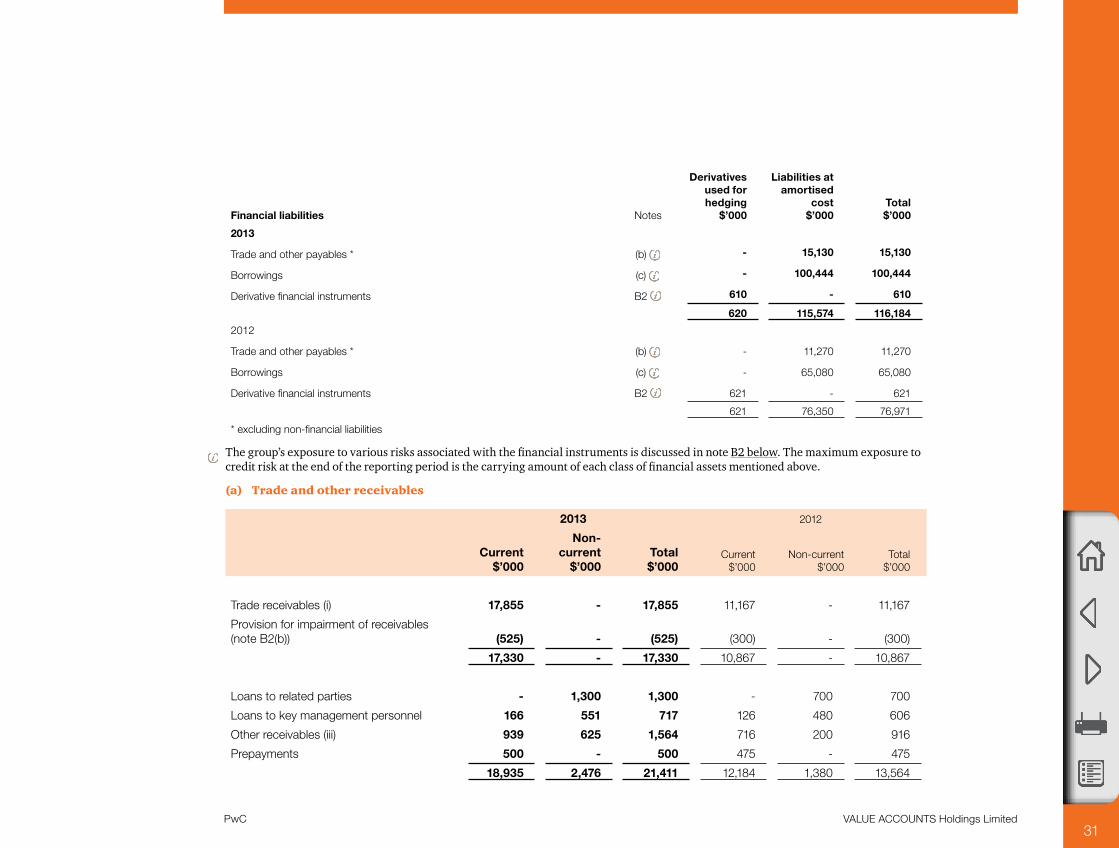
Financial liabilities Notes
Derivatives used for hedging
$’000
Liabilities at amortised
cost $’000
Total $’000
2013
Trade and other payables * (b) - 15,130 15,130
Borrowings (c) - 100,444 100,444
Derivative financial instruments B2 610 - 610
620 115,574 116,184
2012
Trade and other payables * (b) - 11,270 11,270
Borrowings (c) - 65,080 65,080
Derivative financial instruments B2 621 - 621
621 76,350 76,971
* excluding non-financial liabilities
The group’s exposure to various risks associated with the financial instruments is discussed in note B2 below. The maximum exposure to credit risk at the end of the reporting period is the carrying amount of each class of financial assets mentioned above.
(a) Trade and other receivables
2013 2012
Current $’000
Non-current
$’000Total $’000
Current $’000
Non-current $’000
Total $’000
Trade receivables (i) 17,855 - 17,855 11,167 - 11,167
Provision for impairment of receivables (note B2(b)) (525) - (525) (300) - (300)
17,330 - 17,330 10,867 - 10,867
Loans to related parties - 1,300 1,300 - 700 700
Loans to key management personnel 166 551 717 126 480 606
Other receivables (iii) 939 625 1,564 716 200 916
Prepayments 500 - 500 475 - 475
18,935 2,476 21,411 12,184 1,380 13,564

32VALUE ACCOUNTS Holdings LimitedPwC
Further information relating to loans to key management personnel is set out in note F3. Information about credit risk and impairment of receivables is provided in note B2(b) below.
(i) Accounting for trade receivables
Loans and receivables are non-derivative financial assets with fixed or determinable payments that are not quoted in an active market. They are included in current assets, except for those with maturities greater than 12 months after the reporting period which are classified as non-current assets. Trade receivables are generally due for settlement within 30 days.
Debts which are known to be uncollectible are written off by reducing the carrying amount directly. A provision for impairment of trade receivables is recognised when there is objective evidence that the group will not be able to collect all amounts due according to the original terms of the receivables. Significant financial difficulties of the debtor, probability that the debtor will enter bankruptcy or financial reorganisation, and default or delinquency in payments (more than 30 days overdue) are considered indicators that the trade receivable is impaired.
Impairment losses are recognised in profit or loss within other expenses. Subsequent recoveries of amounts previously written off are credited against other expenses.
(ii) Transferred receivables
The carrying amounts of the trade receivables include receivables which are subject to a factoring arrangement. Under this arrangement, VALUE ACCOUNTS Manufacturing Limited has transferred the receivables to the factor in exchange for cash, and is prevented from selling or pledging the receivables. However, VALUE ACCOUNTS has retained late payment and credit risk. The group therefore continues to recognise the transferred assets in their entirety in its balance sheet. The amount repayable under the factoring agreement is presented as secured borrowing.
The relevant amounts are as follows.
2013 $’000
2012 $’000
Carrying amount of transferred receivables 3,250 -
Carrying amount of associated secured borrowing (bank loans) 3,100 -
(iii) Other receivables
These amounts generally arise from transactions outside the usual operating activities of the group. Interest may be charged at commercial rates where the terms of repayment exceed six months. Collateral is not normally obtained.

33VALUE ACCOUNTS Holdings LimitedPwC
(iv) Fair values of trade and other receivables
While receivables are measured at amortised cost, information about their value is relevant as it gives an indication of their underlying value and allows comparison with other entities.
However, due to the short-term nature of the current receivables, their carrying amount is assumed to be the same as their fair value. For the majority of the non-current receivables, the fair values are also not significantly different to their carrying amounts. An exception are the loans to key management personnel, which have a fair value of $481,000 as at 30 June 2013, compared to a carrying amount of $551,000 (2012: fair value of $424,000 and carrying amount of $480,000). The fair values were calculated based on cash flows discounted using a current lending rate of 8.9% (2012 – 8.2%) which is higher than the rate charged on those loans.
(b) Trade and other payables
2013 $’000
2012 $’000
Current liabilities
Trade payables 11,430 9,220
Payroll tax and other statutory liabilities 1,570 1,207
Contingent consideration (note C1) 160 -
Other payables 3,540 2,050
16,700 12,477
Trade payables are unsecured and are usually paid within 30 days of recognition.
The carrying amounts of trade payables are assumed to be the same as their fair values, due to their short-term nature.
(c) Borrowings
2013 2012
Current $’000
Non-current $’000
Total $’000
Current $’000
Non-current $’000
Total $’000
Secured (i)
Bank overdrafts 2,650 - 2,650 2,250 - 2,250
Bank loans 4,250 36,789 41,039 3,050 26,850 29,900
Debentures (note D5) - - - 2,000 2,000 4,000
Lease liabilities (v) 580 3,095 3,675 375 3,575 3,950
Other loans 450 8,580 9,030 150 14,100 14,250
Total secured borrowings 7,930 48,464 56,394 7,825 46,525 54,350

34VALUE ACCOUNTS Holdings LimitedPwC
2013 2012
Current $’000
Non-current $’000
Total $’000
Current $’000
Non-current $’000
Total $’000
Unsecured
Bills payable 1,050 - 1,050 730 - 730
Convertible notes (iii) - 16,815 16,815 - - -
Redeemable preference shares (iv) - 11,000 11,000 - 11,000 11,000
Loans from related parties * - 15,185 15,185 - 4,000 4,000
Total unsecured borrowings 1,050 43,000 44,050 730 15,000 15,730
Total borrowings 8,980 91,464 100,444 8,555 61,525 70,080
* Further information relating to loans from related parties is set out in note F1.
(i) Secured liabilities and assets pledged as security
Of the bank loans, $3,100,000 relate to transferred receivables (see note A3(a)). The remaining bank loans and overdraft are secured by first mortgages over the group’s freehold land and buildings, including those classified as investment properties.
The debentures were secured by a floating charge over the assets of the parent entity.
Lease liabilities are effectively secured as the rights to the leased assets recognised in the financial statements revert to the lessor in the event of default.
The other loans are secured by a negative pledge that imposes certain covenants on the subsidiary that has received those loans. The negative pledge states that (subject to certain exceptions) the subsidiary will not provide any other security over its assets, and will ensure that the following financial ratios are met:
(i) debt will not, at any time, exceed 50% of total tangible assets, and
(ii) borrowing costs will not exceed 50% of earnings before borrowing costs and taxation for each half-year period.
The carrying amounts of assets pledged as security for current and non-current borrowings is disclosed in the note F6.
PwC VALUE ACCOUNTS Holdings Limited 35
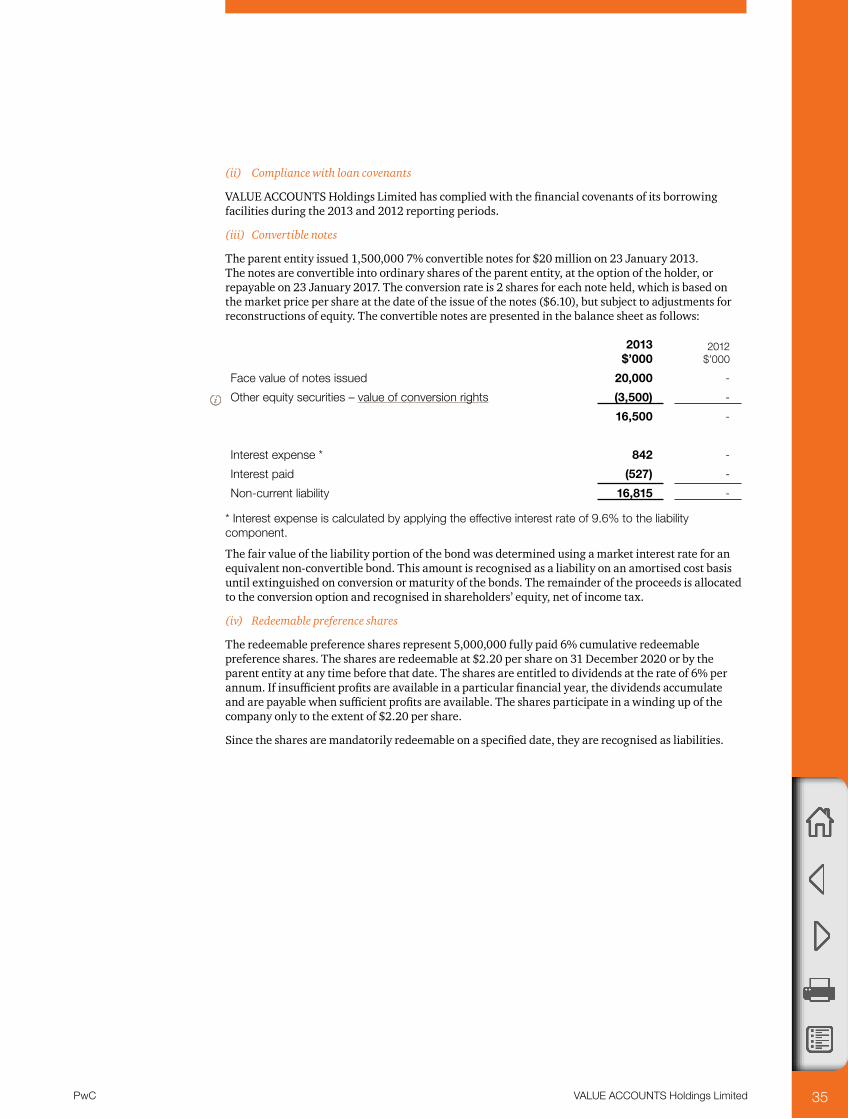
(ii) Compliance with loan covenants
VALUE ACCOUNTS Holdings Limited has complied with the financial covenants of its borrowing facilities during the 2013 and 2012 reporting periods.
(iii) Convertible notes
The parent entity issued 1,500,000 7% convertible notes for $20 million on 23 January 2013. The notes are convertible into ordinary shares of the parent entity, at the option of the holder, or repayable on 23 January 2017. The conversion rate is 2 shares for each note held, which is based on the market price per share at the date of the issue of the notes ($6.10), but subject to adjustments for reconstructions of equity. The convertible notes are presented in the balance sheet as follows:
2013 $’000
2012 $’000
Face value of notes issued 20,000 -
Other equity securities – value of conversion rights (3,500) -
16,500 -
Interest expense * 842 -
Interest paid (527) -
Non-current liability 16,815 -
* Interest expense is calculated by applying the effective interest rate of 9.6% to the liability component.
The fair value of the liability portion of the bond was determined using a market interest rate for an equivalent non-convertible bond. This amount is recognised as a liability on an amortised cost basis until extinguished on conversion or maturity of the bonds. The remainder of the proceeds is allocated to the conversion option and recognised in shareholders’ equity, net of income tax.
(iv) Redeemable preference shares
The redeemable preference shares represent 5,000,000 fully paid 6% cumulative redeemable preference shares. The shares are redeemable at $2.20 per share on 31 December 2020 or by the parent entity at any time before that date. The shares are entitled to dividends at the rate of 6% per annum. If insufficient profits are available in a particular financial year, the dividends accumulate and are payable when sufficient profits are available. The shares participate in a winding up of the company only to the extent of $2.20 per share.
Since the shares are mandatorily redeemable on a specified date, they are recognised as liabilities.

PwC VALUE ACCOUNTS Holdings Limited 36
(v) Finance leases
The group leases various plant and equipment with a carrying amount of $2,360,000 (2012 – $3,200,000) under finance leases expiring within three to seven years. Under the terms of the leases, the group has the option to acquire the leased assets for 50% of their agreed fair value on expiry of the leases. This option lapses in the event the group fails to maintain its credit rating at the level prevailing at inception of the lease.
Some leases provide for the payment of incremental contingent rentals based on movements in a relevant price index. Contingent rentals paid during the year were $610,000 (2012 – nil).
2013 $’000
2012 $’000
Commitments in relation to finance leases are payable as follows:
Within one year 480 280
Later than one year but not later than five years 2,811 3,280
Later than five years 365 370
Minimum lease payments 3,656 3,930
Future finance charges (780) (930)
Recognised as a liability 2,875 3,000
2013 $’000
2012 $’000
Recognised as a liability 2,875 3,000
Lease incentives on non-cancellable operating leases included in lease liabilities 800 950
Total lease liabilities 3,675 3,950
The present value of finance lease liabilities is as follows:
Within one year 395 180
Later than one year but not later than five years 2,165 2,500
Later than five years 315 320
Minimum lease payments 2,875 3,000
(vi) Set-off of assets and liabilities
The parent entity has established a legal right of set-off with a financial institution and certain deposits from subsidiaries with that institution have been set-off against a particular borrowing of $2,500,000. The parties intend to realise the deposit and settle the borrowing simultaneously in March 2014.
(vii) Fair values of borrowings
While borrowings are measured at amortised cost, information about their value is relevant as it gives an indication of their underlying value and allows comparison with other entities. For the majority of the borrowings, the fair values are not materially different to their carrying amounts, since the interest payable on those borrowings is either close to current market rates or the borrowings are of a short-term nature. Significant differences are identified only for the following borrowings:
2013 2012
Carrying amount
$’000Fair value
$’000
Carrying amount
$’000Fair value
$’000
Convertible notes 16,815 17,775 - -
Redeemable preference shares 11,000 9,875 11,000 10,860
The fair values of non-current borrowings are based on cash flows discounted using borrowing rates varying from 7.5% to 8.3%, depending on the type of borrowing (2012 – 7.2% to 7.9%).

37VALUE ACCOUNTS Holdings LimitedPwC
(d) Net debt reconciliation
This section sets out an analysis of net debt and the movements in net debt for each of the periods presented.
Net debt2013
$’0002012
$’000
Cash and cash equivalents 45,407 24,693
Liquid investments (i) 11,300 10,915
Borrowings – repayable within one year (including overdraft) (8,980) (8,555)
Borrowings – repayable after one year (91,464) (61,525)
Net debt (43,737) (34,472)
Cash and liquid investments 56,707 35,608
Gross debt – fixed interest rates (43,689) (22,150)
Gross debt – variable interest rates (56,755) (47,930)
Net debt (43,737) (34,472)
Cash/bank
overdraft $’000
Liquid investments
$’000
Borrowings – repayable
within 1 year
$’000
Borrowings – repayable
after one year
$’000Total $’000
Net debt as at 1 July 2011 13,475 10,370 (4,249) (58,250) (38,654)
Cash flows 8,752 1,235 (1,681) (230) 8,076
Acquisitions – finance leases - - (375) (2,625) (3,000)
Foreign exchange adjustments 216 - - (420) (204)
Other non-cash movements - (690) - - (690)
Net debt as at 30 June 2012 22,443 10,915 (6,305) (61,525) (34,472)
Cash flows 20,562 (465) (25) (29,948) (9,876)
Foreign exchange adjustments (248) 15 - (31) (264)
Other non-cash movements - 835 - 40 875
Net debt as at 30 June 2013 42,757 11,300 (6,330) (91,464) (43,737)
(i) Liquid investments comprise current investments that are traded in an active market, being the group’s financial assets held at fair value through profit or loss.
38VALUE ACCOUNTS Holdings LimitedPwC
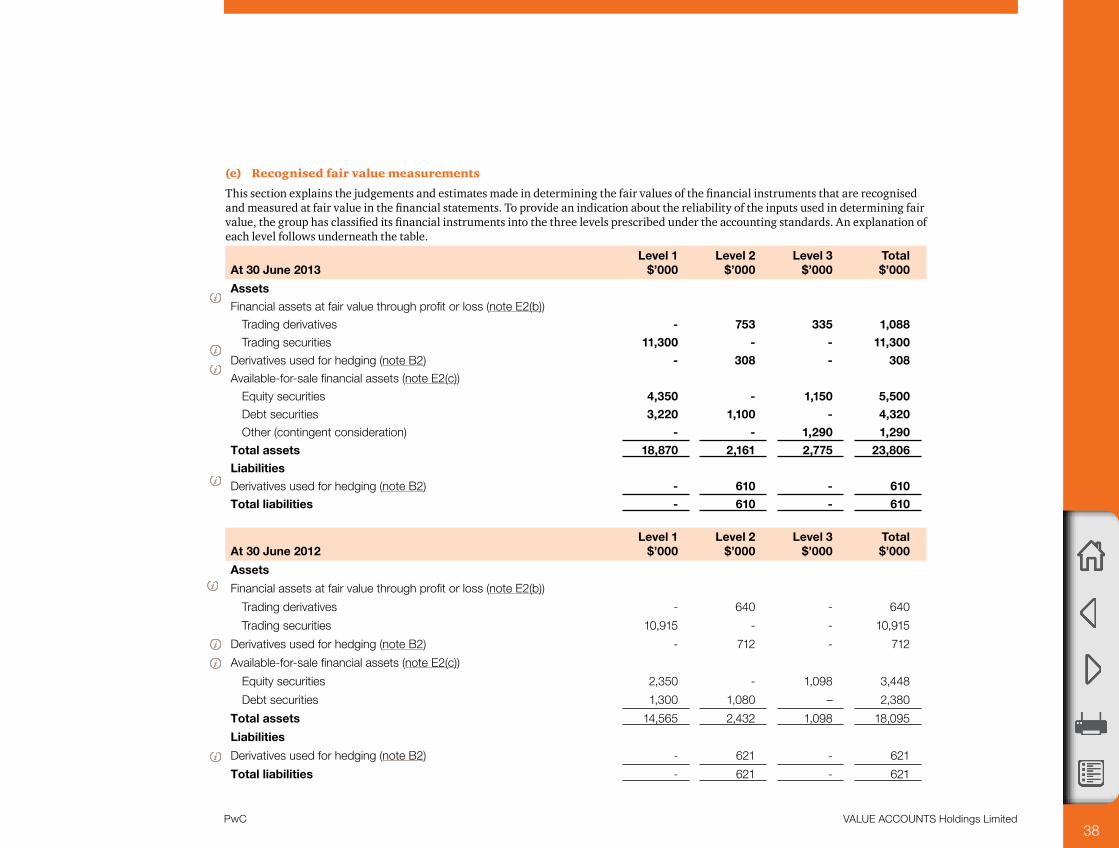
(e) Recognised fair value measurements
This section explains the judgements and estimates made in determining the fair values of the financial instruments that are recognised and measured at fair value in the financial statements. To provide an indication about the reliability of the inputs used in determining fair value, the group has classified its financial instruments into the three levels prescribed under the accounting standards. An explanation of each level follows underneath the table.
At 30 June 2013Level 1
$’000Level 2
$’000Level 3
$’000Total $’000
Assets
Financial assets at fair value through profit or loss (note E2(b))
Trading derivatives - 753 335 1,088
Trading securities 11,300 - - 11,300
Derivatives used for hedging (note B2) - 308 - 308
Available-for-sale financial assets (note E2(c))
Equity securities 4,350 - 1,150 5,500
Debt securities 3,220 1,100 - 4,320
Other (contingent consideration) - - 1,290 1,290
Total assets 18,870 2,161 2,775 23,806
Liabilities
Derivatives used for hedging (note B2) - 610 - 610
Total liabilities - 610 - 610
At 30 June 2012Level 1
$’000Level 2
$’000Level 3
$’000Total $’000
Assets
Financial assets at fair value through profit or loss (note E2(b))
Trading derivatives - 640 - 640
Trading securities 10,915 - - 10,915
Derivatives used for hedging (note B2) - 712 - 712
Available-for-sale financial assets (note E2(c))
Equity securities 2,350 - 1,098 3,448
Debt securities 1,300 1,080 – 2,380
Total assets 14,565 2,432 1,098 18,095
Liabilities
Derivatives used for hedging (note B2) - 621 - 621
Total liabilities - 621 - 621
39VALUE ACCOUNTS Holdings LimitedPwC
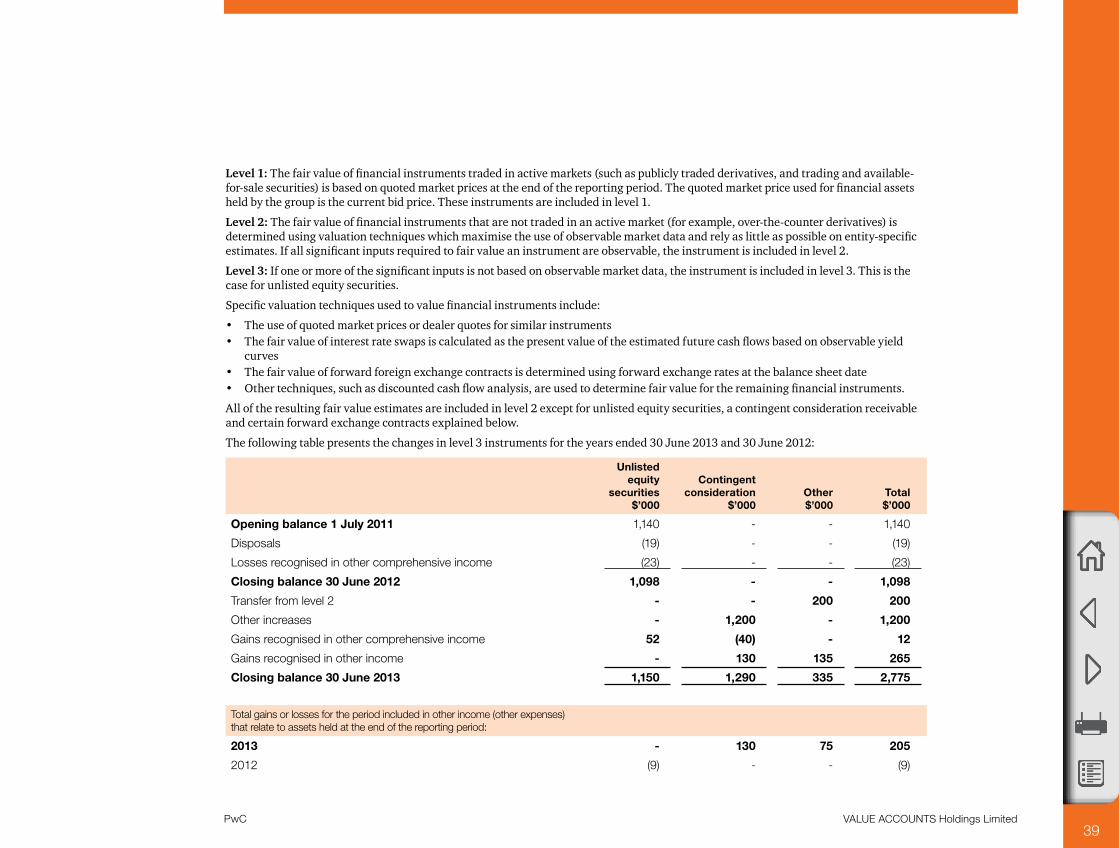
Level 1: The fair value of financial instruments traded in active markets (such as publicly traded derivatives, and trading and available-for-sale securities) is based on quoted market prices at the end of the reporting period. The quoted market price used for financial assets held by the group is the current bid price. These instruments are included in level 1.
Level 2: The fair value of financial instruments that are not traded in an active market (for example, over-the-counter derivatives) is determined using valuation techniques which maximise the use of observable market data and rely as little as possible on entity-specific estimates. If all significant inputs required to fair value an instrument are observable, the instrument is included in level 2.
Level 3: If one or more of the significant inputs is not based on observable market data, the instrument is included in level 3. This is the case for unlisted equity securities.
Specific valuation techniques used to value financial instruments include:
• The use of quoted market prices or dealer quotes for similar instruments• The fair value of interest rate swaps is calculated as the present value of the estimated future cash flows based on observable yield
curves• The fair value of forward foreign exchange contracts is determined using forward exchange rates at the balance sheet date• Other techniques, such as discounted cash flow analysis, are used to determine fair value for the remaining financial instruments.
All of the resulting fair value estimates are included in level 2 except for unlisted equity securities, a contingent consideration receivable and certain forward exchange contracts explained below.
The following table presents the changes in level 3 instruments for the years ended 30 June 2013 and 30 June 2012:
Unlisted equity
securities $’000
Contingent consideration
$’000Other $’000
Total $’000
Opening balance 1 July 2011 1,140 - - 1,140
Disposals (19) - - (19)
Losses recognised in other comprehensive income (23) - - (23)
Closing balance 30 June 2012 1,098 - - 1,098
Transfer from level 2 - - 200 200
Other increases - 1,200 - 1,200
Gains recognised in other comprehensive income 52 (40) - 12
Gains recognised in other income - 130 135 265
Closing balance 30 June 2013 1,150 1,290 335 2,775
Total gains or losses for the period included in other income (other expenses) that relate to assets held at the end of the reporting period:
2013 - 130 75 205
2012 (9) - - (9)

PwC VALUE ACCOUNTS Holdings Limited 40
Unlisted equity securities
The fair value of the unlisted equity securities is determined based on the present value of net cash inflows from expected future dividends and subsequent disposal of the securities. The discount rate used to determine the present value of the net cash inflows was based on a market interest rate and the risk premium specific to the unlisted securities. If the estimated earnings growth factors (2013 – 3%; 2012 – 4%) and risk-adjusted discount rates (2013 – 10%; 2012 – 9%) were 10% higher or lower, their fair value and other components of equity would increase by $70,000/decrease by $80,000 (2012 – increase by $40,000/decrease by $50,000).
Contingent consideration
The fair value of the contingent consideration is calculated as the present value of the expected cash flows using a discount rate that reflects the credit risk specific to the counterparty (14%). If the risk-adjusted discount rate was 10% higher or lower, the fair value of the contingent liability and other components of equity would increase by $40,000/decrease by $40,000. If the expected cash flows were 10% higher or lower, the fair value of the contingent liability and profit or loss would increase/decrease by $35,000.
Other items
In 2013 the group transferred a held-for-trading forward foreign exchange contract from level 2 into level 3 as the counterparty for the derivative encountered significant financial difficulties. This resulted in a significant increase to the discount rate which is not based on observable inputs, as the discount rate of 15% (2012 – 11%) reflects credit risk specific to the counter party. If the credit default rate would be shifted +/- 5% the impact on profit or loss would be $30,000.

41VALUE ACCOUNTS Holdings LimitedPwC
A4 Non-financial assets and liabilities
This note provides further information about those non-financial assets and liabilities of the group that the directors consider significant for an understanding of the group’s financial position and performance, including
• explanation of the calculation basis for each type of non-financial assets and liabilities• accounting policies• information about significant estimation uncertainty and judgements made.
(a) Inventories
Current assets2013
$’0002012
$’000
Raw materials and stores 6,200 4,800
Work in progress 5,600 5,400
Finished goods 7,953 6,472
Land held for development and resale (see note C4) 2,400 -
22,153 16,672
(i) Accounting for inventories
Costs are generally assigned to individual items of inventory on the basis of weighted average costs. For land held for development and resale, costs are assigned by specific identification and include the cost of acquisition, development and borrowing costs incurred during the development.
(ii) Amounts recognised in profit or loss
Inventories recognised as expense during the year ended 30 June 2013 and included in cost of sales and cost of providing services (including $535,000 of inventories damaged by a fire – refer to note A2(b) amounted to $58,374,000 (2012 – $37,390,000).
Write-downs of inventories to net realisable value recognised as an expense during the year ended 30 June 2013 amounted to $950,000 (2012 – $750,000). The expense has been included in ‘cost of sales’ in profit or loss.
42VALUE ACCOUNTS Holdings LimitedPwC
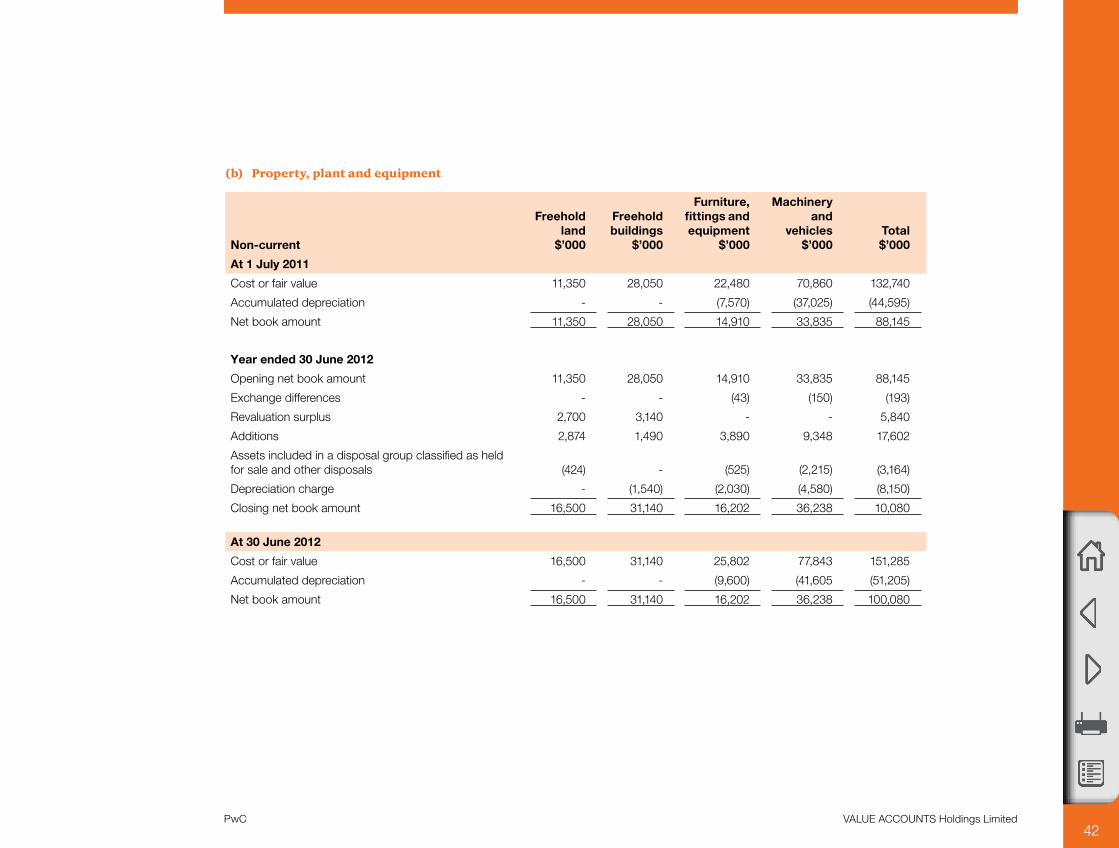
(b) Property, plant and equipment
Non-current
Freehold land
$’000
Freehold buildings
$’000
Furniture, fittings and equipment
$’000
Machinery and
vehicles $’000
Total $’000
At 1 July 2011
Cost or fair value 11,350 28,050 22,480 70,860 132,740
Accumulated depreciation - - (7,570) (37,025) (44,595)
Net book amount 11,350 28,050 14,910 33,835 88,145
Year ended 30 June 2012
Opening net book amount 11,350 28,050 14,910 33,835 88,145
Exchange differences - - (43) (150) (193)
Revaluation surplus 2,700 3,140 - - 5,840
Additions 2,874 1,490 3,890 9,348 17,602
Assets included in a disposal group classified as held for sale and other disposals (424) - (525) (2,215) (3,164)
Depreciation charge - (1,540) (2,030) (4,580) (8,150)
Closing net book amount 16,500 31,140 16,202 36,238 10,080
At 30 June 2012
Cost or fair value 16,500 31,140 25,802 77,843 151,285
Accumulated depreciation - - (9,600) (41,605 (51,205)
Net book amount 16,500 31,140 16,202 36,238 100,080
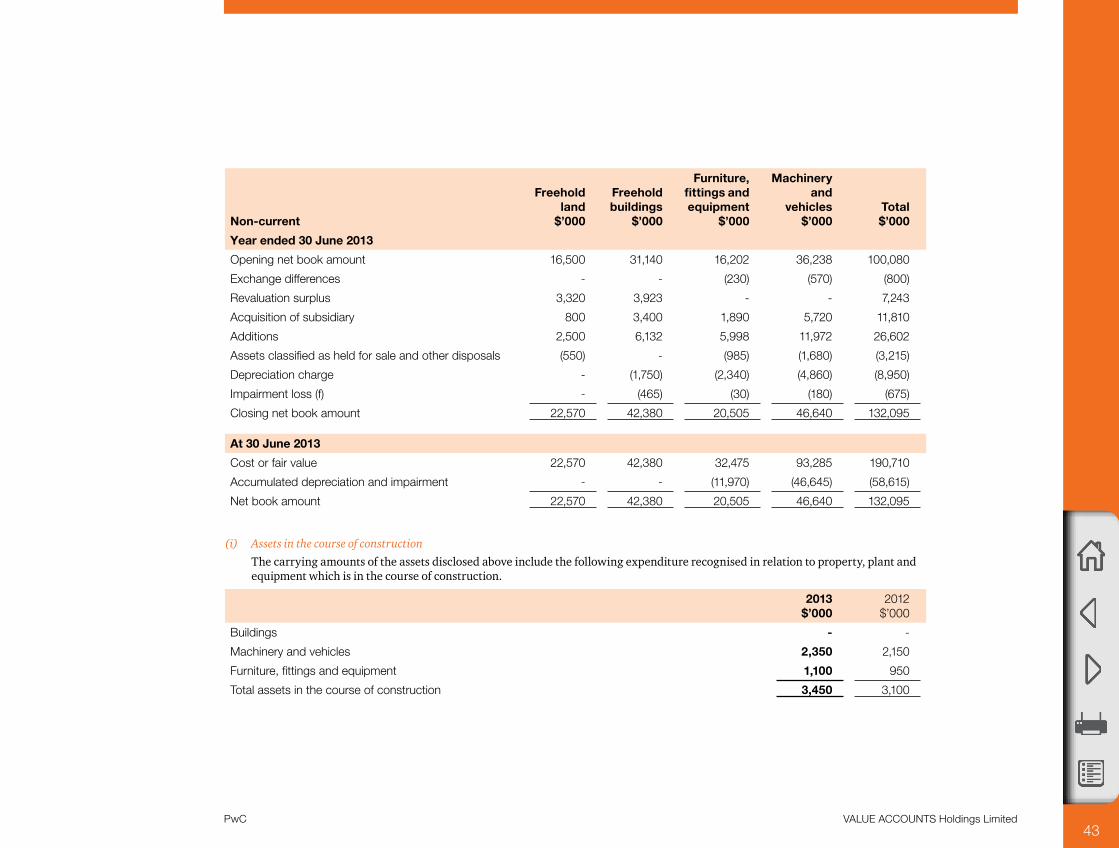
43VALUE ACCOUNTS Holdings LimitedPwC
Non-current
Freehold land
$’000
Freehold buildings
$’000
Furniture, fittings and equipment
$’000
Machinery and
vehicles $’000
Total $’000
Year ended 30 June 2013
Opening net book amount 16,500 31,140 16,202 36,238 100,080
Exchange differences - - (230) (570) (800)
Revaluation surplus 3,320 3,923 - - 7,243
Acquisition of subsidiary 800 3,400 1,890 5,720 11,810
Additions 2,500 6,132 5,998 11,972 26,602
Assets classified as held for sale and other disposals (550) - (985) (1,680) (3,215)
Depreciation charge - (1,750) (2,340) (4,860) (8,950)
Impairment loss (f) - (465) (30) (180) (675)
Closing net book amount 22,570 42,380 20,505 46,640 132,095
At 30 June 2013
Cost or fair value 22,570 42,380 32,475 93,285 190,710
Accumulated depreciation and impairment - - (11,970) (46,645) (58,615)
Net book amount 22,570 42,380 20,505 46,640 132,095
(i) Assets in the course of construction
The carrying amounts of the assets disclosed above include the following expenditure recognised in relation to property, plant and equipment which is in the course of construction.
2013 $’000
2012 $’000
Buildings - -
Machinery and vehicles 2,350 2,150
Furniture, fittings and equipment 1,100 950
Total assets in the course of construction 3,450 3,100

44VALUE ACCOUNTS Holdings LimitedPwC
(ii) Leased assets
Furniture, fittings and equipment includes the following assets which are held as lessee under a finance lease.
2013 $’000
2012 $’000
Leasehold equipment
Cost 3,000 3,000
Accumulated depreciation (250) -
Net book amount 2,750 3,000
(iii) Non-current assets pledged as security
Refer to note F6 in the Appendix to the financial statements for information on non-current assets pledged as security by the group.
(iv) Impairment loss and compensation
The impairment loss relates to assets that were damaged by a fire – refer to note A2(b). The whole amount was recognised in profit or loss, as there was no amount included in the asset revaluation surplus relating to the relevant assets. The recoverable amount of the assets was determined by an independent valuer as their fair values less cost to sell, based on an active market.An amount of $200,000 (2012 – nil) was received by the group from an insurance company as compensation for damage to a building caused by the fire.
(v) Accounting for property, plant and equipment
Land and buildings are recognised at fair value based on periodic, but at least triennial, valuations by external independent valuers, less subsequent depreciation for buildings. All other property, plant and equipment is recognised at historical cost less depreciation.
Depreciation is calculated using the straight-line method to allocate their cost or revalued amounts, net of their residual values, over their estimated useful lives or, in the case of leasehold improvements and certain leased plant and equipment, the shorter lease term as follows:
• Buildings 25-40 years• Machinery 10-5 years• Vehicles 3-5 years• Furniture, fittings and equipment 3-8 years• Leased plant and equipment 10-15 years
(vi) Valuations of land and buildings
Land and buildings are valued at fair value: that is, the amounts for which the assets could be exchanged between willing parties in an arm’s length transaction, based on current prices in an active market for similar properties in the same location and condition. The 2013 revaluations were made by the directors as at 30 June 2013. The 2012 revaluations were based on independent assessments by a member of the Australian Property Institute as at 30 June 2012. The revaluation surplus net of applicable deferred income taxes was credited to other reserves in shareholders’ equity (note E5).
45VALUE ACCOUNTS Holdings LimitedPwC
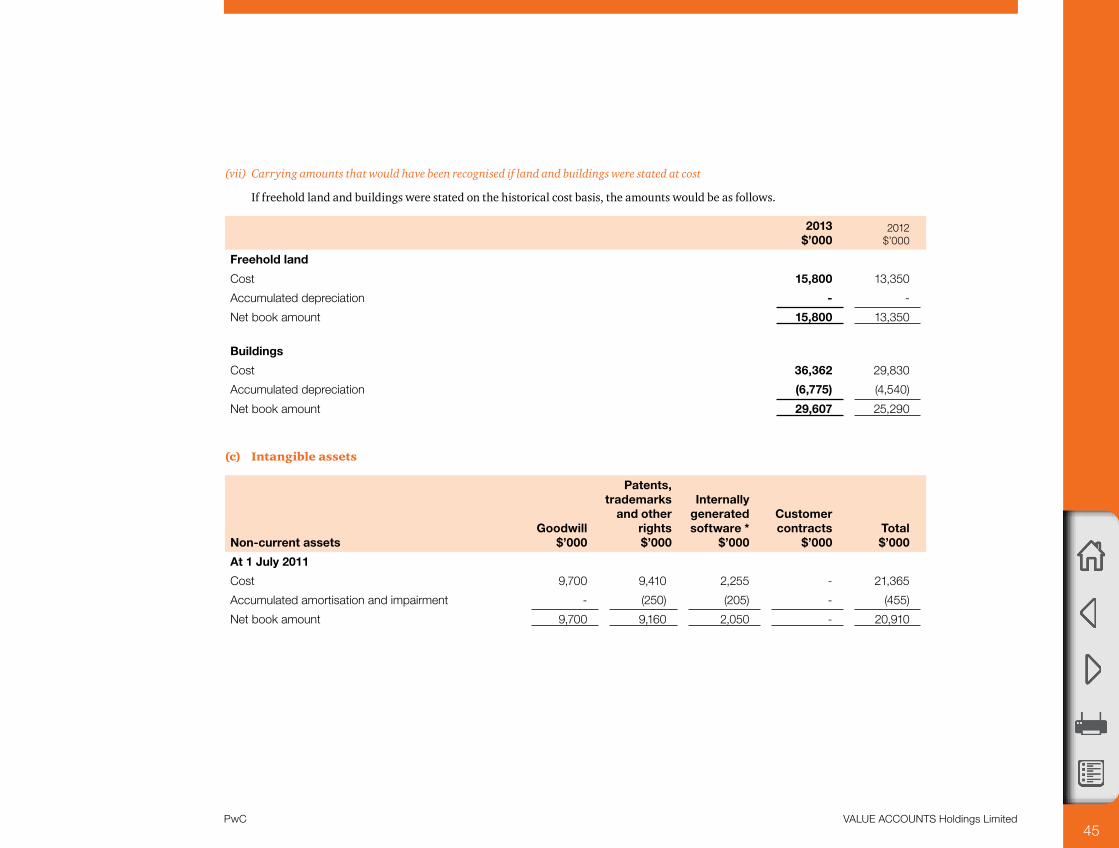
(vii) Carrying amounts that would have been recognised if land and buildings were stated at cost
If freehold land and buildings were stated on the historical cost basis, the amounts would be as follows.
2013 $’000
2012 $’000
Freehold land
Cost 15,800 13,350
Accumulated depreciation - -
Net book amount 15,800 13,350
Buildings
Cost 36,362 29,830
Accumulated depreciation (6,775) (4,540)
Net book amount 29,607 25,290
(c) Intangible assets
Non-current assetsGoodwill
$’000
Patents, trademarks
and other rights $’000
Internally generated software *
$’000
Customer contracts
$’000Total $’000
At 1 July 2011
Cost 9,700 9,410 2,255 - 21,365
Accumulated amortisation and impairment - (250) (205) - (455)
Net book amount 9,700 9,160 2,050 - 20,910

46VALUE ACCOUNTS Holdings LimitedPwC
Non-current assetsGoodwill
$’000
Patents, trademarks
and other rights $’000
Internally generated software *
$’000
Customer contracts
$’000Total $’000
Year ended 30 June 2012
Opening net book amount 9,700 9,160 2,050 - 20,910
Additions – acquisition - - 720 - 720
Exchange differences 45 - - 45
Amortisation charge ** - (525) (205) - (730)
Closing net book amount 9,745 8,635 2,565 - 20,945
At 30 June 2012
Cost 9,745 9,410 2,975 - 22,030
Accumulated amortisation and impairment - (775) (410) - (1,185)
Net book amount 9,745 8,635 2,565 - 20,945
Non-current assets
Year ended 30 June 2013
Opening net book amount 9,745 8,635 2,565 - 20,945
Additions – internal development - - 880 - 880
Acquisition of business 1,115 3,020 - 3,180 7,315
Exchange differences (145) - - - (145)
Impairment charge *** (2,410) - - - (2,410)
Amortisation charge ** - (525) (300) (1,210) (2,035)
Closing net book amount 8,305 11,130 3,145 1,970 24,550
At 30 June 2013
Cost 10,715 12,430 3,855 3,180 30,180
Accumulated amortisation and impairment (2,410) (1,300) (710) (1,210) (5,630)
Net book amount 8,305 11,130 3,145 1,970 24,550
* Software consists of capitalised costs for the development of a tailored software solution for the group’s own use.
** Amortisation expenses are included in cost of sales of goods ($1,050,000; 2012 – $450,000), cost of providing services ($475,000; 2012 – $125,000), marketing expense ($310,000; 2012 – $45,000) and administration expenses ($200,000; 2012 – $110,000).
*** The carrying amount of the furniture manufacturing segment in South East Asia has been reduced to its recoverable amount through recognition of an impairment loss
against goodwill. This loss has been disclosed as a separate line item in profit or loss.

PwC VALUE ACCOUNTS Holdings Limited 47
(i) Accounting for intangible assets
The group amortises intangible assets with a limited useful life using the straight-line method over the following periods:
• Trademark and licences 3-5 years• IT development and software 3-5 years• Customer contracts 1 to 3 years• Capitalised development costs 3-5 years
(ii) Impairment tests for goodwill
Goodwill is monitored by management at the level of the six operating segments (see note A1 for details).
A segment-level summary of the goodwill allocation is presented below.
2013Australia
$’000
South East Asia
$’000Total $’000
IT consulting 3,800 2,870 6,670
Furniture – manufacturing 520 - 520
Electronic equipment 1,115 - 1,115
5,435 2,870 8,305
2012Australia
$’000
South East Asia
$’000Total
$’000
IT consulting 3,800 3,015 6,815
Furniture – manufacturing 520 2,410 2,930
4,320 5,425 9,745
(iii) Significant estimate: key assumptions used for value-in-use calculations
The group tests whether goodwill has suffered any impairment on an annual basis. The recoverable amount of a cash generating unit (CGU) is determined based on value-in-use calculations which require the use of assumptions. The calculations use cash flow projections based on financial budgets approved by management covering a five-year period. Cash flows beyond the five-year period are extrapolated using the estimated growth rates stated below. These growth rates do not exceed the long-term average growth rates for the industry in which each CGU operates.

PwC VALUE ACCOUNTS Holdings Limited 48
The following table sets out the key assumptions for those CGUs that have significant goodwill allocated to them:
Budget periodGrowth rate
beyond budget period **
Discount rate ***Gross margin * Growth rate
2013 %
2012 %
2013 %
2012 %
2013 %
2012 %
2013 %
2012 %
Furniture – manufacturing
South East Asia 47.0 44.0 5.1 4.5 3.5 3.2 14.7 14.3
IT consulting
Australia 60.0 60.0 4.2 3.3 2.2 2.2 14.0 14.4
South East Asia 55.0 54.0 4.8 4.3 2.0 1.8 14.8 15.1
Electronic equipment
Australia 40.0 - 3.2 - 2.1 - 16.0 -
* Budgeted gross margin
** Weighted average growth rate used to extrapolate cash flows beyond the budget period
*** In performing the value-in-use calculations for each CGU, the group has applied post-tax discount rates to discount the estimated future post-tax cash flows. The equivalent pre-tax discount rates are disclosed above. The same post-tax discount rates were applied in 2012 and 2013. The movements in the equivalent pre-tax discount rates between 2012 and 2013 reflect changes in the anticipated timing of future cash flows.
These assumptions have been used for the analysis of each CGU within an operating segment. Management determined budgeted gross margin based on past performance and its expectations for the future. The weighted average growth rates used are consistent with forecasts included in industry reports. The discount rates used reflect specific risks relating to the relevant segments and the countries in which they operate.
(iv) Impairment charge
The impairment charge of $2,410,000 arose in a furniture manufacturing CGU in Indonesia (included in the South East Asian segment summary) following a decision to reduce the manufacturing output allocated to these operations. This was a result of a redefinition of the group’s allocation of manufacturing volumes across all CGUs in order to benefit from advantageous market conditions. Following this decision, the group reassessed the depreciation policies of its property, plant and equipment in this country and estimated that their useful lives will not be affected following this decision. No class of asset other than goodwill was impaired.
(v) Significant estimate: impact of possible changes in key assumptions
Furniture manufacturing CGU – South East Asia
If the budgeted gross margin used in the value-in-use calculation for the furniture manufacturing CGU in Indonesia had been 10% lower than management’s estimates at 30 June 2013 (37% instead of 47%), the group would have recognised an impairment against the carrying amount of property, plant and equipment of $1,300,000.
If the pre-tax discount rate applied to the cash flow projections of this CGU had been 1% higher than management’s estimates (15.7% instead of 14.7%), the group would have recognised an impairment against property, plant and equipment of $600,000. In 2012 there were no reasonably possible changes in any of the key assumptions that would have caused the carrying amount of the Indonesian furniture manufacturing CGU to exceed its recoverable amount.
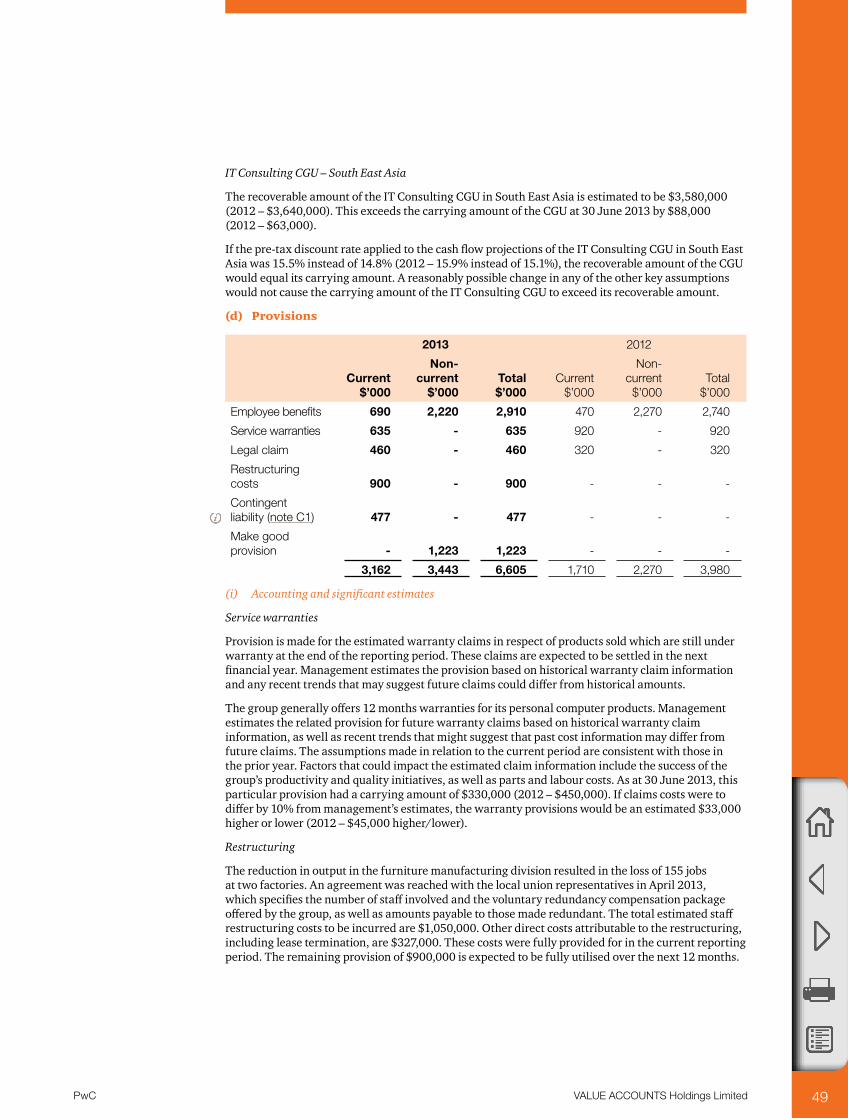
PwC VALUE ACCOUNTS Holdings Limited 49
IT Consulting CGU – South East Asia
The recoverable amount of the IT Consulting CGU in South East Asia is estimated to be $3,580,000 (2012 – $3,640,000). This exceeds the carrying amount of the CGU at 30 June 2013 by $88,000 (2012 – $63,000).
If the pre-tax discount rate applied to the cash flow projections of the IT Consulting CGU in South East Asia was 15.5% instead of 14.8% (2012 – 15.9% instead of 15.1%), the recoverable amount of the CGU would equal its carrying amount. A reasonably possible change in any of the other key assumptions would not cause the carrying amount of the IT Consulting CGU to exceed its recoverable amount.
(d) Provisions
2013 2012
Current $’000
Non-current
$’000Total $’000
Current $’000
Non-current $’000
Total $’000
Employee benefits 690 2,220 2,910 470 2,270 2,740
Service warranties 635 - 635 920 - 920
Legal claim 460 - 460 320 - 320
Restructuring costs 900 - 900 - - -
Contingent liability (note C1) 477 - 477 - - -
Make good provision - 1,223 1,223 - - -
3,162 3,443 6,605 1,710 2,270 3,980
(i) Accounting and significant estimates
Service warranties
Provision is made for the estimated warranty claims in respect of products sold which are still under warranty at the end of the reporting period. These claims are expected to be settled in the next financial year. Management estimates the provision based on historical warranty claim information and any recent trends that may suggest future claims could differ from historical amounts.
The group generally offers 12 months warranties for its personal computer products. Management estimates the related provision for future warranty claims based on historical warranty claim information, as well as recent trends that might suggest that past cost information may differ from future claims. The assumptions made in relation to the current period are consistent with those in the prior year. Factors that could impact the estimated claim information include the success of the group’s productivity and quality initiatives, as well as parts and labour costs. As at 30 June 2013, this particular provision had a carrying amount of $330,000 (2012 – $450,000). If claims costs were to differ by 10% from management’s estimates, the warranty provisions would be an estimated $33,000 higher or lower (2012 – $45,000 higher/lower).
Restructuring
The reduction in output in the furniture manufacturing division resulted in the loss of 155 jobs at two factories. An agreement was reached with the local union representatives in April 2013, which specifies the number of staff involved and the voluntary redundancy compensation package offered by the group, as well as amounts payable to those made redundant. The total estimated staff restructuring costs to be incurred are $1,050,000. Other direct costs attributable to the restructuring, including lease termination, are $327,000. These costs were fully provided for in the current reporting period. The remaining provision of $900,000 is expected to be fully utilised over the next 12 months.

PwC VALUE ACCOUNTS Holdings Limited 50
Make-good provision
VALUE ACCOUNTS Retail Pty Ltd is required to restore the leased premises of its retail stores to their original condition at the end of the respective lease terms. A provision has been recognised for the present value of the estimated expenditure required to remove any leasehold improvements. These costs have been capitalised as part of the cost of leasehold improvements and are amortised over the shorter of the term of the lease or the useful life of the assets.
Employee benefits
The provision for employee benefits relates to the group’s liability for long service leave and annual leave.
(ii) Movements in provisions
Movements in each class of provision during the financial year, other than employee benefits, are set out below.
2013
Restructuring obligations
$’000
Contingent liability
$’000
Service warranties
$’000
Legal claim $’000
Make good
provision $’000
Total $’000
Carrying amount at start of year - - 920 320 - 1,240
Acquired through business combination - 450 - - - 450
Additional provision charged to plant and equipment - - - - 1,035 1,035
Charged/(credited) to profit or loss
- additional provisions recognised 1,377 268 140 1,785
- unused amounts reversed - - (330) - (330)
- unwinding of discount 27 - - 188 215
Amounts used during the year (477) - (223) - (700)
Carrying amount at end of year 900 477 635 460 1,223 3,695
(iii) Amounts not expected to be settled within the next 12 months
The current provision for employee benefits includes accrued annual leave, vesting sick leave and long service leave. For long service leave it covers all unconditional entitlements where employees have completed the required period of service and also those where employees are entitled to pro-rata payments in certain circumstances. The entire amount of the provision of $690,000 (2012 – $470,000) is presented as current, since the group does not have an unconditional right to defer settlement for any of these obligations. However, based on past experience, the group does not expect all employees to take the full amount of accrued leave or require payment within the next 12 months. The following amounts reflect leave that is not to be expected to be taken or paid within the next 12 months.
2013 $’000
2012 $’000
Current leave obligations expected to be settled after 12 months 344 272

PwC VALUE ACCOUNTS Holdings Limited 51
A5 Contributed equity
This note explains the composition of the group’s contributed equity and any movements in contributed equity during the year.
Notes2013
Shares2012
Shares2013
$’0002012
$’000
(a) Share capital
Ordinary shares (c),(e)
Fully paid 53,961,178 51,104,358 73,289 58,953
Called to $2.88 (e) - 1,250,000 - 3,600
Calls in arrears (e) - - - (100)
53,961,178 52,354,358 73,289 62,453
7% non-redeemable participating preference shares fully paid (d) - 500,000 - 1,523
53,961,178 52,854,358 73,289 63,976
(b) Other equity securities
Value of conversion rights – convertible notes (f) 3,500 -
Deferred tax liability component (1,050) -
Treasury shares (g) (120,641) (99,280) (676) (550)
1,774 -
Total contributed equity 53,840,537 52,755,078 75,063 63,426
(c) Movements in ordinary share capital:
Details NotesNumber of
shares $’000
Opening balance 1 July 2011 52,111,430 61,096
Employee share scheme issues (i) 142,857 798
Dividend reinvestment plan issues (h) 100,071 559
Balance 30 June 2012 52,354,358 62,453
Dividend reinvestment plan issues (h) 93,904 565
Final call of $1.12 per share on 1,250,000 partly paid shares (e) - 1,400
Calls in arrears paid (e) - 100
Exercise of options – proceeds received (j) 228,000 1,203
Rights issue (k) 1,284,916 7,708
73,429
Less: Transaction costs arising on share issue (200)
Deferred tax credit recognised directly in equity 60
Balance 30 June 2013 53,961,178 73,289
The purpose of the rights issue and the call on partly paid shares was to repay borrowings which had been drawn to finance the establishment of the furniture retail division, expand the Maitland manufacturing facilities, and acquire shares in VALUE ACCOUNTS Electronics Pty Ltd. Funds raised from the other share issues were used for general working capital purposes.

PwC VALUE ACCOUNTS Holdings Limited 52
(d) Movements in 7% non-redeemable participating preference share capital
Details NotesNumber
of shares $’000
Opening balance 1 July 2011/30 June 2012 500,000 1,523
Shares bought back on-market and cancelled (l) (500,000) (1,350)
Buy-back transaction costs (l) - (45)
Current tax credit recognised directly in equity (l) - 15
Transfer to retained earnings (l) - (143)
Balance 30 June 2013 - -
(e) Ordinary shares
Ordinary shares entitle the holder to participate in dividends and the proceeds on winding up of the company in proportion to the number of and amounts paid on the shares held. This is subject to the prior entitlements of the 6% redeemable preference shares, which are classified as liabilities (refer to note A3(c)).
On a show of hands every holder of ordinary shares present at a meeting in person or by proxy, is entitled to one vote, and upon a poll each share is entitled to one vote.
Ordinary shares have no par value and the company does not have a limited amount of authorised capital.
At 30 June 2012 there were 1,250,000 ordinary shares called to 88 cents, on which a further $1.12 was outstanding. The outstanding amount, together with calls in arrears of $100,000, was received on 3 May 2013.
(f) Other equity securities
The amount shown for other equity securities is the value of the conversion rights relating to the 7% convertible notes, details of which are shown in note A3(c).
(g) Treasury shares
Treasury shares are shares in VALUE ACCOUNTS Holdings Limited that are held by the VALUE ACCOUNTS Employee Share Trust for the purpose of issuing shares under the VALUE ACCOUNTS Employee share scheme and the executive short-term incentive (STI) scheme.
DetailsNumber
of shares $’000
Opening balance 1 July 2011 (46,916) (251)
Acquisition of shares by the Trust (52,364) (299)
Balance 30 June 2012 (99,280) (550)
Acquisition of shares by the Trust (207,636) (1,217)
Issue of deferred shares under the executive STI scheme 40,373 216
Employee share scheme issue 145,902 875
Balance 30 June 2012 (120,641) (676)
(h) Dividend reinvestment plan
The company has established a dividend reinvestment plan under which holders of ordinary shares may elect to have all or part of their dividend entitlements satisfied by the issue of new ordinary shares rather than by being paid in cash. Shares are issued under the plan at a 2.5% discount to the market price.
(i) Employee share scheme
Information relating to the employee share scheme, including details of shares issued under the scheme, is set out in note F4.

PwC VALUE ACCOUNTS Holdings Limited 53
(j) Options
Information relating to the VALUE ACCOUNTS Employee Option Plan, including details of options issued, exercised and lapsed during the financial year and options outstanding at the end of the reporting period, is set out in note F4.
(k) Rights issue
On 10 April 2013 the company invited its shareholders to subscribe to a rights issue of 1,284,916 ordinary shares at an issue price of $6.00 per share on the basis of 1 share for every 10 fully or partly paid ordinary shares held, with such shares to be issued on, and rank for dividends after, 4 June 2013. The issue was fully subscribed.
(l) Share buy-back
During April/May 2013 the company purchased and cancelled all 500,000 7% non-redeemable participating preference shares on-market in order to simplify the company’s capital structure. The buy-back and cancellation were approved by shareholders at last year’s annual general meeting. The shares were acquired at an average price of $2.70 per share, with prices ranging from $2.65 to $2.73. The total cost of $1,380,000, including $30,000 of after tax transaction costs, was deducted from preference shareholder equity. As all the shares of that class were bought back and cancelled, the remaining balance of $143,000 was transferred to retained earnings. The total reduction in paid up capital was $1,523,000.
There is no current on-market buy-back.
The 7% non-redeemable participating preference shares were entitled to dividends at the rate of 7% per annum when sufficient profits were available, but were non-cumulative. They would have participated equally with ordinary shares on winding up of the company.

PwC VALUE ACCOUNTS Holdings Limited 54
B Risk
Discusses the group’s exposure to various financial risks,
explains how these affect the group’s financial position and
performance and what the group does to manage these risks.
B1 Critical estimates, judgements and errors 55
B2 Financial risks 57
B3 Capital management 67
PwC VALUE ACCOUNTS Holdings Limited 55
This section of the notes discusses the group’s exposure to various risks and shows how these could affect the group’s financial position and performance.
B1 Critical estimates, judgements and errors
The preparation of financial statements requires the use of accounting estimates which, by definition, will seldom equal the actual results. Management also needs to exercise judgement in applying the group’s accounting policies. This note provides an overview of the areas that involved a higher degree of judgement or complexity. It also covers those items which are more likely to be materially adjusted due to estimates and assumptions turning out to be wrong. Detailed information about each of these estimates and judgements is included in section A together with information about the basis of calculation for each affected line item in the financial statements.
The areas are:
• Estimated goodwill impairment• Estimation of fair values of investment property• Estimation of provision for warranty claims• Estimation of current tax payable and current tax expense• Recognition of deferred tax asset for carried forward tax losses• Recognition of revenue • Impairment of available-for-sale financial assets .
Estimates and judgements are continually evaluated. They are based on historical experience and other factors, including expectations of future events that may have a financial impact on the entity and that are believed to be reasonable under the circumstances.
(a) Revision of useful lives of plant and equipment
During the year the estimated total useful lives to a subsidiary of certain items of plant and equipment used in the manufacture of furniture were revised. The net effect of the changes in the current financial year was an increase in depreciation expense of $980,000.
Assuming the assets are held until the end of their estimated useful lives, depreciation in future years in relation to these assets will be increased by the following amounts:
Year ending 30 June $’000
2013 740
2014 610
2015 460
2016 430
(b) Correction of error
In March 2013, a subsidiary undertook a detailed review of its leasing contracts and discovered that the terms and conditions of a contract for the lease of equipment had been misinterpreted. As a consequence, the equipment had been incorrectly accounted for as a finance lease rather than as an operating lease.
The error has been corrected by restating each of the affected financial statement line items for the prior periods as follows:
B Risk

56VALUE ACCOUNTS Holdings LimitedPwC
30 June 2012 $’000
Increase/ (Decrease)
$’000
30 June 2012 (Restated)
$’00030 June 2011
$’000
Increase/ (Decrease)
$’000
1 July 2011 (Restated)
$’000
Balance sheet (extract)
Property, plant and equipment 111,380 (11,300) 100,080 99,795 (11,650) 88,145
Deferred tax asset 4,893 (218) 4,675 3,795 (305) 3,490
Current borrowings (10,293) 1,738 (8,555) (9,704) 1,835 (7,869)
Non-current borrowings (71,814) 10,289 (61,525) (69,080) 10,830 (58,250)
Net assets 117,180 509 117,689 93,472 710 94,182
Retained earnings (36,520) (509) (37,029) (20,685) (710) (21,395)
Total equity (117,180) (509) (117,689) (93,472) (710) (94,182)
2012 $’000
Profit Increase/ (Decrease)
$’000
2012 (Restated)
$’000
Income statement (extract)
Cost of sales of goods (41,940) (350) (42,290)
Finance costs (6,832) 638 (6,194)
Profit before income tax 40,353 288 40,641
Income tax expense (11,802) (87) (11,889)
Profit from discontinued operation 399 - 399
Profit for the period 28,950 201 29,151
Profit is attributable to:
Owners of VALUE ACCOUNTS Holdings Limited 26,631 201 26,832
Non-controlling interests 2,319 - 2,319
28,950 201 29,151

57VALUE ACCOUNTS Holdings LimitedPwC
2012 $’000
Profit Increase/ (Decrease)
$’000
2012 (Restated)
$’000
Statement of comprehensive income (extract)
Profit for the period 29,112 39 29,151
Other comprehensive income for the period 5,599 - 5,599
Total comprehensive income for the period 34,711 39 34,750
Total comprehensive income is attributable to:
Owners of VALUE ACCOUNTS Holdings Limited 32,135 39 32,174
Non-controlling interests 2,576 - 2,576
34,711 39 34,750
Basic and diluted earnings per share for the prior year have also been restated. The amount of the correction for both basic and diluted earnings per share was an increase of $0.1 cents per share.
The correction further affected some of the amounts disclosed in note E1(b). Depreciation expense for the prior year was reduced by $250,000 and rental expense relating to operating leases increased by $275,000.
B2 Financial risks
This note explains the group’s exposure to financial risks and how these risks could affect the group’s future financial performance. Current year profit and loss information has been included where relevant to add further context.
Risk Exposure arising from Measurement Management
Market risk – foreign exchange
Future commercial transactions
Recognised financial assets and liabilities not denominated in AUD
Cash flow forecasting
Sensitivity analysis
Forward foreign exchange contracts
Market risk – interest rate Long-term borrowings at variable rates Sensitivity analysis Interest rate swaps
Credit risk Cash and cash equivalents, trade receivables, derivative financial instruments and available-for-sale debt instruments
Aging analysis
Credit ratings
Credit limits, retention of title over goods sold, letters of credits
Liquidity risk Borrowings and other liabilities Rolling cash flow forecasts Availability of committed credit lines and borrowing facilities

PwC VALUE ACCOUNTS Holdings Limited 58
The group’s risk management is carried out by a central treasury department (group treasury) under policies approved by the board of directors. Group treasury identifies, evaluates and hedges financial risks in close co-operation with the group’s operating units. The board provides written principles for overall risk management, as well as policies covering specific areas, such as foreign exchange risk, interest rate risk, credit risk, use of derivative financial instruments and non-derivative financial instruments, and investment of excess liquidity.
Derivatives are only used for hedging purposes and not as trading or speculative instruments. The group has the following derivative financial instruments:
Note
2013 $’000
2012 $’000
Current assets
Forward foreign exchange contracts – held for trading (a)(i) 1,088 640
Total current derivative financial instrument assets 1,088 640
Non-current assets
Interest rate swap contracts – cash flow hedges (a)(ii) 308 712
Total non-current derivative financial instrument assets 308 712
Current liabilities
Forward foreign exchange contracts – cash flow hedges (a)(i) 610 621
Total current derivative financial instrument liabilities 610 621
Net derivative financial instruments 786 731
Accounting policy
Derivatives are classified as held for trading and accounted for at fair value through profit or loss unless they are designated as hedges. They are presented as current assets or liabilities if they are expected to be settled within 12 months after the end of the reporting period.
(a) Market risk
(i) Foreign exchange risk
Group companies are required to hedge their foreign exchange risk exposure using forward contracts transacted with Group Treasury.
The Group Treasury’s risk management policy is to hedge between 75% and 100% of anticipated cash flows (mainly export sales and purchase of inventory) in US dollars for the subsequent 12 months. Approximately 90% (2012 – 95%) of projected purchases qualify as ‘highly probable’ forecast transactions for hedge accounting purposes.
Instruments used by the group
The South East Asian operations use materials purchased from the United States. In order to protect against exchange rate movements, the group has entered into forward exchange contracts to purchase US dollars. These contracts are hedging highly probable forecasted purchases for the ensuing financial year. The contracts are timed to mature when payments for major shipments of component parts are scheduled to be made.
The group has further entered into forward exchange contracts in relation to projected sales that do not qualify as ‘highly probable’ forecast transactions and hence do not satisfy the requirements for hedge accounting (economic hedges). These contracts are subject to the same risk management policies as all other derivative contracts. However, they are accounted for as held for trading with gains (losses) recognised in profit or loss.

59VALUE ACCOUNTS Holdings LimitedPwC
Exposure
The group’s exposure to foreign currency risk at the end of the reporting period, expressed in Australian dollar, was as follows:
30 June 2013 30 June 2012
USD $’000
SGD $’000
IDR $’000
USD $’000
SGD $’000
IDR $’000
Trade receivables 5,150 2,025 - 4,130 945
Bank loans (18,765) - (1,509) (8,250) - -
Trade payables (4,250) - - (5,130) - -
Forward exchange contracts
– buy foreign currency (cash flow hedges) 21,519 - - 18,613 - -
– sell foreign currency (held for trading) 12,073 - - 11,422 - -
Amounts recognised in profit or loss and other comprehensive income
During the year, the following foreign-exchange related amounts were recognised in profit or loss and other comprehensive income:
2013 $’000
2012 $’000
Amounts recognised in profit or loss
Net foreign exchange gain/(loss) included in other income/other expenses 464 (590)
Exchange losses on foreign currency borrowing included in finance costs (2,022) (1,810)
Total net foreign exchange (losses) recognised in profit before income tax for the period (1,588) (2,400)
Net gain on foreign currency derivatives not qualifying as hedges 448 640
(Loss) for ineffective portion of derivatives designated as cash flow hedges (40) -
Net gains (losses) recognised in other comprehensive income (note E5)
Cash flow hedges (218) (1,012)
Translation of foreign operations and net investment hedges (257) 2,159
(Loss)/gain reclassified from other comprehensive income
– included in acquisition cost of components (231) 679

PwC VALUE ACCOUNTS Holdings Limited 60
Sensitivity
As shown in the table above, the group is primarily exposed to changes in US/AUD exchange rates. The sensitivity of profit or loss to changes in the exchange rates arises mainly from US-dollar denominated financial instruments and the impact on other components of equity arises from foreign forward exchange contracts designated as cash flow hedges.
Impact on post tax profit
Impact on other components of equity
2013 $’000
2012 $’000
2013 $’000
2012 $’000
US/AUD exchange rate – increase 10% (10%) (2,194) (894) 1,506 1,311
US/AUD exchange rate – decrease 10% (10%) 1,795 747 (1,232) (1,045)
Profit is more sensitive to movements in the Australian dollar/US dollar exchange rates in 2013 than 2012 because of the increased amount of US dollar denominated borrowings. Equity is more sensitive to movements in the Australian dollar/US dollar exchange rates in 2013 than 2012 because of the increased amount of forward foreign exchange contracts. The group’s exposure to other foreign exchange movements is not material.
(ii) Cash flow and fair value interest rate risk
The group’s main interest rate risk arises from long-term borrowings with variable rates, which expose the group to cash flow interest rate risk. Group policy is to maintain at least 60% of its borrowings at fixed rate using interest rate swaps to achieve this when necessary. During 2013 and 2012, the group’s borrowings at variable rate were mainly denominated in Australian Dollars and US Dollars.
The group’s fixed rate borrowings and receivables are carried at amortised cost. They are therefore not subject to interest rate risk as defined in AASB 7, since neither the carrying amount nor the future cash flows will fluctuate because of a change in market interest rates.
The group manages its cash flow interest rate risk by using floating-to-fixed interest rate swaps. Under these swaps, the group agrees with other parties to exchange, at specified intervals (mainly quarterly), the difference between fixed contract rates and floating rate interest amounts calculated by reference to the agreed notional principal amounts. Generally, the group raises long-term borrowings at floating rates and swaps them into fixed rates that are lower than those available if the group borrowed at fixed rates directly.
Instruments used by the group
Swaps currently in place cover approximately 30% (2012 – 10%) of the variable loan principal outstanding. The fixed interest rates range between 7.8% and 8.3% (2012 – 9.0% and 9.6%) and the variable rates are between 0.5% and 1.0% above the 90-day bank bill rate which at the end of the reporting period was 8.2% (2012 – 9.4%).
The contracts require settlement of net interest receivable or payable each 90 days. The settlement dates coincide with the dates on which interest is payable on the underlying debt. The contracts are settled on a net basis.
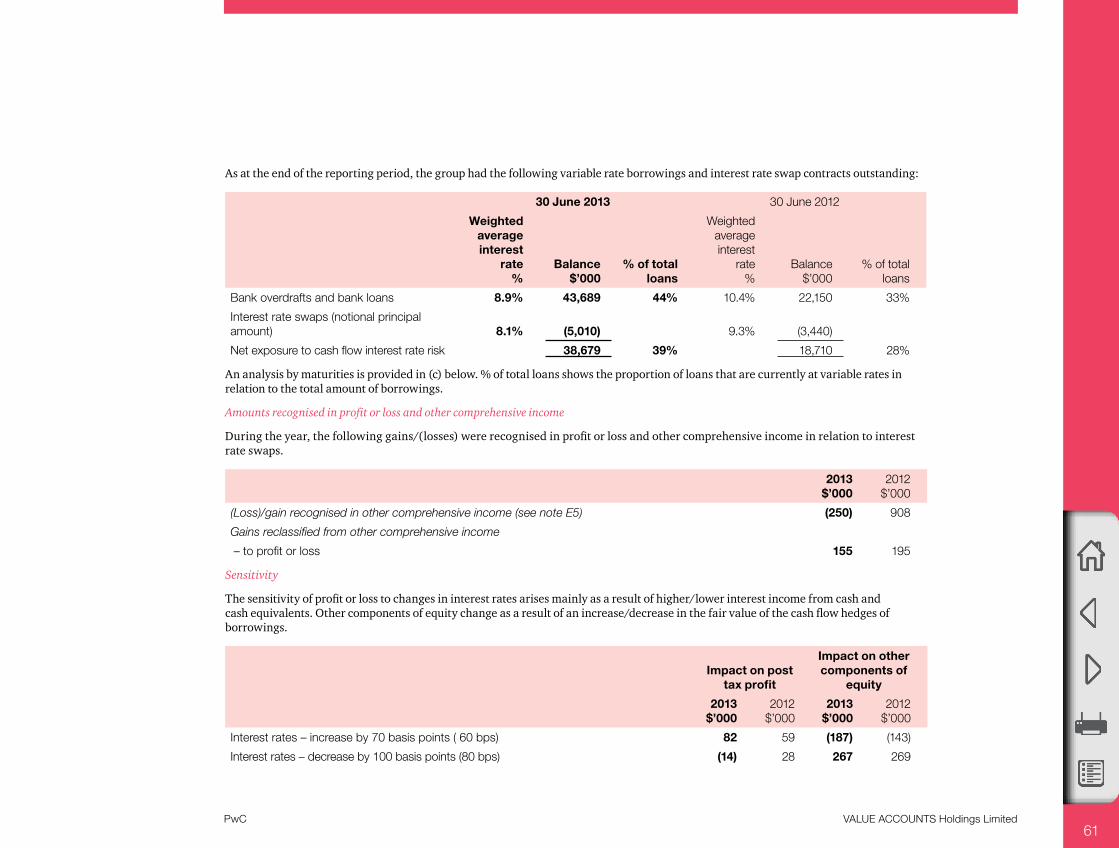
61VALUE ACCOUNTS Holdings LimitedPwC
As at the end of the reporting period, the group had the following variable rate borrowings and interest rate swap contracts outstanding:
30 June 2013 30 June 2012
Weighted average interest
rate %
Balance $’000
% of total loans
Weighted average interest
rate %
Balance $’000
% of total loans
Bank overdrafts and bank loans 8.9% 43,689 44% 10.4% 22,150 33%
Interest rate swaps (notional principal amount) 8.1% (5,010) 9.3% (3,440)
Net exposure to cash flow interest rate risk 38,679 39% 18,710 28%
An analysis by maturities is provided in (c) below. % of total loans shows the proportion of loans that are currently at variable rates in relation to the total amount of borrowings.
Amounts recognised in profit or loss and other comprehensive income
During the year, the following gains/(losses) were recognised in profit or loss and other comprehensive income in relation to interest rate swaps.
2013 $’000
2012 $’000
(Loss)/gain recognised in other comprehensive income (see note E5) (250) 908
Gains reclassified from other comprehensive income
– to profit or loss 155 195
Sensitivity
The sensitivity of profit or loss to changes in interest rates arises mainly as a result of higher/lower interest income from cash and cash equivalents. Other components of equity change as a result of an increase/decrease in the fair value of the cash flow hedges of borrowings.
Impact on post tax profit
Impact on other components of
equity
2013 $’000
2012 $’000
2013 $’000
2012 $’000
Interest rates – increase by 70 basis points ( 60 bps) 82 59 (187) (143)
Interest rates – decrease by 100 basis points (80 bps) (14) 28 267 269

PwC VALUE ACCOUNTS Holdings Limited 62
(b) Credit risk
Credit risk arises from cash and cash equivalents, favourable derivative financial instruments and deposits with banks and financial institutions, as well as credit exposures to wholesale and retail customers, including outstanding receivables and committed transactions.
Risk management
Credit risk is managed on a group basis. For banks and financial institutions, only independently rated parties with a minimum rating of ‘A’ are accepted.
If wholesale customers are independently rated, these ratings are used. Otherwise, if there is no independent rating, risk control assesses the credit quality of the customer, taking into account its financial position, past experience and other factors. Individual risk limits are set based on internal or external ratings in accordance with limits set by the board. The compliance with credit limits by wholesale customers is regularly monitored by line management.
Sales to retail customers are required to be settled in cash or using major credit cards, mitigating credit risk. There are no significant concentrations of credit risk, whether through exposure to individual customers, specific industry sectors and/or regions.
For derivative financial instruments, management has established limits so that, at any time, less than 10% of the fair value of favourable contracts outstanding are with any individual counterparty.
Security
For wholesale customers without credit rating, the group generally retains title over the goods sold until full payment is received, thus limiting the loss from a possible default to the profit margin made on the sale. For some trade receivables the group may also obtain security in the form of guarantees, deeds of undertaking or letters of credit which can be called upon if the counterparty is in default under the terms of the agreement.
As at 30 June 2013 the fair value of collateral held by the group in relation to trade receivables was $580,000 (2012 – $280,000). The group had not sold or re-pledged any collateral.
Guarantees
Credit risk also arises in relation to financial guarantees given to certain parties (see notes F7 and F8 for details). Such guarantees are only provided in exceptional circumstances and are subject to specific board approval.
Credit quality
The credit quality of the group’s material financial assets that are neither past due nor impaired can be assessed by reference to external credit ratings or to historical information about counterparty default rates.
2013 $’000
2012 $’000
Trade receivables
Counterparties with external credit rating (Moody’s)
A 5,700 4,031
BBB 3,100 2,100
BB 1,970 600
10,770 6,731
Counterparties without external credit rating *
Group 1 750 555
Group 2 2,102 2,081
Group 3 2,300 256
5,152 2,892
Total trade receivables 15,922 9,623
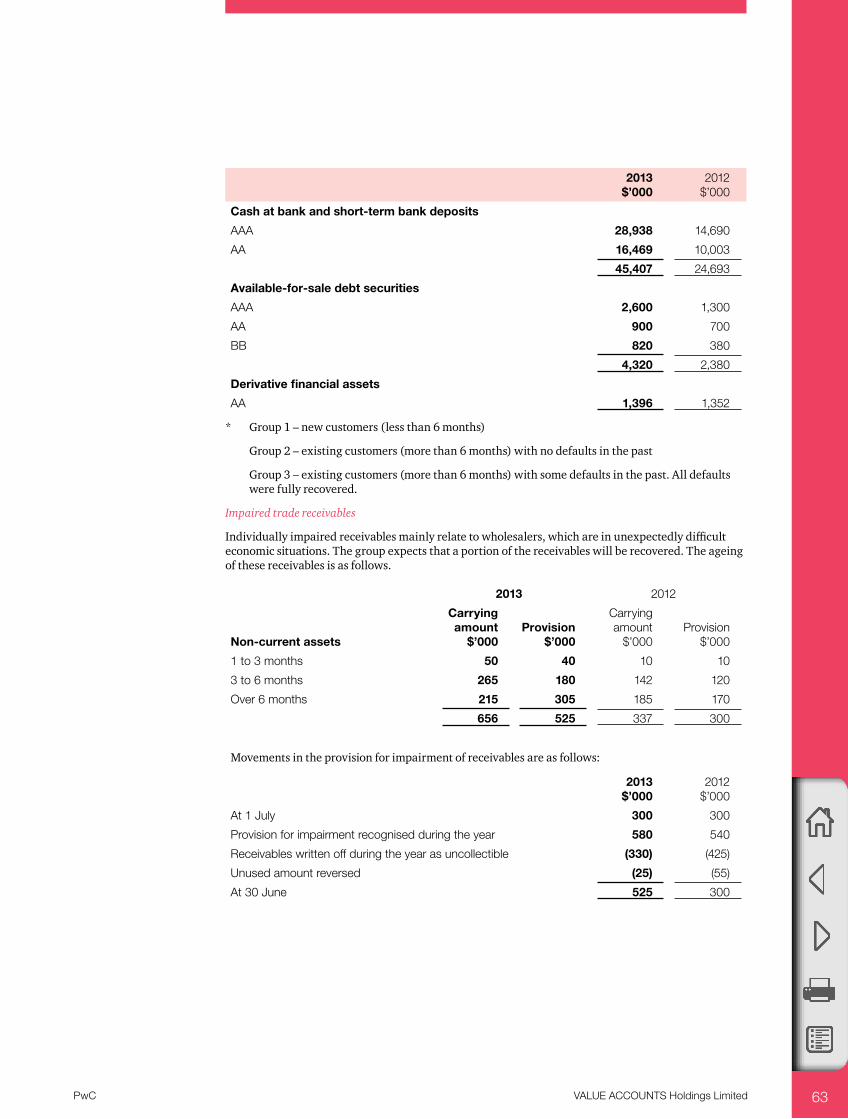
PwC VALUE ACCOUNTS Holdings Limited 63
2013 $’000
2012 $’000
Cash at bank and short-term bank deposits
AAA 28,938 14,690
AA 16,469 10,003
45,407 24,693
Available-for-sale debt securities
AAA 2,600 1,300
AA 900 700
BB 820 380
4,320 2,380
Derivative financial assets
AA 1,396 1,352
* Group 1 – new customers (less than 6 months)
Group 2 – existing customers (more than 6 months) with no defaults in the past
Group 3 – existing customers (more than 6 months) with some defaults in the past. All defaults were fully recovered.
Impaired trade receivables
Individually impaired receivables mainly relate to wholesalers, which are in unexpectedly difficult economic situations. The group expects that a portion of the receivables will be recovered. The ageing of these receivables is as follows.
2013 2012
Non-current assets
Carrying amount
$’000Provision
$’000
Carrying amount
$’000Provision
$’000
1 to 3 months 50 40 10 10
3 to 6 months 265 180 142 120
Over 6 months 215 305 185 170
656 525 337 300
Movements in the provision for impairment of receivables are as follows:
2013 $’000
2012 $’000
At 1 July 300 300
Provision for impairment recognised during the year 580 540
Receivables written off during the year as uncollectible (330) (425)
Unused amount reversed (25) (55)
At 30 June 525 300

PwC VALUE ACCOUNTS Holdings Limited 64
Past due but not impaired receivables
As at 30 June 2013, trade receivables of $1,277,000 (2012 – $1,207,000) were past due but not impaired. These relate to a number of independent customers for whom there is no recent history of default. The ageing analysis of these trade receivables is as follows:
2013 $’000
2012 $’000
Up to 3 months 1,177 1,108
3 to 6 months 100 99
1,277 1,207
The other classes of financial assets do not contain any impaired assets or assets that are past due. Based on the credit history of these other classes, it is expected that these amounts will be received when due. The group does not hold any collateral in relation to these assets.
(c) Liquidity risk
Prudent liquidity risk management involves having sufficient cash and marketable securities and adequate amounts of committed credit facilities, which enables the group to meet its obligations when due and to close out its market positions. At the end of the reporting period the group held deposits at call of $44,657,000 (2012 – $24,093,000) that are expected to readily generate cash inflows for managing liquidity risk. Due to the dynamic nature of the underlying businesses, group treasury maintains flexibility in funding through committed credit lines.
Management monitors rolling forecasts of the group’s liquidity reserve (comprising the undrawn borrowing facilities below) and cash and cash equivalents (note E2(a)) on the basis of expected cash flows. This is generally carried out at local level in the operating companies of the group in accordance with practice and limits set by the group. These limits vary by location to take into account the liquidity of the market in which the entity operates. In addition, the group’s liquidity management policy involves projecting cash flows in major currencies and considering the level of liquid assets necessary to meet these, monitoring balance sheet liquidity ratios against internal and external regulatory requirements and maintaining debt financing plans.
(i) Financing arrangements
The group had access to the following undrawn borrowing facilities at the end of the reporting period:
2013 $’000
2012 $’000
Floating rate
- Expiring within one year (bank overdraft and bill facility) 12,400 10,620
- Expiring beyond one year (bank loans) 9,470 8,100
21,870 18,720
The bank overdraft facilities may be drawn at any time and may be terminated by the bank without notice. The unsecured bill acceptance facility may be drawn at any time and is subject to annual review. Subject to the continuance of satisfactory credit ratings, the bank loan facilities may be drawn at any time in either Australian or United States dollars and have an average maturity of 6.5 years (2012 – 6.9 years).
(ii) Maturities of financial liabilities
The tables below analyse the group’s financial liabilities into relevant maturity groupings based on their contractual maturities for:
• all non-derivative financial liabilities, and• net and gross settled derivative financial instruments for which the contractual maturities are
essential for an understanding of the timing of the cash flows.
The amounts disclosed in the table are the contractual undiscounted cash flows. Balances due within 12 months equal their carrying balances as the impact of discounting is not significant. For interest rate swaps the cash flows have been estimated using forward interest rates applicable at the end of the reporting period.

65VALUE ACCOUNTS Holdings LimitedPwC
Contractual maturities of financial liabilities
At 30 June 2013
Less than 6
months $’000
6 – 12 months
$’000
Between 1 and 2
years $’000
Between 2 and 5
years $’000
Over 5 years
$’000
Total contractual cash flows
$’000
Carrying amount
(assets)/ liabilities
$’000
Non-derivatives
Trade payables 15,130 - - - - 15,130 15,130
Borrowings (excluding finance leases) 4,439 4,639 9,310 46,195 40,121 104,704 96,769
Finance lease liabilities 333 332 920 2,506 365 4,456 3,675
Total non-derivatives 19,902 4,971 10,230 47,701 40,486 124,290 115,574
Derivatives
Net settled (interest rate swaps) - - (203) (105) - (308) (308)
Gross settled (forward foreign exchange contracts – cash flow hedges)
– (inflow) (17,182) (13,994) - - - (31,176) -
– outflow 17,521 14,298 - - - 31,819 610
339 304 - - - 643 610
At 30 June 2012
Non-derivatives
Trade payables 11,270 - - - - 11,270 11,270
Borrowings (excluding finance leases) 4,513 4,118 8,820 34,476 21,303 73,230 66,130
Finance lease liabilities 237 238 930 3,105 370 4,880 3,950
Total non-derivatives 16,020 4,356 9,750 37,581 21,673 89,380 81,350

66VALUE ACCOUNTS Holdings LimitedPwC
Contractual maturities of financial liabilities
At 30 June 2013
Less than 6
months $’000
6 – 12 months
$’000
Between 1 and 2
years $’000
Between 2 and 5
years $’000
Over 5 years
$’000
Total contractual cash flows
$’000
Carrying amount
(assets)/ liabilities
$’000
Derivatives
Net settled (interest rate swaps) - - (500) (212) - (712) (712)
Gross settled (forward foreign exchange contracts – cash flow hedges)
- (inflow) (11,724) (6,560) - - - (18,284) -
- outflow 11,885 7,028 - - - 18,913 621
161 468 - - - 629 621
Of the $47,195,000 disclosed in the 2013 borrowings time band ‘between 2 and 5 years’, the group is considering to repay $5,000,000 early in the first quarter of the 2013 financial year (2012 – nil).

PwC VALUE ACCOUNTS Holdings Limited 67
B3 Capital management
(a) Risk management
The group’s objectives when managing capital are to:
• safeguard their ability to continue as a going concern, so that they can continue to provide returns for shareholders and benefits for other stakeholders, and
• maintain an optimal capital structure to reduce the cost of capital.
In order to maintain or adjust the capital structure, the group may adjust the amount of dividends paid to shareholders, return capital to shareholders, issue new shares or sell assets to reduce debt.
Consistent with others in the industry, the group monitors capital on the basis of the gearing ratio. This ratio is calculated as net debt divided by total capital whereby:
• net debt = total borrowings less cash and cash equivalents• total borrowings = borrowings and trade and other payables• total capital = ‘equity’ as shown in the balance sheet (including non-controlling interests) plus net
debt.
During 2013, the group’s strategy, which was unchanged from 2012, was to maintain a gearing ratio within 30% to 40% and a BB credit rating. The gearing ratios at 30 June 2013 and 30 June 2012 were as follows:
Notes2013
$’0002012
$’000
Total borrowings A3(b),(c) 117,144 82,557
Less: cash and cash equivalents E2(a) (45,407) (24,693)
Net debt 71,737 57,864
Total equity 150,612 117,689
Total capital 222,349 175,553
Gearing ratio 32% 33%
The main reason for the reduction of the gearing ratio was the rights issue that was undertaken during the year.
(b) Dividends
2013 $’000
2012 $’000
(i) Ordinary shares
Final dividend for the year ended 30 June 2012 of 22 cents (2011 – 10 cents) per fully paid share 11,586 5,455
Interim dividend for the year ended 30 June 2013 of 21 cents (2012 – 10 cents) per fully paid share 11,144 5,467
(ii) 7% non-redeemable participating preference shares
Annual dividend of 7 cents (2012 – 7 cents) per share 107 107
Total dividends provided for or paid 22,837 11,029
Dividends paid in cash or satisfied by the issue of shares under the dividend reinvestment plan during the years ended 30 June 2013 and 2012 were as follows:
Paid in cash 22,271 10,470
Satisfied by issue of shares 566 559
22,837 11,029

PwC VALUE ACCOUNTS Holdings Limited 68
2013 $’000
2012 $’000
(iii) Dividends not recognised at the end of the reporting period
In addition to the above dividends, since year end the directors have recommended the payment of a final dividend of 22 cents per fully paid ordinary share (2012 – 22 cents), fully franked based on tax paid at 30%. The aggregate amount of the proposed dividend expected to be paid on 9 October 2013 out of retained earnings at 30 June 2013, but not recognised as a liability at year end, is 11,989 11,586
(iv) Franked dividends
The franked portions of the final dividends recommended after 30 June 2013 will be franked out of existing franking credits or out of franking credits arising from the payment of income tax in the year ending 30 June 2014.
Consolidated Parent entity
2013 $’000
2012 $’000
2013 $’000
2012 $’000
Franking credits available for subsequent reporting periods based on a tax rate of 30% (2012 – 30%) 20,531 15,480 12,510 9,465
The above amounts are calculated from the balance of the franking account as at the end of the reporting period, adjusted for franking credits and debits that will arise from the settlement of liabilities or receivables for income tax and dividends after the end of the year.
The consolidated amounts include franking credits that would be available to the parent entity if distributable profits of subsidiaries were paid as dividends.

PwC VALUE ACCOUNTS Holdings Limited 69
C Group structure
Explains significant aspects of the group structure and how
changes have affected the financial position and performance
of the group.
C1 Business combination 70
C2 Discontinued operation 72
C3 Non-controlling interests 74
C4 Joint operation 75

PwC VALUE ACCOUNTS Holdings Limited 70
This section provides information which will help users understand how the group structure affects the financial position and performance of the group as a whole. In particular, there is information about:
• changes to the structure that occurred during the year as a result of business combinations and the disposal of a discontinued operation
• transactions with non-controlling interests, and• interests in joint operations.
A list of significant subsidiaries is provided in note F2 in the Appendix The Appendix also discloses details about the group’s equity accounted investments (note E2(d)).
C1 Business combination
(a) Summary of acquisition
On 1 October 2012 the parent entity acquired 70% of the issued share capital of VALUE ACCOUNTS Electronics Pty Ltd, a manufacturer of electronic equipment. The acquisition has significantly increased the group’s market share in this industry, which complements the group’s existing IT consultancy division.
Details of the purchase consideration, the net assets acquired and goodwill are as follows.
$’000
Purchase consideration (refer to (b) below):
Cash paid 12,765
Contingent consideration 135
Total purchase consideration 12,900
The assets and liabilities recognised as a result of the acquisition are as follows.
Fair value $’000
Cash 1,550
Trade receivables 780
Inventories 840
Land and buildings 4,200
Plant and equipment 7,610
Deferred tax asset 2,224
Intangible assets: trademarks 3,020
Intangible assets: customer contracts 3,180
Trade payables (335)
Bank overdraft (1,150)
Provision for employee benefits (415)
Contingent liability (450)
Deferred tax liability (2,304)
Retirement benefit obligations (1,914)
Net identifiable assets acquired * 16,836
Less: non-controlling interests (5,051)
Add: goodwill 1,115
Net assets acquired 12,900
The goodwill is attributable to the workforce and the high profitability of the acquired business. It will not be deductible for tax purposes.
There were no acquisitions in the year ending 30 June 2012.
C Group structure

PwC VALUE ACCOUNTS Holdings Limited 71
(i) Contingent consideration
In the event that certain pre-determined sales volumes are achieved by the subsidiary for the year ended 30 June 2013, additional consideration of up to $1,000,000 may be payable in cash on 1 March 2014.
The potential undiscounted amount payable under the agreement is between $0 for sales below $10,000,000 and $1,000,000 for sales above $18,000,000. The fair value of the contingent consideration of $135,000 was estimated by calculating the present value of the future expected cash flows.. The estimates are based on a discount rate of 6% and assumed probability-adjusted sales of VALUE ACCOUNTS Electronics Pty Ltd of between $12,000,000 and $12,500,000.
As at 30 June 2013, the contingent consideration has been derecognised, as the actual sales revenue achieved by VALUE ACCOUNTS Electronics Pty Ltd was below $10,000,000. A gain of $135,000 was included in other income.
(ii) Contingent liability
A contingent liability of $450,000 was recognised on the acquisition of VALUE ACCOUNTS Electronics Pty Ltd for a pending lawsuit in which the entity is a defendant. The claim has arisen from a customer alleging defects on products supplied to them. It is expected that the courts will have reached a decision on this case by the end of 2013. The potential undiscounted amount of all future payments that the group could be required to make if there was an adverse decision related to the lawsuit is estimated to be between $250,000 and $700,000. As at 30 June 2013, there has been no change in the amount recognised (except for the unwinding of the discount of $27,000) for the liability in October 2012, as there has been no change in the probability of the outcome of the lawsuit.
(iii) Acquired receivables
The fair value of acquired trade receivables is $780,000. The gross contractual amount for trade receivables due is $807,000, of which $27,000 is expected to be uncollectible.
(iv) Non-controlling interests
The group recognises non-controlling interests in an acquiree either at fair value or at the non-controlling interest’s proportionate share of the acquiree’s net identifiable assets. This decision is made on an acquisition-by-acquisition basis. For the non-controlling interests in VALUE ACCOUNTS Electronics Pty Ltd, the group elected to recognise the non-controlling interests in at its proportionate share of the acquired net identifiable assets.
(v) Revenue and profit contribution
The acquired business contributed revenues of $11,520,000 and net profit of $925,000 to the group for the period from 1 October 2012 to 30 June 2013.
If the acquisition had occurred on 1 July 2012, consolidated revenue and profit for the year ended 30 June 2013 would have been $219,030,000 and $38,070,000 respectively. These amounts have been calculated using the subsidiary’s results and adjusting them for:
• differences in the accounting policies between the group and the subsidiary, and• the additional depreciation and amortisation that would have been charged assuming the fair
value adjustments to property, plant and equipment and intangible assets had applied from 1 July 2012, together with the consequential tax effects.

PwC VALUE ACCOUNTS Holdings Limited 72
(b) Purchase consideration – cash outflow
2013 $’000
2012 $’000
Outflow of cash to acquire subsidiary, net of cash acquired
Cash consideration 12,765 -
Less: Balances acquired
Cash 1,100 -
Bank overdraft (1,150) -
(50) -
Outflow of cash – investing activities 12,815 -
Acquisition-related costs
Acquisition-related costs of $500,000 are included in other expenses in profit or loss and in operating cash flows in the statement of cash flows.
C2 Discontinued operation
(a) Description
On 30 April 2012 a controlled entity announced its intention to sell the machinery hire division and initiated an active program to locate a buyer and complete the sale. The division was sold on 31 August 2012 with effect from 1 September 2012 and the division disposed of is reported in these financial statements as a discontinued operation.
Financial information relating to the discontinued operation for the period to the date of disposal is set out below.
(b) Financial performance and cash flow information
The financial performance and cash flow information presented are for the two months ended 31 August 2012 (2013 column) and the year ended 30 June 2012.

PwC VALUE ACCOUNTS Holdings Limited 73
2013 $’000
2012 $’000
Revenue (note A2(a)) 21,200 26,460
Expenses (21,109) (25,890)
Profit before income tax 91 570
Income tax expense (27) (171)
Profit after income tax of discontinued operation 64 399
Gain on sale of the division before income tax 930 -
Income tax expense (279) -
Gain on sale of the division after income tax 651 -
Profit from discontinued operation 715 399
Net cash inflow from operating activities 1,166 710
Net cash inflow (outflow) from investing activities (2013 includes an inflow of $3,860,000 from the sale of the division) 2,860 (190)
Net cash (outflow) from financing activities - (280)
Net increase in cash generated by the division 4,026 240
(c) Details of the sale of the division
2013 $’000
2012 $’000
Consideration received or receivable:
Cash 2,860 -
Fair value of contingent consideration 1,200 -
Present value of amount due on 31 March 2015 250 -
Total disposal consideration 4,310 -
Carrying amount of net assets sold (3,380) -
Gain on sale before income tax 930 -
Income tax expense (279) -
Gain on sale after income tax 651 -
In the event the operations of the machinery hire division achieve certain performance criteria during the period 1 September 2012 to 31 March 2014, as specified in an ’earn out’ clause in the sale agreement, additional cash consideration of up to $2,400,000 will be receivable. At the time of the sale, the fair value of the consideration was determined to be $1,200,000. It has been recognised as an available-for-sale financial asset, see note E2(c).
At year end, the fair value was re-estimated to be $1,290,000. Of this change in fair value, $130,000 related to the remeasurement of the expected cash flows and was taken to profit or loss, net of related income tax. The gain is presented in other income (noteE1(a)). A fair value loss of $40,000 relating to changes in market interest rate was recognised in other comprehensive income and included in the available-for-sale financial assets reserve in equity, also net of related income tax.

PwC VALUE ACCOUNTS Holdings Limited 74
The carrying amounts of assets and liabilities as at the date of sale (31 August 2012) were:
31 August 2012
$’000
Property, plant and equipment 1,660
Trade receivables 1,200
Inventories 950
Total assets 3,810
Trade creditors (390)
Provision for employee (40)
Total liabilities (430)
Net assets 3,380
C3 Non-controlling interests
2013 $’000
2012 $’000
Interest in:
Share capital 6,824 2,940
Reserves 659 758
Retained earnings 1,979 1,991
9,462 5,689
(a) Transactions with non-controlling interests
On 21 April 2013, VALUE ACCOUNTS Holdings Limited acquired an additional 5% of the issued shares of VALUE ACCOUNTS Manufacturing Limited for a purchase consideration of $500,000. The carrying amount of the non-controlling interests in VALUE ACCOUNTS Manufacturing Limited on the date of acquisition was $870,000. The group recognised a decrease in non-controlling interests of $290,000 and a decrease in equity attributable to owners of the parent of $210,000. The effect of changes in the ownership interest of VALUE ACCOUNTS Manufacturing Limited on the equity attributable to owners of VALUE ACCOUNTS Holdings Limited during the year is summarised as follows.
2013 $’000
2012 $’000
Carrying amount of non-controlling interests acquired 1,167 -
Consideration paid to non-controlling interests (1,500) -
Excess of consideration paid recognised in the transactions with non-controlling interests reserve within equity (333) -
There were no transactions with non-controlling interests in 2012.

PwC VALUE ACCOUNTS Holdings Limited 75
C4 Joint operation
A subsidiary has entered into a joint venture called Fernwood Venture to develop properties for residential housing. The subsidiary has a 50% participating interest in this joint venture and is entitled to 50% of its output of completed properties. This joint venture is an important element in the group’s strategy for expansion, so detailed information about these operations has been disclosed even though the amounts are not material to the group at present.
The group’s interests in the assets employed in the joint venture are included in the balance sheet, in accordance with the accounting policy described in note F9(b), under the following classifications.
2013 $’000
2012 $’000
Current assets
Cash and cash equivalents 1,010 905
Inventories 2,400 -
Total current assets 3,410 905
Non-current assets
Property, plant and equipment – at cost 4,250 3,220
Accumulated depreciation (660) (550)
Total non-current assets 3,590 2,670
Share of assets employed in joint venture 7,000 3,575
For capital expenditure commitments relating to the Fernwood Venture refer to note D3.

PwC VALUE ACCOUNTS Holdings Limited 76
D Unrecognised items
Provides information about items that are not recognised in the
financial statements but could potentially have a significant
impact on the group’s financial position and performance.
D1 Contingent liabilities 77
D2 Contingent assets 77
D3 Commitments 77
D4 Unrecognised tax amounts 78
D5 Debt defeasance 79
D6 Events occurring after the reporting period 79
D7 Non-cash investing and financing activities 81

PwC VALUE ACCOUNTS Holdings Limited 77
This section of the notes provides information about:
• items that are not recognised in the financial statements as they do not satisfy the recognition criteria, and
• items that have been derecognised but that are still relevant for an understanding of the financial performance of the entity.
D1 Contingent liabilities
The group had contingent liabilities at 30 June 2013 in respect of:
(i) Claims
A claim for unspecified damages was lodged against VALUE ACCOUNTS Retail Pty Ltd in June 2012 in relation to alleged non-performance under a sales contract. The company has disclaimed liability and is defending the action. It is not practical to estimate the potential effect of this claim but legal advice indicates that any liability that may arise in the unlikely event the claim is successful will not be significant.
In March 2013, a claim was lodged against VALUE ACCOUNTS Manufacturing Limited asserting that the entity had breached certain registered patents of a competitor. The matter is currently being considered by the courts and the group expects judgement before the end of December 2013. The group considers it to be probable that the judgement will be in its favour and has therefore not recognised a provision in relation to this claim. The potential undiscounted amount of the total payments that the group could be required to make if there was an adverse decision related to the lawsuit is estimated to be approximately $250,000.
(ii) Guarantees
For information about guarantees given by entities within the group, including the parent entity, please refer to notes F7 and F8.
(iii) Associates and joint ventures
For contingent liabilities relating to associates and joint ventures refer to note E2(d).
D2 Contingent assets
A subsidiary has lodged a claim against a supplier for damages caused by the supply of faulty products. The matter has been referred to arbitration and, having received legal advice, the directors believe that a favourable outcome is probable. However, the contingent asset has not been recognised as a receivable at 30 June 2013 as receipt of the amount is dependent on the outcome of the arbitration process.
D3 Commitments
(a) Capital commitments
Significant capital expenditure contracted for at the reporting date but not recognised as liabilities is as follows:
2013 $’000
2012 $’000
Property, plant and equipment 4,200 800
Fernwood venture
The above commitments include capital expenditure commitments of $500,000 (2012 – nil) relating to the Fernwood Venture (refer to note C4).
D Unrecognised items

PwC VALUE ACCOUNTS Holdings Limited 78
(b) Non-cancellable operating leases
The group leases various offices, warehouses and retail stores under non-cancellable operating leases expiring within two to eight years. The leases have varying terms, escalation clauses and renewal rights. On renewal, the terms of the leases are renegotiated. Excess warehouse space is sub-let to third parties, also under non-cancellable operating leases.
2013 $’000
2012 $’000
Commitments for minimum lease payments in relation to non-cancellable operating leases are payable as follows:
Within one year 850 750
Later than one year but not later than five years 2,300 2,300
Later than five years 3,940 3,770
7,090 6,820
Not included in the above commitments are contingent rental payments which may arise in the event that units produced by certain leased assets exceed a pre-determined production capacity. The contingent rental payable is 1% of sales revenue from the excess production.
Sub-lease payments
2013 $’000
2012 $’000
Future minimum lease payments expected to be received in relation to non-cancellable sub-leases of operating leases 850 920
Rental expense relating to operating leases
Minimum lease payments 1,230 1,530
Contingent rentals 430 -
Sub-leases 290 270
Total rental expense relating to operating leases 1,950 1,800
D4 Unrecognised tax amounts
(a) Tax losses
2013 $’000
2012 $’000
Unused tax losses for which no deferred tax asset has been recognised 1,740 2,796
Potential tax benefit @ 30% 522 839
All unused tax losses were incurred by Australian entities that are not part of the tax consolidated group.
(b) Unrecognised temporary differences
Temporary difference relating to investments in subsidiaries for which deferred tax liabilities have not been recognised:
Foreign currency translation 2,190 1,980
Undistributed earnings 1,350
3,540 1,980
Unrecognised deferred tax liabilities relating to the above temporary differences 1,062 594

PwC VALUE ACCOUNTS Holdings Limited 79
A deferred tax liability has not been recognised in respect of temporary differences of $2,190,000 (2012 – $1,980,000) arising as a result of the translation of the financial statements of the consolidated entity’s subsidiary in Indonesia. The deferred tax liability will only arise in the event of disposal of the subsidiary, and no such disposal is expected in the foreseeable future.
VALUE ACCOUNTS Retail Pty Ltd has undistributed earnings of $1,350,000 (2012 – nil) which, if paid out as dividends, would be unfranked and therefore subject to tax in the hands of the recipient. An assessable temporary difference exists, however no deferred tax liability has been recognised as the parent entity is able to control the timing of distributions from this subsidiary and is not expected to distribute these profits in the foreseeable future.
D5 Debt defeasance
At the end of the reporting period, debentures issued by the parent entity were the subject of an in-substance defeasance, whereby the parent entity’s obligations for principal and interest repayments were assumed by a State Government Statutory Authority. The parent entity was legally released from the primary responsibility for the liability but has guaranteed repayment of the principal and interest in the event of failure by the Authority to meet repayments. Given the virtual risk free status of the Authority, the likelihood of the parent entity ever being called upon to meet these obligations is extremely remote and, consequently, the debt has been treated as having been extinguished. The debentures are repayable in varying instalments due 31 March each year to 2018. Interest is payable quarterly in arrears at a fixed rate of 9.75% per annum.
The aggregate carrying amount of debt extinguished by the in-substance defeasance was $2,000,000, satisfied by a payment to the liability assuming entity of $1,645,000. After allowing for costs of the defeasance ($40,000), a net gain of $395,000 was recognised in profit or loss and included in other income. As at 30 June 2013, the debentures had a fair value of $1,915, based on cash flows that were discounted using a borrowing rate of 8.6%.
D6 Events occurring after the reporting period
(a) Acquisition of Better Office Furnishings Limited
On 15 August 2013 VALUE ACCOUNTS Holdings Limited acquired 87.5% of the issued shares in Better Office Furnishings Limited, a manufacturer of office furniture and equipment, for consideration of $12,030,000. The acquisition is expected to increase the group’s market share and reduce cost through economies of scale.
The financial effects of this transaction have not been brought to account at 30 June 2013. The operating results and assets and liabilities of the company will be consolidated from 15 August 2013.
(i) Purchase consideration
Details of the consideration transferred are:
$’000
Purchase consideration
Cash paid 11,750
Contingent consideration 280
Total purchase consideration 12,030

PwC VALUE ACCOUNTS Holdings Limited 80
The provisionally determined fair values of the assets and liabilities of Better Office Furnishings Limited as at the date of acquisition are as follows:
Fair value $’000
Cash and cash equivalents 575
Property, plant and equipment 12,095
Customer list 2,285
Customer contracts 1,180
Inventories 1,010
Receivables 685
Payables (2,380)
Employee benefit liabilities, including superannuation (230)
Borrowings (3,250)
Net deferred tax assets 420
Net identifiable assets acquired 12,390
Less: non-controlling interests (1,720)
Add: goodwill 1,360
Net assets acquired 12,030
The goodwill is attributable to Better Office Furnishings Limited’s strong position and profitability in trading in the office furniture and equipment market and synergies expected to arise after the company’s acquisition of the new subsidiary. None of the goodwill is expected to be deductible for tax purposes.
(ii) Contingent consideration
The contingent consideration arrangement requires the group to pay the former owners of Better Office Furnishings Limited 5% of the profit of Better Office Furnishings Limited, in excess of $4,000,000 for the year ending 30 June 2013, up to a maximum undiscounted amount of $800,000.
The potential undiscounted amount of all future payments that the group could be required to make under this arrangement is between $0 and $800,000. The fair value of the contingent consideration arrangement of $280,000 has been estimated by calculating the present value of the future expected cash flows. The estimates are based on a discount rate of 8% and assumed probability-adjusted profit in Better Office Furnishings Limited of $4,400,000 to $4,800,000.
(iii) Acquisition-related costs
Acquisition-related costs of $750,000 will be included in other expenses in profit or loss in the reporting period ending 30 June 2014.
(iv) Non-controlling interest
The group has chosen to recognise the non-controlling interest at its fair value for this acquisition. The fair value of the non-controlling interest in Better Office Furnishings Limited, an unlisted company, was estimated by applying a market approach and an income approach. The fair value estimates are based on:
(a) an assumed discount rate of 8%(b) an assumed terminal value based on a range of terminal EBITDA multiples between three and
five times(c) long-term sustainable growth rate of 2%(d) assumed financial multiples of companies deemed to be similar to Better Office Furnishings
Limited, and(e) assumed adjustments because of the lack of control or lack of marketability that market
participants would consider when estimating the fair value of non-controlling interest in Better Office Furnishing Limited.

PwC VALUE ACCOUNTS Holdings Limited 81
(v) Information not disclosed as not yet available
At the time the financial statements were authorised for issue, the group had not yet completed the accounting for the acquisition of Better Office Furnishings Limited. In particular, the fair values of the assets and liabilities disclosed above have only been determined provisionally as the independent valuations have not been finalised. It is also not yet possible to provide detailed information about each class of acquired receivables and any contingent liabilities of the acquired entity.
D7 Non-cash investing and financing activities
2013 $’000
2012 $’000
Acquisition of plant and equipment by means of finance leases - 3,000
Deferred settlement of part proceeds of the sale of the machinery hire division is disclosed in note C2, dividends satisfied by the issue of shares under the dividend reinvestment plan are shown in note B3(b) and options and shares issued to employees under the VALUE ACCOUNTS Employee Option Plan and employee share scheme for no cash consideration are shown in note F4.

PwC VALUE ACCOUNTS Holdings Limited 82
Directors’ declaration

PwC VALUE ACCOUNTS Holdings Limited 83
Directors’ declaration
In the directors’ opinion:
(a) the financial statements and notes set out on pages 5 to 81 and in the Appendix on pages 84 to 145 are in accordance with the Corporations Act 2001, including:
(i) complying with Accounting Standards, the Corporations Regulations 2001 and other mandatory professional reporting requirements, and
(ii) giving a true and fair view of the consolidated entity’s financial position as at 30 June 2013 and of its performance for the financial year ended on that date, and
(b) there are reasonable grounds to believe that the company will be able to pay its debts as and when they become due and payable, and
(c) at the date of this declaration, there are reasonable grounds to believe that the members of the extended closed group identified in note F7 in the Appendix will be able to meet any obligations or liabilities to which they are, or may become, subject by virtue of the deed of cross guarantee described in note F7.
Note F9(a) confirms that the financial statements also comply with International Financial Reporting Standards as issued by the International Accounting Standards Board.
The directors have been given the declarations by the chief executive officer and chief financial officer required by section 295A of the Corporations Act 2001.
This declaration is made in accordance with a resolution of the directors.
M K Hollingworth Director
Sydney 23 August 2013

VALUE ACCOUNTS Holdings LimitedPwC 84
Appendix
Information that the directors do not consider to be relevant
to understanding the financial performance and position
of the group, but that must be disclosed to comply with the
accounting standards and other pronouncements is included
here. The Appendix also lists all of the significant accounting
policies applied in the preparation of these financial
statements. It is grouped into two sections:
E. Non-significant items• Section E provides information about the basis of
calculation for items in the financial statements that the
directors do not consider significant in the context of the
main operations of the entity; this section is structured in
the same way as section A.
F. Other information• Section F contains information that is not immediately
related to individual line items in the financial
statements, such as related party transactions, share-
based payments and a full list of the accounting policies
applied by the entity.
85
E How numbers are calculated – non-significant itemsProvides information about the basis of calculation of line
items in the financial statements that the directors do not
consider significant in the context of the group’s operations.
E1 Profit and loss information 87
E2 Other financial assets and financial liabilities 90
E3 Other non-financial assets and liabilities 94
E4 Assets and liabilities classified as held for sale 101
E5 Other reserves 102
E6 Retained earnings 105
E7 Reconciliation of profit after income tax to net cash inflow from operating activities
106

VALUE ACCOUNTS Holdings LimitedPwC 86
This Appendix sets out information that is required under Accounting Standards, the Corporations Act 2001 or the Corporations Regulations, but that – in the directors’ view – is not critical to understand the financial statements. It is organised into the following sections:
• Section E provides information about the basis of calculation for items in the financial statements that the directors do not consider significant in the context of the main operations of the entity; this section is structured in the same way as section A.
• Section F contains information that is not immediately related to individual line items in the financial statements, such as related party transactions, share-based payments and a full list of the accounting policies applied by the entity.
E How numbers are calculated – non-significant items

VALUE ACCOUNTS Holdings LimitedPwC 87
E1 Profit and loss information(a) Other income
Notes
2013 $’000
2012 $’000
Net gain on disposal of property, plant and equipment (excluding property, plant and equipment sold as part of the machinery hire division) A4(b) 1,620 -
Fair value gains on financial assets at fair value through profit or loss E2(b) 835 -
Net gain on foreign currency derivatives not qualifying as hedges B2(a) 448 640
Net gain on sale of available-for-sale financial assets E2(c) 646 -
Fair value adjustment to investment property E3(a) 1,350 1,397
Other items (i) 1,674 244
6,573 2,281
(i) Government grants
Export market development grants of $250,000 (2012 – $244,000) are included in the ‘other items’ line item. There are no unfulfilled conditions or other contingencies attaching to these grants. The group did not benefit directly from any other forms of government assistance.
Accounting for government grants
Government grants relating to costs are deferred and recognised in the profit or loss over the period necessary to match them with the costs that they are intended to compensate.
Government grants relating to the purchase of property, plant and equipment are included in non-current liabilities as deferred income and are credited to profit or loss on a straight-line basis over the expected lives of the related assets.
(b) Breakdown of expenses by nature
Notes
2013 $’000
2012 $’000
Changes in inventories of finished goods and work in progress A4(a) 6,681 5,255
Raw materials and consumables used (65,055) (42,645)
Employee benefits expenses 77,399 59,901
Depreciation A4(b) 8,950 8,150
Amortisation A4(c) 2,035 730
Research and development expenditure (1,215) (1,010)
Impairment of goodwill A4(c) (2,410) -
Write off of assets damaged by fire A2(b) (1,210) -
Other expenses (6,990) (6,148)
Finance costs
Interest and finance charges paid/payable for financial liabilities not at fair value through profit or loss 5,777 4,904
Provisions: unwinding of discount 215 -
Fair value gain on interest swaps cash flow hedges – transfer from equity (155) (195)
Net exchange losses on foreign currency borrowings 2,022 1,810
7,860 6,519
Amount capitalised (i) (525) (325)
Finance costs expensed 7,335 6,194

VALUE ACCOUNTS Holdings LimitedPwC 88
(i) Capitalised borrowing costs
The capitalisation rate used to determine the amount of borrowing costs to be capitalised is the weighted average interest rate applicable to the entity’s outstanding borrowings during the year, in this case 7.02% (2012 – 7.45%).
(c) Earnings per share
2013 Cents
2012 Cents
(i) Basic earnings per share
From continuing operations attributable to the ordinary equity holders of the company 64.9 51.1
From discontinued operation 1.4 0.8
Total basic earnings per share attributable to the ordinary equity holders of the company 66.3 51.9
(ii) Diluted earnings per share
From continuing operations attributable to the ordinary equity holders of the company 63.8 50.9
From discontinued operation 1.3 0.8
Total diluted earnings per share attributable to the ordinary equity holders of the company 65.1 51.7
(iii) Reconciliations of earnings used in calculating earnings per share
2013 $’000
2012 $’000
Basic earnings per share
Profit attributable to the ordinary equity holders of the company used in calculating basic earnings per share:
From continuing operations 33,865 26,433
From discontinued operation 715 399
34,580 26,832
2013 $’000
2012 $’000
Diluted earnings per share
Profit from continuing operations attributable to the ordinary equity holders of the company:
Used in calculating basic earnings per share 33,865 26,433
Add: interest savings on convertible notes 435 -
Used in calculating diluted earnings per share 34,300 26,433
Profit from discontinued operation 715 399
Profit attributable to the ordinary equity holders of the company used in calculating diluted earnings per share 35,015 26,832

VALUE ACCOUNTS Holdings LimitedPwC 89
(iv) Weighted average number of shares used as the denominator
2013 Number
2012 Number
Weighted average number of ordinary shares used as the denominator in calculating basic earnings per share 52,168,160 51,749,295
Adjustments for calculation of diluted earnings per share:
Amounts uncalled on partly paid shares and calls in arrears 101,094 91,083
Options 24,123 19,754
Deferred shares 100,909 81,937
Convertible notes 1,429,170 -
Weighted average number of ordinary shares and potential ordinary shares used as the denominator in calculating diluted earnings per share 53,823,455 51,942,069
(v) Information concerning the classification of securities
Partly paid ordinary shares
Partly paid ordinary shares carry the right to participate in dividends in proportion to the amount paid relative to the total issue price and to that extent they have been recognised as ordinary share equivalents in the determination of basic earnings per share. Amounts uncalled on partly paid shares and calls in arrears are treated as the equivalent of options to acquire ordinary shares and are included as potential ordinary shares in the determination of diluted earnings per share.
Options
Options granted to employees under the VALUE ACCOUNTS Employee Option Plan are considered to be potential ordinary shares and have been included in the determination of diluted earnings per share to the extent to which they are dilutive. The options have not been included in the determination of basic earnings per share. Details relating to the options are set out in note F4.
The 815,000 options granted on 1 May 2013 are not included in the calculation of diluted earnings per share because they are antidilutive for the year ended 30 June 2013. These options could potentially dilute basic earnings per share in the future.
Deferred shares
Rights to deferred shares granted to executives under the group’s short-term incentive scheme are included in the calculation of diluted earnings per share assuming all outstanding rights will vest. The rights are not included in the determination of basic earnings per share. Further information about the rights is provided in note F4.
Convertible notes
Convertible notes issued during the year are considered to be potential ordinary shares and have been included in the determination of diluted earnings per share from their date of issue. The notes have not been included in the determination of basic earnings per share. Details relating to the notes are set out in note A3(c).
7% non-redeemable participating preference shares
The 7% non-redeemable participating preference shares were classified as equity and were a separate category of ordinary shares for the purposes of determining earnings per share, rather than potential ordinary shares. The shares were bought back and cancelled during the year – (refer to note A5). They have not been included in the determination of basic or diluted earnings per share as no shares were on issue at year end in this category of ordinary shares.
6% cumulative redeemable preference shares
The 6% cumulative redeemable preference shares are not ordinary or potential ordinary shares and have not been included in the determination of basic and diluted earnings per share. These shares are classified as liabilities – refer to note A3(c).

VALUE ACCOUNTS Holdings LimitedPwC 90
E2 Other financial assets and financial liabilities(a) Cash and cash equivalents
2013 $’000
2012 $’000
Current assets
Cash at bank and in hand 750 600
Deposits at call 20,657 10,093
Term deposits 24,000 14,000
45,407 24,693
(i) Reconciliation to cash at the end of the year
The above figures are reconciled to cash at the end of the financial year as shown in the statement of cash flows as follows:
2013 $’000
2012 $’000
Balances as above 45,407 24,693
Bank overdrafts (note A3(c)) (2,650) (2,250)
Balances per statement of cash flows 42,757 22,443
Term deposits are presented as cash equivalents if they have a maturity of three months or less from the date of acquisition and are repayable with 24 hours notice with no loss of interest.
(b) Financial assets at fair value through profit or loss
Financial assets at fair value through profit or loss are all held for trading and include the following:
2013 $’000
2012 $’000
Current assets
US listed equity securities 5,190 4,035
Australian listed equity securities 6,110 6,880
11,300 10,915
(i) Accounting policy
The group classifies financial assets at fair value through profit or loss if they are acquired principally for the purpose of selling in the short-term. They are presented as current assets if they are expected to be sold within 12 months after the end of the reporting period; otherwise they are presented as non-current assets.
The group has not designated any financial assets as at fair value through profit or loss.
(ii) Amounts recognised in profit or loss
Changes in fair values of financial assets at fair value through profit or loss are recorded in other income or other expense in profit or loss (2013 – gain of $835,000; 2012 – loss of $690,000).

VALUE ACCOUNTS Holdings LimitedPwC 91
(c) Available-for-sale financial assets
Available-for-sale financial assets include the following classes of financial assets:
2013 $’000
2012 $’000
Non-current assets
Australian listed securities
Equity securities 4,350 2,350
Debentures 2,230 710
Preference shares 990 590
7,570 3,650
Unlisted securities (i)
Equity securities (ii) 1,150 1,098
Debentures 575 560
Preference shares 525 520
2,250 2,178
Contingent consideration (note C2) 1,290 -
11,110 5,828
(i) Unlisted securities
Unlisted securities are traded in inactive markets. Refer to note A3(e) for further information about the methods used and assumptions applied in determining fair value.
(ii) Investments in related parties
Available-for-sale financial assets includes $300,000 (2012 – $280,000) of equity securities held in entities that are controlled by the ultimate parent entity, Lion Plc.
(iii) Accounting policy
Investments are designated as available-for-sale financial assets if they do not have fixed maturities and fixed or determinable payments, and management intends to hold them for the medium to long-term. Financial assets that are not classified into any of the other categories (at FVTPL, loans and receivables or held-to-maturity investments) are also included in the available-for-sale category.
The financial assets are presented as non-current assets unless they mature, or management intends to dispose of them within 12 months of the end of the reporting period.
(iv) Non-current assets pledged as security
Refer to note F6 for information on non-current assets pledged as security by the group.
(v) Significant estimates
The fair value of financial instruments that are not traded in an active market is determined using valuation techniques. The group uses its judgement to select a variety of methods and make assumptions that are mainly based on market conditions existing at the end of each reporting period. For details of the key assumptions used and the impact of changes to these assumptions see note A3(e).
(vi) Significant judgement
In the 2012 financial statements, the group made a significant judgement about the impairment of a number of its available-for-sale financial assets.
To determine if an available-for-sale financial asset is impaired, the group evaluates the duration and extent to which the fair value of the asset is less than its cost, and the financial health of and short-term business outlook for the investee (including factors such as industry and sector performance, changes in technology and operational and financing cash flows). While the fair value of a number of the group’s available-for-sale financial assets had fallen below cost as at 30 June 2012, the group determined that none of these declines in fair value were expected to be significant or prolonged and hence no impairment needed to be recognised.

VALUE ACCOUNTS Holdings LimitedPwC 92
If all of the declines in fair value below cost had been significant or prolonged, the group would have suffered an additional loss of $500,000 in its 2012 financial statements, being the reclassification of the accumulated fair value adjustments recognised in equity on the impaired available-for-sale financial assets to profit or loss. In the 2013 financial year, the fair value of the relevant assets has increased again and is now above cost.
(vii) Amounts recognised in profit or loss and other comprehensive income
During the year, the following gains/(losses) were recognised in profit or loss and other comprehensive income.
2013 $’000
2012 $’000
Gains/(losses) recognised in other comprehensive income (see note E5) 880 (1,378)
Gains/(losses) reclassified to profit or loss from other comprehensive income on sale 646 (548)
(d) Investments accounted for using the equity method
2013 $’000
2012 $’000
Non-current assets
Shares in associates (a) 1,525 1,375
Interest in joint venture entity (b) 2,250 1,900
3,775 3,275
(i) Investments in associates
2013 $’000
2012 $’000
Movements in carrying amounts
Carrying amount at the beginning of the financial year 1,375 1,225
Share of profits after income tax 200 150
Dividends received/receivable (50) (100)
Share of increment on revaluation of freehold land - 100
Carrying amount at the end of the financial year 1,525 1,375
The group’s investments in associates are not material for its financial performance and financial position.
(ii) Interests in joint venture entity
The parent entity has a 40% interest in Wombat Proprietary Ltd, which is resident in Australia and the principal activity of which is the distribution of computer software.
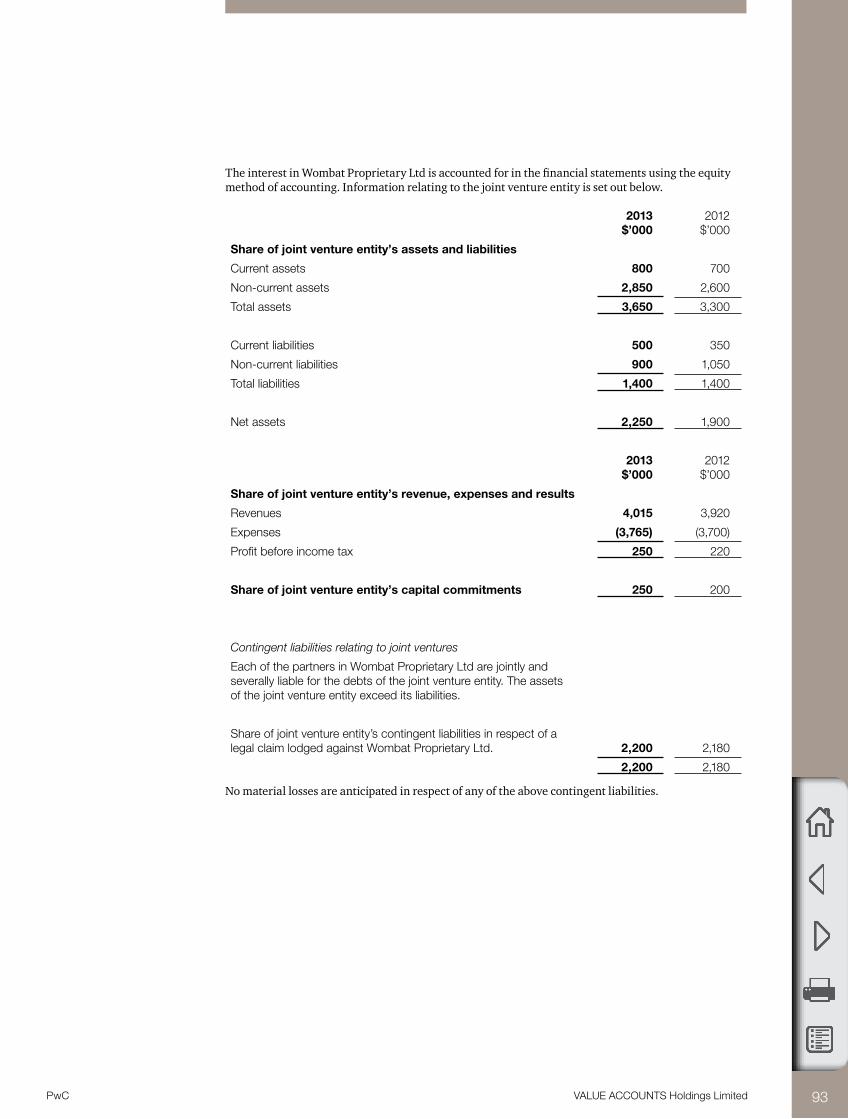
VALUE ACCOUNTS Holdings LimitedPwC 93
The interest in Wombat Proprietary Ltd is accounted for in the financial statements using the equity method of accounting. Information relating to the joint venture entity is set out below.
2013 $’000
2012 $’000
Share of joint venture entity’s assets and liabilities
Current assets 800 700
Non-current assets 2,850 2,600
Total assets 3,650 3,300
Current liabilities 500 350
Non-current liabilities 900 1,050
Total liabilities 1,400 1,400
Net assets 2,250 1,900
2013 $’000
2012 $’000
Share of joint venture entity’s revenue, expenses and results
Revenues 4,015 3,920
Expenses (3,765) (3,700)
Profit before income tax 250 220
Share of joint venture entity’s capital commitments 250 200
Contingent liabilities relating to joint ventures
Each of the partners in Wombat Proprietary Ltd are jointly and severally liable for the debts of the joint venture entity. The assets of the joint venture entity exceed its liabilities.
Share of joint venture entity’s contingent liabilities in respect of a legal claim lodged against Wombat Proprietary Ltd. 2,200 2,180
2,200 2,180
No material losses are anticipated in respect of any of the above contingent liabilities.

VALUE ACCOUNTS Holdings LimitedPwC 94
E3 Other non-financial assets and liabilities (a) Investment properties
2013 $’000
2012 $’000
Non-current assets – at fair value
Opening balance at 1 July 10,050 8,205
Acquisitions 1,900 -
Capitalised subsequent expenditure - 810
Classified as held for sale or disposals - (112)
Net gain/(loss) from fair value adjustment 1,350 1,397
Transfer (to)/from inventories and owner-occupied property - (250)
Closing balance at 30 June 13,300 10,050
(i) Amounts recognised in profit or loss for investment properties
2013 $’000
2012 $’000
Rental income 6,180 5,165
Direct operating expenses from property that generated rental income (807) (606)
Direct operating expenses from property that did not generate rental Income (903) (503)
4,470 4,056
(ii) Accounting for investment property at fair value
Investment properties, principally freehold office buildings, are held for long-term rental yields and are not occupied by the group. Investment properties are carried at fair value, which is based on active market prices, adjusted for any difference in the nature, location or condition of the specific asset. If this information is not available, the group uses alternative valuation methods such as recent prices in less active markets or discounted cash flow projections. These valuations are reviewed annually by a member of the Australian Property Institute. Changes in fair values are presented in profit or loss as part of other income.
(iii) Valuation basis – significant estimates
The group carries its investment properties at fair value with changes in the fair values recognised in profit or loss. It obtains independent valuations at least annually.
At the end of each reporting period, the directors update their assessment, taking into account the most recent independent valuations. The directors determine a property’s value within a range of reasonable fair value estimates.
The best evidence of fair value is current prices in an active market for similar investment properties. Where such information is not available the directors consider information from a variety of sources including:
(i) current prices in an active market for properties of different nature or recent prices of similar properties in less active markets, adjusted to reflect those differences
(ii) discounted cash flow projections based on reliable estimates of future cash flows
(iii) capitalised income projections based upon a property’s estimated net market income, and a capitalisation rate derived from an analysis of market evidence.

VALUE ACCOUNTS Holdings LimitedPwC 95
At the end of the reporting period the key assumptions used by the directors in determining fair value for the group’s portfolio of properties were in the following ranges:
2013 2012
Discount rate 4% – 5% 6% – 7%
Terminal yield 6% – 7% 5% – 6%
Capitalisation rate 4% – 4.5% 4.5% – 5%
Expected vacancy rate 9% – 10% 5% – 6%
Rental growth rate 3% – 3.6% 4% – 4.5%
All of the above key assumptions have been taken from the last independent valuation report for the assets in the portfolio.
(iii) Non-current assets pledged as security
Refer to note F6 for information on non-current assets pledged as security by the group.
(iv) Leasing arrangements
Some of the investment properties are leased to tenants under long-term operating leases with rentals payable monthly. Minimum lease payments receivable on leases of investment properties are as follows:
2013 $’000
2012 $’000
Minimum lease payments under non-cancellable operating leases of investment properties not recognised in the financial statements are receivable as follows:
Within one year 4,265 4,245
Later than one year but not later than 5 years 9,120 9,050
Later than 5 years 2,370 2,550
15,755 15,845
(b) Deferred tax balances
(i) Deferred tax assets
Notes2013
$’0002012
$’000
The balance comprises temporary differences attributable to:
Tax losses A2(c) 3,170 2,245
Retirement benefit obligations E3(c) 968 460
Employee benefits A4(d) 873 822
Deferred revenue 719 711
5,730 4,238
Other
Make good provision A4(d) 367 -
Provision for warranties and legal costs A4(d) 328 372
Provision for restructuring A4(d) 270 -
Cash flow hedges B2 183 186
Doubtful debts B2(b) 158 90
Contingent liability A4(d) 143 -
Write-down of building A2(b) 140 -
Share issue expenses A5 48 -
Other 53 34
Sub-total other 1,690 682

VALUE ACCOUNTS Holdings LimitedPwC 96
Notes2013
$’0002012
$’000
Total deferred tax assets 7,420 4,920
Set-off of deferred tax liabilities pursuant to set-off provisions (313) (245)
Net deferred tax assets 7,107 4,675
Deferred tax assets expected to be recovered within 12 months 2,137 1,568
Deferred tax assets expected to be recovered after more than 12 months 5,283 3,352
7,420 4,920
Significant estimates
The group has recognised deferred tax assets relating to carried forward tax losses to the extent there are sufficient taxable temporary differences (deferred tax liabilities) relating to the same taxation authority and the same subsidiary against which the unused tax losses can be utilised. However, utilisation of the tax losses also depends on the ability of the entity, which is not part of the tax consolidated group, to satisfy certain tests at the time the losses are recouped. Due to the recent capital raising of the parent entity, there are some concerns that the entity may fail to satisfy the continuity of ownership test and therefore has to rely on the same business test. If the entity fails to satisfy the test, carried forward deferred tax assets of $1,378,000 would have to be written off to income tax expense.
Movements
Tax losses $’000
Retirement benefit
obligation $’000
Employee benefits
$’000
Deferred revenue
$’000Other $’000
Total $’000
At 1 July 2011 1,300 365 791 687 347 3,490
(Charged)/credited
- to profit or loss 945 (26) 31 24 235 1,209
- to other comprehensive income - 121 - - 100 221
At 30 June 2012 2,245 460 822 711 682 4,920
(Charged)/credited
- to profit or loss (600) (60) (74) 8 828 102
- to other comprehensive income - (6) - - (15) (21)
- directly to equity - - - - 60 60
Acquisition of subsidiary 1,525 574 125 - 135 2,359
At 30 June 2013 3,170 968 873 719 1,690 7,420

VALUE ACCOUNTS Holdings LimitedPwC 97
(ii) Deferred tax liabilities
Notes2013
$’0002012
$’000
The balance comprises temporary differences attributable to:
Property, plant and equipment A4(b) 6,464 4,140
Intangible assets A4(c) 2,375 770
Convertible note A3(c) 955 -
Investment property E3(a) 1,124 719
10,918 5,629
Other
Financial assets at fair value through profit or loss E2(b) 720 420
Available-for-sale financial assets E2(c) 475 172
Derivatives held for trading B2 326 192
Investments in associates E2(d) 158 113
Prepayments A3(a) 150 143
Inventories A4(a) 120 -
Other 182 214
Sub-total other 2,131 1,254
Total deferred tax liabilities 13,049 6,883
Set-off of deferred tax liabilities pursuant to set-off provisions (313) (245)
Net deferred tax liabilities 12,736 6,638
Deferred tax liabilities expected to be settled within 12 months 1,408 968
Deferred tax liabilities expected to be settled after more than 12 months 11,641 5,915
13,049 6,883
Movements
Property, plant and
equipment $’000
Intangible assets
$’000
Investment property
$’000
Convertible note
$’000Other $’000
Total $’000
At 1 July 2011 2,150 615 300 - 746 3,811
Charged/ (credited)
- to profit or loss 238 155 419 - 15 827
- to other comprehensive income 1,752 - - - 493 2,245
At 30 June 2012 4,140 770 719 - 1,254 6,883

VALUE ACCOUNTS Holdings LimitedPwC 98
Movements
Property, plant and
equipment $’000
Intangible assets
$’000
Investment property
$’000
Convertible note
$’000Other $’000
Total $’000
Charged/ (credited)
- to profit or loss (173) (255) 405 (95) 525 407
- to other comprehensive income 2,173 - - - 232 2,405
- directly to equity - - - 1,050 - 1,050
Acquisition of subsidiary 324 1,860 - - 120 2,304
At 30 June 2013 6,464 2,375 1,124 955 2,131 13,049
(c) Retirement benefit obligations
(i) Superannuation plan
All employees of the group are entitled to benefits from the group’s superannuation plan on retirement, disability or death. The group has one plan with a defined benefit section and a defined contribution section. The defined benefit section provides lump sum benefits based on years of service and final average salary. The defined contribution section receives fixed contributions from group companies and the group’s legal or constructive obligation is limited to these contributions.
(ii) Accounting policy
Actuarial gains and losses arising from experience adjustments and changes in actuarial assumptions are recognised in the period in which they occur, directly in other comprehensive income.
(iii) Balance sheet amounts
The amounts recognised in the balance sheet are determined as follows:
2013 $’000
2012 $’000
Present value of the defined benefit obligation (partly funded) 9,361 4,492
Fair value of defined benefit plan assets (5,991) (2,797)
3,370 1,695
Unrecognised past service costs (145) (163)
Net liability in the balance sheet 3,225 1,532
The group has no legal obligation to settle this liability with an immediate contribution or additional one-off contributions. The group intends to continue to contribute to the defined benefit section of the plan at a rate of 12% of salaries in line with the actuary’s latest recommendations.
(iv) Categories of plan assets
The major categories of plan assets are as follows:
2013 $’000
2012 $’000
Equity instruments 2,936 1,119
Debt instruments 1,378 503
Property 958 839
Other assets 719 336
5,991 2,797
The fair value of plan assets includes ordinary shares issued by VALUE ACCOUNTS Holdings Limited with a fair value of $530,000 (2012 – $410,000) and land and buildings occupied by the group with a fair value of $550,000 (2012 – $580,000).

VALUE ACCOUNTS Holdings LimitedPwC 99
(v) Reconciliations
2013 $’000
2012 $’000
Present value of the defined benefit obligation:
Balance at the beginning of the year 4,492 3,479
Current service cost 769 335
Interest cost 331 184
Employee contributions 55 30
Actuarial (gains) and losses 458 503
Benefits paid (435) (218)
Past service cost - 179
Acquired in business combinations 3,691 -
Balance at the end of the year 9,361 4,492
Fair value of plan assets:
Balance at the beginning of the year 2,797 2,264
Expected return on plan assets 310 160
Actuarial gains and (losses) 488 (73)
Contributions by the company 999 634
Employee contributions 55 30
Benefits paid (435) (218)
Acquired in business combinations 1,777 -
Balance at the end of the year 5,991 2,797
The actual return on plan assets for the period was as follows: 798 87
The difference between the actual and expected return on plan assets is recognised as actuarial gain (loss) in other comprehensive income.
(vi) Amounts recognised in profit or loss
The amounts recognised in profit or loss are as follows:
2013 $’000
2012 $’000
Defined contribution superannuation expense 2,425 2,075
Defined benefit expense
Current service cost 769 335
Interest cost 331 184
Expected return on plan assets (310) (160)
Past service cost 18 16
Total included in employee benefits expense 808 375
Of the total expenses recognised in profit or loss, $427,000 (2012 – $343,000) were recognised in ‘cost of sales of goods’ and $263,000 (2012 – $145,000) in ‘administration expenses’.

VALUE ACCOUNTS Holdings LimitedPwC 100
(vii) Amounts recognised in other comprehensive income
2013 $’000
2012 $’000
Actuarial (loss)/gain recognised in the year 30 (576)
Cumulative actuarial (losses)/gains recognised in other comprehensive income (250) (280)
(vii) Principal actuarial assumptions
The principal actuarial assumptions used (expressed as weighted averages) were as follows:
2013 2012
Discount rate 5.0% 4.5%
Expected return on plan assets 8.5% 8.3%
Future salary increases 4.0% 4.5%
The expected rate of return on assets is based on historical and future expectations of returns for each of the major categories of asset classes as well as the expected and actual allocation of plan assets to these major categories. This resulted in the selection of an 8% rate of return gross of tax (and net of expenses) and a 7.5% rate of return net of tax (and expenses).
(viii) Employer contributions
Employer contributions to the defined benefit section of the plan are based on recommendations by the plan’s actuary. Actuarial assessments are made at no more than three yearly intervals, and the last such assessment was made as at 30 June 2012.
Total employer contributions expected to be paid by the group for the year ending 30 June 2013 are $623,000.
(ix) Historic summary
2013 $’000
2012 $’000
2011 $’000
2010 $’000
2009 $’000
Defined benefit plan obligation (9,361) (4,492) (3,479) (3,203) (2,832)
Plan assets 5,991 2,797 2,264 3,403 2,943
Surplus/(deficit) (3,370) (1,695) (1,215) 200 111
Experience adjustments arising on plan liabilities 277 341 (196) 23 (67)
Experience adjustments arising on plan assets 488 (73) 54 78 (25)

VALUE ACCOUNTS Holdings LimitedPwC 101
E4 Assets and liabilities classified as held for saleThis note provides further information about assets and liabilities that were held for sale at the end of the reporting period.
(a) Assets classified as held for sale
2013 $’000
2012 $’000
Disposal group held for sale (discontinued operation – see note C2)
Property, plant and equipment - 1,995
Trade receivables - 1,570
Inventories - 13,900
Total assets of disposal group held for sale - 17,465
Non-current assets held for sale
Land 250 -
250 -
In May 2013, the directors of VALUE ACCOUNTS Manufacturing Limited decided to sell a parcel of vacant land which was originally acquired for an expansion of the Queensland factory. There are several interested parties and the sale is expected to be completed before the end of December 2013. The asset is presented within total assets of the Australian Furniture – manufacturing segment in note A1.
(b) Liabilities directly associated with assets classified as held for sale
2013 $’000
2012 $’000
Disposal group held for sale (discontinued operation – see note C2)
Trade creditors - (450)
Provision for employee benefits - (50)
- (500)

102VALUE ACCOUNTS Holdings LimitedPwC
E5 Other reservesThe following table shows a breakdown of the balance sheet line item ‘other reserves’ and the movements in these reserves during the year. A description of the nature and purpose of each reserve is provided below the table.
Notes
Revaluation surplus
$’000
AfS financial
assets $’000
Cash flow
hedges $’000
Share- based
payments $’000
Transactions with NCI
$’000
Foreign currency
translation $’000
Total other
reserve $’000
At 1 July 2011 3,220 1,173 (203) 1,289 - - 5,479
Revaluation – gross
A4(b) E2(c) B2(a) 5,840 (1,378) (104) - - - 4,906
Deferred tax E3(b) (1,752) 413 31 - - - 1,472
NCI share in revaluation (124) - - - - - (124)
Depreciation transfer – gross E6 (334) - - - - - (334)
Deferred tax 100 - - - - - 100
Revaluation associate 100 - - - - - 100
Deferred tax E3(b) (30) - - - - - (30)
Reclassification to profit or loss – gross
E2(c)B2(a) - 548 (195) - - - (195)
Deferred tax E3(b) - (164) 59 - - - 59
Transfer to inventory – gross B2(a) - - 679 - - - 679
Deferred tax E3(b) - - (204) - - - (204)
Currency translation differences – current period - - - - - 2,159 2,159
NCI share in translation differences - - - - - (133) (133)
Other comprehensive income 3,800 (581) 266 - - 2,026 5,511

103VALUE ACCOUNTS Holdings LimitedPwC
Notes
Revaluation surplus
$’000
AfS financial
assets $’000
Cash flow
hedges $’000
Share- based
payments $’000
Transactions with NCI
$’000
Foreign currency
translation $’000
Total other
reserve $’000
Transactions with owners in their capacity as owners
Share-based payment expenses F4 - - - 555 - - 555
At 30 June 2012 7,020 592 63 1,844 - 2,026 11,545
Revaluation – gross
A4(b) E2(c) B2(a) 7,243 880 (468) - - - 7,657
Deferred tax E3(b) (2,173) (264) 140 - - - (2,297)
NCI share in revaluation (148) - - - - - (148)
Depreciation transfer – gross E6 (320) - - - - - (320)
Deferred tax 96 - - - - - 96
Revaluation joint venture 300 - - - - - 300
Deferred tax E3(b) (90) - - - - - (90)
Reclassification to profit or loss – gross
E2(c) B2(a) - (646) (155) - - - (801)
Deferred tax E3(b) - 194 47 - - - 241
Transfer to inventory – gross B2(a) - - 231 - - - 231
Deferred tax E3(b) - - (69) - - - (69)
Currency translation differences – current period - - - - - 30 30
Net investment hedge (i) - - - - - (287) (287)
NCI share in translation differences - - - - - 247 247
Other comprehensive income 4,908 164 (274) - - (10) 4,788

104VALUE ACCOUNTS Holdings LimitedPwC
Notes
Revaluation surplus
$’000
AfS financial
assets $’000
Cash flow
hedges $’000
Share- based
payments $’000
Transactions with NCI
$’000
Foreign currency
translation $’000
Total other
reserve $’000
Transactions with owners in their capacity as owners
Share-based payment expenses F4 2,018 2,018
Issue of treasury shares to employees A5(g) - - - (1,091) - - (1,091)
Transactions with NCI C3(b) - - - - (333) - (333)
At 30 June 2012 11,928 756 (211) 2,771 (333) 2,016 11,545
(i) Nature and purpose of other reserves
Revaluation surplus – property, plant and equipment
The property, plant and equipment revaluation surplus is used to record increments and decrements on the revaluation of non-current assets, as described in note F9(r). In the event of a sale of an asset, any balance in the reserve in relation to the asset is transferred to retained earnings.
Available-for-sale financial assets
Changes in the fair value and exchange differences arising on translation of investments, such as equities, classified as available-for-sale financial assets, are recognised in other comprehensive income, as described in note F9(o) and accumulated in a separate reserve within equity. Amounts are reclassified to profit or loss when the associated assets are sold or impaired.
Cash flow hedges
The hedging reserve is used to record gains or losses on a hedging instrument in a cash flow hedge that are recognised in other comprehensive income, as described in note F9(p). Amounts are reclassified to profit or loss when the associated hedged transaction affects profit or loss.
Share-based payments
The share-based payments reserve is used to recognise:
• the grant date fair value of options issued to employees but not exercised• the grant date fair value of shares issued to employees• the grant date fair value of deferred shares granted to employees but not yet vested• the issue of shares held by the VALUE ACCOUNTS Employee Share Trust to employees.
Transactions with non-controlling interests
This reserve is used to record the differences described in note F9(b)(v) which may arise as a result of transactions with non-controlling interests that do not result in a loss of control.
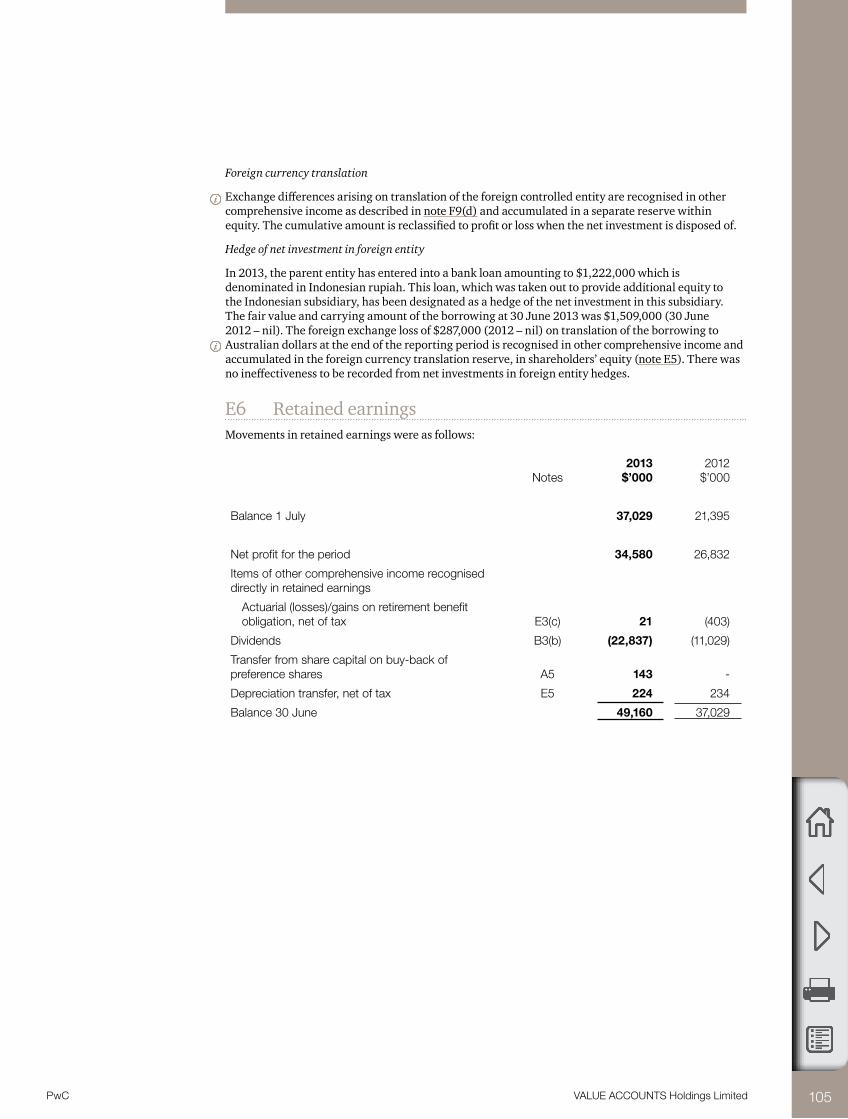
VALUE ACCOUNTS Holdings LimitedPwC 105
Foreign currency translation
Exchange differences arising on translation of the foreign controlled entity are recognised in other comprehensive income as described in note F9(d) and accumulated in a separate reserve within equity. The cumulative amount is reclassified to profit or loss when the net investment is disposed of.
Hedge of net investment in foreign entity
In 2013, the parent entity has entered into a bank loan amounting to $1,222,000 which is denominated in Indonesian rupiah. This loan, which was taken out to provide additional equity to the Indonesian subsidiary, has been designated as a hedge of the net investment in this subsidiary. The fair value and carrying amount of the borrowing at 30 June 2013 was $1,509,000 (30 June 2012 – nil). The foreign exchange loss of $287,000 (2012 – nil) on translation of the borrowing to Australian dollars at the end of the reporting period is recognised in other comprehensive income and accumulated in the foreign currency translation reserve, in shareholders’ equity (note E5). There was no ineffectiveness to be recorded from net investments in foreign entity hedges.
E6 Retained earningsMovements in retained earnings were as follows:
Notes2013
$’0002012
$’000
Balance 1 July 37,029 21,395
Net profit for the period 34,580 26,832
Items of other comprehensive income recognised directly in retained earnings
Actuarial (losses)/gains on retirement benefit obligation, net of tax E3(c) 21 (403)
Dividends B3(b) (22,837) (11,029)
Transfer from share capital on buy-back of preference shares A5 143 -
Depreciation transfer, net of tax E5 224 234
Balance 30 June 49,160 37,029
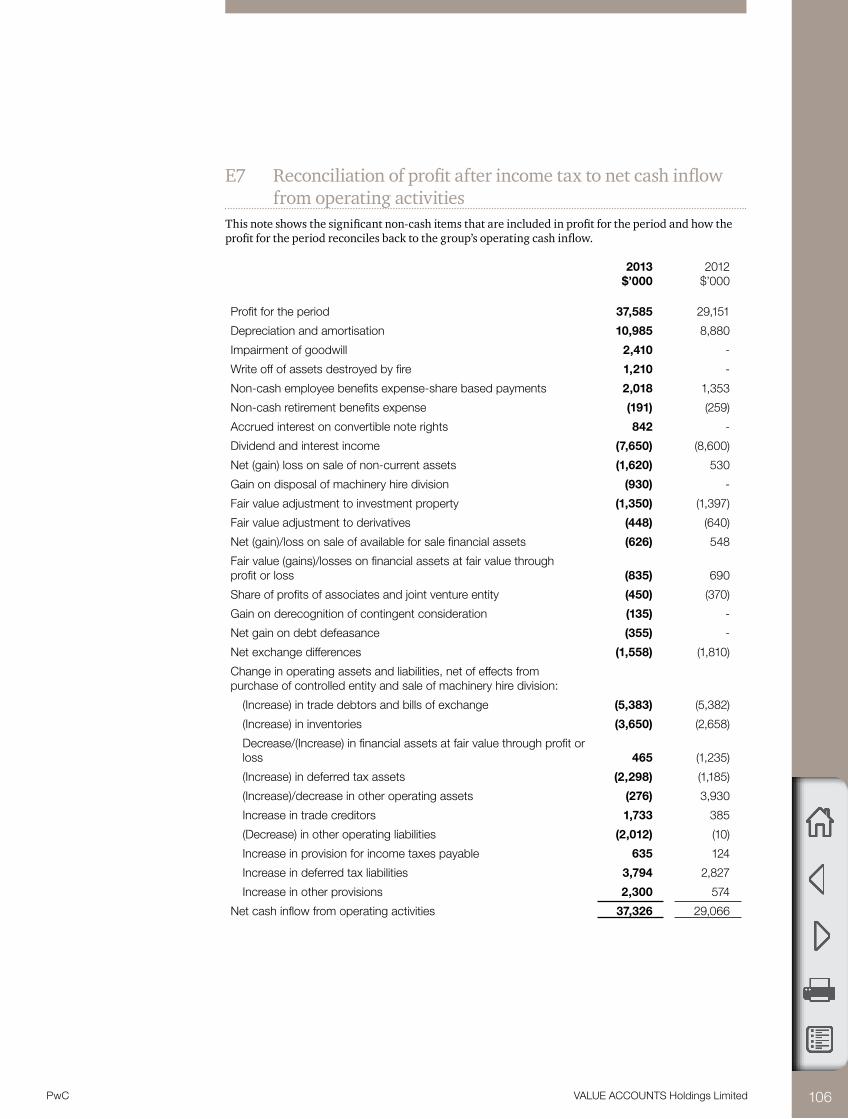
VALUE ACCOUNTS Holdings LimitedPwC 106
E7 Reconciliation of profit after income tax to net cash inflow from operating activities
This note shows the significant non-cash items that are included in profit for the period and how the profit for the period reconciles back to the group’s operating cash inflow.
2013 $’000
2012 $’000
Profit for the period 37,585 29,151
Depreciation and amortisation 10,985 8,880
Impairment of goodwill 2,410 -
Write off of assets destroyed by fire 1,210 -
Non-cash employee benefits expense-share based payments 2,018 1,353
Non-cash retirement benefits expense (191) (259)
Accrued interest on convertible note rights 842 -
Dividend and interest income (7,650) (8,600)
Net (gain) loss on sale of non-current assets (1,620) 530
Gain on disposal of machinery hire division (930) -
Fair value adjustment to investment property (1,350) (1,397)
Fair value adjustment to derivatives (448) (640)
Net (gain)/loss on sale of available for sale financial assets (626) 548
Fair value (gains)/losses on financial assets at fair value through profit or loss (835) 690
Share of profits of associates and joint venture entity (450) (370)
Gain on derecognition of contingent consideration (135) -
Net gain on debt defeasance (355) -
Net exchange differences (1,558) (1,810)
Change in operating assets and liabilities, net of effects from purchase of controlled entity and sale of machinery hire division:
(Increase) in trade debtors and bills of exchange (5,383) (5,382)
(Increase) in inventories (3,650) (2,658)
Decrease/(Increase) in financial assets at fair value through profit or loss 465 (1,235)
(Increase) in deferred tax assets (2,298) (1,185)
(Increase)/decrease in other operating assets (276) 3,930
Increase in trade creditors 1,733 385
(Decrease) in other operating liabilities (2,012) (10)
Increase in provision for income taxes payable 635 124
Increase in deferred tax liabilities 3,794 2,827
Increase in other provisions 2,300 574
Net cash inflow from operating activities 37,326 29,066

VALUE ACCOUNTS Holdings LimitedPwC 107
F Other information
Covers other information that is not directly related to specific
line items in the financial statements, including information
about related party transactions, share-based payments,
assets pledged as security and other statutory information.
F1 Related party transactions 108
F2 Significant subsidiaries 110
F3 Key management personnel disclosures 110
F4 Share-based payments 116
F5 Remuneration of auditors 120
F6 Assets pledged as security 121
F7 Deed of cross guarantee 122
F8 Parent entity financial information 124
F9 Summary of accounting policies 125

VALUE ACCOUNTS Holdings LimitedPwC 108
F1 Related party transactions This note shows the extent of related party transactions that are undertaken by the group and the impact they had on the financial performance and position of the group.
(a) Parent entities
The parent entity within the group is VALUE ACCOUNTS Holdings Limited. The ultimate Australian parent entity is Lion (Australia) Limited which at 30 June 2013 owns 60% (2012 – 63.7%) of the issued ordinary shares of VALUE ACCOUNTS Holdings Limited. The ultimate parent entity and ultimate controlling party is Lion plc (incorporated in the United Kingdom) which at 30 June 2013 owns 100% (2012 – 100%) of the issued ordinary shares of Lion (Australia) Limited.
(b) Subsidiaries
A list of significant subsidiaries is provided in note F2.
(c) Key management personnel
Disclosures relating to key management personnel are set out in note F3.
(d) Transactions with other related parties
The following transactions occurred with related parties:
2013 $
2012 $
Purchases of goods
Purchases of electronic equipment from other related parties 182,232 78,300
Dividend revenue
Other related parties 150,000 300,000
Superannuation contributions
Contributions to superannuation funds on behalf of employees 3,719,333 3,287,543
Other transactions
Dividends paid to ultimate Australian parent entity (Lion (Australia) Limited) 13,313,400 6,553,200
Final call on partly paid ordinary shares paid by ultimate Australian parent entity (note A5(a)) 840,321 -
Subscriptions for new ordinary shares by ultimate Australian parent entity (note A5(c)) 4,626,422 -
Remuneration paid to directors of the ultimate Australian parent entity 155,419 149,467
(e) Outstanding balances arising from sales/purchases of goods and services
The following balances are outstanding at the end of the reporting period in relation to transactions with related parties:
2013 $
2012 $
Current payables (purchases of goods)
Other related parties 265,327 94,300
F Other information
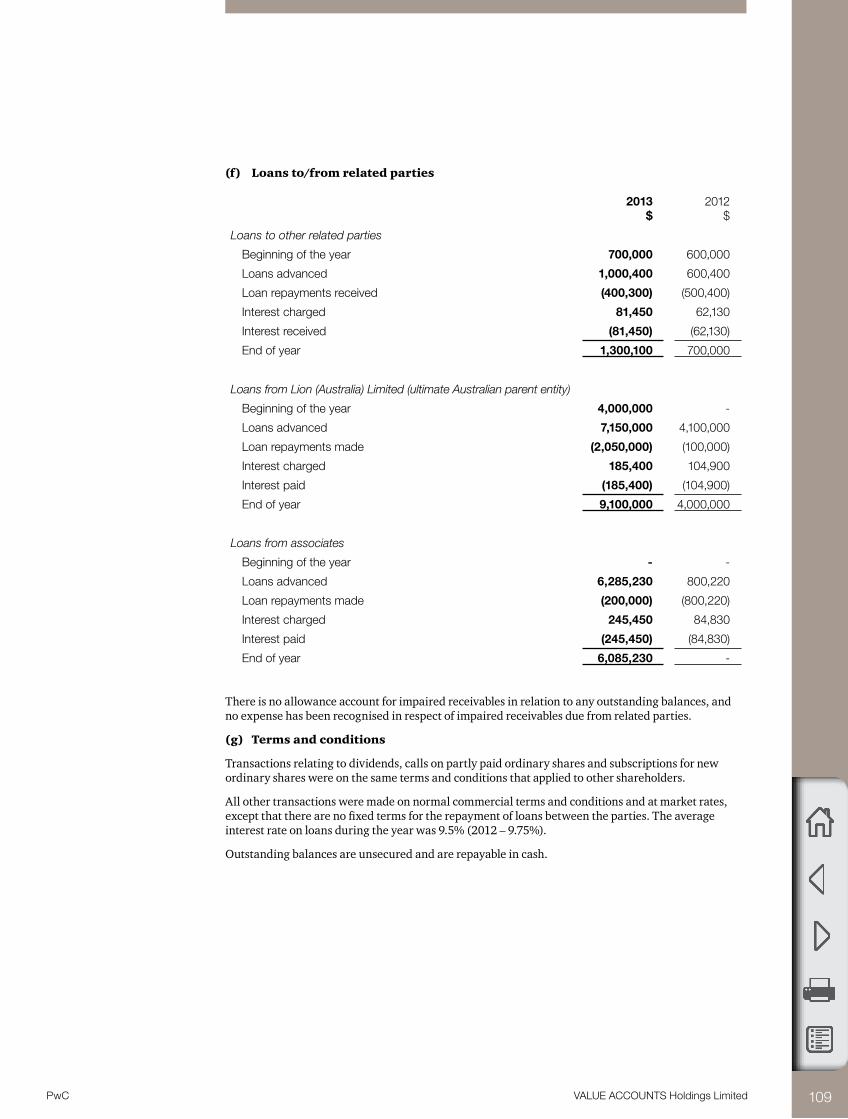
VALUE ACCOUNTS Holdings LimitedPwC 109
(f) Loans to/from related parties
2013 $
2012 $
Loans to other related parties
Beginning of the year 700,000 600,000
Loans advanced 1,000,400 600,400
Loan repayments received (400,300) (500,400)
Interest charged 81,450 62,130
Interest received (81,450) (62,130)
End of year 1,300,100 700,000
Loans from Lion (Australia) Limited (ultimate Australian parent entity)
Beginning of the year 4,000,000 -
Loans advanced 7,150,000 4,100,000
Loan repayments made (2,050,000) (100,000)
Interest charged 185,400 104,900
Interest paid (185,400) (104,900)
End of year 9,100,000 4,000,000
Loans from associates
Beginning of the year - -
Loans advanced 6,285,230 800,220
Loan repayments made (200,000) (800,220)
Interest charged 245,450 84,830
Interest paid (245,450) (84,830)
End of year 6,085,230 -
There is no allowance account for impaired receivables in relation to any outstanding balances, and no expense has been recognised in respect of impaired receivables due from related parties.
(g) Terms and conditions
Transactions relating to dividends, calls on partly paid ordinary shares and subscriptions for new ordinary shares were on the same terms and conditions that applied to other shareholders.
All other transactions were made on normal commercial terms and conditions and at market rates, except that there are no fixed terms for the repayment of loans between the parties. The average interest rate on loans during the year was 9.5% (2012 – 9.75%).
Outstanding balances are unsecured and are repayable in cash.

VALUE ACCOUNTS Holdings LimitedPwC 110
F2 Significant subsidiaries The consolidated financial statements incorporate the assets, liabilities and results of the following principal subsidiaries in accordance with the accounting policy described in note F9(b):
Equity holding **
Name of entityCountry of
incorporationClass of
shares2013
%2012
%
VALUE ACCOUNTS Retail Limited Australia Ordinary 65 65
Preference 100 100
VALUE ACCOUNTS Manufacturing Limited (note C3(b)) Australia Ordinary 90 85
VALUE ACCOUNTS Electronics Pty Ltd Australia Ordinary 70 -
VALUE ACCOUNTS Overseas Limited Indonesia Ordinary 100 100
VALUE ACCOUNTS Consulting Limited* Australia Ordinary 100 100
VALUE ACCOUNTS Development Limited* Australia Ordinary 100 100
* These subsidiaries have been granted relief from the necessity to prepare financial reports in accordance with Class Order 98/1418 issued by the Australian Securities and Investments Commission. For further information refer to note F7.
** The proportion of ownership interest is equal to the proportion of voting power held.
F3 Key management personnel disclosures This note discloses the aggregate remuneration received by key management personnel for the period and sets out detailed information about equity holdings and transactions undertaken with key management personnel that must be disclosed in the financial statements under Australian Accounting Standards.
(a) Key management personnel compensation
2013 $
2012 $
Short-term employee benefits 2,232,619 2,053,464
Post-employment benefits 179,953 161,541
Long-term benefits 39,530 32,719
Termination benefits 115,500 -
Share-based payments 704,942 261,994
3,272,544 2,509,718
Detailed information about the remuneration received by each key management person is provided in the remuneration report on pages x to y.
(b) Equity instrument disclosures relating to key management personnel
Options and rights to deferred shares granted as remuneration
Details of options and rights to deferred shares granted as remuneration, together with their terms and conditions, can be found in the remuneration report on pages x to y and x to y. The report also shows shares issued on the exercise of such options and on vesting of the rights.

111VALUE ACCOUNTS Holdings LimitedPwC
Option and rights holdings
The numbers of options over ordinary shares in the company and rights to deferred shares granted under the executive short-term incentive scheme that were held during the financial year by each director of VALUE ACCOUNTS Holdings Limited and other key management personnel of the group, including their personally related parties, are set out below.
2013 Name
Balance at start of
the yearGranted as
compensation
Exercised (options)/
Vested (rights)Other
changes
Balance at end of the
yearVested and exercisable Unvested
N T Toddington– Options 470,000 250,000 (59,000) - 661,000 91,000 570,000
– Deferred shares 21,024 9,091 (14,019) - 16,096 n/a 16,096
H G Wells– Options 179,000 70,000 (46,000) - 203,000 8,000 195,000
– Deferred shares 1,751 3,636 - - 5,387 n/a 5,387
R T Brown– Options 200,000 - - (200,000) - - -
– Deferred shares 13,488 7,273 (5,607) (15,153) - - -
P M Elliott– Options 186,000 80,000 (22,000) - 244,000 34,000 210,000
– Deferred shares 10,920 7,273 (6,542) - 11,651 n/a 11,651
D M Green– Options 180,000 70,000 (26,000) - 224,000 29,000 195,000
– Deferred shares 17,808 8,182 (4,673) - 21,317 n/a 21,317
S J McInnes– Options 127,000 60,000 (16,000) - 171,000 24,000 147,000
– Deferred shares 12,298 8,182 (6,168) - 14,312 n/a 14,312
W P Shanahan– Options 207,000 90,000 (26,000) (271,000) - - -
– Deferred shares - 6,545 - (6,542) - - -

112VALUE ACCOUNTS Holdings LimitedPwC
All vested options are exercisable at the end of the year.
2012 Name
Balance at start of the
yearGranted as
compensation
Exercised (options)/
Vested (rights)Other
changes
Balance at end of the
yearVested and exercisable Unvested
N T Toddington– Options 440,000 170,000 - (140,000) 470,000 - 470,000
– Deferred shares 14,019 7,005 - - 21,024 - 21,024
R T Brown– Options 170,000 80,000 - (50,000) 200,000 - 200,000
– Deferred shares 5,607 7,881 - - 13,488 - 1,751
P M Elliott– Options 170,000 70,000 - (54,000) 186,000 - 186,000
– Deferred shares 6,542 4,378 - - 10,920 - 13,488
D M Green– Options 165,000 65,000 - (50,000) 180,000 - 180,000
– Deferred shares 4,673 13,135 - - 17,808 - 10,920
S J McInnes– Options 112,000 45,000 - (30,000) 127,000 - 127,000
– Deferred shares 6,168 6,130 - - 12,298 - 17,808
R J Jackson– Options 114,000 70,000 - (184,000) - - -
– Deferred shares 6,542 4,378 - (10,920) - - -
W P Shanahan– Options 179,000 80,000 (52,000) 207,000 - 207,000
– Deferred shares - - - - - - -

113VALUE ACCOUNTS Holdings LimitedPwC
Share holdings
The numbers of shares in the company held during the financial year by each director of VALUE ACCOUNTS Holdings Limited and other key management personnel of the group, including their personally related parties, are set out below. There were no shares granted during the reporting period as compensation.
2013 Name
Balance at the start of
the year
Received during the
year on the exercise of
options
Received on vesting of rights to
deferred shares
Other changes
during the year
Balance at the end of
the year
Ordinary shares
N T Toddington 23,369 59,000 14,019 4,352 100,740
H G Wells 18,214 46,000 - 3,259 67,473
R T Brown 10,000 - 5,607 (15,607) -
M K Hollingworth 20,000 - - 2,000 82,000
J C Campbell 10,310 - - 1,406 71,716
A L Cunningham 10,000 - - 1,000 71,000
R J Hunter 12,372 - - 1,687 74,059
C A Maxwell 10,000 - - 1,000 71,000
B A Wilson 12,000 - - 1,200 73,200
B C Bristol - - - 11,000 11,000
P M Elliott 22,714 22,000 6,542 2,671 53,927
D M Green 17,539 26,000 4,673 2,894 51,106
S J McInnes 14,249 16,000 6,168 (3,191) 33,226
B D Faraday - - - 11,000 11,000
W P Shanahan 13,059 26,000 - (39,059) -
7% non-redeemable participating preference shares
N T Toddington 3,000 - - (3,000) -

114VALUE ACCOUNTS Holdings LimitedPwC
2012 Name
Balance at the start of the year
Received during the year on
the exercise of options
Received on vesting of rights
to deferred shares
Other changes during the year
Balance at the end of the year
Ordinary shares
N T Toddington 19,010 - - 4,359 23,369
R T Brown 7,000 - - 3,000 10,000
M K Hollingworth 78,000 - - 2,000 80,000
J C Campbell 69,000 - - 1,310 70,310
A L Cunningham 69,000 - - 1,000 70,000
R J Hunter 70,775 - - 1,597 72,372
C A Maxwell 69,500 - - 500 70,000
B A Wilson 70,800 - - 1,200 72,000
P M Elliott 27,075 - - (4,361) 22,714
D M Green 14,958 - - 2,581 17,539
S J McInnes 12,905 - - 1,344 14,249
W P Shanahan 18,660 - - (5,601) 13,059
7% NRPPS1
N T Toddington 3,000 - - - 3,000
1. non-redeemable participating preference shares

VALUE ACCOUNTS Holdings LimitedPwC 115
(c) Loans to key management personnel
Details of loans made to directors of VALUE ACCOUNTS Holdings Limited and other key management personnel of the group, including their personally related parties, are set out below.
(i) Aggregates for key management personnel
Balance at the start
of the year
Interest paid and payable
for the year
Interest not
charged
Balance at the end of
the year
Number in group at
the end of the year
$ $ $ $
2013 606,300 56,929 16,262 717,450 6
2012 502,700 41,275 14,128 606,300 5
(ii) Individuals with loans above $100,000 during the financial year
2013 Name
Balance at the start
of the year
Interest paid and payable
for the year
Interest not
charged
Balance at the end of
the year
Highest indebtedness
during the year
$ $ $ $ $
B D Faraday - 25,750 7,300 210,000 220,000
In 2012, there were no loans to individuals that exceeded $100,000 at any time.
Loans outstanding at the end of the current and prior year include an unsecured loan to a director of VALUE ACCOUNTS Holdings Limited of $60,000 which was made for a period of two years and is repayable in full on 30 September 2013. Interest is payable on this loan at the rate of 8% per annum.
All other loans to key management personnel are for periods of 10 years repayable in quarterly instalments, at interest rates of 5% per annum, and are secured by first mortgages over the individuals’ residences.
The amounts shown for interest not charged in the tables above represent the difference between the amount paid and payable for the year and the amount of interest that would have been charged on an arm’s-length basis.
No write-downs or allowances for doubtful receivables have been recognised in relation to any loans made to key management personnel.
(d) Other transactions with key management personnel
A director, Mr A L Cunningham, is a director and a controlling shareholder of Combined Construction Company Pty Ltd. VALUE ACCOUNTS Holdings Limited entered into a contract with Combined Construction Company Pty Ltd during the year for the construction of a warehouse building. The contract was based on normal commercial terms and conditions.
The wife of Mr A L Cunningham, a director, is a director and majority shareholder of Elephant Limited. VALUE ACCOUNTS Holdings Limited has rented an office building from Elephant Limited for the past three years. The rental agreement is based on normal commercial terms and conditions.
A director, Mr B C Bristol, is a partner in the firm of Bristol & Partners, Solicitors. Bristol & Partners has provided legal services to VALUE ACCOUNTS Holdings Limited and certain of its subsidiaries for several years on normal commercial terms and conditions.
Mr D M Green, manager of the furniture division, is a director of Llama Pty Ltd and has the capacity to significantly influence decision making of that company. VALUE ACCOUNTS Holdings Limited owns shares in Llama Pty Ltd on which it receives dividends on the same basis as other shareholders.
Aggregate amounts of each of the above types of other transactions with key management personnel of VALUE ACCOUNTS Holdings Limited:

VALUE ACCOUNTS Holdings LimitedPwC 116
2013 $
2012 $
Amounts recognised as revenue
Dividends received 8,100 7,800
Amounts recognised as expense
Legal fees 38,390 2012
Rent of office building 570,400 550,300
608,790 576,020
Amounts recognised as property, plant and equipment
Construction of warehouse building 155,475 -
During the year, the group also sold household furniture for domestic use to key management personnel within a normal employee relationship on terms and conditions no more favourable than those which it is reasonable to expect would have been adopted if dealing with an unrelated individual at arm’s length in the same circumstances.
Aggregate amounts of assets at the end of the reporting period relating to the above types of other transactions with key management personnel of the group:
2013 $
2012 $
Non-current assets 155,475 -
Aggregate amounts payable to key management personnel of the group at the end of the reporting period relating to the above types of other transactions:
2013 $
2012 $
Current liabilities 196,375 91,294
F4 Share-based paymentsThis note shows the extent of share-based payment transactions undertaken by the group and how these have affected the group’s equity structure and profit or loss.
(a) Employee Option Plan
The establishment of the VALUE ACCOUNTS Employee Option Plan was approved by shareholders at the 2008 annual general meeting. The Employee Option Plan is designed to provide long-term incentives for senior managers and above (including executive directors) to deliver long-term shareholder returns. Under the plan, participants are granted options which only vest if certain performance standards are met. Participation in the plan is at the board’s discretion and no individual has a contractual right to participate in the plan or to receive any guaranteed benefits.
The amount of options that will vest depends on VALUE ACCOUNTS Holdings Limited’s total return to shareholders (TSR), including share price growth, dividends and capital returns, ranking within a peer group of 20 selected companies that are listed on the ASX over a three-year period. Once vested, the options remain exercisable for a period of two years. Options are granted under the plan for no consideration.
Options granted under the plan carry no dividend or voting rights.
When exercisable, each option is convertible into one ordinary share fourteen days after the release of the half-yearly and annual financial results of the group to the market.
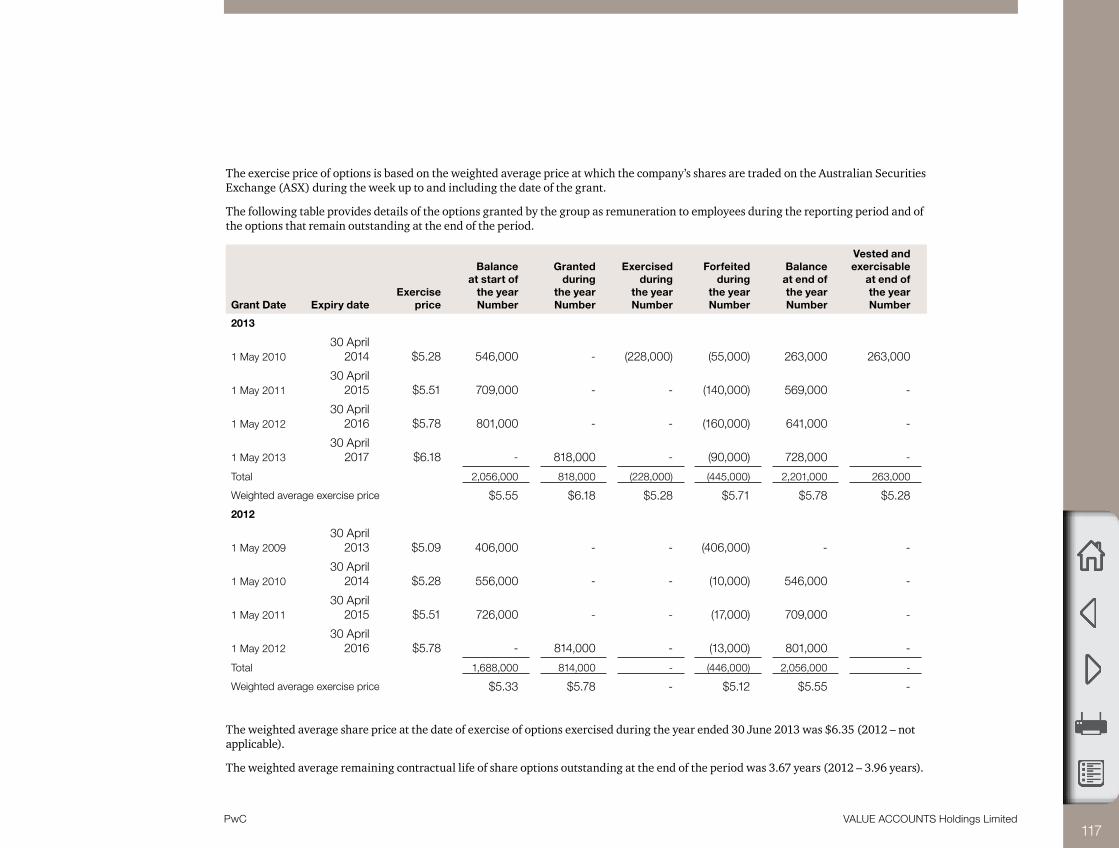
117VALUE ACCOUNTS Holdings LimitedPwC
The exercise price of options is based on the weighted average price at which the company’s shares are traded on the Australian Securities Exchange (ASX) during the week up to and including the date of the grant.
The following table provides details of the options granted by the group as remuneration to employees during the reporting period and of the options that remain outstanding at the end of the period.
Grant Date Expiry dateExercise
price
Balance at start of
the year Number
Granted during
the year Number
Exercised during
the year Number
Forfeited during
the year Number
Balance at end of the year Number
Vested and exercisable
at end of the year Number
2013
1 May 201030 April
2014 $5.28 546,000 - (228,000) (55,000) 263,000 263,000
1 May 201130 April
2015 $5.51 709,000 - - (140,000) 569,000 -
1 May 201230 April
2016 $5.78 801,000 - - (160,000) 641,000 -
1 May 201330 April
2017 $6.18 - 818,000 - (90,000) 728,000 -
Total 2,056,000 818,000 (228,000) (445,000) 2,201,000 263,000
Weighted average exercise price $5.55 $6.18 $5.28 $5.71 $5.78 $5.28
2012
1 May 200930 April
2013 $5.09 406,000 - - (406,000) - -
1 May 201030 April
2014 $5.28 556,000 - - (10,000) 546,000 -
1 May 201130 April
2015 $5.51 726,000 - - (17,000) 709,000 -
1 May 201230 April
2016 $5.78 - 814,000 - (13,000) 801,000 -
Total 1,688,000 814,000 - (446,000) 2,056,000 -
Weighted average exercise price $5.33 $5.78 - $5.12 $5.55 -
The weighted average share price at the date of exercise of options exercised during the year ended 30 June 2013 was $6.35 (2012 – not applicable).
The weighted average remaining contractual life of share options outstanding at the end of the period was 3.67 years (2012 – 3.96 years).

VALUE ACCOUNTS Holdings LimitedPwC 118
(i) Fair value of options granted
The assessed fair value at grant date of options granted during the year ended 30 June 2013 was $1.80 per option (2012 – $1.75). The fair value at grant date is independently determined using a Black-Scholes option pricing model that takes into account the exercise price, the term of the option, the impact of dilution, the share price at grant date and expected price volatility of the underlying share, the expected dividend yield and the risk free interest rate for the term of the option.
The model inputs for options granted during the year ended 30 June 2013 included:
(a) options are granted for no consideration and vest based on VALUE ACCOUNTS Holdings Limited’s TSR ranking within a peer group of 20 selected companies over a three-year period. Vested options are exercisable for a period of two years after vesting
(b) exercise price: $6.18 (2012 – $5.78)
(c) grant date: 1 May 2013 (2012 – 1 May 2012)
(d) expiry date: 30 April 2017 (2012 – 30 April 2016)
(e) share price at grant date: $6.18 (2012 – $5.78)
(f) expected price volatility of the company’s shares: 35% (2012 – 30%)
(g) expected dividend yield: 3.8% (2012 – 3.2%)
(h) risk-free interest rate: 6% (2012 – 5.5%)
The expected price volatility is based on the historic volatility (based on the remaining life of the options), adjusted for any expected changes to future volatility due to publicly available information.
Where options are issued to employees of subsidiaries within the group, the subsidiaries compensate VALUE ACCOUNTS Holdings Limited for the amount recognised as expense in relation to these options.
(b) Deferred shares – executive short-term incentive scheme
Under the group’s short-term incentive (STI) scheme, executives receive 50% of the annual STI achieved in cash and 50% in the form of rights to deferred shares of VALUE ACCOUNTS Holdings Limited. The rights are granted on the 31 August of the following year and vest after two years from the grant date. They automatically convert into one ordinary share each on vesting at an exercise price of nil. The executives do not receive any dividends and are not entitled to vote in relation to the deferred shares during the vesting period. If an executive ceases to be employed by the group within this period, the rights will be forfeited, except in limited circumstances that are approved by the board on a case-by-case basis.
The deferred shares are administered by the VALUE ACCOUNTS Employee Benefit Trust. This trust is consolidated in accordance with note F9(b)(ii). The shares are acquired on market at the grant date and are held as treasury shares until such time as they are vested. Forfeited shares are reallocated in subsequent grants.
The number of rights to be granted is determined based on the dollar value of the achieved STI divided by the weighted average price at which the company’s shares are traded on the ASX during the week up to and include the date of the grant.
2013 2012
Number of rights to deferred shares granted on 31 August 2012 (31 August 2011) 57,636 52,364
Weighted average fair value of rights at grant date $5.50 $5.71
The fair value of the rights at grant date was estimated based on the market price of the company’s shares on that date, with a downward adjustment to take into account the present value of dividends that will not be received by the executives on their rights during the two-year vesting period.

VALUE ACCOUNTS Holdings LimitedPwC 119
(c) Employee share scheme
A scheme under which shares may be issued by the company to employees for no cash consideration was approved by shareholders at the 2009 annual general meeting. All Australian resident permanent employees (excluding executive directors, other key management personnel of the group and the group company secretary) who have been continuously employed by the group for a period of at least one year are eligible to participate in the scheme. Employees may elect not to participate in the scheme.
Since the current reporting period, the employee share scheme is also administered by the VALUE ACCOUNTS Employee Benefit Trust. This Trust is consolidated in accordance with note F9(b)(ii).
Shares issued by the trust to the employees are acquired on-market prior to the issue. Shares held by the trust and not yet issued to employees at the end of the reporting period are shown as treasury shares in the financial statements, see note A5.
Under the scheme, eligible employees may be granted up to $1,000 worth of fully paid ordinary shares in VALUE ACCOUNTS Holdings Limited annually for no cash consideration. The market value of shares issued under the scheme, measured as the weighted average price at which the company’s shares are traded on the ASX during the week up to and including the date of grant, is recognised in the balance sheet as an issue of treasury shares by the trust (in 2012 as share capital) and as part of employee benefit costs in the period the shares are granted.
Offers under the scheme are at the discretion of the company, and no offer may be made unless annual profit growth in the financial year prior to the date of the offer was at least 3% greater than the increase in the consumer price index.
Shares issued under the scheme may not be sold until the earlier of three years after issue or cessation of employment by the group. In all other respects the shares rank equally with other fully-paid ordinary shares on issue (refer to note A5).
The number of shares issued to participants in the scheme is the offer amount divided by the weighted average price at which the company’s shares are traded on the ASX during the week up to and including the date of grant.
Where shares are issued to employees of subsidiaries within the group, the subsidiaries compensate VALUE ACCOUNTS Holdings Limited for the fair value of these shares.
2013 2012
Number of shares issued under the plan to participating employees on 1 December 2012 (2012 – 2 December 2011) 145,902 142,857
Each participant was issued with shares worth $1,000 based on the weighted average market price of $6.18 (2012 – $5.59). Since the current period, these shares were acquired on-market by the VALUE ACCOUNTS Employee Benefit Trust. In the prior year, VALUE ACCOUNTS Holdings Limited satisfied its obligations by issuing new shares.
(d) Expenses arising from share-based payment transactions
Total expenses arising from share-based payment transactions recognised during the period as part of employee benefit expense were as follows:
2013 $’000
2012 $’000
Options issued under employee option plan 896 330
Deferred shares issued under the short-term incentive scheme 220 225
Shares issued under employee share scheme 902 798
2,018 1,353

VALUE ACCOUNTS Holdings LimitedPwC 120
F5 Remuneration of auditors During the year the following fees were paid or payable for services provided by the auditor of the parent entity, its related practices and non-related audit firms:
2013 $
2012 $
(a) PricewaterhouseCoopers Australia(i) Audit and other assurance services
Audit and review of financial statements 197,900 186,300
Other assurance services
Audit of regulatory returns 24,900 24,500
Due diligence services - 10,300
Total remuneration for audit and other assurance services 222,800 221,100
(ii) Taxation services
Tax compliance services 25,000 23,700
International tax consulting and tax advice on mergers and acquisitions 20,200 17,500
Total remuneration for taxation services 45,200 41,200
(iii) Other services
Remuneration advice (including remuneration recommendation) 40,500 29,200
Benchmarking services 12,300 -
Total remuneration for other services 52,800 29,200
Total remuneration of PricewaterhouseCoopers Australia 320,800 291,500
(b) Network firms of PricewaterhouseCoopers Australia (i) Audit and other assurance services
Audit and review of financial statements 121,000 119,000
Other assurance services
Audit of regulatory returns 6,300 5,500
Total remuneration for audit and other assurance services 127,300 124,500
(ii) Other services
Benchmarking services 5,500 7,200
Total remuneration of network firms of PricewaterhouseCoopers Australia 132,800 131,700
(c) Non-PricewaterhouseCoopers audit firms (i) Audit and other assurance services
Audit and review of financial statements 45,000 -
(ii) Other services
Detailed remuneration disclosures are provided in the remuneration report on pages 12 to 24.
Legal services 7,500 10,900
Total remuneration of non-PricewaterhouseCoopers audit firms 52,500 10,900
Total auditors’ remuneration 506,100 434,100

VALUE ACCOUNTS Holdings LimitedPwC 121
It is the group’s policy to employ PricewaterhouseCoopers on assignments additional to their statutory audit duties where PricewaterhouseCoopers’s expertise and experience with the group are important. These assignments are principally tax advice and due diligence reporting on acquisitions, or where PricewaterhouseCoopers is awarded assignments on a competitive basis. It is the group’s policy to seek competitive tenders for all major consulting projects.
F6 Assets pledged as securityThis note provides a summary of the carrying amounts of assets that are pledged as security for current and non-current borrowings:
Notes2013
$’0002012
$’000
Current
Transferred receivables 3,250 -
Floating charge
Cash and cash equivalents E2(a) 24,678 11,154
Receivables A3(a) 12,410 13,542
Financial assets at fair value through profit or loss E2(b) 11,300 10,915
Derivative financial instruments B2 1,088 640
Total current assets pledged as security 52,726 36,651
Non-current
First mortgage
Freehold land and buildings A4(b) 24,950 23,640
Investment properties E3(a) 13,300 10,050
38,250 33,690
Finance lease
Plant and equipment A4(b) 2,750 2,950
Floating charge
Receivables – non-current A3(a) 1,300 700
Available-for-sale financial assets E2(c) 11,110 5,828
Held-to-maturity investments 1,210 -
Derivative financial instruments B2 308 712
Plant and equipment A4(b) 6,150 4,100
20,078 11,340
Total non-current assets pledged as security 61,078 47,980
Total assets pledged as security 113,804 84,231

VALUE ACCOUNTS Holdings LimitedPwC 122
F7 Deed of cross guaranteeVALUE ACCOUNTS Holdings Limited, VALUE ACCOUNTS Consulting Limited and VALUE ACCOUNTS Development Limited are parties to a deed of cross guarantee under which each company guarantees the debts of the others. By entering into the deed, the wholly-owned entities have been relieved from the requirement to prepare a financial report and directors’ report under Class Order 98/1418 (as amended) issued by the Australian Securities and Investments Commission.
(a) Consolidated income statement, statement of comprehensive income and summary of movements in consolidated retained earnings
The above companies represent a ‘closed group’ for the purposes of the Class Order, and as there are no other parties to the deed of cross guarantee that are controlled by VALUE ACCOUNTS Holdings Limited, they also represent the ‘extended closed group’.
Set out below is a consolidated income statement, a consolidated statement of comprehensive income and a summary of movements in consolidated retained earnings for the year ended 30 June 2013 of the closed group consisting of VALUE ACCOUNTS Holdings Limited, VALUE ACCOUNTS Consulting Limited and VALUE ACCOUNTS Development Limited.
2013 $’000
2012 $’000
Consolidated income statement
Revenue from continuing operations 121,706 98,471
Other income 4,385 1,190
Cost of sales of goods (22,132) (28,337)
Cost of providing services (30,494) (20,823)
Other expenses from ordinary activities (32,029) (19,722)
Finance costs (4,200) (3,547)
Share of net profits of associates and joint venture entity accounted for using the equity method 450 370
Profit before income tax 37,686 27,601
Income tax expense (9,778) (6,808)
Profit for the period 27,908 20,793
Consolidated statement of comprehensive income
Profit for the period 27,908 20,793
Other comprehensive income
Items that may be reclassified to profit or loss
Available for sale financial assets 234 (830)
Income tax relating to these items (70) 249
Items that will not be reclassified to profit or loss
Gain on revaluation of land and buildings 3,532 3,662
Actuarial (losses)/gains on retirement benefit obligation 30 (576)
Share of revaluation of land and buildings of associates and joint ventures 300 100
Income tax relating to these items (1,159) (956)
Other comprehensive income for the period, net of tax 2,867 1,649
Total comprehensive income for the period 30,775 22,443

VALUE ACCOUNTS Holdings LimitedPwC 123
2013 $’000
2012 $’000
Summary of movements in consolidated retained earnings
Retained earnings at the beginning of the financial year 16,663 7,068
Profit for the period 27,908 20,793
Transfer from share capital on buy-back of preference shares 143 -
Actuarial (losses)/gains on retirement benefit obligation, net of tax 21 (403)
Depreciation transfer, net of tax 224 234
Dividends provided for or paid (22,837) (11,029)
Retained earnings at the end of the financial year 22,122 16,663
(b) Consolidated balance sheet
Set out below is a consolidated balance sheet as at 30 June 2013 of the closed group consisting of VALUE ACCOUNTS Holdings Limited, VALUE ACCOUNTS Consulting Limited and VALUE ACCOUNTS Development Limited.
2013 $’000
2012 $’000
Current assets
Cash and cash equivalents 46,175 18,552
Trade and other receivables 8,521 5,483
Inventories 9,969 7,502
Financial assets at fair value through profit or loss 5,085 4,912
Derivative financial instruments 490 288
Total current assets 70,239 36,737
Non-current assets
Receivables 1,114 621
Investments accounted for using the equity method 3,775 3,275
Available-for-sale financial assets 11,110 5,828
Held-to-maturity investments 1,210 -
Other financial assets 12,890 11,340
Property, plant and equipment 69,443 65,036
Investment properties 13,300 10,050
Derivative financial instruments 139 320
Deferred tax assets 3,198 2,104
Intangible assets 11,048 9,425
Total non-current assets 127,226 107,999
Total assets 197,466 144,736
Current liabilities
Trade and other payables 9,910 7,985
Borrowings 4,041 3,850
Derivative financial instruments 275 279
Current tax liabilities 2,395 2,370
Provisions 1,423 770
Total current liabilities 16,430 13,386

VALUE ACCOUNTS Holdings LimitedPwC 124
2013 $’000
2012 $’000
Non-current liabilities
Borrowings 65,728 40,525
Deferred tax liabilities 5,731 2,987
Provisions 1,549 1,022
Retirement benefit obligations 3,225 1,532
Total non-current liabilities 76,233 46,066
Total liabilities 92,663 59,452
Net assets 104,802 85,284
Equity
Contributed equity 75,063 63,426
Reserves 7,617 5,195
Retained earnings 22,122 16,663
Total equity 104,802 85,284
F8 Parent entity financial information (a) Summary financial information
The individual financial statements for the parent entity show the following aggregate amounts:
2013 $’000
2012 $’000
Balance sheet
Current assets 11,726 5,651
Total assets 32,359 21,547
Current liabilities 3,389 2,842
Total liabilities 9,124 6,006
Shareholders’ equity
Issued capital 19,212 13,870
Reserves
Revaluation surplus – property, plant and equipment 503 256
Available-for-sale financial assets 203 151
Cash flow hedges (119) (124)
Share-based payments 158 62
Retained earnings 3,278 1,326
23,235 15,541
Profit or loss for the period 3,099 1,663
Total comprehensive income 3,417 1,828
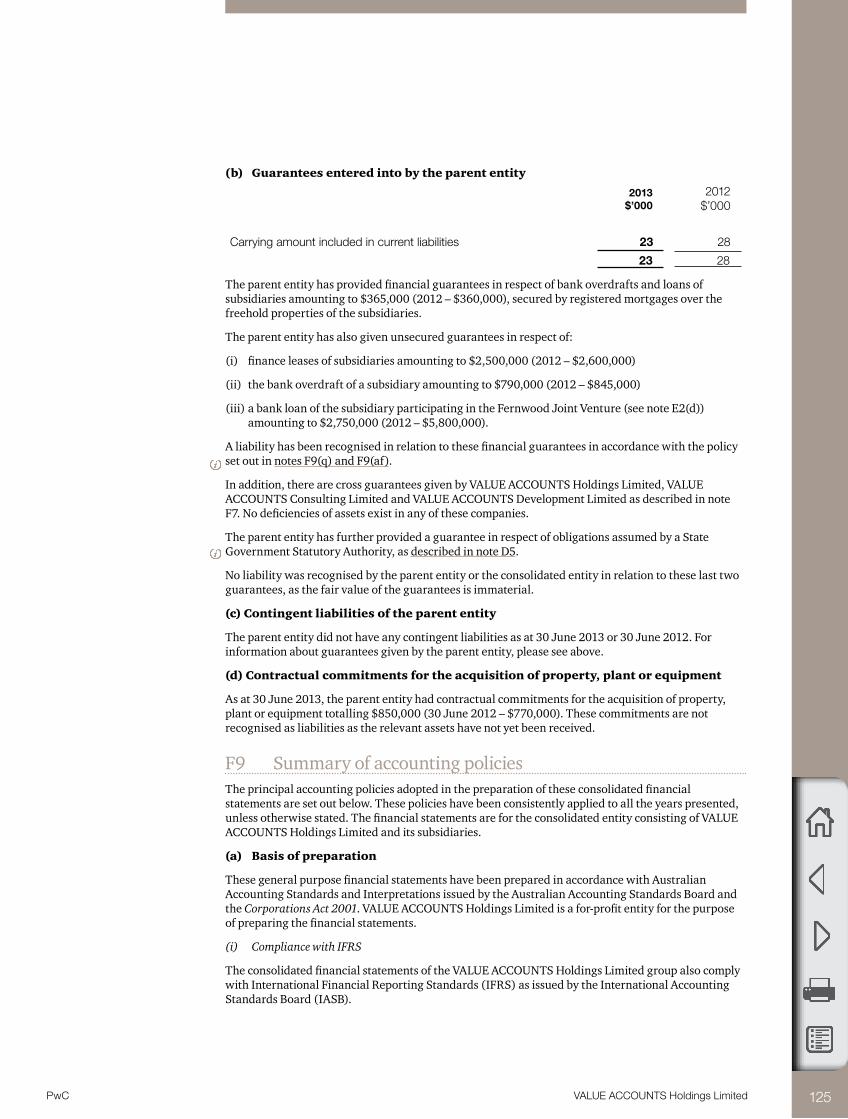
VALUE ACCOUNTS Holdings LimitedPwC 125
(b) Guarantees entered into by the parent entity
2013 $’000
2012 $’000
Carrying amount included in current liabilities 23 28
23 28
The parent entity has provided financial guarantees in respect of bank overdrafts and loans of subsidiaries amounting to $365,000 (2012 – $360,000), secured by registered mortgages over the freehold properties of the subsidiaries.
The parent entity has also given unsecured guarantees in respect of:
(i) finance leases of subsidiaries amounting to $2,500,000 (2012 – $2,600,000)
(ii) the bank overdraft of a subsidiary amounting to $790,000 (2012 – $845,000)
(iii) a bank loan of the subsidiary participating in the Fernwood Joint Venture (see note E2(d)) amounting to $2,750,000 (2012 – $5,800,000).
A liability has been recognised in relation to these financial guarantees in accordance with the policy set out in notes F9(q) and F9(af).
In addition, there are cross guarantees given by VALUE ACCOUNTS Holdings Limited, VALUE ACCOUNTS Consulting Limited and VALUE ACCOUNTS Development Limited as described in note F7. No deficiencies of assets exist in any of these companies.
The parent entity has further provided a guarantee in respect of obligations assumed by a State Government Statutory Authority, as described in note D5.
No liability was recognised by the parent entity or the consolidated entity in relation to these last two guarantees, as the fair value of the guarantees is immaterial.
(c) Contingent liabilities of the parent entity
The parent entity did not have any contingent liabilities as at 30 June 2013 or 30 June 2012. For information about guarantees given by the parent entity, please see above.
(d) Contractual commitments for the acquisition of property, plant or equipment
As at 30 June 2013, the parent entity had contractual commitments for the acquisition of property, plant or equipment totalling $850,000 (30 June 2012 – $770,000). These commitments are not recognised as liabilities as the relevant assets have not yet been received.
F9 Summary of accounting policies The principal accounting policies adopted in the preparation of these consolidated financial statements are set out below. These policies have been consistently applied to all the years presented, unless otherwise stated. The financial statements are for the consolidated entity consisting of VALUE ACCOUNTS Holdings Limited and its subsidiaries.
(a) Basis of preparation
These general purpose financial statements have been prepared in accordance with Australian Accounting Standards and Interpretations issued by the Australian Accounting Standards Board and the Corporations Act 2001. VALUE ACCOUNTS Holdings Limited is a for-profit entity for the purpose of preparing the financial statements.
(i) Compliance with IFRS
The consolidated financial statements of the VALUE ACCOUNTS Holdings Limited group also comply with International Financial Reporting Standards (IFRS) as issued by the International Accounting Standards Board (IASB).

VALUE ACCOUNTS Holdings LimitedPwC 126
(ii) Early adoption of standards
The group has elected to apply the following pronouncement to the annual reporting period beginning 1 July 2012:
• AASB2012-5Amendments to Australian Accounting Standards arising from Annual Improvements 2009—2011 Cycle
This includes applying the revised pronouncement to the comparatives in accordance with AASB 108 Accounting Policies, Changes in Accounting Estimates and Errors. None of the items in the financial statements had to be restated as a result of applying this standard. However, the amendments removed the requirement to provide additional comparative information in all relevant notes where line items in the financial statements are affected as a result of a retrospective restatement (eg because of an error). Following the amendments, it is now sufficient if an entity includes a third balance sheet and explains the impact of the restatement on individual line items in the note that sets out the reasons for the restatement. VALUE ACCOUNTS Holdings Limited has done so in note B1(b) and is not disclosing additional comparatives in each of the notes that are affected by the restatement for the error.
(iii) Historical cost convention
These financial statements have been prepared under the historical cost convention, as modified by the revaluation of available-for-sale financial assets, financial assets and liabilities (including derivative instruments) at fair value through profit or loss, certain classes of property, plant and equipment and investment property.
(b) Principles of consolidation
(i) Subsidiaries
The consolidated financial statements incorporate the assets and liabilities of all subsidiaries of VALUE ACCOUNTS Holdings Limited (‘company’ or ‘parent entity’) as at 30 June 2013 and the results of all subsidiaries for the year then ended. VALUE ACCOUNTS Holdings Limited and its subsidiaries together are referred to in this financial report as the group or the consolidated entity.
Subsidiaries are all entities (including special purpose entities) over which the group has the power to govern the financial and operating policies, generally accompanying a shareholding of more than one-half of the voting rights. The existence and effect of potential voting rights that are currently exercisable or convertible are considered when assessing whether the group controls another entity.
Subsidiaries are fully consolidated from the date on which control is transferred to the group. They are de-consolidated from the date that control ceases.
The acquisition method of accounting is used to account for business combinations by the group (refer to note F9(i)).

VALUE ACCOUNTS Holdings LimitedPwC 127
Intercompany transactions, balances and unrealised gains on transactions between group companies are eliminated. Unrealised losses are also eliminated unless the transaction provides evidence of the impairment of the asset transferred. Accounting policies of subsidiaries have been changed where necessary to ensure consistency with the policies adopted by the group.
Non-controlling interests in the results and equity of subsidiaries are shown separately in the consolidated income statement, statement of comprehensive income, statement of changes in equity and balance sheet respectively.
(ii) Employee Share Trust
The group has formed a trust to administer the group’s employee share schemes. This trust is consolidated, as the substance of the relationship is that the trust is controlled by the group.
Shares held by the VALUE ACCOUNTS Employee Share Trust are disclosed as treasury shares and deducted from contributed equity.
(iii) Associates
Associates are all entities over which the group has significant influence but not control or joint control, generally accompanying a shareholding of between 20% and 50% of the voting rights. Investments in associates are accounted for using the equity method of accounting, after initially being recognised at cost. The group’s investment in associates includes goodwill identified on acquisition (refer to note E2(d)).
The group’s share of its associates’ post-acquisition profits or losses is recognised in profit or loss, and its share of post-acquisition other comprehensive income is recognised in other comprehensive income. The cumulative post-acquisition movements are adjusted against the carrying amount of the investment. Dividends receivable from associates are recognised as reduction in the carrying amount of the investment.
When the group’s share of losses in an associate equals or exceeds its interest in the associate, including any other unsecured long-term receivables, the group does not recognise further losses, unless it has incurred obligations or made payments on behalf of the associate.
Unrealised gains on transactions between the group and its associates are eliminated to the extent of the group’s interest in the associates. Unrealised losses are also eliminated unless the transaction provides evidence of an impairment of the asset transferred. Accounting policies of associates have been changed where necessary to ensure consistency with the policies adopted by the group.
(iv) Joint ventures
Jointly controlled assets
The proportionate interests in the assets, liabilities and expenses of a joint venture activity have been incorporated in the financial statements under the appropriate headings. Details of the joint venture are set out in note E2(d).
Joint venture entities
The interest in a joint venture entity is accounted for using the equity method after initially being recognised at cost. Under the equity method, the share of the profits or losses of the joint venture entity is recognised in profit or loss, and the share of post-acquisition movements in other comprehensive income is recognised in other comprehensive income. Details relating to the joint venture entity are set out in note E2(d).
Profits or losses on transactions establishing the joint venture entity and transactions with the joint venture are eliminated to the extent of the group’s ownership interest until such time as they are realised by the joint venture entity on consumption or sale. However, a loss on the transaction is recognised immediately if the loss provides evidence of a reduction in the net realisable value of current assets, or an impairment loss.

VALUE ACCOUNTS Holdings LimitedPwC 128
(v) Changes in ownership interests
The group treats transactions with non-controlling interests that do not result in a loss of control as transactions with equity owners of the group. A change in ownership interest results in an adjustment between the carrying amounts of the controlling and non-controlling interests to reflect their relative interests in the subsidiary. Any difference between the amount of the adjustment to non-controlling interests and any consideration paid or received is recognised in a separate reserve within equity attributable to owners of VALUE ACCOUNTS Holdings Limited.
When the group ceases to have control, joint control or significant influence, any retained interest in the entity is remeasured to its fair value with the change in carrying amount recognised in profit or loss. This fair value becomes the initial carrying amount for the purposes of subsequently accounting for the retained interest as an associate, jointly controlled entity or financial asset. In addition, any amounts previously recognised in other comprehensive income in respect of that entity are accounted for as if the group had directly disposed of the related assets or liabilities. This may mean that amounts previously recognised in other comprehensive income are reclassified to profit or loss.
If the ownership interest in a jointly-controlled entity or an associate is reduced but joint control or significant influence is retained, only a proportionate share of the amounts previously recognised in other comprehensive income are reclassified to profit or loss where appropriate.
(c) Segment reporting
Operating segments are reported in a manner consistent with the internal reporting provided to the chief operating decision maker.
The Board of VALUE ACCOUNTS Holdings Limited has appointed a strategic steering committee, which assesses the financial performance and position of the group, and makes strategic decisions. The steering committee, which has been identified as being the chief operating decision maker, consists of the chief executive officer, the chief financial officer and the manager for corporate planning.
(d) Foreign currency translation
(i) Functional and presentation currency
Items included in the financial statements of each of the group’s entities are measured using the currency of the primary economic environment in which the entity operates (‘the functional currency’). The consolidated financial statements are presented in Australian dollars, which is VALUE ACCOUNTS Holdings Limited’s functional and presentation currency.
(ii) Transactions and balances
Foreign currency transactions are translated into the functional currency using the exchange rates prevailing at the dates of the transactions. Foreign exchange gains and losses resulting from the settlement of such transactions and from the translation at year end exchange rates of monetary assets and liabilities denominated in foreign currencies are recognised in profit or loss, except when they are deferred in equity as qualifying cash flow hedges and qualifying net investment hedges or are attributable to part of the net investment in a foreign operation.
Foreign exchange gains and losses that relate to borrowings are presented in the income statement, within finance costs. All other foreign exchange gains and losses are presented in the income statement on a net basis within other income or other expenses.
Non-monetary items that are measured at fair value in a foreign currency are translated using the exchange rates at the date when the fair value was determined. Translation differences on assets and liabilities carried at fair value are reported as part of the fair value gain or loss. For example, translation differences on non-monetary assets and liabilities such as equities held at fair value through profit or loss are recognised in profit or loss as part of the fair value gain or loss and translation differences on non-monetary assets such as equities classified as available-for-sale financial assets are recognised in other comprehensive income.

VALUE ACCOUNTS Holdings LimitedPwC 129
(iii) Group companies
The results and financial position of foreign operations (none of which has the currency of a hyperinflationary economy) that have a functional currency different from the presentation currency are translated into the presentation currency as follows:
• assetsandliabilitiesforeachbalancesheetpresentedaretranslatedattheclosingrateatthedate of that balance sheet
• incomeandexpensesforeachincomestatementandstatementofcomprehensiveincomeare translated at average exchange rates (unless this is not a reasonable approximation of the cumulative effect of the rates prevailing on the transaction dates, in which case income and expenses are translated at the dates of the transactions), and
• allresultingexchangedifferencesarerecognisedinothercomprehensiveincome.
On consolidation, exchange differences arising from the translation of any net investment in foreign entities, and of borrowings and other financial instruments designated as hedges of such investments, are recognised in other comprehensive income. When a foreign operation is sold or any borrowings forming part of the net investment are repaid, the associated exchange differences are reclassified to profit or loss, as part of the gain or loss on sale.
Goodwill and fair value adjustments arising on the acquisition of a foreign operation are treated as assets and liabilities of the foreign operation and translated at the closing rate.
(e) Revenue recognition
Revenue is measured at the fair value of the consideration received or receivable. Amounts disclosed as revenue are net of returns, trade allowances, rebates and amounts collected on behalf of third parties.
The group recognises revenue when the amount of revenue can be reliably measured, it is probable that future economic benefits will flow to the entity and specific criteria have been met for each of the group’s activities as described below. The group bases its estimates on historical results, taking into consideration the type of customer, the type of transaction and the specifics of each arrangement.
The specific accounting policies for the group’s main types of revenue are explained in note A2(a). Revenue for other business activities is recognised on the following basis:
(i) Interest income
Interest income is recognised using the effective interest method. When a receivable is impaired, the group reduces the carrying amount to its recoverable amount, being the estimated future cash flow discounted at the original effective interest rate of the instrument, and continues unwinding the discount as interest income. Interest income on impaired loans is recognised using the original effective interest rate.
(ii) Dividends
Dividends are recognised as revenue when the right to receive payment is established. This applies even if they are paid out of pre-acquisition profits. However, the investment may need to be tested for impairment as a consequence, refer note F9(o).
(f) Government grants
Grants from the government are recognised at their fair value where there is a reasonable assurance that the grant will be received and the group will comply with all attached conditions.
Government grants relating to costs are deferred and recognised in the profit or loss over the period necessary to match them with the costs that they are intended to compensate.
Government grants relating to the purchase of property, plant and equipment are included in non-current liabilities as deferred income and are credited to profit or loss on a straight-line basis over the expected lives of the related assets.

VALUE ACCOUNTS Holdings LimitedPwC 130
(g) Income tax
The income tax expense or revenue for the period is the tax payable on the current period’s taxable income based on the applicable income tax rate for each jurisdiction adjusted by changes in deferred tax assets and liabilities attributable to temporary differences and to unused tax losses.
The current income tax charge is calculated on the basis of the tax laws enacted or substantively enacted at the end of the reporting period in the countries where the company’s subsidiaries and associates operate and generate taxable income. Management periodically evaluates positions taken in tax returns with respect to situations in which applicable tax regulation is subject to interpretation. It establishes provisions where appropriate on the basis of amounts expected to be paid to the tax authorities.
Deferred income tax is provided in full, using the liability method, on temporary differences arising between the tax bases of assets and liabilities and their carrying amounts in the consolidated financial statements. However, deferred tax liabilities are not recognised if they arise from the initial recognition of goodwill. Deferred income tax is also not accounted for if it arises from initial recognition of an asset or liability in a transaction other than a business combination that at the time of the transaction affects neither accounting nor taxable profit or loss. Deferred income tax is determined using tax rates (and laws) that have been enacted or substantially enacted by the end of the reporting period and are expected to apply when the related deferred income tax asset is realised or the deferred income tax liability is settled.
The deferred tax liabilities in relation to investment property that is measured at fair value is determined assuming the property will be recovered entirely through sale.
Deferred tax assets are recognised for deductible temporary differences and unused tax losses only if it is probable that future taxable amounts will be available to utilise those temporary differences and losses.
Deferred tax liabilities and assets are not recognised for temporary differences between the carrying amount and tax bases of investments in foreign operations where the company is able to control the timing of the reversal of the temporary differences and it is probable that the differences will not reverse in the foreseeable future.
Deferred tax assets and liabilities are offset when there is a legally enforceable right to offset current tax assets and liabilities and when the deferred tax balances relate to the same taxation authority. Current tax assets and tax liabilities are offset where the entity has a legally enforceable right to offset and intends either to settle on a net basis, or to realise the asset and settle the liability simultaneously.
VALUE ACCOUNTS Holdings Limited and its wholly-owned Australian controlled entities have implemented the tax consolidation legislation. As a consequence, these entities are taxed as a single entity and the deferred tax assets and liabilities of these entities are set off in the consolidated financial statements.
Current and deferred tax is recognised in profit or loss, except to the extent that it relates to items recognised in other comprehensive income or directly in equity. In this case, the tax is also recognised in other comprehensive income or directly in equity, respectively.
(i) Investment allowances and similar tax incentives
Companies within the group may be entitled to claim special tax deductions for investments in qualifying assets or in relation to qualifying expenditure (eg the Research and Development Tax Incentive regime in Australia or other investment allowances). The group accounts for such allowances as tax credits, which means that the allowance reduces income tax payable and current tax expense. A deferred tax asset is recognised for unclaimed tax credits that are carried forward as deferred tax assets.
(h) Leases
Leases of property, plant and equipment where the group, as lessee, has substantially all the risks and rewards of ownership are classified as finance leases (note A3(c)). Finance leases are capitalised at the lease’s inception at the fair value of the leased property or, if lower, the present value of the minimum lease payments. The corresponding rental obligations, net of finance charges, are included in other short-term and long-term payables. Each lease payment is allocated between the liability and finance cost. The finance cost is charged to the profit or loss over the lease period so as to produce a constant periodic rate of interest on the remaining balance of the liability for each period. The property, plant

VALUE ACCOUNTS Holdings LimitedPwC 131
and equipment acquired under finance leases is depreciated over the asset’s useful life or over the shorter of the asset’s useful life and the lease term if there is no reasonable certainty that the group will obtain ownership at the end of the lease term.
Leases in which a significant portion of the risks and rewards of ownership are not transferred to the group as lessee are classified as operating leases (note D3). Payments made under operating leases (net of any incentives received from the lessor) are charged to profit or loss on a straight-line basis over the period of the lease.
Lease income from operating leases where the group is a lessor is recognised in income on a straight-line basis over the lease term (note E3(a)). The respective leased assets are included in the balance sheet based on their nature.
(i) Business combinations
The acquisition method of accounting is used to account for all business combinations, regardless of whether equity instruments or other assets are acquired. The consideration transferred for the acquisition of a subsidiary comprises the fair values of the assets transferred, the liabilities incurred and the equity interests issued by the group. The consideration transferred also includes the fair value of any asset or liability resulting from a contingent consideration arrangement and the fair value of any pre-existing equity interest in the subsidiary. Acquisition-related costs are expensed as incurred. Identifiable assets acquired and liabilities and contingent liabilities assumed in a business combination are, with limited exceptions, measured initially at their fair values at the acquisition date. On an acquisition-by-acquisition basis, the group recognises any non-controlling interest in the acquiree either at fair value or at the non-controlling interest’s proportionate share of the acquiree’s net identifiable assets.
The excess of the consideration transferred and the amount of any non-controlling interest in the acquiree over the fair value of the net identifiable assets acquired is recorded as goodwill. If those amounts are less than the fair value of the net identifiable assets of the subsidiary acquired and the measurement of all amounts has been reviewed, the difference is recognised directly in profit or loss as a bargain purchase.
Where settlement of any part of cash consideration is deferred, the amounts payable in the future are discounted to their present value as at the date of exchange. The discount rate used is the entity’s incremental borrowing rate, being the rate at which a similar borrowing could be obtained from an independent financier under comparable terms and conditions.
Contingent consideration is classified either as equity or a financial liability. Amounts classified as a financial liability are subsequently remeasured to fair value with changes in fair value recognised in profit or loss.
(j) Impairment of assets
Goodwill and intangible assets that have an indefinite useful life are not subject to amortisation and are tested annually for impairment, or more frequently if events or changes in circumstances indicate that they might be impaired. Other assets are tested for impairment whenever events or changes in circumstances indicate that the carrying amount may not be recoverable. An impairment loss is recognised for the amount by which the asset’s carrying amount exceeds its recoverable amount. The recoverable amount is the higher of an asset’s fair value less costs to sell and value in use. For the purposes of assessing impairment, assets are grouped at the lowest levels for which there are separately identifiable cash inflows which are largely independent of the cash inflows from other assets or groups of assets (cash-generating units). Non-financial assets other than goodwill that suffered an impairment are reviewed for possible reversal of the impairment at the end of each reporting period.
(k) Cash and cash equivalents
For the purpose of presentation in the statement of cash flows, cash and cash equivalents includes cash on hand, deposits held at call with financial institutions, other short-term, highly liquid investments with original maturities of three months or less that are readily convertible to known amounts of cash and which are subject to an insignificant risk of changes in value, and bank overdrafts. Bank overdrafts are shown within borrowings in current liabilities in the balance sheet.

VALUE ACCOUNTS Holdings LimitedPwC 132
(l) Trade receivables
Trade receivables are recognised initially at fair value and subsequently measured at amortised cost using the effective interest method, less provision for impairment. Trade receivables are generally due for settlement within 30 days. They are presented as current assets unless collection is not expected for more than 12 months after the reporting date.
Collectability of trade receivables is reviewed on an ongoing basis. Debts which are known to be uncollectible are written off by reducing the carrying amount directly. An allowance account (provision for impairment of trade receivables) is used when there is objective evidence that the group will not be able to collect all amounts due according to the original terms of the receivables. Significant financial difficulties of the debtor, probability that the debtor will enter bankruptcy or financial reorganisation, and default or delinquency in payments (more than 30 days overdue) are considered indicators that the trade receivable is impaired. The amount of the impairment allowance is the difference between the asset’s carrying amount and the present value of estimated future cash flows, discounted at the original effective interest rate. Cash flows relating to short-term receivables are not discounted if the effect of discounting is immaterial.
The amount of the impairment loss is recognised in profit or loss within other expenses. When a trade receivable for which an impairment allowance had been recognised becomes uncollectible in a subsequent period, it is written off against the allowance account. Subsequent recoveries of amounts previously written off are credited against other expenses in profit or loss.
(m) Inventories
(i) Raw materials and stores, work in progress and finished goods
Raw materials and stores, work in progress and finished goods are stated at the lower of cost and net realisable value. Cost comprises direct materials, direct labour and an appropriate proportion of variable and fixed overhead expenditure, the latter being allocated on the basis of normal operating capacity. Cost includes the reclassification from equity of any gains or losses on qualifying cash flow hedges relating to purchases of raw material but excludes borrowing costs. Costs are assigned to individual items of inventory on the basis of weighted average costs. Costs of purchased inventory are determined after deducting rebates and discounts. Net realisable value is the estimated selling price in the ordinary course of business less the estimated costs of completion and the estimated costs necessary to make the sale.
(ii) Land held for resale/capitalisation of borrowing costs
Land held for resale is stated at the lower of cost and net realisable value. Cost is assigned by specific identification and includes the cost of acquisition, and development and borrowing costs during development. When development is completed borrowing costs and other holding charges are expensed as incurred.
Borrowing costs included in the cost of land held for resale are those costs that would have been avoided if the expenditure on the acquisition and development of the land had not been made. Borrowing costs incurred while active development is interrupted for extended periods are recognised as expenses.
(n) Non-current assets (or disposal groups) held for sale and discontinued operations
Non-current assets (or disposal groups) are classified as held for sale if their carrying amount will be recovered principally through a sale transaction rather than through continuing use and a sale is considered highly probable. They are measured at the lower of their carrying amount and fair value less costs to sell, except for assets such as deferred tax assets, assets arising from employee benefits, financial assets and investment property that are carried at fair value and contractual rights under insurance contracts, which are specifically exempt from this requirement.
An impairment loss is recognised for any initial or subsequent write-down of the asset (or disposal group) to fair value less costs to sell. A gain is recognised for any subsequent increases in fair value less costs to sell of an asset (or disposal group), but not in excess of any cumulative impairment loss previously recognised. A gain or loss not previously recognised by the date of the sale of the non-current asset (or disposal group) is recognised at the date of derecognition.
Non-current assets (including those that are part of a disposal group) are not depreciated or amortised while they are classified as held for sale. Interest and other expenses attributable to the liabilities of a disposal group classified as held for sale continue to be recognised.
VALUE ACCOUNTS Holdings LimitedPwC 133
Non-current assets classified as held for sale and the assets of a disposal group classified as held for sale are presented separately from the other assets in the balance sheet. The liabilities of a disposal group classified as held for sale are presented separately from other liabilities in the balance sheet.
A discontinued operation is a component of the entity that has been disposed of or is classified as held for sale and that represents a separate major line of business or geographical area of operations, is part of a single co-ordinated plan to dispose of such a line of business or area of operations, or is a subsidiary acquired exclusively with a view to resale. The results of discontinued operations are presented separately in the income statement.
(o) Investments and other financial assets
Classification
The group classifies its financial assets in the following categories: financial assets at fair value through profit or loss, loans and receivables, held-to-maturity investments and available-for-sale financial assets. The classification depends on the purpose for which the investments were acquired. Management determines the classification of its investments at initial recognition and, in the case of assets classified as held-to-maturity, re-evaluates this designation at the end of each reporting date.
Held-to-maturity investments are non-derivative financial assets quoted in an active market with fixed or determinable payments and fixed maturities that the group’s management has the positive intention and ability to hold to maturity. If the group were to sell other than an insignificant amount of held-to-maturity financial assets, the whole category would be tainted and reclassified as available-for-sale. Held-to-maturity financial assets are included in non-current assets, except for those with maturities less than 12 months from the end of the reporting period, which would be classified as current assets.
Reclassifications
The group may choose to reclassify a non-derivative trading financial asset out of the held for trading category if the financial asset is no longer held for the purpose of selling it in the near term. Financial assets other than loans and receivables are permitted to be reclassified out of the held for trading category only in rare circumstances arising from a single event that is unusual and highly unlikely to recur in the near term. In addition, the group may choose to reclassify financial assets that would meet the definition of loans and receivables out of the held for trading or available-for-sale categories if the group has the intention and ability to hold these financial assets for the foreseeable future or until maturity at the date of reclassification
Reclassifications are made at fair value as of the reclassification date. Fair value becomes the new cost or amortised cost as applicable, and no reversals of fair value gains or losses recorded before reclassification date are subsequently made. Effective interest rates for financial assets reclassified to loans and receivables and held-to-maturity categories are determined at the reclassification date. Further increases in estimates of cash flows adjust effective interest rates prospectively.
Recognition and derecognition
Regular way purchases and sales of financial assets are recognised on trade-date, the date on which the group commits to purchase or sell the asset. Financial assets are derecognised when the rights to receive cash flows from the financial assets have expired or have been transferred and the group has transferred substantially all the risks and rewards of ownership.
When securities classified as available-for-sale are sold, the accumulated fair value adjustments recognised in other comprehensive income are reclassified to profit or loss as gains and losses from investment securities.
Measurement
At initial recognition, the group measures a financial asset at its fair value plus, in the case of a financial asset not at fair value through profit or loss, transaction costs that are directly attributable to the acquisition of the financial asset. Transaction costs of financial assets carried at fair value through profit or loss are expensed in profit or loss.
Loans and receivables and held-to-maturity investments are subsequently carried at amortised cost using the effective interest method.

VALUE ACCOUNTS Holdings LimitedPwC 134
Available-for-sale financial assets and financial assets at fair value through profit or loss are subsequently carried at fair value. Gains or losses arising from changes in the fair value of the ‘financial assets at fair value through profit or loss’ category are presented in profit or loss within other income or other expenses in the period in which they arise. Dividend income from financial assets at fair value through profit or loss is recognised in profit or loss as part of revenue from continuing operations when the group’s right to receive payments is established. Interest income from these financial assets is included in the net gains/(losses).
Changes in the fair value of monetary securities denominated in a foreign currency and classified as available-for-sale are analysed between translation differences resulting from changes in amortised cost of the security and other changes in the carrying amount of the security. The translation differences related to changes in the amortised cost are recognised in profit or loss, and other changes in carrying amount are recognised in other comprehensive income. Changes in the fair value of other monetary and non-monetary securities classified as available-for-sale are recognised in other comprehensive income.
Details on how the fair value of financial instruments is determined are disclosed in note A3(e)).
Impairment
The group assesses at the end of each reporting period whether there is objective evidence that a financial asset or group of financial assets is impaired. A financial asset or a group of financial assets is impaired and impairment losses are incurred only if there is objective evidence of impairment as a result of one or more events that occurred after the initial recognition of the asset (a ‘loss event’) and that loss event (or events) has an impact on the estimated future cash flows of the financial asset or group of financial assets that can be reliably estimated. In the case of equity investments classified as available-for-sale, a significant or prolonged decline in the fair value of the security below its cost is considered an indicator that the assets are impaired.
(i) Assets carried at amortised cost
For loans and receivables, the amount of the loss is measured as the difference between the asset’s carrying amount and the present value of estimated future cash flows (excluding future credit losses that have not been incurred) discounted at the financial asset’s original effective interest rate. The carrying amount of the asset is reduced and the amount of the loss is recognised in profit or loss. If a loan or held-to-maturity investment has a variable interest rate, the discount rate for measuring any impairment loss is the current effective interest rate determined under the contract. As a practical expedient, the group may measure impairment on the basis of an instrument’s fair value using an observable market price.
If, in a subsequent period, the amount of the impairment loss decreases and the decrease can be related objectively to an event occurring after the impairment was recognised (such as an improvement in the debtor’s credit rating), the reversal of the previously recognised impairment loss is recognised in profit or loss.
Impairment testing of trade receivables is described in note F9(l).
Assets classified as available-for-sale
If there is objective evidence of impairment for available-for-sale financial assets, the cumulative loss – measured as the difference between the acquisition cost and the current fair value, less any impairment loss on that financial asset previously recognised in profit or loss – is removed from equity and recognised in profit or loss.
Impairment losses on equity instruments that were recognised in profit or loss are not reversed through profit or loss in a subsequent period.
If the fair value of a debt instrument classified as available-for-sale increases in a subsequent period and the increase can be objectively related to an event occurring after the impairment loss was recognised in profit or loss, the impairment loss is reversed through profit or loss.

VALUE ACCOUNTS Holdings LimitedPwC 135
(p) Derivatives and hedging activities
Derivatives are initially recognised at fair value on the date a derivative contract is entered into and are subsequently remeasured to their fair value at the end of each reporting period. The accounting for subsequent changes in fair value depends on whether the derivative is designated as a hedging instrument, and if so, the nature of the item being hedged. The group designates certain derivatives as either:
• hedgesofthefairvalueofrecognisedassetsorliabilitiesorafirmcommitment(fairvaluehedges)
• hedgesofaparticularriskassociatedwiththecashflowsofrecognisedassetsandliabilitiesandhighly probable forecast transactions (cash flow hedges), or
• hedgesofanetinvestmentinaforeignoperation(netinvestmenthedges).
The group documents at the inception of the hedging transaction the relationship between hedging instruments and hedged items, as well as its risk management objective and strategy for undertaking various hedge transactions. The group also documents its assessment, both at hedge inception and on an ongoing basis, of whether the derivatives that are used in hedging transactions have been and will continue to be highly effective in offsetting changes in fair values or cash flows of hedged items.
The fair values of various derivative financial instruments used for hedging purposes are disclosed in note B2. Movements in the hedging reserve in shareholders’ equity are shown in note E5. The full fair value of a hedging derivative is classified as a non-current asset or liability when the remaining maturity of the hedged item is more than 12 months; it is classified as a current asset or liability when the remaining maturity of the hedged item is less than 12 months. Trading derivatives are classified as a current asset or liability.
(i) Fair value hedge
Changes in the fair value of derivatives that are designated and qualify as fair value hedges are recorded in profit or loss, together with any changes in the fair value of the hedged asset or liability that are attributable to the hedged risk. The gain or loss relating to the effective portion of interest rate swaps hedging fixed rate borrowings is recognised in profit or loss within finance costs, together with changes in the fair value of the hedged fixed rate borrowings attributable to interest rate risk. The gain or loss relating to the ineffective portion is recognised in profit or loss within other income or other expenses.
If the hedge no longer meets the criteria for hedge accounting, the adjustment to the carrying amount of a hedged item for which the effective interest method is used is amortised to profit or loss over the period to maturity using a recalculated effective interest rate.
(ii) Cash flow hedge
The effective portion of changes in the fair value of derivatives that are designated and qualify as cash flow hedges is recognised in other comprehensive income and accumulated in reserves in equity. The gain or loss relating to the ineffective portion is recognised immediately in profit or loss within other income or other expense.
Amounts accumulated in equity are reclassified to profit or loss in the periods when the hedged item affects profit or loss (for instance when the forecast sale that is hedged takes place). The gain or loss relating to the effective portion of interest rate swaps hedging variable rate borrowings is recognised in profit or loss within ‘finance costs’. The gain or loss relating to the effective portion of forward foreign exchange contracts hedging export sales is recognised in profit or loss within ‘sales’. However, when the forecast transaction that is hedged results in the recognition of a non-financial asset (for example, inventory or fixed assets) the gains and losses previously deferred in equity are reclassified from equity and included in the initial measurement of the cost of the asset. The deferred amounts are ultimately recognised in profit or loss as cost of goods sold in the case of inventory, or as depreciation or impairment in the case of fixed assets.
When a hedging instrument expires or is sold or terminated, or when a hedge no longer meets the criteria for hedge accounting, any cumulative gain or loss existing in equity at that time remains in equity and is recognised when the forecast transaction is ultimately recognised in profit or loss. When a forecast transaction is no longer expected to occur, the cumulative gain or loss that was reported in equity is immediately reclassified to profit or loss.

VALUE ACCOUNTS Holdings LimitedPwC 136
(iii) Net investment hedges
Hedges of net investments in foreign operations are accounted for similarly to cash flow hedges.
Any gain or loss on the hedging instrument relating to the effective portion of the hedge is recognised in other comprehensive income and accumulated in reserves in equity. The gain or loss relating to the ineffective portion is recognised immediately in profit or loss within other income or other expenses.
Gains and losses accumulated in equity are reclassified to profit or loss when the foreign operation is partially disposed of or sold.
(iv) Derivatives that do not qualify for hedge accounting
Certain derivative instruments do not qualify for hedge accounting. Changes in the fair value of any derivative instrument that does not qualify for hedge accounting are recognised immediately in profit or loss and are included in other income or other expenses.
(q) Financial guarantee contracts
Financial guarantee contracts are recognised as a financial liability at the time the guarantee is issued. The liability is initially measured at fair value and subsequently at the higher of the amount determined in accordance with AASB 137 Provisions, Contingent Liabilities and Contingent Assets and the amount initially recognised less cumulative amortisation, where appropriate.
The fair value of financial guarantees is determined as the present value of the difference in net cash flows between the contractual payments under the debt instrument and the payments that would be required without the guarantee, or the estimated amount that would be payable to a third party for assuming the obligations.
Where guarantees in relation to loans or other payables of associates are provided for no compensation, the fair values are accounted for as contributions and recognised as part of the cost of the investment.
(r) Property, plant and equipment
Land and buildings (except for investment properties – refer to note F9(s)) are shown at fair value, based on periodic, but at least triennial, valuations by external independent valuers, less subsequent depreciation for buildings. Any accumulated depreciation at the date of revaluation is eliminated against the gross carrying amount of the asset and the net amount is restated to the revalued amount of the asset. All other property, plant and equipment is stated at historical cost less depreciation. Historical cost includes expenditure that is directly attributable to the acquisition of the items. Cost may also include transfers from equity of any gains or losses on qualifying cash flow hedges of foreign currency purchases of property, plant and equipment.
Subsequent costs are included in the asset’s carrying amount or recognised as a separate asset, as appropriate, only when it is probable that future economic benefits associated with the item will flow to the group and the cost of the item can be measured reliably. The carrying amount of any component accounted for as a separate asset is derecognised when replaced. All other repairs and maintenance are charged to profit or loss during the reporting period in which they are incurred.
Increases in the carrying amounts arising on revaluation of land and buildings are recognised, net of tax, in other comprehensive income and accumulated in reserves in equity. To the extent that the increase reverses a decrease previously recognised in profit or loss, the increase is first recognised in profit or loss. Decreases that reverse previous increases of the same asset are first recognised in other comprehensive income to the extent of the remaining surplus attributable to the asset; all other decreases are charged to profit or loss. Each year, the difference between depreciation based on the revalued carrying amount of the asset charged to profit or loss and depreciation based on the asset’s original cost, net of tax, is reclassified from the property, plant and equipment revaluation surplus to retained earnings.

VALUE ACCOUNTS Holdings LimitedPwC 137
Land is not depreciated. Depreciation on other assets is calculated using the straight-line method to allocate their cost or revalued amounts, net of their residual values, over their estimated useful lives or, in the case of leasehold improvements and certain leased plant and equipment, the shorter lease term as follows:
• Buildings 25-40years• Machinery 10-15years• Vehicles 3-5years• Furniture,fittingsandequipment 3-8years• Leasedplantandequipment 10-15years
The assets’ residual values and useful lives are reviewed, and adjusted if appropriate, at the end of each reporting period.
An asset’s carrying amount is written down immediately to its recoverable amount if the asset’s carrying amount is greater than its estimated recoverable amount (note F9(j)).
Gains and losses on disposals are determined by comparing proceeds with carrying amount. These are included in profit or loss. When revalued assets are sold, it is group policy to transfer any amounts included in other reserves in respect of those assets to retained earnings.
(s) Investment properties
Investment properties, principally comprising freehold office buildings, are held for long-term rental yields and are not occupied by the group. Investment properties are carried at fair value, which is based on active market prices, adjusted, if necessary, for any difference in the nature, location or condition of the specific asset. If this information is not available, the group uses alternative valuation methods such as recent prices in less active markets or discounted cash flow projections. These valuations are reviewed annually by a member of the Australian Property Institute. Changes in fair values are recorded in the profit or loss as part of other income.
(t) Intangible assets
(i) Goodwill
Goodwill is measured as described in note F9(i). Goodwill on acquisitions of subsidiaries is included in intangible assets. Goodwill is not amortised but it is tested for impairment annually, or more frequently if events or changes in circumstances indicate that it might be impaired, and is carried at cost less accumulated impairment losses. Gains and losses on the disposal of an entity include the carrying amount of goodwill relating to the entity sold.
Goodwill is allocated to cash-generating units for the purpose of impairment testing. The allocation is made to those cash-generating units or groups of cash-generating units that are expected to benefit from the business combination in which the goodwill arose, identified according to operating segments (note A1).
(ii) Trademarks and licences
Trademarks and licences have a finite useful life and are carried at cost less accumulated amortisation and impairment losses. Amortisation is calculated using the straight-line method to allocate the cost of trademarks and licences over their estimated useful lives, which vary from 3 to 5 years.
(iii) IT development and software
Costs incurred in developing products or systems and costs incurred in acquiring software and licenses that will contribute to future period financial benefits through revenue generation and/or cost reduction are capitalised to software and systems. Costs capitalised include external direct costs of materials and service and direct payroll and payroll related costs of employees’ time spent on the project. Amortisation is calculated on a straight-line basis over periods generally ranging from 3 to 5 years.
IT development costs include only those costs directly attributable to the development phase and are only recognised following completion of technical feasibility and where the group has an intention and ability to use the asset.

VALUE ACCOUNTS Holdings LimitedPwC 138
(iv) Customer contracts
Customer contracts acquired as part of a business combination are recognised separately from goodwill. The customer contracts are carried at their fair value at the date of acquisition less accumulated amortisation and impairment losses. Amortisation is calculated based on the timing of projected cash flows of the contracts over their estimated useful lives, which currently vary from 1 to 3 years.
(v) Research and development
Research expenditure is recognised as an expense as incurred. Costs incurred on development projects (relating to the design and testing of new or improved products) are recognised as intangible assets when it is probable that the project will, after considering its commercial and technical feasibility, be completed and generate future economic benefits and its costs can be measured reliably. The expenditure capitalised comprises all directly attributable costs, including costs of materials, services, direct labour and an appropriate proportion of overheads. Other development expenditures that do not meet these criteria are recognised as an expense as incurred. Development costs previously recognised as an expense are not recognised as an asset in a subsequent period. Capitalised development costs are recorded as intangible assets and amortised from the point at which the asset is ready for use on a straight-line basis over its useful life, which varies from three to five years.
(u) Trade and other payables
These amounts represent liabilities for goods and services provided to the group prior to the end of financial year which are unpaid. The amounts are unsecured and are usually paid within 30 days of recognition. Trade and other payables are presented as current liabilities unless payment is not due within 12 months from the reporting date. They are recognised initially at their fair value and subsequently measured at amortised cost using the effective interest method.
(v) Borrowings
Borrowings are initially recognised at fair value, net of transaction costs incurred. Borrowings are subsequently measured at amortised cost. Any difference between the proceeds (net of transaction costs) and the redemption amount is recognised in profit or loss over the period of the borrowings using the effective interest method. Fees paid on the establishment of loan facilities are recognised as transaction costs of the loan to the extent that it is probable that some or all of the facility will be drawn down. In this case, the fee is deferred until the draw down occurs. To the extent there is no evidence that it is probable that some or all of the facility will be drawn down, the fee is capitalised as a prepayment for liquidity services and amortised over the period of the facility to which it relates.
Preference shares, which are mandatorily redeemable on a specific date, are classified as liabilities. The dividends on these preference shares are recognised in profit or loss as finance costs.
The fair value of the liability portion of a convertible bond is determined using a market interest rate for an equivalent non-convertible bond. This amount is recorded as a liability on an amortised cost basis until extinguished on conversion or maturity of the bonds. The remainder of the proceeds is allocated to the conversion option. This is recognised and included in shareholders’ equity, net of income tax effects.
Borrowings are removed from the balance sheet when the obligation specified in the contract is discharged, cancelled or expired. The difference between the carrying amount of a financial liability that has been extinguished or transferred to another party and the consideration paid, including any non-cash assets transferred or liabilities assumed, is recognised in profit or loss as other income or finance costs.
Where the terms of a financial liability are renegotiated and the entity issues equity instruments to a creditor to extinguish all or part of the liability (debt for equity swap), a gain or loss is recognised in profit or loss, which is measured as the difference between the carrying amount of the financial liability and the fair value of the equity instruments issued.
Borrowings are classified as current liabilities unless the group has an unconditional right to defer settlement of the liability for at least 12 months after the reporting period.
VALUE ACCOUNTS Holdings LimitedPwC 139
(w) Borrowing costs
Borrowing costs incurred for the construction of any qualifying asset are capitalised during the period of time that is required to complete and prepare the asset for its intended use or sale. Other borrowing costs are expensed.
(x) Provisions
Provisions for legal claims, service warranties and make good obligations are recognised when the group has a present legal or constructive obligation as a result of past events, it is probable that an outflow of resources will be required to settle the obligation and the amount has been reliably estimated. Provisions are not recognised for future operating losses.
Where there are a number of similar obligations, the likelihood that an outflow will be required in settlement is determined by considering the class of obligations as a whole. A provision is recognised even if the likelihood of an outflow with respect to any one item included in the same class of obligations may be small.
Provisions are measured at the present value of management’s best estimate of the expenditure required to settle the present obligation at the end of the reporting period. The discount rate used to determine the present value is a pre-tax rate that reflects current market assessments of the time value of money and the risks specific to the liability. The increase in the provision due to the passage of time is recognised as interest expense.
(y) Employee benefits
(i) Short-term obligations
Liabilities for wages and salaries, including non-monetary benefits, annual leave and accumulating sick leave expected to be settled within 12 months after the end of the period in which the employees render the related service are recognised in respect of employees’ services up to the end of the reporting period and are measured at the amounts expected to be paid when the liabilities are settled. The liability for annual leave and accumulating sick leave is recognised in the provision for employee benefits. All other short-term employee benefit obligations are presented as payables.
(ii) Other long-term employee benefit obligations
The liability for long service leave and annual leave which is not expected to be settled within 12 months after the end of the period in which the employees render the related service is recognised in the provision for employee benefits and measured as the present value of expected future payments to be made in respect of services provided by employees up to the end of the reporting period using the projected unit credit method. Consideration is given to expected future wage and salary levels, experience of employee departures and periods of service. Expected future payments are discounted using market yields at the end of the reporting period on government bonds with terms and currencies that match, as closely as possible, the estimated future cash outflows.
The obligations are presented as current liabilities in the balance sheet if the entity does not have an unconditional right to defer settlement for at least twelve months after the reporting date, regardless of when the actual settlement is expected to occur.
(iii) Retirement benefit obligations
All employees of the group are entitled to benefits from the group’s superannuation plan on retirement, disability or death or can direct the group to make contributions to a defined contribution plan of their choice. The group’s superannuation plan has a defined benefit section and a defined contribution section. The defined benefit section provides defined lump sum benefits based on years of service and final average salary. The defined contribution section receives fixed contributions from group companies and the group’s legal or constructive obligation is limited to these contributions.
The liability or asset recognised in the balance sheet in respect of defined benefit superannuation plans is the present value of the defined benefit obligation at the end of the reporting period less the fair value of plan assets, together with adjustments for unrecognised past service costs. The defined benefit obligation is calculated annually by independent actuaries using the projected unit credit method.
The present value of the defined benefit obligation is determined by discounting the estimated future cash outflows using market yields of government bonds that are denominated in the currency

VALUE ACCOUNTS Holdings LimitedPwC 140
in which the benefits will be paid, and that have terms approximating to the terms of the related obligation. In countries where there is a deep market in high-quality corporate bonds, the market rates on those bonds are used.
Actuarial gains and losses arising from experience adjustments and changes in actuarial assumptions are recognised in the period in which they occur, directly in other comprehensive income.
Past service costs are recognised immediately in profit or loss, unless the changes to the superannuation fund are conditional on the employees remaining in service for a specified period of time (the vesting period). In this case, the past service costs are amortised on a straight-line basis over the vesting period.
Contributions to the defined contribution section of the group’s superannuation plan and other independent defined contribution superannuation funds are recognised as an expense as they become payable. Prepaid contributions are recognised as an asset to the extent that a cash refund or a reduction in the future payments is available.
(iv) Share-based payments
Share-based compensation benefits are provided to employees via the VALUE ACCOUNTS Employee Option Plan and an employee share scheme. Information relating to these schemes is set out in note F4.
The fair value of options granted under the VALUE ACCOUNTS Employee Option Plan is recognised as an employee benefits expense with a corresponding increase in equity. The total amount to be expensed is determined by reference to the fair value of the options granted, which includes any market performance conditions and the impact of any non-vesting conditions but excludes the impact of any service and non-market performance vesting conditions.
Non-market vesting conditions are included in assumptions about the number of options that are expected to vest. The total expense is recognised over the vesting period, which is the period over which all of the specified vesting conditions are to be satisfied. At the end of each period, the entity revises its estimates of the number of options that are expected to vest based on the non-marketing vesting conditions. It recognises the impact of the revision to original estimates, if any, in profit or loss, with a corresponding adjustment to equity.
The Employee Option Plan is administered by the VALUE ACCOUNTS Employee Share Trust; see note F9(b)(ii). When the options are exercised, the trust transfers the appropriate amount of shares to the employee. The proceeds received net of any directly attributable transaction costs are credited directly to equity.
Under the employee share scheme, shares issued by the VALUE ACCOUNTS Employee Share Trust to employees for no cash consideration vest immediately on grant date. On this date, the market value of the shares issued is recognised as an employee benefits expense with a corresponding increase in equity.
The fair value of deferred shares granted to employees for nil consideration under the short-term incentive scheme is recognised as an expense over the relevant service period, being the year to which the bonus relates and the vesting period of the shares. The fair value is measured at the grant date of the shares and is recognised in equity in the share-based payment reserve. The number of shares expected to vest is estimated based on the non-market vesting conditions. The estimates are revised at each reporting date and adjustments are recognised in profit or loss and the share-based payment reserve.
The deferred shares are acquired by the VALUE ACCOUNTS Employee Share Trust on market at the grant date and are held as treasury shares until such time as they are vested, see note F9(b)(ii).
(v) Profit-sharing and bonus plans
The group recognises a liability and an expense for bonuses and profit-sharing based on a formula that takes into consideration the profit attributable to the company’s shareholders after certain adjustments. The group recognises a provision where contractually obliged or where there is a past practice that has created a constructive obligation.
VALUE ACCOUNTS Holdings LimitedPwC 141
(vi) Termination benefits
Termination benefits are payable when employment is terminated before the normal retirement date, or when an employee accepts voluntary redundancy in exchange for these benefits. The group recognises termination benefits when it is demonstrably committed to either terminating the employment of current employees according to a detailed formal plan without possibility of withdrawal or to providing termination benefits as a result of an offer made to encourage voluntary redundancy. Benefits falling due more than 12 months after the end of the reporting period are discounted to present value.
(z) Contributed equity
Ordinary shares are classified as equity. Mandatorily redeemable preference shares are classified as liabilities (note A3(c)).
Incremental costs directly attributable to the issue of new shares or options are shown in equity as a deduction, net of tax, from the proceeds.
Where any group company purchases the company’s equity instruments, for example as the result of a share buy-back or a share-based payment plan, the consideration paid, including any directly attributable incremental costs (net of income taxes) is deducted from equity attributable to the owners of VALUE ACCOUNTS Holdings Limited as treasury shares until the shares are cancelled or reissued. Where such ordinary shares are subsequently reissued, any consideration received, net of any directly attributable incremental transaction costs and the related income tax effects, is included in equity attributable to the owners of VALUE ACCOUNTS Holdings Limited.
(aa) Dividends
Provision is made for the amount of any dividend declared, being appropriately authorised and no longer at the discretion of the entity, on or before the end of the reporting period but not distributed at the end of the reporting period.
(ab) Earnings per share
(i) Basic earnings per share
Basic earnings per share is calculated by dividing:
• theprofitattributabletoownersofthecompany,excludinganycostsofservicingequityotherthan ordinary shares
• bytheweightedaveragenumberofordinarysharesoutstandingduringthefinancialyear,adjusted for bonus elements in ordinary shares issued during the year and excluding treasury shares (note A5).
(ii) Diluted earnings per share
Diluted earnings per share adjusts the figures used in the determination of basic earnings per share to take into account:
• theafterincometaxeffectofinterestandotherfinancingcostsassociatedwithdilutivepotential ordinary shares, and
• theweightedaveragenumberofadditionalordinarysharesthatwouldhavebeenoutstandingassuming the conversion of all dilutive potential ordinary shares.
(ac) Goods and Services Tax (GST)
Revenues, expenses and assets are recognised net of the amount of associated GST, unless the GST incurred is not recoverable from the taxation authority. In this case it is recognised as part of the cost of acquisition of the asset or as part of the expense.
Receivables and payables are stated inclusive of the amount of GST receivable or payable. The net amount of GST recoverable from, or payable to, the taxation authority is included with other receivables or payables in the balance sheet.
Cash flows are presented on a gross basis. The GST components of cash flows arising from investing or financing activities which are recoverable from, or payable to the taxation authority, are presented as operating cash flows.

142VALUE ACCOUNTS Holdings LimitedPwC
(ad) Rounding of amounts
The company is of a kind referred to in Class Order 98/100, issued by the Australian Securities and Investments Commission, relating to the ‘rounding off’ of amounts in the financial statements. Amounts in the financial statements have been rounded off in accordance with that Class Order to the nearest thousand dollars, or in certain cases, the nearest dollar.
(ae) New accounting standards and interpretations
Certain new accounting standards and interpretations have been published that are not mandatory for 30 June 2013 reporting periods and have not been early adopted by the group. The group’s assessment of the impact of these new standards and interpretations is set out below.
Title of standard Nature of change Impact
Mandatory application date/ Date of adoption by group
AASB 9 Financial Instruments
AASB 9 addresses the classification, measurement and derecognition of financial assets and financial liabilities.
When adopted, the standard will affect in particular the group’s accounting for its available-for-sale financial assets, since AASB 9 only permits the recognition of fair value gains and losses in other comprehensive income if they relate to equity investments that are not held for trading. Fair value gains and losses on available-for-sale debt investments, for example, will therefore have to be recognised directly in profit or loss. In the current reporting period, the group recognised $576,000 of such gains in other comprehensive income.
There will be no impact on the group’s accounting for financial liabilities, as the new requirements only affect the accounting for financial liabilities that are designated at fair value through profit or loss and the group does not have any such liabilities.
Must be applied for financial years commencing on or after 1 January 2015.
The group has not yet decided when to adopt AASB 9.

143VALUE ACCOUNTS Holdings LimitedPwC
Title of standard Nature of change Impact
Mandatory application date/ Date of adoption by group
AASB 10 Consolidated Financial Statements, AASB 11 Joint Arrangements, AASB 12 Disclosure of Interests in Other Entities
AASB 10 replaces all of the guidance on control and consolidation in the current standards. While the core principles in relation to consolidation remain unchanged, the standard introduces a single definition of control that applies to all entities. It focuses on the need to have both power and rights or exposure to variable returns. Control exists when the investor can use its power to affect the amount of its returns.
AASB 11 introduces a principles based approach to accounting for joint arrangements. The focus is no longer on the legal structure of joint arrangements, but rather on how rights and obligations are shared by the parties to the joint arrangement. Based on the assessment of rights and obligations, a joint arrangement will be classified as either a joint operation or a joint venture. Joint ventures are accounted for using the equity method, and the choice to proportionately consolidate will no longer be permitted.
AASB 12 sets out the required disclosures for entities reporting under the two new standards, AASB 10 and AASB 11, and replaces the disclosure requirements currently found in AASB 127 and AASB 128.
While the group does not expect the new standard to have a significant impact on its composition, it has yet to perform a detailed analysis of the new guidance in the context of its various investees that may or may not be controlled under the new rules.
The group’s investment in the joint venture entity will be classified as a joint venture under the new rules. As the group already applies the equity method in accounting for this investment, AASB 11 will not have any impact on the amounts recognised in its financial statements.
Application of AASB 12 by the group will not affect any of the amounts recognised in the financial statements, but will impact the type of information disclosed in relation to the group’s investments.
Must be applied for financial years commencing on or after 1 January 2013.
Will be applied by the group from 1 July 2013.
AASB 13 Fair Value Measurement
AASB 13 explains how to measure fair value and aims to enhance fair value disclosures.
The group has yet to determine which, if any, of its current measurement techniques will have to change as a result of the new guidance. It is therefore not possible to state the impact, if any, of the new rules on any of the amounts recognised in the financial statements. However, application of the new standard will impact the type of information disclosed in the notes to the financial statements.
Must be applied for financial years commencing on or after 1 January 2013.
Will be applied by the group from 1 July 2013.

144VALUE ACCOUNTS Holdings LimitedPwC
Title of standard Nature of change Impact
Mandatory application date/ Date of adoption by group
Revised AASB 119 Employee Benefits
The revised AASB 119 requires the recognition of all remeasurements of defined benefit liabilities/assets immediately in other comprehensive income (removal of the so-called ‘corridor’ method), the immediate recognition of all past service cost in profit or loss and the calculation of a net interest expense or income by applying the discount rate to the net defined benefit liability or asset. This replaces the expected return on plan assets that is currently included in profit or loss. The standard also introduces a number of additional disclosures for defined benefit liabilities/assets and could affect the timing of the recognition of termination benefits. The amendments will have to be implemented retrospectively.
Had the group adopted the new rules in the current reporting period, profit or loss for the current period would have been approximately $103,000 lower, other comprehensive income approximately $91,000 higher and total comprehensive income for the period approximately $12,000 lower than reported. The group expects a similar impact on profit or loss and other comprehensive income in the 2014 financial year. In the balance sheet as at 30 June 2013, retirement benefit obligations would have been $145,000 higher, deferred tax assets $44,000 higher and retained earnings $103,000 lower.
Must be applied for financial years commencing on or after 1 January 2013.
Will be applied by the group from 1 July 2013.
There are no other standards that are not yet effective and that are expected to have a material impact on the entity in the current or future reporting periods and on foreseeable future transactions.
(af) Parent entity financial information
The financial information for the parent entity, VALUE ACCOUNTS Holdings Limited, disclosed in note F8 has been prepared on the same basis as the consolidated financial statements, except as set out below.
(i) Investments in subsidiaries, associates and joint venture entities
Investments in subsidiaries, associates and joint venture entities are accounted for at cost in the financial statements of VALUE ACCOUNTS Holdings Limited. Dividends received from associates are recognised in the parent entity’s profit or loss when its right to receive the dividend is established.
VALUE ACCOUNTS Holdings LimitedPwC 145
(ii) Tax consolidation legislation
VALUE ACCOUNTS Holdings Limited and its wholly-owned Australian controlled entities have implemented the tax consolidation legislation.
The head entity, VALUE ACCOUNTS Holdings Limited, and the controlled entities in the tax consolidated group account for their own current and deferred tax amounts. These tax amounts are measured as if each entity in the tax consolidated group continues to be a stand alone taxpayer in its own right.
In addition to its own current and deferred tax amounts, VALUE ACCOUNTS Holdings Limited also recognises the current tax liabilities (or assets) and the deferred tax assets arising from unused tax losses and unused tax credits assumed from controlled entities in the tax consolidated group.
The entities have also entered into a tax funding agreement under which the wholly-owned entities fully compensate VALUE ACCOUNTS Holdings Limited for any current tax payable assumed and are compensated by VALUE ACCOUNTS Holdings Limited for any current tax receivable and deferred tax assets relating to unused tax losses or unused tax credits that are transferred to VALUE ACCOUNTS Holdings Limited under the tax consolidation legislation. The funding amounts are determined by reference to the amounts recognised in the wholly-owned entities’ financial statements.
The amounts receivable/payable under the tax funding agreement are due upon receipt of the funding advice from the head entity, which is issued as soon as practicable after the end of each financial year. The head entity may also require payment of interim funding amounts to assist with its obligations to pay tax instalments.
Assets or liabilities arising under tax funding agreements with the tax consolidated entities are recognised as current amounts receivable from or payable to other entities in the group.
Any difference between the amounts assumed and amounts receivable or payable under the tax funding agreement are recognised as a contribution to (or distribution from) wholly-owned tax consolidated entities.
(iii) Financial guarantees
Where the parent entity has provided financial guarantees in relation to loans and payables of subsidiaries for no compensation, the fair values of these guarantees are accounted for as contributions and recognised as part of the cost of the investment.
(iv) Share-based payments
The grant by the company of options over its equity instruments to the employees of subsidiary undertakings in the group is treated as a capital contribution to that subsidiary undertaking. The fair value of employee services received, measured by reference to the grant date fair value, is recognized over the vesting period as an increase to investment in subsidiary undertakings, with a corresponding credit to equity.
VALUE ACCOUNTS Holdings LimitedPwC 146
Abbreviations used in this publication are set out below.
AASB Australian Accounting Standards Board
AASB (Number) Accounting Standards issued by the AASB
AASB (Number)R Revised accounting standard – not yet operative
AASB I (Number) Interpretations issued by the AASB
ABN Australian Business Number
ACN Australian Company Number
AfS Available for Sale (financial assets)
AIFRS Australian equivalents to International Financial Reporting Standards
ASIC Australian Securities and Investments Commission
ASIC RG ASIC Regulatory Guide
ASIC (Number) ASIC Class Orders
ASX ASX Limited, trading as Australian Securities Exchange
ASX (Number) ASX Listing Rules
bps basis points
CA Corporations Act 2001
CGU Cash Generating Unit
CODM Chief operating decision maker
CR Corporations Regulations 2001
FVTPL (Financial assets/liabilities at) fair value through profit or loss
GAAP Generally Accepted Accounting Principles
GPFS General Purpose Financial Statements
IAS International Accounting Standards
IASB International Accounting Standards Board
IFRIC Interpretations issued by the IFRS Interpretations Committee of the IASB
IFRS International Financial Reporting Standards
NCI Non-controlling interest
OCI Other comprehensive income
RDR Reduced Disclosure Regime
SAC Statements of Accounting Concepts
STI Short-term Incentive
TSR Total Shareholder Return
UIG Urgent Issues Group
UIG (Number) UIG Interpretations

VALUE ACCOUNTS Holdings LimitedPwC 147
Adelaide
Level 14, 91 King William Street, Adelaide GPO Box 418, Adelaide, SA 5001 Telephone: (08) 8218 7000 Fax: (08) 8218 7999
Newcastle
Level 6, 26 Honeysuckle Drive, Newcastle, NSW PO Box 798, Newcastle, NSW 2300 Telephone: (02) 4925 1100 Fax: (02) 4925 1199
Brisbane
Level 15, Riverside Centre, 123 Eagle Street, Brisbane GPO Box 150, Brisbane, QLD 4001 Telephone: (07) 3257 5000 Fax: (07) 3257 5999
Perth
Level 15, Brookfield Place 125 St Georges Terrace, Perth GPO Box D198, Perth, WA 6840 Telephone: (08) 9238 3000 Fax: (08) 9238 3999
Gold Coast
Ground Floor, Suite 4, The Point @ Varsity 47 Watts Drive, QLD 4227 GPO Box 150, Brisbane, QLD 4001 Telephone: (07) 5689 1942 Fax: (07) 3257 5999
Sydney
Darling Park Tower 2 201 Sussex Street, Sydney GPO Box 2650, Sydney, NSW 1171 Telephone: (02) 8266 0000 Fax: (02) 8266 9999
Canberra
Walter Turnbull House 28 Sydney Avenue, Forrest GPO Box 447, Canberra, ACT 2601 Telephone: (02) 6271 3000 Fax: (02) 6271 3999
Greater Western Sydney
Level 1, 21 Solent Circuit, Baulkham Hills, NSW 2153 PO Box 7684, Baulkham Hills, NSW 2153 Telephone: (02) 9659 2476 Fax: (02) 8286 9999
Melbourne
Freshwater Place Level 19, 2 Southbank Boulevard, Southbank GPO Box 1331, Melbourne, VIC 3001 Telephone: (03) 8603 1000 Fax: (03) 8603 1999
Townsville
51 Sturt Street, Townsville PO Box 1047, Townsville, QLD 4810 Telephone: (07) 4721 8500 Fax: (07) 4721 8599
Internet website
www.pwc.com.au