streamflow and erosion response to prolonged intense
TRANSCRIPT

Streamflow and Erosion Response to Prolonged Intense Rainfall of November 1–2, 2000, Island of Hawaii, Hawaii
U.S. Department of the InteriorU.S. Geological SurveyWater-Resources Investigations Report 02-4117

Streamflow and Erosion Response toProlonged Intense Rainfall of November 1–2,2000, Island of Hawaii, Hawaii
By Richard A. Fontaine and Barry R. Hill
U.S. GEOLOGICAL SURVEY
Water-Resources Investigations Report 02-4117
Honolulu, Hawaii2002

U.S. DEPARTMENT OF THE INTERIOR
GALE A. NORTON, Secretary
U.S. GEOLOGICAL SURVEY
Charles G. Groat, Director
The use of firm, trade, and brand names in this report is for identification purposesonly and does not constitute endorsement by the U.S. Geological Survey.
For additional information write to: Copies of this report can be purchasedfrom:
District Chief U.S. Geological SurveyU.S. Geological Survey Branch of Information Services677 Ala Moana Blvd., Suite 415 Box 25286Honolulu, HI 96813 Denver, CO 80225-0286
U.S
. DEP
ARTMENT OF THE
INTER
IOR
MARCH 3, 1849

CONTENTS
Abstract . . . . . . . . . . . . . . . . . . . . . . . . . . . . . . . . . . . . . . . . . . . . . . . . . . . . . . . . . . . . . . . . . . . . . . . . . . . . . . . . . . . . . . . . . . 1
Introduction . . . . . . . . . . . . . . . . . . . . . . . . . . . . . . . . . . . . . . . . . . . . . . . . . . . . . . . . . . . . . . . . . . . . . . . . . . . . . . . . . . . . . . . 1
Purpose and Scope . . . . . . . . . . . . . . . . . . . . . . . . . . . . . . . . . . . . . . . . . . . . . . . . . . . . . . . . . . . . . . . . . . . . . . . . . . . . 1
Acknowledgements . . . . . . . . . . . . . . . . . . . . . . . . . . . . . . . . . . . . . . . . . . . . . . . . . . . . . . . . . . . . . . . . . . . . . . . . . . . 2
Study Area. . . . . . . . . . . . . . . . . . . . . . . . . . . . . . . . . . . . . . . . . . . . . . . . . . . . . . . . . . . . . . . . . . . . . . . . . . . . . . . . . . . . . . . . 2
Waiakea High-Rainfall Area . . . . . . . . . . . . . . . . . . . . . . . . . . . . . . . . . . . . . . . . . . . . . . . . . . . . . . . . . . . . . . . . . . . . 2
Kapapala High-Rainfall Area . . . . . . . . . . . . . . . . . . . . . . . . . . . . . . . . . . . . . . . . . . . . . . . . . . . . . . . . . . . . . . . . . . . . 5
Storm Characteristics . . . . . . . . . . . . . . . . . . . . . . . . . . . . . . . . . . . . . . . . . . . . . . . . . . . . . . . . . . . . . . . . . . . . . . . . . . . . . . . 5
Rainfall Amounts . . . . . . . . . . . . . . . . . . . . . . . . . . . . . . . . . . . . . . . . . . . . . . . . . . . . . . . . . . . . . . . . . . . . . . . . . . . . . 8
Rainfall Frequency . . . . . . . . . . . . . . . . . . . . . . . . . . . . . . . . . . . . . . . . . . . . . . . . . . . . . . . . . . . . . . . . . . . . . . . . . . . . 10
Description of Flood . . . . . . . . . . . . . . . . . . . . . . . . . . . . . . . . . . . . . . . . . . . . . . . . . . . . . . . . . . . . . . . . . . . . . . . . . . . . . . . . 10
Peak Flows . . . . . . . . . . . . . . . . . . . . . . . . . . . . . . . . . . . . . . . . . . . . . . . . . . . . . . . . . . . . . . . . . . . . . . . . . . . . . . . . . . 11
Waiakea High-Rainfall Area. . . . . . . . . . . . . . . . . . . . . . . . . . . . . . . . . . . . . . . . . . . . . . . . . . . . . . . . . . . . . . . 11
Kapapala High-Rainfall Area . . . . . . . . . . . . . . . . . . . . . . . . . . . . . . . . . . . . . . . . . . . . . . . . . . . . . . . . . . . . . . 16
Peak-Flow Frequency . . . . . . . . . . . . . . . . . . . . . . . . . . . . . . . . . . . . . . . . . . . . . . . . . . . . . . . . . . . . . . . . . . . . . . . . . . 17
Waiakea High-Rainfall Area. . . . . . . . . . . . . . . . . . . . . . . . . . . . . . . . . . . . . . . . . . . . . . . . . . . . . . . . . . . . . . . 18
Kapapala High-Rainfall Area . . . . . . . . . . . . . . . . . . . . . . . . . . . . . . . . . . . . . . . . . . . . . . . . . . . . . . . . . . . . . . 18
Rainfall-Runoff Relations. . . . . . . . . . . . . . . . . . . . . . . . . . . . . . . . . . . . . . . . . . . . . . . . . . . . . . . . . . . . . . . . . . . . . . . 18
Waiakea High-Rainfall Area. . . . . . . . . . . . . . . . . . . . . . . . . . . . . . . . . . . . . . . . . . . . . . . . . . . . . . . . . . . . . . . 23
Kapapala High-Rainfall Area . . . . . . . . . . . . . . . . . . . . . . . . . . . . . . . . . . . . . . . . . . . . . . . . . . . . . . . . . . . . . . 24
Erosional Features in the Kapapala High-Rainfall Area . . . . . . . . . . . . . . . . . . . . . . . . . . . . . . . . . . . . . . . . . . . . . . . . . . . . . 25
Summary and Conclusions . . . . . . . . . . . . . . . . . . . . . . . . . . . . . . . . . . . . . . . . . . . . . . . . . . . . . . . . . . . . . . . . . . . . . . . . . . . 28
References Cited . . . . . . . . . . . . . . . . . . . . . . . . . . . . . . . . . . . . . . . . . . . . . . . . . . . . . . . . . . . . . . . . . . . . . . . . . . . . . . . . . . . 30
FIGURES
1–3. Maps showing:
1. Study areas and total rainfall, November 1–2, 2000 flood, island of Hawaii, Hawaii . . . . . . . . . . . . . . . . . . . 3
2. Waiakea high-rainfall area and data-collection sites, island of Hawaii, Hawaii . . . . . . . . . . . . . . . . . . . . . . . . 4
3. Kapapala high-rainfall area and data-collection sites, island of Hawaii, Hawaii . . . . . . . . . . . . . . . . . . . . . . . 6
4. Graph showing hourly rainfall totals for November 1–2, 2000 at Waiakea Uka and Kapapala Ranch,island of Hawaii, Hawaii . . . . . . . . . . . . . . . . . . . . . . . . . . . . . . . . . . . . . . . . . . . . . . . . . . . . . . . . . . . . . . . . . . . 9
5. Photograph showing site of destroyed Highway 11 bridge over Keaiwa Stream near Pahala, Hawaii,November 3, 2000, island of Hawaii, Hawaii . . . . . . . . . . . . . . . . . . . . . . . . . . . . . . . . . . . . . . . . . . . . . . . . . . . 11
6–7. Maps showing:
6. Total rainfall in the Waiakea high-rainfall area, November 1–2, 2000 flood, island of Hawaii, Hawaii . . . . . 14
7. Total rainfall in the Kapapala high-rainfall area, November 1–2, 2000 flood, island of Hawaii, Hawaii. . . . . 15
8. Scatterplot of peak-flow recurrence interval and area-weighted storm rainfall, November 1–2, 2000 flood,island of Hawaii, Hawaii . . . . . . . . . . . . . . . . . . . . . . . . . . . . . . . . . . . . . . . . . . . . . . . . . . . . . . . . . . . . . . . . . . . 20
9–10. Graphs showing:
9. Piihonua hourly rainfall totals and Honolii streamflow data, November 1–2, 2000 flood, island of Hawaii,Hawaii . . . . . . . . . . . . . . . . . . . . . . . . . . . . . . . . . . . . . . . . . . . . . . . . . . . . . . . . . . . . . . . . . . . . . . . . . . . . 21
Contents iii

10. Relation between peak unit runoff and drainage area, November 1–2, 2000 flood, island ofHawaii, Hawaii . . . . . . . . . . . . . . . . . . . . . . . . . . . . . . . . . . . . . . . . . . . . . . . . . . . . . . . . . . . . . . . . . . . . . . 23
11–12. Photographs showing:
11. Hillslope erosional feature at site 47 along Kaoiki Pali, showing evidence of both fluvialand mass-wasting erosion, island of Hawaii, Hawaii . . . . . . . . . . . . . . . . . . . . . . . . . . . . . . . . . . . . . . . . . 27
12. Headcut on Waihaka Stream between Kapapala Ranch and site 13, showing effect of
resistant cap of lava above ash deposits, island of Hawaii, Hawaii . . . . . . . . . . . . . . . . . . . . . . . . . . . . . . 29
TABLES
1. Maximum rainfall totals and recurrence intervals for selected durations, November 1–2, 2000 flood,island of Hawaii, Hawaii . . . . . . . . . . . . . . . . . . . . . . . . . . . . . . . . . . . . . . . . . . . . . . . . . . . . . . . . . . . . . . . . . . . . 10
2. Peak-flow and erosion measurement sites for November 1–2, 2000 flood, island of Hawaii, Hawaii . . . . . . . . . . . . 12
3. Peak flows and associated recurrence intervals for November 1–2, 2000 flood, and previous record peak flows,island of Hawaii, Hawaii. . . . . . . . . . . . . . . . . . . . . . . . . . . . . . . . . . . . . . . . . . . . . . . . . . . . . . . . . . . . . . . . . . . . . 16
4. Rainfall and runoff data for November 1–2, 2000 flood, island of Hawaii, Hawaii . . . . . . . . . . . . . . . . . . . . . . . . . . 19
5. Critical rainfall durations associated with peak flows for November 1–2, 2000 flood, island of Hawaii, Hawaii . . . 22
6. Hillslope erosional features along the Kaoiki Pali resulting from the November 1–2, 2000 flood,island of Hawaii, Hawaii. . . . . . . . . . . . . . . . . . . . . . . . . . . . . . . . . . . . . . . . . . . . . . . . . . . . . . . . . . . . . . . . . . . . . 26
7. Dimensions of selected hillslope erosional features along the Kaoiki Pali resulting from the November 1–2,2000 flood, island of Hawaii, Hawaii . . . . . . . . . . . . . . . . . . . . . . . . . . . . . . . . . . . . . . . . . . . . . . . . . . . . . . . . . . . 27
8. Shear stresses exerted by peak flows upstream of hillslope erosional features along the Kaoiki Pali,November 1–2, 2000 flood, island of Hawaii, Hawaii . . . . . . . . . . . . . . . . . . . . . . . . . . . . . . . . . . . . . . . . . . . . . . 28
iv Streamflow and Erosion Response to Prolonged Intense Rainfall of November 1-2, 2000, Island of Hawaii, Hawaii

Streamflow and Erosion Response to Prolonged IntenseRainfall of November 1–2, 2000, Island of Hawaii, Hawaii
By Richard A. Fontaine and Barry R. Hill
Abstract
A combination of several meteorologic andtopographic factors produced extreme rainfall overthe eastern part of the island of Hawaii on Novem-ber 1–2, 2000. Storm rainfall was concentrated intwo distinct areas, the Waiakea and Kapapalaareas, where maximum rainfall totals of 32.47 and38.97 inches were recorded. Resultant floodingcaused damages in excess of 70 million dollars,among the highest totals associated with floodingin the State’s history. Storm rainfall had recurrenceintervals that ranged from 10 years or less for max-imum 1-hour totals to 100 years or more for maxi-mum 24-hour totals.
As part of this study, peak flow and/or erosiondata were collected at 41 sites. Analyses of thesedata indicated that peak discharges of recordoccurred at 6 of 12 sites where historic data wereavailable. Peak flows with estimated recurrenceintervals from 50 to over 100 years were recordedat 4 of 11 sites. Peak flows were poorly correlatedwith total storm rainfall. Critical rainfall durationsassociated with peak flows ranged from 1 to 12hours and were about 3 hours at most sites. Rain-fall-runoff computations and field observationsindicated that infiltration-excess overland flowalone was not sufficient to have caused theobserved flood peaks and therefore saturation-excess overland flow and subsurface flow probablycontributed to peak flows at most sites.
Most hillslope erosion associated with thestorm took place along or near the Kaoiki Pali in
the Kapapala area. Hillslope erosion was predomi-nately caused by overland flow.
INTRODUCTION
During November 1–2, 2000, prolonged andintense rain fell in two separate areas of the island ofHawaii: the Waiakea area and the Kapapala area (fig.1). Storm rainfall totals exceeded 30 in. within bothhigh-rainfall areas, and ranged from 5 to 25 in. within alarger surrounding area encompassing most of the east-ern half of the island (Paul Haraguchi, consulting mete-orologist, written commun., 2001). The resultantflooding caused millions of dollars in damages to roads,bridges, homes, businesses, and farms. No human fatal-ities resulted from the storm, and only one injury wasreported. This study was done by the U.S. GeologicalSurvey (USGS), as part of the USGS Office of SurfaceWater’s national program to document the effects ofextreme floods in the United States.
Purpose and Scope
This report describes the streamflow response tothe storm of November 1–2, 2000, and documents thegeomorphic effects of the storm and flood. Thesedescriptions are based on (1) determinations or esti-mates of peak streamflows at selected locations withinthe Waiakea and Kapapala high-rainfall areas, (2) deter-minations of the recurrence intervals of the flood peaksat gaging stations with adequate data, (3) comparisonsof peak streamflows at different locations on the basisof area-weighted rainfall and drainage area, and (4)descriptions of hillslope erosional features related to thestorm and flood in the Kapapala area. Detailed descrip-tions of storm meteorology, rainfall distribution and
Introduction 1

intensity, and geomorphic effects in the Waiakea high-rainfall area are provided by Haraguchi (Paul Haragu-chi, consulting meteorologist, written commun., 2001),and are not included in this report. Large-scale massmovement on the Kilauea Volcano that may haveoccurred during the storm (Cervelli and others, 2002)also is not described here.
During the period October 28–29, 2000, strongthunderstorms brought rainfall, estimated to be as greatas 24 to 27 in., to localized areas of eastern Maui (KevinKodama, National Weather Service, written commun.,2000). Runoff from this storm overflowed bridges,prompting the closure of several roads. Numerous tour-ists and local residents were temporarily stranded as aresult of the storm although no fatalities occurred.Although flooding was significant, analysis of the Octo-ber 28–29, 2000 storm on Maui was not included in thescope of this report.
Acknowledgements
The assistance of Kevin Kodama, NationalWeather Service, Paul Haraguchi consulting meteorol-ogist, and Sterling Yong, State of Hawaii Flood Coordi-nator, in obtaining information is gratefullyacknowledged. Mr. and Mrs. Gordon Cran of the Kapa-pala Ranch were kind enough to allow us access toranch lands for fieldwork and provided directions tosites of interest. Saku Nakamura of the NaturalResources Conservation Service provided data on soilproperties and Michael Lisowski of the U.S. GeologicalSurvey provided valuable insights regarding geomor-phic processes associated with the storm.
STUDY AREA
The high-rainfall areas of Waiakea and Kapapala(fig. 1) are located on the windward (eastern) slopes ofthe island of Hawaii. The study area includes parts ofthe volcanoes of Mauna Kea, Mauna Loa, and Kilauea.These volcanoes are of Pleistocene or Recent age;Mauna Loa and Kilauea are active volcanoes (Stearnsand Macdonald, 1946). Surface and subsurface rocksinclude basaltic and andesitic aa and pahoehoe lavaflows and the Pahala Ash (Stearns and Macdonald,1946). The climate is generally warm and humid. Pre-vailing winds are northeast trades, and orographiceffects imposed by the high, broad, volcanic mountains
of the island have a major effect on annual and stormrainfall distribution (Paul Haraguchi, consulting meteo-rologist, written commun., 2001). Historically, sugarplantations have dominated land use at altitudes below3,000 ft. Diversified agriculture, cattle ranching, andforestry expanded after the closure of the plantations inthe 1990’s but much of the former sugar lands remainfallow. At altitudes above 3,000 ft, most of the land isforest, park, military reservations, or hunting areas.
Waiakea High-Rainfall Area
The Waiakea high-rainfall area (figs. 1 and 2)includes the city of Hilo and extends from aboutPapaikou on the north to Glenwood on the south, andfrom sea level to an altitude of approximately 4,000 ft(Paul Haraguchi, consulting meteorologist, writtencommun., 2001). Mean annual rainfall in this arearanges from 118 in. along the coast to 236 in. at altitudesnear 3,000 ft (Giambelluca and others, 1986). Exceptfor the urban areas near the ocean, land cover is gener-ally dense, tropical, native, and introduced forest vege-tation, with some agricultural activity on extensiveformer sugarcane lands.
The Waiakea high-rainfall area includes the lowerwindward slopes of both Mauna Kea and Mauna Loa.Mauna Kea lies to the north of the Wailuku River (fig.2), and its slopes are formed of moderate to highly per-meable aa and pahoehoe basaltic and andesitic lavaflows of the Hamakua Volcanics capped with PahalaAsh (Stearns and Macdonald, 1946) (updated geologicnames used are from Langenheim and Clague, 1987).South of the Wailuku River, the area includes historicand prehistoric basaltic aa and pahoehoe lava flows ofthe Kau Basalt and basaltic flows of the Kahuku Basaltcapped by Pahala Ash (Stearns and Macdonald, 1946).
Although all of the surficial geologic materials arehighly permeable, the differing permeabilities of aa lavaflows, pahoehoe lava flows, and ash are likely to affectinfiltration and runoff during rainfall. Stearns and Mac-donald (1946 p. 159) considered the Pahala Ash to begenerally less permeable than the lava flows of theHamakua Volcanics, and suggested that the ash mayincrease runoff during storms. Sato and others (1973,p. 27) considered pahoehoe lavas to have low perme-ability in comparison to surrounding soils, althoughthey noted that aa lava flows act as ground-waterrecharge areas (Sato and others, 1973, p. 34) and
2 Streamflow and Erosion Response to Prolonged Intense Rainfall of November 1-2, 2000, Island of Hawaii, Hawaii

Study Area 3
Figure 1. Study areas and total rainfall, November 1–2, 2000 flood, island of Hawaii, Hawaii (rainfall lines fromconsulting meteorologist, Paul Haraguchi, written commun., 2001).
2
20˚
156˚̊
PAPA IIIFIFIFICOCECEAEAN
Oahu Molokai
LKah
Hawaii
HAWAII
156˚
155˚30'
55˚
19˚3
19
Keaau
Hilo
Papaikou
H
Honokaa
H
in Cook
Pahala
MAUNA LOA
KILAUEA
MAUNA KEA
WAIAKEAHIGH-RAINFALL
AREA
KAPAPALAHIGH-RAINFALL
AREA
HUALALAI
Upol
Honuapo Bay
O
Papa Bay
Keala B
Hono B
Kawaih B
0
00
10 MILES5
55 10 KILOMETERS10 KILOMETERS
EXPLANATION
LINE OF EQUAL RAINFALL, IN INCHES
RAIN GAGE AND NAME
PiihonuaHiloAirport
WaiakeaUka
MountainView
KapapalaRanch
KapapalaRanch
HawaiiVolcanoesNationalPark
Pahoa
5
10 15 20
2535
35
25
30

4 Streamflow and Erosion Response to Prolonged Intense Rainfall of November 1-2, 2000, Island of Hawaii, Hawaii
Figure 2. Waiakea high-rainfall area and data-collection sites, island of Hawaii, Hawaii.
EXPLANATION
TOPOGRAPHIC CONTOUR, IN FEET ABOVE MEAN SEA LEVEL
STREAMFLOW-GAGING STATION AND ABBREVIATED NUMBER
MISCELLANEOUS DISCHARGE MEASUREMENT SITE AND NUMBER
Gl
00
0
5 MILES5 MILES
5 KILOMETERS
1300
0
600
7000
5000
9000
80006000
7000
7000
3000
0
10000
1000
012000
8000
9000
9000
4000
1200
0
1000
7176.5
014
7000
52
MAUNA LOA
155˚20' 155˚10'155˚30'
19˚40'
19˚30'
19˚5
presumably contribute little or no surface runoff. Formost soils, surface permeability is 2.0 to 20 in/hr (Satoand others, 1973; Saku Nakamura, Natural ResourcesConservation Service, written commun., 2001). Mostsoils overlying ash or pahoehoe lavas have decreases oftwo orders of magnitude in permeability at depths rang-ing from 8 to 72 in. below land surface (Saku Naka-mura, Natural Resources Conservation Service, writtencommun., 2001). Soils overlying aa lavas haveincreases in permeability with depth (Saku Nakamura,Natural Resources Conservation Service, written com-mun., 2001). The parts of the study area underlain byash or pahoehoe lavas therefore are more likely to gen-erate shallow subsurface flow during heavy rainfall,owing to their decreases in permeability at shallowdepths on steep slopes (Freeze, 1974), than are parts ofthe area underlain by aa lavas, which have increases inpermeability at depth.
Kapapala High-Rainfall Area
The Kapapala high-rainfall area (figs. 1 and 3)includes the Kapapala Ranch, the community of WoodValley, and the town of Pahala, and extends approxi-mately from altitudes of 1,000 to 7,000 ft (Paul Haragu-chi, consulting meteorologist, written commun., 2001).Mean annual rainfall ranges from about 39 in. near the7,000-ft elevation to 118 in. at the 3,000-ft elevation(Giambelluca and others, 1986). From 3,000 ft to sealevel, annual rainfall decreases to about 40 in. (Giam-belluca and others, 1986). Until the end of plantationagriculture in 1995, much of the area below an altitudeof 3,000 ft to the southwest of the Kapapala Ranch wasused for sugar cultivation. Most of the former sugarcanelands now are used for macadamia nut orchards, pas-ture, or are left fallow. The land to the northeast of theKapapala Ranch has been used for pasture for manyyears. Forests cover most of the area above an altitudeof about 3,500 ft.
The Kapapala high-rainfall area is located mostlyon the slopes of Mauna Loa, but extends onto the south-western slopes of Kilauea as well. Surficial geology onMauna Loa include primarily basaltic lava flows of theKau Basalt, with smaller exposures of ash-cappedbasaltic lava flows of the Kahuku Basalt and a largelandslide deposit in the Wood Valley area (Stearns andClark, 1930; Stearns and Macdonald, 1946). OnKilauea, the surficial geology consists of historic andprehistoric basaltic lava flows (Stearns and Macdonald,
1946). Several major landforms related to structuraldeformation or large-scale mass movement on bothMauna Loa and Kilauea are within the Kapapala high-rainfall area, including fault scarps called pali in Hawaiiand numerous fissures and extensional cracks (Stearnsand Macdonald, 1946).
As in the Waiakea high-rainfall area, differences inthe permeabilities of surficial geologic materials mayaffect rates and process of storm runoff in the Kapapalahigh-rainfall area. Stearns and Clark (1930, p. 177) andStearns and Macdonald (1946, p. 76–77) considered thePahala Ash exposed on the Kahuku Basalt to be lesspermeable than the surrounding Kau Basalt. Soilsdeveloped on ash have permeabilities ranging from 2.0to 6.0 in/hr, whereas soils developed on lava have sur-face permeabilities ranging from 6.0 to 20 in/hr (Satoand others, 1973; Saku Nakamura, Natural ResourcesConservation Service, written commun., 2001). Infiltra-tion-excess overland flow therefore will occur at rain-fall intensities of 2.0 to 20 in/hr. Soils developed onboth types of parent material have decreases of one totwo orders of magnitude in permeability at depths rang-ing from 4 in. below land surface for soils developed onlavas to 48 in. below land surface for ash soils (SakuNakamura, Natural Resources Conservation Service,written commun., 2001). Such significant decreases inpermeability at shallow depths on steep hillslopes arelikely to result in shallow subsurface storm flow duringintense rainfall (Freeze, 1974).
STORM CHARACTERISTICS
Haraguchi (Paul Haraguchi, consulting meteorolo-gist, written commun., 2001) identified four primaryconditions whose simultaneous convergence duringNovember 1–2, 2000 contributed to the extreme natureof the storm. The conditions included (1) the upslopetopography of eastern Hawaii, (2) the location of a largeupper level trough 500 mi southwest of Kauai, (3) thepattern of southeasterly trade winds in the area, and (4)the location of the remnants from tropical storm Paul.
Total rainfall amounts for the storm of November1–2, 2000 were historical maximums at many locations,and exceeded 30 in. at some gages (Paul Haraguchi,consulting meteorologist, written commun., 2001).However, in some parts of eastern Hawaii, the maxi-mum rainfall totals from the November 1–2, 2000 stormwere not significantly greater than those recorded
Storm Characteristics 5

6 Streamflow and Erosion Response to Prolonged Intense Rainfall of November 1-2, 2000, Island of Hawaii, Hawaii
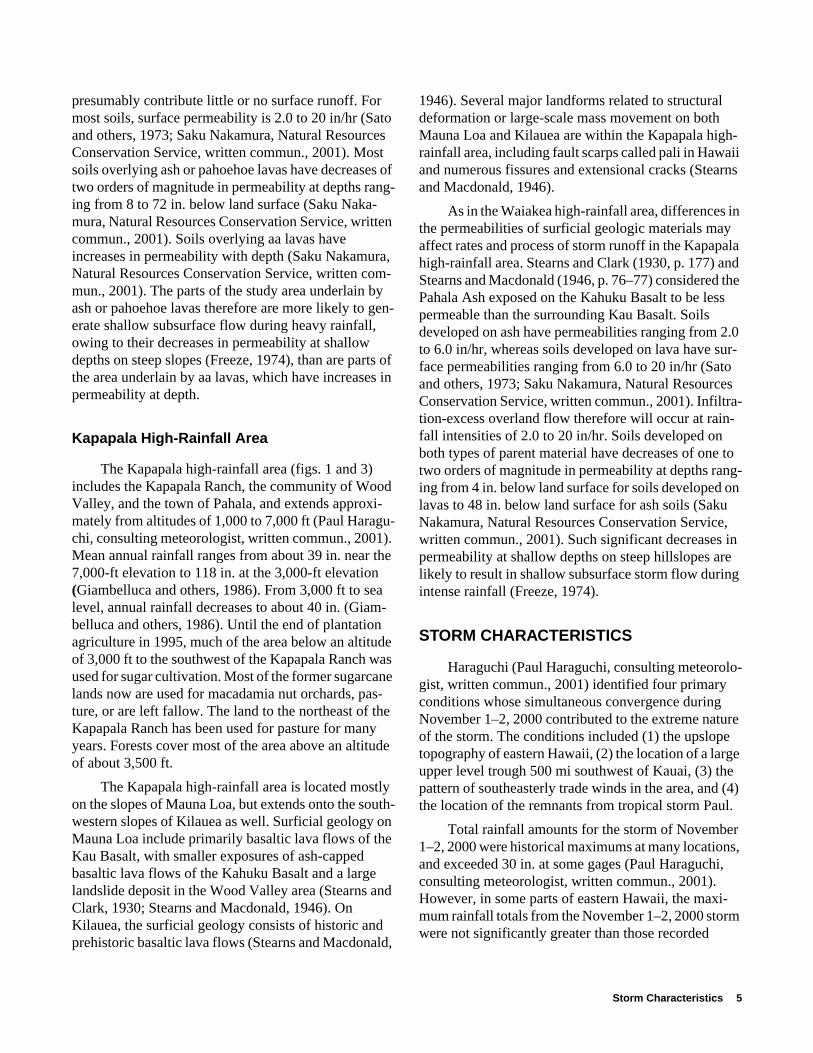
Figure 3. Kapapala high-rainfall area and data-collection sites, island of Hawaii, Hawaii.
EXPLANATION
TOPOGRAPHIC CONTOUR, IN FEET ABOVE MEAN SEA LEVEL
STREAMFLOW-GAGING STATION AND ABBREVIATED NUMBER
MISCELLANEOUS DISCHARGE MEASUREMENT SITE AND NUMBER
EROSIONAL FEATURE SITE AND NUMBER
H
P
PiikeaGulch
Kaalaala GulchKeaiwa Gulch
0
0
5 MILES
5 KILOMETERS
155˚20'155˚40'
19˚20'
19˚10'
155˚30'
KapapalaRanch
KILAUEA
7000
27
50
MAUNA LOA
13000
8000
12000
1000
011
000 70
00
11000 60006
0009000
8000
10
5000
3000
see fig. 3 --continued
Storm Characteristics 7
Figure 3. Kapapala high-rainfall area and data-collection sites, island of Hawaii, Hawaii--Continued.
EXPLANATION
TOPOGRAPHIC CONTOUR, IN FEET ABOVE MEAN SEA LEVEL
MISCELLANEOUS DISCHARGE MEASUREMENT SITE AND NUMBER
EROSIONAL FEATURE SITE AND NUMBER
3000
4500
5000
5500
6000
6500
4000
3500
6500
155˚20'
19˚20'
19˚25'
155˚25'
Kaoiki
Kaoiki
Kaoiki
PaliPaliPali
29
35
34
36
4739 38 37
41
4240
4546
28
50
50
51
30
33
31
34
36a,b,c,d
32
29
0
0
1
1
2 MILES
2 KILOMETERS
HIGHW
AY
11

during other storms. Several previous 24-hour rainfalltotals recorded on the island of Hawaii have been inexcess of 25 in. (Stearns and Clark, 1930; Paul Haragu-chi, consulting meteorologist, written commun., 2001).Storms with rainfall equal to or greater than the storm ofNovember 1–2, 2000 probably occurred before the his-torical period of record in Hawaii and are likely to occurperiodically in the future.
Rainfall Amounts
According to provisional data from the NationalWeather Service (NWS) hydronet network (internet sitehttp://www.prh.noaa.gov/hnl/pages/hydrology.html),the mean rainfall during October 2000 at six rain gagesin the Waiakea high-rainfall area was 182 percent ofnormal, whereas year-to-date (January through October2000) totals averaged 92 percent of normal. In theKapapala high-rainfall area, rainfall during October2000 averaged 63 percent of normal at two rain gages.January through October 2000 rainfall totals at the twogages averaged 51 percent of normal. Thus, antecedentsoil moisture was probably higher in the Waiakea high-rainfall area than in the Kapapala high-rainfall area.
During the November 1–2, 2000 storm, rainfalltotals of as much as 38.97 in. in the Kapapala high-rain-fall area and 32.47 in. in the Waiakea high-rainfall areawere recorded (Kapapala Ranch and Mountain ViewNWS gages). Lines of equal rainfall shown in figure 1(Paul Haraguchi, consulting meteorologist, writtencommun., 2001) depict the spatial distribution of totalrainfall for the November 1–2, 2000 storm. Haraguchi(consulting meteorologist, written commun., 2001)summarized daily rainfall totals at 39 gages and hourlyrainfall totals at 11 gages that were used to develop therainfall map. Two distinct storm centers with greaterthan 30 in. of rainfall can be seen in figure 1. TheWaiakea high-rainfall area 30-in. rainfall line extendssouthwest from near Hilo Airport to Glenwood. TheKapapala high-rainfall area 30-in. rainfall line is cen-tered near Kapapala Ranch.
One of the distinguishing characteristics of theNovember 1–2, 2000 storm was that most of the rain fellin periods of only 24 hours in duration. Plots of provi-sional, hourly rainfall data from the NWS KapapalaRanch and Waiakea Uka stations depict the temporalpattern of rain during this storm (fig. 4). The mostintense rainfall at the Kapapala Ranch station (in the
Kapapala high-rainfall area) was during a 6-hour periodthat extended from 0600 to 1200 hours on November 2.During this 6-hour period, hourly rainfall totals rangedfrom 3.02 to 4.15 in. The most intense rainfall at theWaiakea Uka station (in the Waiakea high-rainfall area)was during a 4-hour period from 2200 hours on Novem-ber 1 to 0200 hours on November 2. During this 4-hourperiod, hourly rainfall totals ranged from 2.57 to 3.24in.
The temporal distribution of storm rainfall was dis-tinctly different in the Waiakea and Kapapala high-rainfall areas. Peak-rainfall intensities occurred muchlater in the Kapapala high-rainfall area. As a result, theamount of rain that fell prior to the period of maximumintensity was much greater there. In the Waiakea high-rainfall area, as represented by the data for the WaiakeaUka station (fig. 4), the 4-hour period of most intenserainfall occurred 14 hours after the beginning of thestorm. A total of 6.65 in., or 21 percent of the total-storm rainfall of 30.89 in., fell prior to the period ofmost intense rainfall. A total of 12.83 in., or 42 percentof the total-storm rainfall, fell after the period of mostintense rainfall. In the Kapapala high-rainfall area, asrepresented by the data for the Kapapala Ranch station(fig. 4), the 6-hour period of most intense rainfalloccurred 22 hours after the storm began. A total of13.73 in., or 35 percent of the total-storm rainfall of38.97 in., fell prior to the period of most intense rainfall.A total of 2.99 in., or 8 percent of the total-storm rain-fall, fell after the period of most intense rainfall.
Maximum rainfall totals and recurrence intervalsfor selected durations for the November 1–2, 2000storm are summarized in table 1. Rainfall frequencydata are discussed in the next section. The maximumrainfall totals shown in table 1 can be used to furthercontrast the Waiakea and Kapapala high-rainfall areas.The only rain gage in table 1 that is located in the Kapa-pala high-rainfall area is the Kapapala Ranch gage.Maximum rainfall totals for durations of 1, 3, 6, 12, and24-hours at the Kapapala Ranch gage were higher thanall but one value recorded at each of the other gages intable 1, the exception being the maximum 1-hour rain-fall total of 4.56 in. at Hilo Airport. The maximum 3-and 6-hour rainfall totals of 12.25 and 22.25 in. at Kapa-pala Ranch were 25 and 48 percent greater than maxi-mum totals for those durations at any of the other gages.These data indicate that, for the most part, maximumrainfall intensities were greater in the Kapapala high-
8 Streamflow and Erosion Response to Prolonged Intense Rainfall of November 1-2, 2000, Island of Hawaii, Hawaii

Storm Characteristics 9
Figure 4. Graph showing hourly rainfall totals for November 1–2, 2000 at Waiakea Uka and Kapapala Ranch,island of Hawaii, Hawaii. (Provisional data from the National Weather Service)
8 10 12 14
NOVEMBER 1 NOVEMBER 2
16 18 20 22 24 2 4 6 8 10 12 14 16 18
DATE AND TIME IN HOURS
Waiakea Uka
0
0.5
1.0
1.5
2.0
2.5
3.0
3.5
8 10 12 14
NOVEMBER 1 NOVEMBER 2
16 18 20 22 24 2 4 6 8 10 12 14 16 18
DATE AND TIME IN HOURS
RAIN
FALL
, IN
INCH
ES
Kapapala Ranch
0
0.5
1.0
1.5
2.0
2.5
3.0
3.5
4.0
4.5
RAIN
FALL
, IN
INCH
ES

Table 1. Maximum rainfall totals and recurrence intervals for selected durations, November 1–2, 2000 flood, island ofHawaii, Hawaii[Provisional data from the National Weather Service, Honolulu, Hawaii; >, greater than; rain gage locations are shown in figure 1]
National WeatherService rain gage
Depth (inches)/Recurrence interval (years)
1 hour 3 hours 6 hours 12 hours 24 hours
Piihonua 3.35/1 8.67/10 14.15/25–50 20.44/50–100 24.73/50–100
Hilo Airport 4.56/5–10 9.78/50–100 13.21/50–100 22.55/>100 26.89/>100
Waiakea Uka 3.24/1 8.78/10–25 15.02/50–100 23.90/>100 29.11/>100
Mountain View 3.31/2 8.56/25–50 13.24/50–100 19.28/>100 29.75/>100
Glenwood 2.32/1 6.24/5–10 10.78/25 17.51/100 26.60/>100
Pahoa 2.76/1 5.73/2–5 9.90/25 14.33/50 16.03/25
Hawaii Volcanoes National Park
2.10/1 5.40/5 7.00/5 13.80/25–50 20.80/100
Kapapala Ranch 4.15/10 12.25/>100 22.25/>100 28.73/>100 37.02/>100
rainfall area than they were in the Waiakea high-rainfallarea.
Rainfall Frequency
The severity of rainfall events, both in terms oftotal rainfall and intensity, can be quantified through theuse of rainfall-frequency data. Frequency data are com-monly expressed in terms of recurrence intervals inyears. The recurrence interval is approximately theaverage period of time between events that are greaterthan or equal to a specified value. For example, an eventwith a recurrence interval of 50 years is one that has arainfall total expected to be equaled or exceeded, overthe long term, an average of once every 50 years. Recur-rence intervals are computed for rainfall totals that fallwithin specified durations or time intervals.
Recurrence intervals associated with maximumrainfall totals for selected durations of time for theNovember 1–2, 2000 storm are summarized in table 1.Recurrence interval data in table 1 were based on ana-lyses contained in Technical Paper 43 published by theU.S. Weather Bureau (1962).
Recurrence interval data summarized in table 1indicate that for durations of 1-hour, the maximum rain-fall intensities recorded during the November 1–2, 2000flood were not extreme. With the exception of theKapapala Ranch and Hilo Airport data, where 5 to 10year recurrence intervals were found, maximum 1-hourrainfall totals were of a magnitude that would beexpected to occur every 1 to 2 years on average. Theseverity of the November 1–2, 2000 storm, as measured
by rainfall recurrence interval, increased as the durationof the time interval increased. Twenty-four hour rainfalltotals had recurrence intervals greater than or equal to100 years at six of the eight rain gages included intable 1.
DESCRIPTION OF FLOOD
Rainfall intensities of greater than 10 in/day can beexpected at least once a year somewhere in the State ofHawaii (Lee and Valenciano, 1986, p. 201). Flooding istherefore common throughout the State, particularly inareas such as the Waiakea and Kapapala high-rainfallareas (Harris and Nakahara, 1980; Haraguchi, 1980a;and Haraguchi, 1980b). In these areas, intense rainfall iscommon and most streams have small watersheds (lessthan 50 mi2) with very steep slopes. In combination,these factors produce significant volumes of runoff andshort response times.
Total flood damages associated with the Novem-ber 1–2, 2000 storm were estimated to be in excess of70 million dollars (Paul Haraguchi, consulting meteo-rologist, written commun., 2001). Travel in and aroundthe Waiakea and Kapapala high-rainfall areas wasbrought to a standstill as numerous bridges and streamcrossings were destroyed. Most notable among thedamaged crossings were the four bridges along High-way 11 near Pahala and the Komohana Street Bridgeover Alenaio Stream. Figure 5 is a picture taken at thesite of the former Highway 11 Bridge over KeaiwaStream, just north of Pahala, on November 3, 2000.
10 Streamflow and Erosion Response to Prolonged Intense Rainfall of November 1-2, 2000, Island of Hawaii, Hawaii

Figure 5. Photograph showing site of destroyed Highway 11 bridge over Keaiwa Stream near Pahala, Hawaii,November 3, 2000, island of Hawaii, Hawaii. Note person (circled) for scale.
In response to the extreme flooding and level ofdamage, the Governor of Hawaii declared the island ofHawaii a disaster area on November 4, 2000. Within aweek the island was declared a federal disaster area. Inthe sections that follow are summaries of the peak-flowdischarge and frequency, and rainfall-runoff data for theNovember 1–2, 2000 storm in the Waiakea and Kapa-pala high-rainfall areas.
Peak Flows
As part of this study, the U.S. Geological Surveycollected peak flow and/or erosion data at 41 sites to aidin the description of the flood. These 41 sites are listedin table 2 and their locations are shown in figures 2 and3.
Waiakea High-Rainfall Area
Peak flow and/or peak stage data were collected at11 sites in the Waiakea high-rainfall area. These sitesare listed in table 2 and their locations are shown in fig-ure 6. Included among the 11 sites are 8 active stream-
gaging stations, 2 discontinued stream-gaging stations,and 1 miscellaneous site. Of the eight active gaging sta-tions, only two are continuous record sites where stageand discharge data are collected at 15-minute incre-ments, and of the two, only one operated during theflood. The six remaining active stations are crest-stagegages where only measurements of peak stage and peakdischarge are available for the storm. Data collectionactivities at the one miscellaneous and two discontinuedsites were undertaken specifically for the study of thisflood.
Peak flow and stage data for the November 1–2,2000 flood in the Waiakea high-rainfall area are sum-marized in table 3. Also included in table 3 are the peri-ods of record at the gaging stations and the dates andmagnitudes of the previous peak flows of record. Recur-rence interval data in table 3 is discussed in the follow-ing section of the report.
A variety of hydraulic models and hydrologic tech-niques were utilized to compute peak stages and flowsat the 11 sites in the Waiakea high-rainfall area. Thepeak stage at site 7000 was determined by using
Description of Flood 11

12S
treamflo
w an
d E
rosio
n R
espo
nse to
Pro
lon
ged
Inten
se Rain
fall of N
ovem
ber 1-2, 2000, Islan
d o
f Haw
aii, Haw
aii
Remarks
rd peak stage measurement
peak discharge from slope-areameasurement
peak discharge from slope-areameasurement
bank erosion near gage; peak dis-charge from slope-area measure-ment
peak discharge from rating
rd peak discharge from rating;streambank landslide near gage
peak discharge from rating
peak discharge from flow throughculvert measurement
peak discharge from ratingpeak discharge from flow through
culvert measuremente peak discharge from critical-depth
measurementbank erosion at gage; peak
discharge from flow throughculvert measurement
bank erosion upstream; peak dis-charge from critical-depth mea-surement
above channel headcut; peak dis-charge from critical-depth mea-surement
peak discharge from critical-depthmeasurement
peak discharge from critical-depthmeasurement
peak discharge from critical-depthmeasurement
upstream of site 30; peak dischargefrom critical-depth measurement
downstream of site 29downstream of site 35
Table 2. Peak-flow and erosion measurement sites for November 1–2, 2000 flood, island of Hawaii, Hawaii
Site USGS Peak flow Erosionnumber Station name Station typestation number data data(figs. 2 and 3)
7000 16700000 Waiakea Stream near Mountain View No No abandoned continuous-recostreamgage
7013 16701300 Waiakea Stream at Hilo Yes No crest-stage gage
7014 16701400 Palai Stream at Hilo Yes No crest-stage gage
7016 16701600 Alenaio Stream at Hilo Yes No crest-stage gage
7040 16704000 Wailuku River at Piihonua Yes No active continuous-recordstreamgage
7130 16713000 Wailuku River at Hilo Yes No abandoned continuous-recostreamgage
7170 16717000 Honolii Stream near Papaikou Yes No active continuous-recordstreamgage
7174 16717400 Kalaoa Mauka Stream near Hilo Yes No crest-stage gage
7176 16717600 Alia Stream near Hilo Yes No crest-stage gage7176.5 16717650 Kapehu Stream near Pepeekeo Yes No crest-stage gage
7700 16770000 Hionamoa Gulch at Pahala Yes No abandoned crest-stage gag
7705 16770500 Paauau Gulch at Pahala Yes No active continuous-recordstreamgage
2 191822155281601 Waihaka Stream at altitude 3,230 feet near Yes No miscellaneousPahala
13 191702155271301 Waihaka Stream at altitude 2,290 feet near Yes No miscellaneousPahala
18 191744155273001 Waihaka Stream at altitude 2,740 feet near Yes No miscellaneousPahala
21 191616155282601 Waiakaloa Gulch at Wood Valley Camp Yes No miscellaneous
27 191209155282301 Paauau Stream below Highway 11 at Pahala Yes No miscellaneous
28 none none No Yes miscellaneous29 192228155224201 Unnamed Gulch above Peter Lee Road near Yes No miscellaneous
Wood Valley30 none none No Yes miscellaneous31 none none No Yes miscellaneous32 none none No Yes miscellaneous33 none none No Yes miscellaneous

Descrip
tion
of F
loo
d13
inued
Remarks
peak discharge from critical-depthmeasurement
upstream of site 31; peak dischargefrom critical-depth measurement
peak discharge from critical-depthmeasurement
peak discharge from critical-depthmeasurement
peak discharge from critical-depthmeasurement
Table 2. Peak-flow and erosion measurement sites for November 1–2, 2000 flood, island of Hawaii, Hawaii--Cont
Site USGS Peak flow Erosionnumber Station name Station typestation number data data(figs. 2 and 3)
34 192326155215101 Unnamed gulch at altitude 3,530 feet Yes Yes miscellaneousKaoiki Pali near Volcano
35 192314155215901 Unnamed gulch at altitude 3,470 feet Yes No miscellaneousKaoiki Pali near Volcano
36a none none No Yes miscellaneous36b none none No Yes miscellaneous36c none none No Yes miscellaneous36d 192400155212101 Unnamed gulch at altitude 3,460 feet Kao- Yes Yes miscellaneous
iki Pali near Volcano37 none none No Yes miscellaneous38 none none No Yes miscellaneous39 none none No Yes miscellaneous40 none none No Yes miscellaneous41 none none No Yes miscellaneous42 none none No Yes miscellaneous45 none none No Yes miscellaneous46 none none No Yes miscellaneous47 192507155210401 Unnamed gulch at altitude 4,000 feet near Yes Yes miscellaneous
Volcano50 none none No Yes miscellaneous51 none none No Yes miscellaneous52 193940155073901 Waiakea Stream above Hoaka Stream at Yes No miscellaneous
Waiakea

Figure 6. Total rainfall in the Waiakea high-rainfall area, November 1–2, 2000 flood, island of Hawaii, Hawaii (rainfall linesfrom consulting meteorologist, Paul Haraguchi, written commun., 2001).
Gl
hi
7000
52
EXPLANATION
LINE OF EQUAL RAINFALL, IN INCHES
STREAMFLOW-GAGING STATION AND ABBREVIATED NUMBER
MISCELLANEOUS DISCHARGE MEASUREMENT SITE AND NUMBER
WATERSHED BOUNDARY
155˚20' 155˚10'155˚30'
19˚40'40'
19˚330'
19˚550
0
0
5 MILES
5 KILOMETERS
5
10
15
25
7176.5
63
7014
10
MAUNA LOA
MAUN
14 Streamflow and Erosion Response to Prolonged Intense Rainfall of November 1-2, 2000, Island of Hawaii, Hawaii
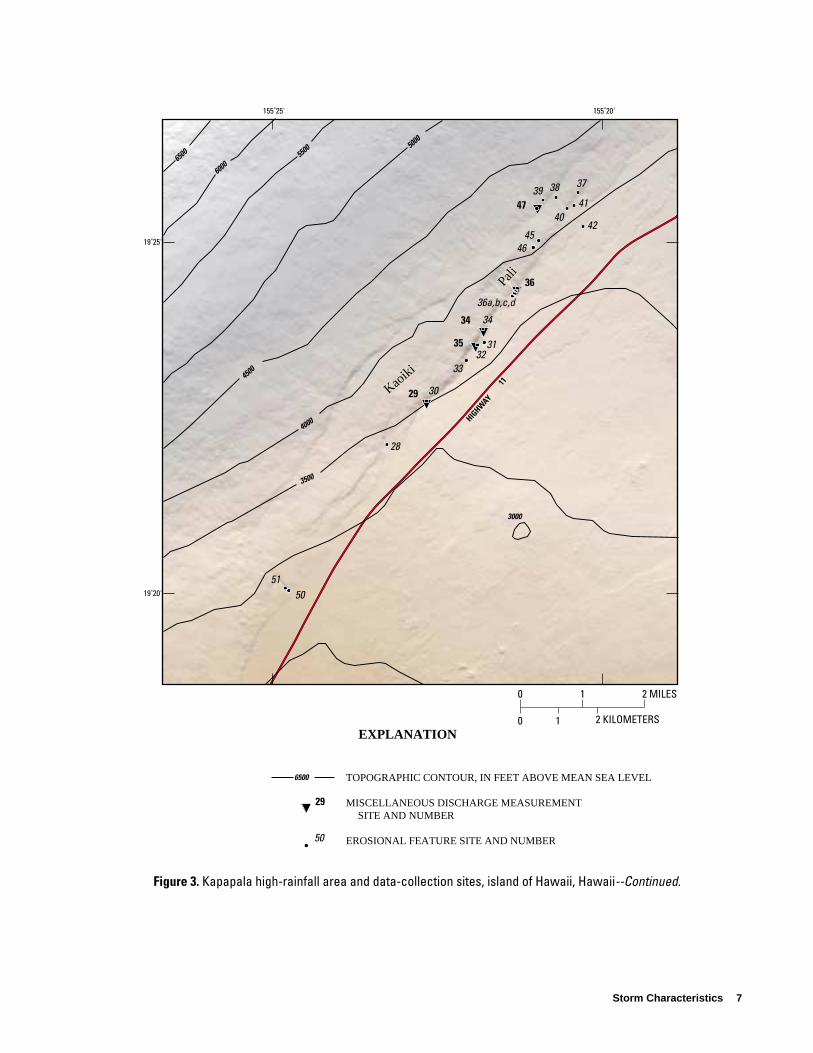
Figure 7. Total rainfall in the Kapapala high-rainfall area, November 1–2, 2000 flood, islandof Hawaii, Hawaii (rainfall lines from consulting meteorologist, Paul Haraguchi, writtencommun., 2001).
7705
27
0
0
5 MILES
5 KILOMETERS
EXPLANATION
LINE OF EQUAL RAINFALL, IN INCHES
STREAMFLOW-GAGING STATION AND ABBREVIATED NUMBER
MISCELLANEOUS DISCHARGE MEASUREMENT SITE AND NUMBER
WATERSHED BOUNDARY
155˚20'155˚40'
19˚20'
19˚10'
155˚30'
5105 25
13
8
34
47
15
KILAUEA
MAUNA LOA
differential leveling techniques to refer a flagged high-water mark to the stage datum used at the gage. Critical-depth techniques (Barnes and Davidian, 1978, p. 189)were used to compute the peak flow at site 52. Use ofthe critical-depth technique to compute peak flows wasvalidated by Jarrett and England (2002). Slope-areatechniques (Fulford, 1994) were used to compute peakflows at sites 7013, 7014, and 7016. A calibrated stage-discharge rating curve (Rantz and others, 1982) wasused to compute peak flows at sites 7040, 7130, 7170,and 7176. Flow-through culvert computations (Fulford,
1998) were used to compute peak flows at sites 7174and 7176.5.
Record peak flows and/or stages were recorded at4 of the 11 sites including Waiakea Stream near Moun-tain View (site 7000), Waiakea Stream at Hilo (site7013), Palai Stream at Hilo (site 7014), and AlenaioStream at Hilo (site 7016). The four sites with newpeaks of record are all located in or close to the areaenclosed by the 30-in. rainfall line shown in figure 6. Atthe Waiakea Stream near Mountain View gage, the peak
Description of Flood 15

a Site number refers to the site numbers from table 2b Peak stage associated with the peak flow was 4.47 feetc Peak stage during the November 1-2, 2000 flood was 6.44 feet
Table 3. Peak flows and associated recurrence intervals for November 1–2, 2000 flood, and previous record peakflows, island of Hawaii, Hawaii[ft3/s, cubic feet per second; --, not available; >, greater than; P, operational as of 2002]
November 1–2, 2000Previous recordSite peak flow Date of Peak flow Recurrence
numbera (ft3/s) previous peak Period of peak-flow record (ft3/s) interval (years)
7000 310b 08/26/70 1930-95 --c >1007013 3,670 08/12/94 1968-75, 1979, 1993-P 5,760 707014 1,260 02/20/79 1965-71, 1979-80, 1994, 2001-P 1,580 507016 1,010 07/30/97 1997-P 6,300 --7040 80,200 08/11/40 1928-40, 1940-1947, 1948-P 40,700 107130 79,800 12/13/87 1977-79, 1980-95 75,000 107170 22,600 05/23/78 1911-13, 1967-P 14,300 57174 400 02/20/79 1963-67, 1973-76, 1978-79, 1985, 228 15
2001-P7176 2,850 02/20/79 1962-72, 1979, 1986, 1994-P 1,520 807176.5 3,320 02/20/79 1963-68, 1975, 1979, 1985-86, 1,900 30
1994-P7700 10,400 02/20/79 1963-80, 1985-86, 1994 11,400 257705 3,600 01/05/69 1963-79, 1994-98, 2001-P 4,480 15
01/08/752 -- -- none 7,150 --
13 -- -- none 11,600 --18 -- -- none 8,920 --21 -- -- none 5,500 --27 -- -- none 7,180 --29 -- -- none 530 --34 -- -- none 54 --35 -- -- none 229 --
36d -- -- none 145 --47 -- -- none 262 --52 -- -- none 6,420 --
discharge was not determined; however, the peak stagefrom this flood (6.44 ft) was 1.97 ft higher than the peakstage for the period of record (1930 to 1995). Peak flowat the Waiakea Stream at Hilo gage (site 7013) was 57percent higher than any peak there since 1968.Peak flow at the Palai Stream gage (site 7014) was 25percent higher than any peak there since 1965. Thesefindings were based on both published and unpublishedUSGS data collected at the gages.
The peak flow for the Alenaio Stream at Hilo gage(site 7016) was significantly higher than the previouspeak of record; however, records have been collected atthis site for only 5 years. Peak flows during the Novem-ber 1–2, 2000 storm at three sites north of Hilo (sites7174, 7176, and 7176.5) were on average 44 percent
lower than their previous peak flows of record (Febru-ary 20, 1979 flood; Harris and Nakahara, 1980).
Kapapala High-Rainfall Area
Peak flow data were collected at 12 sites in theKapapala high-rainfall area. These sites are listed intable 2 and shown in figure 7. The 12 sites include 1active stream-gaging station, 1 discontinued crest-stagegage, and 10 miscellaneous sites. No continuousrecords of discharge are available in the area becausesite 7705 (Paauau Gulch at Pahala) was inoperable dur-ing the November 1–2, 2000 flood. Data collectionactivities at the one discontinued site and the 10 miscel-laneous sites were undertaken specifically for the studyof this flood.
16 Streamflow and Erosion Response to Prolonged Intense Rainfall of November 1-2, 2000, Island of Hawaii, Hawaii
Peak-flow data for the November 1–2, 2000 floodin the Kapapala high-rainfall area are summarized intable 3. Also included in table 3 are the periods of recordat the gaging stations and the dates and magnitudes ofthe previous peak flows of record. Recurrence intervaldata in table 3 is discussed in the following section.Note that for the 10 miscellaneous sites in table 3, onlypeak flow data for the November 1–2, 2000 flood areincluded because there are no historical data for thesesites.
Several hydraulic models were used to computepeak flows at the 12 sites in the Kapapala high-rainfallarea. The peak flow at site 7705 was determined usinga combination of culvert and road overflow analyses(Fulford, 1998). Critical-depth techniques (Barnes andDavidian, 1978. p. 189) were used to compute peakflows for the remaining 11 sites.
Record peak flows took place at both of the sta-tions in the Kapapala high-rainfall area with historicinformation, Hionamoa Gulch at Pahala (site 7700) andPaauau Gulch at Pahala (site 7705). Peak flows at theHionamoa and Paauau gages were 10 and 24 percenthigher than the previous peaks of record at the gagessince 1963. These findings were based on both pub-lished and unpublished USGS data collected at thegages. The two sites with new peaks of record are closeto the area enclosed by the 30-in. rainfall line shown infigure 7.
Attempts were made to determine peak flows forKeaiwa, Kaalaala, and Piikea Gulches near Highway 11(fig. 3). At each of these locations, bridges were heavilydamaged or destroyed during the flood. Unfortunatelyno suitable sites were found where flood hydraulicmodels could be applied. At each of these locations theflow broke into multiple channels and in many placescreated new ones. Peak flow determinations of 7,360cubic feet per second (ft3/s), 6,460 ft3/s, and 6,920 ft3/swere made at Keaiwa, Kaalaala, and Piikea Gulches,respectively, after the February 20, 1979 flood (Harrisand Nakahara, 1980, p.12). Given that (1) maximumstorm total rainfall in this area during the 1979 floodwas 26.80 in. (Harris and Nakahara, 1980, p. 8) whilethe maximum recorded during the November 1–2, 2000flood was 38.97 in. and (2) peak flows at the two his-toric stream gages in the area (sites 7700 and 7705) hadsignificantly higher flows in 2000 compared with 1979,it is probably reasonable to assume that peak flows atthese sites during the November 2000 flood were higherthan those determined for the February 20, 1979 flood.
Peak-Flow Frequency
As explained in the section on rainfall frequency,the recurrence interval of a given peak flow is a measureof the average number of years between floods withflows that equal or exceed it. For example, the 100-yearpeak flow is one that would be equaled or exceeded,over the long term, an average of once every 100 years.This does not imply that floods will take place at regularintervals: two 100-year floods could take place withinthe same year, or 100 years could pass without a single100-year flood. Another way to view the recurrenceinterval is to take its reciprocal (for example 100 yearbecomes 1/100 or 0.01), which yields the annualexceedance probability. In this case, a 100-year floodhas an annual exceedance probability of 0.01, or a 1 per-cent chance of occurring or being exceeded in any givenyear.
In this study, Log Pearson type III procedures, asdescribed by the Interagency Advisory Committee onWater Data in Bulletin 17B (1982) were used to com-pute frequency curves for each of the data collectionsites (table 3) that have a minimum of 10 years ofrecord. These frequency curves were then used to esti-mate recurrence intervals for the November 1–2, 2000flood. When computing frequency curves, the stationskew was weighted with a generalized skew coefficientof –0.05 (Interagency Committee on Water Data, 1982,p. 12) and where available, historic information wasused to extend the effective length of record (Inter-agency Committee on Water Data, 1982, app. 6). His-toric record lengths were based on published andunpublished USGS records available for the sites aswell as those for adjacent sites. When available, theNovember 1–2, 2000 peak discharge was included inthe frequency analyses. None of the sites where fre-quency analyses were run have peak discharges affectedby reservoirs. No trends were detected in any of theannual peak flow series; therefore, all were treated asbeing homogeneous. In general, the higher a given peakflow is relative to the historic peak flows at a site, thehigher the recurrence interval. In this respect, recur-rence intervals computed for the November 1–2, 2000flood are also a reflection of the past flooding history ata site.
Description of Flood 17

Waiakea High-Rainfall Area
Sufficient historic records were available for 9 ofthe 11 data sites in the Waiakea high-rainfall area tocompute recurrence intervals for the November 1–2,2000 flood. The recurrence interval data are shown intable 3. The recurrence interval for the November 1–2,2000 flood on Waiakea and Palai Streams (sites 7000,7013, and 7014) ranged from 50 to greater than 100years. An exact recurrence interval was not shown forsite 7000 because the peak flow for the November 1–2,2000 storm could not be determined. The peak flow wasknown to be significantly greater than that associatedwith the highest point on the stage-discharge ratingcurve in effect when the station was last in operation(5.00 ft gage height is equivalent to 473 ft3/s) becausethe peak stage for the November 1–2, 2000 flood was6.44 ft and the stage-discharge rating was unlikely tohave changed significantly since 1995. The peak-flowfrequency curve computed for site 7000 indicated that a100-year flood has a discharge of about 440 ft3/s, thus agreater-than-100-year recurrence interval shown intable 3. No recurrence interval was shown for site 52because this is a miscellaneous site with no historicdata. No recurrence interval was shown for site 7016because there are only 5 years of historic data available.On the basis of the locations of sites 52 and 7016 and therecurrence interval computed for adjacent sites, theNovember 1–2, 2000 flood probably had a recurrenceinterval between 50 and 100 years at those locations.
At sites on the Wailuku River and Honolii Stream(sites 7040, 7130, and 7170) the recurrence intervalswere 5 to 10 years. At each of these sites there were sev-eral historic peak flows that were greater than theNovember 1–2, 2000 flood. For example, in 73 years ofrecord at site 7040, the November 1–2, 2000 peak flowof 40,700 ft3/s was exceeded by five annual peak flows,with the highest being 80,200 ft3/s in August 1940.
At sites on three small streams north of Hilo, (sites7174, 7176, and 7176.5) the recurrence intervals were15, 80, and 30 years, respectively. The recurrence inter-val of 80 years for Alia Stream (site 7176) appears to besomewhat of an outlier; however, given the data col-lected over the 40-year historic period of record at thesite, the computation is reasonable. At Alia Stream thetwo highest peaks of record are 2,850 ft3/s and 1,520ft3/s (February 1979 and November 2000 floods) whilethe third highest peak was only 560 ft3/s (April 1986flood). The 1979 and 2000 peak flows are 5.1 and 2.7times greater than any previous peak flow recorded at
Alia Stream in 40 years. As noted earlier, the higher agiven peak flow is relative to the historical peak flows,the higher the recurrence interval. At Alia Stream, boththe 1979 and 2000 floods are significantly higher thanthe other historic peak flows, therefore the statisticalfrequency analyses show them to have high recurrenceintervals.
Kapapala High-Rainfall Area
Only 2 of the 12 sites in the Kapapala high-rainfallarea had sufficient historic data to compute recurrenceintervals for the November 1–2 flood. These were site7700 on Hionamoa Gulch at Pahala and site 7705 onPaauau Gulch at Pahala. Recurrence intervals were rea-sonably consistent and were 25 years for site 7700 and15 years for site 7705 (table 3). The remaining 10 siteswere miscellaneous sites with no historic data.
Rainfall-Runoff Relations
The relations between the rainfall that fell duringthe storm of November 1-2, 2000, and the runoffresponses of streams in the Waiakea and Kapapalahigh-rainfall areas are examined in this section of thereport. Improving our understanding of flooding pro-cesses in these areas is important for those living nearbyand for county, state, and federal officials who mustplan for the recurrence of damaging floods.
The process of flood generation or productioninvolves a complex interaction of atmospheric inputs,geology and geomorphology, vegetation and soils, andhuman influences (Pilgrim and Cordery, 1992, p. 9.1).The relatively young and evolving nature of the bedrock(Stearns and Macdonald, 1946) and the extreme spatialvariation of rainfall (figure 1) in the study area furthercomplicate the process.
A simplistic, yet useful way to consider rainfall-runoff relationships can be found in the structure of therational method formula (Pilgrim and Cordery, 1992,p. 9.15),
q = F C i A, (1)
where:q is the flood peak flow,F is a unit’s conversion factor, which in English
units equals 1.008 and is generally omitted from the formula,
18 Streamflow and Erosion Response to Prolonged Intense Rainfall of November 1-2, 2000, Island of Hawaii, Hawaii

a Site numbers correspond to sites listed in table 2 and shown in figures 2 and 3b Values greater than 100 are considered unreasonable and likely result from errors in drainage area, rainfall intensities, or peak flow esti-
matesc Averages were computed from peak hourly rainfall at the Kapapala Ranch and Hawaii Volcanoes National Park gagesd Computed drainage area has a high degree of uncertainty owing to poorly defined drainage area boundariese Peak unit runoff is subject to error owing to the uncertainty in the computed drainage area
Table 4. Rainfall and runoff data for November 1–2, 2000 flood, island of Hawaii, Hawaii[mi2, square mile; ft3/s/mi2, cubic feet per second per square mile]
Peak-runoff ratio(peak unit runoff
Peak unit Peak hourly as percentage of Area-weightedSite Drainage area runoff rainfall Rain gage used peak hourly storm rainfall
numbera (mi2) (ft3/s/mi2) (inches) for peak rainfall rainfall) (inches)
7000 17.4 -- -- -- -- 23.17013 35.8 161 3.24 Waiakea 8 25.87014 5.08 311 3.24 Waiakea 15 30.07016 8.62 731 3.24 Waiakea 35 28.27040 230 168 3.35 Piihonua 8 8.97130 256 293 3.35 Piihonua 14 10.07170 11.6 1,230 3.35 Piihonua 57 17.17174 0.24 950 3.35 Piihonua 44 22.57176 0.58 2,620 3.35 Piihonua b121 22.57176.5 1.09 1,740 3.35 Piihonua 81 22.57700 9.31 1,220 4.15 Kapapala 46 26.97705 1.74 2,780 4.15 Kapapala 96 33.4
2 6.54 1,090 4.15 Kapapala 40 28.113 7.97 1,460 4.15 Kapapala 54 29.418 7.45 1,200 4.15 Kapapala 45 29.021 2.50 2,200 4.15 Kapapala 82 34.827 7.41 969 4.15 Kapapala 36 31.629 0.30 1,770 3.12 caverage 91 32.534 d0.01 e5,400 3.12 caverage b277 27.535 0.37 619 3.12 caverage 32 29.336d d0.05 e2,900 3.12 caverage b149 27.547 0.43 609 3.12 caverage 31 26.052 31.3 205 3.24 Waiakea 10 25.2
C is a dimensionless term that relates runoff torainfall,
i is the rainfall intensity, andA is the drainage area of the basin.
The rational formula is widely used to estimateflood flows in small basins and can be considered “anapproximate deterministic model representing the floodpeak” (Pilgrim and Cordery, 1992, p. 9.15). In this sim-plistic model, the C term incorporates most of the com-plexities referred to above. However, flood peak flow inthis model is directly correlated to drainage area of thebasin and rainfall intensity. The rainfall intensity termhas a time frame, which is considered to be the time ofconcentration for the basin or the time it takes water totravel from the most remote point in the basin to thepoint of interest. The rational method is not used for
computations in this report. The implication for thisstudy, derived from the rational method formula, is thatwhile total rainfall for a storm is an important factoraffecting total storm runoff, peak flows are more influ-enced by rainfall that fell over shorter periods of time.
To evaluate rainfall-runoff relations in the studyarea, peak-flow and recurrence-interval data from table3 along with rainfall-runoff data shown in table 4 wereused. Table 4 includes the drainage area, peak unit run-off, area-weighted storm rainfall, the most proximateNWS hourly rain gage and the maximum hourly rainfallrecorded at the gage during the November 1–2, 2000storm, and peak runoff ratios for each of the 22 siteswhere peak-flow data were collected. Watershedboundaries were digitized and geographic informationsystem (GIS) techniques were used to compute
Description of Flood 19

Figure 8. Scatterplot of peak-flow recurrence interval and area-weighted storm rainfall, November 1–2, 2000flood, island of Hawaii, Hawaii.
0
20
40
60
80
100
120
1050 15 20 25 30 35 40
AREA-WEIGHTED RAINFALL, IN INCHES
PEAK
-FLO
W R
ECUR
REN
CE IN
TERV
AL, I
N Y
EARS
Correlation coefficient = 0.335
watershed drainage areas in square miles. The water-shed boundaries are shown in figures 6 and 7. Peak unitrunoff is simply the peak flow rate at a location dividedby the drainage area upstream from it.
Area-weighted storm rainfall values were based onthe application of the isohyetal method (Linsley andothers, 1982, p. 71). Lines of equal storm precipitationwere overlain on a map showing watershed boundaries(figs. 6 and 7). The area-weighted rainfall was thencomputed for each site in table 4 by weighting the aver-age precipitation between successive rainfall lines bythe area between them, adding these values, and divid-ing the total by the total watershed drainage area (Fon-taine and Nielsen, 1994, p. 28). Average precipitationwithin the innermost rainfall lines was assigned thevalue of rainfall associated with the highest line.
The peak-runoff ratio was computed as the peakrunoff rate (in cubic feet per second converted to inchesof runoff per second) divided by the peak rainfall rate(in inches per second) and is expressed as a percent. Thepeak rainfall rate was taken to be the maximum hourlyrainfall from the closest NWS rain gage (provisionaldata from the NWS). The selected rain gages and theirpeak hourly rainfall intensities are shown in table 4. The
peak rainfall rate used in these computations shouldoptimally correspond to the time of concentration forthe watershed in question. In small (less than about 1mi2), intermediate (about 1–10 mi2), and large (greaterthan about 10 mi2) watersheds, the optimum peak rain-fall rates would be less than 1 hour, 1 to 3 hours, and 3hours or more, respectively. In this analysis, the 1-hourpeak rainfall rate was used for all sites, without any sig-nificant loss of accuracy because rainfall during theNovember 1–2, 2000 storm was characterized byextended periods of uniform, high intensity rainfall. Forexample, rainfall intensities for the maximum 3-hourdurations, at the four index stations used in the table 4computations, averaged 90 percent of the intensities forthe maximum 1-hour durations. In addition, rainfallintensities for durations of less than 1 hour were notavailable.
To explore the relationship between peak flowsand rainfall data, a scatterplot of peak-flow recurrenceinterval (table 3) compared with area-weighted stormrainfall (table 4) was prepared (fig. 8). As can be seen infigure 8, peak-flow recurrence intervals show little cor-relation with storm-total area-weighted rainfall (corre-lation coefficient is 0.335). For example, the four siteswith area-weighted storm rainfall totals of between 20
20 Streamflow and Erosion Response to Prolonged Intense Rainfall of November 1-2, 2000, Island of Hawaii, Hawaii

Figure 9. Piihonua hourly rainfall totals and Honolii streamflow data, November 1–2, 2000 flood, island of Hawaii, Hawaii.
0
0.5
1.0
1.5
2.0
2.5
3.0
3.5
4.0RA
INFA
LL, I
N IN
CHES
0
2000
4000
6000
8000
10000
12000
14000
16000
STRE
AMFL
OW, I
N C
UBIC
FEE
T PE
R SE
CON
D
RAINFALL, PIIHONUASTREAMFLOW, SITE NUMBER 7170
0 4
NOVEMBER 1 NOVEMBER 2
8 1612 20 24 4 8 12 16 20 24
DATE AND TIME
and 25 in. have recurrence intervals that range between15 and greater than 100 years. The lack of a correlationbetween peak-flow recurrence intervals and storm-totalrainfall indicates that peak flows are more stronglyinfluenced by shorter-duration rainfall totals.
Perhaps the best way to evaluate the relationsbetween peak flows and short-duration rainfall totals isto compare streamflow hydrographs with short-dura-tion rainfall that fell on the watershed area upstreamfrom the streamflow recording station. Unfortunately,during the November 1–2, 2000 flood, only one USGScontinuous-record gaging station was in operation andhourly rainfall data are currently only available forselected rain gages in the study area. Watershed-widerainfall intensity data from the NWS are not availablefor the November 1–2, 2000 flood at this time. Stream-flow data collected at 15-minute increments for Honolii
Stream (site 7170) are compared with the most proxi-mate NWS hourly rain-gage data (Piihonua) in figure 9.The data in figure 9 indicate that initially there was littlestreamflow response to rainfall. Between 1300 and1500 hours on November 1, 1.06 in. of rain fell, result-ing in the initial rise in the flow hydrograph whichpeaked between 1 and 2 hours later. The next rainfallpeak was the 1.58 in. of rain, which fell between 1900,and 2000 hours on November 1. Again the flowhydrograph started to rise about 2 hours later. At thispoint rainfall intensity and streamflow continued toincrease with both the rainfall and flow rates peakingbetween 2400 hours on November 1 and 0100 hours onNovember 2. After 0100 hours, both the rainfall andstreamflow rates fell significantly. The rainfall between0100 and 0200 hours on November 2 was 1.94 in.; how-ever, this rate was not sufficient to continue to increasestreamflow. This implies that the peak flow and
Description of Flood 21

response time at site 7170 was associated with the4-hour period of time that rainfall rates were greaterthan 1.94 in/hr (between 2100 hours on November 1and 0100 hours on November 2). The earlier responsetimes of 1 to 2 hours and this 4-hour duration of intenserainfall prior to a drop in the flow hydrograph impliesthat the time of concentration or critical rainfall dura-tion, for the November 1–2, 2000 storm, is somewherebetween 1 to 2 and 4 hours for this watershed. Again,given the limitations in the rainfall data, this is only anapproximation.
According to Benson’s (1962, p. 32) study of thecorrelation of peak flows and rainfall intensities, thebest results come from using rainfall intensities havingthe same recurrence intervals as the peak flows. There-fore, it could be assumed that another measure of timeof concentration or critical rainfall duration would beprovided by comparing the peak flow and maximumrainfall recurrence intervals from tables 1 and 3. Foreach site with a peak-flow recurrence interval in table 3,the most proximate rain gage was selected (table 4). Theminimum rainfall duration with a recurrence interval(table 1) that most closely matches the peak-flow recur-rence interval was then determined and summarized intable 5. For example, for site 7170, the critical rainfallduration is 1 to 3 hours while the analysis of thehydrograph (fig. 9) indicates the critical rainfall dura-tion was between 1 to 4 hours.
To compare peak-flow rates at a variety of siteswith differing drainage areas, it is best to use the peakunit-runoff rate (the peak flow rate divided by the drain-age area, table 4). A scatterplot of peak unit-runoff ratecompared with drainage area is shown in figure 10.Data for sites 34 and 36 were not included in figure 10because of uncertainties in their computed drainageareas. Data for sites 7040 and 7130, although consistentwith the generalized trend line shown, were notincluded in figure 10 because their drainage areas werean order of magnitude greater than those for the remain-ing sites. Data in figure 10 indicate that the peak unit-runoff rates generally decline with increasing drainagearea. High-intensity rainfall is more likely to extendover entire watersheds when those watersheds aresmall. In larger drainages, the timing and spatial distri-bution of high rainfall intensities are more likely to varythroughout the watersheds, therefore leading to peakrunoff rates that are not synchronized. Although thetrend of declining peak unit-runoff rates is clear, therelation is not strong enough (correlation coefficient is-0.444) to allow use of the data in figure 10 to make esti-mates of peak unit-runoff rates at sites where peak-flowcalculations were not made for the November 1–2, 2000flood.
Peak runoff ratios (table 4), in conjunction withsoil permeability data (Sato and others, 1973; SakuNakamura, Natural Resources Conservation Service,written commun., 2001), indicate that infiltration-excess (Horton) overland flow did not account for largeproportions of the peak flows. Peak streamflows repre-sented between 8 and 96 percent of peak rainfall for the19 sites where reasonable comparisons could be made,that is, at sites where peak-runoff rates were less than100 percent of peak-rainfall rates (table 4). The averagepeak-runoff ratio for the 19 sites was 43 percent. Peakstreamflow was more than 50 percent of peak rainfall at6 sites and more than 80 percent of peak rainfall at 4sites (table 4). These peak-runoff ratios are high in viewof the high infiltration rates in the study area. Perme-ability data for soils in the study area indicate that rain-fall intensities of at least 2.0 and up to 20.0 in/hr arenecessary to exceed infiltration rates and cause anyHorton overland flow. For many of the soils in the studyarea, permeability data indicate that rainfall intensitiesof 6.0 in/hr are required to generate Horton overlandflow. Actual maximum hourly rainfall intensitiesranged from 2.10 to 4.56 in. (table 1), so some Hortonoverland flow probably was generated during the storm
Table 5. Critical rainfall durations associated with peakflows for November 1–2, 2000 flood, island of Hawaii,Hawaii
Critical rainfallSite numbera duration (hours)b
7000 12
7013 6
7014 3–6
7040 3
7130 3
7170 1–3
7174 3
7176 12
7176.5 6
7700 1–3
7705 1–3
a Site numbers are listed in table 2 and shown in figures 2 and 3.b Minimum rainfall duration with a recurrence interval matching
the peak flow recurrence interval.
22 Streamflow and Erosion Response to Prolonged Intense Rainfall of November 1-2, 2000, Island of Hawaii, Hawaii

Figure 10. Relation between peak unit runoff and drainage area, November 1–2, 2000 flood, island of Hawaii,Hawaii.
0
500
1000
1500
2000
2500
3000
3500
0 40302010
DRAINAGE AREA, IN SQUARE MILES
PEAK
UN
IT R
UNOF
F,IN
CUB
IC F
EET
PER
SECO
ND
PER
SQUA
RE M
ILE
generalized trend line
on soils with permeabilities between 2.0 and 6.0 in/hr.However, the large areas with permeabilities greaterthan 6.0 in/hr probably contributed no Horton overlandflow because rainfall intensities were less than infiltra-tion rates. Therefore, the generally high peak-runoffratios (table 4) for watersheds with highly permeablesoils indicate that saturation overland flow and subsur-face stormflow probably contributed to peak flows.This conclusion is supported by field evidence ofrestricted areas of overland flow, and by subsurface per-meability data that indicate sharp decreases in perme-ability at shallow depths.
Waiakea High-Rainfall Area
In the description of the study area it was noted thatthe watersheds north of the Wailuku River lie on theslopes of Mauna Kea with its older, Hamakua Volcanicslava flows and the remaining sections of the Waiakeahigh-rainfall area lie on the slopes of Mauna Loa withits younger and often historic Kau Basalt lava flows.This geologic distinction is readily apparent when view-ing the rainfall-runoff data in table 4. Sites located onthe slopes of Mauna Kea have peak unit-runoff rates
and peak-runoff ratios that are four to five times higherthan those for sites located on the slopes of Mauna Loa.
Six sites have rainfall-runoff data for watershedson the slopes of Mauna Loa (sites 52, 7013, 7014, 7016,7040, and 7130). Peak unit-runoff values for the sixsites range from 161 to 731 cubic feet per second persquare mile (ft3/s/mi2) and average 311 ft3/s/mi2. Peak-runoff ratios range from 8 to 35 percent and average 15percent.
Four sites have rainfall-runoff data for watershedson the slopes of Mauna Kea (sites 7170, 7174, 7176,and 7176.5). Peak unit-runoff values for the four sitesrange from 950 to 2,620 ft3/s/mi2 and average 1,635ft3/s/mi2. The peak-runoff ratio for site number 7176(Alia Stream near Hilo) was computed to be greaterthan 100 percent, which implies that the maximum run-off rate from the watershed was greater than the maxi-mum rainfall rate that fell on it. With the exception ofunusual circumstances, such as dam failures, this is nota physical possibility and implies that one or more ofthe computations for this watershed were in error. ThePiihonua hourly rain gage, while located a significant
Description of Flood 23

distance from the Alia Stream watershed, was still theclosest site with hourly rainfall data for use in comput-ing the peak-runoff ratio. It is likely that differences inrainfall between that recorded at the Piihonua rain gageand that falling on the Alia Stream watershed existwhich would therefore render computations using thePiihonua rain gage data incorrect. Another possibility isthat there were errors in the computation of the peak-flow rate for the Alia Stream site. Excluding data forsite 7176, peak-runoff ratios for the three remainingsites range from 44 to 81 percent and average 61 per-cent.
The estimates of critical rainfall durations (table 5)for sites in the Waiakea high-rainfall area do not showany clear patterns. Critical durations for five of the ninesites located in the Waiakea high-rainfall area areapproximately 3 hours. The values of 12 and 6 hourscomputed for sites 7176 and 7176.5 do not appear rea-sonable and this could be attributed to the lack of aproximate hourly rain gage for these watersheds. Val-ues of 12 and 6 hours computed for sites 7000 and 7013in the Waiakea Stream watershed could be a function ofthe lower rates of runoff from that area. Watershedresponse time will be slower when higher percentagesof rainfall infiltrate into the ground.
Kapapala High-Rainfall Area
Rainfall-runoff data were computed for 12 sites inthe Kapapala high-rainfall area (table 4). Peak unit-run-off and peak-runoff ratios determined for sites 34 and36d were found to be unreasonable. As noted above,peak-runoff ratios greater than 100 percent are not prob-able in this area. Watersheds in the vicinity of sites 34and 36d are extremely poorly defined and errors in themeasurement of drainage areas for these sites are likely.Sites 34 and 36d were determined to have very smalldrainage areas (0.01 and 0.05 mi2) and therefore anymeasurement errors would lead to large percentage dif-ferences in the computations of areas and therefore peakunit-runoff and peak-runoff ratios. Rainfall-runoff datafor these sites are not used in the summary providedbelow.
Unlike the Waiakea high-rainfall area, no cleartrends were apparent in the rainfall-runoff data com-puted for the 10 sites in Kapapala high-rainfall area(table 4). Peak unit-runoff values range from 609 to
2,780 ft3/s/mi2 and average 1,390 ft3/s/mi2. Peak-runoffratios range from 31 to 96 percent and average 55 per-cent. Peak unit-runoff and peak-runoff ratios computedfor the Kapapala high-rainfall area are similar to butslightly lower than those computed for the area north ofthe Wailuku River in the Waiakea high-rainfall area.
Estimates of critical rainfall durations (table 5)were computed for only two sites in the Kapapala high-rainfall area (sites 7700 and 7705). For both sites, com-puted durations were 1 to 3 hours indicating the rapidresponse of peak-flow rates in these streams to periodsof peak-rainfall intensities. One factor that might havecontributed to this rapid response, noted in an earliersection of this report, is that the periods of maximumrainfall intensities in the Kapapala high-rainfall areatook place much later in the storm and after significantamounts of antecedent rainfall had already fallen (fig.2). This fact coupled with the higher rainfall intensitiesrecorded in the Kapapala high-rainfall area (table 1)could have contributed to faster response times.
An interesting pattern in computed peak unit run-off was noted for sites 2, 18, and 13 along WaihakaStream near Kapapala Ranch. As can be seen from thedata for these sites in table 4, proceeding downstreamfrom site 2, with a drainage area of 6.54 mi2, to site 18,with a drainage area of 7.45 mi2, to site 13, with a drain-age area of 7.97 mi2, peak unit runoff increased from1,090 to 1,460 ft3/s/mi2. This trend contrasts with thenormal pattern of declining peak unit runoff rates withincreasing drainage area (fig. 10). At these sites onWaihaka Stream, the increasing peak unit-runoff ratesare directly correlated to the fact that the area of maxi-mum storm rainfall, and most likely intensity, wascloser to site 13 and Kapapala Ranch. Another factor islikely to be land use in the area. As noted in the descrip-tion of the study area, most of the land above an altitudeof about 3,500 ft is forested. Site 2 on Waihaka Streamis at an altitude of 3,230 ft and therefore downstreamfrom that altitude the percentage of non-forested landarea in the watershed increases. Runoff from the non-forested lands would be higher because infiltration ratesthere would be lower (Dunne and Leopold, 1978,p. 167).
24 Streamflow and Erosion Response to Prolonged Intense Rainfall of November 1-2, 2000, Island of Hawaii, Hawaii

EROSIONAL FEATURES IN THEKAPAPALA HIGH-RAINFALL AREA
Erosional features attributed to the storm ofNovember 1–2, 2000 included both channel and hills-lope features. This report focuses on the hillslope fea-tures because of their relation to surface runoffgeneration processes (overland flow).
Hillslope erosional features included mass-wast-ing and fluvial (caused by flowing water) features, andsome features that showed evidence of both mass-movement and fluvial erosion (table 6). Hillslope fea-tures were observed along the Kaoiki Pali, between theKapapala Ranch and Kilauea Volcano (fig. 3). A fewsmall features also were noted above Wood Valley. Nohillslope features were observed southwest of WoodValley or northeast of site 47 (fig. 7) in Hawaii Volca-noes National Park.
Field visits were made to all hillslope featuresalong the Kaoiki Pali to collect information on the pro-cesses and materials contributing to the hillslope fail-ures and to measure representative dimensions of thefailures. These features had a variety of forms, but ingeneral, the features had well-defined headscarps belowthe top of the pali, steep sides, or banks, highly irregularscar surfaces, and deposits on the gentle slope at the footof the pali. Erosional features on ash deposits typicallyhad lobe-shaped lateral scarps along their banks thatappeared to be the result of mass wasting followingundercutting by fluvial erosion (fig. 11). Locations weredetermined by altimeter, compass bearings to mappedfeatures, and from examination of topographic maps.Except where precluded by steep slopes or unstablelandslide deposits, the headscarp of each failure wasexamined for signs of overland flow, including debrisdeposits, rill or channel cutting, and flattened leaves ofgrass oriented in the presumed direction of flow. Depos-its were examined to infer the extent to which they weretransported after the initial failures by flowing water.Failure scars were also examined for evidence of sub-surface flow, including macropore openings, depositsof fine sediment at ash-basalt contacts, persistent mois-ture, or moss growth at headscarps. Topographic slopeswere measured with an Abney level. Dimensions weremeasured with a range finder or fiberglass tape.
Hillslope erosional features included debris slides,debris flows, slumps, gullies, and features having char-
acteristics of both gullies and landslides (table 6). Alti-tudes at the tops of the erosional features ranged from2,640 to 4,020 ft. Topographic slopes at the tops of thefeatures ranged from 11 to 100 percent. Measuredlengths ranged from 20 to 668 ft, average widths rangesfrom 2.3 to 157 ft, and average depths ranged from 2.3to 9 ft (table 7). Measured volumes ranged from 51 to12,400 cubic yards (table 7). Of the 21 features visitedin the field, 8 occurred in ash deposits, 11 involvedbasalt interlayered with ash, and only two failuresoccurred in basalt without interlayered ash. Five of thefeatures did not have discernible evidence of overlandflow at their upslope ends. Evidence of overland flowwas found for the other 16 features.
Shear stresses computed for peak flows at or nearhillslope erosional features ranged from 2.47 to 42.6pounds per square foot (lb/ft2) and are summarized intable 8. Shear stress was computed as:
T = γds (2)
Where T is shear stress, in pounds per square foot,γ is the specific weight of water, in pounds per
cubic foot,d is maximum flow depth, in feet, ands is the topographic slope of the channel bed, in
feet per foot (Leopold and others, 1964,p. 157).
Depths were determined from cross-section sur-veys. Slopes were determined from cross-section sur-veys and measurements of distances between crosssections (sites 36 and 47), or were calculated from val-ues of discharge (Q), in ft3/s, and conveyance (K), inft3/s, computed for critical-depth flow measurements(sites 29, 34, and 35):
.SQK----
2= (3)
Slopes (S) computed using (3) are energy slopes, andunderestimate the bed slopes to an unknown degree.
The computed shear stresses are at or above thecritical shear stresses required to initiate channels onungrazed grass-covered valley floors (Prosser andSlade, 1994; Prosser and Dietrich, 1995; Prosser andAbernathy, 1996) and are substantially higher than thecritical shear stresses required to erode grassy valleyfloors under simulated grazing that would be more rep-resentative of actual field conditions along the Kaoiki
Erosional Features in the Kapapala High-Rainfall Area 25

Table 6. Hillslope erosional features along the Kaoiki Pali resulting from the November 1–2, 2000 flood, island ofHawaii, Hawaii[--, not determined]
Sitenumbera Type of feature
Altitude atheadscarp
(feet)Hillslope gradient
(percent) Geologic materialsEvidence foroverland flow
28
30
31
32
33
34
36a
36b
36c
36d
37
38
39
40
41
42
45
46
47
50
51
debris flow
debris flow/gully
debris slide
debris slide
debris slide
debris flow/gully
slump/gully
gully
slump
gully
slump/gully
gully
gully
gully
slump/gully
debris slide
debris flow/gully
debris flow
gully
debris slide
gully
3,030
3,250
3,350
3,440
3,410
3,530
3,360
3,420
3,430
3,460
3,880
3,890
4,020
3,740
3,720
3,590
3,810
3,810
4,000
2,640
2,640
40
29
12
50
80
75
25
33
33
17
33
11
18
14
20
--
17
18
27
100
100
basalt/ash
basalt/ash
basalt
basalt/ash
basalt/ash
basalt/ash
ash
ash
ash
basalt/ash
ash
ash
basalt/ash
basalt/ash
basalt/ash
basalt
ash
basalt/ash
basalt/ash
ash
ash
Yes
Yes
Yes
No
No
Yes
Yes
Yes
Yes
Yes
Yes
Yes
Yes
Yes
Yes
No
Yes
No
Yes
No
Yes
a Site numbers are listed in table 2 and shown in figure 4.
Pali (Prosser and Slade, 1994; Prosser and Dietrich,1995; Prosser and Abernathy, 1996). The peak flowsalong the Kaoiki Pali, therefore, appear to have exertedsufficient shear stresses to initiate the observed hillslopeerosional features.
Previous studies (Prosser and Slade, 1994; Prosserand Dietrich, 1995; Prosser and Abernathy, 1996) haveshown that a shear stress of about 0.52 lb/ft2 is sufficientto erode a grazed grass-covered valley floor. Substitut-ing a value of 0.52 lb/ft2 in (2) and rearranging to solvefor d at the sites listed in table 8 gives a range of 0.04 to0.76 ft of depth corresponding to the critical shearstress. Flow depths less than this range would not belikely to initiate erosion. Thus, the maximum flowdepths at locations where erosion did not occur werelikely less than 0.76 ft, even in swales and other topo-graphic depressions that would tend to concentrateflow. Substantial amounts of overland flow thereforewere probably restricted to locations where erosion wasobserved. Widespread overland flow with depths of
greater than a few tenths of a foot probably did notoccur. This observation supports the peak runoff ratioanalysis presented earlier, which indicated the possibil-ity of major contributions of subsurface storm flow topeak flows.
Collapse features above lava tubes were noted inseveral locations at the foot of the pali. Field evidenceindicates that many of these features intercepted surfacerunoff. No evidence of discharge of subsurface flowfrom lava tubes was found.
Evidence of previous erosional episodes along theKaoiki Pali was found in a few locations. Near site 34(fig. 3), previously unmapped alluvium was foundexposed at one of the collapse features described above,indicating possibly two earlier periods of fluvial erosionand deposition in the unchanneled area. A tree exposedin the landslide scar at site 36 (fig. 3), had two distinctsets of roots, one about 4 ft higher than the other, indi-cating burial in an earlier erosional episode and subse-quent exhumation in the storm of November 1–2, 2000.
26 Streamflow and Erosion Response to Prolonged Intense Rainfall of November 1-2, 2000, Island of Hawaii, Hawaii

Figure 11. Hillslope erosional feature at site 47 along Kaoiki Pali, showingevidence of both fluvial and mass-wasting erosion, island of Hawaii,Hawaii.
fluvial
mass-wasting
Table 7. Dimensions of selected hillslope erosional features along the Kaoiki Pali resulting from theNovember 1–2, 2000 flood, island of Hawaii, Hawaii[--, not determined; (e), estimated; max., maximum width reported in place of average width]
Site Horizontal length Average width Average depth Volumenumbera (feet) (feet) (feet) (cubic yards)
28 306 72 9 7,34030 668 -- -- --30.1 262 2.3 2.3 5131 163 105 8 5,07032 355 157 6(e) 12,40033 180 40 -- --34 420 20 5(e) 1,56036a 131 72 (max.) -- --36b -- -- -- --36c 91 66 (max.) -- --36d 142 75 (max.) -- --37 253 -- -- --50 20 35 -- --51 -- 8 -- --
a
Site numbers are listed in table 2 and shown in figure 4Erosional Features in the Kapapala High-Rainfall Area 27

a Site numbers are listed in tables 1 and 2 and shown in figure 3; site29 is upstream of site 30
b Channel bed slope estimated from hydraulic model computationsc Channel bed slope measured in the field
Several fissures or cracks were observed near site35 along the top of the Kaoiki Pali. These cracks are notnecessarily related to the storm of November 1–2, 2000,but they appear to be recent based on “bridges” of livegrasses that span the cracks. These cracks indicate thepossibility of future large and rapid mass-movementfailures along the Kaoiki Pali. Hummocky deposits nearsite 36 (fig. 3) may have resulted from earlier such fail-ures.
In addition to the hillslope failures associated withthe storm, major channel widening and deepeningoccurred on many streams in the Kapapala high-rainfallarea, and many completely new channels were cutwhere existing channels lacked the capacity to conveythe storm runoff owing to low channel conveyance orblockage by debris or engineered structures. One suchchannel, Waihaka Stream at the Kapapala Ranch, waseroded to a depth of about 40 ft. Channel deepening andwidening followed a pattern similar to that of the dis-continuous gullies described in the southwest U.S. byLeopold and others (1964); headcuts and plunge poolswere created where resistant lava prevented downcut-ting upstream but easily-eroded ash allowed downcut-ting downstream (fig. 12). Downstream from headcuts,channel depth and bank height decreased until peakflows were able to overtop banks, leading to cutting ofmore new channels on previously unchanneled hills-lopes. Channel cutting was apparently enhanced bothby the low resistance of the Pahala Ash to erosion bysurface water and the youthful age of the landscape,which has poorly developed drainage and only minortopographic divides between stream basins.
A detailed investigation of the extent and magni-tude of channel erosion related to the storm of Novem-ber 1–2, 2000, is beyond the scope of this report.However, near site 2 (fig. 3), an attempt was made toestimate the amount of channel widening by measuringthe maximum lengths of the roots of ohia trees exposedalong the channel banks. These measurements indicatedabout 20 ft of erosion on each bank. This estimate isconsistent with anecdotal information on the wideningof the channel at the nearby ranch pipeline crossing,which was destroyed during the storm and rebuilt inDecember 2000 (Gordon Cran, Kapapala Ranch, oralcommun., 2001).
Channel erosion appeared to be much more exten-sive during the storm of November 1–2, 2000, than inother recent storms that were of only slightly smallermagnitude. The extensive channel erosion during thestorm of November 1–2, 2000, may have been a resultof the long duration of intense rainfall and high stream-flow (fig. 9), as suggested by Costa and O’Connor(1995) for study sites on the U.S. mainland.
Fewer erosional features were documented in theWaiakea high-rainfall area (Paul Haraguchi, consultingmeteorologist, written commun., 2001). These featuresincluded several landslides on coastal cliffs and stream-banks. Hillslope erosional features and channel erosiondid not occur to the same degree as in the Kapapalahigh-rainfall area possibly because the thick ash depos-its that are easily eroded by surface water do not occurin the Waiakea area.
SUMMARY AND CONCLUSIONS
The unique convergence of the upslope topogra-phy of eastern Hawaii, the location of a large upperlevel trough and remnants from tropical storm Paul, andthe pattern of tradewinds in the area combined to pro-duce extreme rainfall over parts of the island of Hawaiion November 1–2, 2000. Two distinct storm centersreceived rainfall in excess of 30 inches: the Waiakeaand the Kapapala high-rainfall areas. Most of the rainfell in a 24-hour period and maximum-recorded rainfallfor the entire storm in the Waiakea and Kapapala areaswas 32.47 inches at Mountain View and 38.97 inches atKapapala Ranch. The severity of the November 1–2,2000 storm, as measured by the recurrence interval ofthe rainfall, increased as the duration of the time inter-val increased. Maximum 1-hour rainfall totals had
Table 8. Shear stresses exerted by peak flows upstream ofhillslope erosional features along the Kaoiki Pali, November1–2, 2000 flood, island of Hawaii, Hawaii
Channel Shear stressSite Depth bed slope (pounds per
numbera (feet) (feet per foot) square foot)
29 3.6 b0.011 2.47
34 3.9 b0.015 3.64
35 5.1 b0.012 3.81
36 2.6 c0.125 20.5
47 3.1 c0.220 42.6
28 Streamflow and Erosion Response to Prolonged Intense Rainfall of November 1-2, 2000, Island of Hawaii, Hawaii

Figure 12. Headcut on Waihaka Stream between Kapapala Ranch and site 13,showing effect of resistant cap of lava above ash deposits, island of Hawaii,Hawaii.
lavaash
recurrence intervals of 10 years or less while most max-imum 24-hour rainfall totals had recurrence intervalsequal to or greater than 100 years.
Peak flow and/or erosion data were collected at 41sites to aid in the description of the flooding associatedwith the November 1–2, 2000 storm. New peak dis-charges of record occurred at six of the 12 sites wherehistoric data were available. The recurrence intervalsassociated with the peak discharges ranged between 50and 100 years for streams south of the Wailuku River inthe Waiakea high-rainfall area. The majority of theremaining streams in the study area had recurrenceintervals between 5 and 30 years. Peak unit-runoff rates
computed for 22 sites ranged from 161 to 5,400 cubicfeet per second per square mile of watershed area. Peakunit-runoff rates averaged 311 cubic feet per second persquare mile for the Wailuku River and streams to itssouth, in the Waiakea high-rainfall area. Peak unit-runoff rates in the remainder of the Waiakea and theKapapala high-rainfall areas were comparable and aver-aged 1,635 and 1,390 cubic feet per second per squaremile.
Analysis of rainfall-runoff relationships in thestudy area was complicated by the complex and evolv-ing nature of the geology and the extreme spatial varia-tion of the storm rainfall. Peak flows were found to be
Summary and Conclusions 29

poorly correlated to area-weighted storm rainfall andwere therefore more strongly influenced by shorter-duration rainfall totals. Comparison of peak streamflowand rainfall recurrence interval data indicated the criti-cal rainfall durations for the generation of peak flowsranged from 1 to 12 hours and were about 3 hours atmost sites. Peak-runoff rates divided by peak-rainfallintensities were found to average 43 percent at 19 sites.While maximum hourly rainfall intensities exceededinfiltration rates in parts of the study area, the overlandflow generated would not have been sufficient toaccount for the high peak-runoff rates. This findingindicates the saturation overland flow and subsurfaceflow probably contributed to peak flows at most sites.
Most hillslope erosion related to the stormoccurred along or near the Kaoiki Pali in the Kapapalahigh-rainfall area. The erosion was mostly caused byoverland flow and was associated with thick ash depos-its of the Kahuku Basalt.
REFERENCES CITED
Barnes, H.H., Jr., and Davidian, Jacob, 1978, Indirect meth-ods: chap. 5 in Hydrometry: Principles and Practices,Herschy, R.W., ed., New York, Wiley, p. 149–191.
Benson, M.A., 1962, Factors influencing the occurrence offloods in a humid region of diverse terrain: U.S. Geolog-ical Survey Water-Supply Paper 1580-B, 64 p., 1 pl.
Cervelli, Peter, Segall, Paul, Jonson, Kaj, Lisowski, Michael,and Miklius, Asta, 2002, Sudden seismic fault slip on thesouth flank of Kilauea volcano, Nature, v. 415,p. 1014–1018.
Costa, J.E., and O’Connor, J.E., 1995, Geomorphically effec-tive floods, in Costa, J.E., and others (eds.), Natural andAnthropogenic Influences in Fluvial Geomorphology,Geophysical Monograph 89, American GeophysicalUnion, p. 45–56.
Dunne, Thomas, and Leopold, L.B., 1978, Water in environ-mental planning: San Francisco, Calif., W.H. Freemanand Company, 818 p.
Fontaine, R.A., and Nielsen, J.P., 1994, Flood of April 1987in Maine: U.S. Geological Survey Water-Supply Paper2424, 50 p.
Freeze, R.A., 1974, Streamflow generation: Reviews of Geo-physics and Space Physics, vol. 12, p. 627–647.
Fulford, J.M., 1994, User’s guide to SAC, a computer pro-gram for computing discharge by slope-area method:U.S. Geological Survey Open-File Report 94-360, 31 p.
Fulford, J.M., 1998, User’s guide to the U.S. Geological Sur-vey culvert analysis program, version 97-08: U.S. Geo-
logical Survey Water-Resources Investigations Report98-4166, 70 p.
Giambelluca, T.W., Nullet, M.A., and Schroeder, T.A., 1986,Rainfall atlas of Hawaii: Hawaii Department of Land andNatural Resources Report R76, 267 p.
Haraguchi, Paul, 1980a, Storm of November 16–18, 1979,Island of Hawaii: Hawaii Department of Land and Natu-ral Resources Circular C82, 37 p.
Haraguchi, Paul, 1980b, Storms of March 16–19 and 23–24,1980, Islands of Hawaii and Oahu: Hawaii Departmentof Land and Natural Resources Circular C84, 24 p.
Harris, D.D., and Nakahara, R.H., 1980, Flood of February20, 1979 in Hilo, Kau, and Puna Districts, Island ofHawaii: Hawaii Department of Land and NaturalResources Circular C81, 28 p.
Interagency Advisory Committee on Water Data, 1982,Guidelines for determining flood flow frequency: WaterResources Council Bulletin 17B, 28 p., 14 app., 1 pl.
Jarrett, R.D., and England, J.F., Jr., 2002, Reliability ofpaleostage indicators for paleoflood studies in Water sci-ence application 5, ancient floods, modern hazards,American Geophysical Union, p. 91–109.
Langenheim, V.A.M., and Clague, D.A., 1987, Chap. 1 ofDecker, R.W., Wright, T.L., and Stauffer, R.H., eds.,Volcanism in Hawaii: U.S. Geological Survey Profes-sional Paper 1350, v. 1, p. 55–84.
Lee, Reuben, and Valenciano, Santos, 1986, Hawaii surface-water resources: in National Water Summary 1985—hydrologic events and surface-water resources,U.S. Geological Survey Water-Supply Paper 2300,p. 201–206.
Leopold, L.B., Wolman, M.G., and Miller, F.P., 1964, Flu-vial processes in Geomorphology: San Francisco, Calif.,W.H. Freeman and Company, 522 p.
Linsley, R.K., Jr., Kohler, M.A., and Paulhus, J.L.H., 1982,Hydrology for Engineers: New York, McGraw-Hill,508 p.
Pilgrim, D.H., and Cordery, Ian, 1992, Flood runoff, chap. 9in Maidment D.R., ed., Handbook of Hydrology: NewYork, McGraw-Hill, variously paged.
Prosser, I.P., and Abernathy, Bruce, 1996, Predicting thetopographic limits to a gully network using a digital ter-rain model and process thresholds: Water ResourcesResearch, v. 32, p. 2289–2298.
Prosser, I.P., and Dietrich, W.E., 1995, Field experiments onerosion by overland flow and their implication for a dig-ital terrain model of channel initiation: Water ResourcesResearch, v. 31, p. 2867–2876.
Prosser, I.P., and Slade, C.J., 1994, Gully formation and therole of valley-floor vegetation, southeastern Australia:Geology, v. 22, p. 1127–1130.
30 Streamflow and Erosion Response to Prolonged Intense Rainfall of November 1-2, 2000, Island of Hawaii, Hawaii

Rantz, S.E., and others, 1982, Measurement and computationof streamflow, Volume 1 and Volume 2: U.S. GeologicalSurvey Water-Supply Paper 2175, 631 p.
Sato, H.H., Ikeda, Warren, Paeth, Robert, Smythe, Richard,and Takehiro, Minoru, Jr., 1973, Soil Survey of theIsland of Hawaii, State of Hawaii: U.S. Department ofAgriculture, Soil Conservation Service, 115 p., 195sheets, 1 pl.
Stearns, H.T., and Clark, W.O., 1930, Geology and waterresources of the Kau District, Hawaii: U.S. GeologicalSurvey Water-Supply Paper 616, 194 p., 3 pl.
Stearns, H.T., and Macdonald, G.A., 1946, Geology andground-water resources of the island of Hawaii: HawaiiDivision of Hydrography Bulletin 9, 363 p., 3 pl.
U.S. Weather Bureau, 1962, Rainfall-frequency atlas of theHawaiian Islands: U.S. Bureau Technical Paper No. 43,Washington D.C., 60 p.
References Cited 31

32 Streamflow and Erosion Response to Prolonged Intense Rainfall of November 1-2, 2000, Island of Hawaii, Hawaii