streams: processes and landforms - inside minesinside.mines.edu/~cshorey/newfiles/lecture 15 -...
TRANSCRIPT

1
Streams:Processes and
Landforms

2
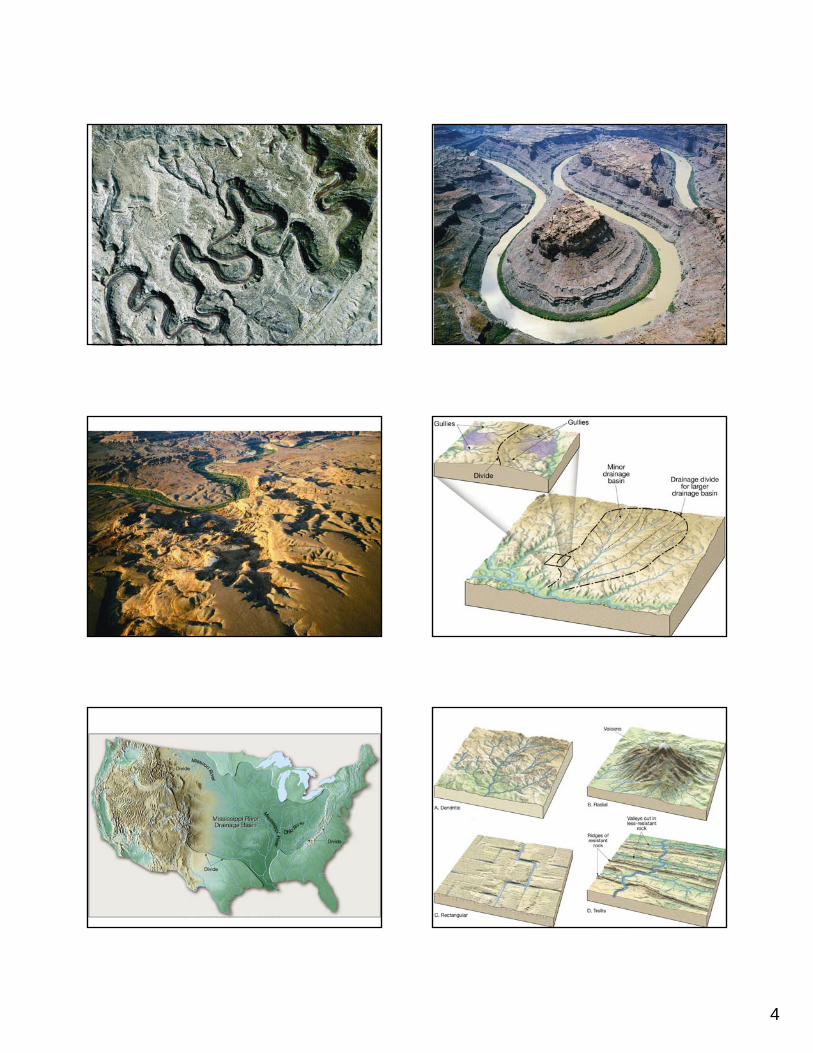
Result of uplifted
land
Map view Cross section
Young river
Middle aged river
Old aged river

3
Don’t build on the outside of a river bend!
4

5
Capacity and Competence• Stream capacity is the total
discharge of sediment the stream is transporting.–Bed, suspended, and dissolved load.
• Stream competence is the largest sized particle being moved by the stream.–Bed load material.

6

7
Stream Discharge (Q)• Q=WxDxV
–Q is discharge in volume/unit time (cfs, m3/s)
–W is width–D is average depth–V is average velocity
Flow velocity• Manning equation V=(1.49/n)R⅔S½
– n=Manning roughness coefficient– R=Hydraulic radius=A/P
• A is the cross-sectional area and P is the wetted perimeter
– S=slope of channel– C=Chezy coefficient (C) is a constant of
proportionality related to resisting factors in the system
Hydraulic radius (R)
• R=A/P• A=Cross sectional area of channel• P=Wetted perimeter of channel

8
R=A/P=10/12=0.833
R=A/P=10/7.9=1.266
Manning n• Assumes n is constant for a channel• Lumps many sources of resistance into
one though sometimes broken into :1. Free surface resistance (surface waves and
abrupt changes in water surface gradients)2. Channel resistance (undulations in channel
bed and banks and cross-section shape)3. Boundary resistance (grain roughness)
Manning roughness coefficients (n) for different boundary types
Boundary Manning n (ft1/6)Very smooth surfaces such as glass, plastic or brass 0.010Very smooth concrete and planed timber 0.011Smooth concrete 0.012Ordinary concrete 0.013Good wood 0.014Vitrified clay 0.015Shot concrete, untroweled, and earth channels in best condition 0.017Straight, unlined earth channels in good condition 0.020Rivers and earth canals in fair condition, some growth 0.025Winding natural streams and canals in poor condition,
considerable moss growth 0.035Mountain streams with rocky beds and rivers with variablesections and some vegetation along banks 0.041-0.050
Variation of Manning n values with changes in bed form occurring under different flow conditions
Bed form Manning n (ft1/6)Lower regimeRipples 0.017 – 0.028Dunes 0.018 – 0.035Washed-out dunes or transition 0.014-0.024Upper regimePlane bed 0.011 – 0.015Standing waves 0.012 – 0.016Antidunes 0.012 – 0.020
A hydrograph is a graph showing the discharge of a stream over time.
Sluggish discharge
Flashy discharge
Discharge in the U.S.
•http://water.usgs.gov/waterwatch/

9
Rating curve
Mississippi floods of
1993
Flood Recurrence Interval• Definition:
– Average time elapsed between floods of a given size/magnitude
• Recurrence interval concept used for other natural disasters too– Just replace “floods” in the above
definition with the disaster de jour
Flood Recurrence Interval• Peak discharge during each year.• If the station has a long record
these can be useful statistically.
R=n+1/m• n is the number of years of record• m is the magnitude (order of rank)
– Largest flood on record is m=1
10
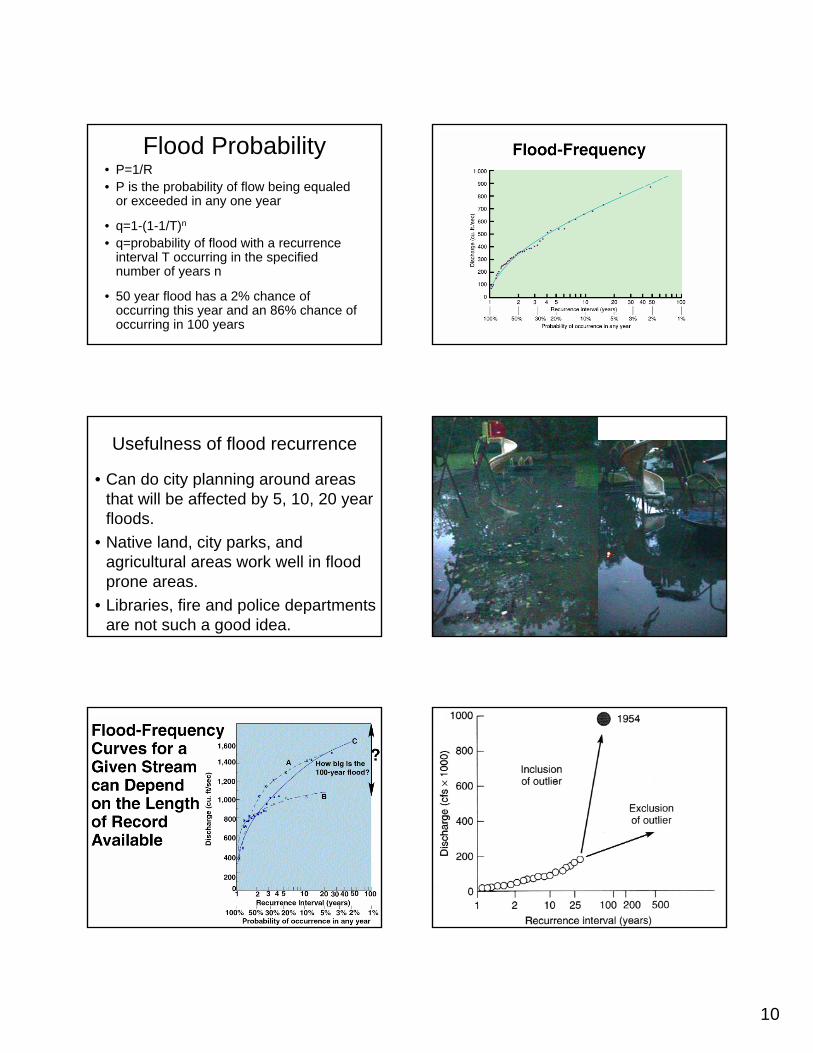
Flood Probability• P=1/R• P is the probability of flow being equaled
or exceeded in any one year
• q=1-(1-1/T)n
• q=probability of flood with a recurrence interval T occurring in the specified number of years n
• 50 year flood has a 2% chance of occurring this year and an 86% chance of occurring in 100 years
Usefulness of flood recurrence
• Can do city planning around areas that will be affected by 5, 10, 20 year floods.
• Native land, city parks, and agricultural areas work well in flood prone areas.
• Libraries, fire and police departments are not such a good idea.

11
The Water Budget and Flooding
• P=R+ET+I

12