strength effects in diamond under shock compression from 0
TRANSCRIPT
Strength effects in diamond under shock compression from 0.1 to 1 TPa
R. S. McWilliams,1,2,* J. H. Eggert,2 D. G. Hicks,2 D. K. Bradley,2 P. M. Celliers,2 D. K. Spaulding,1 T. R. Boehly,3
G. W. Collins,2 and R. Jeanloz1
1Department of Earth and Planetary Science, University of California–Berkeley, Berkeley, California 94720, USA2Physics Division, Physical and Life Science Directorate, Lawrence Livermore National Laboratory, Livermore, California 94550, USA
3Laboratory for Laser Energetics, University of Rochester, Rochester, New York 14623, USA�Received 3 October 2009; published 22 January 2010�
A two-wave shock structure—elastic precursor followed by an inelastic compression wave—is observed insingle crystal and polycrystalline diamond laser shock compressed to peak stresses as high as 800 GPa. TheHugoniot elastic limits are measured to be 80 ��12�, 81 ��6�, and 60 ��3� GPa for the �100�, �110�, and�111� orientations of single crystals with the directional dependence attributable to the relative increase instrength under confining stress. These values imply a single crystal yield strength approximately 1/3 of theo-retical predictions. The measurements reveal clear deviations from an elastic-plastic response upon dynamicyielding with significant relaxation toward an isotropic stress state for shock stresses of at least 160 GPa.Previously reported signatures of melting at 700–800 GPa along the diamond Hugoniot may be related to thetransition from a two-wave to a single-wave structure, supporting the interpretation that melting begins atlower stresses ��600 GPa� with the appearance of an optically reflecting phase of carbon.
DOI: 10.1103/PhysRevB.81.014111 PACS number�s�: 62.50.Ef, 91.60.Gf, 91.60.Fe
I. INTRODUCTION
Diamond has the largest resistance to deformation of anyknown bulk material; it is of unparalleled utility in numeroustechnological applications, due also to its transparency,chemical inertness and high thermal conductivity, and manyhave sought to predict or measure it’s yield strength.1–11 Inthe present study, we characterize its yielding by measuringthe behavior of single-crystal and polycrystalline diamondunder compression by large-amplitude shock waves between100 and 1000 GPa.
In solids, minimum elastic energy is obtained under hy-drostatic �isotropic� stress conditions.12 When stressed aniso-tropically, a solid material may behave macroscopically as afluid with stress relaxing toward hydrostatic conditions; orthe material can resist yielding, sustaining anisotropic stressthrough strength effects. Strength is manifested in numerousways under dynamic loading of solids, the most conspicuousbeing the Hugoniot elastic limit �HEL�: the stress belowwhich strain is purely elastic and above which significantinelastic yielding occurs. Compression to stresses just be-yond the HEL is associated with the formation of a two-waveshock structure, featuring an elastic precursor traveling at alongitudinal sound speed �and compressing the material tonear its HEL� followed by an inelastic wave that achieves thepeak compression.
Because the stress of the precursor shock represents thelimit of elastic deformation, it provides a measure of thematerial’s initial yield strength. For the inelastic wave, theeffects of strength in general depend on material, shock am-plitude, strain rate, and time.13–21 The elastic-plastic model,13
for example, assumes that strength is maintained during in-elastic deformation with deviatoric stress magnitudes compa-rable to those observed at the HEL. Alternatively, the elastic-isotropic model14 assumes that strength is lost duringinelastic compression, resulting in shock-compressed statesof hydrostatic stress. The behavior of real materials falls be-
tween these two extremes, for compression just beyond theHEL.
Materials exhibiting a total or partial loss of strength dur-ing inelastic compression tend to be brittle and characterizedby high strength and low thermal conductivity at ambientconditions, e.g., the dielectrics quartz �SiO2�,17,22,23 boroncarbide �B4C�,19,20 periclase,15,17 and corundum�Al2O3�.14,17,24 The prevailing explanation for strength lossunder dynamic yielding is that inelastic deformation is local-ized in shear bands, where elevated local temperatures cantransiently enhance slip, in some cases through melting.15–18
Thermal-strain localization is counterbalanced by heat con-duction and hence is favored in thermally resistive materials.That strength loss occurs most prevalently in brittle solidsalso suggests a connection with brittle fracture. Metals, withlow strength, high thermal conductivity and typically ductileyielding, tend toward elastic-plastic responses.
Diamond, a brittle dielectric of uniquely high strength andthermal conductivity, lacks an obvious analog among othersolids that have been studied with shock compression. High-strength, high thermal-conductivity moissanite �SiC� may bethe closest and resembles an elastic-plastic material undershock loading.19,20 However, silicon �Si�—which also hashigh strength and high thermal conductivity and is isostruc-tural with diamond—behaves as an elastic-isotropicmaterial.25 While diamond’s resistance to plastic flow andtendency to yield by fracturing at ambient pressure and tem-perature is well known,26 plastic flow has been observed indiamond at high pressures8 and temperatures26 �though onsignificantly longer time scales than are explored by shockcompression�. In the present study, we find that the responseof diamond to shock loading ranges from nearly elastic-isotropic to nearly elastic-plastic, correlated with initialsample properties.
The response of diamond to dynamic compression hasbeen measured previously11,27–36 although the low-stressshock-compression regime ��600 GPa�, where strength ef-
PHYSICAL REVIEW B 81, 014111 �2010�
1098-0121/2010/81�1�/014111�19� ©2010 The American Physical Society014111-1

fects should play the largest role, has received relatively littleattention.11,27–30 Early equation-of-state measurements at100–600 GPa reported a single-wave structure.27 Subsequentmeasurements, however, documented elastic precursor wavesat 180–250 GPa.28,30 The present results are consistent withthe latter studies.
Recent shock experiments on diamond have focused onhigher stresses, 500–3500 GPa.31–36 Melting has been foundto initiate at 600–800 GPa31,33,35–38 and most shock equation-of-state measurements have documented stresses near orabove this stress.32–35 Whereas the occurrence of meltingsuggests that strength should not play a role in this stressregime, the present observations reveal that this is not thecase. Also, recent ramp-wave loading experiments indicatethat solid diamond exhibits significant strength to rampstresses of �800 GPa,11 raising the possibility that strengthcan similarly influence the shock-wave response.
II. MATERIALS AND EXPERIMENTAL METHOD
Single-crystal diamond samples were cut for shock propa-gation in the three crystallographic orientations that exhibitideal uniaxial strain for elastic shock compression:39,40 �100�,�110�, and �111�. The �100� �type Ia� and �110� �types Ia andIIa� samples were transparent, colorless, and inclusion free,and were fashioned into polished circular disks100–500 �m in thickness and 1 mm in diameter; these weresupplied by Delaware Diamond Knives, Inc. and Harris Dia-mond Co. The �111� samples were inclusion-free type Ibdiamonds, transparent and yellow in color, cut into 1-mm-sided squares �200 �m thick, with the broad surfacesformed by cleavage along �111� planes; these were suppliedby Almax Industries. In some high-stress experiments, amicrocrystalline synthetic �CVD� diamond was studied; thisvariety of polycrystal, supplied by Diamond MaterialsGmbH, has been studied previously under dynamiccompression.11,35,36
The targets consisted of diamond mounted on a diamond-turned �optically finished� 1100 aluminum buffer �Aero Re-search Associates, Inc.�, 50–100 �m thick, with 8–20 �mof plastic ablator �CH� deposited on the opposite surface�Fig. 1�. In most targets, a 137-�m-thick, z-cut quartz win-dow �Meller Optics, Inc.� was placed adjacent to the dia-mond as a reference standard. In some targets, two�100-�m-thick diamonds of identical orientation werestacked with a 100 nm layer of aluminum deposited on asection of the interface between them to provide an internalsurface at which to observe shock arrival in diamond �Fig.2�. Target components were aligned, stacked withNorland-63 UV-cure photopolymer glue between parts, andcompressed using a Fineplacer Pico �Finetech GmbH�; tar-gets were UV cured while under compression, reducing gapsbetween parts to a minimum.
A Wyco optical surface profilometer �Veeco Instruments�was used to create a two-dimensional thickness map ofsamples and targets throughout target assembly. Interferencefringes observed in gaps between parts under illumination bywhite light, in combination with optical profilometry, wereused to characterize gap thicknesses throughout the as-
sembled targets. Targets with gap thicknesses exceeding�1 �m were discarded because for larger thicknesses shockreverberation in the gap causes a significant perturbation inshock travel time. The 100-nm aluminum layer in the inter-face of stacked diamonds does not significantly affect ourmeasurements. In some �111� samples, cleavage on different�111� planes resulted in a series of steps on diamond sur-faces; care was taken to ensure that these steps did not inter-fere with the measurements.
Shock waves were driven into the targets using two lasersystems, Janus �100 GW at 532 nm� at Lawrence LivermoreNational Laboratory and Omega �3 TW at 355 nm� at theUniversity of Rochester’s Laboratory for Laser Energetics.One-dimensional loading and unloading was achieved bysmoothing the drive laser foci with phase plate technologythat provided uniform irradiation over a square region1000 �m on a side, or a circular region 650 �m in diam-eter. This uniform, high-intensity laser ablated the target sur-face generating a high velocity plasma. In response to thislarge impulse, a planar shock having the dimension of thefocal spot is generated in the target. As the shock propagatesacross the target, lateral unloading reduces the diameter ofthe planar region to between 950 and 100 �m, depending onshock-propagation distance, the phase plate used and—forthe square plate—the plate orientation relative to the target.The size and quality of the planar region was documented bythe observed uniformity of shock-arrival times at a givendepth in the target.
Pulses of 1–6 ns duration were used. The 6 ns pulsesprovide an optimum degree of shock steadiness during theexperiment �quasisteady loading� but with a limited peakstress; whereas 1–4 ns pulses typically create higher peak
FIG. 1. Target schematic with the laser �left� incident on anablative layer of polymer �CH�, driving a shock through an Albuffer and into the diamond sample. In most cases, a z-cut quartzreference was placed on the buffer, adjacent to the diamond. Insome cases, two diamonds were stacked on each other, effectivelyforming a single diamond with an internal interface, which waspartially coated with �100 nm of Al. An AR coating was some-times used on the quartz and diamond free surfaces to permit ob-servation of weakly reflecting shocks in the transparent samples.Line-imaging VISAR and SOP diagnostics view the target from theright. Targets are in an evacuated chamber for the experiment.
MCWILLIAMS et al. PHYSICAL REVIEW B 81, 014111 �2010�
014111-2
stresses but result in shock decay with propagation distancedue to unloading following shutoff of the laser drive. Char-acterization of loading stability is discussed in Appendix A.
Two line-imaging velocity interferometer �VISAR� sys-tems were used to measure velocities and shock traveltimes.41,42 The interferometric measurement of velocity byVISAR is given by
Velocity = �� �
2��1 + ��� . �1�
The second term on the right �velocity per fringe, VPF�involves the wavelength of the VISAR probe laser ��=532 nm�, the optical delay time � introduced by the etalonin one leg of the interferometer, a correction �1+�� for opti-
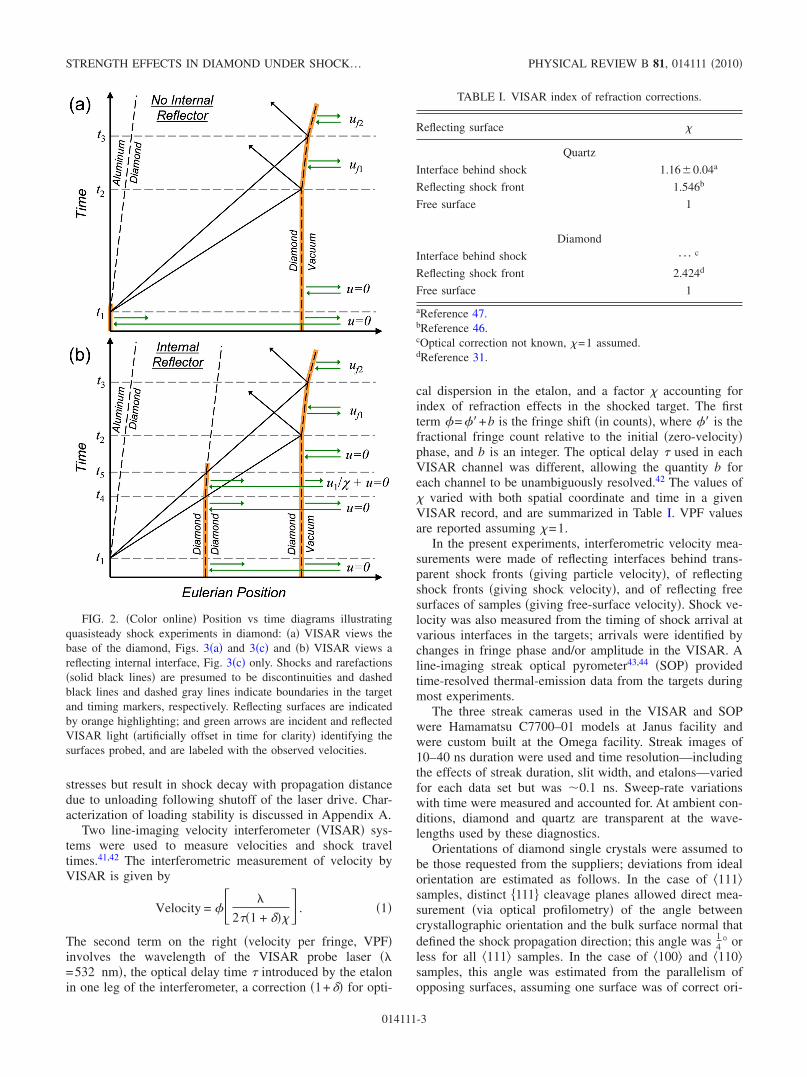
cal dispersion in the etalon, and a factor � accounting forindex of refraction effects in the shocked target. The firstterm �=��+b is the fringe shift �in counts�, where �� is thefractional fringe count relative to the initial �zero-velocity�phase, and b is an integer. The optical delay � used in eachVISAR channel was different, allowing the quantity b foreach channel to be unambiguously resolved.42 The values of� varied with both spatial coordinate and time in a givenVISAR record, and are summarized in Table I. VPF valuesare reported assuming �=1.
In the present experiments, interferometric velocity mea-surements were made of reflecting interfaces behind trans-parent shock fronts �giving particle velocity�, of reflectingshock fronts �giving shock velocity�, and of reflecting freesurfaces of samples �giving free-surface velocity�. Shock ve-locity was also measured from the timing of shock arrival atvarious interfaces in the targets; arrivals were identified bychanges in fringe phase and/or amplitude in the VISAR. Aline-imaging streak optical pyrometer43,44 �SOP� providedtime-resolved thermal-emission data from the targets duringmost experiments.
The three streak cameras used in the VISAR and SOPwere Hamamatsu C7700–01 models at Janus facility andwere custom built at the Omega facility. Streak images of10–40 ns duration were used and time resolution—includingthe effects of streak duration, slit width, and etalons—variedfor each data set but was �0.1 ns. Sweep-rate variationswith time were measured and accounted for. At ambient con-ditions, diamond and quartz are transparent at the wave-lengths used by these diagnostics.
Orientations of diamond single crystals were assumed tobe those requested from the suppliers; deviations from idealorientation are estimated as follows. In the case of �111�samples, distinct �111� cleavage planes allowed direct mea-surement �via optical profilometry� of the angle betweencrystallographic orientation and the bulk surface normal thatdefined the shock propagation direction; this angle was 1
4° orless for all �111� samples. In the case of �100� and �110�samples, this angle was estimated from the parallelism ofopposing surfaces, assuming one surface was of correct ori-
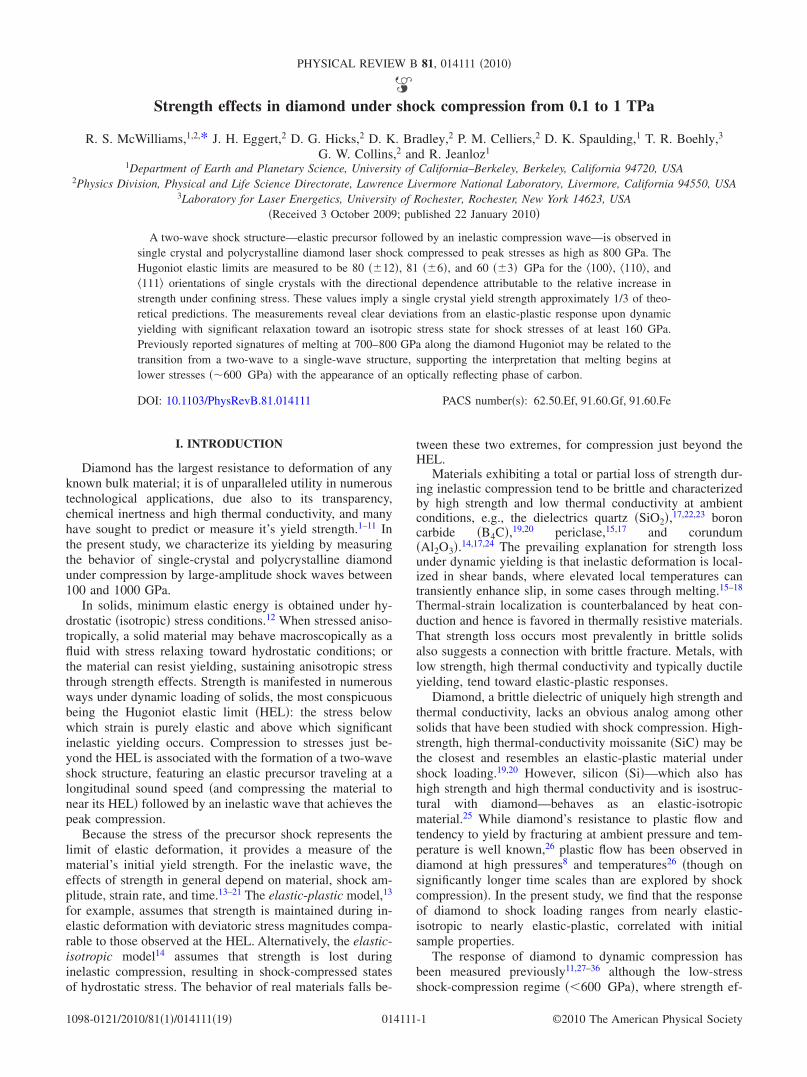
FIG. 2. �Color online� Position vs time diagrams illustratingquasisteady shock experiments in diamond: �a� VISAR views thebase of the diamond, Figs. 3�a� and 3�c� and �b� VISAR views areflecting internal interface, Fig. 3�c� only. Shocks and rarefactions�solid black lines� are presumed to be discontinuities and dashedblack lines and dashed gray lines indicate boundaries in the targetand timing markers, respectively. Reflecting surfaces are indicatedby orange highlighting; and green arrows are incident and reflectedVISAR light �artificially offset in time for clarity� identifying thesurfaces probed, and are labeled with the observed velocities.
TABLE I. VISAR index of refraction corrections.
Reflecting surface �
Quartz
Interface behind shock 1.16�0.04a
Reflecting shock front 1.546b
Free surface 1
Diamond
Interface behind shock ¯
c
Reflecting shock front 2.424d
Free surface 1
aReference 47.bReference 46.cOptical correction not known, �=1 assumed.dReference 31.
STRENGTH EFFECTS IN DIAMOND UNDER SHOCK… PHYSICAL REVIEW B 81, 014111 �2010�
014111-3
entation and the other of incorrect orientation. For the maxi-mum thickness variation over a 1 mm diameter observed inthese diamonds �5 �m�, a � 1
3° misalignment would be sug-gested; thus it is likely that the shock-propagation directionlies within �1° of the �100� and �110� orientations. Thedensities of the diamond, quartz, and aluminum sampleswere taken to be 3.52, 2.65, and 2.71 g/cc, respectively.
For experiments in which shock fronts in quartz45 ordiamond31 were reflecting, antireflection �AR� coatings weresometimes used on free surfaces; this was necessary to ob-serve shock fronts with weak ��10%� reflectivities usingVISAR. When AR coatings were used, the free surface be-came reflecting on shock arrival and its subsequent velocitycould be measured.
The quartz window acts as a reference for determining theshock conditions in the aluminum buffer and the diamond. Inthe majority of our experiments, quartz was shocked into themolten regime and the shock front was reflecting and emis-sive, permitting time-resolved measurement of shock veloc-ity using VISAR, and thermal emission using SOP.45,46 Thisdata was used to document the stability of the laser driveduring the experiment �Appendix A�. In some cases a poorAR coating prevented direct observation of the reflectingshock with VISAR; shock velocity was determined in suchcases from the transit time of the shock across the quartz;time-resolved thermal emission was still observed. For asingle experiment at the lowest stress studied here, shockedquartz was transparent to VISAR and the velocity of thequartz-aluminum interface was measured.47 Preheating dueto the laser drive at the maximum laser energies studied herehas been previously found to be negligible in these types oftargets.48
III. ANALYSIS AND RESULTS
Shock conditions were assessed using the Rankine-Hugoniot equations that relate shock-wave velocity D, par-ticle velocity u, density �or volume V=1 /�, and longitu-dinal shock stress P through conservation of �linear�momentum and mass22
Pb = Pa + a�Db − ua��ub − ua� , �2�
b = aDb − ua
Db − ub. �3�
Subscript a indicates conditions ahead of the shock front,and subscript b is used to denote shock velocity �Db� and theconditions behind the shock. For a two-wave system, theseequations are applied successively to the first and secondshocks. The preshock state of the system is u0=0, P0=0, and0 �ambient density�, and states behind the first and secondwaves �traveling at D1 and D2� are u1, P1, and 1 and u2, P2,and 2, respectively.
The P--D-u states obtained in this manner define theshock Hugoniots of diamond, the loci of states achieved byshock compression from a particular initial state. In thepresent study, this initial state was varied by altering theproperties of the diamond samples �e.g., the orientation of
single crystals�. The shock front is optically reflective forHugoniot states above 600 GPa �Ref. 31� and these resultsare discussed separately from the experimental observationsat stresses below 600 GPa. Steady-loading behavior is as-sumed in the analysis of our low-stress experiments becausethis is a good assumption in most cases �Appendix A�.
A. Low-stress results
1. Observations
A two-wave structure was observed in all experimentsbelow 600 GPa �Figs. 2 and 3�. Free-surface velocity profiles�Fig. 4� show features common to elastic-inelastic two-waveshock structures16,17,22,49–51 with the leading elastic shockconsisting of a sharp jump in free-surface velocity uf, fol-lowed by uf decreasing with time prior to second-wave ar-rival. On second-wave arrival, the profile varies dependingon sample orientation and driving stress, the second-wavearrival generally being sharper at higher peak stress andmore distended at lower stress. For P2=200–300 GPa in the�100� and �110� orientations, the second-shock arrival fea-tures a sharp initial jump in velocity followed by a slow riseto peak velocity. This initial jump, observed previously in�110� diamond,30 is due to the interaction of the two-wavestructure with the sample surface �Fig. 5�.13,25,50 The jumpleading the second-wave arrival is slightly larger than thejump observed on first-shock arrival as is commonly ob-served when the sample surface is unconfined.13,50
In our analysis, we make use of the observation that thefirst wave is transparent to VISAR interferometry and thesecond is nontransparent to VISAR �Fig. 3�. This is consis-tent with identification of the first wave as elastic and thesecond as inelastic, with scattering from heterogeneous dam-age the likely cause of transparency loss.
2. Measurement of first-wave conditions
The particle velocity u1 is obtained from the free-surfacevelocity following arrival of the first shock, uf1, assuminguf1=2u1.14,22,23,28 Uncertainty is estimated from the fullrange of velocities observed between first- and second-wavearrivals at the free surface.
Shock velocity D1 is determined from travel time acrossthe diamond. The measured D1 are comparable to the ambi-ent longitudinal sound speeds in the �100�, �110�, and �111�orientations �17.53, 18.32, and 18.58 km/s, respectively�.39,52
This is additional evidence that the first wave is elastic. D1appears to decrease somewhat between the first and seconddiamond of stacked targets by �1 km /s,47 presumably as aresult of stress relaxation behind the precursor;51 because thechange in velocity is on the order of the absolute measure-ment uncertainty, the average is used for D1. The stress P1and density 1 are then determined through Eqs. �2� and �3�.
3. Measurement of second-wave conditions
Shock velocity D2 is determined from shock travel time,using shock arrival at the free surface, and for stacked tar-gets, arrival at the internal interface �in which case the twomeasurements are averaged�. The effect of the precursor on
MCWILLIAMS et al. PHYSICAL REVIEW B 81, 014111 �2010�
014111-4

FIG. 3. Line VISAR �a� and �c�� and result-ing velocity records �b� and �d�� for shots dh14and dh8, respectively. Spatial �vertical� axes of�a� and �c� are 925 �m full scale and are labeledto indicate the target region: quartz, diamond, anddiamond with a reflecting �Al-coated� internal in-terface. In �a� and �c�, darker interference fringescorrespond to higher reflection from the target. Inplots �b� and �d�, velocities for diamond andquartz are solid black and gray lines, respectively.Time zero corresponds to shock breakout intodiamond and quartz. Events, numbered as in Fig.2, are determined from changes in fringe phase��� or intensity; the subsequent phase ��� isdetermined from �=0 corresponding to a mo-tionless surface. �1� Shock breakout from alumi-num buffer, diamond and quartz rendered non-transparent and reflection from the buffer ceases;a reflecting shock is visible in quartz in �a� due togood AR coating on the quartz window ���0and ��0�; for quartz in �c�, and diamond in bothtargets, only an intensity drop is registered ��=0 and �=0�. �2� and �3�� Arrival of elastic andinelastic waves �respectively� at diamond freesurface ���0 and ��0�. �4� Arrival of elasticwave at internal reflecting interface, wave istransparent ���0 and ��0�. �5� Arrival of in-elastic wave at internal reflecting interface, waveis nontransparent ���0 and �=0� �6� Arrivalof shock at quartz free surface �character dependson the initial quality of the AR coating�; subse-quent to this event only free-surface reflection isobserved with ��0. For the observed fringeshift at event 4, �=1 is assumed in reducing thedata, and overlapping �=0 fringes from the freesurface are subtracted. For both �a� and �c�, theapparent VPF �for �=1� is 6.221 km/s per fringeshift. In selecting arrival times to determineshock velocity, arrival 1 is identified by the dropin fringe intensity; arrivals 2 and 4 are identifiedby sharp fringe shifts; arrival 3 is identified as thepoint of maximum free-surface acceleration; ar-rival 5 is identified by a sudden drop in fringeintensity and an incomplete fringe shift; and ar-rival 6 is identified by a fringe shift or an inten-sity drop. Arrival times are obtained self-consistently, accounting for the time resolution ofthe VISAR.
STRENGTH EFFECTS IN DIAMOND UNDER SHOCK… PHYSICAL REVIEW B 81, 014111 �2010�
014111-5

velocity measurement at the internal interface is straightfor-ward.
At the free surface, the effect of the prior arrival of theprecursor is more complicated as reverberation between thefree-surface release of the precursor and the approaching in-elastic wave must be considered �Fig. 5�.14,22,50,53,54 We use
FIG. 4. Profiles of free-surface velocity uf vs normalized time�time after the shock enters the diamond divided by the thickness ofthe diamond or diamond stack�, for orientations �a� �100�, �b� �110�,and �c� �111�. Normalization to diamond thickness results in iden-tical arrival times for waves traveling at the same velocity. Inset in�b� is a detail �with a longer time scale� on the lowest amplitudewave in that figure.
FIG. 5. Distance-time plot of reverberations following arrival ofthe elastic precursor at the free surface, after Refs. 53 and 54. Solidlines are shocks and rarefactions �labeled with Eulerian wave ve-locities� and dashed lines are material interfaces. Rarefactions areapproximated as discontinuous waves.
FIG. 6. �Color online� Impedance-match method for a represen-tative experiment �dh3�. The path to the first state in diamond isindicated by Rayleigh line R1 with a slope 0D1 and the path fromthe first to the second state is indicated by Rayleigh line R2 with aslope 1�D2−u1�. The aluminum Hugoniot �Al� is reflected �M�about the initial state in aluminum, intersecting with R2 and thequartz Hugoniot �Q�, to estimate the release �into quartz� and re-shock �into diamond� response of Al �Ref. 57�; errors due to thereflected-Hugoniot approximation are negligible. Impedance match-ing was accomplished by first determining aluminum conditionsfrom measured quartz conditions, then determining second-wavediamond conditions from aluminum conditions. Dashed lines indi-cate uncertainty in R1, R2, and M. Uncertainties in first- andsecond-wave states are represented in two ways: by orthogonal er-ror bars �blue� and by polygonal zones �red�, where the latter showcovariance; orthogonal uncertainties are reported in Table II; po-lygonal uncertainties are shown in subsequent graphs whenappropriate.
MCWILLIAMS et al. PHYSICAL REVIEW B 81, 014111 �2010�
014111-6

the reverberation treatment53,54 with D2 defined as
D2 =�t2 − t1��2D1u1 − 2u1
2 − D3D1 + D3u1� + L�D1 − u1 + D3�t2�D3 − 2u1� + t1�u1 + D1�
�4�
where L is the diamond thickness �the total thickness in thecase of stacked targets�, t1 is the transit time of the first waveacross the diamond�s�, t2 is the apparent transit time of thesecond wave, and D3 is the velocity of the wave that emergesfrom the interaction between the precursor release wave andthe oncoming second shock. The quantity D3 is not wellknown. One common assumption is that D3=D1+2u1, whichassumes that diamond is restressed to support a new elasticwave with the same velocity as the first.14,22,53,54 This as-sumption seems realistic for the experiments on �100� and�110� diamond where the second-wave free-surface arrivalevent contains a clear elastic reverberation. However, it wasobserved in experiments on quartz22,53 that this assumptionproduces unrealistic values of D2 and that more reasonableresults are obtained by assuming D3 is significantly slowerwith a velocity closer to the bulk wave speed.
In the present study, we measured D3 by comparing D2measured in the first diamond of stacked targets with thatestimated using Eq. �4�. The value of D3 giving the bestagreement between the two measurements is 82 ��5�% ofD1+2u1 for P2 between 150 and 300 GPa, consistent withthe lower D3 suggested by previous studies. We considered asystematic uncertainty of �D1+2u1��D3� �D2+2u1� in ap-plying Eq. �4� to all measurements, where the lower boundreproduces the slower measured value. At P2�200 GPa, theshock velocity obtained from Eq. �4� is imprecise due to thelong time between reverberations and the systematic uncer-tainty in D3.
The particle velocity u2, stress P2, and density 2 behindthe second wave were determined simultaneously throughimpedance matching22 using the Hugoniots of quartz46,55 andaluminum,56,57 the measured shock conditions in the quartz,the precursor shock conditions, and D2 �Fig. 6�. The shocksin quartz and aluminum consist of single waves at the con-ditions studied here.
Note that we observe uf2 /u2�2 at P2�300 GPa �TableII�. For example, for P2=200–300 GPa in the present study,uf2 /u2 ratios of 1.69 ��0.12�, 1.56 ��0.09�, and 1.21��0.09� are observed for the �100�, �110�, and �111� orien-tations, respectively. Also, uf2 /u2�1.7 has been reported forP2�200 GPa in nearly �111�-oriented diamond.28 Such de-viations from the frequently assumed uf2 /u2=2behavior23,25,50,54 are likely due to strength effects and pre-clude the use of the free-surface release velocity to estimateu2 in these low-stress experiments.
4. Hugoniot data and uncertainty
Hugoniot data at low stress �Table II� are plotted in Figs.7 and 8, together with previous Hugoniot data in this stressregime on nearly �111�-oriented diamond28 �plotted with our�111� data� and �100� diamond.27
Uncertainties in the measured quantities—D1, u1, D2, andthe quartz shock velocity DQ—were propagated to dependant
quantities—e.g. P1, 1, u2, P2, and 2—with careful consid-eration of covariance. To represent covariance in the uncer-tainty of dependant quantities graphically, polygonal bound-ing regions are used �rather than orthogonal error bars� asshown in Figs. 6–8. These contain all solutions to the analy-sis that fall within the uncertainties of the measured quanti-ties. Standard orthogonal uncertainties are reported in TableII.
B. High-stress results
For high-stress experiments, shorter laser-pulse durationsand unloading at the drive surface typically produced shocksthat decayed in amplitude with time.31,34,42,45 Time-integratedmeasurements �e.g., shock-travel times�, often provided in-sufficient constraints on the shock conditions present duringthe experiment. For shock stresses above �600 GPa, theshock front in diamond was reflecting,31 permitting time-resolved velocimetry of the decaying shock as it transited thediamond.31,34,42,45 In some experiments the shock was ini-tially reflecting but became nonreflecting during transit.31
For experiments where the shock remained reflectingthroughout transit �Figs. 9 and 10�, it was possible to mea-sure shock velocity immediately before arrival at the freesurface. Then, immediately after arrival, the free-surface ve-locity could be measured. The shock at the free surface ex-hibited either single- or two-wave structure.
The two-wave structure in this type of experiment wasinterpreted to consist of a transparent, nonreflecting precur-sor �consistent with observations at low stress� and a reflect-ing second wave, such that D2 was measured through theprecursor by VISAR interferometry. This could alter � fromthat expected for a single, reflecting wave ��=n0�,31,42 wheren0 is the ambient index of refraction. Making the index-of-refraction corrections,58 we obtain for a two-wave �transpar-ent first wave, reflecting second wave� structure
� = n01 − �1 − n1/n0��1 − D1/D2�� , �5�
where n1 is the index of refraction behind the first wave. Thetwo terms in parenthesis are small because D1�D2 at con-ditions where the second shock is reflecting and n1�n0 forany reasonable change in the index of refraction of diamondin the precursor wave. Thus, �=n0 is accurate for all reflect-ing shocks in diamond.
Immediately before and after free-surface arrival of theshock�s�, it is reasonable to approximate conditions as thoseof steady loading. That is, on a time scale short relative to thetime scale of shock decay, unsteady loading effects can beignored and steady-wave analysis �e.g., impedance match-ing� can be used. In this interval three measurements con-strain the state of the shock�s� immediately before free-surface arrival: D2, uf1 �if observed�, and uf2. First shockconditions, when visible, were obtained by assuming uf1=2u1 as at low stress, and estimating D1 �Table II�. Inelasticshock conditions were obtained from measurement of D2 im-mediately before free-surface arrival and uf2 after free-surface arrival, assuming uf2=2u2 �justified by the relativelygood agreement of our results, using this assumption, withindependent Hugoniot measurements at high stress: Fig. 11�.
STRENGTH EFFECTS IN DIAMOND UNDER SHOCK… PHYSICAL REVIEW B 81, 014111 �2010�
014111-7

TABLE II. Experimental results. Uncertainties are in parenthesis and are intended to represent 68.3% �1-sigma� confidence. For stacked diamonds, the sample thickness is the totalthickness. Shots beginning with “dh” were conducted at LLNL; numbered shots were conducted at LLE.
ShotOrientation andconfiguration
Intensity�1016 W /m2�
Duration�ns� Drive
Thickness��m�
D1
�km/s�uf1
�km/s�u1
�km/s�P1
�GPa�1
�g /cm3�D2
�km/s�uf2
�km/s�u2
�km/s�P2
�GPa�2
�g /cm3�DQ
�km/s�
dh6a �110� 2.50 6 steady 99.1 20.72 2.21 1.107 80.7 3.713 10.8 2.43 1.78 105 3.99 6.95
single �1.0� �0.68� �0.14� �0.071� �5.8� �0.015� �1.5� �0.10� �0.57� �20� �0.26� �0.98�dh10a �110� 5.90 6 steady 207.9 19.90 2.45 1.223 85.5 3.745 12.71 ¯
b 2.87 156 4.37 8.95
stack �1.4� �0.45� �0.09� �0.043� �3.5� �0.010� �0.38� �0.21� �9� �0.10� �0.35�dh9a �100� 6.03 6 steady 175.9 20.22 2.26 1.13 80 3.723 13.64 3.96 2.89 162 4.33 9.08
stack �1.4� �0.52� �0.35� �0.17� �12� �0.034� �0.39� �0.14� �0.22� �10� �0.10� �0.36�dh13a �111� 6.28 6 steady 224.0 20.74 1.77 0.88 64.3 3.671 15.12 3.20 2.80 165 4.24 9.03c
single �1.0� �0.30� �0.22� �0.11� �7.9� �0.020� �0.64� �0.20� �0.21� �11� �0.08� �0.36�dh3a �100� 6.45 6 steady 83.8 19.29 2.65 1.33 89.8 3.774 13.41 4.75 2.99 166 4.38 9.23
single �1.3� �0.73� �0.25� �0.13� �9.1� �0.028� �0.93� �0.26� �0.24� �11� �0.13� �0.39�dh2a �100� 12.30 6 steady 78.8 19.65 2.80 1.400 96.7 3.785 15.21 7.30 4.38 253 4.83 11.61c
single �1.3� �0.80� �0.10� �0.050� �5.2� �0.016� �0.81� �0.30� �0.38� �20� �0.20� �0.49�dh8a �100� 13.18 6 steady 174.7 19.47 3.00 1.50 103 3.808 15.86 7.34 4.32 257 4.74 11.61
stack �1.6� �0.58� �0.32� �0.16� �11� �0.035� �0.41� �0.31� �0.24� �13� �0.11� �0.32�dh14a �111� 12.10 6 steady 201.3 20.75 1.66 0.828 60.4 3.661 16.49 5.31 4.39 265 4.74 11.75
single �1.5� �0.36� �0.09� �0.043� �3.3� �0.008� �0.53� �0.15� �0.26� �15� �0.12� �0.32�dh5a �110� 13.32 6 steady 175.6 20.42 2.57 1.28 92.1 3.751 16.44 6.70 4.42 270 4.73 11.83
stack �2.6� �0.56� �0.21� �0.10� �7.8� �0.021� �0.41� �0.23� �0.27� �15� �0.12� �0.32�dh1a �110� 13.18 6 steady 101.8 19.37 2.61 1.303 88.7 3.768 15.40 7.58 4.76 273 4.99 12.07
single �1.3� �0.61� �0.14� �0.068� �5.4� �0.016� �0.64� �0.20� �0.29� �16� �0.17� �0.33�dh12a �110� 15.88 4 decaying 207.7 20.74 2.79 1.40 102 3.769 16.45 ¯
d 4.42 274 4.72 11.87
stack �2.2� �0.53� �0.26� �0.13� �10� �0.027� �0.92� �0.43� �24� �0.20� �0.51�dh17a �111� 17.45 4 decaying 232.0 20.81 1.86 0.932 68.2 3.680 16.90 ¯
d 5.16 316 5.00 12.75
single �1.4� �0.40� �0.19� �0.093� �6.9� �0.017� �0.94� �0.41� �25� �0.23� �0.53�dh19a �110� 54.50 4 decaying 205.6 19.55e 3.08 1.54 105.7 3.815 19.8 ¯
d 8.32 578 6.08 16.95c
stack �1.5� �0.82� �0.20� �0.10� �8.2� �0.025� �1.4� �0.70� �50� �0.52� �0.71�dh15a �111� 55.48 4 decaying 169.8 22.43e 3.65 1.83 143.9 3.826 20.6 ¯
d 8.15 599 5.77 16.99c
single �1.3� �0.62� �0.21� �0.11� �9.2� �0.022� �1.7� �0.72� �53� �0.49� �0.71�dh18a �100� 56.23 4 decaying 167.3 21.6e 3.47 1.733 132 3.821 20.8 ¯
d 8.18 602 5.77 17.03
stack �1.5� �1.1� �0.20� �0.098� �10� �0.025� �1.8� �0.70� �53� �0.49� �0.72�41649f �110� 184.10 1 decaying 500g 20.87h 3.40 1.70 125 3.827 ¯
f¯
f¯
f¯
f¯
f¯
f
single �0.64� �0.40� �0.20� �15� �0.041�43633i CVD 396.36 1 decaying 420g 21.9j 5.19 2.60 200 3.987 20.79 16.70 8.35 617 5.83 ¯
i
single �1.0� �0.88� �0.44� �35� �0.094� �0.32� �0.90� �0.45� �34� �0.22�
MC
WIL
LIA
MS
etal.
PHY
SICA
LR
EV
IEW
B81,
014111�2010�
014111-8

TABLE II. �Continued.�
ShotOrientation andconfiguration
Intensity�1016 W /m2�
Duration�ns� Drive
Thickness��m�
D1
�km/s�uf1
�km/s�u1
�km/s�P1
�GPa�1
�g /cm3�D2
�km/s�uf2
�km/s�u2
�km/s�P2
�GPa�2
�g /cm3�DQ
�km/s�
29424i �110� 445.78 1 decaying 450g , k 21.5h 4.88 2.44 184 3.966 20.10 17.35 8.68 621 6.13 ¯
i
single �1.4� �0.47� �0.24� �21� �0.059� �0.25� �0.23� �0.11� �13� �0.09�42454i �110� 527.49 1 decaying 500g 21.5h 5.16 2.58 195 3.993 20.84 19.18 9.59 706 6.48 ¯
i
single �1.6� �0.64� �0.32� �28� �0.079� �0.46� �0.67� �0.33� �29� �0.23�20547i �110� 47.51 3.5 steady 100g 21.6h 5.50 2.75 209 4.028 20.60 19.89 9.95 726 6.75 ¯
i
single �1.7� �0.28� �0.14� �20� �0.056� �0.40� �0.30� �0.15� �19� �0.16�43634i CVD 589.97 1 decaying 420g
¯
l¯
l¯
l¯
l¯
l 21.60 20.00 10.00 759 6.55 ¯
i
single �0.25� �0.40� �0.20� �18� �0.13�20550i �110� 177.77 1 decaying 100g
¯
m¯
m¯
m¯
m¯
m 23.40 22.50 11.25 925 6.77 ¯
i
single �0.30� �0.75� �0.38� �33� �0.22�20549i �110� 217.93 1 decaying 100g
¯
m¯
m¯
m¯
m¯
m 23.30 23.00 11.50 942 6.94 ¯
i
single �0.35� �0.75� �0.38� �34� �0.24�aInelastic wave conditions obtained by impedance matching with D2 obtained from diamond transit time.bFree-surface inelastic wave arrival missed.cQuartz shock conditions not observed; estimated from scaling of quartz conditions with laser intensity.dNot reported due to shock decay, uf2 does not accurately correspond with u2 estimated by impedance matching.ePrecursor velocities are upper bounds.fInelastic wave conditions could not be accurately estimated.gDiamond thickness not precisely known.hEstimated from elastic Hugoniot models �finite-strain models and linear fit in D -u� fit to �110� elastic wave data �Ref. 47�.iInelastic wave conditions obtained by assuming uf2=2u2 with D2 obtained from reflecting shock front.jEstimated from Eq. �6� assuming D1=DC.kCorrected from Ref. 42.lPrecursor just barely overdriven; precursor visible at edge of sample where weaker shocks arrived at free surface.mPrecursor overdriven.
STR
EN
GT
HE
FFEC
TS
IND
IAM
ON
DU
ND
ER
SHO
CK
…PH
YSIC
AL
RE
VIE
WB
81,014111
�2010�
014111-9

Stress and density were then determined through Eqs. �2�and �3�.
Our approach amounts to impedance matching in a smallspatial region around the interface between two materials�diamond and vacuum, in the present case� during the shorttime interval that steady loading is a reasonableapproximation.33,34,59,60 For a two-wave structure, wave-amplitude variations during the interval between wave arriv-als are accounted for. A high-stress experiment �shot 20547�with approximately steady loading confirmed that there is noresolvable difference between data obtained under nearlysteady and decaying loading conditions.
FIG. 7. �Color online� Shock velocity vs particle velocity datafor single-crystal diamond. Circles and squares are elastic and in-elastic Hugoniot data, respectively. Orientations are �100� �purple�,�110� �green�, and �111� �red�. Filled symbols are present results;two-wave shock data on nearly �111�-oriented diamond �Ref. 28�are open circles and squares �red�; single-wave shock data on �100�diamond �Ref. 27� are open crossed squares �purple�, and a linear fitto this data is the solid black line. Colored solid lines are bounds onthe predicted hydrostatic Hugoniot �Appendix B� for each orienta-tion and are observed to be anisotropic at low stress. Coloreddashed �dotted� lines are Lagrangian �Eulerian� finite-strain modelsfor the elastic Hugoniots �Ref. 47� centered on the ambient longi-tudinal sound speeds �colored triangles�. Black triangle is ambientbulk sound speed.
FIG. 8. �Color online� Stress vs density data for �a� �100�, �b��110�, and �c� �111� single-crystal diamond. Symbols and colora-tion are consistent with Fig. 7; circles �squares� are elastic �inelas-tic� wave data. Present data are filled symbols; data for nearly �111�diamond �Ref. 28� are open symbols; data for �100� diamond �Ref.27� are crossed open squares, shown with estimated corrections tothese datapoints for a two wave structure �Ref. 47� �adjacent, openblack polygons�. Solid gray region is the hydrostatic isentrope ofdiamond and its uncertainty �Appendix B�. The hydrostatic Hugo-niot prediction �bounded by colored solid lines� is virtually identicalin each orientation; note however that it is defined only above theHEL. Colored dashed �dotted� lines are Lagrangian �Eulerian�finite-strain models for the elastic Hugoniots �Ref. 47�.
MCWILLIAMS et al. PHYSICAL REVIEW B 81, 014111 �2010�
014111-10

It was observed that with increasing D2 �near the freesurface�, the interval between arrivals of the first and secondwaves decreased until at a critical velocity DC and above,only a single wave arrival was observed. It is interpreted thatbelow DC, the precursor is fast enough to separate from theinelastic shock while above it, the precursor is overdriven.Then, for some experiments �e.g., Figs. 9 and 10�, DC wasreached as the decaying shock transited the diamond, causingthe wave to split before reaching the free surface; in others,DC was not reached during decay and only a single wave waspresent during the experiment.
For �110� diamond, DC lies between �20.8 and�23.3 km /s, given the experiments that bound this transi-tion in our data. We can more precisely estimate DC by con-sidering the distance-time diagram in Fig. 9. Considering thedecay of the second shock, observed to be linear in time tlate in the experiments �e.g., Fig. 10� as D2�t� D0-Rt, whereD0 and R are constants fit to the data, and assuming the firstwave has a constant velocity of D1=DC, we have
DC = D0 − Rt2 + �2R�t3 − t2��D0 − uf1� − R2�t32 − t2
2� . �6�
Equation �6� was used with decaying-shock experiments29424 and 42454 to give DC=22.3�0.3 for �110� diamond.This result is consistent with the splitting of the shock duringsample transit; e.g., in Fig. 10, the two-wave structure shouldbe present for only �4 ns preceding shock arrival at the freesurface. If the amplitude of the first wave decreased withpropagation distance �due to stress relaxation� rather thanremaining constant with D1=DC, the value of DC obtainedthrough Eq. �6� is a lower bound. However, the present mea-surements and finite-strain predictions47 suggest that D1 does
not vary much with elastic wave amplitude in �110� diamondand thus Eq. �6� should be accurate. Indeed, the D1 inferredfor the above shots from elastic Hugoniot models �Table II�are in agreement with the independently determined DC. Forthe polycrystalline material, a single experiment �43634� oc-curred right at the overdrive point, constraining DC to be21.6�0.3 km /s. The data set in this case showed only asingle-wave free-surface arrival at the center of the sample,
FIG. 9. �Color online� Position vs time diagram for a decayingshock experiment �Fig. 10�. Lines, coloration, and time markernumbering are the same as in Fig. 2. Continuous rarefaction fromthe left is presumed; rightward-propagating rarefactions are notshown. The shock velocity in the single-wave regime, before theshock has split into two waves between t1 and t2, is labeled D.Splitting is presumed to occur when a critical velocity �DC� isreached during decay.
FIG. 10. Line VISAR record �a� for decaying, reflecting shockexperiment �shot 29424� and interpreted velocities �b� used forcharacterizing the two-wave structure of diamond at high stress.The vertical �spatial� axis in �a� is 200 �m full scale and shows theregion of planar shock compression in a single diamond sample.Events 1, 2, and 3 are numbered as in Figs. 2, 3, and 9; event 7 isa brief period of opacity in the diamond caused by photoionizationduring the laser pulse �Ref. 42�. At event 1, a strongly reflectingshock appears in the diamond ���0 and ��0�; shock velocitythen decreases continuously with time as does shock reflectivity asthe shock nears the free surface �Ref. 31�. At event 2, the free-surface reflectivity, initially eliminated with an AR coating, in-creases on first-shock arrival, permitting observation of the subse-quent free-surface velocity but obscuring the weakly reflectingsecond shock still within the diamond ���0 and ��0�. At event3, the second shock arrives at the free surface ���0 and ��0�.Prior to event 2, we interpret that the reflecting second wave isobserved through a transparent first wave. The gray solid line in �b�is a fit to the linear-decay portion of the second shock, extrapolatedto estimate shock conditions between events 2 and 3. For �a�, theapparent VPF is 15.96 km/s per fringe shift.
STRENGTH EFFECTS IN DIAMOND UNDER SHOCK… PHYSICAL REVIEW B 81, 014111 �2010�
014111-11

where the main shock was the strongest, and a two-wavearrival toward the edge of the sample, where slightly weakershocks arrived at the free surface. DC was also estimated forthe polycrystal from Eq. �6� and shot 43633, giving a valueconsistent with that shown above. It should be noted that DCis known independently from the Hugoniot.
IV. DISCUSSION
A. Elastic-wave behavior
Elastic precursor amplitudes are found to increase withsecond-wave �peak� stress, reaching values as high as�200 GPa before being overdriven. This, together with thedecreasing particle velocity behind the precursor wavefrontand the decrease in precursor velocity with propagation dis-tance are common phenomena14,15,22,50,61 that can be inter-preted in terms of time-dependant inelastic relaxation ofinitially-elastic uniaxial strain.16,17,49,51 Our elastic precursorstresses in �110�- and �111�-oriented diamond compare wellwith those measured previously in �110�- �Ref. 30� andnearly �111�-oriented �Ref. 28� diamond, respectively, atsimilar peak stresses.
We took the HELs of diamond to be best represented bythe weakest elastic precursor observed in each orientation,giving 80.1 ��12.4�, 80.7 ��5.8�, and 60.4 ��3.3� for the�100�, �110�, and �111� orientations, respectively. Our ratio-nale is that as precursor stress scales with peak stress, there isa point at which the peak stress is no larger than the precur-sor stress, such that P1= P2; this is the minimum shock stress
required to initiate yielding in the form of a second, inelasticshock �the HEL�. In each orientation, this stress was esti-mated from the observed scaling of P1 with P2 and corre-sponded with the weakest precursor stress. Precursor stressesin diamond can thus exceed the HEL by more than a factorof two.
We have observed that elastic precursors in diamond canpersist to peak stresses of �800 GPa in �110�-oriented dia-mond and �700 GPa in polycrystalline diamond. The limitof the two-wave structure was not observed for the �100� and�111� single-crystal orientations; however, given that elastic-shock velocities in these orientations are similar to or fasterthan those in �110� �Fig. 7�, it is probable that the overdrivestresses and velocities will be comparable to or higher thanobserved for �110�. This shows that, for any orientation ofsingle-crystal diamond and at least one variety of polycrys-tal, a two-wave structure can occur for shock compression toall states on the solid Hugoniot; and, given the observation ofreflecting shocks behind the elastic precursor waves, also topartially molten states on the solid-liquid coexistencecurve.31 The DC obtained here should be considered upperbounds for experiments in which steady loading conditionsare achieved.
B. Inelastic-wave behavior
The most precise inelastic Hugoniot data on single-crystaldiamond in the present study, at P2�160 GPa �Fig. 8�, re-veals that peak compression states are consistent with hydro-static stress for the �100� and �110� orientations and incon-sistent with hydrostatic stress for the �111� orientation. Ourobservations are consistent with the expectation that shock-compressed states will either fall on the hydrostatic compres-sion curve or at higher P or D �for given or u� due tostrength effects. For P2 between 200 and 600 GPa, thepresent Hugoniot data are all compatible with the hydrostaticresponse although uncertainties in the data and hydrostat arelarge.
V. THE STRENGTH OF DIAMOND
A. Definitions of strength
The von Mises criterion relates yield strength Y to devia-toric stress �ij
/ by
Y = �3/2�1/2��ij/ �ij
/ �1/2, �7�
where
�ij/ �ij−P̄�ij �8�
for stress tensor �ij �taken to be positive on compression�, �ij
being the Kronecker delta and P̄ �ii /3 the mean stress �re-peated subscripts imply summation�. For a coordinate systemaligned with directions of principal stress, such that �11=�S is the longitudinal shock stress and �22 and �33 areprincipal stresses transverse to the shock propagation direc-tion, the von Mises criterion reduces to
Y = �S − �TY , �9�
where �TY ��22+�33� /2. Equation �9� is exact for isotropic
lateral stress ��22=�33� as is the case for �100� and �111�
FIG. 11. �Color online� Shock vs particle velocity measurementsfor diamond at high stress, showing the limit of the two-wave struc-ture. Data obtained using the methods described in Sec. III B areshown as filled squares ��110� diamond, green; polycrystalline CVDdiamond, orange�; in the two-wave regime, only D2-u2 data areshown; and corresponding precursor amplitudes can be found inTable II. Dashed colored lines are bounds on the overdrive velocity�DC� that separates the two-wave and single-wave regimes in thepresent measurements. Previous high-precision, single-wave Hugo-niot data on �110� diamond �Ref. 34� �green open squares�, �100�diamond �Ref. 27� �purple crossed square�, and polycrystalline dia-mond �Ref. 35� �orange open squares� are also plotted.
MCWILLIAMS et al. PHYSICAL REVIEW B 81, 014111 �2010�
014111-12

uniaxial strain in cubic crystals.62 When lateral stress is an-isotropic ��22��33� as can be the case for �110� uniaxialstrain,62 Eq. �9� is accurate to within 0.3% for diamond.47
For single crystals, strength can also be described usingthe resolved shear stress on preferred slip planes atyielding.16,62,63 In diamond, slip and fracture occurs prima-rily on �111� planes, as expected theoretically7 and observedin indentation tests,26 diamond-anvil cell �DAC� �quasistatic�high-pressure experiments,8 and shock compression.64 Thissuggests that finite-strain, while altering crystal symmetry,does not change the preferred slip plane referenced to theunstrained lattice. For elastic uniaxial strain in the �100�,�110�, and �111� directions of an fcc lattice, and presumingslip occurs on �111� planes in the direction of maximumresolved shear stress �a �112� direction in all cases�, thecritical-resolved shear stress �CRSS can be written as
�CRSS = ��S − �TCRSS�cos� n�sin� n� , �10�
where �TCRSS is the transverse stress in the plane containing
the shock-propagation direction and the �112� slip direction,and n is the angle from the shock-propagation direction tothe �111� slip-plane normal. For �100� and �110� uniaxialstrain, �T
CRSS=�22=�33; for �110�, �TCRSS equals either �22 or
�33 depending on the coordinates used to define the principalstresses. If slip occurs in a preferred direction that is not�112�, then �CRSS is reduced by the cosine of the angle be-tween �112� and the preferred slip direction in the �111�plane �e.g., if �110� �111� slip is assumed, �CRSS is reduced by�13%�. The normal �confining� stress on the slip plane atyielding, �n, can be written as
�n = �S cos2� n� + �TCRSS sin2� n� . �11�
In the present discussion, crystallographic directions andplanes in strained conditions are referenced to their un-strained cubic coordinates.
While the critical-resolved shear stress is arguably a morefundamental measure of strength for single crystals than theyield strength, it has limited applicability because it is notpossible to unambiguously define slip-system orientationsrelative to the stress field once inelastic deformation occurs.Therefore, only the von Mises criterion is used to evaluatestrength for states beyond yielding.
To evaluate Y, �CRSS and �n in the shock-compressedstates, the lateral stresses �T
Y and �TCRSS must be determined.
One approach, valid for elastic strain and hence only forconditions of incipient yielding at the HEL, is to calculatethe stress field �ij under uniaxial strain using known elasticconstants. This method has been described for shock com-pression of fcc single-crystals with �111� slip systems assum-ing linear elasticity and infinitesimal strain.62 Here, becauseof the high compressions experienced in diamond at its HEL,it was necessary to account for nonlinear elasticity and thechange in crystal symmetry under uniaxial strain. In predict-ing �ij with nonlinear elastic theory, we have consideredelastic constants up to the third order52,65 using bothLagrangian16,23,29,47 and Eulerian47 finite-strain formulations.
The other, more general approach to calculating lateralstress, also applicable for states beyond the HEL, is to com-pare the measured �S with the hydrostatic pressure PH at a
given volume.13 Considering the definition of P̄, we canwrite
�S − �T = �3/2��S − P̄� . �12�
Equation �12� is valid if �T=�TY =�T
CRSS when �22=�33 ��100�and �111� compression� or if �T=�T
Y when �22��33 ��110�compression�; when �22��33 it is not straightforward to de-fine �T
CRSS through Eq. �12�. At a given volume
P̄ − PH P . �13�
For diamond, P=0 is a good approximation.47
B. Strength of single-crystal diamond
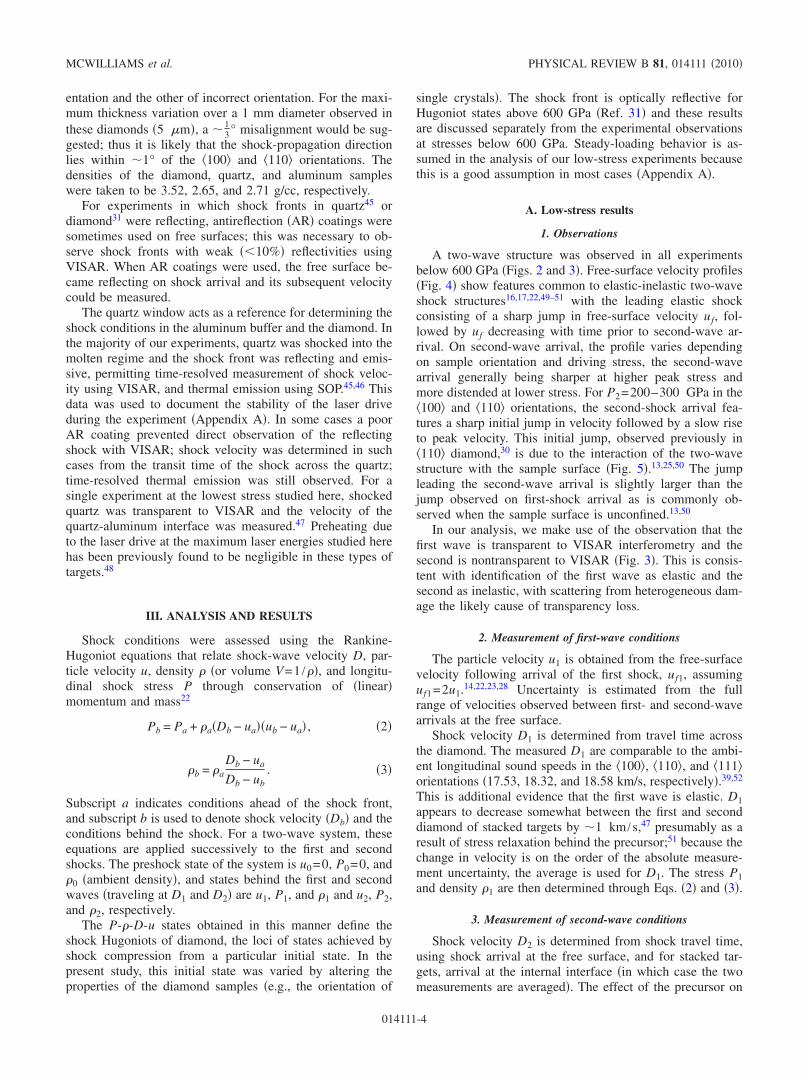
The strength of single-crystal diamond, taken from themeasured HEL values in each orientation, is shown in TableIII. Equation �12� was evaluated with PH determined on thehydrostatic isentrope �Appendix B�. Also shown in Table IIIare prior experimental and theoretical strength determina-tions. The present Y measurements are comparable to thosefrom DAC studies,8–10 though the DAC determinations tendto be larger. Presently measured Y and �CRSS are approxi-mately 1/3 of theoretical predictions on compression orshear;1–6 predictions of strength in tension4,7 are not directlyrelevant to our work, as tension promotes a mode of failurewith no analog in compression.
It is observed in the present data that �CRSS depends onloading direction and increases with �n �Fig. 12�. This isconsistent with theoretical expectations.3,5 The observed in-crease is approximately linear with a slope of �0.32, com-parable to that predicted by Ref. 3 ��0.26� but significantlylarger than predicted by Ref. 5 ��0.07�. Analyzing HEL datafor silicon61 �also an fcc lattice� in the same manner as fordiamond, a similar dependence of �CRSS on �n is observed�Fig. 12�. In contrast, �CRSS in single-crystal �fcc� copper isindependent of �n;62 this may be because the low confiningstress at the HEL in copper is not enough to significantlyalter that material’s strength.
The observation that the strength of single-crystal dia-mond increases with confining stress may explain the higheryield strengths observed in DAC experiments, as yielding inthe DAC occurs at higher confining stress than yielding un-der shock loading. We note that ramp-compression data onpolycrystalline diamond11 suggest that the elastic strength ofsingle crystal and polycrystalline diamond are comparableunder high strain-rate dynamic loading.
C. Yield strength under inelastic compression
The behavior of the yield strength under inelastic com-pression is shown in Fig. 13. In this figure, the strength ob-served in the precursor �Y1� and the strength observed in theinelastic wave �Y2� are compared using the quantity Y2 /Y1. Ywas determined from Eq. �12� with PH calculated on thehydrostatic isentrope for Y1 and the hydrostatic Hugoniot forY2 �Appendix B�.
For inelastic compression just beyond the HEL �to�160 GPa� the strength response varies with orientation.
STRENGTH EFFECTS IN DIAMOND UNDER SHOCK… PHYSICAL REVIEW B 81, 014111 �2010�
014111-13
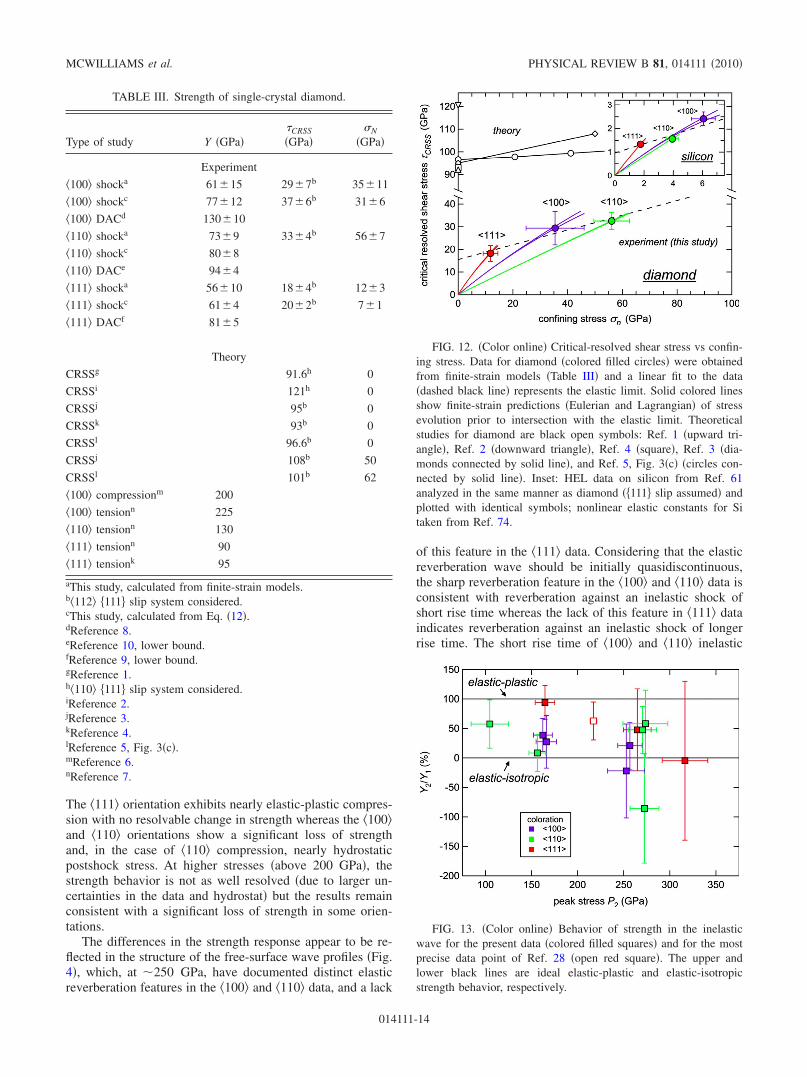
The �111� orientation exhibits nearly elastic-plastic compres-sion with no resolvable change in strength whereas the �100�and �110� orientations show a significant loss of strengthand, in the case of �110� compression, nearly hydrostaticpostshock stress. At higher stresses �above 200 GPa�, thestrength behavior is not as well resolved �due to larger un-certainties in the data and hydrostat� but the results remainconsistent with a significant loss of strength in some orien-tations.
The differences in the strength response appear to be re-flected in the structure of the free-surface wave profiles �Fig.4�, which, at �250 GPa, have documented distinct elasticreverberation features in the �100� and �110� data, and a lack
of this feature in the �111� data. Considering that the elasticreverberation wave should be initially quasidiscontinuous,the sharp reverberation feature in the �100� and �110� data isconsistent with reverberation against an inelastic shock ofshort rise time whereas the lack of this feature in �111� dataindicates reverberation against an inelastic shock of longerrise time. The short rise time of �100� and �110� inelastic
TABLE III. Strength of single-crystal diamond.
Type of study Y �GPa��CRSS
�GPa��N
�GPa�
Experiment
�100� shocka 61�15 29�7b 35�11
�100� shockc 77�12 37�6b 31�6
�100� DACd 130�10
�110� shocka 73�9 33�4b 56�7
�110� shockc 80�8
�110� DACe 94�4
�111� shocka 56�10 18�4b 12�3
�111� shockc 61�4 20�2b 7�1
�111� DACf 81�5
Theory
CRSSg 91.6h 0
CRSSi 121h 0
CRSSj 95b 0
CRSSk 93b 0
CRSSl 96.6b 0
CRSSj 108b 50
CRSSl 101b 62
�100� compressionm 200
�100� tensionn 225
�110� tensionn 130
�111� tensionn 90
�111� tensionk 95
aThis study, calculated from finite-strain models.b�112� �111� slip system considered.cThis study, calculated from Eq. �12�.dReference 8.eReference 10, lower bound.fReference 9, lower bound.gReference 1.h�110� �111� slip system considered.iReference 2.jReference 3.kReference 4.lReference 5, Fig. 3�c�.mReference 6.nReference 7.
FIG. 12. �Color online� Critical-resolved shear stress vs confin-ing stress. Data for diamond �colored filled circles� were obtainedfrom finite-strain models �Table III� and a linear fit to the data�dashed black line� represents the elastic limit. Solid colored linesshow finite-strain predictions �Eulerian and Lagrangian� of stressevolution prior to intersection with the elastic limit. Theoreticalstudies for diamond are black open symbols: Ref. 1 �upward tri-angle�, Ref. 2 �downward triangle�, Ref. 4 �square�, Ref. 3 �dia-monds connected by solid line�, and Ref. 5, Fig. 3�c� �circles con-nected by solid line�. Inset: HEL data on silicon from Ref. 61analyzed in the same manner as diamond ��111� slip assumed� andplotted with identical symbols; nonlinear elastic constants for Sitaken from Ref. 74.
FIG. 13. �Color online� Behavior of strength in the inelasticwave for the present data �colored filled squares� and for the mostprecise data point of Ref. 28 �open red square�. The upper andlower black lines are ideal elastic-plastic and elastic-isotropicstrength behavior, respectively.
MCWILLIAMS et al. PHYSICAL REVIEW B 81, 014111 �2010�
014111-14

shocks is likely coupled to strength loss since the probablemechanism for strength loss—shear banding—would coin-cide with rapid stress relaxation in the inelastic shock and asharper wavefront.18 The long rise time of the �111� inelasticshock suggests slow stress relaxation, likely a consequenceof plastic �rather than catastrophic� inelastic deformation andis consistent with the observed retention of strength in thisorientation. The differences in the strength response are alsoreflected in the slow second-shock velocities in the �100� and�110� orientations, relative to local bulk sound speeds �Fig.14�, a common indicator of strength loss.14,15,19
The cause of the observed differences in the inelasticstrength response is not known but may be related to thesignificantly lower elastic limit in the �111� orientation. Wenote that previous data on nearly �111�-oriented diamond,which exhibited a low elastic limit and evidence for nonhy-drostatic stress under shock compression �Fig. 8�, are consis-tent with the present �111� data.
Finally, the observation that limiting free-surface releasevelocities are low �uf2�2u2� at P2�300 GPa for all orien-tations shows that strength can affect the unloading behaviorof diamond even in cases where it has been significantlyreduced on initial shock compression.66 This is consistentwith the idea of a transient strength-loss mechanism, such asshear banding during shock compression followed by post-shock hardening due to the dissipation of thermalheterogeneities.15,17,18,20
D. Impurity effects
The preceding discussion treats the dynamic strength ofsingle-crystal diamond as if it were independent of diamondtype. However, under quasistatic loading, the presence ofimpurities is known to affect the mechanical properties ofdiamond26 and it is reasonable to expect similar effects under
dynamic loading. Type Ib diamonds, used here to study the�111� orientation, feature dispersed substitutional nitrogendefects, and are known to exhibit low strength in quasistaticindentation experiments, as well as the strongest tendencytoward plasticity.26 In contrast, types Ia and IIa diamonds,used to study the �100� and �110� orientations, typically con-tain aggregate nitrogen impurities �Ia� or lack significant ni-trogen impurities �IIa�, and tend to be harder in indentationtests, more resistant to plastic flow, and more prone to frac-ture in comparison with Ib samples.26 These properties areconsistent with the lower HEL and tendency to yield plasti-cally of �111�-oriented Ib samples and with the higher HELsand loss of strength on yielding apparent in �100�- and�110�-oriented Ia and IIa samples. Thus, while our strengthdata on single crystals has been interpreted in the context ofcrystalline anisotropy, it may become evident through furtherstudy that our observations have been influenced by defectcontent.
VI. COMPARISON TO OTHER HUGONIOTMEASUREMENTS
There have been a number of studies of the shock Hugo-niot of diamond in the stress range examined in the presentstudy,27,28,32–35 though only one of these studies reported atwo-wave structure.28 In this section, we consider the previ-ous Hugoniot data in the context of the present measure-ments. Since some data in which single waves were reportedare more precise than the present work and do not depend onassumptions that may reduce accuracy �i.e., uf2=2u2 used inthe present study at P2�600 GPa�, we examine whether anysystematic errors might have been incurred in those experi-ments where a two-wave structure was likely to have beenpresent but unobserved.
A. Hicks et al. 2008
Some of the present authors �Hicks et al.,34 HEA� haverecently published diamond Hugoniot measurements from600 to 1900 GPa on �110�-oriented diamond �Fig. 11�. Thepresent measurements on this orientation suggest that a two-wave structure should have occurred in diamond in thelowest-stress experiments of that study �at stresses less than�800 GPa and shock velocities less than 22.3�0.3 km /s�.As in Sec. III B of the present work, the velocity of thereflective �inelastic� shock in diamond was measured byVISAR in that study. An elastic precursor, had one beenpresent, would not have affected this measurement or beenobservable, though it could have generated a systematic errorin the analysis. This error is negligible if elastic precursorconditions are presumed similar in HEA and the presentwork. For the lowest-stress datapoint, where the error is larg-est, estimated corrections for a two-wave structure are −0.4%in u2, +0.6% in P2, and −1.0% in 2, which are well withinthe uncertainty of the original data.
B. Other data
High-stress diamond Hugoniot data have also been re-ported by Knudson, Desjarlais, and Dolan35 �KDD� for
FIG. 14. �Color online� Comparison of inelastic shock velocitywith bulk sound velocity. Inelastic shock data are from the presentstudy �colored filled squares�, Ref. 28 �open squares�, and Ref. 27�open crossed squares�. The black solid lines are limits on the localbulk sound speed �Appendix B�; the ambient bulk sound speed isthe black open triangle. Colored lines are bounds on shock veloci-ties for elastic-isotropic compression.
STRENGTH EFFECTS IN DIAMOND UNDER SHOCK… PHYSICAL REVIEW B 81, 014111 �2010�
014111-15

stresses between 550 and 1400 GPa on two varieties of poly-crystalline diamond �Fig. 11�; single-wave compression wasreported. The microcrystalline samples used in that study arederived from the same manufacturing process and supplier asthe polycrystalline samples studied here, and are consideredto be identical. The present measurements of DC in this ma-terial �21.6�0.3 km /s� indicate that a two-wave structuremay have been present at stresses lower than �700 GPa inthe experiments of KDD. It is not clear if an elastic precursorcould have been observed in those experiments or how itwould have affected the measurements. We note that a sig-nificant kink in the KDD Hugoniot at �21.5 km /s, identi-fied as the onset of melting by those authors, is identical toDC observed in the present study for microcrystalline dia-mond. We also note that the Hugoniot data of HEA, KDD,and the present study are in good agreement in the over-driven regime and diverge in the regime of the two-wavestructure �Fig. 11�.
Lower-precision high-stress Hugoniot data on �100� �Ref.33� and �110� �Ref. 32� diamond �500–2000 GPa� also re-ported single waves. The present observations suggest thatelastic precursors were likely to have been present in someexperiments from these studies as well. This could explainthe discrepancy between the travel-time-based andinterferometry-based shock velocity measurements in Ref.33 at low stress, and suggests that the transition identified asmelting in that study may also be related to precursor over-drive.
Two prior studies have examined the diamond Hugoniotat stresses below 500 GPa.27,28 The data of Kondo andAhrens,28 which included a two-wave structure and studiedstresses of �200 GPa in nearly �111�-oriented diamond, aregenerally consistent with the present data on �111� diamond�Figs. 7, 8, and 13�.
We conclude that the single-wave Hugoniot data ofPavlovskii27 on �100� diamond at stresses from 100 to 600GPa are in significant error. This is evident without referenceto the present measurements: three out of four datapoints inthat study have shock velocities less than the ambient �100�longitudinal sound speed �Fig. 7�, guaranteeing the presenceof a precursor wave in those experiments. The present dataon �100� diamond reinforce this conclusion and suggest thatthe fourth datapoint may also have exhibited a two-wavestructure. Accounting for the two-wave structure reveals sub-stantial systematic error in the original data—as large as 20%in stress and 5% in density or 37% in =2−0 for thelowest-stress datapoint.11,47 While Pavlovskii’s originalsingle-wave data are consistent with hydrostatic stress, esti-mated corrections to this data for the unobserved elastic pre-cursor result in a significant divergence from a hydrostaticresponse �Fig. 8�.
VII. CONCLUSIONS
We observe a two-wave elastic-inelastic shock structure inthree orientations of diamond single crystal and at least onevariety of diamond polycrystal to peak stresses as high as�800 GPa. Finite postshock shear stress is observed forcompression of �111�-oriented diamond �this study� and
nearly �111�-oriented diamond28 for shock loading to hun-dreds of GPa. Theoretical Hugoniot calculations assumingsingle-wave shock compression and hydrostatic stressconditions31,35,37,38 thus may not provide accurate represen-tations of the shock Hugoniot.
The low-stress Hugoniot of Pavlovskii27 is inconsistentwith the present results and a general linear D-u descriptionof the diamond Hugoniot does not appear to be realistic dueto: �1� the high elastic limit and the wide range of conditionsover which the two-wave structure occurs; �2� the occurrenceof strength loss beyond the elastic limit �which produces anonlinear D-u response�; �3� variations in the shock responsewith initial sample properties; and �4� the occurrence ofphase transitions31,35,37,38 at higher stress.
There is good agreement between the most precise Hugo-niot data at high stress34,35 only in the overdriven regime�Fig. 11�; in the regime of the two-wave structure these datasets diverge, consistent with our conclusion that strength ef-fects are present and need to be taken into account. Theobservation of an elastic precursor at conditions where thesecond shock is reflecting is evidence that the two-wavestructure can persist into the partially molten shock regime.31
We find that reported signatures of melting at 700–800GPa33,35 are well correlated with observed transitions fromtwo- to single-wave structures and thus could be related toprecursor overdrive. The onset of reflectingshocks31—occurring at �600 GPa in �110� diamond34—suggests that melting can begin at lower stress. Recentshock-temperature measurements also support an initiationof melting at �600 GPa �in both polycrystalline and �110�diamond�.36 This stress is near the lower end of theoreticalpredictions for the onset of melting which range from 625–745 GPa when single-wave compression is assumed.35,37,38
Hugoniot predictions including the two-wave structure willbe warmer �Appendix B� and are thus likely to intersect themelting curve at lower stress.
ACKNOWLEDGMENTS
Much of this research was completed at the University ofCalifornia, Berkeley �Ref. 47�. The authors thank MarcusKnudson, Yogendra Gupta, Michael Winey, Stefan Tur-neaure, Rudolf Wenk, and Brent Grocholski for helpful dis-cussions; Dwight Price, Ray Smith, Steve Letts, WalterUnites, Gary Loomis, and the staff of the Jupiter and Omegalaser facilities for technical support; the SEGRF and ILSAprograms at LLNL for financial support; and an anonymousreviewer for comments on the manuscript. This work wasperformed under the auspices of the U.S. Department of En-ergy by Lawrence Livermore National Laboratory underContracts No. W-7405-Eng-48 and No. DE-AC52-07NA27344, and by the University of Rochester under Co-operative Agreement No. DE-FC03-92SF19460.
APPENDIX A: EVALUATION OF DRIVE STEADINESS
The laser-driven shocks used in the present study are in-herently unsteady. As the shock travels away from the drivensurface, it experiences perturbations in amplitude, both posi-
MCWILLIAMS et al. PHYSICAL REVIEW B 81, 014111 �2010�
014111-16
tive and negative, due to variations in the pressure of thelaser-driven plasma during irradiation and due to release fol-lowing laser shutoff. The latter effect dominates our presentexperiments at P2�300 GPa, causing shock decay withtime. For P2�300 GPa, approximately steady-loading con-ditions are achieved with perturbations in shock-front ampli-tude being both positive and negative but centered aboutsome mean state. It is the mean state which we have at-tempted to characterize in our experiments as this is expectedto reasonably represent a state that would be obtained underideal steady loading. Below we characterize the magnitudeof these perturbations in such optimized, quasisteady experi-ments, using the quartz window as a diagnostic of loadingstability. We note that in such experiments, drive instabilityshould affect primarily second-shock amplitude �in diamond�since the elastic precursor, once separated from the secondshock, should be relatively insensitive to its amplitude.
Conditions at the quartz shock front and their variationwith time are observed in VISAR and SOP records �e.g., Fig.3� since the quartz shock front is reflecting and emissive45
for most of the experiments. The drive-pressure perturbationsaffecting the shock in quartz can be presumed to similarlyaffect the shock in diamond. Though the diamond shock isnot reflecting, transparent, or emissive at low stress,31,47 pre-venting time-resolved study of shock conditions, its variabil-ity in time can be estimated from that observed in quartzusing the relation
tQ = � cQ
cQ + uQ − DQ�� cD + uD − DD
cD�tD, �A1�
where a given perturbation due to the laser drive arrives atthe quartz and diamond shock fronts at time tQ and tD, re-spectively �where tQ and tD are measured relative to shockbreakout into diamond and quartz�. It is assumed in Eq. �A1�that perturbations arrive at the base of the diamond andquartz simultaneously and that they are small enough thatconstant D, u, and c can be assumed, where c is the soundspeed in the shock-compressed state; subscripts “Q” and “D”denote quantities in quartz and diamond, respectively. Ac-counting for impedance mismatches,67 variations in shockstress in diamond up to tD ��PD� can be estimated from ob-served variations in quartz up to tQ ��PQ� by
1 + ZA/ZQ
1 + ZA/ZD�PQ = �PD, �A2�
where ZA, ZQ, and ZD are the impedances of aluminum,quartz, and diamond, respectively, and can be estimated fromthe respective Hugoniots.
In shot dh14, at a mean peak stress of �265 GPa in dia-mond and �180 GPa in quartz—Fig. 3�a�—VISAR obser-vation of the quartz shock front revealed variations in shockvelocity with time. Equation �A1� gives tQ�0.92 tD for thisexperiment with D and u measured in the experiment �TableII�, cQ ��14 km /s� estimated from measured sound speedsin molten quartz,68 and cD ��26 km /s� estimated as a lon-gitudinal sound speed cD=cB
�3�1−�� / �1+�� from the Pois-son ratio ��0.1 �Ref. 26� and the bulk sound speed cB �Ap-pendix B�. Thus, drive-stress perturbations affecting the
diamond shock front to tD�12 ns �the time it takes for thesecond shock to transit the diamond� have similarly affectedthe quartz shock front to tQ�11 ns �a time at which thequartz shock is still transiting the sample�. The directly ob-served variation in the quartz shock-front conditions to tQ�11 ns has a standard deviation of �2.5% in shock veloc-ity and �6.4% in stress. Estimating ZA�56, ZQ�52, andZD�75 GPa / �km /s� at the appropriate high-stress condi-tions, a �7.6% variation in stress at the diamond shock frontduring sample transit is estimated; this is roughly equivalentto the uncertainty in P2 for this experiment, showing that theeffects of unsteady loading are accounted for in our uncer-tainty.
Thermal emission variations in quartz were consistentwith the variations in shock velocity. In a number ofexperiments—e.g., Fig. 3�c�—time-resolved velocimetrywas not obtained �due to poor AR coatings� and onlythermal-emission data was available. By comparison ofemission and VISAR data from different experiments, it wasclear that loading stability was relatively constant for givenlaser-drive conditions.
APPENDIX B: HYDROSTATIC HUGONIOT PREDICTION
The Hugoniot of diamond—assuming elastic-isotropiccompression �hydrostatic conditions in the peak state�—canbe predicted by a thermodynamic pathway that considersisentropic compression to the final volume, V2, followed byisochoric heating at V2 to final pressure P2 and internal en-ergy E2.69 In the present treatment we explicitly account forthe two-wave structure. The isentropic compression step isdescribed here by a third-order Birch-Murnaghan equation ofstate, where the subscript S is used to denote isentropic con-ditions.
PS�f� = 3K0Sf�1 + 2f�5/21 + �3/2��K0S/ − 4�f� , �B1�
where f = �1 /2��V0 /V�2/3−1� is the Eulerian isotropic strain,K0S=−V0��P /�V�S,P=0 is the ambient isentropic bulk modu-lus, and K0S
/ = ��K0S /�P�S,P=0 is the pressure derivative of thebulk modulus. Isothermal compression is also described byEq. �B1� if the isentropic moduli are replaced by isothermalmoduli: K0T=−V0��P /�V�T,P=0 and K0T
/ = ��K0T /�P�T,P=0.70
The isochoric heating step can be described by the Gruneisenequation of state, �=V��P /�E�V, where � is the Gruneisenparameter, leading to
P2�V2� = PS�V2� + ��/V2�E2�V2� − ES�V2�� . �B2�
The internal energy of the final state E2 is defined by theHugoniot equation22
E2 − E0 = 12 �P2 + P1��V1 − V2� + 1
2 �P1 + P0��V0 − V1� ,
�B3�
which has been adapted for a two-wave system. With Eq.�B3�, and considering that PS=−��E /�V�S, Eq. �B2� can bewritten as
STRENGTH EFFECTS IN DIAMOND UNDER SHOCK… PHYSICAL REVIEW B 81, 014111 �2010�
014111-17

P2�V2� = �1 −1
2��/V2��V1 − V2��−1
� �PS�V2� +�
V2�P0�V0 − V1�
2
+P1�V0 − V2�
2+ �
V0
V2
PSdV� . �B4�
The predicted D2 and u2 are then determined from P2�V2�using Eqs. �2� and �3�. In this analysis, the fact that theelastic precursor is in a state of anisotropic stress does notneed to be considered explicitly; only the isotropicallystressed final state is important.
The thermodynamic parameters required by our model areK0S, K0S
/ , and �. In the present model we assume that �varies as �=�0�V /V0�, where �0=0.773 is the ambient valueof � �though predictions are not significantly different if �=�0 is assumed�. A precise value of K0S was obtained fromthe isentropic second-order elastic constants52,70 as K0S=444.8 ��0.7� GPa; this was consistent with but moreprecise than K0S=437.8 ��8.5� GPa obtained from isother-mal static compression measurements of K0T.47,71,72 K0S
/ wasdetermined from K0T
/ measured by isothermalcompression47,71,72 as K0S
/ =3.93 ��0.27�.We consider this model accurate to �400 GPa; above
this stress, uncertainties become large, extrapolations be-come model dependent,47 and phase transitions31,38 may af-fect the compressibility.
For the calculations of P2, 2, D2, and u2, we consideredthe parameters of the elastic precursor P1, 1, D1, and u1 tobe fixed at the HEL. Uncertainty in the HEL and the scalingof precursor amplitude with second-wave stress are not usedin the predictions for the sake of clarity. Accounting for pre-cursor uncertainty and scaling somewhat affects the D2-u2predictions but does not noticeably affect the P2-2 predic-tions.
In the case of single-wave shock compression, i.e., whenthe elastic precursor is overdriven, V1=V0, and P1= P0 in Eq.�B4�. One effect of considering the precursor is to increasethe dissipative thermal pressure Pdiss P2-PS at a given vol-ume. At P2�150 GPa on the hydrostatic Hugoniot, Pdiss�5 GPa for a two-wave treatment, compared to a Pdiss�2 GPa for a treatment that ignores the elastic precursor.The difference in thermal pressure PTh between these twotreatments ��3 GPa� is related to the temperature differenceT by PTh=�00CVT, assuming a constant specific heatCV and the volume dependence of � discussed earlier. Esti-mating CV from its measured value at 1000 K and ambientpressure,73 the temperature difference between the single-and double-wave calculation at P2�150 GPa is �625 K.This is comparable to the calculated single-wave shock tem-perature of 650–1200 K.37,38 Thus, at low stresses in dia-mond, elastic-isotropic compression produces Hugoniot tem-peratures approximately 50–100 % larger than what wouldbe obtained by single-shock isotropic compression.
The bulk sound speed cB at V2 was estimated from Eq.�B1� as cB=���P /��S.
*Corresponding author. Present address: Institute for Shock Phys-ics, Washington State University, Pullman, WA 99164, [email protected] W. R. Tyson, Philos. Mag. 14, 925 �1966�.2 A. Kelly, W. R. Tyson, and A. H. Cottrell, Philos. Mag. 15, 567
�1967�.3 H. Chacham and L. Kleinman, Phys. Rev. Lett. 85, 4904 �2000�.4 D. Roundy and M. L. Cohen, Phys. Rev. B 64, 212103 �2001�.5 Y. Umeno and M. Cerny, Phys. Rev. B 77, 100101 �2008�.6 J. J. Zhao, S. Scandolo, J. Kohanoff, G. L. Chiarotti, and
E. Tosatti, Appl. Phys. Lett. 75, 487 �1999�.7 R. H. Telling, C. J. Pickard, M. C. Payne, and J. E. Field, Phys.
Rev. Lett. 84, 5160 �2000�.8 M. I. Eremets, I. A. Trojan, P. Gwaze, J. Huth, R. Boehler, and
V. D. Blank, Appl. Phys. Lett. 87, 141902 �2005�.9 Y. Akahama and H. Kawamura, J. Appl. Phys. 98, 083523
�2005�.10 Y. Akahama and H. Kawamura, High Press. Res. 27, 473 �2007�.11 D. K. Bradley, J. H. Eggert, R. F. Smith, S. T. Prisbrey, D. G.
Hicks, D. G. Braun, J. Biener, A. V. Hamza, R. E. Rudd, andG. W. Collins, Phys. Rev. Lett. 102, 075503 �2009�.
12 L. V. Altshuler, M. N. Pavlovskii, and V. P. Drakin, Sov. Phys.JETP 25, 260 �1967�.
13 G. R. Fowles, J. Appl. Phys. 32, 1475 �1961�.14 R. A. Graham and W. P. Brooks, J. Phys. Chem. Solids 32, 2311
�1971�.
15 D. E. Grady, in High Pressure Research: Applications in Geo-physics, edited by M. H. Manghnani and S. Akimoto �Academic,New York, 1977�.
16 L. Davison and R. A. Graham, Phys. Rep. 55, 255 �1979�.17 D. E. Grady, J. Geophys. Res. 85, 913 �1980�.18 D. E. Grady and J. R. Asay, J. Appl. Phys. 53, 7350 �1982�.19 D. E. Grady, Sandia National Laboratories Report No.
SAND94–3266, 1995.20 T. J. Vogler and L. C. Chhabildas, Int. J. Impact Eng. 33, 812
�2006�.21 J. R. Asay, T. Ao, J. P. Davis, C. Hall, T. J. Vogler, and G. T.
Gray, J. Appl. Phys. 103, 083514 �2008�.22 J. Wackerle, J. Appl. Phys. 33, 922 �1962�.23 R. Fowles, J. Geophys. Res. 72, 5729 �1967�.24 T. Mashimo, Y. Hanaoka, and K. Nagayama, J. Appl. Phys. 63,
327 �1988�.25 T. Goto, T. Sato, and Y. Syono, Jpn. J. Appl. Phys., Part 2 21,
L369 �1982�.26 J. E. Field, The Properties of Natural and Synthetic Diamond
�Academic, San Diego, 1992�.27 M. N. Pavlovskii, Sov. Phys. Solid State 13, 741 �1971�.28 K. Kondo and T. J. Ahrens, Geophys. Res. Lett. 10, 281 �1983�.29 J. M. Boteler and Y. M. Gupta, Phys. Rev. B 66, 014107 �2002�.30 M. D. Knudson, J. R. Asay, S. C. Jones, and Y. M. Gupta, Sandia
National Laboratories Report No. SAND2001–3738, 2001.31 D. K. Bradley, J. H. Eggert, D. G. Hicks, P. M. Celliers, S. J.
MCWILLIAMS et al. PHYSICAL REVIEW B 81, 014111 �2010�
014111-18

Moon, R. C. Cauble, and G. W. Collins, Phys. Rev. Lett. 93,195506 �2004�.
32 H. Nagao, K. G. Nakamura, K. Kondo, N. Ozaki, K. Takamatsu,T. Ono, T. Shiota, D. Ichinose, K. A. Tanaka, K. Wakabayashi,K. Okada, M. Yoshida, M. Nakai, K. Nagai, K. Shigemori,T. Sakaiya, and K. Otani, Phys. Plasmas 13, 052705 �2006�.
33 S. Brygoo, E. Henry, P. Loubeyre, J. Eggert, M. Koenig,B. Loupias, A. Benuzzi-Mounaix, and M. R. Le Gloahec, NatureMater. 6, 274 �2007�.
34 D. G. Hicks, T. R. Boehly, P. M. Celliers, D. K. Bradley, J. H.Eggert, R. S. McWilliams, R. Jeanloz, and G. W. Collins, Phys.Rev. B 78, 174102 �2008�.
35 M. D. Knudson, M. P. Desjarlais, and D. H. Dolan, Science 322,1822 �2008�.
36 J. H. Eggert, D. G. Hicks, P. M. Celliers, D. K. Bradley, R. S.McWilliams, R. Jeanloz, J. E. Miller, T. R. Boehly, and G. W.Collins, Nat. Phys. 6, 40 �2010�.
37 N. A. Romero and W. D. Mattson, Phys. Rev. B 76, 214113�2007�.
38 A. A. Correa, L. X. Benedict, D. A. Young, E. Schwegler, andS. A. Bonev, Phys. Rev. B 78, 024101 �2008�.
39 K. Brugger, J. Appl. Phys. 36, 759 �1965�.40 J. M. Winey and Y. M. Gupta, J. Appl. Phys. 96, 1993 �2004�.41 L. M. Barker and R. E. Hollenbach, J. Appl. Phys. 43, 4669
�1972�.42 P. M. Celliers, D. K. Bradley, G. W. Collins, D. G. Hicks, T. R.
Boehly, and W. J. Armstrong, Rev. Sci. Instrum. 75, 4916�2004�.
43 J. E. Miller, T. R. Boehly, A. Melchior, D. D. Meyerhofer, P. M.Celliers, J. H. Eggert, D. G. Hicks, C. M. Sorce, J. A. Oertel, andP. M. Emmel, Rev. Sci. Instrum. 78, 034903 �2007�.
44 D. K. Spaulding, D. G. Hicks, R. F. Smith, J. H. Eggert, R. S.McWilliams, G. W. Collins, and R. Jeanloz, in Shock Compres-sion of Condensed Matter, edited by M. Elert et al., AIP Conf.Proc. No. 955, �AIP, New York, 2007�, p. 1071.
45 D. G. Hicks, T. R. Boehly, J. H. Eggert, J. E. Miller, P. M.Celliers, and G. W. Collins, Phys. Rev. Lett. 97, 025502 �2006�.
46 D. G. Hicks, T. R. Boehly, P. M. Celliers, J. H. Eggert, E. Vi-anello, D. D. Meyerhofer, and G. W. Collins, Phys. Plasmas 12,082702 �2005�.
47 R. S. McWilliams, Ph.D. thesis, University of California Berke-ley, 2008.
48 T. R. Boehly, D. G. Hicks, P. M. Celliers, T. J. B. Collins,R. Earley, J. H. Eggert, D. Jacobs-Perkins, S. J. Moon, E. Vi-anello, D. D. Meyerhofer, and G. W. Collins, Phys. Plasmas 11,L49 �2004�.
49 J. W. Taylor, J. Appl. Phys. 36, 3146 �1965�.50 J. W. Taylor and M. H. Rice, J. Appl. Phys. 34, 364 �1963�.
51 J. R. Asay, Y. Gupta, and G. R. Fowles, J. Appl. Phys. 43, 744�1972�.
52 R. Vogelgesang, A. K. Ramdas, S. Rodriguez, M. Grimsditch,and T. R. Anthony, Phys. Rev. B 54, 3989 �1996�.
53 G. R. Fowles, Poulter Laboratories Technical Report No. 003–61, 1961.
54 T. J. Ahrens, W. H. Gust, and E. B. Royce, J. Appl. Phys. 39,4610 �1968�.
55 G. I. Kerley, in Equations of State for Composite Materials,Kerley Report No. KPS99–4 �Kerley Publishing Services, Albu-querque, NM, 1999�.
56 G. I. Kerley, Int. J. Impact Eng. 5, 441 �1987�.57 P. M. Celliers, G. W. Collins, D. G. Hicks, and J. H. Eggert, J.
Appl. Phys. 98, 113529 �2005�.58 D. Hayes, J. Appl. Phys. 89, 6484 �2001�.59 J. Eggert, S. Brygoo, P. Loubeyre, R. S. McWilliams, P. M.
Celliers, D. G. Hicks, T. R. Boehly, R. Jeanloz, and G. W. Col-lins, Phys. Rev. Lett. 100, 124503 �2008�.
60 D. G. Hicks, T. R. Boehly, P. M. Celliers, J. H. Eggert, S. J.Moon, D. D. Meyerhofer, and G. W. Collins, Phys. Rev. B 79,014112 �2009�.
61 W. H. Gust and E. B. Royce, J. Appl. Phys. 42, 1897 �1971�.62 O. E. Jones and J. D. Mote, J. Appl. Phys. 40, 4920 �1969�.63 W. J. Murri and G. D. Anderson, J. Appl. Phys. 41, 3521 �1970�.64 J. H. Eggert, D. G. Hicks, P. M. Celliers, D. K. Bradley, J. E.
Cox, W. G. Unites, G. W. Collins, R. S. McWilliams, R. Jeanloz,S. Brygoo, and P. Loubeyre, in Proceedings of Joint 20thAIRAPT-43th EHPRG International Conference on High Pres-sure Science and Technology, Karlsruhe, 2005.
65 E. Anastassakis, A. Cantarero, and M. Cardona, Phys. Rev. B41, 7529 �1990�.
66 R. G. McQueen, S. P. Marsh, J. W. Taylor, J. N. Fritz, and W. J.Carter, in High-Velocity Impact Phenomena, edited by R. Kin-slow �Academic, New York, 1970�.
67 J. Lipkin and J. R. Asay, J. Appl. Phys. 48, 182 �1977�.68 J. A. Akins and T. J. Ahrens, Geophys. Res. Lett. 29, 1394
�2002�.69 R. Jeanloz, P. M. Celliers, G. W. Collins, J. H. Eggert, K. K. M.
Lee, R. S. McWilliams, S. Brygoo, and P. Loubeyre, Proc. Natl.Acad. Sci. U.S.A. 104, 9172 �2007�.
70 F. Birch, J. Geophys. Res. 83, 1257 �1978�.71 F. Occelli, P. Loubeyre, and R. Letoullec, Nature Mater. 2, 151
�2003�.72 F. Datchi, A. Dewaele, Y. Le Godec, and P. Loubeyre, Phys. Rev.
B 75, 214104 �2007�.73 A. C. Victor, J. Chem. Phys. 36, 1903 �1962�.74 H. J. McSkimin and J. P. Andreatch, J. Appl. Phys. 35, 3312
�1964�.
STRENGTH EFFECTS IN DIAMOND UNDER SHOCK… PHYSICAL REVIEW B 81, 014111 �2010�
014111-19