strength of materials - İtÜweb.itu.edu.tr/haluk/som/strength_of_materials_week2.pdf · strength...
TRANSCRIPT
Betonarme Yapılar
Dr. Haluk SesigürI.T.U. Faculty of ArchitectureStructural and Earthquake Engineering WG
Strength of Materials
Internal Force Diagrams

Strength of MaterialsInternal Force Diagrams
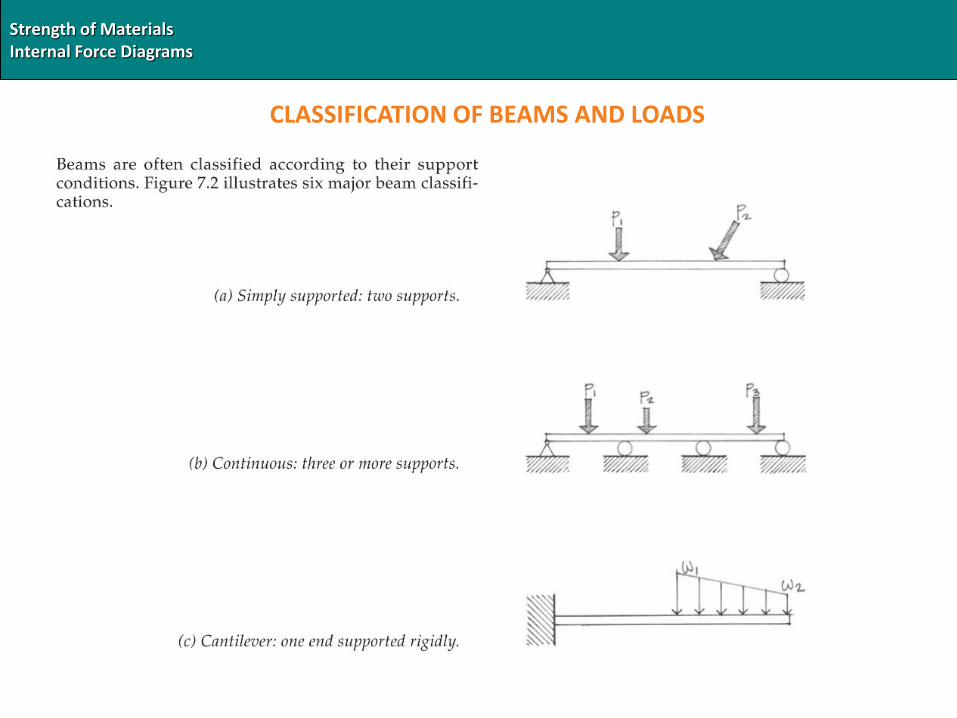
CLASSIFICATION OF BEAMS AND LOADS
Strength of MaterialsInternal Force Diagrams
CLASSIFICATION OF BEAMS AND LOADS

Strength of MaterialsInternal Force Diagrams
CLASSIFICATION OF BEAMS AND LOADS

Strength of MaterialsInternal Force Diagrams
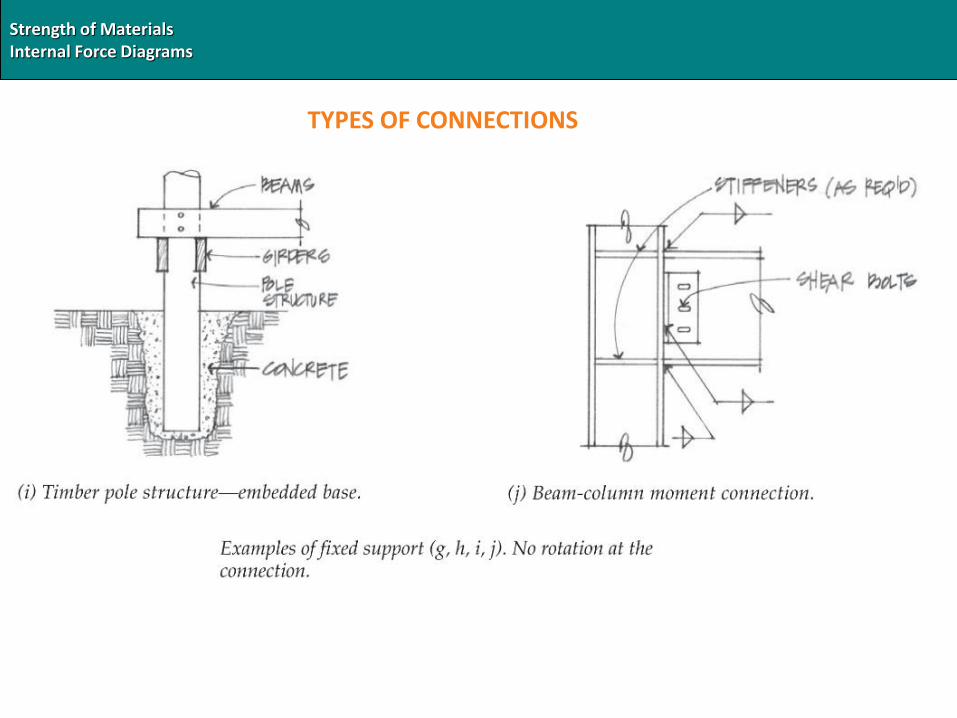
TYPES OF CONNECTIONS

Strength of MaterialsInternal Force Diagrams
TYPES OF CONNECTIONS

Strength of MaterialsInternal Force Diagrams
TYPES OF CONNECTIONS
Strength of MaterialsInternal Force Diagrams
TYPES OF CONNECTIONS
Strength of MaterialsInternal Force Diagrams
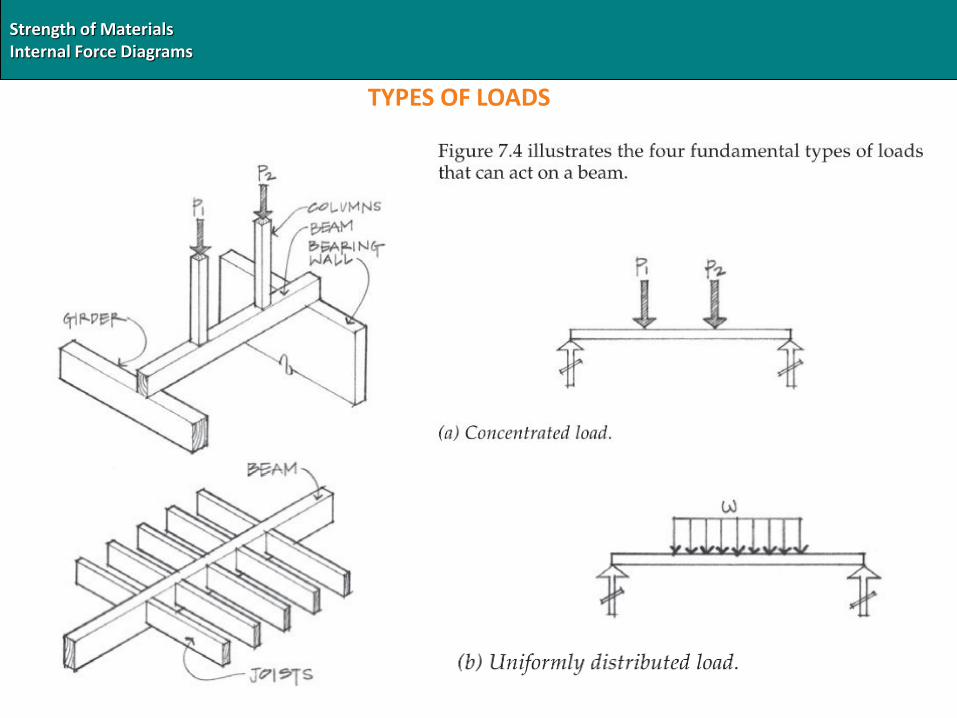
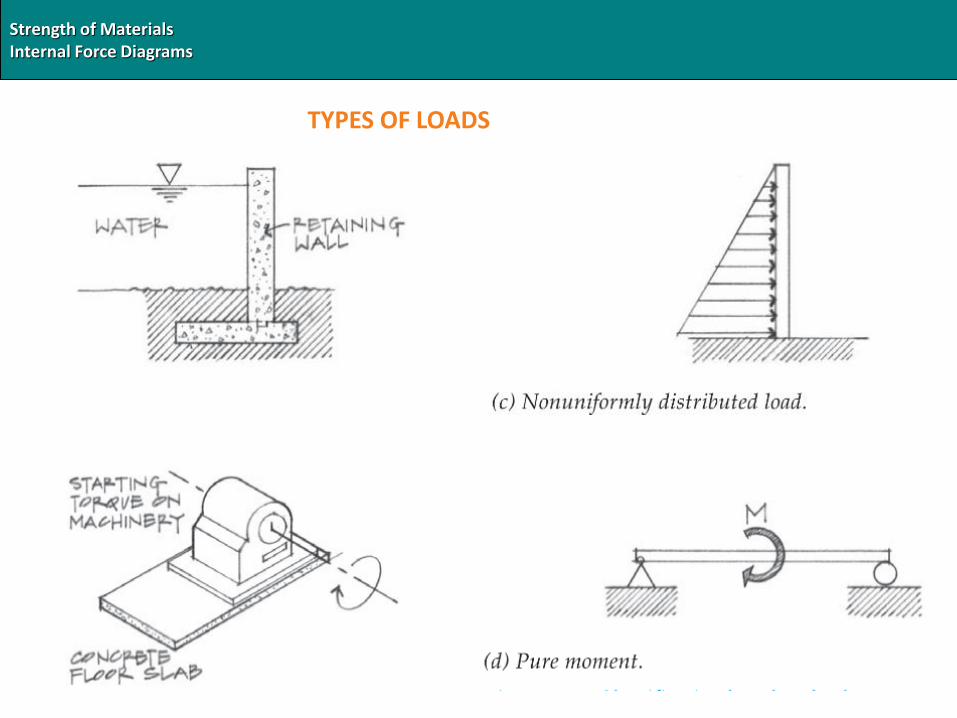
TYPES OF LOADS
Strength of MaterialsInternal Force Diagrams
TYPES OF LOADS

Strength of MaterialsInternal Force Diagrams
DEFORMATION OF STRUCTURES
Deformations in beams due to point loadsPoint loaded beams

Strength of MaterialsInternal Force Diagrams
DEFORMATION OF STRUCTURES
A downward deformation leads TENSION (T)stresses at the bottom of the beam element
T
T
An upward deformation leads TENSION (T)stresses at the top of the beam element
Strength of MaterialsInternal Force Diagrams
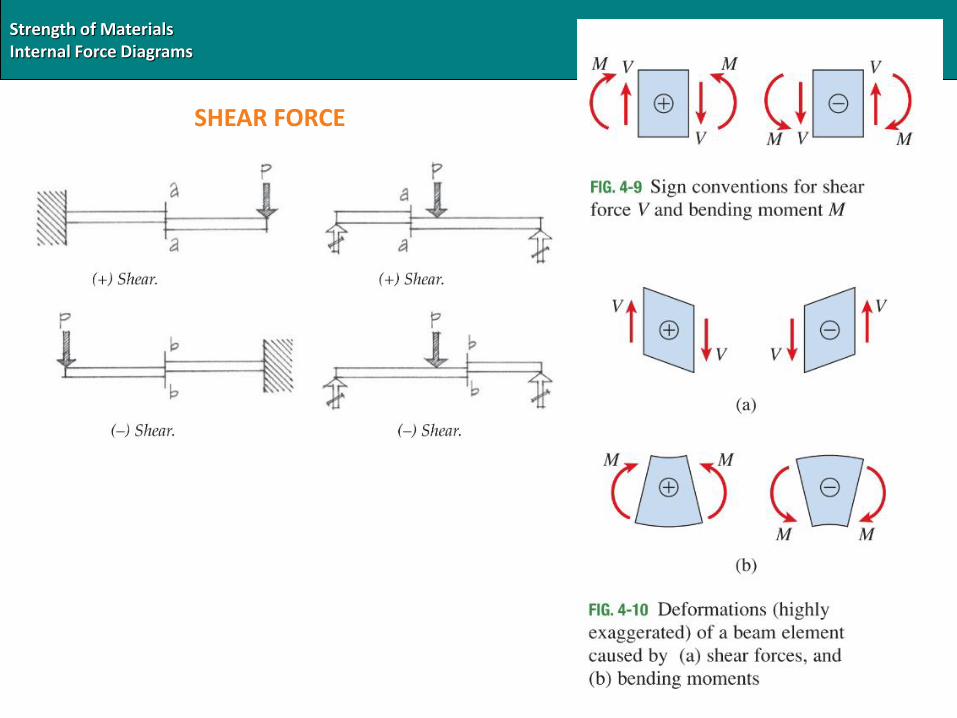
SHEAR FORCE

Strength of MaterialsInternal Force Diagrams
BENDING MOMENT

Strength of MaterialsInternal Force Diagrams
DEFORMATION DUE TO BENDING (T:Tension, C:Compression)Negative bending
Positive bending (hogging)
Negative bending (sagging)
Strength of MaterialsInternal Force Diagrams
+
+
_ ( V )
( M )

Strength of MaterialsInternal Force Diagrams
+_ ( V )
( M )+

Strength of MaterialsInternal Force Diagrams
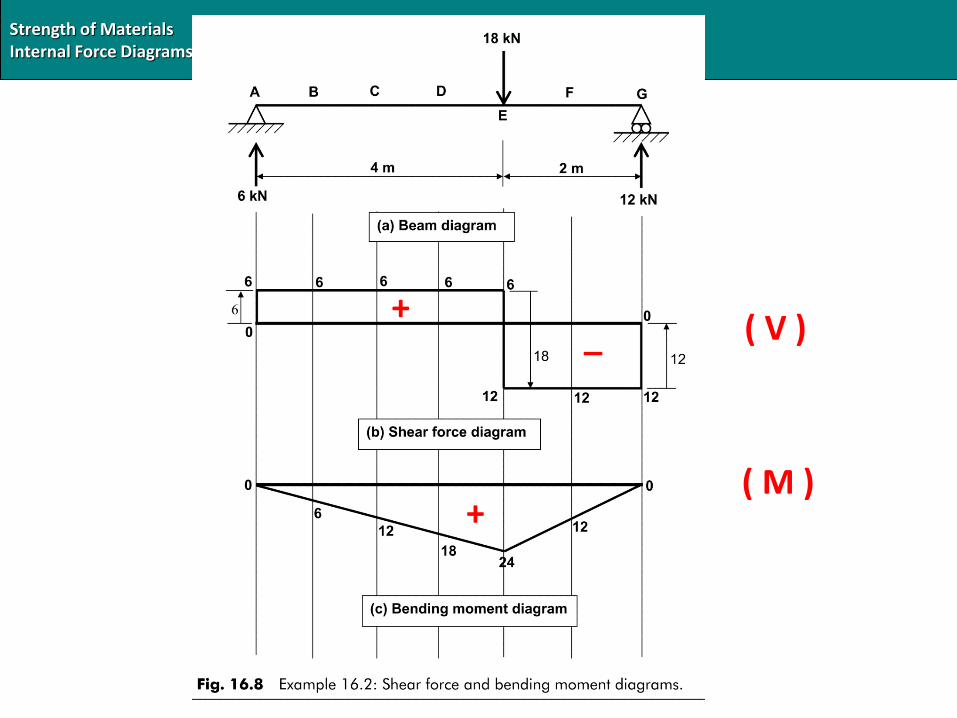
Shear Force Diagram of the point loaded beam - Follow the arrows
+_ ( V )
Note that:Between point forces shear forcediagram shows constant variation
Strength of MaterialsInternal Force Diagrams
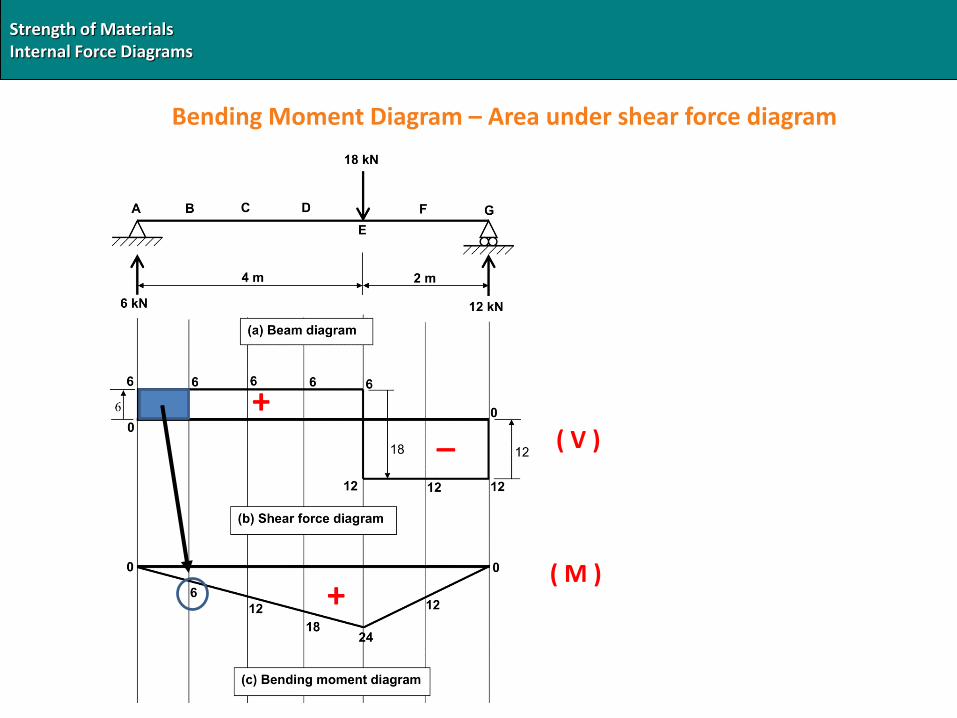
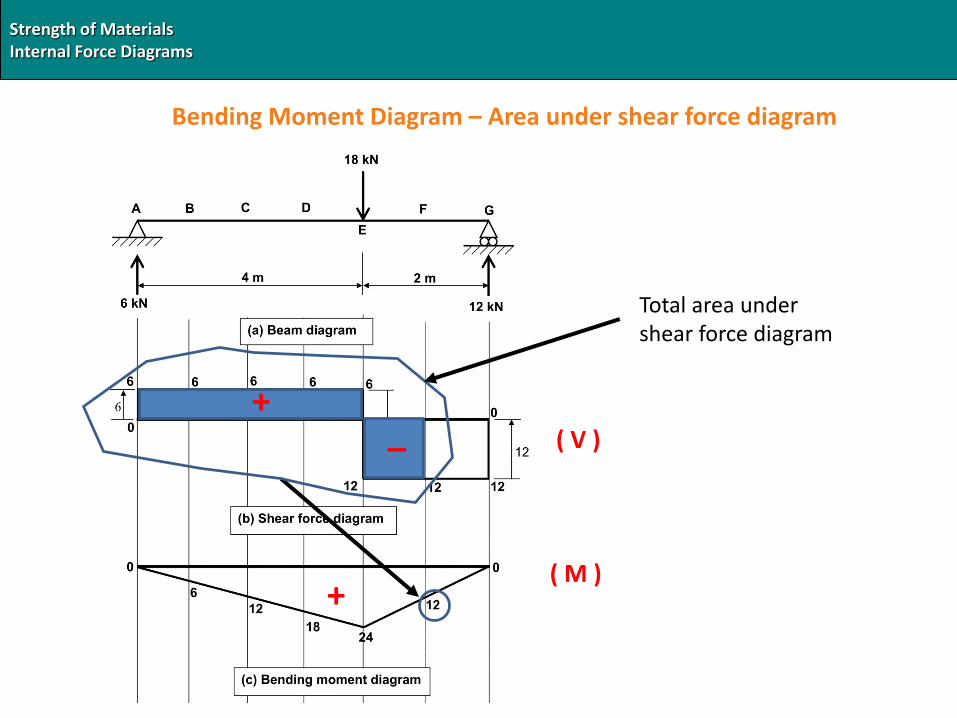
Bending Moment Diagram – Area under shear force diagram
+
+
_ ( V )
( M )

Strength of MaterialsInternal Force Diagrams
Bending Moment Diagram – Area under shear force diagram
+
+
_ ( V )
( M )

Strength of MaterialsInternal Force Diagrams
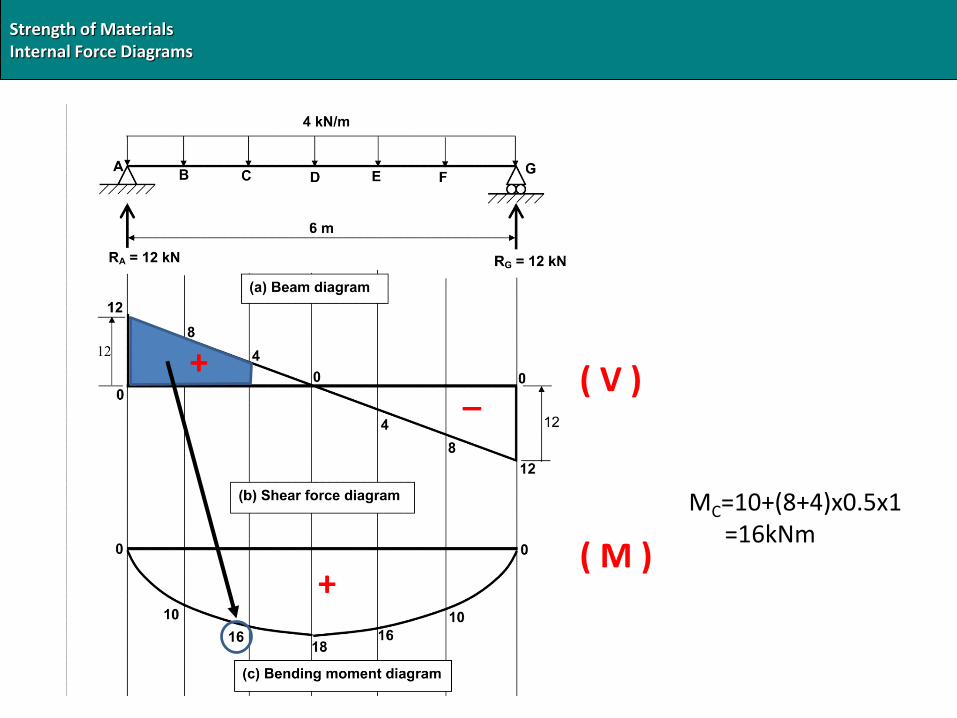
Bending Moment Diagram – Area under shear force diagram
+
_ ( V )
( M )
+

Strength of MaterialsInternal Force Diagrams
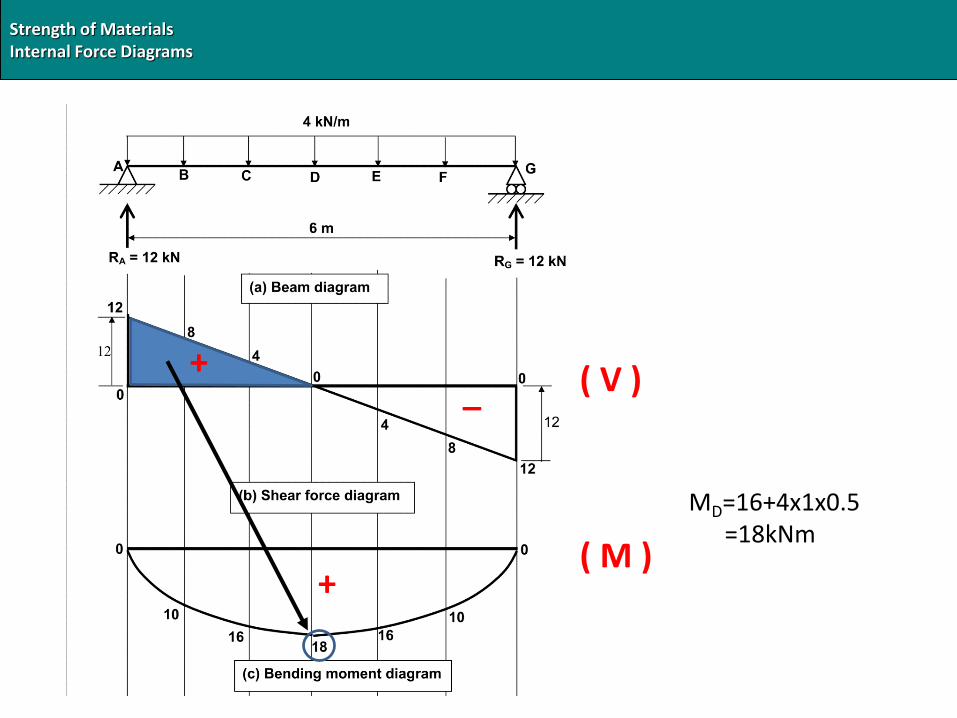
Bending Moment Diagram – Area under shear force diagram
+
_ ( V )
( M )
+
Strength of MaterialsInternal Force Diagrams
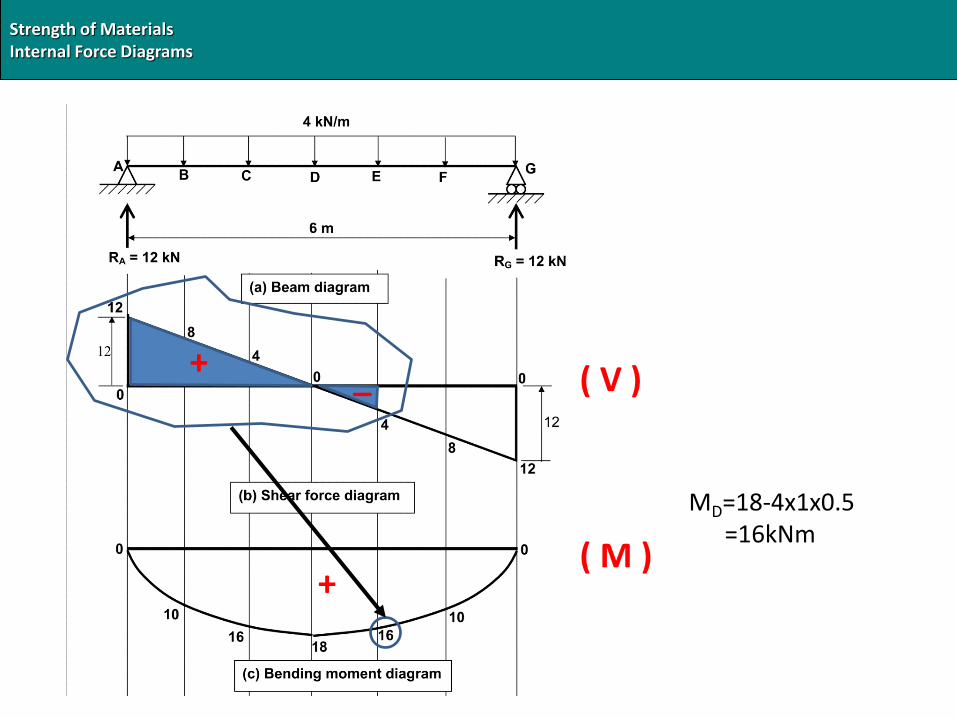
Bending Moment Diagram – Area under shear force diagram
+
( V )
( M )
+_
Total area undershear force diagram

Strength of MaterialsInternal Force Diagrams
Bending Moment Diagram – Area under shear force diagram
+
( V )
( M )
+_
Total area undershear force diagram

Strength of MaterialsInternal Force Diagrams
Shear Force and Bending Moment Diagramsarrows
+
+
_ ( V )
( M )

Strength of MaterialsInternal Force Diagrams
+_
( V )
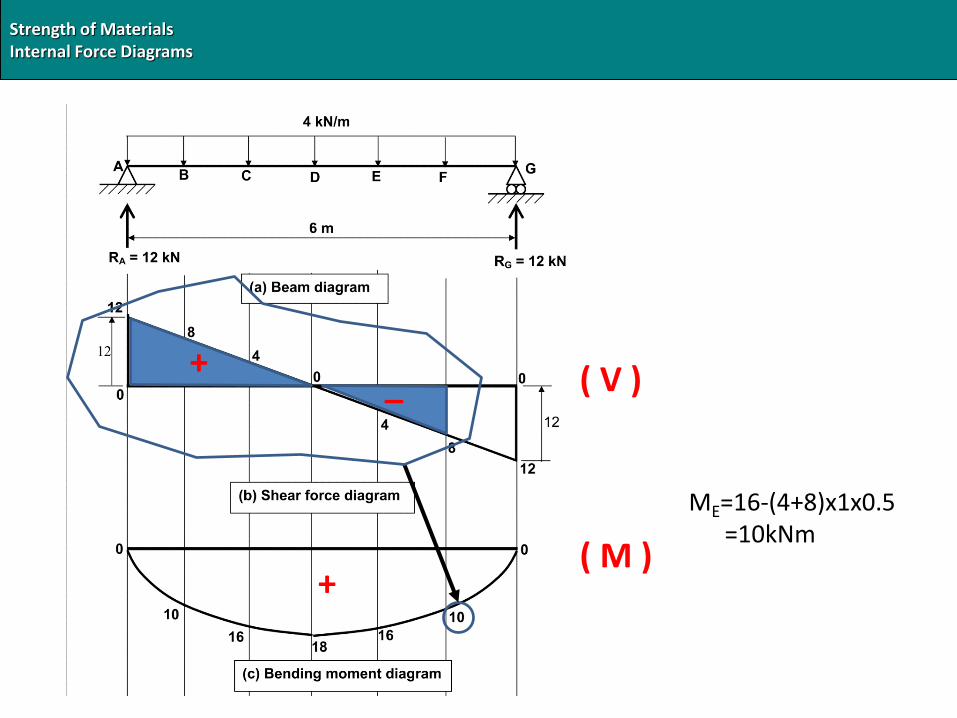
Shear Force Diagram of the uniform distributed loaded beam
For this load condition shear forces are decreasing linearly between point forces. To beginThe diagram follow the arrow at point A, 12kN than calculate the shear force variation dueTo distributed load. shear forces decreasing linearly (4kN/m x 6m=24kN)from +12kN at point A to (+12-24 = -12kN) -12kN at point G. At the right support close the
Shear force diagram with the force RG=12kN.

Strength of MaterialsInternal Force Diagrams
TYPES OF CONNECTIONS
+_ ( V )
( M )+
MB=(12+8)x0.5x1=10kNm
Strength of MaterialsInternal Force Diagrams
TYPES OF CONNECTIONS
_ ( V )
( M )+
+
MC=10+(8+4)x0.5x1=16kNm
Strength of MaterialsInternal Force Diagrams
TYPES OF CONNECTIONS
_ ( V )
( M )+
+
MD=16+4x1x0.5=18kNm
Strength of MaterialsInternal Force Diagrams
TYPES OF CONNECTIONS
( V )
( M )+
+ _
MD=18-4x1x0.5=16kNm
Strength of MaterialsInternal Force Diagrams
TYPES OF CONNECTIONS
( V )
( M )+
+_
ME=16-(4+8)x1x0.5=10kNm

Strength of MaterialsInternal Force Diagrams
TYPES OF CONNECTIONS
( V )
( M )+
+_
ME=10-(12+8)x1x0.5=0

Strength of MaterialsInternal Force Diagrams
( V )+
_
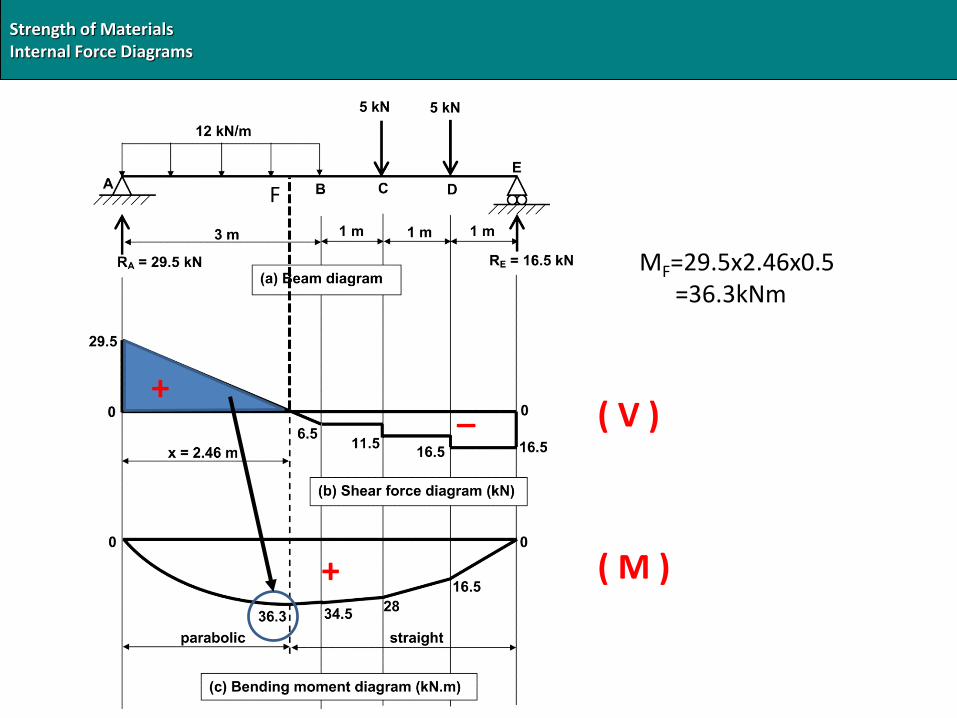
VB=29.5-12x3=-6.5kN
VC=-6.5-5=-11.5kN
VD=-11.5-5=-16.5kN
EXAMPLE:
Strength of MaterialsInternal Force Diagrams
( V )
( M )
_
+
+
MF=29.5x2.46x0.5=36.3kNm
F
Strength of MaterialsInternal Force Diagrams
( V )
( M )
_
+
+ 0.54m
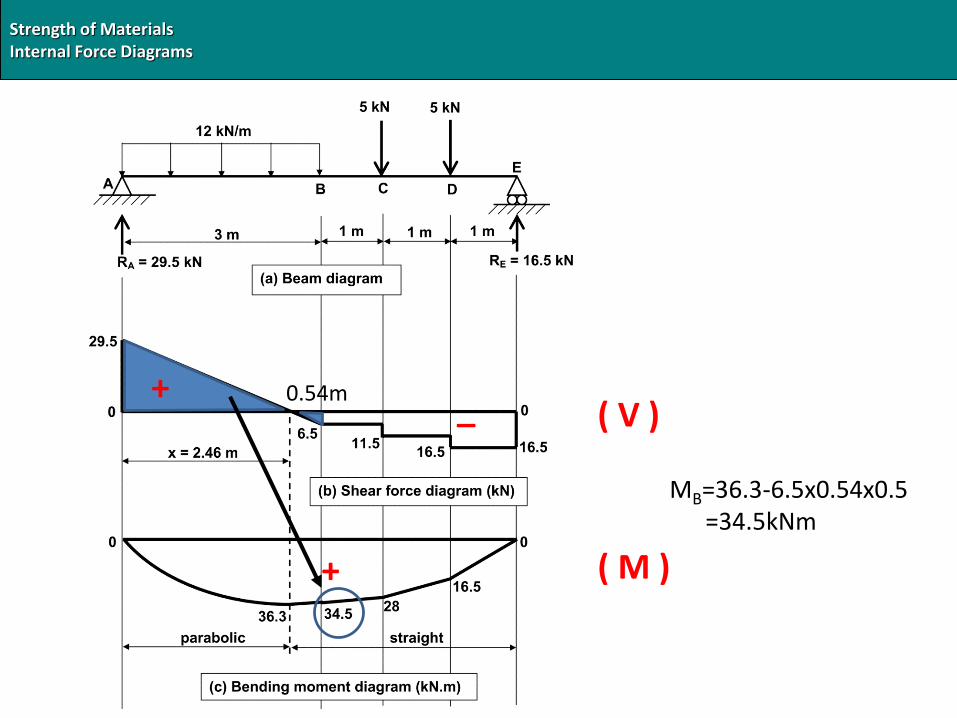
MB=36.3-6.5x0.54x0.5=34.5kNm

Strength of MaterialsInternal Force Diagrams
( V )
( M )
_
+
+ 0.54m
MB=34.5-6.5x1=28kNm

Strength of MaterialsInternal Force Diagrams
( V )
( M )+
+ 0.54m
MB=28-11.5x1=16.5kNm
_
Strength of MaterialsInternal Force Diagrams
( V )
( M )+
+ 0.54m
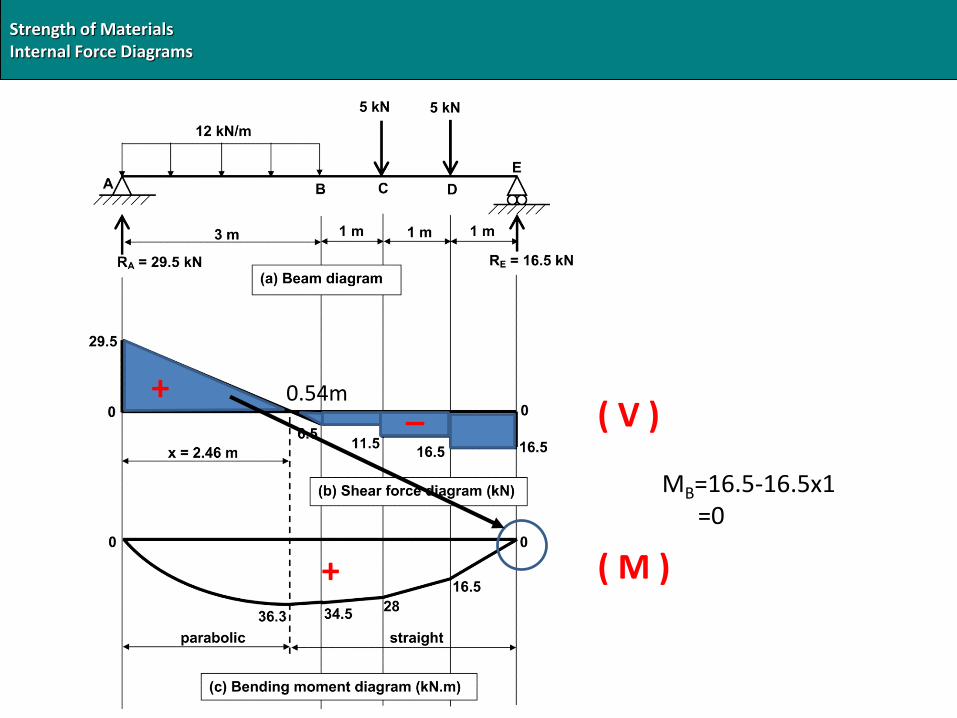
MB=16.5-16.5x1=0
_

Strength of MaterialsInternal Force Diagrams
LETS REMEMBER
Strength of MaterialsInternal Force Diagrams

Strength of MaterialsInternal Force Diagrams