strengthening indicator-based surveillance -...
TRANSCRIPT

Strengthening indicator-based surveillance
Stage Two BookletStrengthening surveillance of
and response to foodborne diseases


Strengthening indicator-based surveillance
Strengthening surveillance of and response to foodborne diseases
Stage Two Booklet

Strengthening surveillance of and response to foodborne diseases: a practical manual. Stage 2. Strengthening indicator-based surveillance
ISBN 978-92-4-151325-8
© World Health Organization 2017
Some rights reserved. This work is available under the Creative Commons Attribution-NonCommercial-ShareAlike 3.0 IGO licence (CC BY-NC-SA 3.0 IGO; https://creativecommons.org/licenses/by-nc-sa/3.0/igo).
Under the terms of this licence, you may copy, redistribute and adapt the work for non-commercial purposes, provided the work is appropriately cited, as indicated below. In any use of this work, there should be no suggestion that WHO endorses any specific organization, products or services. The use of the WHO logo is not permitted. If you adapt the work, then you must license your work under the same or equivalent Creative Commons licence. If you create a translation of this work, you should add the following disclaimer along with the suggested citation: “This translation was not created by the World Health Organization (WHO). WHO is not responsible for the content or accuracy of this translation. The original English edition shall be the binding and authentic edition”.
Any mediation relating to disputes arising under the licence shall be conducted in accordance with the mediation rules of the World Intellectual Property Organization.
Suggested citation. Strengthening surveillance of and response to foodborne diseases: a practical manual. Introductory module. Geneva: World Health Organization; 2017. Licence: CC BY-NC-SA 3.0 IGO.
Cataloguing-in-Publication (CIP) data. CIP data are available at http://apps.who.int/iris.
Sales, rights and licensing. To purchase WHO publications, see http://apps.who.int/bookorders. To submit requests for commercial use and queries on rights and licensing, see http://www.who.int/about/licensing.
Third-party materials. If you wish to reuse material from this work that is attributed to a third party, such as tables, figures or images, it is your responsibility to determine whether permission is needed for that reuse and to obtain permission from the copyright holder. The risk of claims resulting from infringement of any third-party-owned component in the work rests solely with the user.
General disclaimers. The designations employed and the presentation of the material in this publication do not imply the expression of any opinion whatsoever on the part of WHO concerning the legal status of any country, territory, city or area or of its authorities, or concerning the delimitation of its frontiers or boundaries. Dotted and dashed lines on maps represent approximate border lines for which there may not yet be full agreement.
The mention of specific companies or of certain manufacturers’ products does not imply that they are endorsed or recommended by WHO in preference to others of a similar nature that are not mentioned. Errors and omissions excepted, the names of proprietary products are distinguished by initial capital letters.
All reasonable precautions have been taken by WHO to verify the information contained in this publication. However, the published material is being distributed without warranty of any kind, either expressed or implied. The responsibility for the interpretation and use of the material lies with the reader. In no event shall WHO be liable for damages arising from its use.
Printed in Geneva

iii
Table of Contents
Acronyms used in this module vi
1. How to use this module 1
2. Introduction to Stage Two 4
Minimum Requirements 6
Objectives of the surveillance and response system 7
Vision for the surveillance and response system 8
3. Indicator-based surveillance: strengthening the role of the laboratory 10
Select priority foodborne diseases for surveillance 15Establish a sampling protocol for collecting clinical specimens 17Establish a protocol for testing clinical specimens 22Establish a data-reporting protocol 32Options for strengthening laboratory-based surveillance 35
4. Indicator-based surveillance: strengthening the notifiable disease surveillance system 40
List of diseases and syndromes under surveillance with case definitions 43Notification process 44Database to store surveillance data 45Regular analysis 47Thresholds for cluster detection 51Regular publication of data in surveillance bulletins 55Surveillance protocols 55Options for strengthening notifiable disease surveillance 57
5. Event-based surveillance 61Foodborne event detection: options to increase sensitivity 62Foodborne event detection: options to increase specificity 65

iv
6. Rapid risk assessment of foodborne events 69
7. Response 73
Building capacity in analytical epidemiology 75
Questionnaires 78
Multisectoral collaboration 80
8. Ad hoc research studies: supplementingsurveillance and response data 82
Etiological studies 84
Risk factor studies 86
Burden of disease studies 87
Source attribution studies 88
Pathogen prevalence along the food chain 91
Studies to identify foodborne chemical hazards 92
Where to begin 92
9. Multisectoral collaboration 97
Establishing mechanisms for collaboration 99
Risk profiling 101
10. Monitoring and evaluation 106
Monitoring 108
Evaluation 108
11. Managing implementation 111
Decision-trees 112
Identifying priority capacities for implementation 113
Strategic plans 113
Annex 1:
Identifying priorities for surveillance and response in stage 2 114
Strategy grids 120
Delphi panel approach 121

v
Annex 2: Further characterization of bacterial foodborne pathogens 127
Annex 3:
Mapping laboratory capacities for further characterization 131
Annex 4:
Minimum data requirements for notifiable disease surveillance in stage 2 133
Annex 5:
An example of a data dictionary for the notifiable disease surveillance database 136
Annex 6: An example of a surveillance log 140
Annex 7:
Information sources for rapid risk assessment of a foodborne event 142
Annex 8:
Example of a communication mechanism 145
Annex 9:
Examples of monitoring indicators for foodborne diseases 148
Annex 10:
Managing implementation in stage 2 150
References 158

vi
AMR antimicrobial resistance
CDC Centers for Disease Control and Prevention (of the United States of America)
CUSUM cumulative sum
EBS event-based surveillance
ECDC European Centre for Disease Prevention and Control
EFSA European Food Safety Authority
EQAS external quality assessment scheme
FAO Food and Agriculture Organization of the United Nations
FETP field epidemiology training programme
GFN Global Foodborne Infections Network
GI gastrointestinal illness
HCW health care worker
HUS haemolytic uraemic syndrome
IBS indicator-based surveillance
MLST multilocus sequence typing
Acronyms used in this module

vii
MLVA multilocus variable tandem repeat analysis
mOR matched odds ratio
ORT outbreak response team
OIE World Organisation for Animal Health
PCR polymerase chain reaction
PFGE pulsed field gel electrophoresis
STEC Shiga-toxin-producing Escherichia coli
TDS total diet studies
WGS whole genome sequencing
WHO World Health Organization

1
How to use this module
1.

Stage two
2
This module is intended for countries that are in stage 2 of strengthening their
surveillance and response system for foodborne diseases, and contains specific guidance
on strengthening indicator-based surveillance (IBS) through laboratory identification of
foodborne pathogens. Guidance is also given on conducting ad hoc research studies to
supplement data from the surveillance and response system, and on how the data from
the different sectors in the food supply chain can be used to conduct risk profiling.
Users of this module are encouraged to read first the introductory module of this manual,
which sets the context for the guidance contained here and defines the scope and target
audience. The introductory module also contains a glossary, which explains some of the
technical terms used in the manual, and discusses the different risk-related terms used
in the various disciplines involved in the prevention and control of foodborne diseases.
It will also be useful to consult the stage 1 modules, to understand the capacities that
should already be in place in stage 2.
The present module contains specific advice on:
strengthening the role of laboratories in IBS;
strengthening surveillance of notifiable diseases;
strengthening event-based surveillance (EBS);
rapid risk assessment of foodborne events;
response to foodborne events;
ad hoc research studies;
multisectoral collaboration;
monitoring and evaluation;
managing implementation.

Stage two
3
Most sections contain decision-trees, which display a step-by-step pathway for
developing capacities for surveillance and response for foodborne diseases. The
section on managing implementation contains a tool that countries can use to
document the capacities that have already been met and the steps that need to
be taken to further strengthen the system.

4
Introduction to Stage 2
2.

Stage two
5
A country in stage 2 of strengthening its surveillance and response system for
foodborne diseases should focus on strengthening the national IBS system
through laboratory characterization of priority foodborne pathogens. The
national notifiable disease surveillance system should evolve from an aggregated,
syndrome-based system to a case-based system that relies on laboratory
identification of priority foodborne pathogens. Data from the surveillance and
response system should be used to inform risk profiling. Ad hoc research studies
might be required to fill specific gaps in surveillance or gaps identified during risk
profiling. This module describes options for:
strengthening the surveillance system to:
monitor trends and detect outbreaks of specific priority foodborne
diseases;
identify vulnerable populations;
monitor the public health impact and effectiveness of applied control
measures and policy decisions;
strengthening the response system to ensure that:
multidisciplinary teams routinely investigate suspected foodborne events;
the source of foodborne outbreaks is identified and control measures are
implemented in a timely way at appropriate points along the food chain;
the capacity to conduct analytical epidemiological studies to attribute risk
is available at the local level;

Stage two
6
developing the capacity to conduct ad hoc research studies aimed at
addressing gaps identified in surveillance, such as:
attributing food sources to specific diseases;
understanding the foodborne disease burden in the community.
Minimum requirements
Before the surveillance and response system for foodborne diseases can be
strengthened in this way, the following should be in place:
• an IBS system that can monitor trends in disease syndromes and
identify foodborne outbreaks;
• an EBS system capable of detecting foodborne events;
• capacity to undertake rapid risk assessments of acute public
health events, including gathering information, assessing the risk,
and assigning a level of risk to further spread of foodborne events,
such as outbreaks;
• multidisciplinary outbreak response, with capacity at subnational
level to conduct descriptive epidemiological studies during
foodborne outbreaks and at least one epidemiologist in the
country who can conduct analytical epidemiological studies
during foodborne disease outbreaks;
• laboratory capacity or appropriate referral pathways to support
the identification of pathogens in clinical specimens during
foodborne outbreaks.
Minimum requirements

Stage two
7
Objectives of the surveillance and response system Countries may have different needs and priorities for surveillance and response
to foodborne diseases. However, all data collection should be based on well-
defined objectives that lead to action to control or prevent foodborne diseases.
The objectives of the surveillance and response system in stage 2 in relation to
foodborne disease can include the following:
to detect and respond to foodborne events, to allow rapid implementation
of control measures;
to monitor trends in order to understand the epidemiology of foodborne
diseases, e.g. geographical distribution of diseases, seasonality and
vulnerable populations;
to identify the magnitude of the problem of foodborne diseases in the
community;
to motivate ad hoc research on foodborne diseases;
to attribute food sources to specific foodborne diseases;
to inform clinical management policy, where appropriate, e.g. on
antimicrobial resistance;
to monitor and evaluate interventions and measures taken to control
foodborne diseases;
to collaborate with other relevant sectors, contributing data from the
surveillance and response system to help generate risk profiles.

Stage two
8
Vision for the surveillance and response systemThe vision is a description of what the surveillance and response system will look
like at the end of stage 2. By the end of stage 2, there should be:
an indicator-based surveillance system that includes laboratory analysis,
to better understand trends in foodborne diseases and to increase the
sensitivity and specificity of outbreak detection;
a fully functional notifiable disease surveillance system that can monitor
trends and detect outbreaks;
a fully functional event-based surveillance system capable of detecting
foodborne events;
capacity for rapid risk assessment of foodborne events at the subnational
level;
response capacity at subnational level to carry out analytical
epidemiological studies during foodborne outbreak investigations;
capacity to conduct ad hoc research studies to fill identified gaps, e.g.
to attribute food sources to specific diseases, understand foodborne
disease epidemiology and estimate the burden of foodborne diseases in
the community;
multisectoral collaboration that facilitates the sharing of data for risk
profiling.
To achieve this vision countries can focus on developing and strengthening the
stage one components outlined in Figure 1. The blue area shows the components
that were developed in stage 1. The green areas show the developments in the
surveillance and response system in stage 2.

Stage two
9
FIGURE 1. Components of the surveillance and response system for foodborne diseases
in stage 2
Capacity to undertake risk
profiling
Rapid risk assessment of events• Staff at subnational level
can conduct rapid risk assessments of foodborne events
• Laboratory data routinely used in assessments
Adhoc studies
Multisectoral collaboration
Indicator based surveillance
Indicator based surveillance
Event based surveillance Response
• Mechanism for communication between sectors with a stake in foodborne diseases
Laboratory-based surveillance
Notifiable disease surveillance
Increasing specificity and sensitivity
• Further laboratory characterization of foodborne pathogens
• Individual level data routinely collected for each disease
• Expanding reporters to media and community leaders
• Actively scanning media for foodborne events
• Subnational capacity to conduct analytical epidemiology during foodborne disease outbreaks
• Disease specific questionnaires for investigations

10
Indicator-based surveillance: strengthening
the role of the laboratory
3.

Stage two
11
To have an indicator-based surveillance system that includes laboratory
analysis, to better understand trends in foodborne diseases and to increase
the sensitivity and specificity of outbreak detection, countries will need to
develop or strengthen the following:
› a list of priority foodborne diseases for surveillance selected
through a formal process;
› laboratory-based surveillance for priority foodborne diseases,
in which cases detected through the surveillance system are
confirmed and further characterized in the laboratory;
› protocols for collecting clinical specimens for all priority foodborne
diseases that include:
› objectives of the surveillance system,
› which specimens will be collected (e.g. stool),
› when specimens will be collected (e.g. every 20th patient
meeting the case definition of diarrhoea),
› how specimens will be collected,
› how specimens will be stored before being transported to the
laboratory,
› how and where the specimens will be transported to;
› protocols for testing clinical specimens for all priority foodborne
diseases that include:
› a description of how laboratory testing is organized, e.g.
identifying which samples from which reporting sites go to
which laboratories,
Selfassessment

Stage two
12
› instructions for the further characterization of priority
foodborne pathogens,
› instructions for antimicrobial susceptibility testing of
foodborne pathogens and how this links to the broader
antimicrobial surveillance system;
› a database to house the laboratory-based surveillance data, with a
data dictionary to support the operation of the database;
› a surveillance log to document changes to the laboratory-based
surveillance system;
› data reporting protocols for all priority foodborne diseases that
include:
› who will send and enter the data to the surveillance system,
› which data will be sent,
› how often the data will be sent, and
› what actions will be taken based on the information sent to the
surveillance system;
› antimicrobial susceptibility testing as a routine part of the
surveillance system for relevant foodborne diseases.

Stage two
13
At the beginning of stage 2, IBS is mainly focused on syndromes that are reported
through the notifiable disease surveillance system. Over time, as laboratory
capacity increases, it will become possible to confirm some of the etiological
agents responsible for foodborne diseases. There will be a transition from a
notifiable disease surveillance system based on clinical syndromes to one based
on laboratory-confirmed diseases (Figure 2). The notifiable disease surveillance
system developed in stage 1 will continue to operate while capacities are being
developed in laboratory-based surveillance in stage 2. Strengthening the role
of the laboratory may provide an opportunity to collect and analyse data from
individual cases rather than aggregated surveillance data. Capturing specific
information for each case, such as age, sex and place of residence, will allow more
detailed analysis of surveillance data.
FIGURE 2. Developing IBS in stage 2
Notifiable disease surveillance
Laboratory-based surveillance
• Syndromes
• Aggregated data
• Legal mandate for reporting syndromes
• Laboratory confirmation of agents
• Individual level data
• No legal mandate for reporting
• Operating in selected sites within a country
Notifiable disease surveillance
• Laboratory confirmation of agents
• Individual level data
• Legal mandate for reporting laboratory confirmed diseases
• Operating throughout the country
STAGE 2
startSTAGE 2
endSurveillance system development
Capacities developed in Stage 1
Capacities developed in Stage 2

Stage two
14
Strengthening of laboratory-based surveillance for foodborne diseases should be
based on existing systems and structures, where possible. Medical practitioners
can collect relevant specimens from patients presenting for health care, which
are sent to designated laboratories for testing to assist the doctor in making a
diagnosis. When a condition is under surveillance, the diagnostic information
is also important for public health purposes. The focus of this section is on
strengthening laboratory services for public health surveillance and response
purposes.
There are four steps to be taken in strengthening laboratory-based surveillance of
foodborne pathogens:
Once they have been finalized, the sampling protocol, the testing protocol and the
data-reporting protocol can be combined into one document that summarizes
the operation of the laboratory-based surveillance system.
2. establish a sampling protocol for collecting, storing and transporting clinical specimens;
1. select priority foodborne diseases for surveillance;
3. establish a protocol for testing clinical specimens;
4. establish a data-reporting protocol.

Stage two
15
Select priority foodborne diseases for surveillanceIn most countries, tough decisions need to be made about how to allocate limited
resources to develop sustainable surveillance and response systems that meet
the specific requirements of foodborne diseases. As a starting-point, it will be
important to consider what should be monitored through the surveillance system
and why. A clear statement of the objectives of the surveillance system should
be written. The desired sensitivity and specificity of the system should then be
considered in relation to the resources available.
Increasing sensitivity can lead to a greater ability to detect:
important changes in the trends of foodborne diseases, for example,
seasonal patterns of enteric foodborne pathogens;
outbreaks of foodborne diseases caused by foods that may have
been distributed across the country or internationally.
Questions that will need to be addressed during the prioritization process include
the following.
Which foodborne diseases should be under surveillance?
How many reporting sites and types of reporting site should be included
in the surveillance system?
Should the system cover the whole country or selected areas?

Stage two
16
Increasing specificity can lead to a greater ability to detect:
changes in a specific foodborne pathogen, which may help
understand changes in trends of foodborne diseases; for example,
changes in pathogenicity may be reflected by a higher proportion
of cases being hospitalized;
clusters of genetically similar organisms, which may suggest a
common food source.
Questions that will need to be addressed during the prioritization process include
the following.
Which laboratory tests will need to be performed (e.g. for further
characterization)?
How will the laboratory system be structured to support the requirements
for further characterization?
Step-by-step guidance for drawing up a list of priority diseases is given in Annex 1.

Stage two
17
Establish a sampling protocol for collecting clinical specimensThe choice of when and where to collect clinical specimens for surveillance will
depend on the systems already in place for specimen collection and testing.
In some countries, for instance, there may already be a clinical practice where
specimens are routinely collected and tested in a laboratory. Any strategies to
strengthen laboratory-based surveillance should build on the systems that are
already in place.
It is important to establish a sampling protocol for the collection of clinical
specimens for laboratory-based surveillance. The sampling protocol should
specify the following:
the objectives of the surveillance system;
which specimens will be collected (e.g. faeces, blood, etc.); the stage
1 module contains a list of foodborne diseases and the appropriate
specimens to be collected (reproduced from WHO, 2008a);
when specimens are to be collected (e.g. every 20th patient meeting the
case definition of diarrhoea);
how specimens should be collected (guidance on collecting clinical
specimens is given elsewhere (WHO, 2008a));
how specimens should be stored before being transported to the
laboratory (guidance on storing clinical specimens is given elsewhere
(WHO, 2008a));
where the specimens need to be transported to.

Stage two
18
Countries where clinical specimens are not routinely collected
For countries where clinical specimens are not already routinely collected, there are
three options for collecting clinical specimens for laboratory-based surveillance.
Strategically select a limited number of sites and collect specimens
from all or a random selection of patients meeting a case definition
(sentinel surveillance).
Collect specimens from patients with severe illness (e.g. those
admitted to hospital) or from patients who have died from a
suspected foodborne illness (severity-based surveillance).
Collect specimens from patients whenever clinicians recognize a
clustering of a particular clinical syndrome, by time, place or person
(cluster-based surveillance).
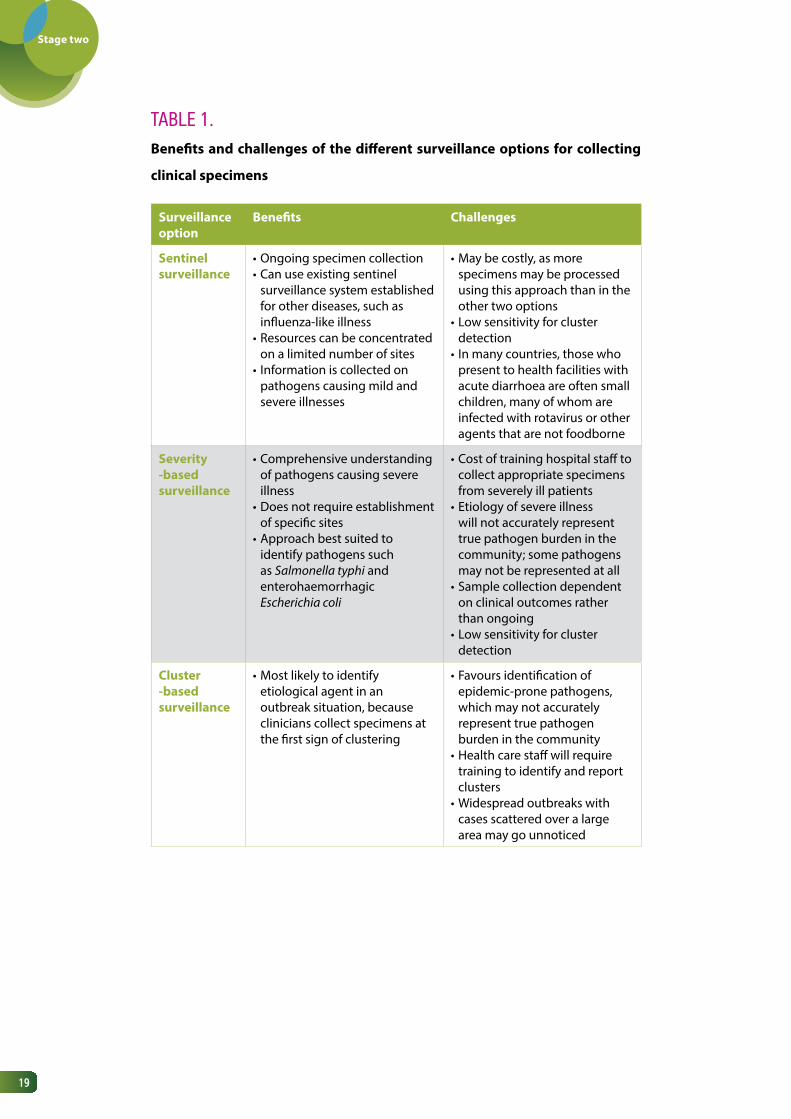
It will be important to weigh up the potential benefits and challenges of the three
approaches. These are summarized in Table 1.
Stage two
19
TABLE 1. Benefits and challenges of the different surveillance options for collecting
clinical specimens
Surveillance option
Benefits Challenges
Sentinel surveillance
•Ongoing specimen collection•Can use existing sentinel
surveillance system established for other diseases, such as influenza-like illness
•Resources can be concentrated on a limited number of sites
• Information is collected on pathogens causing mild and severe illnesses
•May be costly, as more specimens may be processed using this approach than in the other two options
•Low sensitivity for cluster detection
• In many countries, those who present to health facilities with acute diarrhoea are often small children, many of whom are infected with rotavirus or other agents that are not foodborne
Severity -based surveillance
•Comprehensive understanding of pathogens causing severe illness
•Does not require establishment of specific sites
•Approach best suited to identify pathogens such as Salmonella typhi and enterohaemorrhagic Escherichia coli
•Cost of training hospital staff to collect appropriate specimens from severely ill patients
•Etiology of severe illness will not accurately represent true pathogen burden in the community; some pathogens may not be represented at all
•Sample collection dependent on clinical outcomes rather than ongoing
•Low sensitivity for cluster detection
Cluster -based surveillance
•Most likely to identify etiological agent in an outbreak situation, because clinicians collect specimens at the first sign of clustering
•Favours identification of epidemic-prone pathogens, which may not accurately represent true pathogen burden in the community
•Health care staff will require training to identify and report clusters
•Widespread outbreaks with cases scattered over a large area may go unnoticed

Stage two
20
The additional costs for sentinel surveillance will depend on how much use can
be made of existing systems. Every effort should be made to build on existing
systems. For example, it may be possible to build foodborne disease sentinel
surveillance on surveillance for influenza-like illness, by using the same:
sentinel clinics or hospitals: the clinical staff will have already been
trained to take part in a surveillance system;
surveillance and laboratory reporting forms: staff will already be
familiar with the reporting forms, which can be adapted to cover
foodborne diseases;
sample transport systems: the protocols for sample packaging and
transport will be in place.
It will be necessary to determine if the existing sentinel sites and the laboratories
performing the testing have the capacity to undertake surveillance for other
diseases and syndromes. The addition of foodborne diseases should not
compromise the existing surveillance system.
If there is no existing sentinel surveillance, it will be necessary to recruit clinicians
to collect the specimens and report to the surveillance system. This may present
a challenge if clinicians do not perceive that they have a role in public health. It
might be necessary to consider incentives for clinician participation. However, it is
important that the incentives are formalized (e.g. accreditation points) and do not
bias the surveillance system. Feedback to clinicians from the surveillance system,
in the form of surveillance bulletins, can also show them how the information
they collect is used for public health purposes.

Stage two
21
It will also be necessary to identify the most appropriate laboratory to test the
clinical specimens; several options may be available. Transporting specimens can
be difficult, so it is advisable to choose a laboratory as close as possible to where
the specimens are collected.
Regardless of the options chosen for specimen collection, there will be costs for:
the training of clinical staff to recognize the circumstances in which they
should collect specimens;
collection, storage, packaging and transport of the specimens.
Countries where clinical specimens are routinely collected
For countries where specimens are already collected for laboratory testing for
priority foodborne diseases, only minor adjustments might be needed to ensure
that data are sent to local health authorities and the national surveillance system.
If specimens are being collected but not routinely tested for priority foodborne
pathogens, it will be necessary to determine whether existing laboratories are
able to conduct the required testing or whether samples should be referred to
a regional or national public health laboratory. This option will require specific
funding to cover the costs of testing at the chosen laboratory and training the
laboratory staff. Figure 3 shows the options for organizing testing for specific
foodborne pathogens in countries where specimens are routinely collected.

Stage two
22
FIGURE 3. Options for organizing testing for foodborne pathogens in countries where specimens are routinely collected
Establish a protocol for testing clinical specimensThere are three aspects to consider when establishing a protocol for testing of
clinical specimens for foodborne pathogens.
1. The organization of laboratory testing should be well understood, to
ensure that specimens are referred to the laboratories that can perform
the required tests.
2. The requirements for further characterization of priority foodborne
pathogens must be defined.
3. Antimicrobial susceptibility testing of foodborne pathogens should be
part of a broader antimicrobial surveillance system.
Use the existing laboratory system to collect samples from suspected cases • Identify laboratories that routinely receive samples from patients with the syndromes of interest• Depending on the resources and the number of laboratories identified, recruit all or some of the laboratories to
participate in the surveilance system
Option 2Samples are available but have not
been tested in the laboratory for the pathogens of interest
• Organize for the specimens to be tested for priority foodborne pathogens
Results are reported to the laboratory-based surveilance system
Option 1Samples are tested for the
pathogens of interest
1.
2.
3.

Stage two
23
Laboratories are gradually moving towards culture-independent diagnostic
tests, such as polymerase chain reaction (PCR), to detect pathogens, including
foodborne pathogens. PCR is suitable for diagnostic testing, as it provides a
rapid and generally reliable result. However, PCR does not allow the further
characterization of foodborne pathogens required for public health purposes. For
each priority pathogen, countries will need to define which results are sent to the
surveillance system; for example, should PCR- positive, culture-negative results
be sent to the surveillance system? PCR results have limited use for detecting
clusters of disease, but a PCR-positive result combined with exposure information
from the clinician requesting the testing may provide important information for
an outbreak investigation.
Organization of laboratory testing
Collected specimens will need to be transported to a laboratory that can test
for the priority foodborne pathogens. Depending on the laboratory services
available, it might be necessary to refer isolates from positive patients to a public
health laboratory or reference laboratory for further characterization.
Ideally, laboratory-based surveillance would use existing diagnostic testing
systems to identify cases of disease. Depending on how the laboratory system is
structured in a country, this can require the support of:
public health laboratories: these are based in the public sector
(and sometimes the private sector) and their primary role is to
conduct further typing of isolates to support the surveillance and
response system;
national and international reference laboratories: these are
centres of excellence that are able to use sophisticated laboratory
techniques to support the surveillance and response system;

Stage two
24
hospital laboratories: these are based in hospitals in either the
public or private sector and provide diagnostic services to clinicians;
private laboratories: these are based in the private sector and
provide diagnostic services to clinicians.
Each country will have its own laboratory referral pathways to support surveillance
and response, but a generic flowchart is shown in Figure 4. The overall system
should focus on meeting the needs of clinicians and public health practitioners.
The primary role of the hospital and private laboratories is to make a diagnosis
to inform clinical management. The laboratory result should be sent both to the
requesting clinician and to the local health authorities managing the surveillance
system. For priority pathogens, specimens should be referred to a public health
laboratory for further characterization of the pathogen (also known as pathogen
typing). Typing of common foodborne pathogens is necessary to identify clusters
and outbreaks and more precisely understand disease trends. For example, there
are over 2000 serovars of non-typhoidal Salmonella and further characterization
can detect clusters of similar organisms that may suggest a common food source.
As specific serovars of Salmonella may be associated with specific types of food,
further characterization of isolates will also help guide control measures. National
and international reference laboratories can be used for additional further
characterization of isolates, especially during outbreak investigations.

Stage two
25
FIGURE 4. Laboratory structures to support surveillance of and response for foodborne
diseases
Persuading private and hospital laboratories to participate in laboratory-based
surveillance can be difficult, as they often do not perceive public health as their
responsibility. Strategies to encourage participation should be considered (e.g.
payments for the cost of transporting isolates to a public health laboratory and
reporting to the surveillance system).
Specimen collected from sick person
Laboratory-based surveilance system
Hospital laboratory• Diagnostic service• May have some capacity to
perform further characterization
Private laboratory• Diagnostic service• May have some capacity to
perform further characterization
National or internationalreference laboratory
• Further characterization
Public healthlaboratory
• Further characterization
Flow of clinical specimen for diagnostic purposes
Flow of isolates for puplic health purposes
Flow of case-based surveilance data

Stage two
26
Further characterization
Further laboratory characterization of foodborne pathogens is vital for detecting
foodborne disease outbreaks. The level of characterization required to detect
outbreaks is rarely used to direct patient care, with the exception of antimicrobial
resistance (AMR) testing. Private and hospital pathology laboratories are, therefore,
unlikely to conduct this testing.
At the most basic level, it can be important to identify the species, as different
species may have different epidemiological characteristics and sources. However,
for some types of foodborne pathogens, such as Salmonella and Shigella, further
testing is needed. Several tests are commonly used to characterize foodborne
pathogens, including:
serotyping;
phage typing;
pulsed-field gel electrophoresis (PFGE);
multilocus variable tandem repeat analysis (MLVA);
whole genome sequencing.

Stage two
27
Surveillance data – and hence the results of further laboratory characterization –
need to be comparable across provinces, states or territories, to provide a national
perspective. Usually this will require a high degree of interaction between
reference laboratories and agreement to use consistent methods of testing,
reagents, equipment, and nomenclature. Guidance is available for strengthening
public health laboratory networks to support disease surveillance (WHO & CDC,
2008).
It is also important to ensure that the laboratories contributing results to the
surveillance system have quality management systems in place, to ensure that
the results are accurate, timely and reliable. WHO has produced a handbook on
laboratory quality management systems (WHO, 2011). As laboratory capacity is
strengthened and quality management systems are put in place, laboratories
may consider participating in an external quality assessment scheme (EQAS).
Such a scheme leads to the identification of deficiencies in laboratory practice,
which then guides efforts to improve detection and reporting of pathogens.
Specific guidance on introducing an EQAS has been published by WHO (WHO,
1999a; 2011). An EQAS can be used for any type of test performed in a laboratory;
foodborne diseases could be added to the list of agents to be tested for in an
EQAS survey. An example is presented as case study 1.
The Global Foodborne Infections Network (GFN) runs an EQAS for foodborne
pathogens, and reports from the scheme are published annually (www.who.
int/gfn/activities/eqas/en/). In 2013, participating laboratories received eight
anonymous strains of Salmonella, four Shigella strains, two Campylobacter
isolates and one unknown isolate (Escherichia coli O157:H16) for identification
(Hendriksen et al., 2014).

Stage two
28
Further characterization may not be needed for every clinical specimen.
Requirements for further characterization will depend on the pathogen and the
circumstances. Annex 2 outlines the types of further characterization that are
appropriate for different foodborne bacterial pathogens. Countries will need
to define requirements for further characterization for each priority foodborne
From 2002 to 2009, public health laboratories and related facilities across
Africa were invited to participate in an EQAS, which included bacterial enteric
diseases, bacterial meningitis, plague, tuberculosis and malaria. The bacterial
enteric pathogens included Salmonella spp, Shigella spp, Vibrio cholerae,
Salmonella enterica serovar Typhi, Escherichia coli and Campylobacter jejuni.
Surveys were sent annually to test participants’ diagnostic proficiency and the
results were assessed by referees. Identification was found to be acceptable
in 65% of challenges for bacterial enteric pathogens, but serotyping and
antibiotic susceptibility testing and reporting were frequently incorrect. This
assessment helped identify issues that provided an evidence base for future
laboratory strengthening activities.
Case Study
CASE STUDy 1. Including foodborne pathogens in an external quality assurance scheme in Africa
Source: Frean et al., 2012.

Stage two
29
pathogen and map the laboratories in the country that can perform the testing.
This process can also help identify possible gaps in laboratory-based surveillance
and areas that may require additional support. Annex 3 contains a template for
mapping the laboratory testing capacities within a country.
The global food chain is complex and food destined for one country may have
been produced and processed in multiple countries. Therefore, the detection
of and response to international foodborne outbreaks is only possible with
international comparison of strains collected through IBS. Laboratories can submit
genetic sequences or other information that allows comparison of pathogens
across countries. Box 1 lists some networks and databases to which laboratories
can upload genetic information on foodborne pathogens for international
comparison. It is important to recognize that these networks are voluntary and
the data in the databases are not necessarily representative of the diversity of
pathogens in any given country.
There have been numerous examples of successful interventions following
investigation of contaminated foods that have been distributed internationally,
including turkey contaminated with Salmonella Stanley (Kinross et al., 2014)
and watermelon contaminated with Salmonella Newport (case study 2). Sharing
of laboratory results from genetic testing of pathogens and epidemiological
information from investigations of these outbreaks was vital to identifying the
common source of the outbreak.

Stage two
30
BOx 1. Examples of databases for international comparison of foodborne pathogens
› PulseNet International (http://www.pulsenetinternational.org/).
This is a network of national and regional laboratory networks
dedicated to detecting clusters of foodborne disease worldwide
(Swaminathan et al., 2006). Each laboratory uses standard
genotyping methods and shares data to allow the detection of
foodborne disease outbreaks that cross international borders.
The international network has evolved from the American system,
PulseNet.
› PubMLST (http://pubmlst.org). This contains multiple databases
for a range of different bacteria MLST schemes. Some of the
foodborne pathogens included are Bacillus cereus, Campylobacter,
Vibrio cholerae and Vibrio parahaemolyticus. Laboratories can
download allelic profiles and sequence types, and can contribute
their MLST results to the database for comparison. The databases
are hosted by the PubMLST website at the Department of Zoology,
University of Oxford, England.
› GenBank (http://www.ncbi.nlm.nih.gov/genbank/). This database,
housed at the National Institutes of Health (NIH) in the USA,
contains genetic sequences of various bacteria and viruses
including foodborne pathogens. GenBank is part of the
International Nucleotide Sequence Database Collaboration, which
comprises the DNA DataBank of Japan, the European Molecular
Biology Laboratory, and GenBank at the National Centre for
Biotechnology Information in the United States. Laboratories can
upload sequences to the database and compare their sequences
with others in the database.
Example
Stage two
31
CASE STUDy 2. How further characterization and sharing of laboratory results identified a
multinational outbreak of Salmonella Newport
› HAVNET (www.rivm.nl/en/Topics/H/HAVNET/Database). This database
contains hepatitis A sequences from around the world and is hosted
by the National Institute for Public Health and the Environment
in the Netherlands. HAVNET contains entries from GenBank, but
also includes entries submitted by participating members in the
network.
› Institut Pasteur MLST databases (www.pasteur.fr/mlst). These
databases contain sequences and sequence types (STs), which are
freely available. Databases for a range of bacteria are hosted on
the website. The main database of interest for foodborne diseases
is for Listeria monocytogenes.
In 2011, Salmonella Newport was detected in a ready-to-eat slice of watermelon
as part of a food survey in England. A total of 63 human cases of Salmonella
Newport infection were reported in England, Wales, Northern Ireland,
Scotland, Ireland and Germany. Isolates were indistinguishable by pulsed-field
gel electrophoresis and matched that from the watermelon isolate. Forty-six
patients who met the case definition were interviewed, of whom 27 reported
eating watermelon. Further investigations, including trace-backs, confirmed
that the outbreak was linked to consumption of imported watermelon.
Case Study
Source: Byrne et al., 2014.

Stage two
32
Antimicrobial susceptibility testing
Antimicrobial drugs are used to treat bacterial infections. Even though most
foodborne diseases do not need such treatment, it is important to conduct
susceptibility testing to detect resistance in individual bacterial isolates for
epidemiological purposes. If an isolate is resistant to antimicrobial drugs, those
drugs cannot be used to treat the infection in the person from whom the isolate
came. This can lead to poor health outcomes for the individual and also pose a
threat to public health. It is therefore important that antimicrobial susceptibility
testing on clinical isolates is conducted routinely and accurately.
Antimicrobial susceptibility testing is conducted mainly on non-foodborne
pathogens; however, it is important that any surveillance for antimicrobial
resistance includes priority foodborne pathogens. WHO guidance is available on
how to perform antimicrobial susceptibility testing (WHO, 2003). Guidance on
surveillance for antimicrobial resistance is currently under development.
Establish a data-reporting protocolThe data-reporting protocol is important because it documents:
who will send the data to the surveillance system;
what data will be sent;
how often data will be sent; and
what actions will be taken on the basis of the information sent to
the surveillance system.

Stage two
33
Once a pathogen has been identified at a laboratory, the results need to be
recorded and sent to the treating clinician. The responsibility for reporting
laboratory-confirmed cases to the surveillance system may rest with the clinician,
the laboratory or both. The reports should be sent to the local health authorities
responsible for surveillance and response. The data are then collated with data
from other sites (if there is more than one participating laboratory or sentinel site)
and sent to the national laboratory-based surveillance system.
Early in the development of a laboratory-based surveillance system, a stand-
alone database will need to be set up to house the data from the laboratories.
The database will need to be able to capture the relevant laboratory results and
the demographic details of the patient. A data dictionary should support the
operation of the database and a surveillance log should be used to document
changes to the surveillance system. As the surveillance system develops and
specific diseases are made nationally notifiable, the laboratory results will enter
the notifiable disease surveillance system database. Section 4 gives further
information on this subject.
Each laboratory will have its own information management system to store
information about specimens and the results of testing. The key information that
needs to be sent to the local authorities responsible for the surveillance system is:
laboratory identification number;
unique patient identification number;
patient’s first name;
patient’s surname;
date of birth;
sex;
address;
name and address of the health care facility sending the sample;

Stage two
34
type of specimen (e.g. faeces, blood, etc.);
date of specimen collection;
date of receipt at the reporting laboratory;
agent identified;
antimicrobial susceptibility testing results;any clinical or exposure
information (e.g. travel), if available.
It is important that the patient’s identity is transmitted to the surveillance system
at the local level so that patients can be interviewed if required, and so that
duplicate records can be removed from the system. It is, however, essential to
maintain patients’ confidentiality at all times. Names and addresses of patients
should be seen only by laboratory staff, the treating clinician and local health staff
with specific responsibility for surveillance and response. When the data are sent
from the local level to the national surveillance system, identifying information,
such as patient name and address, should not be included.
In the early stages of laboratory-based surveillance, data may be sent weekly or
monthly from the laboratories to the surveillance system. However, if one of the
objectives of the surveillance system is to detect outbreaks, it will be necessary
eventually to increase the frequency of reporting. The capacity to report laboratory
results in a timely manner should be considered when assessing the feasibility of
making laboratory-confirmed diseases nationally notifiable.
The data-reporting protocol should also specify what will be done with the data in
the surveillance system. For example, local surveillance bulletins may be produced
to send feedback to the clinicians and laboratories contributing to the system.

Stage two
35
It will also be necessary to document what the local health authorities should
do if an outbreak is detected through the laboratory-based surveillance system.
For example, if a potential foodborne disease outbreak is detected, a rapid risk
assessment should be conducted and an investigation launched, if appropriate.
Options for strengthening laboratory-based surveillance Box 2 provides a summary of the options for strengthening laboratory-based
surveillance of foodborne diseases in stage 2. This information is also summarized
in the decision-tree in Figure 5.
BOx 2. Summary of options for strengthening laboratory-based surveillance for
foodborne diseases
› Select the priority foodborne pathogens for inclusion in the
laboratory-based surveillance system (Annex 1).
› Establish a sampling protocol for collecting specimens.
› If clinical specimens are not already routinely collected,
consider collecting specimens:
› through sentinel surveillance sites;
› from patients with severe illness;
› from patients with a similar illness clustered in time and
place.
Summary

Stage two
36
› If clinical specimens are routinely collected, examine whether
laboratories are able to report results for priority foodborne
pathogens to the laboratory-based surveillance system.
› Establish a protocol for testing specimens.
› Map laboratory capacities for further characterization of
bacterial foodborne pathogens in the country.
› Encourage participation in an external quality assessment
scheme, so that the quality of testing can be monitored in a
standard way.
› Consider including priority foodborne pathogens in any
antimicrobial resistance surveillance system.
› Establish a database for the laboratory-based surveillance data.
A data dictionary will be needed to support the operation of the
database and a surveillance log to document changes made to the
surveillance system.
› Establish a protocol for reporting data to the surveillance system.
› Establish contact with international reference laboratories for
pathogen characterization.
› Consider sharing molecular patterns of relevant pathogens in an
international database to assist in the detection of foodborne
outbreaks that may cross international boundaries.

Stage two
37
for strengthening laboratory-based surveillance in stage 2
List of foodborne diseases and the
appropriate specimens to be collected
Stage 1 module, Annex 1
Guidance on how to collect and
transport clinical specimens for
laboratory testing
Foodborne disease outbreaks:
guidelines for investigation and
control (WHO, 2008a)
http://www.who.int/foodsafety/
publications/foodborne_dis-
ease/outbreak_guidelines.pdf
Challenges and benefits of different
surveillance options for collecting
specimens
Table 1
Laboratory quality management system:
handbook (WHO, 2011)
http://www.who.int/ihr/publica-
tions/lqms/en/index.html
Requirements and guidance for external
quality assessment schemes for health
laboratories (WHO, 1999a)
http://whqlibdoc.who.
int/hq/1999/WHO_DIL_
LAB_99.2.pdf
Guide for national public health
laboratory networking to strengthen
integrated disease surveillance and
response (WHO/CDC, 2008)
http://www.afro.who.int/en/
clusters-a-programmes/dpc/
integrated-disease-surveillance/
ids-publications.html
Global Foodborne Infections Network:
global foodborne pathogen EQAS
www.who.int/gfn/activities/
eqas/en/
Manual for the laboratory identification
and antimicrobial susceptibility testing
of bacterial pathogens of public health
concern in the developing world (WHO,
2003)
http://www.who.int/csr/resourc-
es/publications/drugresist/
WHO_CDS_CSR_RMD_2003_6/
en/
Reference guide

Stage two
38
Prioritizing foodborne diseases for
surveillance
Annex 1
Further characterization of bacterial
foodborne pathogens
Annex 2
Mapping laboratory capacities for
further characterization of bacterial
foodborne pathogens
Annex 3
Steps to strengthen laboratory-based
surveillance
Figure 5

Stage two
39
FIGURE 5. Decision-tree to identify the steps a country can take to strengthen
laboratory-based surveillance for foodborne diseases in stage 2
Have the priority foodborne pathogens for laboratory-based surveillance been established?
Identify priority foodborne pathogens (Annex 1)
• Consider surveillance options (e.g. sentinel surveillance).• Explore if formal, sustainable incentives could be offered to
clinicians to collect specimens for testing.• Establish a specimen collection protocol.
• Identify further characterization requirements for each pathogen and map the laboratories able to perform the necessary testing (Annex 3).
• Document this in the laboratory testing protocol.
• Establish a database to house the laboratory-based data.• Ensure there is a data dictionary to support the database.• Ensure there is a surveillance log to document changes in the surveillance system.
• Explore mechanisms for the laboratories to report results to the surveillance system.• Explore whether sustainable incentives could be offered to laboratories.• Establish a data-reporting protocol.
• Explore with laboratories participating in the surveillance system whether they could carry out antimicrobial susceptibility testing of priority foodborne pathogens.
Are clinical specimens being routinely collected from patients?
Are specimens being tested for priority foodborne pathogens under surveillance?
Is there a database to house the laboratory-based surveillance data?
Is antimicrobial susceptibility testing being performed on priority foodborne pathogens?
Are laboratories using methods and reporting nomenclature that allow results to be compared
across the country?
Capacities for laboratory-based surveillance in stage 2 have been established
Are laboratory results being reported to the laboratory-based surveillance system?
Have the requirements for further characterization of priority foodborne pathogens been documented and are the further
characterisation tests being performed?
• Explore whether specimens can be tested at the diagnostic laboratory or need to be sent to a public health laboratory.
• Establish a laboratory testing protocol.
• Advocate for methods and reporting nomenclature that allow laboratory results to be compared across the country.

40
Indicator-based surveillance: strengthening
the notifiable disease surveillance system
4.

Stage two
41
For a fully functional notifiable disease surveillance system that can
successfully monitor trends and detect outbreaks, countries will need to
ensure the following:
› existing laws and decrees governing the national notifiable disease
surveillance system are up to date and include priority foodborne
diseases;
› there are case definitions for each of the notifiable foodborne
diseases;
› there are notification forms and a clear mechanism for reporting
(e.g. fax number, telephone notification, web-based system);
› laboratories and health care workers:
› are aware of their obligations to report positive test results to
the surveillance system,
› have specific forms for notification of cases,
› have clear instructions for reporting that fits within the existing
surveillance system;
› there is a notifiable disease surveillance system database that:
› can record all the information required under the minimum
data requirements,
› allows data to be entered easily,
› allows data to be extracted easily for analysis,
› can be accessed at any time,
Selfassessment

Stage two
42
› is relatively stable over time to enable trends to be monitored;
› to support the surveillance processes, there is:
› a data dictionary,
› a surveillance system log,
› a disease-specific surveillance log;
› the surveillance data from both the notifiable disease surveillance
system and the laboratories are analysed and interpreted regularly;
› data analyses are included in a regular surveillance bulletin that is
available to all stakeholders;
› surveillance protocols include the list of notifiable diseases with,
for each disease:
› a case definition,
› the reason for surveillance,
› a data analysis plan for monitoring trends and the thresholds
used for cluster detection,
› the public health action required (e.g. response triggered by
one case or a cluster of cases).
As a country moves into stage 2, the notifiable disease surveillance system
evolves from collecting aggregated data on syndromes to individual-level data on
laboratory-confirmed cases of illness. Many of the options presented here relate
specifically to foodborne diseases, but can be applied equally to other notifiable
diseases under surveillance. Strengthening notifiable disease surveillance is a
long-term process, which needs to focus on developing a sustainable system.

Stage two
43
It is important that countries entering stage 2:
focus on strengthening their existing surveillance system for notifiable
syndromes and diseases before considering expanding the list of notifiable
conditions;
bear in mind that adding too many diseases to the national notifiable
disease list can overwhelm and compromise the entire system; in
extending the national notifiable disease surveillance system to include
foodborne diseases, only priority diseases should be included (Annex 1
contains guidance for prioritizing diseases for surveillance);
ensure that the surveillance of any priority diseases added to the existing
notifiable syndrome and disease surveillance system is complementary to
existing practices and is sustainable.
List of diseases and syndromes under surveillance with case definitionsBefore priority foodborne diseases can be added to the notifiable disease
surveillance system, the following must be in place:
a fully functional notifiable disease and syndrome surveillance system
that can monitor trends and detect events; and
the capacity to carry out sustainable laboratory-based surveillance.
Once a priority list of foodborne diseases has been drawn up, existing laws or
decrees that govern notification to the national disease surveillance system will
need to be amended accordingly. In general, the hazards that would be made
notifiable are microbial pathogens, as foodborne chemical hazards are not
routinely measured through surveillance systems (see section 8).

Stage two
44
Case definitions will need to be drafted for each disease to be included in the
surveillance system. The case definitions should describe the laboratory and
clinical evidence required for a patient to be considered as a case for surveillance
purposes. Some examples of case definitions are given elsewhere (WHO, 1999b).
It is important to work with the laboratories that will be testing for priority
foodborne pathogens to ensure that their methods provide the level of evidence
required in the case definitions.
Notification processDepending on the notification process in a country, laboratories and health care
workers will be required to report to the notifiable disease surveillance system.
Laboratories and health workers need to be made aware of their obligations to
report positive test results to the surveillance system. The following steps should
be undertaken to facilitate reporting:
provide guidance and training to health care workers and laboratories on
the conditions that are notifiable and their case definitions;
create specific notification forms for use by health care workers;
create a mechanism for reporting that fits within the existing surveillance
system. It is important that the process for notifying is simple and rapid.
Timely reporting is an essential requirement of a notifiable disease
surveillance system that is designed to detect outbreaks. Reporting may
be done by fax, phone or through a web-based system.
If both health care workers and laboratories have an obligation to report to the
surveillance system, it is important that the clinical information about patients
can be linked with their laboratory test results. Ideally, this is done using the
patient’s name and date of birth. If it is decided not to send personal identifying
information to the surveillance system at the local level, it will be necessary to

Stage two
45
consider alternatives, such as a unique identification number for each patient that
accompanies both the clinical specimen and the notifications from health care
workers and laboratories.
Database to store surveillance dataAs the notifiable disease surveillance system starts to receive notifications about
individuals from health care workers and laboratories, the management of the
data will become increasingly complex. In stage 1, the surveillance database
houses aggregated data on each notifiable condition. In stage 2, as specific
diseases are added to the notifiable disease surveillance system, the existing
surveillance database will need to be modified, or a new database created, to
store individual-level data. The minimum data requirements for the database
will need to be defined. Annex 4 provides an example of a minimum dataset for
surveillance of foodborne diseases in stage 2. These data fields apply not only
to foodborne diseases, but potentially to all diseases included in the notifiable
diseases surveillance system.
It is important that the surveillance database:
can record all the information required under the minimum data
requirements;
allows data to be entered easily, therefore reducing possible data entry
errors;
allows data to be extracted easily for analysis;
can be accessed at any time;
is stable (i.e. the fields in the database do not change much over time).

Stage two
46
Depending on the skills and financial resources available, it may be possible to
build a surveillance database or to have it built by expert database developers. In
both cases, it will be crucial to map:
the objectives of surveillance;
processes: how the data flow through the system from data entry to
analysis;
outputs: this may include surveillance bulletins, annual reports, outputs
from cluster detection methods, weekly surveillance summaries, etc.
resources: this covers all the resources required to support the system,
including staff (database administration, public health staff), budgets and
equipment (e.g. computers, faxes, printers).
The specifications and business requirements of the database will need to be
carefully defined, to make it easier for the developer to provide a database with
the necessary functionality.
The following should also accompany the database.
Data dictionary. This should provide details of each data field and specify
how information should be entered into the database. Annex 5 contains
an example of a data dictionary, which builds on the dictionary developed
in stage 1.
Surveillance log. All changes made to the notifiable disease surveillance
system during stage 2 should be documented in the surveillance log. An
example of a surveillance log is given in Annex 6.

Stage two
47
Disease-specific surveillance logs. Once the database starts to collect
individual-level data for specific laboratory-confirmed diseases, a separate
surveillance log should be established for each disease. Over time, case
definitions and laboratory methods used to identify the pathogens under
surveillance may change. All these changes should be documented in
disease-specific surveillance logs, to allow consistent interpretation of the
data over time.
Regular analysisNotifiable disease surveillance data should be regularly reviewed for trends
and for clusters of foodborne disease. The data should be able to describe the
epidemiology of each disease by time, place and person. Appropriate analyses to
consider include the following.
Notification rates
Notification rates are useful for comparing notifications of diseases in different
populations. To calculate notification rates, demographic data are required for the
denominator. These may be difficult to obtain if the populations of interest are
not recorded in the national census. Two main types of rates can be calculated.
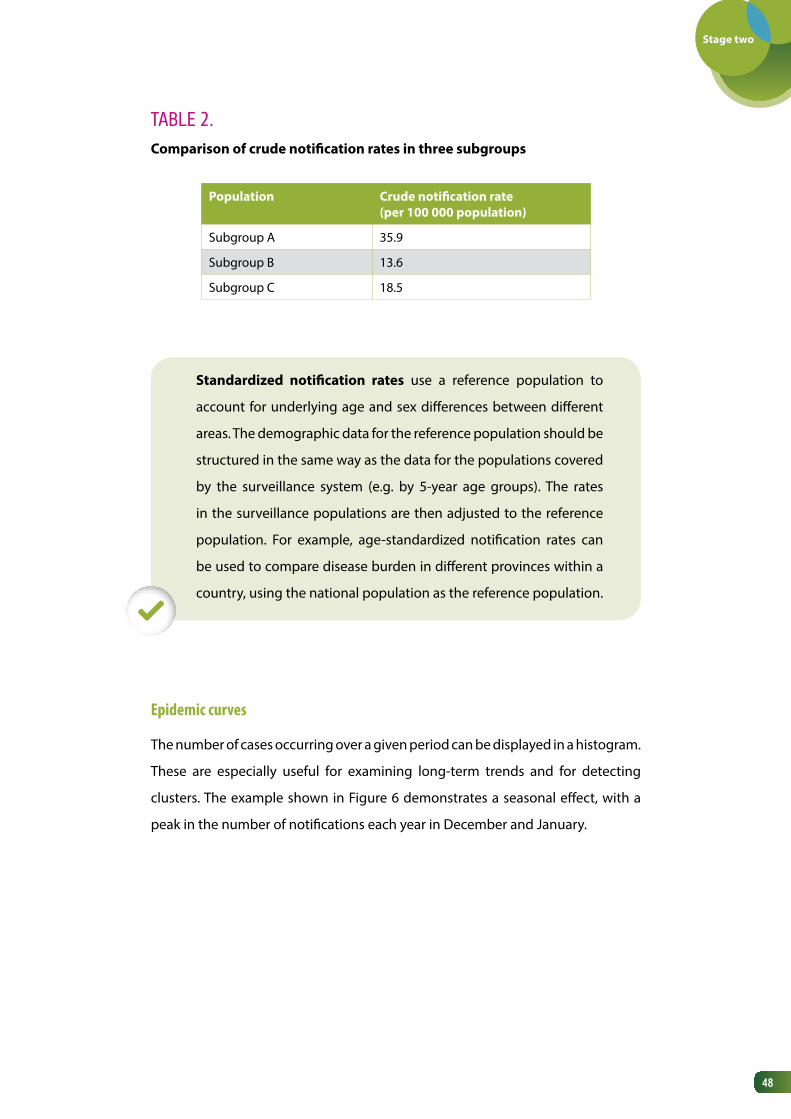
Crude notification rates are calculated by dividing the number
of notifications of a specific disease by the number of people in
the population of interest. The example in Table 2 shows that the
crude notification rate in subgroup A was higher than in the other
subgroups.
Stage two
48
TABLE 2. Comparison of crude notification rates in three subgroups
Standardized notification rates use a reference population to
account for underlying age and sex differences between different
areas. The demographic data for the reference population should be
structured in the same way as the data for the populations covered
by the surveillance system (e.g. by 5-year age groups). The rates
in the surveillance populations are then adjusted to the reference
population. For example, age-standardized notification rates can
be used to compare disease burden in different provinces within a
country, using the national population as the reference population.
Epidemic curves
The number of cases occurring over a given period can be displayed in a histogram.
These are especially useful for examining long-term trends and for detecting
clusters. The example shown in Figure 6 demonstrates a seasonal effect, with a
peak in the number of notifications each year in December and January.
Population Crude notification rate (per 100 000 population)
Subgroup A 35.9
Subgroup B 13.6
Subgroup C 18.5

Stage two
49
FIGURE 6. Example of an epidemic curve
Num
ber o
f not
ifica
tions
Month of disease onset
0
10
20
30
40
50
60
2011
Jan
Mar
May Ju
l
Sep
Nov
2012
Jan
Mar
May Ju
l
Sep
Nov
2013
Jan
Mar
May Ju
l
Sep
Nov
2014
Jan
Mar
May Ju
l
Sep
Nov
Bar charts
Bar charts showing notification rates by age group and sex can be especially
useful in identifying vulnerable groups and enabling valid comparisons between
the groups. Basic demographic data can be used to calculate the notification rates
per 100 000 population. Figure 7, for example, shows a bar chart for an infection
for which the highest notification rates are in children aged 0–4 years and people
aged over 60 years.

Stage two
50
FIGURE 7. Example of a bar chart showing notification rates by sex and age group
Rat
e of
not
ifica
tion
(per
100
,000
pop
ulat
ion
Age group (years)
0
5
10
15
20
25
30
0-4 10-19 30-39 50-59 70+5-9 20-29 40-49 60-69
MaleFemale
Mapping
Maps of notification rates may help identify areas that have a greater burden of
specific foodborne diseases. Basic demographic data (e.g. population estimates
for each of the geographical regions of interest) will be needed to calculate the
notification rates. An example of such a map is shown in Figure 8.

Stage two
51
FIGURE 8. Map showing incidence rates of Salmonella Stanley cases in selected
European Union Member State regions, 1 August 2011 to 22 October 2012
Thresholds for cluster detectionClusters are most often defined in relation to time and place. It is important to
recognize that epidemiologically linked cases may occur that are below the
threshold for investigation, but that may nevertheless be important to follow
up. Examples are foodborne disease in vulnerable subpopulations, such as
infants, and severe illness. In other cases, limited public health resources may be
insufficient to allow small clusters to be fully investigated.
Source: Kinross et al., 2014.

Stage two
52
Cluster detection methods range from simple calculations of historical averages
to complex statistical modelling. The stage 1 module contains information on
thresholds. In stage 2, more advanced thresholds and cluster detection methods
may be useful. Robertson et al. (2010) reviewed some methods for detecting
outbreaks using surveillance data, including cumulative sums (CUSUMs), scan
statistics and model-based approaches. Case study 3 describes the application of
CUSUMs to detect clusters of Salmonella cases, while case study 4 describes the
use of scan statistics to detect clusters of Listeria monocytogenes infection. The
common requirements of all these approaches are:
further characterization of pathogens to group genetically similar
organisms;
several years of stable, reliable surveillance data for genetically
similar organisms.
CASE STUDy 3. Applying a CUSUM method to Salmonella surveillance data
A computer algorithm based on the CUSUM method was developed.
The algorithm cumulated sums of the difference between frequencies of
Salmonella isolates and their expected means. A CUSUM was calculated for
each Salmonella serotype for each week in a one-year period and compared
with the same week over the previous 5 years, using either the mean or the
median of the 5 weeks. A 15-week mean was also assessed (using the mean
over a 3-week interval for the past 5 years). Sensitivity, specificity and false-
positive rates were assessed for Salmonella Enteritidis outbreaks in each state
of the USA.
Case Study

Stage two
53
› Sensitivity was defined in terms of the number of outbreaks
flagged by the algorithm that matched reported outbreaks.
› Specificity was based on the number of weeks not flagged that
corresponded to weeks without reported outbreaks.
› False-positive rate was the proportion of flags that did not
correspond to outbreaks over the total number of flags.
Sensitivity by state in which outbreaks were reported varied from 0% (0/1)
to 100%, specificity was 64–100%, and the false-positive rate was between 0
and 100%. The data need to be interpreted with caution, as there were some
limitations, including size of outbreak, lack of reporting of isolates, duplicate
isolate reports, and under-reporting because of limited resources to investigate
small outbreaks.
Source: Hutwagner et al., 1997.
CASE STUDy 4. Using scan statistics to detect clusters of Listeria monocytogenes based on ribotyping and PFGE types
The ribotype and PFGE type of 131 human Listeria monocytogenes isolates,
collected in New York State (USA) between November 1996 and June 2000,
were compared to look for clusters of genetically similar organisms. A scan
statistic was used to detect listeriosis clusters. The scan statistic assumes an
underlying Poisson distribution and a stable population at risk over time, and
is useful for rare events. This statistical test compares the incidence of events
within a defined window of time against the incidence of events outside the
window. Given that the incubation period for L. monocytogenes can be up
Case Study
Stage two
54
Source: Sauders et al., 2003.
to 70 days, the time windows tested in this study were one month and three
months. Nine clusters (total 41 cases; 31% of cases) were identified by ribotype
or PFGE; five clusters (18% of cases) were identified using both methods. Two
of the nine clusters (13% of cases) corresponded with investigated multistate
listeriosis outbreaks. All clusters detected within the one-month window were
also detected in the three-month window.
Once appropriate cluster detection methods have been identified, the use of
such techniques should become a routine function of the surveillance system.
Any alerts generated will need to be considered within the rapid risk assessment
process to determine whether further investigation is required. Staff working
with the notifiable disease surveillance and response system should also
regularly examine the data for any unusual features in new notifications, which
may indicate the beginning of an outbreak (e.g. a higher than normal number of
infants notified with a common type of Salmonella may indicate contamination of
infant formula or an outbreak at a child care centre).
Public health staff should meet weekly to discuss surveillance data, with a
particular focus on the detection of clusters and results of investigations.
Foodborne diseases should be specifically considered during these team reviews.
Short daily meetings could also be considered for critical updates.
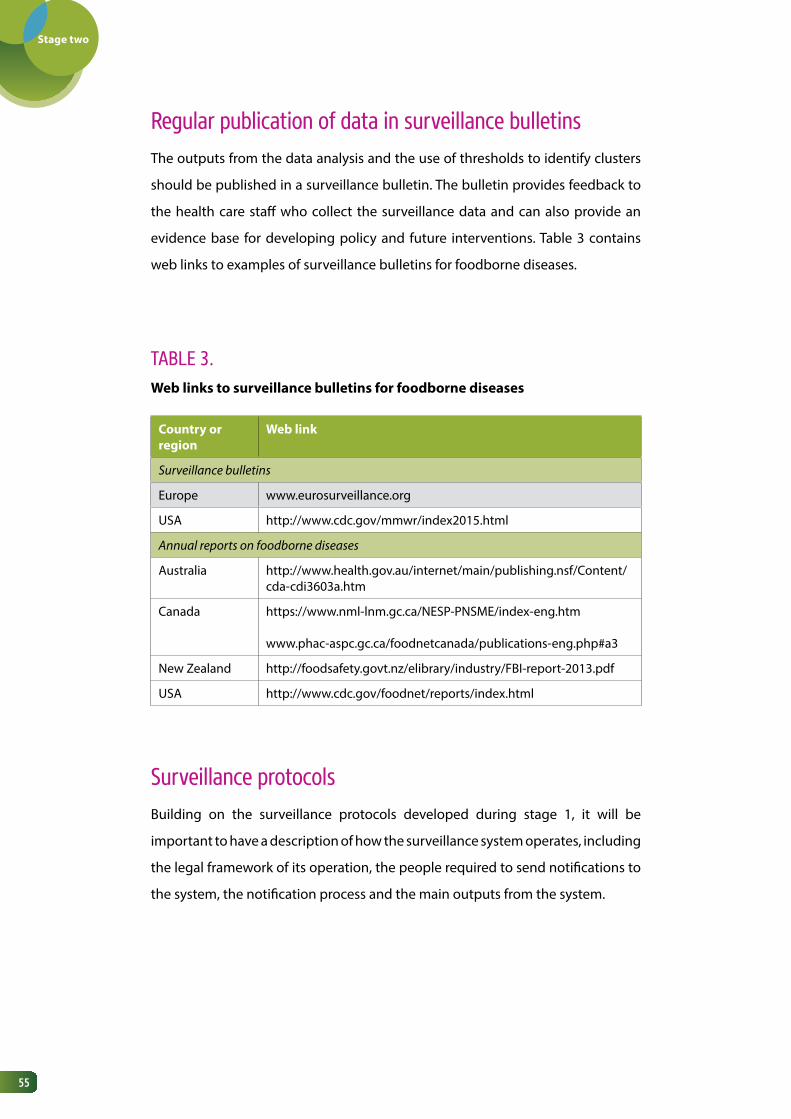
Stage two
55
Regular publication of data in surveillance bulletinsThe outputs from the data analysis and the use of thresholds to identify clusters
should be published in a surveillance bulletin. The bulletin provides feedback to
the health care staff who collect the surveillance data and can also provide an
evidence base for developing policy and future interventions. Table 3 contains
web links to examples of surveillance bulletins for foodborne diseases.
TABLE 3. Web links to surveillance bulletins for foodborne diseases
Country or region
Web link
Surveillance bulletins
Europe www.eurosurveillance.org
USA http://www.cdc.gov/mmwr/index2015.html
Annual reports on foodborne diseases
Australia http://www.health.gov.au/internet/main/publishing.nsf/Content/cda-cdi3603a.htm
Canada https://www.nml-lnm.gc.ca/NESP-PNSME/index-eng.htm
www.phac-aspc.gc.ca/foodnetcanada/publications-eng.php#a3
New Zealand http://foodsafety.govt.nz/elibrary/industry/FBI-report-2013.pdf
USA http://www.cdc.gov/foodnet/reports/index.html
Surveillance protocolsBuilding on the surveillance protocols developed during stage 1, it will be
important to have a description of how the surveillance system operates, including
the legal framework of its operation, the people required to send notifications to
the system, the notification process and the main outputs from the system.

Stage two
56
The protocols should include a list of notifiable diseases with, for each disease:
the rationale for surveillance, linked to the aims of the surveillance system
(e.g. Salmonella is under surveillance because it is an outbreak-prone
pathogen and one of the aims of the surveillance system is to detect
outbreaks);
the case definition;
data analysis plans for monitoring trends and the thresholds used for
cluster detection;
public health action required (e.g. one case triggers a response or response
launched when there is a cluster).
Figure 9 shows how the surveillance protocols fit with other supporting
documentation for the surveillance and response system in stage 2. The
documentation may be combined in one document or kept as separate
documents.

Stage two
57
FIGURE 9. Documentation required for the surveillance and response system in stage 2
Data dictionary forevent database
Surveilance Protocols
Healthfacilities
Analyses for trends
Thresholds for cluster detection
Notification
Eventdatabase
Rapid risk assessment
Response
Responce Protocols
Alert
Documentation
Database
Options for strengthening notifiable disease surveillance Box 3 summarizes the options for strengthening the notifiable disease surveillance
system in stage 2. This information is also given in the decision-tree for notifiable
disease surveillance in Figure 10.
Surveilancedatabase
Data dictionary forsurveilance database

Stage two
58
BOx 3. Summary of options for strengthening notifiable disease surveillance
› Amend public health legislation and decrees to add priority
laboratory-confirmed foodborne hazards to the national notifiable
disease list.
› Write case definitions for each notifiable disease.
› Create notification forms and a reporting mechanism (e.g. fax
number, telephone notification, web-based system).
› Ensure that laboratories and health care workers are aware of their
obligation to report notifiable diseases.
› Expand the existing notifiable disease surveillance database to
receive notifications about individual cases from health workers
and laboratories.
› Ensure that there is a data dictionary to support the database.
› Regularly analyse data for trends and to identify vulnerable
populations.
› Establish thresholds for the detection of clusters.
› Ensure that surveillance data are regularly reported in the
surveillance bulletin.
› Update existing surveillance protocols to document the process
of notification, the diseases under surveillance, the analyses being
conducted and the public health action that should be taken for
each disease.
› Document all changes to the notifiable disease surveillance system
in a surveillance log.
› Establish a surveillance log for each disease.
Summary

Stage two
59
for strengthening notifiable disease surveillance for foodborne diseases in stage 2
Prioritizing foodborne diseases for
surveillance
Annex 1
Recommended surveillance standards
(WHO, 1999b)
http://www.who.int/csr/resourc-
es/publications/surveillance/
WHO_CDS_CSR_ISR_99_2_EN/
en/
Minimum data requirements for the
notifiable disease surveillance database
Annex 4
Example of a data dictionary Annex 5
Example of a surveillance log Annex 6
Review of cluster detection methods Robertson et al., 2010
Steps for strengthening notifiable
disease surveillance for foodborne
diseases
Figure 10
Reference guide

Stage two
60
FIGURE 10. Decision-tree to identify the steps a country can take to strengthen notifiable disease surveillance for foodborne diseases in stage 2
Have the priorities for notifiable disease surveillance (including foodborne diseases) been established?
• Amend or create a notifiable disease surveillance database that can record individual-level data according to minimum data requirements
• Amend or create a data dictionary that supports the database
• Undertake a prioritization exercise (see Annex1)
• Explore options for amending legislation or decrees
• Develop case definitions in consultation with laboratories
• Explore options for establishing alert thresholds• Consider holding weekly meetings with public health staff to review the surveillance data
Are notifiable disease surveillance data regularly analysed?
Has the legislation been amended to add priority foodborne diseases to the national notifiable disease list?
Are there standard surveillance case definitions for each foodborne disease?
Are there thresholds for cluster detection?
Are laboratories reporting to the notifiable disease surveillance system?
Are there surveillance protocols to document surveillance processes and public health actions?
Capacities for notifiable disease surveillance in stage 2 have been established
Are data being regularly reported in the surveillance bulletin?
Are health care workers reporting to the notifiable disease surveillance
system?
Is the notifiable disease surveillance system database able to capture
individual-level data from laboratories and health care
workers?
• Remind laboratories of their obligation to report notifiable diseases to the surveillance system• Explore mechanisms for laboratories to report to the surveillance system• Share surveillance case definitions• Provide feedback from the surveillance system to laboratories to show how their notifications benefit public health
• Remind health care workers of their obligations to report notifiable diseases to the surveillance system• Share surveillance case definitions• Explore mechanisms for health care workers to report to the surveillance system• Provide feedback from the surveillance system to health care workers to show them how their notifications benefit
public health
• Regularly analyse surveillance data by time, place and person
• Amend ro create surveillance protocols to accurately reflect surveillance processes and public health action required
• Report notifiable diseases surveillance data regularly in the surveillance bulletin

61
Event-based surveillance
5.

Stage two
62
For a fully functional event-based surveillance system that can detect
foodborne events, countries will need to ensure the following:
› a 24-hour telephone hotline, fax or email to receive reports at a
national level;
› sensitivity of EBS has been strengthened through training of
people outside the health system (e.g. media, village leaders, etc.);
› active scanning of the media at the national and international
levels for information about possible foodborne events.
Selfassessment
In stage 2, a country is building on its existing EBS system to detect more
foodborne events. Strengthening EBS for foodborne diseases will involve finding
a balance between sensitivity (picking up all important foodborne events),
specificity (ensuring that most of the events detected are actually foodborne)
and sustainability (in terms of the financial and human resource costs involved in
maintaining the system).
Foodborne event detection: options to increase sensitivity Countries considering increasing sensitivity will need to ensure that they have the
capacity to assess and respond to more events. Sensitivity can be improved by:
increasing the number of reports coming from the local level to a
central authority (passive surveillance); or

Stage two
63
actively scanning radio, print and electronic media for information
about possible foodborne events (active surveillance).
Table 4 presents several options for increasing the sensitivity of EBS. Improvements
in sensitivity need to be balanced against the long-term sustainability of the
overall surveillance and response system. For example, a 24-hour hotline could
initially be made available to health care workers and local sanitary or food
inspectors; as capacity increases, other reporting sources could be given access,
such as pharmacists, journalists and the general public. In addition, any actions to
increase the sensitivity of the EBS system should be done in consultation with all
partners within the ministry of health. It is possible that events detected through
EBS may be vaccine-preventable or require urgent intervention by other parts of
the ministry of health.
TABLE 4. Options for increasing sensitivity of EBS in stage 2
Advantages Disadvantages
1. Passive surveillance
Reporting channels
Expand coverage of EBS within the health care system (if the current system has limited geographical scope)
National coverage for EBS. Cost of training staff across the health care system to report events.
Institute 24-hour, 7 days per week coverage (if the current system is limited with regard to time coverage)
A responsible, trained officer is available to receive reports 24 hours a day.
Requires staffing 24 hours a day.
Institute a hotlineOptions:• Toll-free phone
numberA toll-free hotline will remove any cost barriers to reporting.
The cost of the toll-free number will need to be funded.

Stage two
64
Advantages Disadvantages
• Text and call back
• VHF/HF radio
Texting the health authorities about an event has a limited cost to the reporter.
Good option in remote areas where mobile phone coverage is poor.
There is a cost to the authorities to return the call.Authorities must call back immediately, requiring permanent staffing of the hotline.
Requires reporters to have access to VHF/HF radio equipment.
Establish an email address or dedicated fax line
Having other forms of communication in addition to a hotline can make reporting more flexible.
Requires a reliable telecommunications system.Requires information technology support.
Reporting sources
Train pharmacists to recognize and report events
Potential for high sensitivity and specificity. Pharmacists often see the first signs of an unexpected increase in cases of a particular illness. Ill people often go to a pharmacist for advice or over-the-counter medicines before they go to a medical practitioner.
Most pharmacists are private practitioners and it may be difficult to encourage them to report events.
Would require a system with regular feedback and follow-up.
Train media personnel to recognize and report events
Can detect events early.Journalists engaged in reporting health events can use their networks for detection.Can also assist in communication of accurate information during events.
Media generally report on newsworthiness and not necessarily on public health importance.Public health events may not be detected and reported on in countries with heavily restricted or controlled media.Potentially low specificity as reports might not be related to foodborne disease or public health.
Train community leaders and nongovernmental organizations to recognize and report events
Potential for high sensitivity.
Potential for low specificity as reports might not be related to foodborne disease or public health.May be reluctant to report issues that could have negative consequences for the community.
(TABLE 4. Continue)
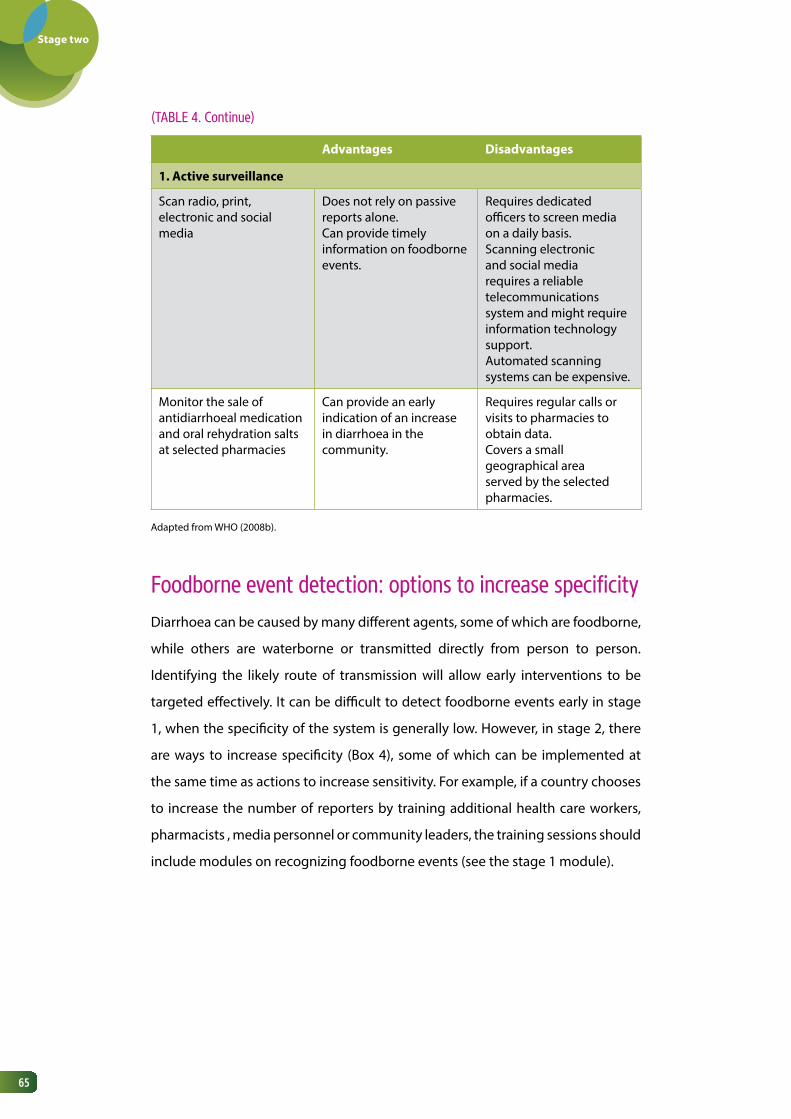
Stage two
65
(TABLE 4. Continue)
Advantages Disadvantages
1. Active surveillance
Scan radio, print, electronic and social media
Does not rely on passive reports alone.Can provide timely information on foodborne events.
Requires dedicated officers to screen media on a daily basis.Scanning electronic and social media requires a reliable telecommunications system and might require information technology support.Automated scanning systems can be expensive.
Monitor the sale of antidiarrhoeal medication and oral rehydration salts at selected pharmacies
Can provide an early indication of an increase in diarrhoea in the community.
Requires regular calls or visits to pharmacies to obtain data.Covers a small geographical area served by the selected pharmacies.
Adapted from WHO (2008b).
Foodborne event detection: options to increase specificity Diarrhoea can be caused by many different agents, some of which are foodborne,
while others are waterborne or transmitted directly from person to person.
Identifying the likely route of transmission will allow early interventions to be
targeted effectively. It can be difficult to detect foodborne events early in stage
1, when the specificity of the system is generally low. However, in stage 2, there
are ways to increase specificity (Box 4), some of which can be implemented at
the same time as actions to increase sensitivity. For example, if a country chooses
to increase the number of reporters by training additional health care workers,
pharmacists , media personnel or community leaders, the training sessions should
include modules on recognizing foodborne events (see the stage 1 module).

Stage two
66
BOx 4. Options for increasing specificity of EBS in detecting foodborne events
› Train reporting sources (e.g. health care workers, pharmacists,
media personnel and community leaders) to recognize foodborne
events:
› raise awareness of how a foodborne event might manifest
itself;
› encourage sources to report rumours of diarrhoeal illness
in a group of people with a common exposure (e.g. within a
workplace or school or following a function, such as a wedding).
› Select pharmacy sites that can provide data about the sale of
antidiarrhoeal medication and oral rehydration salts.
› If monitoring media at the national level, include specific searches
for foodborne events, e.g. use “contaminated food” or “food
poisoning” as search terms.
› Examine reports from food safety colleagues about any product
recalls or results from food monitoring programmes that may
indicate a potential foodborne event.
› Distribute INFOSAN alerts to rapid risk assessment teams and
health care workers reporting to the EBS system to raise awareness
about hazards and their potential distribution.
Summary

Stage two
67
Figure 11 shows the decision-tree for strengthening the sensitivity and specificity
of EBS to detect foodborne events in stage 2.
for strengthening EBS to detect foodborne events in stage 2
A guide to establishing event-based
surveillance (WHO, 2008b)
http://www.wpro.who.int/
emerging_diseases/documents/
docs/eventbasedsurv.pdf
Early detection, assessment and
response to acute public health events:
implementation of early warning and
response with a focus on event-based
surveillance. Interim version. WHO (2014)
http://www.who.int/ihr/pub-
lications/WHO_HSE_GCR_
LYO_2014.4/en/
Options for increasing sensitivity of EBS
system
Table 4
Steps for strengthening the EBS system Figure 11
Reference guide

Stage two
68
FIGURE 11. Decision-tree to identify the steps a country can take to strengthen event-based surveillance for foodborne diseases in stage 2
Is there a 24-hour telephone hotline, fax or email to receive reports at a national level?
• Establish a 24-hour telephone hotline, fax line or email address to receive reports at the national level.
Have people outside of the health system been trained to recognize and report foodborne events?
Is there active scanning of the media to detect events?
Capacities for event-based surveillance in stage 2 have been established
• Designate a staff member to actively scan media for foodborne events.
• Consider training journalists, village leaders and others in the community who could become reporters to the EBS system.
• Ensure the training includes examples of foodborne events.

Stage two
69
Rapid risk assessment of
foodborne events
6.

Stage two
70
To be able to undertake rapid risk assessment of foodborne disease events at
the subnational level, countries will need to ensure the following:
› staff at the subnational level have been designated responsibility
for conducting rapid risk assessments;
› these staff at the subnational level have been trained in rapid risk
assessment and the training included examples of foodborne
disease events that have occurred;
› a mechanism is in place that allows the national level to provide
technical support and advice to the subnational level, as required;
› laboratory data are routinely used in the rapid risk assessment of
foodborne disease events.
Selfassessment
Most of the capacities for rapid risk assessment are developed while countries
are in stage 1. Detailed guidance on strengthening rapid risk assessment is
available elsewhere (ECDC, 2011; WHO, 2012). Table 5 summarizes how rapid risk
assessment of foodborne disease events differs between stage 1 and stage 2. In
stage 2, the capacities for rapid risk assessment at the subnational level should be
strengthened. This involves:
identifying staff who will be involved in rapid risk assessments;
training the staff in the procedures that have been adopted nationally; the
training should include examples of foodborne disease events that have
occurred in the country and been assessed at the national level;
Stage two
71
setting up a mechanism through which technical support and advice can
be provided from the national level to the subnational level, as required.
In some countries, the mechanism may be as simple as a telephone call;
other countries may require an official request for assistance.
The information used in the rapid risk assessment process is generally of a higher
quality, more reliable and more complete in stage 2. Annex 7 contains an example
of information that can be used in a rapid risk assessment in stage 2. In stage 1,
there is more uncertainty in the risk characterization, as the risk assessment relies
mainly on published data from other countries. As laboratory-based surveillance
is strengthened, countries in stage 2 will be able to use their own detailed data to
inform hazard, exposure and context assessments, thus increasing the confidence
in the overall risk assessment. An example of risk characterization of a possible
foodborne event is given in Annex 10 of the stage 1 module.
Multisectoral collaboration during rapid risk assessments is stronger in stage 2,
with each of the different sectors being involved in assessing the risk posed by
the event. In stage 2, food safety staff and public health laboratory staff should be
permanent members of the rapid risk assessment teams for suspected foodborne
events. The roles and responsibilities of each member of the rapid risk assessment
team should be clear and documented, either in the surveillance or the response
protocols.

Stage two
72
TABLE 5. Comparison of rapid risk assessment of possible foodborne disease events
in stage 1 and stage 2
Stage 1 Stage 2
Location of rapid risk assessment capacities
National level National and subnational levels
Information for hazard, exposure and context assessments
•Limited•Reliant on published
studies or data from other countries
•Extensive•Own country data
Multisectoral collabora-tion
Focal points from food safety and laboratory identified and participate in rapid risk assessments, as required
Food safety and laboratory staff are standing members of rapid risk assessment teams when an event is suspected to be foodborne
for strengthening rapid risk assessment of foodborne events in stage 2
Rapid risk assessment of acute public
health events (WHO, 2012)
http://whqlibdoc.who.int/
hq/2012/WHO_HSE_GAR_
ARO_2012.1_eng.pdf?ua=1
Operational guidance on rapid risk
assessment methodology (ECDC, 2011)
http://ecdc.europa.eu/en/publi-
cations/Publications/1108_TED_
Risk_Assessment_Methodolo-
gy_Guidance.pdf
Examples of information used in the
assessment of hazards, exposures and
context in stage 2
Annex 7
Example of risk characterization of a
possible foodborne event
Stage 1 module, Annex 10
Reference guide

73
Response7.

Stage two
74
To have a subnational response capacity that can carry out analytical
epidemiological studies during foodborne outbreak investigations, countries
will need to ensure the following:
› specific questionnaires are available for each priority foodborne
pathogen;
› capacity to conduct analytical epidemiological studies during
outbreak investigations exists at the national and subnational
levels;
› representatives from food safety and public health laboratories
(and animal health, where applicable) are routinely part of the
outbreak response team.
Selfassessment
During stage 1, strengthening of response capacity focused on conducting
descriptive epidemiological studies throughout the country, with capacity to
perform analytical epidemiological studies at the national level. In stage 2, the
focus is on building the capacity to carry out analytical epidemiological studies
in outbreak response teams (ORTs) at the subnational level. This will require
significant investments of resources and time. However, the availability of a cadre
of trained field epidemiologists will benefit not only foodborne diseases, but the
whole surveillance and response system. Table 6 shows how response differs
between stage 1 and stage 2.

Stage two
75
TABLE 6. Comparison of response to possible foodborne disease events in stage 1 and
stage 2
Building capacity in analytical epidemiologyOne of the main differences in response between stage 1 and stage 2 is the
strengthening of skills in analytical epidemiology at the subnational level. This
will involve identifying motivated staff at the subnational level and offering
opportunities for these staff to receive training in field epidemiology. To perform
analytical epidemiological studies during foodborne outbreak investigations,
staff need to be able to:
generate hypotheses about specific food sources on the basis of food
history questionnaires;
choose the correct study design (cohort study vs case–control study);
design questionnaires to test hypotheses about the food source (i.e.
include specific food items thought to be responsible for the illness);
administer the questionnaires;
Stage 1 Stage 2
Location of capacities to perform analytical epidemiological studies
May be only one or two epidemiologists in the country who can be mobilized to assist
National and subnational levels
Questionnaires General; one questionnaire can be used for any type of investigation
Specific questionnaires for each priority foodborne pathogen
Multisectoral collaboration Focal points from food safety and laboratories identified and participate in responses
Representatives from food safety and laboratories (and animal health, where applicable) are routinely part of the outbreak response team

Stage two
76
create a database to store responses from the questionnaires;
enter data into the database;
manage and clean the data in the database;
extract the data from the database;
analyse the data using univariate and multivariate analyses;
evaluate the effect of bias and confounding on the results of the analysis;
communicate the findings from the analysis.
Building capacities in epidemiology is a long-term process and can be achieved in
a number of ways, including:
training members of the ORTs in outbreak investigation techniques,
including analytical epidemiology;
mentoring enthusiastic staff in the field during outbreak
investigations;
providing formal training in the Master of Public Health degree
programme;
providing formal training in a field epidemiology training
programme (FETP) or a modified FETP (e.g. a six-month programme
that teaches basic field epidemiology).

Stage two
77
There are several different models of FETP, and most are built on a learning-by-
doing approach, first established by the US CDC for the training of epidemic
intelligence service officers (Jones et al., 2014). The students learn while they are
in field placements, and it is important that they have mentors to guide them.
Each FETP specifies core competencies that the students must meet. One of the
key competencies is the ability to conduct outbreak investigations, specifically to
carry out analytical epidemiological studies. Case study 5 describes how countries
in Central America established sustainable FETPs.
CASE STUDy 5. Approach to field epidemiology training in Central America
After two hurricanes devastated the Central American region in 1998, there was
a need to strengthen the response to public health emergencies. A regional
FETP was established, based on a three-tiered model.
› First tier. Local health workers were trained in basic epidemiology
to enable them to respond to local events. Training was conducted
over a 3–5 month period.
› Intermediate tier. A nine-month training programme built on the
competencies acquired in the first tier.
› Advanced tier. A two-year FETP was established, leading to an
academic qualification from a university.
All three tiers included some formal training in a classroom, but most of the
competencies were gained during field work at the students’ workplaces.
As the capacities in field epidemiology increased in the region, individual
countries built their own FETPs. Five important considerations for ensuring a
sustainable FETP were:
Case Study

Stage two
78
› national financing, with a specific line item for the FETP in the
ministry of health budget;
› inclusion of the FETP in the organizational chart of the ministry of
health;
› appointment of a full-time director of the FETP;
› well-defined job functions that allowed epidemiologists in the
ministry of health to practise skills acquired during training;
› a career path for field epidemiologists in the country.
Incorporating methods used in foodborne disease outbreak investigations into
the training curriculum of existing field epidemiology training programmes in a
country is the ideal way to ensure that the epidemiologists are trained to conduct
analytical epidemiological studies. Being able to conduct a cohort or case–control
study is one of the main capacities required in the response to foodborne disease
outbreaks. Examples of case–control and cohort studies are given elsewhere
(WHO, 2008a).
QuestionnairesCountries in stage 2 should have specific questionnaires for each foodborne
pathogen under surveillance. Many diseases are associated with specific exposures,
which will need to be explored in detail, e.g. reef fish for ciguatera intoxication
and sweet cassava for cyanide poisoning. Web links to some examples of disease-
specific questionnaires are given in Table 7.

Stage two
79
Eggs have been identified as a high-risk food item for salmonellosis. A Salmonella
questionnaire may, therefore, include a detailed section on eggs, including
questions about:
the type of egg (e.g. chicken, duck);
how it was produced (e.g. free-range, caged, barn-laid);
the brand of the egg;
the place where the egg was purchased;
any other information that may assist in tracing the eggs consumed back
to the farm that produced them (e.g. batch numbers, use-by dates, etc.).
There are two approaches to obtaining a food history through a questionnaire.
1. Open-ended food history. The interviewer asks the patients
what they ate for breakfast, lunch, dinner, etc. on each day in the
incubation period. This method is useful for identifying novel food
sources. However, the quality of the information obtained may not
be high, because of recall bias. Often, 1–2 weeks may have passed
between the time a specimen is collected and the time of the
interview, and the patient may not remember the exact details of all
the food consumed during the incubation period.
2. Trawling questionnaire. The interviewer asks the patients
whether they ate a specific food item. The list of foods that may
have been contaminated with the agent should be based on
previous experience and information published in the literature.
This approach can be helpful for foods commonly found to be a
source of infection, but may not be useful for identifying novel food
sources.

Stage two
80
It is often best to use a combination of open-ended food history and a section
with trawling questions. For guidance related to questionnaire development,
please refer to WHO (2008a).
TABLE 7. Web links to disease-specific questionnaires
Disease Country Web link to questionnaire
Listeria infection USA http://www.cdc.gov/nationalsurveillance/PDFs/ListeriaCaseReportFormOMB0920-0004_alfalfa.pdf
Salmonella infection
United Kingdom
https://www.gov.uk/government/uploads/system/uploads/attachment_data/file/322555/Salmonella_questionnaire.pdf
Ciguatera intoxication
Australia http://www.health.qld.gov.au/foodsafety/documents/Ciguateraq.pdf
Shiga-toxin-producing E. coli/haemolytic uraemic syndrome
USA https://www.michigan.gov/documents/mdch/ecoli-STEC_questionnaire_277685_7.pdf
Multisectoral collaborationMultisectoral collaboration becomes truly operational during stage 2. The
epidemiological aspects of outbreak investigations will be led by the surveillance
and response sector, but the overall response to the outbreak will involve food
safety and animal health staff, who have the mandate to implement many of the
possible control measures.
The key information from an epidemiological investigation required by food safety
colleagues is the possible food source, plus any information that would enable
them to conduct a trace-back to determine exactly where control measures need
to be targeted. In a large proportion of foodborne outbreaks, the source can be
identified with detailed descriptive epidemiology and trace-back investigations.

Stage two
81
Even when a food item has been incriminated by analytical studies, trace-back is
still necessary to identify the exact source and allow appropriate control measures
to be taken. The epidemiological investigation should obtain as much detail as
possible about the suspected food source, through, for example, detailed food
history interviews and examining food purchases by checking receipts or data
from loyalty card schemes.
for strengthening the response to foodborne disease events in stage 2
Foodborne disease outbreaks: guidelines
for investigation and control (WHO,
2008a)
http://www.who.int/foodsafety/
publications/foodborne_dis-
ease/outbreak_guidelines.pdf
GuiaVETA: guidelines of surveillance
systems for foodborne diseases and
investigation of outbreaks
INPPAZ, PAHO, WHO (2001)
Multisite evaluation of field epidemiology
training programs: findings and
recommendations (Jones et al., 2014)
http://www.cdc.gov/globalhealth/fetp/pdf/fetp_evaluation_report_may_2014.pdf
Examples of disease-specific
questionnaires
Table 7
Reference guide

82
Ad hoc research studies: supplementing surveillance
and response data
8.

Stage two
83
To undertake ad hoc research studies to attribute food sources to specific
diseases, understand foodborne disease epidemiology and estimate the
burden of foodborne diseases in the community, countries will need to develop
or strengthen:
› a mechanism for discussing, agreeing, planning and undertaking
ad hoc research studies.
Selfassessment
There may be occasions when the existing surveillance system cannot answer
some important questions in relation to foodborne diseases, such as the following.
What proportion of diarrhoeal illness in community X is caused by
pathogens that might be foodborne?
We see outbreaks of a particular type of Salmonella, but our
surveillance system tells us there are sporadic cases too. Is the food
item responsible for the outbreaks also causing the sporadic cases?
What proportion of Shiga-toxin-producing E. coli (STEC) cases
reported to the surveillance system are foodborne?
Do the types of Campylobacter found in humans also occur in foods
or in animals? What proportion of Campylobacter cases reported to
the surveillance system may be attributed to chicken meat?

Stage two
84
Ad hoc research studies can answer some of these questions. Several types of
studies are described below, and the advantages and disadvantages of each study
type are shown in Table 8. Some studies, such as risk factor studies, use methods
that could apply to any disease, such as case–control studies; other types of
studies, such as source attribution studies, are specific to foodborne illness.
Etiological studiesEarly in stage 2, it may be necessary to consider some targeted public health
studies to answer questions about the incidence of different foodborne pathogens
causing disease in the community. Results from these studies can provide an
indication of the diversity of such pathogens and identify the main ones. These
results can be used in drawing up the priority list of pathogens for surveillance
and help guide laboratory strengthening activities. For example, if Salmonella
was the most frequently isolated organism from a sample of people presenting
with diarrhoea in a community, it may be worth while to strengthen laboratory
capacity for Salmonella testing. Etiological studies can also be useful in identifying
high-risk groups. For example, enterohaemorrhagic E.coli may be more frequently
isolated from children, indicating that the burden of illness may be higher in this
group. To determine if a specific age-group is at higher risk, it would be necessary
to know the total number of cases reported and also the underlying demographic
profile in the area. Once high-risk groups have been identified, possible sources of
the illness can be examined and appropriate groups targeted with interventions.
Examples of etiological studies are given in case studies 6 and 7.

Stage two
85
CASE STUDy 6. Etiology of persistent diarrhoea in young children in rural northern India
A cohort study followed 963 children aged 0–71 months for 12 months. The
incidence of persistent diarrhoea was 6.3 per 100 child–years and was highest
in those aged 0–11 months. Pathogens isolated during persistent episodes
of diarrhoea included enterotoxigenic Escherichia coli (9.3%), Salmonella spp.
(4.7%), Campylobacter (4.7%), Shigella spp. (2.3%), Entamoeba histolytica
(2.3%), and rotavirus (2.3%). Similar proportions of these pathogens were also
isolated during episodes of acute diarrhoea.
A total of 42 889 specimens were collected from people who presented to
outpatient clinics at 15 hospitals in Guangdong, China, from 2007 to 2012.
All the samples were tested for Salmonella and those that were positive were
further characterized using antigen and PFGE testing. The antimicrobial
susceptibility of the isolates was also tested. Of the specimens collected,
1764 were positive for Salmonella, and the most common serovars were
Typhimurium (n=523), Enteritidis (n=257) and 4,5,12:i:– (n=244). The research
team was able to demonstrate that the burden of Salmonella Typhimurium
and Salmonella 4, 5, 12:i:– was highest in infants, while Salmonella Enteritidis
was more frequently isolated from adults. There was a high level of multidrug
resistance, with 1128 samples exhibiting resistance to more than one of the
agents tested. Only 9.97% (n=176) of isolates were fully susceptible.
Case Study
Case Study
Source: Bhan et al., 1989.
Source: Ke et al., 2014.
CASE STUDy 7. Salmonellosis in Guangdong province, China

Stage two
86
A case–control study was undertaken with 182 cases of Salmonella Enteritidis
infection and 345 controls. Illness was significantly associated with:
international travel (matched odds ratio (mOR), 61, 95% confidence interval
(CI), 8–447); eating undercooked eggs (mOR, 2.2, 95% CI, 1–5); and eating
chicken prepared outside of the home (mOR, 2.2, 95% CI, 1.3–3.4). Eating
chicken outside of the home remained the only significant risk factor for illness
(mOR, 2.0, 95% CI, 1.1–3.6) in a multivariate analysis.
Source: Kimura et al., 2004.
Risk factor studiesDuring an outbreak investigation, analytical or laboratory evidence will often
implicate a high-risk food item as responsible for foodborne illness. With some
of the more common endemic Salmonella serovars, a large number of cases
may be reported to the surveillance system that are not part of a point source
outbreak. To understand the risk factors for sporadic illness in a community, a
case–control study is needed. Cases reported through the surveillance system
are interviewed using a specific questionnaire. Controls are recruited and asked
the same questions. Analysis of the results can identify the food items associated
with sporadic illness in the community (case study 8). The three main issues to
consider in designing a case–control study to examine risk factors for sporadic
infection with foodborne pathogens are: the case definition, selection of controls
and assessment of exposures (Fullerton et al., 2012).
Once the case–control study has been completed and the food items associated
with infection have been identified, control measures aimed at reducing illness in
humans should be discussed with food safety colleagues, veterinarians from the
agricultural sector and the relevant industry.
CASE STUDy 8. Risk factors for sporadic Salmonella Enteritidis infections in the United
States of America
Case Study

Stage two
87
Burden of disease studiesSurveillance systems often do not capture all the illness occurring in the community.
This is especially the case with diarrhoeal illness, as people may not seek health care.
Burden of foodborne disease studies are required to estimate the true burden of
gastroenteritis in the community and assign the proportion that is thought to be
foodborne. Once the total burden of acute gastroenteritis is known, food-specific
and pathogen-specific estimates can be determined. Burden of disease studies
are useful for policy-setting by governments. If food-specific burdens can be
estimated, the results can guide interventions and provide an evidence base for
decision-making about where funds for interventions could be targeted. Case study
9 describes the estimation of the burden of gastroenteritis in Argentina.
Guidance on methods for estimating the burden of disease is given elsewhere
(WHO, 2015). Countries requiring further guidance are invited to contact the WHO
Department of Food Safety and Zoonoses ([email protected]).
CASE STUDy 9. Burden of gastrointestinal illness in Argentina
A study to estimate the burden of acute gastrointestinal illness (GI) was
conducted in Galvez, Argentina, in 2007. Respondents were asked if they had
experienced GI in the previous 7 days or 30 days. The data collection period was
split between the low GI season and the high GI season, to examine the impact
of seasonality on the burden of GI. A total of 2915 people were surveyed. The
mean annual incidence using the 30-day recall period was 0.43 (low GI season)
and 0.49 (high GI season) episodes per person–year. In comparison, the mean
annual incidence given by the 7-day recall period was 0.76 (low GI season) and
2.66 (high GI season) episodes per person–year. In a multivariate model, the
risk factors associated with acute GI in Galvez were high GI season, younger
age group and neighbourhood.
Case Study
Source: Thomas et al., 2010.

Stage two
88
Source attribution studiesPathogens transmitted by food may have more than one source and may also
be spread via other routes of transmission (e.g. animal-to-person or person-to-
person). It is therefore important to understand, for each pathogen, the proportion
of human illness that is caused by a food vehicle. Source attribution studies are
used to determine what proportion of illness can be attributed to particular food
sources. There are various approaches to attributing foodborne illness to specific
food sources (EFSA, 2008). The main approaches are described below.
1. Microbial subtyping. This involves testing human, animal or
food samples using highly discriminatory laboratory methods,
such as multilocus sequence typing (MLST) or PFGE. The laboratory
results from each sector are then compared to determine where
there are overlaps and hence identify a potential source of the
illness in humans. An example of a source attribution study using
this approach is given in case study 10.
2. Summary outbreak data. Outbreak surveillance data are
compiled and statistical models are applied. Food sources identified
during outbreak investigations can thus be attributed to specific
pathogens (case study 11).
3. Epidemiological studies of sporadic cases. These involve
interviewing sporadic cases for their food histories and
determining the likely source through a case-series investigation.
The epidemiology-based approach can also use case–control
methods and may involve further analysis to calculate a population
attributable fraction (Stafford et al., 2008), which gives an estimate
of the proportion of cases attributable to a food vehicle.

Stage two
89
4. Risk assessments. These involve quantifying the exposure
to pathogens from a multitude of sources using risk assessment
methods.
5. Expert opinion. A group of experts discusses gaps in the data
and estimates the proportion of illness attributable to specific food
items. The Delphi method may be used to obtain consensus or
structured elicitation methods can be used to calculate an estimate
of illness attributable to a specific food source. For example, the
WHO global burden of disease estimates used Cooke’s classical
model, in which responses to seed questions are used to weight and
aggregate expert responses to questions about food attribution.
These methods are discussed in detail elsewhere (EFSA, 2008; Pires et al., 2009; Hald
et al., 2016), together with the advantages, disadvantages and data requirements
of each approach.
The outcomes from source attribution studies provide an evidence base for
specific pathogen–food pairs. It will then be possible to work with food safety
colleagues, veterinarians from the agricultural sector, and the relevant industry
to focus control measures. Source attribution studies can also be used to evaluate
the effectiveness of interventions.

Stage two
90
CASE STUDy 10. Campylobacter source attribution using laboratory methods in Scotland
Campylobacter isolates from humans (5674 cases) were compared with 3419
non-human isolates collected in Scotland in 2005–06. Multilocus sequence
typing was performed on all the isolates and the results were analysed using
statistical models. The models attributed 76% of clinical isolates to chicken
and 20% to cattle and sheep. Only about 4% of isolates were attributed to wild
birds, the environment, swine, and turkey.
Source attribution was done using outbreak surveillance data from countries
in Latin America and the Caribbean. A statistical model was developed for
the main foodborne bacterial pathogens. Between 1993 and 2010, there
were 6313 outbreaks reported across 20 countries. From 1993 to 1999, the
most important sources of bacterial pathogens in outbreaks were meat, dairy
products, water and vegetables. From 2000 to 2010, eggs, vegetables and
grains and beans were the most important sources of bacterial outbreaks. This
study identified gaps in surveillance data, but the approach was found to be
useful for developing countries where surveillance for foodborne diseases
may be limited.
Case Study
Case Study
Source: Sheppard et al., 2009.
Source: Pires et al., 2012.
CASE STUDy 11. Source attribution in Latin America and the Caribbean using data from outbreak investigations

Stage two
91
Pathogen prevalence along the food chainAs a step towards stage 3, a country may consider conducting a survey to measure
pathogen prevalence at each step along the food chain, from the farm, through
the various processing steps, distribution and retail outlets. The findings can be
compared with human surveillance data to determine if there are any overlaps in
the types of pathogens present (case study 12).
CASE STUDy 12. Pathogen prevalence along the food chain in Mexico
Four states in Mexico conducted a study to examine the prevalence of
Salmonella spp. across the food chain from March 2002 to August 2005.
Samples were collected at three different points along the food chain: (1) ill
and asymptomatic children; (2) pork, chicken and beef on sale in the retail
sector; and (3) intestines from chicken, swine and cattle at slaughter houses.
The Salmonella isolates were tested for antimicrobial resistance and were
further typed by PFGE. The main findings were:
› high rates of contamination of meat (21.3–36.4%);
› high rates of ceftriaxone-resistant S. Typhimurium in chicken
(77.3% of all S. Typhimurium isolates), ill humans (66.3%), and
swine (40.4%);
› the emergence of ciprofloxacin resistance in S. Heidelberg (10.4%)
and S. Typhimurium (1.7%) from swine.
Case Study
Source: Zaidi et al., 2008.

Stage two
92
Studies to identify foodborne chemical hazardsChemical hazards cannot be monitored through the surveillance system for
communicable diseases. The main concern with chemical hazards is their long-
term health effects. Food monitoring will have an important role in regularly
sampling food items, testing them for priority chemical hazards and assessing the
levels of contaminants in food in relation to maximum allowable limits.
WHO has published guidance on assessing dietary exposure to chemicals in foods
(WHO, 2009). These assessments require data on the concentrations of chemicals
in foods and on consumption of specific food items. Total diet studies are the most
robust for estimating the concentrations of chemicals in foods (EFSA, FAO, WHO,
2011). Food consumption data can be obtained from food diaries and recall of
foods eaten in the previous 24 hours. Foods are then purchased, prepared (cooked,
peeled, etc.) and pooled into groups. The pooled food groups are then sampled
and analysed for priority chemical hazards. Data from total diet studies and food
histories can be put into risk-based models and the dietary exposure calculated.
This is then compared with maximum allowable limits for the chemicals of interest
to determine the health risks to the community.
Where to beginWhen a country identifies a gap in knowledge about foodborne diseases that the
surveillance and response system cannot answer, it may be necessary to consider
conducting one of the ad hoc studies discussed above. There are many ways to
approach such a study, but a general outline of the process is given below.

Stage two
93
03
04
05
FORM A wORkINg gROup
Bring together people with relevant expertise to discuss the study question. Terms of reference should be established for the working group, to allow it to focus on the study.
IDENtIFy thE AppROpRIAtE MEthODS
The working group will need to decide on the most appropriate method for answering the study question. The sections above provide some ideas as a starting-point.
IDENtIFy FuNDINg
Some ad hoc studies are expensive and will require significant resources. The financial and human resources required for the study should be identified before the study begins.
EthICAL CONSIDERAtIONS
Some studies may require prior approval from a human research ethics committee.
IDENtIFy ExpERtS tO pARtICIpAtE IN thE StuDy
Key experts in the country should participate in the study. These experts do not need to possess all the skills to conduct the study, but should be familiar with research methods, foodborne diseases and the context in which the study will be undertaken. Experts should include government staff and academics from the university sector, as a minimum. A lead investigator should be identified.
OutCOMES FROM thE StuDy
Given that ad hoc studies are undertaken to answer specific questions, the outcomes from the study should be anticipated. For example, is the study likely to lead to a policy change in relation to food safety or regulation? If so, food safety experts will need to be part of the working group to ensure that the outcomes can be used to influence policy change.
01
02
06

Stage two
94
TABLE 8. Types of ad hoc research studies that can be useful for foodborne diseases
Type of ad hoc research study
Requirements for the study Advantages Disadvantages
Etiological study
•research question coming from gaps in surveillance data (e.g. what are the main microbial pathogens causing diarrhoea in the community?)
•Laboratories can identify pathogens
•Can be relatively inexpensive, depending on the pathogens being tested
•Uses a sentinel surveillance approach, which can be a foundation for routine sentinel surveillance in the future
•Only measures one point in time
•Considerations of bias and the ability to generalize results to whole country
Risk factor study
••Laboratoriescanidentifypathogens
•Cases need to be interviewed by public health authorities
•Analytical epidemiology skills (e.g. case–control study analysis)
•Useful for identifying risk factors for sporadic infections
•Can be time-consuming•Careful consideration of
study design (e.g. selection of controls)
Burden of disease study
•Laboratories can identify pathogens
•Population-based cross-sectional study design
•Statistical assistance
•Provides an accurate estimate of gastroenteritis in the community
•Provides an estimate of the proportion of gastroenteritis that is likely to be foodborne
•Requires significant resources
Source attribution study
•For the laboratory-based approach, laboratories can identify and characterize pathogens to the highest level
•For the epidemiological approach, comprehensive and complete outbreak surveillance data
•Statistical assistance•Cooperation with colleagues
in food safety and agriculture
•Can attribute food sources to specific foodborne pathogens
•Epidemiological approach can be used in developing countries where the laboratory approach may not be appropriate
•Can foster multisectoral collaboration
•Discriminatory laboratory tests can be expensive
• If using outbreak surveillance data, the attribution would only be in an outbreak setting and may not be generalizable to sporadic illness
•Need a large number of samples to ensure adequate power in study
Prevalence along the food chain
•Laboratories dealing with different sectors (human, animal and food) can identify pathogens and use mutually agreed subtyping methods
•Cooperation with colleagues in food safety and agriculture
• Identify food sources responsible for human illness
•Can foster multisectoral collaboration
•Useful first step towards integrated food chain surveillance
•Only measures one point in time and cannot provide ongoing information about food sources

Stage two
95
Type of ad hoc research study
Requirements for the study Advantages Disadvantages
Total diet study (TDS)
•Laboratories that can test for priority chemical hazards in foods
•Can identify chemical hazards in specific food groups
•Data from TDS can be triangulated with food consumption surveys to assess dietary exposure to chemicals
•Can be expensive, as need a large sample size and range of foods for analysis
•May only be able to measure a small number of chemical hazards
Food consumption studies
•Population-based cross-sectional survey design
•Provides an excellent snapshot of the food consumed by the general population
•Data generated can also be used in assessing food histories obtained during cluster investigations
•Need a large number of participants to ensure adequate power in study
•Often need to run over long period of time to account for seasonality in foods consumed
(TABLE 8. Continue)
for ad hoc research studies on foodborne diseases in stage 2
Advantages and disadvantages of
different ad hoc study designs
Table 8
Burden of foodborne disease method Under development (Foodborne
Disease Burden Epidemiology
Reference Group) http://www.
who.int/foodsafety/areas_work/
foodborne-diseases/ferg/en/
Source attribution methods (Pires et al.,
2009)
http://www.efsa.europa.eu/en/
scdocs/doc/764.pdf
Reference guide

Stage two
96
World Health Organization estimates
of the relative contributions of food to
the burden of disease due to selected
foodborne hazards: a structured expert
elicitation (Hald et al., 2016)
http://journals.plos.org/
plosone/article?id=10.1371/
journal.pone.0145839
Assessing dietary exposure of chemicals
in foods (WHO, 2009)
http://whqlibdoc.who.int/ehc/
WHO_EHC_240_9_eng_Chap-
ter6.pdf
Guidance on conducting total diet
studies (EFSA, FAO, WHO, 2011)
http://www.efsa.europa.eu/en/
efsajournal/doc/2450.pdf

97
Multisectoral collaboration
9.

Stage two
98
For multisectoral collaboration that facilitates the sharing of data for risk
profiling, countries will need to develop or strengthen the following:
› a functioning communication mechanism between all stakeholders
in food safety in the country; this requires agreement on:
› what information is to be shared,
› when information needs to be shared,
› who needs to know the information, and
› how information is to be shared;
› evidence that this mechanism is in operation, e.g. a written
communications plan, report from an outbreak debriefing about
how the teams will work together better, etc.;
› multisectoral involvement in risk profiling of food safety problems,
to help identify appropriate risk management strategies.
Selfassessment
Multisectoral collaboration becomes increasingly important in stage 2. There
will be operational linkages during the response to acute public health events.
However, there will also need to be strategic linkages, to ensure that surveillance
data from humans can be combined with food monitoring data to improve
understanding of some of the risks posed by hazards in food items.

Stage two
99
Establishing mechanisms for collaborationThe food safety and monitoring systems will be developing in parallel with the
surveillance and response system. It will be important to ensure the cooperation
of all stakeholders and that coordination and communication mechanisms
are established (WHO, FAO, OIE, 2008). Some of the questions that need to be
addressed when creating a communication mechanism are:
what information is to be shared?
when does the information need to be shared?
who needs to know the information?
how is the information to be shared?
Table 9 suggests some possible answers to these questions, which can form
the basis of a communication mechanism. A template for a communication
mechanism between surveillance and response staff and food safety staff is
given in Annex 8. It may be possible to establish a working group that specifically
addresses multisectoral collaboration for foodborne diseases. Representatives
on the working group could include disease surveillance and response staff,
food safety staff, veterinarians from the agricultural sector, horticulturalists,
toxicologists, laboratory personnel and people responsible for monitoring of food
for export. Clear terms of reference need to be drawn up and the mandates of
each partner clearly identified and respected. Figure 12 shows the steps a country
can take to strengthen multisectoral collaboration in stage 2.

Stage two
100
TABLE 9. An example of a basis for a communication mechanism
QuestionAcute events Routine
Surveillance and response
Food safety Surveillance and response
Food safety
What information needs to be shared?
•Event details from the initial report: how many are ill, where they are located, dates of onset of illness, suspected sources of illness
•Detailed information from case interviews, such as date of illness onset, brand and place of purchase of suspected food source to assist in trace-back.
•Food recall information: which products are affected, nature of the recall, distribution of the product
•Results from trace-back investigations that may be relevant for interviewing subsequent cases in an outbreak
•Surveillance bulletins
•Specific data for understanding the risks for certain pathogens
•Results from food monitoring
• Information about preventative measures being implemented across the food chain
When does the information need to be shared?
Within 24 hours of the first report of an event and updated daily at outbreak meetings
Within 24 hours of the first report of an event and updated daily at outbreak meetings
Whenever new surveillance bulletins are issued
Whenever reports from food monitoring are issued
Who needs to know the information?
Designated food safety focal points for events
Designated surveillance and response focal points for events
Food safety team Surveillance and response team
How is the information to be shared?
Email, telephone, minutes of outbreak meetings
Email surveillance bulletins and food monitoring reportsPresent results to partners

Stage two
101
FIGURE 12. Decision-tree to identify the steps a country can take to strengthen multisectoral collaboration for foodborne diseases in stage 2
Are food safety and laboratory staff standing members of rapid risk assessment teams and rapid response teams for
foodborne events at national and subnational level?
• Ensure food safety and laboratory staff are standing members of rapid risk assessment and response teams at national level.
• Ensure food safety and laboratory staff are standing members of rapid risk assessment and response teams at subnational level.
Is there a clear communication mechanism for acute events and routine surveillance feedback?
Is there a working group on foodborne diseases?
Capacities for multisectoral collaboration in stage 2 have been established
• Consider establishing a working group on foodborne diseases.• If it is decided to establish a working group, draft terms of reference
and membership.
• Establish a communication mechanism that has been approved by all relevant stakeholders.
Risk profilingAs the surveillance and response system for foodborne diseases is strengthened,
countries will be able to use the surveillance data to contribute to risk profiling.
The risk profiles are generated by food regulators who have the mandate to take
public health actions and interventions.
Risk profiling is the process of describing a food safety problem and its context
to help identify opportunities for authorities to implement appropriate risk
management strategies (FAO, WHO, 2006). A typical risk profile includes a brief
description of (FAO, WHO, 2006):

Stage two
102
the situation, product or commodity involved;
the pathways by which consumers are exposed to the hazard;
possible risks associated with that exposure;
consumer perceptions of the risks;
the distribution of possible risks among different segments of the
population.
Table 10 lists the information that is included in a risk profile and shows where
data from the surveillance and response system for foodborne diseases may be
used.
Within the food safety sector, the risk profile assists risk managers in setting
priorities, establishing if there are data gaps and deciding if a risk assessment is
required. In many instances, the risk profile can be a preliminary risk assessment
that summarizes all of the available information (FAO, WHO, 2006). Examples
of a range of different risk profiles can be found on the website of the New
Zealand Food Safety Authority (http://www.foodsafety.govt.nz/science-risk/risk-
assessment/risk-profiles/).

Stage two
103
TABLE 10. Information included in a risk profile and role of data from the surveillance and response system
Information included in a risk profile Data from surveillance and response system
Initial statement of the food safety issue Might include a brief summary of the epidemiology in humans, from data in the notifiable disease surveillance system and event database. For example: “There were 850 cases of salmonellosis in humans in 2014 and 10 Salmonella outbreaks reported.”
Description of the hazard and foods involved
N/A
How and where the hazard enters the food supply
Some systems can capture data on the place where the food item was consumed (e.g. home, restaurant) and where the breakdown occurred that led to the outbreak (e.g. primary production, processing, distribution, domestic handling).
Which foods expose consumers to the hazard and how much of those foods are consumed by various groups in the population
Might include a summary of outbreaks linked to the specific food item that have been investigated and recorded in the event database.
Frequency, distribution and levels of occurrence of the hazard in foods
Source attribution studies can use data from the surveillance and response system to provide this information.
Possible risks identified from the available scientific literature
It is also possible to include this information from the event database if the following data on outbreaks are systematically collected:•contamination risk factors (e.g. raw
products contaminated by animal or environmental pathogens, cross-contamination with raw animal ingredients);
•factors in survival or improper treatment to inactivate bacteria (e.g. insufficient time/temperature, inadequate acidification)
•factors that permit proliferation (e.g. inadequate hot or cold storage, slow cooling).
Nature of values at risk (human health, economic, cultural, etc.)
Description of the adverse human health effects:•detailed description of the
epidemiology of the pathogen from the notifiable disease surveillance system;

Stage two
104
Information included in a risk profile Data from surveillance and response system
•detailed summary of all outbreaks related to the pathogen and food item from the event database;
•results from ad hoc research studies, such as risk factors identified from case–control studies of sporadic cases or information from source attribution studies.
Distribution of the risk (who produces, benefits from, and bears the risk)
Identification of high-risk groups in the population from the surveillance and outbreak data.
Characteristics of the commodity or hazard that might affect the availability and feasibility of risk management options
N/A
Current risk management practices relevant to the issue, including any regulatory standards
N/A
Public perceptions of the possible risks N/A
Information about possible risk management (control) measures
N/A
Preliminary indication of questions that a risk assessment could (and could not) be expected to answer
N/A
Implications of risk management in terms of international agreements
N/A
(TABLE 10. Continue)
Adapted from Box 2.5 in FAO, WHO, 2006.N/A= not applicable

Stage two
105
for strengthening multisectoral collaboration in stage 2
Steps to strengthen multisectoral
collaboration
Figure 12
Template for a communication
mechanism between surveillance and
response staff and food safety staff
Annex 8
Food safety risk analysis: a guide for
national food safety authorities (FAO/
WHO, 2006)
http://www.who.int/foodsafety/
publications/micro/riskanaly-
sis06.pdf
Examples of risk profiles http://www.foodsafety.govt.nz/
science-risk/risk-assessment/
risk-profiles/
Reference guide

106
Monitoring and evaluation
10.

Stage two
107
For monitoring and evaluation of the surveillance and response system for
foodborne diseases, countries will need to:
› revise monitoring indicators for each component of the system to
include:
› laboratory-confirmed foodborne diseases for IBS,
› sensitivity and specificity of EBS,
› subnational capacity for rapid risk assessment and response,
› multisectoral collaboration;
› ensure regular evaluation of the surveillance and response system
in relation to foodborne diseases.
Selfassessment
Routine monitoring and regular evaluations can help to ensure that the
surveillance and response system for foodborne diseases is functioning efficiently
and effectively. Each component (EBS, IBS, rapid risk assessment, response and
multisectoral collaboration) in the system should be monitored in stage 1. In
stage 2, the indicators will need to be updated, as the surveillance and response
system for foodborne diseases develops.
Guidance on monitoring and evaluation of disease surveillance and response
systems has been published by WHO (2006a). This proposes indicators for
monitoring and evaluation and contains tools for compiling data for monitoring
purposes. Specific guidance on evaluation and monitoring of the early warning
function of EBS and IBS is also available (WHO, 2014).

Stage two
108
MonitoringThe generic monitoring indicators in the two guidance documents mentioned
above also apply to foodborne diseases. However, a country may choose to add
some indicators that specifically address foodborne diseases in stage 2 (Annex
9). The indicators used for monitoring each component in stage 1 will need to be
reviewed to ensure that the most appropriate indicators are being used in stage
2. For example, for IBS, it will be important to include indicators of timeliness and
completeness of data in notifications from laboratories.
EvaluationIf an evaluation of the national surveillance system is planned, a specific section
on foodborne diseases and foodborne events could be included. This is an ideal
opportunity to use existing resources to identify the ability of the broader disease
surveillance and response system to address foodborne diseases, and to harness
opportunities for funding foodborne disease surveillance that will also strengthen
the broader system. The surveillance system attributes that are important for
foodborne diseases are shown in Box 5.
BOx 5. Desirable surveillance system attributes for foodborne diseases
Simplicity.
The system should be as simple as possible to ensure that participants, such as
notifiers (EBS and IBS), can contribute easily. The surveillance system database
should also be kept simple at all stages, to ensure that data can be entered and
extracted easily.
how to

Stage two
109
Flexibility. The system needs to be flexible, so that new syndromes or diseases can be added
as the surveillance system moves from stage 1 to stage 2.
Data quality. The data should be complete and valid, regardless of the stage. As the surveillance
system develops and more data are collected, it will be important to ensure that
data quality is maintained.
Acceptability. The system needs to be acceptable to surveillance staff at the local level, to ensure
that they send data regularly and on time.
Sensitivity. While the system does not need to detect every case occurring in a community,
it needs to be sufficiently sensitive to detect events. Assessing sensitivity will also
help determine the proportion of cases that are being reported to the surveillance
system.
Positive predictive value. This should be quite high for the detection of events, so that responses are
launched only for real events. The processes of event verification and rapid risk
assessment are vital.
Representativeness. As the surveillance system develops, it should become more representative, to
allow accurate monitoring of trends over time and evaluation of interventions.
Timeliness. This is the most important attribute for the detection of foodborne events,
including outbreaks. As part of the evaluation, it will be important to examine
where delays are possible throughout the surveillance system.

Stage two
110
Based on guidance from the Centers for Disease Control and Prevention (2001) and WHO (2014).
for strengthening monitoring and evaluation of the surveillance and response system in stage 2
Communicable disease surveillance and
response systems: guide to monitoring
and evaluating (WHO, 2006a)
http://www.who.int/csr/resourc-
es/publications/surveillance/
WHO_CDS_EPR_LYO_2006_2.
Early detection, assessment and
response to acute public health events:
implementation of early warning and
response with a focus on event-based
surveillance. Interim version (WHO, 2014)
http://www.who.int/ihr/pub-
lications/WHO_HSE_GCR_
LYO_2014.4/en/
Updated guidelines for evaluating
public health surveillance systems:
recommendations from the guidelines
working group (Centers for Disease
Control and Prevention, 2001)
http://www.cdc.gov/mmwr/pre-
view/mmwrhtml/rr5013a1.htm
Reference guide
Stability. The system should be sufficiently stable to allow the data being reported to be
regularly assessed. It is important to have a stable baseline to determine whether
observations are above what is expected.

111
Managing implementation
11.

Stage two
112
The guidance contained in this module has been designed to fit in with existing
strategic plans for disease surveillance and response and, where applicable, food
safety. The drafting of separate plans specifically to address foodborne disease
surveillance and response in stage 2 is discouraged. There are several steps a
country can take to implement the guidance contained in this module.
Decision-treesUse the decision-trees presented in this module as tools to assess existing
capacities and to determine what actions need to be taken to strengthen
surveillance and response for foodborne diseases. Some activities in stage 2 are
not captured in the decision-trees (e.g. rapid risk assessment, response, ad hoc
studies and monitoring and evaluation), but are discussed in the text. Annex 10
lists all of the actions from the decision-trees and the text of this module, and
contains a template for recording the information.
It is important to note that the stages and the capacities in the decision-trees are
simplified guides to assist countries. Each country will develop its surveillance and
response system in its own way. A country does not need to have all capacities in
all of the components in stage 1 before moving to stage 2. It may be necessary to
refer to the stage 1 module if some of the capacities for one component require
more development. Countries in stage 2 that are still developing surveillance and
response capacities may also start to consider taking steps towards integrated
food chain surveillance, once their laboratory-based surveillance is robust enough
and there is goodwill among all of the key stakeholders.

Stage two
113
Identifying priority capacities for implementationOnce the capacities that require strengthening have been identified, activities
for implementation should be prioritized. It is important to involve all relevant
stakeholders in identifying the priority capacity-building activities. Some criteria
in selecting priority activities for implementation include:
impact on the surveillance and response system;
available resources (e.g. financial and human resources);
ease of implementation.
The priorities can be documented for each capacity-building activity in the
template in Annex 10.
Ideally, countries should give priority to activities that will increase the impact of the
surveillance and response system and that can be implemented with the financial
and human resources available. However, some capacities will require significant
investments; the information in this module may be used in drafting proposals for
funding to strengthen surveillance and response for foodborne diseases. In stage
2, many of the activities undertaken to strengthen the surveillance and response
system for foodborne diseases will have benefits for the broader surveillance and
response system for other diseases under surveillance.
Strategic plansInitially, a country may add the completed template from Annex 10 to their
existing surveillance and response strategic plans. As further national strategic
plans are developed, the activities for strengthening surveillance and response
for foodborne diseases can be incorporated.

114
Identifying priorities for surveillance and response in stage 2
Annex 1.

Stage two
115
The main principle of disease prioritization is that all key stakeholders should
collaborate in drawing up a list of diseases for surveillance in a systematic,
transparent and objective manner. A defined prioritization technique can provide
a structured mechanism for objectively ranking foodborne diseases and making
sometimes difficult decisions. It also helps to gather input from a variety of
stakeholders, including food safety partners, and to take into consideration other
competing health issues within the country.
The steps for prioritizing diseases are as follows.
1. Establish criteria.
2. Collect information.
3. Make decisions.
4. Translate priorities into surveillance options.
Step 1. Establish criteriaThe first step is to agree a set of criteria for objectively assessing each disease
and syndrome under consideration. The parameters listed in Table A1.1 can help
guide the development of the criteria. These parameters should be examined
not only from the national perspective but also from a regional, and possibly
international, perspective, depending on the trade implications and the potential
for cross-border spread. Additional criteria can be added to the list, depending on
the needs of the country.
2.
1.
3.
4.

Stage two
116
TABLE A1.1. Possible criteria for identifying priority diseases for surveillance in stage 2
Criteria Parameters to consider
Disease burden (size of the health problem, severity of clinical outcomes)
•Percentage of cases attributable to foodborne transmission
•Annual incidence rate •Vulnerability of the exposed population groups (by
sex, age, ethnicity)•Case–fatality ratio•Rate of hospitalization •Nature and frequency of long-term disabilities
Information about the hazards
•Food monitoring data for chemical residues in food•Food monitoring data for microbial pathogens
Epidemiological features •Disease that occurs in outbreaks that have been attributed to a food source
•Disease trends over time: is the incidence rate increasing?
Availability of treatment or effective control
•Possibility of applying specific prevention or control measures
•Availability and nature of treatment
Social and economic costs •Estimate of economic cost of the disease• Impact on tourism and international trade•Public perceptions of risk
Feasibility •Availability of reliable diagnostic tests•Ability to carry out surveillance for the disease
Step 2. Collect information to guide prioritization processOnce the criteria for assessing priority have been established, the relevant
information on the criteria has to be collected for each disease and syndrome
under consideration. Table A1.2 indicates some possible sources of information.
When considering information sources, it is important to understand how the
data are collected, analysed and reported. There may be biases in the methods
of collection or analysis that may make a disease or hazard appear to be more of
a problem than it really is. For example, when considering food monitoring data
on chemical residues, it will be important to know the full list of chemicals tested
for. Similarly, when considering the pathogens most frequently identified during
outbreaks, it will be important to know the range of pathogens tested for.

Stage two
117
The collected data can then be entered into a table (Table A1.3), which allows easy
comparison of the key criteria. Where possible, data to complete the table should
come from existing sources. For countries at the beginning of stage 2, there may
be a lack of data for certain criteria; these data gaps should also be documented.
TABLE A1.2. Possible sources of information on criteria for establishing priorities for
surveillance in stage 2
Information source
Extra resources required?
Advantages Disadvantages
Existing surveillance data, e.g. trends in diarrhoeal syndromes
No •The data do not provide specific information on foodborne diseases but can be used, along with other data (e.g. multiple outbreak data or results of prevalence surveys in animals or humans) to draw conclusions about trends.
•Captures trends over time•Notifiable systems might cover the
whole country •High specificity for foodborne
diseases where there is laboratory confirmation
•Low specificity where syndromes (without laboratory confirmation) are used
•Without other sources of data, the sensitivity for foodborne diseases may be low
Outbreak response data
No •Data from multiple outbreaks can provide an indication of the burden of outbreak-prone foodborne diseases
•Low sensitivity, as the data are only from detected outbreaks where a foodborne pathogen is identified
Existing ad hoc research studies
No •May provide specific information about foodborne hazards to supplement existing surveillance and outbreak data
•May not specifically address criteria for prioritization
Food monitoring No •Captures information about the main hazards being found in food
•Especially important for establishing priorities for chemical hazards
•A limited range of hazards may be tested for
•A limited range of foods may be tested
Foodborne disease burden estimates
Yes •Most accurate way to determine the burden of gastroenteritis thought to be foodborne in origin
•Can be expensive

Stage two
118
Questions Disease 1 Disease 2 Disease 3
Disease burden
Percentage of annual cases attributable to foodborne transmission
Annual incidence rate per 100 000 population
At-risk populations• Male:female ratio• Age groups most
affected• Other high-risk groups
Case–fatality ratio
Hospitalization rate
Nature and frequency of long-term disabilities
Information about hazards
Food monitoring data for chemical residues in food
Food monitoring data for microbial pathogens
Information source
Extra resources required?
Advantages Disadvantages
Food consumption data
Maybe •There may be existing food consumption data that can be used with food monitoring data to assess chemical risks in foods (WHO, 2009)
•Can be expensive
Total diet studies Yes •Most accurate way to measure concentrations of chemical residues in food
•Can be expensive
(TABLE A1.2. Continue)
TABLE A1.3. Template for summarizing data on diseases and syndromes as part of the
prioritization process

Stage two
119
Questions Disease 1 Disease 2 Disease 3
Epidemiological features
Epidemic potential (do outbreaks occur?)
Disease trends (is the incidence rate increasing?)
Availability of treatment or control
Specific prevention or control measures
Availability of treatment
Social and economic costs
Estimate of economic cost
Impact on tourism and international trade
Public perception of risk
Feasibility
Availability of reliable diagnostic tests
Ability to conduct surveillance for the disease
(TABLE A1.3. Continue)
Step 3. Make decisionsThere are several options for making decisions about foodborne disease priorities.
The choice will depend on the resources available and the number and diversity
of stakeholders in the process. The two main approaches are strategy grids and a
Delphi panel.

Stage two
120
Strategy grids
Strategy grids are recommended for use in countries where resources are limited
and the main focus is on identifying the foodborne diseases for which surveillance
will have the biggest impact. Using the data collected in Table A1.3, all of the
diseases considered in the prioritization process can be ranked in a strategy grid.
The criteria used for the strategy grids are flexible – any of the criteria from step
1 could be used to make a strategy grid. An example using disease burden and
feasibility of conducting surveillance is shown in Figure A1.1. However similar
strategy grids could be drawn up for disease burden and capacity to control
or prevent disease, or for feasibility of conducting surveillance and social and
economic impact.
FIGURE A1.1. Strategy grid to set priorities for foodborne disease surveillance, using
disease burden and feasibility
Disease burden
Feasibility
high
highLow
Low
High disease burden, low feasibility High disease burden, high feasibility
The surveillance of these foodborne diseases is a long-term project. Options for surveillance will require significant investment. Focusing on too many of these diseases can overwhelm the surveillance system and compromise its overall performance.
These diseases should be a high priority and sufficient resources should be assigned to their surveillance
Low disease burden, low feasibility Low disease burden, high feasibility
With minimal return on investment, these are the lowest priority foodborne diseases and should not be included in the surveillance system.
Often politically important (as they are rare but may be high-impact diseases, such as botulism), these diseases may need to be considered as more resources become available. It may also be possible to gather information on these diseases using ad hoc research studies.

Stage two
121
Delphi panel approach
When there are many criteria in the priority-setting process, many diseases to
choose from, or where the input from a wide variety of stakeholders needs to
be considered, the Delphi approach is the recommended method of identifying
priorities. The process has been described in detail in WHO (2006b) guidelines,
and can be summarized as follows.
› Identify key stakeholders to be part of the prioritization process.
› Ask participants to score the diseases against the criteria.
› Weight and sum the results for each participant.
› Rank the diseases, then ask participants to assess the ranking.
› Discuss and finalize the results.
how to
Modifications of this approach have been used with success in a range of settings
with widely differing resources, such as Germany and the Federated States of
Micronesia (Krause, 2008; Gilsdorf & Krause, 2011; Pavlin et al., 2010). The scoring
and weighting of the criteria for prioritization make the process transparent,
reproducible and less likely to be dominated by the more vocal participants. The
steps involved in the process are shown in Figure A1.2.

Stage two
122
FIGURE A1.2. Steps involved in the Delphi approach to prioritization
A
B
C
D
E
F
Define scores for each criterion
Delphi panel: define weights
Delphi panel: assign scores for each criterion
Apply weights and sum scores
Rank the hazards
Delphi panel: discussion and consensus
Based on Krause (2008) and Pavlin et al. (2010).
Step A. Define scores for each criterion
A standard scoring system needs to be developed for the criteria developed in
step 1. Commonly used scores are +1 for criteria of high importance, -1 for criteria
of low importance and 0 for those of medium importance. For each criterion,
thresholds should be defined for each score. Table A1.4 shows how a matrix can
be constructed to define the scores for each criterion. Some examples of criteria
and thresholds used in scoring are given in Krause (2008) and Pavlin et al. (2010).

Stage two
123
TABLE A1.4. Matrix for defining scores for each criterion
Step B. Delphi panel: define weights
A panel of experts and key stakeholders who are knowledgeable in the area
should be convened. Each member of the panel should rank the criteria in order
of importance, assigning the highest number to the most important criterion and
1 to the least important. A weight is calculated for each criterion as the average of
the rankings. This process can take place before or during a meeting of the panel
of experts.
Step C. Delphi panel: assign scores for each criterion
A meeting of the panel of experts then considers the data collected in step 2 and
collectively decides on the score for each criterion.
CriterionScore
-1 0 +1
Disease incidence Fewer than 1 case per 100 000 population
1–20 cases per 100 000 population
More than 20 cases per 100 000 population

Stage two
124
Step D. Apply weights and sum scores
Each criterion score is then multiplied by the weighting from step B and all the
criteria scores are summed to give an overall score for each hazard.
Step E. Rank the hazards
Once the weighting and scores have been calculated, the diseases are ranked in
order from the highest score to the lowest.
Step F. Delphi panel: discussion and consensus
The expert panel should then examine the ranked list of hazards and discuss the
results at a meeting. There may need to be a consensus approach depending on
the results of the ranking.
Step 4. Translate priorities into surveillance optionsOnce a list of priority hazards has been drawn up, the surveillance options for
each hazard need to be considered. Table A1.5 lists the options based on a general
grouping of hazards. Laboratory-based surveillance is the most appropriate
option for microbial hazards that require further characterization. However, it may
not be necessary or desirable to have laboratory-based surveillance for some rare
high-impact diseases, such as botulism and haemolytic uraemic syndrome (HUS).
Chemical hazards, including pesticides and natural toxins, require a targeted
approach using ad hoc research studies. Parasites may also be measured through
ad hoc research studies or burden of disease studies, until laboratory capacity is
sufficient for diagnostic tests to be performed routinely.

Stage two
125
TABLE A1.5. Surveillance options for different priority hazards
Hazard Example Surveillance option Rationale
Microbial hazards
Salmonella, Shigella, Shiga-toxin-producing E.coli, Campylobacter, hepatitis A
Laboratory-based surveillance Strong laboratory capacity is needed to keep these pathogens under surveillance
Acute diarrhoea
Notifiable disease surveillance Early in stage 2, diarrhoea will still be important as a notifiable syndrome, until laboratory capacity improves
Sentinel surveillance Once laboratory capacity begins to develop, it may be possible to conduct sentinel surveillance, with a subset of samples being tested in a laboratory
Rare high-impact diseases
Botulism Strengthened notifiable disease surveillance
•Distinctive clinical presentation
•Given that it is a rare disease, laboratories may not have the capacity to conduct testing
Haemolytic uraemic syndrome
Strengthened notifiable disease surveillance; laboratory confirmation required
•Rare complication of STEC infection, but may also be caused by other factors. It is therefore essential that HUS cases are tested for STEC.
•Clinical presentation part of case definition for HUS, but blood tests are needed for confirmation
Chemical hazards
Pesticides Ad hoc research studies, such as total diet studies, population-based surveys
•Only involvement with surveillance and response system would be for acute events that may be detected through EBS.
•Ad hoc research studies are required to answer questions related to chemical hazards
Natural toxins (e.g. aflatoxins, mushroom toxins)
Ad hoc research studies, such as total diet studies, population-based surveys
•Only involvement with surveillance and response system would be for acute events that may be detected through EBS.
•Ad hoc research studies are required to answer questions related to natural toxins

Stage two
126
Hazard Example Surveillance option Rationale
Parasites
Cryptosporidium, Trichinella, Cyclospora
Ad hoc research studies, burden of disease studies, existing control programmes for specific diseases
Early in stage 2, it is unlikely that there will be laboratory capacity to detect parasites.
Laboratory- based surveillance
Once laboratory capacity begins to develop, it may be possible to include high priority parasites in laboratory surveillance.
(TABLE A1.5. Continue)

127
Further characterization of bacterial foodborne
pathogens
Annex 2.
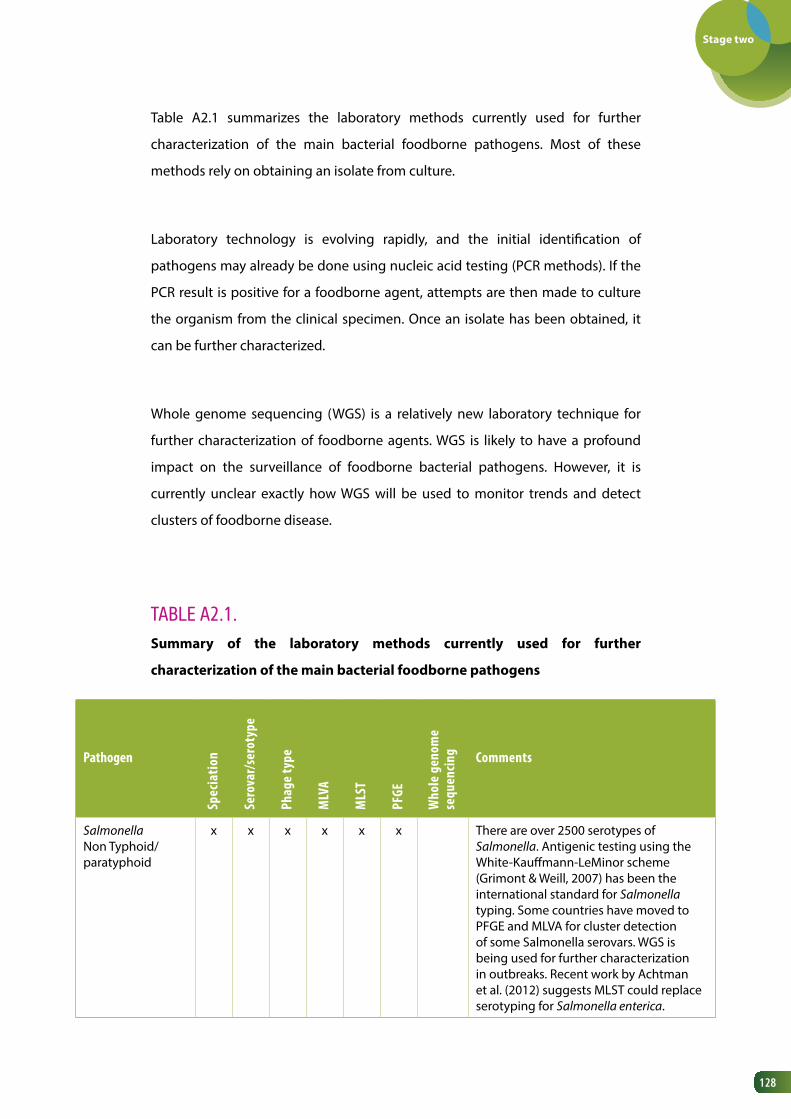
Stage two
128
Table A2.1 summarizes the laboratory methods currently used for further
characterization of the main bacterial foodborne pathogens. Most of these
methods rely on obtaining an isolate from culture.
Laboratory technology is evolving rapidly, and the initial identification of
pathogens may already be done using nucleic acid testing (PCR methods). If the
PCR result is positive for a foodborne agent, attempts are then made to culture
the organism from the clinical specimen. Once an isolate has been obtained, it
can be further characterized.
Whole genome sequencing (WGS) is a relatively new laboratory technique for
further characterization of foodborne agents. WGS is likely to have a profound
impact on the surveillance of foodborne bacterial pathogens. However, it is
currently unclear exactly how WGS will be used to monitor trends and detect
clusters of foodborne disease.
TABLE A2.1. Summary of the laboratory methods currently used for further
characterization of the main bacterial foodborne pathogens
Pathogen
Spec
iatio
n
Sero
var/
sero
type
Phag
e ty
pe
MLV
A
MLS
T
PFGE
Who
le g
enom
e se
quen
cing Comments
Salmonella Non Typhoid/paratyphoid
x x x x x x There are over 2500 serotypes of Salmonella. Antigenic testing using the White-Kauffmann-LeMinor scheme (Grimont & Weill, 2007) has been the international standard for Salmonella typing. Some countries have moved to PFGE and MLVA for cluster detection of some Salmonella serovars. WGS is being used for further characterization in outbreaks. Recent work by Achtman et al. (2012) suggests MLST could replace serotyping for Salmonella enterica.

Stage two
129
PathogenSp
ecia
tion
Sero
var/
sero
type
Phag
e ty
pe
MLV
A
MLS
T
PFGE
Who
le g
enom
e se
quen
cing Comments
SalmonellaTyphoid/paratyphoid fever
x x x x These serotypes, strictly adapted to humans, are homogenous populations. PFGE is limited for outbreak discrimination, MLVA schemes have not been validated yet.
Campylobacter x x Generally Campylobacter is ubiquitous and further typing is expensive. For routine surveillance, identification of Campylobacter is sufficient. However, speciation and further typing using MLST can be used for source attribution studies or for assessing genetic relatedness in an outbreak.
Shiga-toxin-producing E.coli (STEC)
x x x x x The most important laboratory test for the diagnosis of STEC is the detection of the Shiga-toxin-producing genes by PCR, regardless of the serotype. For routine surveillance, identification at the serotype level is sufficient for cluster detection. In an outbreak situation further typing is needed, e.g. MLVA, PFGE, MLST, WGS.
Shigella x x x There are four species of Shigella, three of which are made up of multiple serotypes. For routine surveillance, identification at the serotype level is sufficient for cluster detection. MLVA could be used in outbreak situations, in particular S. sonnei (Chiou et al., 2013). Shigella and Escherichia coli are closely related genetically.
Listeria x x x x x Generally one case of L. monocytogenes triggers a public health response. Further typing is required for cluster detection and outbreak investigation. All isolates should be further characterized.
Yersinia x x Identification of Y. enterocolitica and Y. pseudotuberculosis is required. Many biotypes of Y. enterocolitica are non-pathogenic, so further typing is generally required.
(TABLE A2.1. Continue)

Stage two
130
(TABLE A2.1. Continue)
PathogenSp
ecia
tion
Sero
var/
sero
type
Phag
e ty
pe
MLV
A
MLS
T
PFGE
Who
le g
enom
e se
quen
cing Comments
Vibrio cholerae x x x x Two main serogroups of V. cholerae, O1 and O139, cause epidemic cholera. Serogroup O1 has three serotypes (Ogawa, Inaba and Hikojima) and two biotypes (classical and El Tor). PFGE is the gold standard method for outbreak typing. Several MLVA schemes have been established.
Other Vibrio spp. (e.g. V. parahaemolyticus)
x x

131
Mapping laboratory capacities for further
characterization
Annex 3.

Stage two
132
Table A3.1 provides an example of a template that can be used to map out the
laboratory capacities for further characterization in stage 2. The template should
be completed for each pathogen under surveillance, with specification of the
typing methods available in the country and the laboratories that can perform
the testing. Examples are presented in the template in italics.
TABLE A3.1. Template for mapping laboratory capacities in a country
PathogenFurther characterization method
Laboratories performing the tests
Routine surveillance Outbreaks
Salmonella Serovar Laboratory X, Y, Z As for routine surveillance
Phage typing Laboratory Y, Z
MLVA Laboratory Z
PFGE Laboratory X, Z
WGS Laboratory Z
Shiga-toxin-producing E.coli
Serotyping using PCR Laboratory X, Y, Z As for routine surveillance
Serotyping using antigen testing
Laboratory Z
MLVA Laboratory Z
WGS Laboratory Z
Campylobacter Species Laboratory X, Y As for routine surveillance
MLST Laboratory X
Listeria Species Laboratory Y, Z As for routine surveillance
Serogroup Laboratory Y, Z
MLVA Laboratory Z
PFGE Laboratory Z
WGS Laboratory Z
....

133
Minimum data requirements for
notifiable disease surveillance in
stage 2
Annex 4.

Stage two
134
When the notifiable disease surveillance system shifts from recording aggregated
data on syndromes to individual data on laboratory-confirmed diseases, the
surveillance database will need to be amended. Table A4.1 shows the minimum
data set that would be required for foodborne diseases in stage 2.
TABLE A4.1. Minimum data set required for foodborne diseases collected as part of a notifiable disease surveillance system
Data variable Data format Description of data variable
Name Text Surname and first name
Date of birth Date
Sex Categorical
Residential address Text Important for case follow-up, investigation and descriptive epidemiology. Should include all the relevant information to identify the geographical location of the home. This is especially important if the information will be mapped
Phone number(s) Text Important for case follow-up
Ethnicity Categorical May be limited to vulnerable subpopulations
Disease Categorical Disease reported
Date of symptom onset Date Date first symptom began; important for identifying period of exposure
Date of report Date Date reported by doctor or laboratory
Date of specimen collection
Date Date specimen was collected
Pathogen/chemical/agent Categorical Specific details about the pathogen, chemical or agent causing disease, including typing information. This may be split over 2 or 3 data fields and may require associated date fields for each typing result.
Died Categorical Patient died following foodborne illness
Date of death Date Date patient died

Stage two
135
Data variable Data format Description of data variable
Place of acquisition Categorical Record if patient was likely to have acquired the illness locally or while travelling. An additional field may be included to capture country of acquisition for disease acquired outside of the country.
Notifier details Text Name and contact details of notifier for follow-up of case details
Exposure information Text Information from clinical notes that may indicate the likely source of the infection
(TABLE A4.1. Continue)

136
An example of a data dictionary for the notifiable disease
surveillance database
Annex 5.

Stage two
137
The data dictionary lists each field in the notifiable disease surveillance database,
together with a description of the format of the data, the options for categorical
fields and a description of the data rules that may apply.
The example shown in table A5.1 uses a selection of the minimum data
requirements specified in Annex 4.
TABLE A5.1. An example of a data dictionary for the notifiable disease surveillance database
NameDescription of data variable
This field contains the first name and surname of the patient.
Format of the data Text
Specifications for the data
Free text field (100 characters maximum)
Data rules This field is mandatory.Often the name (and date of birth) is checked in the system before a new record is created, to ensure that there is no duplication of episodes of illness in the database. A name is also required in case the patient needs to be interviewed as part of an investigation.
Date of birthDescription of data variable
This field contains the date of birth of the patient.
Format of the data Date
Specifications for the data
DD/MM/YYYY
Data rules This field is mandatory and only one date is permitted.Often the date of birth (and name) is checked on the system before a new record is created, to ensure that there is no duplication of episodes of illness in the database.

Stage two
138
SexDescription of data variable
This field describes the sex of the patient.
Format of the data Categorical
Specifications for the data
1 = Male2 = Female3 = Unknown to the notifier999 = Not stated by the notifier
Data rules This field is mandatory and only one category is permitted.
Residential addressDescription of data variable
This field contains the residential address of the patient.
Format of the data Text
Specifications for the data
Free text field (200 characters maximum)[Note: This may be one field, or multiple fields, depending on how addresses are recorded in the country]
Data rules This field is mandatory, as location can be used to identify clustering in place and may also be required if patients are interviewed face to face as part of an investigation.
Pathogen/chemical/agent (level 1)Description of data variable
This field contains the agent identified in the clinical specimen collected from the patient
Format of the data Categorical
Specifications for the data
1 = Disease 1 (e.g. Salmonella)2 = Disease 2 (e.g. Shiga-toxin producing E.coli)3 = ...[continue the list until all notifiable conditions are included]
Data rules This field is mandatory.
Pathogen/chemical/agent (level 2)Description of data variable
This field contains further characterization information about the agent identified in the clinical specimen collected from the patient
Format of the data Categorical
Specifications for the data
1 = further typing 1 (e.g. Typhimurium, for Salmonella)2 = further typing 2 (e.g. Enteritidis, for Salmonella)3 = further typing 3 (e.g. O157, for STEC)4= ...[continue the list until all further typing options for notifiable conditions are included]
(TABLE A5.1. Continue)

Stage two
139
Data rules This field is mandatory.
Date of birthDescription of data variable
This field identifies where the illness was acquired
Format of the data Categorical
Specifications for the data
1 = Country 12 = Country 23 = ... [continue the list until all countries have been listed. Some countries have their own classification of countries e.g. Standard Australian Classification of Countries (SACC) http://www.abs.gov.au/ausstats/[email protected]/0/C8B8914F6C683351CA25744D00818CED?opendocument. Alternatively, there is a list of United Nations Member States http://www.un.org/en/members/, which may be a useful starting-point]888 = Unknown place of acquisition999 = Place of acquisition was not stated in notification
Data rules This field is mandatory. Ensure that your own country is listed as the default field.
(TABLE A5.1. Continue)

140
An example of a surveillance log
Annex 6.
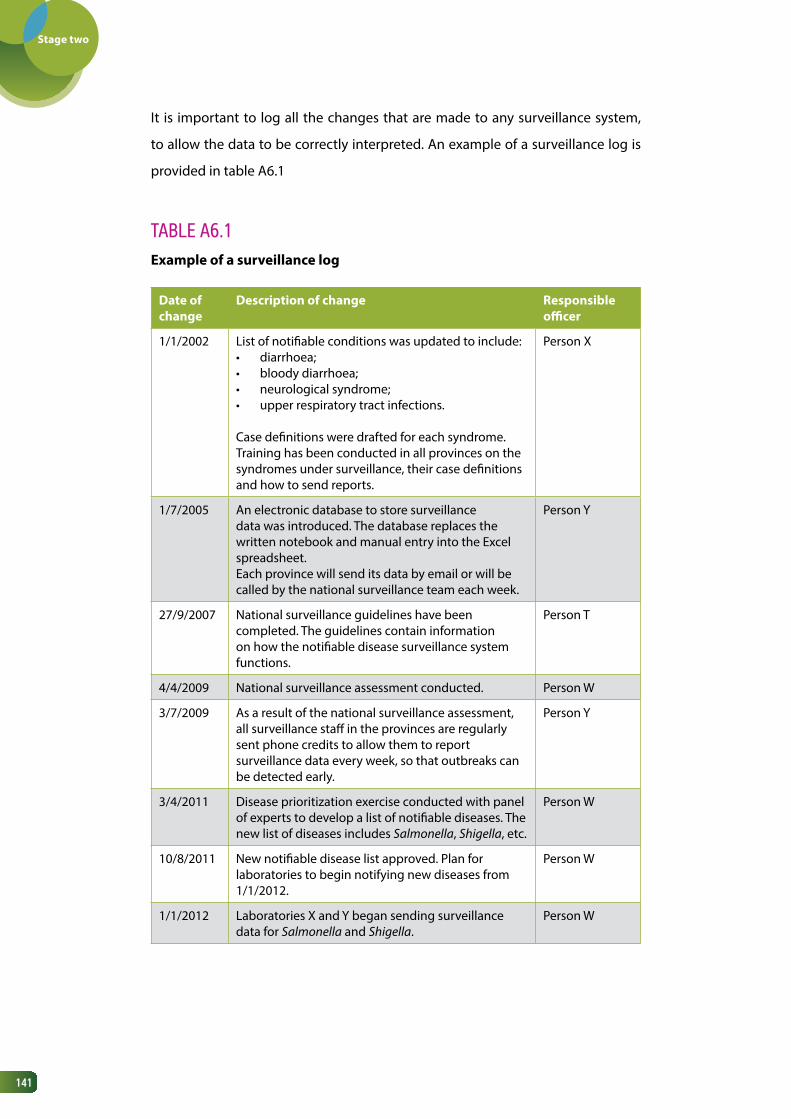
Stage two
141
It is important to log all the changes that are made to any surveillance system,
to allow the data to be correctly interpreted. An example of a surveillance log is
provided in table A6.1
TABLE A6.1 Example of a surveillance log
Date of change
Description of change Responsible officer
1/1/2002 List of notifiable conditions was updated to include:• diarrhoea;• bloody diarrhoea;• neurological syndrome;• upper respiratory tract infections.
Case definitions were drafted for each syndrome. Training has been conducted in all provinces on the syndromes under surveillance, their case definitions and how to send reports.
Person X
1/7/2005 An electronic database to store surveillance data was introduced. The database replaces the written notebook and manual entry into the Excel spreadsheet.Each province will send its data by email or will be called by the national surveillance team each week.
Person Y
27/9/2007 National surveillance guidelines have been completed. The guidelines contain information on how the notifiable disease surveillance system functions.
Person T
4/4/2009 National surveillance assessment conducted. Person W
3/7/2009 As a result of the national surveillance assessment, all surveillance staff in the provinces are regularly sent phone credits to allow them to report surveillance data every week, so that outbreaks can be detected early.
Person Y
3/4/2011 Disease prioritization exercise conducted with panel of experts to develop a list of notifiable diseases. The new list of diseases includes Salmonella, Shigella, etc.
Person W
10/8/2011 New notifiable disease list approved. Plan for laboratories to begin notifying new diseases from 1/1/2012.
Person W
1/1/2012 Laboratories X and Y began sending surveillance data for Salmonella and Shigella.
Person W

142
Information sources for rapid risk assessment of
a foodborne event
Annex 7.

Stage two
143
Various sources of information can be used in the assessment of hazard, exposure
and context of a foodborne disease events. The table below presents some of
these information sources, using an event related to Vibrio parahaemolyticus as an
example. It is unlikely that all of this information will be available.
Event description: a reference laboratory in country X has confirmed two samples
of V. parahaemolyticus. At the same time there are reports of clusters of cases of
acute diarrhoea in three communities in different parts of the country.
BackgroundV. parahaemolyticus is a bacterium that naturally inhabits marine environments. Infections in humans occur when people eat contaminated seafood that is raw or undercooked. The main clinical signs of V. parahaemolyticus infection are diarrhoea, which is sometimes bloody, abdominal pain, nausea and vomiting. The incubation period is approximately 12–24 hours and symptoms usually last for 1–7 days (Heymann, 2008; Nair et al., 2007).
Characteristic being assessed Information sources
Hazard
Bacterial factors Serotypes involved
• Laboratory information: any recent research studies on V. parahaemolyticus undertaken in the country.
• Published literature from other countries about distribution of serotypes.
Clinical factors Clinical presentation
• Data from hospital-based IBS for acute diarrhoea: number of cases.
• Data from laboratories about V. parahaemolyticus in humans.
Severity Data from hospital-based IBS for acute diarrhoea: number of deaths.
Exposure
Agent Previous outbreaks
Published literature from other countries: outbreak settings, serotypes responsible, food vehicles thought to be responsible for outbreaks
Food monitoring
Data from food monitoring programmes, of both local food and food for export
Host Epidemiology of the infection in humans
• Published research, including cross-sectional studies and outbreak investigations
• Surveillance reports from other countries providing information about the demographics (e.g. age, sex, socioeconomic status) of people infected with V. parahaemolyticus.
• Data from hospital-based IBS for acute diarrhoea

Stage two
144
Characteristic being assessed Information sources
Distribution of seafood sources
• Published research or programmes focused on V. parahaemolyticus in seafood, e.g. types of seafood infected (shellfish, octopus, prawns, etc.)
• Data from the agricultural sector about the origin of the seafood
Context
Socioeconomic factors
Food sources Agriculture or commerce reports about how much the suspected food items cost and how much is consumed annually
Size of the population at risk
• Vital statistics, including distribution of socioeconomic status
• Food consumption studies (frequency of consumption) for certain seafood items
Human behaviour
• Surveys on health-care-seeking behaviour for those with acute diarrhoea
• Knowledge, attitudes and practices surveys on the preparation of seafood
• Anthropological studies about the cultural importance of food choices and how foods are consumed (e.g. raw or cooked)
Ecological factors
Climate Meteorological data (rainfall, temperature, humidity)
Production Data from the Department of Agriculture on how seafood is produced (e.g. wild caught or farmed) and harvested
Programme factors
Strength of the health system
• National health indicator data• Annual reports or programme evaluation
reports• Reports from debriefings of previous
events
Adapted from WHO, 2012.

145
Example of a communication
mechanism
Annex 8.

Stage two
146
As multisectoral collaboration becomes stronger in stage 2, it may be necessary
to establish a communication mechanism to ensure that there is a clear process
that describes what information will be shared amongst the key stakeholders
in foodborne diseases and under what circumstances.. It is important that the
agreed process is written down. Table A8.1. provides an example of how the
process can be documented. It will be necessary for the different stakeholders to
work together to agree on the actions described in table A8.1. The process should
be reviewed annually to ensure the information is accurate and the actions
appropriate.
TABLE A8.1. Information from surveillance and response sector to food safety sector
What will be communicated?
Who will receive the information?
Purpose of the information
Frequency of communication
Method of communication
Notes
Acute events
Report of suspected foodborne outbreak
Food safety manager
To inform the manager that an investigation has started
Within 24 hours of receipt of report
Routine communications
Annual report on foodborne diseases
Food safety team
To inform the food safety team about the notifications of foodborne diseases and provide a summary of key foodborne outbreaks investigated
Each year on completion of the report
Email and presentation

Stage two
147
What will be communicated?
Who will receive the information?
Purpose of the information
Frequency of communication
Method of communication
Notes
Acute events
Food item contaminated with Salmonella
Surveillance and response manager
To inform the manager that a food item is contaminated with Salmonella
Within 24 hours of receipt of report
Routine communications
Annual report on food safety
Surveillance and response team
To provide information about food safety
On completion of the report
Email and presentation
Information from food safety sector to surveillance and response sector

148
Examples of monitoring indicators for
foodborne diseases
Annex 9

Stage two
149
Table A9.1 suggests some indicators for ongoing monitoring of each component
of the surveillance and response system for foodborne diseases in stage 2.
TABLE A9.1. Indicators for ongoing monitoring of the surveillance and response system for foodborne diseases in stage 2
Component Proposed indicator Numerator Denominator
IBS Time between obtaining laboratory result and reporting to the notifiable disease surveillance system
N/A N/A
Proportion of pathogens adequately characterized to allow cluster detection
Number of cases reported for which pathogens have been further typed
Total number of cases reported for pathogens that are able to be further typed
Completeness of the core data fields (specified in minimum data requirements)
The number of valid entries that adhere to the data specifications for the data field
Total number of entries for the data field
Number of surveillance bulletins produced each year
N/A N/A
EBS Proportion of reports from outside the health system
Number of event reports from outside the health system
Total number of events reported
Rapid risk assessment
Proportion of subnational sites that are able to conduct rapid risk assessments
Number of subnational sites that are able to conduct rapid risk assessments
Total number of subnational sites
Response Average length of time for case interviews
N/A N/A
Number of subnational sites that have performed analytical epidemiological studies (e.g. case–control and cohort studies)
N/A N/A
Proportion of investigations for which a debriefing was conducted
Number of foodborne event investigations for which a debriefing was conducted
Total number of foodborne events investigated
Multisectoral collaboration
Number of times coordinating body meets to discuss foodborne disease issues
N/A N/A
N/A = not applicable

150
Managing implementation
in stage 2
Annex 10.

Stage two
151
The template below summarizes the capacities to be strengthened in a surveillance
and response system for foodborne diseases in stage 2. This template can be
completed to provide an overview of the current situation and help identify the
priority capacities for strengthening.
1. Many of the rows in the template correspond to a point in one of the
decision-trees in this module. Refer to the relevant decision-tree and
accompanying text for more explanation. Some components of the
surveillance and response system in stage 2, however, are not reflected in
the decision-trees, e.g. rapid risk assessment, response, ad hoc studies and
monitoring and evaluation. The general capacities required to strengthen
these components, which are described in the text of the relevant sections,
are also included in the template.
2. For each capacity, note whether it currently exists in the country. If the
answer is “yes”, move on to the next row.
3. If the capacity does not exist, determine the level of priority for
strengthening using the following criteria:
• impact: the impact of the activity on the surveillance and response
system for foodborne diseases; score as high (3), medium (2) or low (1)
impact;
• resources: the resources (e.g. financial and human) required for
implementation of the activity; score as few (3) , medium (2) or many
(1) resources;
• ease of implementation: the ease with which the activity can be
implemented; consider political and organizational acceptability,
approval processes, access to technical skills, organizational changes
required, access to required resources: score as easy (3), neutral (2) or
difficult (1);
• priority: sum the scores for impact, resources and ease of implementation,
to assign a priority to the capacity-building activity. This scoring system
2.
1.
3.

Stage two
152
will mainly be useful for identifying easily achievable capacities over
a 1–2 year period. It is important that longer-term capacity building,
which will have a lower score, is also reflected in the workplan,
to help plan for future strengthening activities, such as building
epidemiological capacity for outbreak investigations.
4. Define the actions that will be taken to meet the capacity.
5. Set a timeframe for implementation. Aim to identify actions that can be
taken within a 12-month period.
6. Assign an officer to be responsible for each implementation activity.
4.
5.
6.
CapacitiesCapacity
exists (yes/no)
Priority for implementationa
Actions Timeframe Person responsible
Impa
ct
Reso
urce
s
Ease
of
impl
emen
tatio
nn
Prio
rity
Indicator-based surveillance: strengthening the role of the laboratory
Priority foodborne diseases have been identified for surveillance
Clinical specimens are being routinely collected from patients according to the specimen collection protocol
The specimen collection protocol documents:• objectives of
surveillance, • which specimens will be
collected, • when the specimens will
be collected, • how they will be
collected, • how they will be
transported • the laboratories
where testing can be performed

Stage two
153
CapacitiesCapacity
exists (yes/no)
Priority for implementationa
Actions Timeframe Person responsible
Impa
ct
Reso
urce
s
Ease
of
impl
emen
tatio
nn
Prio
rity
Clinical specimens are being tested according to the laboratory testing protocol
The laboratory testing protocol for clinical specimens documents:• how laboratory testing is
organized• instructions for further
characterization of priority foodborne pathogens
• instructions for antimicrobial susceptibility testing
A database houses laboratory-based surveillance data, with a data dictionary to support its operation
A surveillance log is available to document changes in the laboratory-based surveillance system
Laboratory results are routinely sent to the surveillance system according to the data reporting protocol
The data reporting protocol includes:• who will send data to
the surveillance system• what data will be sent• how often the data
should be sent• actions that will be
taken based on the information sent to the surveillance system

Stage two
154
CapacitiesCapacity
exists (yes/no)
Priority for implementationa
Actions Timeframe Person responsible
Impa
ct
Reso
urce
s
Ease
of
impl
emen
tatio
nn
Prio
rity
Antimicrobial susceptibility testing is being performed on priority foodborne pathogens
Laboratory methods and reporting nomenclature are consistent across laboratories so that results can be compared nationally
Relevant sequencing information is being shared internationally for priority foodborne pathogens
Indicator-based surveillance: strengthening notifiable disease surveillance
Priority foodborne diseases have been identified for notifiable disease surveillance
Existing laws and decrees for the process of notification are up to date and include priority foodborne diseases
Case definitions exist for all notifiable diseases under surveillance
There are notification forms and a clear mechanism for reporting to the surveillance system
Laboratories and health care workers are aware of their obligations to report notifiable diseases
There is a notifiable disease surveillance system database capable of storing data on individuals

Stage two
155
CapacitiesCapacity
exists (yes/no)
Priority for implementationa
Actions Timeframe Person responsible
Impa
ct
Reso
urce
s
Ease
of
impl
emen
tatio
nn
Prio
rity
A data dictionary exists to support the operation of the surveillance database
There is a surveillance log to document changes to the surveillance system
There are disease-specific surveillance logs (once laboratory-confirmed pathogens become nationally notifiable)
Surveillance data are analysed regularly
Surveillance data are reported in a surveillance bulletin
Cluster detection methods are applied to surveillance data
Surveillance protocols document the processes in the surveillance system
Event-based surveillance
There is a 24-hour telephone number, fax or email to receive reports at the national level
Reporters outside of the health system have been identified and trained to recognize and report foodborne events
Active scanning of the media for foodborne events

Stage two
156
CapacitiesCapacity
exists (yes/no)
Priority for implementationa
Actions Timeframe Person responsible
Impa
ct
Reso
urce
s
Ease
of
impl
emen
tatio
nn
Prio
rity
Rapid risk assessment of foodborne events
Staff have been designated at subnational level who can conduct rapid risk assessments
The staff have been trained on how to conduct rapid risk assessments using foodborne events as examples
A mechanism is in place to offer technical support and advice from the national level to the subnational level, when required
Laboratory data are used in rapid risk assessments of foodborne events
Response
There are disease-specific questionnaires for priority foodborne pathogens
Analytical epidemiological studies are conducted at national and subnational levels
Representatives from food safety and laboratories are routinely part of outbreak response teams
There are training opportunities in analytical epidemiology in the country
Ad hoc research studies
A mechanism exists for discussing, agreeing, planning and undertaking ad hoc research studies

Stage two
157
CapacitiesCapacity
exists (yes/no)
Priority for implementationa
Actions Timeframe Person responsible
Impa
ct
Reso
urce
s
Ease
of
impl
emen
tatio
nn
Prio
rity
Multisectoral collaboration
There is a communication mechanism between food safety stakeholders, which documents:• what information is to
be shared• when the information is
shared• who needs to know the
information• how the information will
be shared
There is multisectoral involvement in risk profiling of food safety problems
Monitoring and evaluation
Monitoring indicators have been adjusted to include:• laboratory confirmed
foodborne diseases for IBS;
• increase sensitivity and specificity of EBS;
• subnational capacity for rapid risk assessment and response;
• increased multisectoral collaboration.
The surveillance and response system has been evaluated in the past 5-10 years
a Priority is the sum of the scores for impact, resources and ease of implementation. This priority score should only be used as a guide to help identify easily achievable capacities, but long-term capacity building, which usually has a low score, should also be reflected in this work plan.

158
References

Stage two
159
• Achtman M et al. (2012) Multilocus sequence typing as a replacement for serotyping in Salmonella enterica. PLOS Pathogens. 8(6) (http://journals.plos.org/plospathogens/article?id=10.1371/journal.ppat.1002776; accessed 4 June 2015).
• Bhan M et al. (1989) Descriptive epidemiology of persistent diarrhoea among young children in rural northern India. Bull World Health Organ. 67(3):281-8.
• Byrne L et al. (2014) A multi-country outbreak of Salmonella Newport gastroenteritis in Europe associated with watermelon from Brazil, confirmed by whole genome sequencing: October 2011 to January 2012. Eurosurveillance. 19(31) (http://www.eurosurveillance.org/ViewArticle.aspx?ArticleId=20866; accessed 2 June 2015).
• Centers for Disease Control and Prevention (2001) Updated guidelines for evaluating public health surveillance systems: recommendations from the guidelines working group. MMWR. 50 (RR-13) (http://www.cdc.gov/mmwr/preview/mmwrhtml/rr5013a1.htm; accessed 6 August 2014).
• Chiou CS et al. (2013) A simple approach to obtain comparable Shigella sonnei MLVA results across laboratories. Int J Med Microbiol. 303(8): 678-84.
• ECDC (2011) Operational guidance on rapid risk assessment methodology. Stockholm: European Centre for Disease Prevention and Control (http://ecdc.europa.eu/en/publications/Publications/1108_TED_Risk_Assessment_Methodology_Guidance.pdf; accessed 14 February 2016).
• EFSA, FAO, WHO (2011) Towards a harmonised total diet study approach: a guidance document. EFSA Journal. 9(11): 2450. doi:10.2903/j.efsa.2011.2450 (http://www.efsa.europa.eu/en/efsajournal/doc/2450.pdf; accessed 27 June 2015).
• EFSA (2008) Scientific opinion of the Panel on Biological Hazards on a request from EFSA on overview of methods for source attribution for human illness from food borne microbiological hazards. The EFSA Journal. 764: 1- 43 (http://www.efsa.europa.eu/en/scdocs/doc/764.pdf; accessed 9 April 2015).
• FAO, WHO (2006) Food safety risk analysis: a guide for national food safety authorities. Food and Nutrition Paper No. 87. Rome, Food and Agriculture Organization of the United Nations (http://www.who.int/foodsafety/publications/micro/riskanalysis06.pdf; accessed 10 April 2015).
• Frean J et al. (2012) External quality assessment of national public health laboratories in Africa, 2002–2009. Bull World Health Organ; 90:191–199A.
• Fullerton K et al. (2012) Case-control studies of sporadic enteric infections: a review and discussion of studies conducted internationally from 1990 to 2009. Foodborne Pathogens and Disease. 9(4): 281-292.

Stage two
160
• Gilsdorf A, Krause G (2011) Prioritisation of infectious diseases in public health: feedback on the prioritisation methodology, 15 July 2008 to 15 January 2009. Eurosurveillance. 16(18) (http://www.eurosurveillance.org/ViewArticle.aspx?ArticleId=19861; accessed 10 August 2014).
• Grimont PAD, Weill FX (2007) Antigenic formulae of the Salmonella serovars. 9th ed. Paris: World Health Organization Collaborating Centre for Reference and Research on Salmonella, Institut Pasteur (http://www.pasteur.fr/ip/portal/action/WebdriveActionEvent/oid/01s-000036-089; accessed 3 April 2015).
• Hendriksen R et al. (2014) The external quality assurance system of the WHO Global Foodborne Infections Network. Soborg, National Food Institute, Technical University of Denmark (www.who.int/foodsafety/who_2013_fullreportisbn.pdf?ua=1; accessed 3 June 2015).
• Heymann D, ed. (2008) Control of communicable diseases manual, 19th edition. Washington, DC: American Public Health Association.
• Hutwagner L et al. (1997) Using laboratory-based surveillance data for prevention: an algorithm for detecting Salmonella outbreaks. Emerging Infectious Diseases. 3(3): 395-400.
• INPPAZ, PAHO, WHO (2001) GuiaVETA: guidelines of surveillance system for foodborne diseases and investigation of outbreaks (http://epi.minsal.cl/epi/html/software/guias/VETA/I/homepage.htm; accessed 10 August 2014).
• Jones D et al. (2014) Multisite evaluation of field epidemiology training programs: findings and recommendations. Atlanta, GA: Centers for Disease Control and Prevention (http://www.cdc.gov/globalhealth/fetp/pdf/fetp_evaluation_report_may_2014.pdf; accessed 8 April 2015).
• Ke B et al. (2014) Serovar distribution, antimicrobial resistance profiles and PFGE typing of Salmonella enteric strains isolated from 2007-2012 in Guangdong, China. BMC Infectious Diseases. 14: 338 (http://www.biomedcentral.com/1471-2334/14/338; accessed 25 February 2015).
• Kimura A et al. (2004) Chicken consumption is a newly identified risk factor for sporadic Salmonella enterica serotype Enteritidis infections in the United States: a case-control study in FoodNet Sites. Clinical Infectious Diseases. 38(Suppl 3): S244–52.
• Kinross P et al. (2014) Multidisciplinary investigation of a multicountry outbreak of Salmonella Stanley infections associated with turkey meat in the European Union, August 2011 to January 2013, Eurosurveillance. 19(19) (http://www.eurosurveillance.org/ViewArticle.aspx?ArticleId=20801; accessed 3 April 2015).
Stage two
161
• Krause G (2008) Prioritisation of infectious diseases in public health – call for comments. Eurosurveillance. 13(40) (http://www.eurosurveillance.org/ViewArticle.aspx?ArticleId=18996; accessed 10 August 2014).
• Lopez A, Caceres V (2008) Central America Field Epidemiology Training Program (CA FETP): a pathway to sustainable public health capacity development. Human Resources for Health. 6:27 (http://www.human-resources-health.com/content/6/1/27; accessed 8 April 2015).
• Nair G et al. (2007) Global dissemination of Vibrio parahaemolyticus serotype O3:K6 and its serovariants. Clinical Microbiology Reviews. 20(1): 39-48.
• Pavlin B et al. (2010) A standardised process for developing a national notifiable diseases list in a Pacific Island setting. Asia-Pacific Journal of Public Health. 22(3): 279-288.
• Pires S et al. (2009) Attributing the human disease burden of foodborne infections to specific sources. Foodborne Pathogens and Disease. 6(4): 417-424.
• Pires S et al. (2012) Attributing human foodborne illness to food sources and water in Latin American and the Caribbean using data from outbreak investigations. Int J Food Microbiol. 152(3): 129-138.
• Robertson C et al. (2010) Review of methods for space-time disease surveillance. Spatial and Spatio-temporal Epidemology. 1: 105-116.
• Sauders B et al. (2003) Molecular subtyping to detect human listeriosis clusters. Emerging Infectious Diseases. 9(6): 672-680.
• Sheppard S et al. (2009) Campylobacter genotyping to determine the source of human infection. Clinical Infectious Diseases. 48:1072–8.
• Stafford R et al. (2008) Population-attributable risk estimates for risk factors associated with Campylobacter infection, Australia. Emerging Infectious Diseases. 14:895–901.
• Swaminathan B et al. (2006) Building PulseNet International: an interconnected system of laboratory networks to facilitate timely public health recognition and response to foodborne disease outbreaks and emerging foodborne diseases. Foodborne Pathogens and Disease. 3(1): 36-50.
• Thomas M et al. (2010) Burden of acute gastrointestinal illness in Galvez, Argentina, 2007. J Health Popul Nutr. 28(2): 149-158.
• WHO (1999a) Requirements and guidance for external quality assessment schemes for health laboratories. Geneva: World Health Organization (http://whqlibdoc.who.int/hq/1999/WHO_DIL_LAB_99.2.pdf; accessed 31 August 2014).

Stage two
162
• WHO (1999b) Recommended surveillance standards, 2nd ed, WHO/CDS/CSR/ISR/99/2/EN. Geneva: World Health Organization (http://www.who.int/csr/resources/publications/surveillance/WHO_CDS_CSR_ISR_99_2_EN/en/; accessed 7 August 2014).
• WHO (2003) Manual for the laboratory identification and antimicrobial susceptibility testing of bacterial pathogens of public health concern in the developing world. Geneva: World Health Organization (http://www.who.int/csr/resources/publications/drugresist/WHO_CDS_CSR_RMD_2003_6/en/; accessed 3 June 2015).
• WHO (2006a) Communicable disease surveillance and response systems: guide to monitoring and evaluating. WHO/CDS/EPR/LYO/2006.2. Geneva: World Health Organization (http://www.who.int/csr/resources/publications/surveillance/WHO_CDS_EPR_LYO_2006_2.pdf; accessed 4 March 2014).
• WHO (2006b) Setting priorities in communicable disease surveillance. Geneva: World Health Organization (http://www.who.int/csr/resources/publications/surveillance/WHO_CDS_EPR_LYO_2006_3/en/; accessed 6 September 2014).
• WHO (2008a) Foodborne disease outbreaks: guidelines for investigation and control. Geneva: World Health Organization (http://www.who.int/foodsafety/publications/foodborne_disease/outbreak_guidelines.pdf; accessed 6 September 2014).
• WHO (2008b) A guide to establishing event-based surveillance. Manila, WHO Regional Office for the Western Pacific (http://www.wpro.who.int/emerging_diseases/documents/docs/eventbasedsurv.pdf; accessed 6 September 2014).
• WHO (2009) Principles and methods for the risk assessment of chemicals in food. Environmental Health Criteria 240. Geneva: World Health Organization (http://whqlibdoc.who.int/ehc/WHO_EHC_240_9_eng_Chapter6.pdf; accessed 10 August 2014).
• WHO (2011) Laboratory quality management system: handbook. Geneva: World Health Organization (http://www.who.int/ihr/publications/lqms/en/index.html; accessed 6 September 2014).
• WHO (2012) Rapid risk assessment of acute public health events, WHO/HSE/GAR/ARO/2012.1. Geneva: World Health Organization (http://whqlibdoc.who.int/hq/2012/WHO_HSE_GAR_ARO_2012.1_eng.pdf?ua=1; accessed 6 September 2014).
• WHO (2014) Early detection, assessment and response to acute public health events: implementation of early warning and response with a focus on event-based surveillance. Interim version. WHO/HSE/GCR/LYO/2014.4. Geneva: World Health Organization (http://www.who.int/ihr/publications/WHO_HSE_GCR_LYO_2014.4/en/; accessed 7 September 2014).

Stage two
163
• WHO (2015) WHO estimates of the global burden of foodborne diseases. Foodbornedisease burden epidemiology reference group 2007-2015. Geneva, World HealthOrganization (http://www.who.int/foodsafety/areas_work/foodborne-diseases/ferg/en/; accessed 20 February 2016).
• WHO, CDC (2008) Guide for national public health laboratory networking to strengthenintegrated disease surveillance and response. Test version 1.0. Brazzaville, WHORegional Office for Africa (http://www.afro.who.int/en/clusters-a-programmes/dpc/integrated-disease-surveillance/ids-publications.html; accessed 4 April 2015).
• WHO, FAO, OIE (2008) Zoonotic diseases: a guide to establishing collaboration betweenanimal and human health sectors at the country level. World Health Organization(http://www.oie.int/doc/ged/D12060.PDF; accessed 6 September 2014).
• Zaidi M et al. (2008) Integrated food chain surveillance system for Salmonella spp. inMexico. Emerging Infectious Diseases. 14(3): 429-435.


ISBN 978 924 1 51325 8