stress in the workplace: the phenomenon, some key
TRANSCRIPT
STRESS IN THE WORKPLACE: THE PHENOMENON, SOME KEY CORRELATES
AND PROBLEM SOLVING APPROACHES
by
FERGUS RURIC VOGEL
Submitted in partial fulfilment of the
requirements for the degree of
Philosophiae Doctor
in the Faculty of Humanities, University of Pretoria
MAY 2006

ii
This thesis is dedicated to my son Ruric Colm
who amazes me every day with his joy and love of life
The real voyage of discovery consists not in seeking new lands but seeking with new eyes.
Marcel Proust
iii
ACKNOWLEDGEMENTS I wish to express my sincere appreciation to the following people for their contribution to this study:
• Prof R P de la Rey, my promoter, for his guidance, valued suggestions, and encouragement
throughout the study.
• Dr Mike van der Linde of the Department of Statistics for processing the data.
• Dr Susan Nel for her liaison with a number of the organizations.
• My lovely wife Salomé for her consistent support and belief in me throughout the study.
• Lourett Visser for being very helpful and supportive at different stages in the completion of
the thesis.
• Mrs Ria Holman for much appreciated e-mail support during my stay in Antwerp, Belgium.
• The respondents who voluntarily completed the questionnaires.

iv
SUMMARY
Stress in the workplace: the phenomenon, some key correlates
and problem solving approaches
by
Student: Fergus Ruric Vogel
Supervisor: Prof RP de la Rey
Departement: Psychology
Degree: Philosophiae Doctor
In this study the researcher set out to determine the levels and the causes of workplace stress, as
well as the consequences of stress in terms of witnessed and experienced aggression in the
workplace, anxiety, depression, and worry for a sample of 205 subjects. To achieve this, the
following tests were used: 1) Experience of Work and Life Circumstances Questionnaire, 2) the
Aggression in the Workplace Questionnaire, 3) the IPAT Anxiety Scale, 4) the Beck Depression
Inventory, and 5) the Penn State Worry Questionnaire. The subjects’ ability to cope with
experienced stressors in relation to social problem solving was examined with the Social Problem-
Solving Inventory-Revised. The raw data were analysed by means of the usual descriptive
statistics. In addition, inferential statistics including z-tests, t-tests, analysis of variance and post-
hoc analyses (Scheffé) were conducted for the following groups: total group, gender, marital status,
age, organizational type, qualification and position level.
Results indicate that most of the subjects in the sample experienced normal levels of stress,
indicating that the participants generally experienced their circumstances within or outside the
workplace as satisfactory. Generally, the results also indicated that their expectations regarding
their work situation were met. With reference to the consequences of stress, the total sample
reported low levels of witnessing and experiencing workplace aggression, normal levels of anxiety,
low levels of depression and worry. Good overall social problem solving suggests the ability to cope
with demands and stressors within and outside the workplace. Generally, Pearson correlations
indicated significant relationships between a) levels of stress as experienced by subjects and b)
witnessed and experienced workplace aggression, c) anxiety, d) depression, e) worry and f) social
problem solving.
v
That most of the subjects in this sample were able to deal effectively with the demands and
stressors placed on them, from within and outside the workplace suggests the ability to use
effective problem-focused coping involving social problem solving which for most participants, was
due to a positive problem orientation and effective rational problem solving skills. These findings
may be useful as part of a stress management programme to help employees deal with stress
proactively by becoming more effective problem-solvers. In terms of a salutogenic paradigm, and
consistent with recent developments in positive psychology, the findings indicate that more
attention should be paid to possible reasons why some employees appear to cope with stress more
effectively than others.
Key terms: stress, workplace, wellbeing, workplace aggression, anxiety, depression, worry,
problem-focused coping, social problem solving; quantitative analysis
vi
OPSOMMING
Druktespanning in die werkplek: die fenomeen, enkele kernkorrelate
en benaderings tot probleemoplossing
deur
Student: Fergus Ruric Vogel
Promotor: Prof RP de la Rey
Departement: Sielkunde
Graad: Philosophiae Doctor
In hierdie studie poog die navorser om die vlakke en oorsake van stres in die werkplek, sowel as
die gevolge daarvan in terme van waargenome en beleefde aggressie in die werkplek, angs,
depressie en kommer vir ’n steekproef van 205 deelnemers vas te stel. Vir hierdie doel is die
volgende vraelyste gebruik: 1) Ervaring van Werk- en Lewensomstandighedevraelys, 2) Aggressie
in die Werkplekvraelys, 3) IPAT Angsskaal, 4) Beck Depressie-inventaris, en 5) Penn State
Kommervraelys. Die deelnemers se vermoë om stres te hanteer soos weerspieël in hulle sosiale
probleemoplossingvaardighede is ondersoek met die Sosiale probleemoplossingsinventaris-
Hersien. Die onverwerkte data is ontleed deur gebruik te maak van beskrywende statistiek asook
inferensiële statistieke soos z-toetse, t-toetse, variansieontleding en post-hoc analises (Scheffé) vir
die volgende groepe: totale groep, geslag, huwelikstatus, ouderdom, tipe organisasie, kwalifikasie-
en posvlak.
Resultate toon dat die meeste deelnemers normale stresvlakke ervaar wat aandui dat respondente
hulle omstandighede binne en buite die werkomgewing as bevredigend beleef. Oor die algemeen
toon die resultate ook dat deelnemers voel dat daar aan hulle verwagtinge betreffende die
werksituasie voldoen word. Met betrekking tot die gevolge van stres, rapporteer die totale groep lae
vlakke van waargenome en beleefde aggressie in die werkplek, asook normale angsvlakke, en lae
vlakke van depressie en kommer. Deelenemers se goeie algemene sosiale probleemoplossing
suggereer hul vermoë om stressors binne en buite die werkplek toereikend te hanteer.
Pearsonkorrelasies toon oor die algemeen aan dat statisties beduidende verbande bestaan tussen
deelnemers se beleefde a) stresvlakke en b) waargenome en beleefde agressie in die werkplek, c)
angs, d) depressie, e) kommer en f) sosiale probleemoplossing.
vii
Dat meeste van die deelnemers in hierdie steekproef die vermoë het om eise en stressors binne en
buite die werkplek effektief te hanteer suggereer die effektiewe gebruik van probleemgesentreerde
hantering wat sosiale probleemoplossing insluit wat vir die meeste deelnemers geassosieer was
met ‘n positiewe probleemoriëntasie and effektiewe rasionele probleemoplossingvaardighede. Die
bevindings van hierdie studie kan nuttig wees as deel van ‘n streshanteringprogram wat
werknemers help om meer proaktief in hulle hantering van stres te wees deur meer effektiewe
probleemoplossing. Vanuit ‘n salutogeniese paradigma en in ooreenstemming met resente
verwikkelinge in positiewe sielkunde, suggereer die bevindings ook dat meer aandag geskenk moet
word aan redes waarom sommige werknemers stres meer effektief as ander hanteer.
Sleutelterme: Stres, werkplek, algemene welstand, gedrag, werkplekaggressie, angs, depressie,
bekommernis, probleemgefokusde handhawing, sosiale probleemoplossing, kwantitatiewe analise
viii
TABLE OF CONTENTS
Summary iv
Opsomming vi
CHAPTER 1
WORK STRESS
1.1 Introduction 1
1.2 Occupational health psychology 2
1.3 The nature of stress 2
1.3.1 Definition of stress and work stress 2
1.3.2 Burnout 3
1.4 Major causes of stress 4
1.4.1 Job insecurity 5
1.4.2 Work hours 5
1.4.3 Control at work 6
1.4.4 Managerial style 6
1.5 Consequences of stress 7
1.5.1 Physical consequences 7
1.5.2 Psychological problems 8
1.5.3 Behavioural problems 8
1.6 Stress in South Africa 9
1.7 Conclusion 10
ix
CHAPTER 2
RESEARCH PROBLEM AND PURPOSE OF STUDY
2.1 Introduction 11
2.2 Research problem 11
2.2.1 Causes of stress 12
2.2.2 Consequences of stress 13
2.3 Aim of the study 13
2.4 Research objectives 14
CHAPTER 3
STRESS IN THE WORKPLACE
3.1 Introduction 16
3.2 Models of stress 16
3.2.1 Response-based model 16
3.2.2 The general adaptation syndrome 17
3.2.2.1 Physiological processes 20
3.2.3 Stimulus-based model 21
3.2.4 Psychological-based approaches 23
3.2.4.1 Transactional models of stress 23
1) Lazarus’s transactional model of stress 23
2) Cox and MacKay’s transactional model of stress 24
3.2.4.2 Cybernetic theory of organizational stress 25
3.3 Main causes and sources of workplace stress 26
3.3.1 Extraorganizational causes and sources of stress 26
3.3.1.1 Rate of social and technological change 26
3.3.1.2 Family 27
3.3.1.3 Relocation 27
3.3.1.4 Life changes 28
3.3.1.5 Race, sex, and social class 28
x
3.3.2 Organizational stressors 29
3.3.2.1 Task demands 29
3.3.2.2 Physical demands 31
3.3.2.3 Role demands 32
1) Role conflict and ambiguity 32
2) Responsibility for others 33
3.3.2.4 Interpersonal demands 33
1) Group pressures 33
2) Relationships at work 33
3.3.2.5 Career stress 34
3.3.3 Group stressors 35
3.3.4 Individual stressors 35
3.3.4.1 Type A and B personalities 35
3.3.4.2 Learned helplessness 36
3.3.4.3 Self-efficacy 36
3.3.4.4 Psychological hardiness 37
3.3.4.5 Optimism 37
3.4 Conclusion 37
CHAPTER 4
AGGRESSION IN THE WORKPLACE
4.1 Introduction 40
4.2 Aggression 41
4.2.1 Instinct theories 42
4.2.2 Biological theories 43
4.2.3 Drive theories 44
4.2.4 Social learning theory 45
4.2.5 Cognitive theories 45
4.2.6 Personal causes of aggression 47
4.2.6.1 Type A personality 47
4.2.6.2 Hostile attribution bias 47
4.2.6.3 Antecedents of aggressive behaviour 47
4.2.6.4 “Big Five” dimensions of personality 48
xi
4.2.6.5 Gender differences 49
4.2.7 Anger 49
4.2.8 Violence 50
4.3 Aggression in the workplace 51
4.3.1 Causes of workplace aggression 53
4.3.1.1 Social determinants of workplace aggression 54
4.3.1.2 Situational factors 54
4.3.1.3 Individual differences 55
4.3.1.4 Models of workplace aggression 56
4.4 Conclusion 59
CHAPTER 5
ANXIETY, DEPRESSION, AND WORRY
5.1 Introduction 62
5.2 Anxiety 62
5.2.1 Normal anxiety 63
5.2.2 Pathological anxiety 63
5.2.3 Theories of anxiety 64
5.2.3.1 Psychoanalytical theories 64
5.2.3.2 Learning theories 64
5.2.3.3 Existential theories 65
5.2.3.4 Biological theories 65
5.2.4 Stress and anxiety 66
5.3 Depression 67
5.3.1 Causal factors of depression 68
5.3.1.1 Biological and genetic factors 68
1) Genetic and constitutional factors 68
2) Neurophysiological and neuroendocrinological factors 69
3) Biochemical factors 70
5.3.1.2 Psychosocial factors 70

xii
5.3.2 Theories of depression 71
5.3.2.1 Psychodynamic theories 71
5.3.2.2 Cognitive theory 71
5.3.2.3 Learned helplessness 72
5.3.2.4 Interpersonal effects of mood disorders 72
5.4 Worry 73
5.5 Work-related stress, anxiety, depression and worry 74
5.6 Conclusion 75
CHAPTER 6
COPING
6.1 Introduction 77
6.2 Coping defined 77
6.3 Coping strategies 78
6.3.1 Key coping strategies 80
6.3.1.1 Individual coping strategies 80
1) Exercise 80
2) Relaxation 81
3) Time management 82
4) Social support 83
5) Cognitive therapy techniques 84
a) Stress inoculation 85
b) Problem solving 86
6.3.1.2 Organizational strategies 87
1) Institutional programmes 87
2) Collateral programmmes 89
6.4 Conclusion 90
xiii
CHAPTER 7
METHODOLOGY
7.1 Introduction 91
7.2 Research hypotheses 92
7.2.1 First set 92
7.2.2 Second set 92
7.2.3 Third set 93
7.2.4 Fourth set 94
7.3 Research Design 95
7.3.1 Data collection 95
7.3.1.1 Psychometric instruments 95
7.3.1.2 Biographical questionnaire 96
7.3.1.3 Experience of Work and Life Circumstances Questionnaire 96
7.3.1.4 Aggression in the Workplace Questionnaire 97
7.3.1.5 IPAT Anxiety Scale 97
7.3.1.6 Beck Depression Inventory 98
7.3.1.7 Penn State Worry Questionnaire 99
7.3.1.8 Social Problem-Solving Inventory-Revised 99
7.4 Quantitative analysis of test data 101
7.4.1 Descriptive and other statistics 101
7.4.1.1 The z-test 101
7.4.1.2 The t-test 101
7.4.1.3 Correlation coefficient 102
7.4.1.4 Analysis of variance 102
7.4.1.5 Post hoc comparisons (Scheffé) 102
7.4.1.6 Reliability coefficient 103
7.5 Impact of response patterns 103
7.6 Effect size 104
7.7 Conclusion 105

xiv
CHAPTER 8
DESCRIPTION OF SAMPLE 8.1 Introduction 106
8.2 Subjects 106
8.2.1 Description of the total survey group 107
8.2.1.1 Gender 107
8.2.1.2 Age 107
8.2.1.3 Ethnicity 108
8.2.1.4 Marital status 108
8.2.1.5 Home language 108
8.2.1.6 Organizations 109
8.2.1.7 Qualifications 109
8.2.1.8 Position level 110
8.2.1.9 Work experience 110
8.3 Conclusion 111
CHAPTER 9
RESULTS 9.1 Introduction 113
9.2 Descriptive statistics 113
9.3 Cronbach alpha reliability coefficients 113
9.4 Inferential statistics 114
9.4.1 Z-test statistic 114
9.4.1.1 Total sample 115
1) Experience of Work and Life Circumstances Questionnaire 115
a) Level of stress 115
b) Causes outside the work situation 115
c) Organizational functioning 116
d) Task characteristics 116

xv
e) Physical working conditions and job equipment 116
f) Career matters 117
g) Social matters 117
h) Remuneration, fringe benefits and personnel policy 118
2) Aggression in the Workplace Questionnaire 118
a) Aggression in the workplace-witnessed 118
b) Aggression in the workplace-experienced 119
3) IPAT Anxiety Scale 119
a) Factor –C 119
b) Factor L 120
c) Factor O 120
d) Factor -Q3 121
e) Factor Q4 121
f) Score A 121
g) Score B 122
h) Total anxiety 122
4) Beck Depression Inventory 122
5) Penn State Worry Questionnaire 123
6) Social Problem-Solving Inventory-Revised 123
a) Positive problem orientation 124
b) Negative problem orientation 124
c) Rational problem solving 124
d) Problem definition and formulation 125
e) Generation of alternatives 125
f) Decision making 125
g) Solution implementation and verification 126
h) Impulsivity/carelessness style 126
i) Avoidance style 126
j) Total social problem solving 127
9.4.2 T-test statistic 127
9.4.2.1 Gender comparison 128
1) Experience of Work and Life Circumstances Questionnaire 128
2) Aggression in the Workplace Questionnaire 129
a) Aggression in the workplace-witnessed 129
b) Aggression in the Workplace-experienced 129
3) IPAT Anxiety Scale 130
xvi
4) Beck Depression Inventory 132
5) Penn State Worry Questionnaire 132
6) Social Problem-Solving Inventory-Revised 133
9.4.2.2 Marital status 134
1) Experience of Work and Life Circumstances Questionnaire 134
2) Aggression in the Workplace Questionnaire 135
a) Aggression in the workplace-witnessed 135
b) Aggression in the workplace-experienced 136
3) IPAT Anxiety Scale 137
4) Beck Depression Inventory 138
5) Penn State Worry Questionnaire 139
6) Social Problem-Solving Inventory-Revised 139
9.4.3 Analysis of variance 142
9.4.3.1 Experience of Work and Life Circumstances Questionnaire 142
1) Level of stress 142
2) Causes outside the work situation 143
3) Organizational functioning 143
4) Task characteristics 146
5) Physical working conditions and job equipment 151
6) Career matters 152
7) Social matters 156
8) Remuneration, fringe benefits and personnel policy 157
9.4.3.2 Aggression in the Workplace Questionnaire 164
1) Aggression in the workplace -witnessed 164
a) Witnessed overall aggression 164
b) Witnessed expressions of hostility 165
c) Witnessed obstructionism 165
d) Witnessed overt aggression 166
2) Aggression in the workplace-experienced 169
a) Experienced overall aggression 169
b) Experienced expressions of hostility 170
c) Experienced obstructionism 170
d) Experienced overt aggression 171
9.4.3.3 IPAT Anxiety Scale 177
1) Factor –C 177
2) Factor L 178
xvii
3) Factor O 179
4) Factor -Q3 179
5) Factor Q4 180
6) Score A 181
7) Score B 181
8) Total anxiety 182
9.4.3.4 Beck Depression Inventory 183
9.4.3.5 Penn State Worry Questionnaire 183
9.4.3.6 Social Problem-Solving Inventory-Revised 184
1) Positive problem orientation 184
2) Negative problem orientation 185
3) Rational problem solving 186
4) Problem definition and formulation 186
5) Generation of alternatives 187
6) Decision making 190
7) Solution implementation and verification 190
8) Impulsivity/carelessness style 191
9) Avoidance style 192
10) Total social problem solving 192
9.5 Co-relationships 193
9.5.1 Total Group 193
9.5.1.1 Experience of Work and Life Circumstances Questionnaire with the Aggression
in the Workplace Questionnaire 193
1) Experience of Work and Life Circumstances Questionnaire with the
Aggression in the Workplace Questionnaire-witnessed 194
2) Experience of Work and Life Circumstances Questionnaire with the
Aggression in the Workplace Questionnaire-experienced 194
9.5.1.2 Experience of Work and Life Circumstances Questionnaire with the
IPAT Anxiety Scale 195
9.5.1.3 Experience of Work and Life Circumstances Questionnaire with the
Beck Depression Inventory 195
9.5.1.4 Experience of Work and Life Circumstances Questionnaire with the
Penn State Worry Questionnaire 196
9.5.1.5 Experience of Work and Life Circumstances Questionnaire with the
Social Problem-Solving Inventory-Revised 197
xviii
9.5.2 Gender 197
9.5.2.1 Experience of Work and Life Circumstances Questionnaire with the
Aggression in the Workplace Questionnaire 197
1) Experience of Work and Life Circumstances Questionnaire with the
Aggression in the Workplace Questionnaire-witnessed 198
2) Experience of Work and Life Circumstances Questionnaire with the
Aggression in the Workplace Questionnaire-experienced 198
9.5.2.2 Experience of Work and Life Circumstances Questionnaire with the
IPAT Anxiety Scale 199
9.5.2.3 Experience of Work and Life Circumstances Questionnaire with the
Beck Depression Inventory 199
9.5.2.4 Experience of Work and Life Circumstances Questionnaire with the
Penn State Worry Questionnaire 200
9.5.2.5 Experience of Work and Life Circumstances Questionnaire with the
Social Problem-Solving Inventory-Revised 201
9.5.3 Marital status 202
9.5.3.1 Experience of Work and Life Circumstances Questionnaire with the
Aggression in the Workplace Questionnaire 202
1) Experience of Work and Life Circumstances Questionnaire with the
Aggression in the Workplace Questionnaire-witnessed 202
2) Experience of Work and Life Circumstances Questionnaire with the
Aggression in the Workplace Questionnaire-experienced 203
9.5.3.2 Experience of Work and Life Circumstances Questionnaire with the
IPAT Anxiety Scale 203
9.5.3.3 Experience of Work and Life Circumstances Questionnaire with the
Beck Depression Inventory 204
9.5.3.4 Experience of Work and Life Circumstances Questionnaire with the
Penn State Worry Questionnaire 205
9.5.3.5 Experience of Work and Life Circumstances Questionnaire with the
Social Problem-Solving Inventory-Revised 205
9.5.4 Age groups 206
9.5.4.1 Experience of Work and Life Circumstances Questionnaire with the
Aggression in the Workplace Questionnaire 206
1) Experience of Work and Life Circumstances Questionnaire with the
Aggression in the Workplace Questionnaire-witnessed 206
xix
2) Experience of Work and Life Circumstances Questionnaire with the
Aggression in the Workplace Questionnaire-experienced 207
9.5.4.2 Experience of Work and Life Circumstances Questionnaire with the
IPAT Anxiety Scale 208
9.5.4.3 Experience of Work and Life Circumstances Questionnaire with the
Beck Depression Inventory 208
9.5.4.4 Experience of Work and Life Circumstances Questionnaire with the
Penn State Worry Questionnaire 209
9.5.4.5 Experience of Work and Life Circumstances Questionnaire with the
Social Problem-Solving Inventory-Revised 210
9.5.5 Organization groupings 211
9.5.5.1 Experience of Work and Life Circumstances Questionnaire with the
Aggression in the Workplace Questionnaire 211
1) Experience of Work and Life Circumstances Questionnaire with the
Aggression in the Workplace Questionnaire-witnessed 211
2) Experience of Work and Life Circumstances Questionnaire with the
Aggression in the Workplace Questionnaire-experienced 212
9.5.5.2 Experience of Work and Life Circumstances Questionnaire with the
IPAT Anxiety Scale 212
9.5.5.3 Experience of Work and Life Circumstances Questionnaire with the
Beck Depression Inventory 213
9.5.5.4 Experience of Work and Life Circumstances Questionnaire with the
Penn State Worry Questionnaire 214
9.5.5.5 Experience of Work and Life Circumstances Questionnaire with the
Social Problem-Solving Inventory-Revised 214
9.5.6 Qualification groupings 215
9.5.6.1Experience of Work and Life Circumstances Questionnaire with the
Aggression in the Workplace Questionnaire 215
1) Experience of Work and Life Circumstances Questionnaire with the
Aggression in the Workplace Questionnaire-witnessed 216
2) Experience of Work and Life Circumstances Questionnaire with the
Aggression in the Workplace Questionnaire-experienced 217
9.5.6.2 Experience of Work and Life Circumstances Questionnaire with the
IPAT Anxiety Scale 217
9.5.6.3 Experience of Work and Life Circumstances Questionnaire with the
Beck Depression Inventory 218
xx
9.5.6.4 Experience of Work and Life Circumstances Questionnaire with the
Penn State Worry Questionnaire 219
9.5.6.5 Experience of Work and Life Circumstances Questionnaire with the
Social Problem-Solving Inventory-Revised 220
9.5.7 Position levels 221
9.5.7.1 Experience of Work and Life Circumstances Questionnaire with the
Aggression in the Workplace Questionnaire 221
1) Experience of Work and Life Circumstances Questionnaire with the
Aggression in the Workplace Questionnaire-witnessed 221
2) Experience of Work and Life Circumstances Questionnaire with the
Aggression in the Workplace Questionnaire-experienced 222
9.5.7.2 Experience of Work and Life Circumstances Questionnaire with the
IPAT Anxiety Scale 222
9.5.7.3 Experience of Work and Life Circumstances Questionnaire with the
Beck Depression Inventory 223
9.5.7.4 Experience of Work and Life Circumstances Questionnaire with the
Penn State Worry Questionnaire 224
9.5.7.5 Experience of Work and Life Circumstances Questionnaire with the
Social Problem-Solving Inventory-Revised 224
9.6 Effect size, d 225
9.7 Conclusion 226
CHAPTER 10
DISCUSSION
10.1 Introduction 227
10.2 Cronbach alpha reliability coefficients 227
10.2.1 Experience of Work and Life Circumstances Questionnaire 227
10.2.2 Aggression in the Workplace Questionnaire 227
10.2.3 IPAT Anxiety Scale 228
10.2.4 Beck Depression Inventory 228
10.2.5 Penn State Worry Questionnaire 229
10.2.6 Social Problem-Solving Inventory–Revised 229

xxi
10.3 Experience of stress and its consequences 229
10.3.1 Total sample, gender, marital status, and age 229
10.3.2 Type of organization grouping 236
10.3.2.1 Organization grouping with qualification level 238
10.3.2.2 Organization grouping with position level 241
10.3.2.3 Organization grouping with age 242
10.3.3 Qualification level 243
10.3.3.1 Qualification level with age 244
10.3.3.2 Qualification level with position level 245
10.3.4 Position level 245
10.3.4.1 Position level with age 246
10.4 Coping 247
10.5 Overall assessment of effect size 249
10.6 Some limitations of the present research 249
10.7 Further research 250
10.7 Conclusion 250
LIST OF REFERENCES 252
APPENDIX A 266
APPENDIX B 290
LIST OF FIGURES
Figure 2.1: Causes and consequences of workplace stress 15
Figure 3.1: A response model of stress 17
Figure 3.2: The General Adaptation Syndrome 20
Figure 3.3: Cox’s stimulus-based model of stress 22
Figure 3.4: A psychological model of stress with the emphasis on perceptual and
cognitive processes 23
xxii
Figure 3.5: Macrolevel stressors of an organization 30
Figure 4.1: Cognitive theories of aggression 46
Figure 4.2: The General Affective Aggression Model 46
Figure 4.3: Neuman and Baron’s theoretical model of workplace aggression 57
Figure 4.4: Baron’s General Workplace Affective Aggression Model 58
Figure 4.5: A cognitive appraisal model of workplace aggression 60
Figure 6.1: Appraisal model of stress and coping 78
LIST OF TABLES
Table 3.1: Examples of the effects of the autonomic (sympathetic) arousal on organs 18
Table 4.1: Factors that characterize different forms of aggression 42
Table 4.2: Types of aggression in the workplace 52
Table 8.1: Balance of questionnaires 106
Table 8.2: Gender distribution 107
Table 8.3: Mean age ( x ), standard deviation (s), and variance (s²) for age of respondents 107
Table 8.4: Age distribution of respondents 108
Table 8.5: Ethnicity 108
Table 8.6: Marital status 108
Table 8.7: Home language distribution 109
Table 8.8: Type of institution 109
Table 8.9: Qualifications of the survey group 110
Table 8.10: Position level 110
Table 8.11: Mean work experience ( x ), standard deviation (s), and variance (s²) for
work experience of respondents 111
Table 8.12: Work experience distribution 111
Table 9.1: Calculations of z-values for aggression in the workplace-witnessed 119
Table 9.2: Calculations of z-values for aggression in the workplace-experienced 119
Table 9.3: T-test statistics for the Experience of Work and Life Circumstances
Questionnaire for gender 128
Table 9.4: T-test statistics for aggression in the workplace-witnessed for gender 129
Table 9.5: T-test statistics for aggression in the workplace-experienced for gender 130
Table 9.6: T-test statistics for the IPAT Anxiety Scale for gender 131
Table 9.7: T-test statistics for the Beck Depression Inventory for gender 132
Table 9.8: T-test statistics for the Penn State Worry Questionnaire for gender 132
Table 9.9: T-test statistics for the Social Problem-Solving Inventory-Revised for gender 133

xxiii
Table 9.10: T-test statistics for the Experience of Work and Life Circumstances
Questionnaire for marital status 135
Table 9.11: T-test statistics for Aggression in the workplace-witnessed for marital status 136
Table 9.12: T-test statistics for Aggression in the workplace-experienced for marital status 136
Table 9.13: T-test statistics for the IPAT Anxiety Scale for marital status 138
Table 9.14: T-test statistics for the Beck Depression Inventory for marital status 139
Table 9.15: T-test statistics for the Penn State Worry Questionnaire for marital status 139
Table 9.16: T-test statistics for the Social Problem-Solving Inventory-Revised for
marital status 141
Table 9.17: Analysis of variance for level of stress 142
Table 9.18: Analysis of variance for causes outside the work situation 143
Table 9.19: Analysis of variance for organizational functioning 144
Table 9.20: Mean values for organizational functioning by organization and qualification
grouping 146
Table 9.21: Analysis of variance for task characteristics 146
Table 9.22: Mean values for task characteristics by organization and qualification grouping 148
Table 9.23: Mean values for task characteristics by organization grouping and position level 149
Table 9.24: Mean values for task characteristics by organization grouping and age group 151
Table 9.25: Analysis of variance for physical working conditions 151
Table 9.26: Analysis of variance for career matters 153
Table 9.27: Mean values for career matters by organization and qualification grouping 156
Table 9.28: Analysis of variance for social matters 156
Table 9.29: Analysis of variance for remuneration, fringe benefits and personnel policy 157
Table 9.30: Mean values for remuneration, fringe benefits and personnel policy by
organization and qualification grouping 160
Table 9.31: Mean values for remuneration, fringe benefits and personnel policy by
organization grouping and age group 163
Table 9.32: Mean values for remuneration, fringe benefits and personnel policy by
qualification grouping and age group 163
Table 9.33: Analysis of variance for witnessed overall aggression 164
Table 9.34: Analysis of variance for witnessed expressions of hostility 165
Table 9.35: Analysis of variance for witnessed obstructionism 166
Table 9.36: Analysis of variance for witnessed overt aggression 166
Table 9.37: Mean values for witnessed overt aggression by organization and
qualification grouping 169
Table 9.38: Analysis of variance for experienced overall aggression 169
xxiv
Table 9.39: Analysis of variance for experienced expressions of hostility 170
Table 9.40: Analysis of variance for experienced obstructionism 171
Table 9.41: Analysis of variance for experienced overt aggression 171
Table 9.42: Mean values for experienced overt aggression by organization and
qualification grouping 174
Table 9.43: Mean values for experienced overt aggression by qualification grouping and
age grouping 176
Table 9.44: Mean values for experienced overt aggression by age group and
position level 177
Table 9.45: Analysis of variance for ego weakness or lack of ego strength 178
Table 9.46: Analysis of variance for suspiciousness 178
Table 9.47: Analysis of variance for guilt proneness 179
Table 9.48: Analysis of variance for defective integration and lack of self-sentiment 180
Table 9.49: Analysis of variance for frustrative tension or id pressure 180
Table 9.50: Analysis of variance for covert anxiety 181
Table 9.51: Analysis of variance for overt anxiety 182
Table 9.52: Analysis of variance for the total anxiety score 182
Table 9.53: Analysis of variance for depression 183
Table 9.54: Analysis of variance for worry 184
Table 9.55: Analysis of variance for positive problem orientation 185
Table 9.56: Analysis of variance for negative problem orientation 185
Table 9.57: Analysis of variance for rational problem solving 186
Table 9.58: Analysis of variance for problem definition and formulation 187
Table 9.59: Analysis of variance for the generation of alternatives 187
Table 9.60: Mean values for generation of alternatives by organization grouping and
position level 189
Table 9.61: Analysis of variance for decision making 190
Table 9.62: Analysis of variance for solution implementation and verification 191
Table 9.63: Analysis of variance for impulsivity/carelessness style 191
Table 9.64: Analysis of variance for avoidance style 192
Table 9.65: Analysis of variance for total problem solving 193
1
CHAPTER 1
WORK STRESS
1.1 Introduction
Stress has become an important term in everyday language, meaningful to most individuals
found in industrial societies (Wainwright & Calnan, 2002: v). It not only describes a range of
“pains and aches” or as Cartwright and Cooper (1997:1) put it ‘a vague yet often sense of
disquiet’, but a legitimate concern of our modern way of life. For both lay people and
researchers work stress is indicative of the ‘natural’ limit of human endurance and resilience
(Wainwright & Calnan, 2002: v) and is part of life, unavoidable, good and bad, constructive and
destructive (Jacobs, in Van Zyl, 2002: 26).
Stress costs corporations all over the world large sums of money and on an individual level it
affects the physical and psychological well being of the employee. Luthans (2002:395) quotes
the president of the American Institute of Stress at the New York Medical College on the cost of
stress in the U.S. workplace as saying ‘(It)…is estimated between $200 and $300 billion
annually, as assessed by absenteeism, employee turnover, direct medical costs, workers’
compensation and other legal costs, diminished productivity, accidents, etc., and is spread
throughout the corporation, from the mailroom to the executive suite’. Schell (1997: 4) mentions
the International Labour Office in Geneva that cites that ‘excessive, pathological job stress can
be viewed as the end-of-the-century affliction from which no country or job stratum is spared’. It
is estimated that in South Africa R500 million is lost annually through absenteeism and loss of
productivity as a result of stress (“Executive stress”, 1991).
All employment generates stress and strain to some degree (Koeske & Kirk, 1993: 319) and
people tend to associate stress with something bad (Luthans, 2002: 395). A certain amount of
stress is not automatically bad for the individual working in an organization and can enhance job
performance (Luthans, 2002: 411). Stress experienced as a result of job-related stressful
events, such as getting a new supervisor or being involuntarily transferred, often resulted in
individuals obtaining more information about their job resulting in new and better ways of doing
their work (Weiss, Ilgen, & Sharbaugh, 1982: 64). Individuals working in jobs such as in sales,
journalism, or television and who are under time pressures often benefit from mild levels of
stress. Other occupations, in which the individual has a high level of contact with clients such as
teaching, law, policing, and medicine do not benefit from mild levels of stress and often suffer
from burnout (Forshaw, 2002: 75; Luthans, 2002: 412; Van der Ploeg, Dorresteijn, & Kleber,
2003: 158).
2
1.2 Occupational health psychology
The field of stress falls under the spectre of health psychology. Health psychology, a relatively
new branch of psychology, specifically focuses on issues of human health and illness (Forshaw,
2002: 1). Tetrick and Quick (in Quick & Tetrick, 2002: 4) state that health as defined by the
World Health Organization in 1946 is not just the absence of disease but a state of complete
physical, mental, and social wellbeing and in 1986 it added that health be viewed as ‘resource
for everyday life, not the object of living’. Health is seen as ‘a positive concept including social
and personal resources as well as physical capabilities’ (Nutbeam in Quick & Tetrick, 2002: 4).
Forshaw (2002: 1) loosely defines health psychology as ‘the study of how thoughts, feelings,
and behaviours stem from, interact with, or cause, physical or mental efficiency, efficacy,
comfort and wellbeing’.
Occupational health psychology involves the application of both public health and health
psychology to occupational settings (Quick et al, 1997: 15). Tetrick and Quick (in Quick &
Tetrick, 2002: 4) state that ‘(T) the purpose of occupational health psychology is to develop,
maintain, and promote the health of employees directly and the health of their families’. It
achieves this goal by incorporating the preventive and therapeutic interventions developed to
create safe and healthy working environments.
To appreciate the challenges facing occupational health psychology the nature of stress and the
most relevant causes occurring in the workplace will be examined.
1.3 The nature of stress
Individuals usually think of stress as a negative event with negative consequences. This
negative stress is called distress. However there is also a positive form of stress, called
eustress where the Greek ‘eu’ means good (Birkenbihl, 1989: 12). Examples of eustress
include, for example, a promotion, gaining recognition and getting married (Moorhead & Griffin,
1989: 195).
1.3.1 Definition of stress and work stress
Stress is derived from the Latin word stringere, meaning to draw tight, and was used in the 17th
century to describe hardships or affliction (Cartwright & Cooper, 1997: 3). Numerous definitions
of stress and job stress can be found in the literature. Moorhead and Griffin (1989: 193) define
stress “as a person’s adaptive response to a stimulus that places excessive psychological or
physical demands on that person”. Luthans (2002: 396) defines work stress as “an adaptive
response to an external situation that results in physical, psychological, and behavioral
deviations for organizational participants”. Both definitions imply that individuals respond in
different ways when subjected to certain stressors. A stressor is any stimulus, which the
3
individual perceives as a threat (Cotton, 1990: 28). The individual must perceive the stressor to
be excessive for stress to result, whether it is physical, psychological or psychosocial. Physical
stressors include such conditions as environmental pollutants, environmental pressures such as
extreme changes in temperature, electric shock, prolonged exercise, injuries and other trauma
to the body, and exposure to disease. Psychological stressors refer to those threats that are
attributed to the individual’s internal reactivity, such as thoughts, feelings, and concerns about
these threats. Psychosocial stressors are those that result from interpersonal interactions, such
as with colleagues at work or from social isolation.
Luthans (2002: 396) also points out what stress is not:
• Stress is not simply anxiety. Anxiety operates solely in the emotional and psychological
sphere, whereas stress operates in both the aforementioned spheres, and also in the
physiological sphere. Stress may be accompanied by anxiety, but the one should not be
equated with the other.
• Stress is not simply nervous tension. Nervous tension, like anxiety, may result from stress,
but they are not the same. Some individuals may keep their stress “bottled up” and therefore
not display any nervous tension.
• Stress is not necessarily something damaging, bad, or to be avoided. Eustress is not
damaging or bad and is something individuals should seek out rather than avoid. Everyone
will experience stress. The important issue is how the individual is able to handle stress.
Distress, however, should be prevented or effectively controlled.
Before stress can be discussed any further, the term burnout needs to be clarified as it is often
used alternatively with the term stress.
1.3.2 Burnout
The first writings on burnout were by Freudenberger (in Maslach et al, 2001: 399) and Maslach
(in Maslach et al, 2001: 399) a year later. Burnout is seen as a psychological syndrome that
occurs in response to chronic interpersonal stressors on the job (Maslach et al, 2001: 400) and
is commonly associated with human service occupations (Schaufeli, 2003: 4). Three factors are
associated with burnout, which are emotional exhaustion, depersonalisation, and feelings of
reduced personal accomplishment. Exhaustion represents the basic individual stress dimension
of burnout. It describes feelings of being overextended and depleted of one’s emotional and
physical resources. Depersonalisation (or cynicism) refers to the interpersonal dimension of
burnout, and may be described as a negative, callous, or excessively detached response to
various aspects of the job (Maslach et al, 2001: 402). Individuals begin to lose interest in things
around them (Forshaw, 2002: 75). They often start lacking sympathy for people in their

4
environment and can be described as being emotionally flat. The third component of reduced
efficacy or accomplishment represents the self-evaluation dimension of burnout (Maslach et al,
2001: 402). It refers to feelings of incompetence and a lack of achievement and productivity at
work.
Densten (2001: 842) found in his re-evaluation of these three factors that emotional exhaustion
had two distinct aspects, i.e., psychological and somatic strain. Psychological strain referred to
items such as ‘really a strain’ or ‘too much stress’ where as somatic strain referred to items such
as ‘emotionally drained’, ‘used up’ or fatigued’. Personal accomplishment was found to also
consist of two components, one referring to ‘self’ and the other to ‘other’. A decline in personal
accomplishment (self) may relate more to a lack of job competency, where as personal
accomplishment (others) may relate to the views and expectations of others.
Luthans (2002: 398) quotes John Izzo, a former HR professional who describes burnout as
“losing a sense of the basic purpose and fulfilment of your work.” Luthans (2002: 412)
concludes ‘that performance of many tasks is in fact strongly affected by stress’ and that
‘performance usually drops off sharply when stress rises to high levels’. There are many causes
of stress affecting the individual in the workplace.
1.4 Major causes of stress
In the 1990’s major restructuring of work started to take place (Sparks, Faragher, & Cooper,
2001: 490). Organizations in countries that were hit by recession had to downsize and
restructure in an effort to survive. In the United States of America 2.7 million jobs were lost
between March 2001 and August 2003 (Heylin, 2004: 28). As a result an increase in
subcontracting and outsourcing has taken place in order to remain competitive on the global
market. A rise in short-term contracts, new patterns of working, such as teleworking, self-
regulated work and teamwork, an increase in the use of computerized technology, and the
development of a more flexible workforce has taken place (Cox, Griffiths, & Rial-Gonzalez in
Sparks, Faragher, & Cooper, 2001: 490). An increase in the numbers of females in the
workforce, as well as dual-earner couples, and an increase in part-time work has also occurred
in some countries. Over the past 40 years in the United States of America Heylin (2004: 28)
states “the percentage of those on payrolls who are women has risen inexorably from 37% to
almost 49% today”. As a result of these changes research on occupational research and
employee wellbeing has focused on four major causes of stress in organizations, i.e., job
insecurity, work hours, control at work, and managerial style (Sparks, Faragher, & Cooper,
2001: 490).
5
1.4.1 Job insecurity
The trend, where organizations are restructuring and downsizing, has led to an increase in the
level of perceived job insecurity (Kivimäki, Vahtera, Pentti & Ferrie, 2000: 972). Not only blue-
collar occupations are affected, but also professional and graduate jobs are being affected
(Smithson & Lewis, 2000: 681). In the past the workers that were laid off were mostly young,
male, blue-collar workers (Greenglass & Burke, 2001: 1). Today higher paid, white-collar
workers, often at their peak of their careers, are loosing their jobs. Burchell et al in Sparks,
Faragher, and Cooper, 2001: 491) found that the youngest and the oldest employees of an
organization experienced high levels of job insecurity.
Job insecurity has been identified as a form of work-related stressor, which is potentially
detrimental to the individual’s psychological wellbeing, job attitudes and behaviours
(Klandermans, Van Vuuren, & Jacobson in Lim, 1996: 172). Employees generally experience
high levels of anxiety when their jobs are insecure, which arises from the lack of certainty
regarding when layoffs or curtailment of job features will occur, and when it occurs who will be
affected (Jacobson in Lim, 1996: 173). Inherent in job insecurity is the experience of ambiguity
that makes this phenomenon highly stressful for the individual. Research has shown that
perceived job insecurity is bad for employee wellbeing and can impact on organizations through
increased absence from work due to sickness (Kivimäki et al, 1997: 870). Other effects include
lowered morale and motivation (Worral & Cooper, in Sparks, Faragher, and Cooper, 2001: 490),
diminished support of organizational goals, less effort to produce quality work, and were more
actively looking for alternative employment (King, 2000: 88).
1.4.2 Work hours
In many organizations changes due to restructuring and downsizing have resulted in an
increase in the number of working hours (Sparks, Faragher, & Cooper, 2001: 493). Long
working hours required by certain jobs effect employee wellbeing. Shift work has been found to
be a common stressor that affects blood temperature, metabolic rate, blood sugar levels, mental
efficiency, and work motivation (Cartwright & Cooper, 1997: 15). Extended shifts are also
associated with deaths due to coronary heart disease (Cartwright & Cooper, 1997: 15).
Rosa (1995: 54) found that workers working shifts suffered from excess fatigue, sleepiness, and
significant loss of sleep. Actual incidents of falling asleep were found to occur more often during
night shifts (Åkerstedt, in Sallinen et al, 1998: 240). The second half of the night shift is a time of
increased risk because the nadir of alertness is reached during this period. Over a long period
severe sleep disturbances may develop resulting in the development of chronic fatigue, anxiety,
nervousness, and depression (Costa et al in Smith, Folkard, & Fuller, 2002: 166). Furthermore
shift workers are have been found to be prone to poor lifestyle habits, such as heavy smoking,
6
inadequate diet, and lack of exercise (Marayuma et al, in Sutherland & Cooper, 2000: 72).
Flexible working hours have been found to have both advantages and disadvantages (Sparks,
Faragher, & Cooper, 2001: 494). Some of the advantages include lower stress levels,
increased job enrichment, morale and autonomy, reduced absenteeism and tardiness, and
improved job satisfaction and productivity. Disadvantages include increase costs, problems with
scheduling and work co-ordination, difficulties in supervising all employees due to differing work
hours, and changes in the organizational culture.
1.4.3 Control at work
The concept of perceived control or autonomy has been extensively researched over the years
(Sparks, Faragher, Cooper, 2001: 498). It is essentially a cognitive phenomenon and refers to
the level that individuals perceive they are in control of their lives including their work (Luthans,
2002: 275). Ganster and Fusilier (in Sparks, Faragher, Cooper, 2001: 498) define perceived
control as the amount of control that individuals believe they have over their environment,
whether direct or indirect, to make it less threatening or more rewarding.
Within the work environment perceived control refers to the extent to which employees are free
to decide how to accomplish a task or to reach set goals (Theorell, 2002: 204). Employees who
perceive themselves’ as in control are more intrinsically motivated and willing to accept
responsibility for the consequences of their work (Hackman & Oldham, in Sparks, Faragher,
Cooper, 2001: 498). Much of the research on control at work was in terms of task, decision,
physical and resource control (Hurrell & McLaney in Troup & Dewe, 2002: 338) and more
recently in terms of timing control and method control (Wall, Jackson, & Mullarkey in Troup &
Dewe, 2002: 338) as well as task, resource and organizational control (Carayon & Zijlstra in
Troup & Dewe, 2002: 338). Research on distinguishing ‘being in control’ and ‘the desire for
control’ has also been done (Burger in Troup & Dewe, 2002: 338). Mergers and acquisitions
are particularly stressful because they are viewed as a crucial event over which the employee
has no control and is psychologically not prepared for (Cartwright & Cooper, 1997: 33).
Employees tend to fear the worst and are very pessimistic from when the merger or acquisition
is announced until actual changes have taken place.
1.4.4 Managerial style
Managers are prone to high levels of work stress (Sparks, Faragher, & Cooper, 2001: 501).
They are involved in decision-making and the implementation of these decisions. When large
important changes occur within the organization such as a merger, they are often blamed for
these changes (Campbell-Jamison, Worrall, & Cooper, 2001: 46). Employees in a study of a
power company that was being privatised felt let down by the organization and they felt that the
trust that had existed between them and management had been destroyed. They blamed the

7
organization although in actual fact it was outside the control of management. The survivors’ felt
highly “stressed” due to feeling overworked, under pressure, hurt by the organization, bitter and
aggressive towards management.
Increased managerial pressure may impact on employee wellbeing (Sparks, Faragher, Cooper,
2001: 501). Due to their superior position in the organization, managers and supervisors,
whether intentionally or unintentionally, may cause stress for their subordinates. Different
managers have different management styles, which may affect their subordinates. Managers
who were viewed as having an inconsiderate management style contributed to the employee’s
self-reports of increased job pressure (Buck, in Sparks, Faragher, Cooper, 2001: 501). A
bullying management style was found to play an important role when managers were under
pressure (Hoël & Cooper, in Sparks, Faragher, & Cooper, 2001: 501). They found in their
survey of over 5 000 employees, that managers were the perpetrators for nearly 75 % of
employees who reported being victims of bullying affecting their wellbeing.
When events in the workplace are perceived as stressful and are seen as taxing the capabilities
of the individual it may have dire consequences for the individual.
1.5 Consequences of stress
Some individuals are unable to cope with these stressful situations, and for the organization this
could result in high staff turnover, absenteeism, and decreased motivation. Individuals may
respond in different ways to the perceived stressors, which may be exhibited on a physical,
psychological, or behavioural level.
1.5.1 Physical consequences
On a physical level research has shown that physical health has been linked to stress
(Forshaw, 2002: 60, Luthans, 2002: 412). Luthans (2002: 412) summarizes the physical health
concerns that have been associated with stress and they include the following:
� Problems of the immune system, resulting in a lowered ability to fight off illness and
infection.
� Problems of the cardiovascular system of which blood pressure and heart disease are the
most common.
� Problems of the musculoskeletal system, such as tension and headaches.
� Problems of the gastrointestinal system, such as diarrhoea and constipation.
These physical ailments have a serious effect on the wellbeing of the individual and they impact
on the organization (Luthans, 2002: 412; Cartwright & Cooper, 1997: 2, 8). In the U.K. the
8
British Heart Foundation Coronary Prevention Group has calculated that 180 000 people die
each year from coronary heart disease, and that this disease accounts for 70 million lost
working days to industry and commerce (Cartwright & Cooper, 1997: 10). However, not all heart
disease can be linked directly to stress (Luthans, 2002: 412). Environmental conditions and the
individual’s general state of health, heredity factors, and medical history are known to contribute
to heart disease.
1.5.2 Psychological problems
Considerable research has shown that stress impacts on physical health especially within a
medical context. However, not as much attention has been given to the impact of stress on
mental health (Luthans, 2002: 413). Psychological problems resulting from stress may be as
important as they may impact on the day-to-day job performance of the employee.
Psychological problems that are associated with stress include feelings of helplessness, mood
changes, anger, depression, anxiety, nervousness, irritability, tension, and boredom (Dormann
& Zapf, 2002: 34; Moorhead & Griffin, 1989: 204; Luthans, 2002: 413; Schell, 1997: 140).
Individuals reacted to the impact of stress by exhibiting aggressive acts, such as sabotage,
interpersonal aggression, hostility, and complaints (Chen & Spector, 1992: 181). Job insecurity,
which is associated with organizational downsizing, also elicits reactions of anxiety, insecurity,
stress, and anger (Greenglas & Burke, 2001: 3). These psychological problems associated with
stress impact on job performance (McGrath in Luthans, 2002: 413), decision-making, and job
satisfaction (Greenglas & Burke, 2001: 3) amongst others.
1.5.3 Behavioural problems
Behavioural problems that are associated with stress include undereating or overeating, fatigue,
increased smoking and drinking, and drug abuse (Luthans, 2002: 414; Hogh, Borg, &
Mikkelsen, 2003: 190). Moorhead and Griffin (1989: 204) add accident proneness, and violence
to the list. Cotton (1990: 45) likens the behavioural symptoms that individual’s exhibit with the
expectations of the fight or flight response. The stressed individual may display a pattern of
either aggressive behaviour or of avoidance. The aggressive individual may strike out, or be
argumentative, stubborn, or confrontational. The individual who is prone to avoidance behaviour
may become passive, avoiding stressful situations, whether minor or important, to the extent of
becoming immobilized.
Alcohol consumption is often a way of dealing with stress leading to absenteeism and job
turnover (Luthans, 2002: 414). Chen and Spector (1992: 182) found that the most significant
reaction to work stressors was the intention to quit. Staying away from work or quitting one’s
work due to stress is a flight response to the situation, which may be a far healthier response
9
than a fight reaction, in which an individual stays on in the stressful environment and becomes
angry and/or aggressive.
1.6 Stress in South Africa
A large number of changes have occurred in South Africa which in turn has affected the
workplace in one or another way. Political changes and affirmative action (Beeld, 22 August
1997), downsizing or rightsizing of organizations (Freight & Trading Weekly, 11 June 1999),
retrenchments (Drum, February 1996) and restructuring (Marais & Schepers, 1996: 1) have all
taken place over the last decade.
Peters (Saturday Star, Dec 23, 2000) reports that bullying, work overload, and staff cuts are
among factors that have contributed to making stress one of the greatest health hazards in the
workplace. She refers to the South Africa Federation of Mental Health (Saturday Star, Dec 23,
2000) as stating “that the majority of adults spend between 50 and 80% of their waking hours at
work, and 68% of all workers will experience workplace problems severe enough to prevent
them from coping with their day-to-day duties”. A loss of about 200-million working days each
year worldwide was attributed to employees with depression. The World Health Organization
believes that “stress and depression are on the top of the list of mental health problems and that
job stress is a worldwide epidemic, and stress-related disorders are becoming the most
prevalent reason for worker disability” (Peters, Saturday Star, Dec 23 2000).
Research shows that approximately 30%–40% of South Africans suffer from high levels of
stress (Van Zyl in Van Zyl, 1998: 22) and particularly South African managers are known to
suffer from high levels of stress (Van Zyl in Spangenberg & Orpen-Lyall, 2000: 6). Sullivan (in
Van Zyl & Pietersen, 1999: 74) noted that in South Africa the effects of the world recession are
compounded by an unstable and rapidly changing social and political climate. The impact of
stress is thought to affect all levels of society, whether at individual or national level (Van Zyl &
Pietersen, 1999: 74).
Van Zyl (2002: 26) summarises a number of statistics and probable symptoms of stress, which
he believes are indicative of the high stress experienced among South Africans:
� South Africa’s divorce rate is one of the three highest in the world.
� The incidence of coronary diseases is among the five highest in the world.
� Until recently the suicide rate among the Indian community was the highest in the world.
� There are too many people in jail.
� The number of motor accidents is among the highest in the world.
� The use of drugs was among the highest in world, especially in the Western Cape.
10
Within the work situation Van Zyl (2002: 26) referring to Jacobs (in Van Zyl, 2002: 28) as well as
Levert, Lucas and Ortlepp (in Van Zyl, 2002: 28) gives the following warning signs of high levels
of stress:
� Frequent illness
� Persistent fatigue
� Irritability
� Nail-biting
� Lack of concentration
� Increased use of alcohol and drugs
� Poor interrelationships.
In the light of this information it becomes clear that South African workers experience high
levels of work stress as well as concomitant reactions and symptoms of stress. It appears that
many South African public and private companies do not realize the effect specifically chronic
stress may have on their employees (Van Zyl, 2002: 27) and it appears that very little is done by
the employers to develop their employees’ ability to deal effectively with their stress.
1.7 Conclusion
Stress has become a major issue of our time affecting the individual and the organization in
which the individual is employed. A study among 15 800 workers from 15 member states of the
European Union found that after back pain (33%), stress (28%) and fatigue (23%) ranked
second and third, respectively of the most frequently reported occupational health problems
(Paoli in Schaufeli, 2003: 1, Sutherland & Cooper, 2000: 23). It is predicted that that the amount
of stress experienced is likely to get worse (Cartwright & Cooper, 1997: 2). Increasing cross-
national mergers, increasing international competition and joint ventures between organizations
across national boundaries will result in reorganizations, relocations of personnel, redesign of
jobs, and reallocations of roles and responsibilities. Change will be accompanied by job
insecurities, corporate culture clashes and significantly different managerial styles, all of which
will lead to massive organizational change and inevitable stress. Trade agreements, the
influence of larger economic systems, for example the European Union, will result in
organizations that will impose rules and regulations in terms of labour laws, health and safety at
work, methods of production, distribution, and remuneration, which will inhibit individual control
and autonomy (Cartwright & Cooper, 1997: 3). It is predicted that the ever-increasing workload
with a decreasing workforce in a climate of rapid change and with control over the means of
production increasingly being taken over by free-trade institutions and their bureaucracies,
corporate stress is here to stay.
11
CHAPTER 2
RESEARCH PROBLEM AND PURPOSE OF STUDY
2.1 Introduction
Stress in the workplace is a worldwide phenomenon affecting the employee at all levels. In South
Africa circumstances are continually changing with political changes, affirmative action, downsizing,
mergers and acquisitions, retrenchments, lay-offs, new technology amongst others, impacting on
the individual in the workplace for example in the form of job insecurity. Other sources of stress
brought into the organizational context are issues such as personal and financial problems.
Stressors inherent in an organization, such as task demands, role demands, physical demands and
interpersonal demands, continually affect the employee.
Prior to this doctoral study the researcher having worked in industry and the public service,
personally observed the effect of job insecurity as a result downsizing, and affirmative action on
fellow employees. They spoke about their fear of possibly being retrenched or having to take on a
job that did not ensure the income that they were used to. In some cases they had to reapply for
their posts, which created a lot of uncertainty. Some did retain their old posts, others were
retrenched, and a few found alternative posts within the organization. For some that found
alternative posts in the organization it meant relocating to other parts of the country: the change
impacted on all of their family members. A few did not wait for the company to make a decision
and instead found alternative jobs outside the organization, even immigrating or starting to work for
themselves. In one of the organizations a number of staff remained in their jobs at all costs to
ensure an income. Some used to complain of stagnation and one particular individual reacted
negatively by developing migraine headaches. The general negativity affected their interactions
with colleagues, and their productivity dropped accordingly. Some individuals would come to work
late and they used to leave early, something they did not do prior to the restructuring of the
organization. Other possible causes of stress that the author experienced or witnessed were long
working hours on the pilot plant resulting in fatigue and loss of concentration, working towards
deadlines, and staying within the confines of the budget.
2.2 Research problem
In the light of the introductory remarks above, the questions that arose in the mind of the researcher
was “Which major stressors were impacting on these individuals?” “Were they to be found within or
outside the organization?” “How did they react to these stressful situations?” Based on these
12
questions the underlying research problem could be divided into two major areas, namely causes
and consequences of stress in the workplace.
2.2.1 Causes of stress
Possible causes of work-related stress amongst employees, specifically senior management,
middle management, and specialist staff (specialists in their field), working in organizations are
related to extraorganizational stressors as well as stressors inherent in the organization.
Extraorganizational stressors refer to factors such as affirmative action, downsizing, retrenchments,
restructuring, technological changes, and job sharing. Other factors include personal and financial
problems. Stressors inherent in the organization, refers to factors such as the functioning of the
organization, task characteristics, physical working conditions, equipment, career matters and
social issues. Van Zyl (in Van Zyl, 2002: 26) found in an investigation in South Africa that 34.7% of
Coloureds, 38.1% of Whites and Asians, and 35% of Black South Africans experienced high levels
of stress. An investigation into the sources of job satisfaction and work stress amongst middle
management in South Africa found that the main sources of work stress were work demands and
expectations, working conditions, subordinates, interpersonal relationships, person responsibility,
and working hours (Strydom & Meyer, 2002: 19).
The current economic situation in the country, new legislation, for example the Employment Equity
Act, affirmative action and the quota system are all placing increasing demands on South Africans,
both inside and outside of the work situation leading to high levels of stress (Van Zyl, 2002: 26).
For some these changes have lead to the fear of retrenchment and lower income. The main
concern that was reported to a suicide prevention centre in the past was relationship problems.
However this has changed to issues related to the lack of money, for example losing one’s home or
car by repossession (Van Zyl, 1997: 138). High levels of stress are carried over to the non-work
environment such as to other people the individual interacts with, for example the spouse and
children (Kruger in Van Zyl, 2002: 26). Stress experienced outside the work environment can again
impact on the work situation.
The problem of stress and the related health problems impact on the direct and indirect costs of the
organization. One way of addressing this problem is to report research findings reflecting the
present situation affecting the employees in the workplace. The findings may then be used to make
organizations aware of the problem and allow for the development of an effective stress
management strategy.
13
2.2.2 Consequences of stress
Individuals in the workplace may respond in different ways to both the extraorganizational and
inherent stressors in the organization. This may manifest itself on a physical, psychological, and/or
behavioural level. On a physical level it could manifest for example as hypertension, on a
psychological level as anger, depression, anxiety and worry, and/ or on a behavioural level smoking
and drinking, sleeplessness, overeating or undernourishment, and aggression. Van Zyl (1993: 37)
found that a group of black South African high-level employees reported that they experienced
passivity, uncertainty, and loneliness when subjected to high levels of stress. Research conducted
with a group of lower level black and white employees involved in manual tasks showed that these
black employees were inclined to lack self-confidence, to be dependant on others, to be passive, to
feel uncertain, to be dissatisfied, frustrated, and to feel helpless (Van Zyl, 1996: 129). The white
counterparts on the other hand, had higher scores on overload and tended to worry much more.
However, it is not always easy to detect the symptoms of high levels of stress, as employees tend
to hide these to protect their reputations and to appear as if nothing is happening (McGarvey in Van
Zyl, 2002: 28).
However not everybody is unable to cope with stressful situations, some individuals seem to thrive
under stress. A number of factors moderate the impact that various sources of stress have on the
individual. These factors include job experience, social support, locus of control, learned
helplessness, and problem solving ability amongst others. Spangenberg and Orpen (2000: 8)
investigated the relationship between stress and coping strategies and found that an avoidant
coping strategy probably contributed to an increase in stress levels amongst a group of managers.
No other literature reporting on coping with stress in the workplace in the South African context with
respect to management could be found.
In the light of this it is important to investigate not only the causes of stress but also the
consequences of stress. Van Zyl (2002: 30) echo’s this sentiment and states that ‘a system of
stress measurement and management – at all levels – is not a luxury in South Africa, or something
“nice” to do for humanistic reasons. It is a matter of physical, psychological, economic, and social
survival. Stress measurement in particular, can help to address the real problems in a preventative
manner.’
2.3 Aim of the study
The study aims to determine the level and causes of stress that subjects experience in the
workplace. These may both be extraorganizational and those inherent in the organization.
14
Furthermore the stressors and demands that contribute to the individual’s experience of stress are
expected to impact the individual both on a psychological, physiological, and behavioural level. A
further aim of the study is to focus on specific psychological and behavioural consequences the
experience of stress may lead to. At a psychological level the aim is to measure the levels of
anxiety, depression, and worry. At a behavioural level the aim of the research will be to ascertain
the extent of workplace aggression. However these consequences are dependant on the ability
inability of the employee to deal with the demand and stressors inside and outside the workplace.
Thus the third aim of the research is to determine how effective or ineffective the subjects cope with
the demands or stressors they have to deal with in terms of social problem solving.
Very little research is available on the consequences of work stress with respect to anxiety and
depression in South Africa. No research could be found within the South African context on the
impact stress has on aggression in the workplace, worry, and on social problem solving as a way of
coping with stress.
As circumstances in South Africa are continually changing it is believed that is essential to not only
to determine the causes but also to continue studying the impact stress has on the wellbeing of the
individual in the workplace. Management is prone to excessively high levels of stress due to
overloading because they are regularly promoted to position levels, which their American and
European counterparts only reach at a later stage (Van Zyl, 1997: 138). A further aim therefore was
to focus on senior management, middle management, and on specialist staff where specialist staff
refers to specialists in their specific work areas.
2.4 Research objectives
The objective of the research is to determine the individual’s experience of stress in terms of
normal, high, or very high. The causes of the stress as experienced by the employees, whether
within or outside the organisation, will also be determined. Outside the organisation this includes
factors such as the political, and social changes that have and are continuing to take place in South
Africa, as well as technological changes, personal and financial problems. Within the organisation
these include organisational functioning, task characteristics, physical working conditions and job
equipment, career opportunities, social matters, and remuneration, fringe benefits and personnel
policy of the organisation. To achieve this, the Experience of Work and Life Circumstances
Questionnaire will be used. With regard to the impact of stress in terms of the specific
psychological consequences, specifically depression, anxiety and worry, and behavioural
consequences, specifically aggression as it manifests itself in the workplace the Aggression in the
15
Workplace Questionnaire, the IPAT Anxiety Inventory, the Beck Depression Inventory and the Penn
State Worry Questionnaire will be employed. The extent to which and individual is able to cope
effectively or for that matter ineffectively with experienced stress, will be assessed by employing the
Social Problem Solving Inventory-Revised.
The aim was to determine the causes of stress arising outside and originating within the work
situation, the impact that these stressors had on the individual’s experience of stress, the individual
consequences in terms of workplace aggression, worry, anxiety and depression as well as the
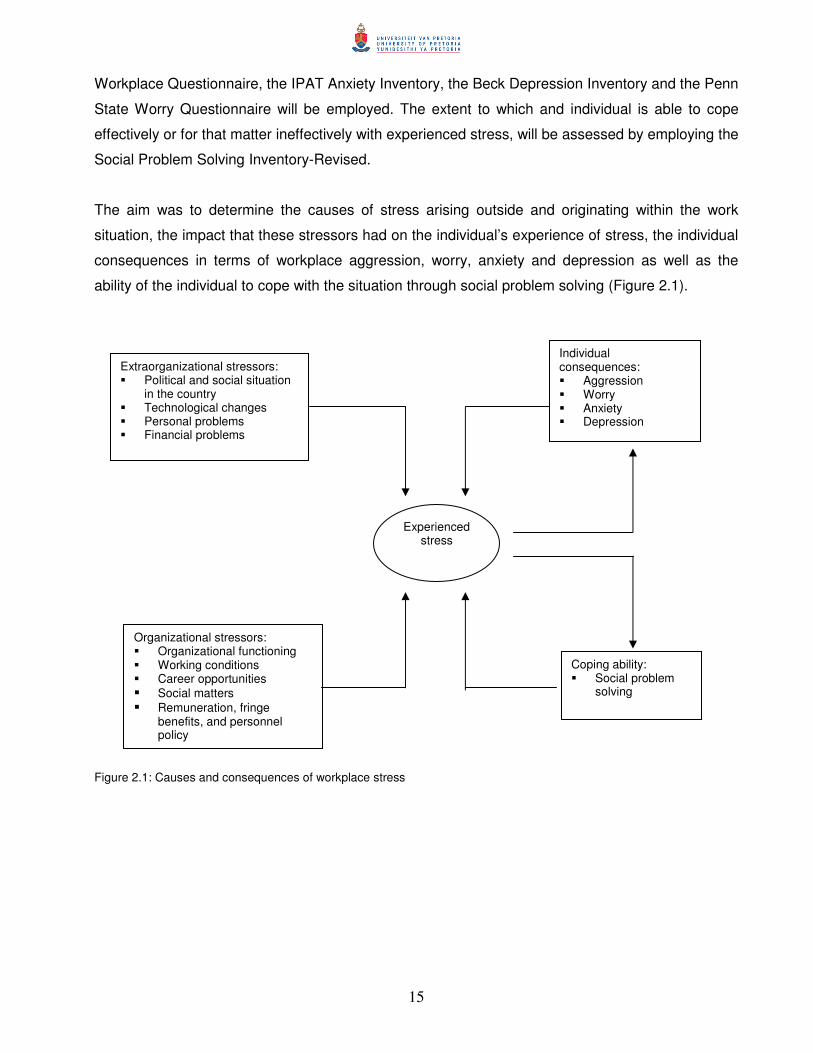
ability of the individual to cope with the situation through social problem solving (Figure 2.1).
Figure 2.1: Causes and consequences of workplace stress
Extraorganizational stressors: � Political and social situation
in the country � Technological changes � Personal problems � Financial problems
Experienced stress
Individual consequences: � Aggression � Worry � Anxiety � Depression
Coping ability: � Social problem
solving
Organizational stressors: � Organizational functioning � Working conditions � Career opportunities � Social matters � Remuneration, fringe
benefits, and personnel policy
16
CHAPTER 3
STRESS IN THE WORKPLACE 3.1 Introduction
Stress is a natural part of everyday living. Individuals experience varying levels of stress in and
outside the workplace. In the workplace stress results in lost productivity due to absenteeism, work
related accidents, stress claims, a demotivated work force, sabotage and even bankruptcy (Schell,
1997: 5). Schell (1997:4) reports that in Japan 60% of the approximately 120 million adults
employed claim to be adversely affected by excessive job stress. The collective cost of stress to
U.S. organizations for absenteeism, reduced productivity, compensation claims, health insurance,
and direct medical expenses has been estimated at approximately $150 billion per year in the
1980‘s (Karasek & Theorell in Cartwright & Cooper, 1997: 2).
In the United Kingdom, stress-related absences were 10 times more costly than all other industrial
relations disputes put together. In terms of sickness, absence and premature death or retirement
due to alcoholism, stress costs the U.K. economy a staggering £2 billion per annum. Heart disease,
the single biggest killer, is estimated by the British Heart Foundation to cost an average U.K.
company of 10 000 employees 73 000 lost working days each year; additional costs include the
annual death of 42 employees between 35 and 64 years of age and lost value in products or
services of more than £2.5 million. Of all absence for sickness in the United Kingdom, 21% was
due to stress-related heart disease. Similarly, in Norway, the economic costs of work-related
sickness and accidents amount to more than 10% of the gross national product (GNP) (Lunde-
Jensen, in Cartwright and Cooper, 1997: 2).
3.2 Models of stress
A number of different approaches to the conceptualisation of stress can be found of which the
response-based or medico-physiological approach, the stimulus-based or engineering approach,
the more psychological-based approach exemplified by transactional, and cybernetic theories of
stress are relevant to the conceptualisation and definition of stress (Cox, 1978:3; Cox & Mackay,
1981: 94; Cummings & Cooper, 1998: 101).
3.2.1 Response-based model
The response-based approach regards stress as a response or a pattern and is treated as a
dependant variable (Cox, 1978: 3; Cox & Mackay, 1981: 94; Sutherland & Cooper, 1990: 11). The
study of stress tends to be concerned with the response of an individual when the individual is

17
exposed to an environmental stimulus or demand. The focus of the model is the manifestation of
stress.
The response-based approach to stress is exemplified in the writing of Hans Selye who was one of
the first researchers to attempt to explain the process of stress-related illness in terms of the
general adaptation syndrome (GAS) (Cox & Mackay, 1981: 94; Cartwright & Cooper, 2002: 48).
The response-based model of stress is represented schematically below (Figure 3.1).
ENVIRONMENT PERSON
psychological
stressor agents stress response physiological
behavioural
STIMULUS RESPONSE
Figure 3.1: A response model of stress (Sutherland & Cooper, 2000: 47)
3.2.2 The general adaptation syndrome
Endocrinologist Hans Selye, widely considered the father of stress research, during his search for a
new sex hormone discovered that a wide range of stimuli, such as exposure to temperature
extremes, physical injury, or injection of toxic substances resulted in tissue damage in laboratory
rats (Selye, in Schell, 1997: 131; Wainwright & Calnan, 2002: 38). He found that the cortex of the
adrenal gland became enlarged; the thymus and lymphatic structures in turn became involuted; and
deep-bleeding ulcers developed in the stomach and intestines.
He called this non-specific response to harmful stimuli the general adaptation syndrome (GAS).
About a decade later he introduced the term “stress” in his writings. In 1910, Sir William Osler
investigated the connection between stress and strain-causing disease when he found a
relationship between angina pectoris and a hectic pace of life (Hinkle in Cartwright & Cooper, 1997:
4). In the early 1900s Cannon (in Quick et al, 1997: 6; Wainwright & Calnan, 2002: 35) had
described an emergency reaction exhibited by an organism when it was confronted with a threat or
danger. This reaction prepares the organism to respond to a threat by either facing it (fighting) or by
avoiding it (fleeing). The reaction has become known as the “fight or flight” response. This response
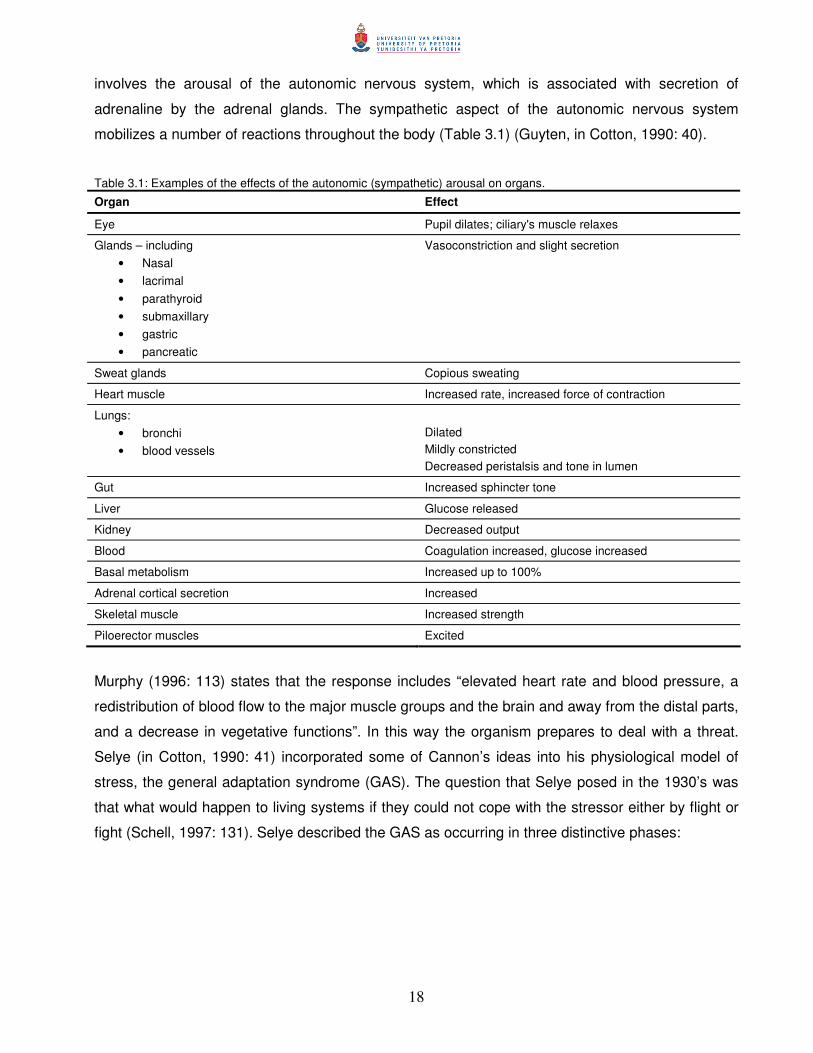
18
involves the arousal of the autonomic nervous system, which is associated with secretion of
adrenaline by the adrenal glands. The sympathetic aspect of the autonomic nervous system
mobilizes a number of reactions throughout the body (Table 3.1) (Guyten, in Cotton, 1990: 40).
Table 3.1: Examples of the effects of the autonomic (sympathetic) arousal on organs.
Organ Effect
Eye Pupil dilates; ciliary's muscle relaxes
Glands – including • Nasal • lacrimal • parathyroid • submaxillary • gastric • pancreatic
Vasoconstriction and slight secretion
Sweat glands Copious sweating
Heart muscle Increased rate, increased force of contraction
Lungs: • bronchi • blood vessels
Dilated Mildly constricted Decreased peristalsis and tone in lumen
Gut Increased sphincter tone
Liver Glucose released
Kidney Decreased output
Blood Coagulation increased, glucose increased
Basal metabolism Increased up to 100%
Adrenal cortical secretion Increased
Skeletal muscle Increased strength
Piloerector muscles Excited
Murphy (1996: 113) states that the response includes “elevated heart rate and blood pressure, a
redistribution of blood flow to the major muscle groups and the brain and away from the distal parts,
and a decrease in vegetative functions”. In this way the organism prepares to deal with a threat.
Selye (in Cotton, 1990: 41) incorporated some of Cannon’s ideas into his physiological model of
stress, the general adaptation syndrome (GAS). The question that Selye posed in the 1930’s was
that what would happen to living systems if they could not cope with the stressor either by flight or
fight (Schell, 1997: 131). Selye described the GAS as occurring in three distinctive phases:
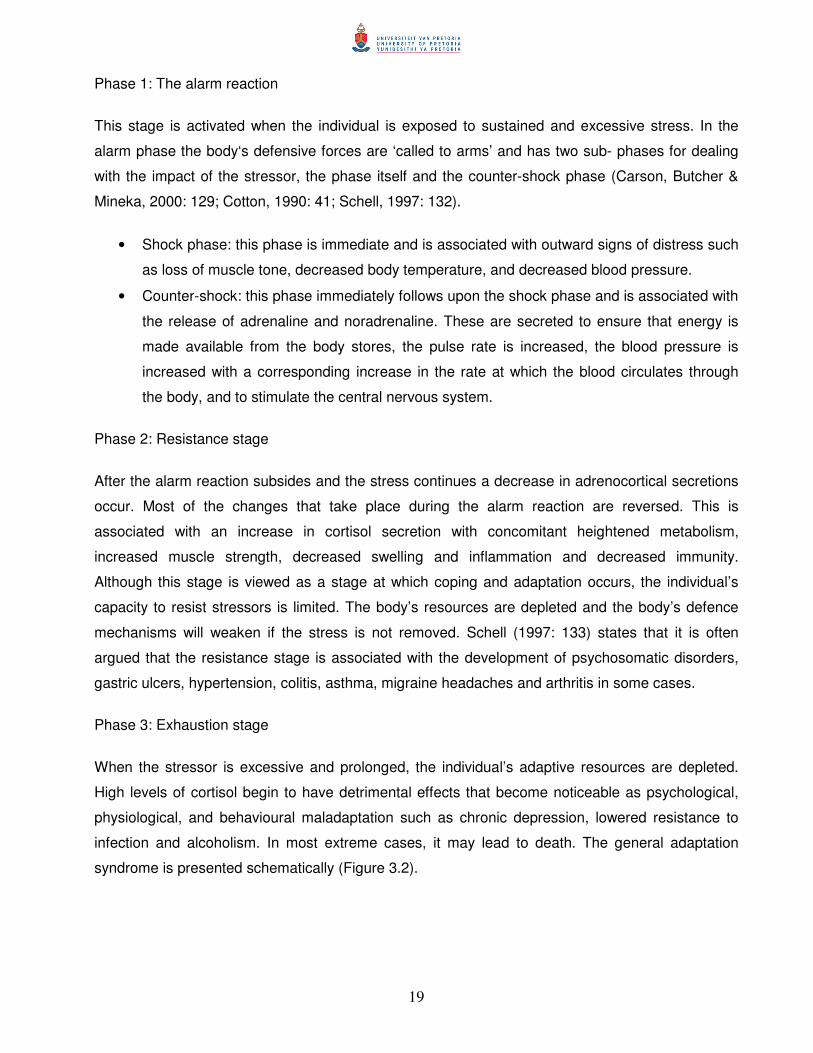
19
Phase 1: The alarm reaction
This stage is activated when the individual is exposed to sustained and excessive stress. In the
alarm phase the body‘s defensive forces are ‘called to arms’ and has two sub- phases for dealing
with the impact of the stressor, the phase itself and the counter-shock phase (Carson, Butcher &
Mineka, 2000: 129; Cotton, 1990: 41; Schell, 1997: 132).
• Shock phase: this phase is immediate and is associated with outward signs of distress such
as loss of muscle tone, decreased body temperature, and decreased blood pressure.
• Counter-shock: this phase immediately follows upon the shock phase and is associated with
the release of adrenaline and noradrenaline. These are secreted to ensure that energy is
made available from the body stores, the pulse rate is increased, the blood pressure is
increased with a corresponding increase in the rate at which the blood circulates through
the body, and to stimulate the central nervous system.
Phase 2: Resistance stage
After the alarm reaction subsides and the stress continues a decrease in adrenocortical secretions
occur. Most of the changes that take place during the alarm reaction are reversed. This is
associated with an increase in cortisol secretion with concomitant heightened metabolism,
increased muscle strength, decreased swelling and inflammation and decreased immunity.
Although this stage is viewed as a stage at which coping and adaptation occurs, the individual’s
capacity to resist stressors is limited. The body’s resources are depleted and the body’s defence
mechanisms will weaken if the stress is not removed. Schell (1997: 133) states that it is often
argued that the resistance stage is associated with the development of psychosomatic disorders,
gastric ulcers, hypertension, colitis, asthma, migraine headaches and arthritis in some cases.
Phase 3: Exhaustion stage
When the stressor is excessive and prolonged, the individual’s adaptive resources are depleted.
High levels of cortisol begin to have detrimental effects that become noticeable as psychological,
physiological, and behavioural maladaptation such as chronic depression, lowered resistance to
infection and alcoholism. In most extreme cases, it may lead to death. The general adaptation
syndrome is presented schematically (Figure 3.2).
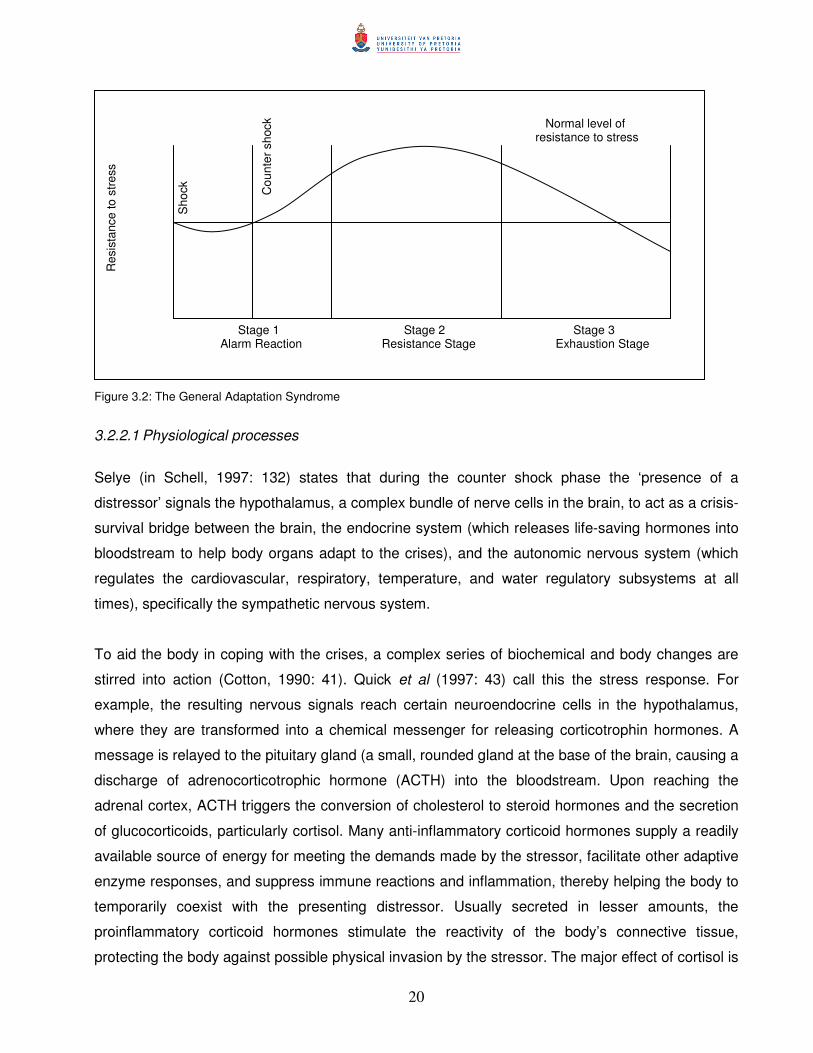
20
Normal level of resistance to stress
Stage 1 Stage 2 Stage 3 Alarm Reaction Resistance Stage Exhaustion Stage
Figure 3.2: The General Adaptation Syndrome
3.2.2.1 Physiological processes
Selye (in Schell, 1997: 132) states that during the counter shock phase the ‘presence of a
distressor’ signals the hypothalamus, a complex bundle of nerve cells in the brain, to act as a crisis-
survival bridge between the brain, the endocrine system (which releases life-saving hormones into
bloodstream to help body organs adapt to the crises), and the autonomic nervous system (which
regulates the cardiovascular, respiratory, temperature, and water regulatory subsystems at all
times), specifically the sympathetic nervous system.
To aid the body in coping with the crises, a complex series of biochemical and body changes are
stirred into action (Cotton, 1990: 41). Quick et al (1997: 43) call this the stress response. For
example, the resulting nervous signals reach certain neuroendocrine cells in the hypothalamus,
where they are transformed into a chemical messenger for releasing corticotrophin hormones. A
message is relayed to the pituitary gland (a small, rounded gland at the base of the brain, causing a
discharge of adrenocorticotrophic hormone (ACTH) into the bloodstream. Upon reaching the
adrenal cortex, ACTH triggers the conversion of cholesterol to steroid hormones and the secretion
of glucocorticoids, particularly cortisol. Many anti-inflammatory corticoid hormones supply a readily
available source of energy for meeting the demands made by the stressor, facilitate other adaptive
enzyme responses, and suppress immune reactions and inflammation, thereby helping the body to
temporarily coexist with the presenting distressor. Usually secreted in lesser amounts, the
proinflammatory corticoid hormones stimulate the reactivity of the body’s connective tissue,
protecting the body against possible physical invasion by the stressor. The major effect of cortisol is
Cou
nter
sho
ck
Res
ista
nce
to s
tress
Sho
ck

21
to increase the supply of glucose and fatty acids in the bloodstream by stimulating the liver to
release glucose and fat cells to release fatty acids.
Several short-loop and long-loop biofeedback mechanisms existing within the body continually
monitor the existing levels of hormones and compare these levels to those required for adaptation.
If it finds that there is abundance of for example ACTH, a short-loop feedback mechanism returns
some of it to the hypothalamus-pituitary axis, which stops further ACTH production. Parallel to
these processes, the catecholamines, primarily adrenaline and noradrenaline, are liberated as
another means of adaptation. Catecholamine release has a direct, activating effect on the central
nervous system particularly the reticular activating system (RAS). This leads to an increase in
alertness through sharpening of the sensory processes.
Selye (in Schell, 1997: 135) recognized that stressors affect individuals differently. The ways in
which individuals respond to these stressors depend upon many endogenous factors, such as
genetic and hereditary predispositions, gender, age, and early childhood conditioning and
patterning. Exogenous factors such as food intake, physical environment, health and safety also
play a role in determining which system, whether respiratory, cardiovascular, mental for example,
may be affected. Henry and Stephens (in Schell, 1997: 135) showed that the perceived inability of
the individual to control the stressor/s caused the human system to move into the resistance phase.
Animal research studies that they did, indicated that when living systems could control the
environment and the stressor found in it, they showed increased activity, showing aggression with
activation of the adrenergic system. However when they could not exert control, they showed a
withdrawal response, with activation of the adrenocortical hormones. Critics of Selye’s research say
it ignores both the psychological impact of stress on an individual and the individual’s ability to
recognize stress and act in various ways to change his or her situation (Cartwright & Cooper, 1997:
4).
3.2.3 Stimulus-based model
The stimulus approach views stress as an independent variable whereas the response-based
approach does not. Thus the stimulus characteristics of the environment are considered as
disturbing or disruptive in some way (Cox, 1978: 12; Cox & Mackay, 1981: 97; Sutherland &
Cooper, 1990: 15).
This model is essentially an engineering one incorporating Hooke’s Law of Elasticity from physics.
Hooke’s Law states that a load or a demand (the stress), which is exerted on the metal, causes a
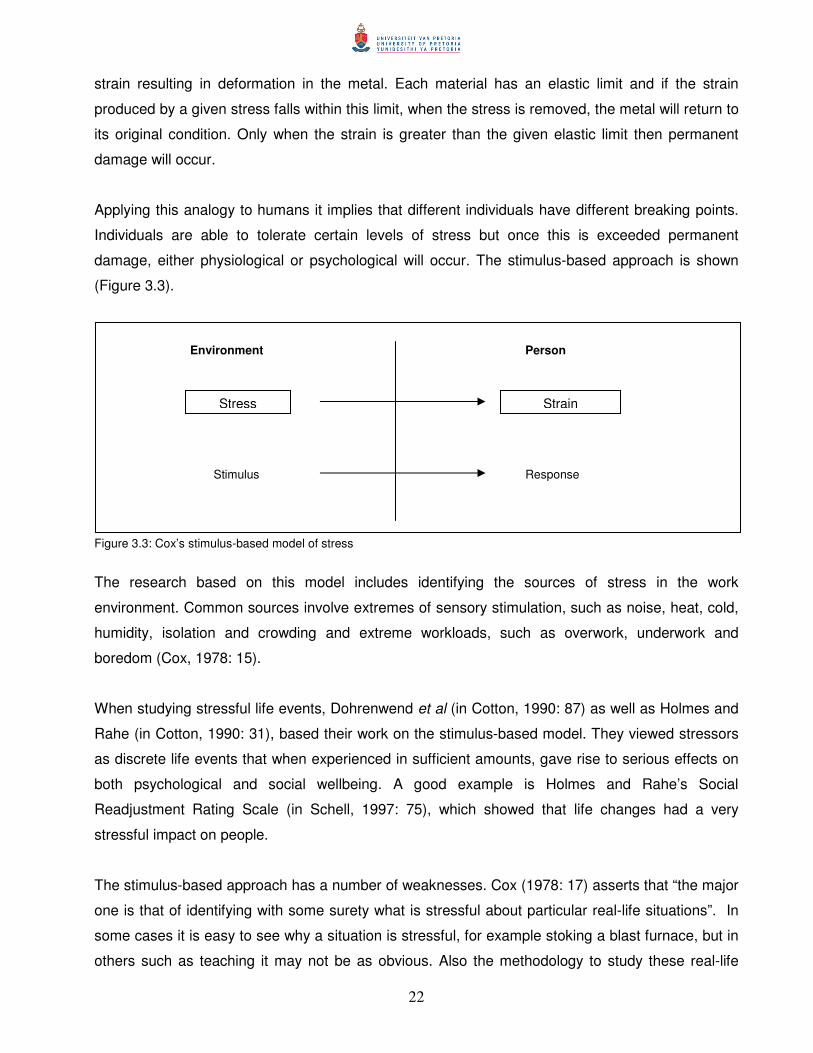
22
strain resulting in deformation in the metal. Each material has an elastic limit and if the strain
produced by a given stress falls within this limit, when the stress is removed, the metal will return to
its original condition. Only when the strain is greater than the given elastic limit then permanent
damage will occur.
Applying this analogy to humans it implies that different individuals have different breaking points.
Individuals are able to tolerate certain levels of stress but once this is exceeded permanent
damage, either physiological or psychological will occur. The stimulus-based approach is shown
(Figure 3.3).
Environment Person
Stimulus Response Figure 3.3: Cox’s stimulus-based model of stress
The research based on this model includes identifying the sources of stress in the work
environment. Common sources involve extremes of sensory stimulation, such as noise, heat, cold,
humidity, isolation and crowding and extreme workloads, such as overwork, underwork and
boredom (Cox, 1978: 15).
When studying stressful life events, Dohrenwend et al (in Cotton, 1990: 87) as well as Holmes and
Rahe (in Cotton, 1990: 31), based their work on the stimulus-based model. They viewed stressors
as discrete life events that when experienced in sufficient amounts, gave rise to serious effects on
both psychological and social wellbeing. A good example is Holmes and Rahe’s Social
Readjustment Rating Scale (in Schell, 1997: 75), which showed that life changes had a very
stressful impact on people.
The stimulus-based approach has a number of weaknesses. Cox (1978: 17) asserts that “the major
one is that of identifying with some surety what is stressful about particular real-life situations”. In
some cases it is easy to see why a situation is stressful, for example stoking a blast furnace, but in
others such as teaching it may not be as obvious. Also the methodology to study these real-life
Stress Strain
23
situations, for example the first case is relatively easy, but in other cases such as the second
example, is doubtful as it often is based on retrospective verbal reports, which is often inaccurate.
Also a real-life situation may be viewed as stressful by some and not by others.
3.2.4 Psychological-based approaches
The psychological models of stress emphasize the role of perceptual and cognitive characteristics,
which are important in explaining individual differences regarding their response to stress (Cox &
MacKay, 1981: 99). A psychological model of stress is given (Figure 3.4).
Figure 3.4: A psychological model of stress with the emphasis on perceptual and cognitive processes (Cox & MacKay, 1981: 99)
The transactional (Cox & MacKay, 1981: 101) and cybernetic models of stress (Cummings &
Cooper, 1998: 101) further exemplify the psychological-based approaches to stress.
3.2.4.1 Transactional models of stress
Two variations of the transactional models of stress will be discussed, namely Lazarus’s and Cox’s
models. Cox and MacKay’s transactional model is used as the framework by the developers of the
Experience of Work and Life Circumstances Questionnaire.
1) Lazarus’s transactional model of stress
Lazarus (in Cox & MacKay, 1981: 99; Cummings & Cooper, 1998: 105) has developed an
important psychological model of stress in which he suggests that ‘stress occurs when there are
demands on the person that tax or exceed his adjustment resources’. Thus if the individual views
the situation as stressful it is due to his or her cognitive appraisal of the environment.
Threat Perceptual factors
Cognitive appraisal
Coping strategies
24
The objective characteristics of the situation are not considered. Lazarus and Folkman (1984: 53)
have identified three kinds of cognitive appraisal: primary, secondary, and reappraisal where
primary appraisal consists of the judgment that an encounter is irrelevant, benign-positive, or
stressful, secondary appraisal refers to a judgment concerning what might and can be done and
reappraisal is when the appraisal is changed based on new information from the environment
and/or the person. Stress is not induced but is viewed as a process between the individual and his
or her environment in which threat and coping play a role. Questions that a person may ask are
such as “What choices do I have?”; “Can I implement a particular option?”; and “Will it work?”
(Wainwright & Calnan, 2002: 61). The process of appraisal explains why some individuals are able
to cope or even thrive under stressful conditions, whereas others won’t.
2) Cox and MacKay’s transactional model of stress
Cox and MacKay (Cox, 1978: 18; Cox & MacKay, 1981: 101) have outlined another important
psychological model of stress in which they define stress as an individual phenomenon and the
‘result of a transaction between the person and his situation’. Cox uses the word transaction to
‘emphasize the active and adaptive nature of the process’. Thus stress is described as ‘part of a
complex and dynamic system of transactions between the person and his environment’ (Cox, 1978:
18).
This model includes both the response-and stimulus-based definitions of stress and emphasizes
that stress is ‘an individual perceptual phenomenon rooted in psychological processes’ (Cox,
1978:18). Emphasis is also placed on the feedback aspects implying that the system is cyclical
rather than linear. The system consists of five stages.
Cox (1978: 19) describes the first stage as representing ‘the sources of demand relating to the
person’ and it forms part of the individual’s environment. These demands are either external,
derived from the environment, or internal in the form of psychological and physiological needs, the
fulfilment of which determines the individual’s behaviour.
The second stage consists of the individual’s perception of the demands and his or her ability to
cope with the demand. Cox (1978: 18) states that ‘stress may be said to arise when there is an
imbalance between the perceived demand and the person’s perception of his capability to meet the
demand’. It is important to realize that the important balance or imbalance is between the perceived
demand and the individual’s perceived capability and not between the demand and the individual’s
actual capability. The individual’s cognitive appraisal of the potentially stressful situation and his or

25
her capability to cope is important here. When a high demand is made on an individual, he or she
will not experience stress until he or she has reached his or her limitations. At this point the
individual realizes he or she cannot cope anymore and then experiences stress due to the
recognition of his or her limitations and the imbalance between the demand and capability. This
imbalance will be experienced on a subjective or emotional level coupled with changes on a
physiological level as well as cognitive and behavioural attempts to ‘reduce the stressful nature of
the demand’ (Cox, 1978: 20). The third stage is associated with the psychophysiological stages,
which correspond to the response to stress. Cox (1978: 20) feels that ‘these responses are
sometimes thought of as the end point of the stress process’ and ‘should be regarded as methods
of coping available to the person’. The fourth stage which Cox (1978: 20) feels is frequently ignored
and is ‘concerned with the consequences of the coping responses’, whether actual or perceived.
The fifth and last stage of the model revolves around feedback and is found to occur at all of the
other stages determining the outcome at each of the stages.
Cox (1978: 20) states that ‘inappropriate and ineffective response strategies will invariably prolong
or even increase the experience of stress’. If inappropriate coping occurs at this point it can result in
further physiological and psychological damage. This model, according to Cox (1978: 20), ‘treats
stress as an intervening variable, the reflection of a transaction between the person and his
environment’ and ‘it is part of a dynamic cybernetic system’.
3.2.4.2 Cybernetic theory of organizational stress
Cummings and Cooper (1998: 101) present a cybernetic theory of stress derived from the
framework and concepts of cybernetics or systems control. They state that ‘the basic premise of
this theory is that behaviour is directed at reducing deviations from a specific goal-state’. They use
Miller’s application of cybernetics to living systems, which explains how living systems, whether
plants or animals, maintain themselves in steady states or homeostasis (Cummings & Cooper,
1998: 102). Homeostasis is maintained by keeping a variety of variables in balance such as those
that have to do with the import, transformation, and export of matter/energy and information. When
homeostasis is disrupted from either inside or outside the system by forces, they are counteracted
so as to restore the original balance.
Stress as well as threat incorporates environmental factors affecting the individual, the resultant
effects, and the individual’s reactions (Appley & Turnbull, in Cummings & Cooper, 1998: 104). The
environmental factors refer to those factors that impact the individual’s normal functioning.
Cummings and Cooper (1998: 104) feel that stress ‘signifies those external factors that are
26
currently affecting the person’, while threat in turn ‘represents those conditions that the individual
perceives are likely to affect him or her in the future’. The example they give is when ‘a person’s
present employment status may not affect his or her behaviour adversely; yet the rumour that
company downsizing is likely to occur and may result in job loss’ which can be stressful.
The immediate effects or disruption is seen as a strain within the individual and his or her attempt to
reduce it is termed the individuals adjustment process. Strain includes indicators such as rapid
pulse rate or job dissatisfaction, whereas adjustment processes include behaviours such as
smoking, excessive drinking or long-term effects of ineffective coping such as raised blood
pressure or high cholesterol levels. Stress or threat can be viewed as the independent variable,
strain as the intervening variable and the adjustment process as the dependant variable.
Cummings and Cooper (1998: 104) state that cybernetic theory allows stress to be depicted as an
information-feedback cycle. This process or stress cycle has four distinct phases, the detection of
strain, choice of adjustment processes, implementation of adjustment processes, and affects of
adjustment processes on the stress or threat situation.
3.3 Main causes and sources of workplace stress
There are a number of approaches to discussing the main causes and sources of workplace stress
(Luthans, 2002: 397; Cartwright & Cooper, 1997: 13; Quick et al, 1997: 21). The categories most
often alluded to include extraorganizational stressors, organizational stressors, group stressors,
and individual stressors (Luthans, 2002: 397)
3.3.1 Extraorganizational causes and sources of stress
Luthans (2002: 398) feels that people often ignore the important role, which factors outside the
organization can play in workplace stress. When the organization is viewed as an open system,
then it can be expected that forces outside of the organization will contribute towards workplace
stress, affecting individuals inside the organization. These are societal/technological change,
globalisation, the family, relocation, life changes, and race, sex, and social class (Luthans, 2002:
398).
3.3.1.1 Rate of social and technological change
The rate at which social and technological change is taking place all over the world, has and is
having a great impact on the way people live, which in turn has an impact on their work (Luthans,
2002: 398). Political change and the introduction of affirmative action programmes affect the
27
individual in the workplace increasing their levels of reported stress (Van Zyl, 1998: 24). The fast
pace of modern living has ‘increased stress and decreased personal wellness’ where wellness
refers to ‘a harmonious and productive balance of physical, mental, and social wellbeing brought
about by the acceptance of one’s personal responsibility for developing and adhering to a health
promotion program’ (Reiter, in Luthans, 2002: 398). Due to the ‘rat-race’ and the fast pace of life,
wellness has deteriorated and the potential for stress occurring in the workplace has increased.
3.3.1.2 Family
An individual’s family situation, which can include crises such as a squabble or illness of a family
member or a strained relationship with the spouse or one or more of the children, has the capacity
to generate stress for employees (Luthans, 2002: 398). Employees may find it increasingly difficult
to balance work and family due to longer working hours and late-night shifts (Atkinson, 1999: 57)
thus putting more strain on work-family relationships (Carlson & Perrewé, 1999: 521; Sutherland &
Cooper, 2000: 105). In firms with strong work performance norms conflict due to family-work
demands led to job stress (Hammer et al, 2004: 89). The co-ordination of work and vacation
schedules, and the search for child and elder care has become prominent and highly stressful
(DeFrank & Ivancevich, 1998: 57). Dual-career couples may experience stress due to conflict with
society’s expectations concerning family roles resulting in feelings of guilt (Cartwright & Cooper,
1997: 148). Social support plays an important role in moderating the effects of time demands and
role stressors in both the family and work domain reducing the level of work-family conflict (Carlson
& Perrewé, 1999: 528).
Other factors that contribute to the employee’s experience of stress due to the family situation
include life changes such as a divorce, the general economic situation in the country, facilities at
home, social situations, and status, amongst others.
3.3.1.3 Relocation
Relocation of the family due to a transfer or a promotion can lead to stress (Cartwright & Cooper,
1997: 153; Luthans, 2002: 398). The labour force is becoming more mobile, which is particularly the
case for managers and other professionals (Cartwright & Cooper, 1997: 15). It is estimated that
managers in the U.K. change jobs about once every three years. Moving can be traumatic and
stressful because the individual has to give up his or her job, family, and outside activities. Further
the age, qualifications, job skills, and the personality of the individual influences the way the move
is viewed and interpreted. According to the U.S. Department of Labor, the ‘typical American family’
consisting of a working husband, a homemaker wife, and an average of two children, represents

28
only 7% of the families in the U.S.A. In Britain, nearly 65% of all women work, mostly full-time
(Cartwright & Cooper, 1997: 21). Not only do dual-career families affect women but also men, as
part of their career, are expected to be mobile and move to different localities, whether within their
country or abroad. If the man was the sole breadwinner, this may have occurred more easily. Now,
such a decision will create problems for both working members of the family (Cartwright & Cooper,
1997: 22). Expatriate managers may experience a culture shock when assigned to a foreign
country for a specific length of time and when they return to their home country after their contract
has expired they may experience isolation, both significant sources of stress (Sanchez, Spector, &
Cooper, 2000: 103).
3.3.1.4 Life changes
Changes that an individual may experience over the life span may be slow such as getting older or
may be sudden such as the death of a spouse (Luthans, 2002: 398). Age is something that creeps
up on a person and suddenly he or she becomes aware that ‘old’ is no longer a label that applies to
others but now applies to him or herself (Cartwright and Cooper, 1997: 64). Certain life events
remind one of one’s own mortality such as the loss of one’s parents, the death of a member of
one’s peer group or the birth of a grandchild.
Cartwright and Cooper (1997: 65) state that ‘the most vulnerable group are executives in their late
40s and 50s, who are likely to be abusing alcohol and coping with alienated children, aging parents,
and extensive financial commitments’. There is a definite correlation between the extent of these
life changes and the quality of the individual’s health (Rahe & Holmes, in Cotton, 1990: 32). The
greater the number of life changes, the greater the risk of illness or accident attributable to stress
becomes, which in turn may impact on the work situation. Divorce is one life change that interferes
with work more than any other life change, especially in the first three months after the one spouse
has left the other (Crosby, in Luthans, 2002: 398).
3.3.1.5 Race, sex, and social class
Sometimes minority groups may experience more stressors than majority groups (Luthans, 2002:
398). Stress-inducing issues include differences in beliefs and values, differences in opportunities
with regard to rewards and promotions, and perceptions by minority employees that they are being
discriminated against or lack of fit between them and the organization (Schneider & Northcraft,
1999: 1451). Individuals are likely to avoid contact with others they perceive as different (Brewer,
in Schneider & Northcraft, 1999: 1452). Those that do not fit in become alienated and may decide
to leave.
29
Affirmative action may cause high level of stress when individuals are promoted to high level
positions when they have not been adequately trained for these positions (Moerdyk in Van Zyl,
1998: 22).
A review of 19 studies showed that women seem to experience more psychological distress than
men, whereas men are more susceptible to severe physical illness (Jick & Mitz, 1985: 418).
Professional women experience stressors similar to those of men, such as role, job and
environmental demands (for example physical setting), interpersonal demands (relationships with
superiors), and extraorganizational demands (e.g., relationships with spouse and children). Unique
stressors specific to professional women include discrimination, stereotyping, conflicting demands
of both marriage and family with work and career, as well as social isolation (Nelson & Quick, 1985:
207).
Social class is recognized as playing a large part in shaping individual’s health behaviours including
stress (Chin, Monroe, & Fiscella, 2000: 318). Behavioural risk factors such as smoking, high fat
diet, inadequate physical activity, drug and alcohol use, and unsafe sexual behaviour are strongly
associated with lower social class.
3.3.2 Organizational stressors
Not only does the individual have to contend with potential stressors outside the workplace, but
also with those that are generated within an organization. These stressors are unique to the
organization and occur at the macrolevel dimension of the organization (Luthans, 2002: 399). The
macrolevel comprises four categories of potential stressors, which include administrative policies
and strategies, organizational structure and design, organizational processes, and working
conditions (Figure 3.5).
Cartwright and Cooper (1997: 14-21), Luthans (2002: 399), Moorhead and Griffin (1989: 197-201;
Quick et al, 1997: 21; Sutherland & Cooper, 2000: 101) focus on a number of factors within the
organization that may cause stress. These include task demands, physical demands, role
demands, interpersonal demands, and career stress.
3.3.2.1 Task demands
Task demands refer directly to the specific job an individual is performing and includes the type of
occupation, job security, workload, and new technology. Moorhead and Griffin (1989: 198) state
that ‘some occupations are simply more stressful than others’ and mention occupations such as
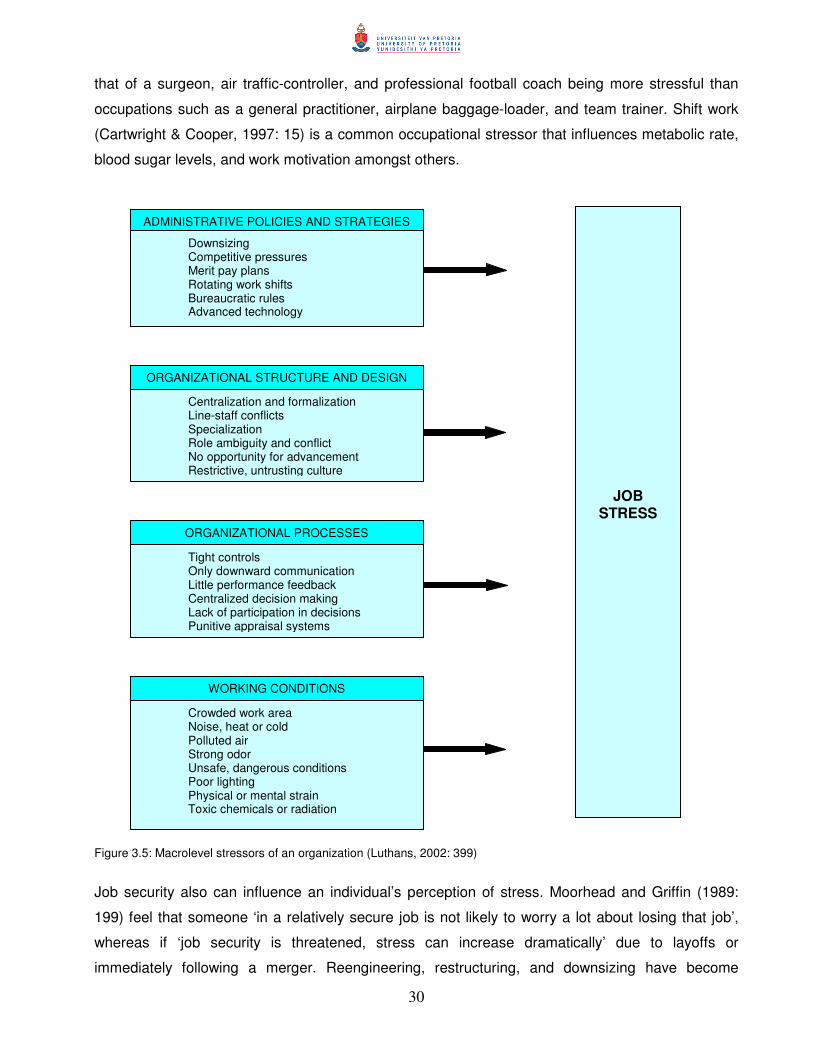
30
that of a surgeon, air traffic-controller, and professional football coach being more stressful than
occupations such as a general practitioner, airplane baggage-loader, and team trainer. Shift work
(Cartwright & Cooper, 1997: 15) is a common occupational stressor that influences metabolic rate,
blood sugar levels, and work motivation amongst others.
Figure 3.5: Macrolevel stressors of an organization (Luthans, 2002: 399)
Job security also can influence an individual’s perception of stress. Moorhead and Griffin (1989:
199) feel that someone ‘in a relatively secure job is not likely to worry a lot about losing that job’,
whereas if ‘job security is threatened, stress can increase dramatically’ due to layoffs or
immediately following a merger. Reengineering, restructuring, and downsizing have become
JOB STRESS
ORGANIZATIONAL PROCESSES
Tight controls Only downward communication Little performance feedback Centralized decision making Lack of participation in decisions Punitive appraisal systems
WORKING CONDITIONS
ADMINISTRATIVE POLICIES AND STRATEGIES
Downsizing Competitive pressures Merit pay plans Rotating work shifts Bureaucratic rules Advanced technology
ORGANIZATIONAL STRUCTURE AND DESIGN
Centralization and formalization Line-staff conflicts Specialization Role ambiguity and conflict No opportunity for advancement Restrictive, untrusting culture
Crowded work area Noise, heat or cold Polluted air Strong odor Unsafe, dangerous conditions Poor lighting Physical or mental strain Toxic chemicals or radiation
31
regular occurrences in order to stay competitive in a global market (DeFrank & Ivancevich, 1998:
56). Research on downsizing has been shown to be highly stressful for employees (Jick in
Sutherland & Cooper, 2000: 10). Survivors often ‘experience tremendous pressure from the fear of
future cuts, the loss of friends and colleagues, and an increase in workload’ (DeFrank &
Invancevich, 1998: 57). Armstrong-Stassen (2002: 10) observed that when an employee was
declared redundant but remained in the organization after the downsizing was complete, she
reported a significant increase in organizational trust, commitment, and job satisfaction.
Workload can be perceived as either too much or too little, for example work-underload or work-
overload. Work-underload often refers to routine jobs ‘that demand too little in terms of
demonstration of skills or use of knowledge and experience’ and are as stressful as jobs with high
role overload and that required high levels of responsibility (Quick et al, 1997: 27). This is often
associated with boredom, apathy and lack of motivation to work (Sutherland & Cooper, 2000: 174).
Work-overload ‘occurs when a person simply has more work to do than he or she can handle’
(Moorhead & Griffin, 1989: 199). This can refer to too many tasks to do or to little time to complete
the tasks in (quantitative overload), or the subjective feeling that the individual may feel
incompetent to do the job (qualitative overload). Quantitative overload leads to long working hours
which may take a toll on employee health (Cartwright & Cooper, 1997: 15). Research has
established a link between extended shifts and deaths due to coronary disease (Breslow & Buell,
and Russek & Zohman, in Cartwright & Cooper, 1997: 15).
The introduction of new technology ‘has required management and workers alike to continually
adapt to new equipment, systems, and ways of working’ (Cartwright & Cooper, 1997: 16). Keeping
up with new technology in order to maintain technological superiority or having a boss trained in the
“old ways” or not adapting to new technology is a great source of pressure at work. A new term was
coined for the adverse reactions some individuals show when confronted with new technology: it is
called technostress (Genco, 2000: 42). These individuals feel inadequate and frustrated because
they are not up-to-date with the new technology. The stress they experience leads to feelings of
helplessness, loss of motivation, mood swings, and even depression.
3.3.2.2 Physical demands
Physical demands refer to the working conditions, which include the physical surroundings, and the
design or physical setting of the workplace (Cartwright & Cooper, 1997: 14; Moorhead & Griffin,
1989: 199; Quick et al, 1997: 21).
32
Physical surroundings refer to aspects such as noise, humidity, lighting, smells, and temperature.
Excessive noise, vibrations, heat, cold, humidity dry air, poor lighting, extremely bright lighting or
other rays such as ultraviolet light and electromagnetic radiation can result in stress. The design or
physical setting of the workplace may be another source of stress. A poorly designed office could
make it difficult for individuals to have privacy, or could result in too much or too little social
interaction (Moorhead & Griffin, 1989: 200). Too much interaction may distract the individual from
the task at hand, while too little could result in boredom or even loneliness. Typical managers in
organizations mainly function within an office environment and are therefore not being exposed to
hazardous situations and noxious agents that blue-collar workers are subjected to.
3.3.2.3 Role demands
Role demands refer to a set of behaviours associated with a particular position or particular role the
individual has in a group or organization (Moorhead & Griffin, 1989: 200). When these are clearly
defined and understood and the individual experiences expectations as clear and non-conflicting,
stress should be at a minimum (Cartwright & Cooper, 1997: 16). Although individuals bring different
roles into the organization the most important role they have at work is their organizational one
(Luthans, 2002: 408). An individual may experience stress as a result of role ambiguity and conflict,
and responsibility for others.
1) Role conflict and ambiguity
Role conflict and ambiguity develops when an individual is uncertain about his or her job definition,
work objectives, co-workers’ expectations, and responsibilities of his or her job (Cartwright &
Cooper, 1997: 17; Luthans, 2002: 408). Role conflict and ambiguity may result in lowered self-
esteem, depressed mood, life dissatisfaction, low motivation to work, and job turnover.
Role conflict can be experienced as incongruence between two or more roles (Moorhead & Griffin,
1989: 200) or when an individual experiences conflicting job demands (Cartwright and Cooper,
1997: 17). Role ambiguity can be defined as a lack of clarity regarding the exact nature of a
particular role (Moorhead & Griffin, 1989: 250). This can result from having a poor job description,
obtaining unclear instructions from the supervisor, or unclear cues from fellow workers.
The literature on organizational development describes three different types of role conflict often
experienced by both mangers and their fellow workers (Luthans, 2002: 408):
33
� Interrole conflict, which can happen when a person experiences conflict among two or more
roles that must be played at the same time. Work roles and non-work roles are often found
to be the cause.
� Intrarole conflict may be created by contradictory expectations as to how a given role should
be played. Luthans (2002: 408) gives the example of a manager, who is unsure whether he
or she should be autocratic or democratic when dealing with his or her subordinates.
� Person-role conflict may result from a basic incongruence between the person and the
expectations of the role. Moorhead and Griffin (1989: 251) illustrate this by a peace activist
working for a weapons factory, although it goes against this person’s beliefs.
Chen and Spector (1992: 179) gathered self-report data from 400 white-collar employees found in a
number of different occupations. Among the variables measured they found that work stressors
such as role ambiguity and role conflict gave rise to interpersonal aggression and sabotage.
2) Responsibility for others
According to Cartwright and Cooper (1997: 17) there are two types of responsibility, one for people
and one for things such as budgets, equipment, and buildings. Individuals taking responsibility for
people would have to spend more time dealing with people, going to meetings, and trying to meet
deadlines, were more likely to experience stress than those not working with people.
3.3.2.4 Interpersonal demands
Interpersonal demands refer to pressures, which are experienced by individuals as exerted by co-
workers. Group pressures and relationships at work create demands on the individual resulting in
an increase in stress (Moorhead & Griffin, 1989: 200; Cartwright & Cooper, 1997: 18).
1) Group pressures
Group pressures according to Moorhead and Griffin (1989: 200) ‘include such things as pressure to
restrict output, pressure to conform to the group’s norms’, as well as exerting pressure on
individuals to conform. If the individual varies from the group’s expectations, he or she may
experience high levels of stress.
2) Relationships at work
Relationships at work may also be a major source of stress. When poor relationships exist between
colleagues, this may lead to irritation which over time leads to a decrease in self-esteem and an
34
increase in anxiety (Mohr in Dormann & Zapf, 2002: 34). Anxiety leads to depressive symptoms
further impacting self-esteem. Social isolation may occur exacerbating the depressive symptoms.
Psychosomatic complaints may also be reported. Cartwright and Cooper (1997: 18) mention that
emotional problems may result ‘when the relationship between a subordinate and a boss is
psychologically unhealthy for one reason or another’. Employees that experienced high levels of
work stress also had a negative perception of the group that they worked in (Jex & Thomas, 2003:
166) and thus possibly impacting on group effectiveness.
Buck (in Cartwright & Cooper, 1997: 18) found that ‘when a boss was perceived as “considerate”,
the subordinates felt that there was “friendship, mutual trust, respect, and a certain warmth’’
between boss and subordinate”. Those subordinates that felt that their bosses were inconsiderate
experienced more job pressure. The reverse also holds true. Relationships with subordinates can
also be stressful particularly for those in managerial positions with technical and scientific
backgrounds as they may lack people skills (Cartwright & Cooper, 1997: 18). Competition and
personality conflicts among co-workers may also result in stress (Cartwright & Cooper, 1997: 19;
Moorhead & Griffin, 1989: 200). Abrasive, hard-driving individuals cause stress for co-workers
because they ignore the others’ feelings and their way of interacting (Levinson, in Cartwright &
Cooper, 1997: 19).
3.3.2.5 Career stress
For many individuals a career spanning a lifetime is of great importance. Being promoted, gaining
increased status, getting higher salaries, and finding better opportunities has all been associated
with career development (Moorhead & Griffin, 1989: 638). Today however, lack of job security, fear
of job loss, and obsolescence or retirement are common features of working life (Cartwright &
Cooper, 1997: 19). Job opportunities are becoming scarce due to downsizing to create smaller,
flatter and more effective organizations. Organizational downsizing is associated with a significant
decline in job satisfaction (Ashford, Lee & Bobko in Campbell-Jamison et al, 2001: 42), as well as
motivation and loss of commitment towards the organization (Campbell-Jamison et al, 2001: 42).
The resultant job insecurity is experienced as highly stressful. Uncertainty about future career
possibilities may be another source of career stress (Möller & Spangenberg, 1996: 348). A study
conducted on stress and coping amongst South African dentists found that nearly half of the
respondents were uncertain about their future career direction and options.
35
3.3.3 Group stressors
The group is a great potential source of stress, which includes the lack of group cohesiveness and
social support.
Lack of group cohesiveness refers to the sense of “togetherness” the employee’s experience,
especially at the lower levels of the organization. When the employee does not experience a sense
of cohesiveness, it can lead to high levels of stress (Luthans, 2002: 400). Cohesiveness is very
important to employees, specifically at the lower levels of the organization. If the employee cannot
be part of the group due to either the task design, the supervisor preventing it, or when other
members of the group shut the individual out, a lack of cohesiveness can be experienced as highly
stressful. Lack of social support can be very stressful, as the individual cannot share their ups and
downs with others. Quick et al (1997: 197) conclude that there is a strong connection between
social support and health. For example, socially isolated individuals are less healthy both physically
and psychologically and they are more likely to die (House et al in Quick et al, 1997: 196). In a
cohesive group this is not expected to happen.
3.3.4 Individual stressors
Individual dispositions tend to moderate the affect that stressors have on the person (Luthans,
2002: 401; Schell, 1997: 222; Quick et al, 1997: 47). These include individual dispositions such as
Type A and B personalities, learned helplessness, self-efficacy, psychological hardiness and
optimism.
3.3.4.1 Type A and B personalities
Type A personality refers to an individual that Friedman and Rosenman (in Luthans, 2002: 401)
define as ‘an action-emotion complex that can be observed in any person who is aggressively
involved in a chronic, incessant struggle to achieve more and more in less and less time, and if
required to do so, against the opposing efforts of other things or other persons’.
Schell (1997: 226) describes them ‘as individuals that walk fast, talk fast, think fast, have relatively
loud voices, are job- and task-fixated, use sarcasm, have forced rather than natural smiles, and talk
over others if others take too long to come to the point’. They are highly competitive, work under
constant pressures such as deadlines, are easily frustrated and unable to relax (Schell, 1997: 226;
Luthans, 2002: 402). Type A personalities are associated with cardiovascular disease, specifically
heart attacks. Most modern thinking associates type A personalities with anger and hostility that
36
leads to cardiovascular disease (Baron & Byrne, 2003: 449; Luthans, 2002: 402; Schell, 1997:
226). Type B personalities are in a sense the opposite to Type A, in that they are less competitive,
less concerned about time, are more patient, have a lower sense of urgency, are more relaxed, and
not typically associated with anger and hostility (Baron & Byrne, 2003: 449; Luthans, 2002: 402;
Quick et al, 1997: 49).
3.3.4.2 Learned helplessness
Learned helplessness is a concept coined by Seligman (Luthans, 2002: 403) based on research
over the feeling of loss of control initially conducted on dogs. Seligman and his colleagues have
expanded this research to explaining individuals’ sense of lack of control. Individuals are more likely
to experience a sense of helplessness when they perceive the cause of loss of control:
� To be related to something about their personal characteristics (as opposed to outside,
environmental forces;
� As stable and enduring (rather than just temporary);
� To be global and universal (cutting across many situations, rather than in just one sphere of life)
(Luthans, 2002: 403).
When individuals feel that they do not have the ability to control their work situation, they will
experience stress (Jackson, 1983: 17). When they are included in decision-making that affects
them, their work stress decreases because their sense of control over their work environment
increases. Any organizational change, such as a merger, is perceived as highly stressful as it is a
situation over which the employee feels he or she has no control (Cartwright & Cooper, 1997: 33).
3.3.4.3 Self-efficacy
Self-efficacy refers to the individual’s self-perception of his or her controllability over action and a
specific perception of one’s capacity to execute a particular task (Bandura in Maddi, 1996: 458).
This disposition plays an important role in the ability to handle stress (Luthans, 2002: 311). Bandura
et al (1985: 412) found that individuals with high self-efficacy had a relatively low physiological
arousal level displayed by low epinephrine and norepinephrine secretion, whereas those individuals
experiencing high levels of stress had high physiological arousal levels and displayed high
catecholamine reactivity. Therefore those individuals with a high self-efficacy tended to remain
more in control when faced with a stressful situation.
37
3.3.4.4 Psychological hardiness
When individuals are faced with extreme stressors, some may disintegrate at the slightest
provocation, whereas others seem unfazed (Luthans, 2002: 403). Those individuals, who can cope
well with extreme stressors, are viewed as being hardy. Kobasa (in Kobasa et al, 1982: 174)
proposed that hardiness is a constellation of personality characteristics that function as a resource
of resistance in the encounter with stressful life events and involves a commitment disposition, a
control disposition, and a challenge disposition. A study of middle- and upper–level managers who
were under considerable stress found that the hardy executives had a lower rate of stress-related
illness and were found to be more involved in what they were doing (Kobasa et al, 1982: 174). They
were committed, they viewed change as normal and challenging, and they felt that they could
influence the events around them, giving them a sense of control.
3.3.4.5 Optimism
Optimism and pessimism reflect alternative styles of peoples’ expectations of the future (Carver &
Scheier, 2002: 231). People use these styles to predict whether future outcomes will be good or
bad. The expectancies people have generally pertain to their entire life. Optimistic people expect to
have positive outcomes even when circumstances are difficult. Pessimistic people expect negative
outcomes under the same circumstances. Quick et al (1997: 52) state that optimists moderate
stress by realizing that bad events and hard times ‘are temporary, limited, and caused by
something other than they them self’. Optimism is related to emotional wellbeing, quality of life and
to lower levels of depression. Optimism was also related to problem-focused coping especially
when the situation was viewed as controllable (Scheier, Weintraub, & Carver in Carver & Scheier,
2002: 235). Furthermore it was to the use of positive reframing and with the ability to accept the
reality of the situation when the situation was viewed as uncontrollable.
3.4 Conclusion
Stress is a phenomenon that is here to stay. Since Selye first coined the term ‘stress’ in 1956,
researchers find it a term that is not easily defined and conceptualised. The sources and causes of
stress are many and varied, whether found within or without the organization, which were
discussed extensively in this chapter. They include amongst others job insecurity, work-hours,
control at work, managerial style, physical and role demands, as well as group stressors and career
stress.

38
Stress is not necessarily bad for the individual but depending on the ability of the individual to cope
with the perceived stressors, it may have detrimental consequences for both the individual and the
organization. The ability to deal with the stressor effectively is mediated by the personality
characteristics of the individual, which may for example include factors such as A type personality,
hardiness, learned helplessness, and self-efficacy. For those individuals that appraise stress as
harmful and difficult to cope with, their inability to do so has dire consequences for them, such as
affecting him or her on a physical, psychological, and behavioural level. Cardiovascular disease
and chronic bouts of depression are two of the main consequences of chronic work stress. Other
stress-related disorders include short-term depression, anxiety, insomnia, migraine headaches,
stomach ulcers, asthma, arthritis, and substance abuse. Stress may give rise to a demotivated
workforce, absenteeism, work-related accidents, frequent or prolonged sick leave, decreased
productivity, and costly disability claims costing the organization millions of Rand.
Organizations need to be aware of the hazards and stressors that may exist in the workplace and
to take measures, that allows the organization to manage these effectively so as to protect the
wellbeing of the employee but also to cover themselves against any potential legal action from
affected employees. By taking appropriate measures organizations may enhance not only
employee well being but also employee commitment and performance.
The present research makes use of the stimulus-response approach to stress in which workplace
stress is viewed as a transaction between the individual and his or her environment. Although the
stimulus-response approach allows for the use of different models, the present study will use Cox
and McKay’s five stage model (see section 3.2.4.1). The reason for this choice was that according
to this model stress is described as a dynamic process in which the physical as well as the
psychological characteristics of the individual play a role. Furthermore, the focus is on the important
role of specific demands and the individual’s ability to deal with them.
Cox (1978: 19) describes the first stage as representing ‘the sources of demand relating to the
person’ and it forms part of the individual’s environment. The demands and stressors impacting on
the individual both within and without the organization will be measured. The second stage consists
of the individual’s perception of the demands and stressors and his or her ability to cope with these.
When a high demand is made on an individual, he or she will not experience stress until he or she
has reached his or her limitations. Thus the experience of stress whether high or low will again be
assessed. The third stage is associated with the physical changes as well as cognitive and
behavioural responses. These purport to reduce the immediate impact of the demands and
stressors. Here the role of coping through social problem solving will be assessed. The fourth stage
39
focuses on the consequences of the coping responses, whether actual or perceived. These include
the effect of the response both on a cognitive and behavioural level. In terms of the study this would
include the experience of anxiety, depression, worry as well as expressions of workplace
aggression. The fifth and last stage of the model revolves around feedback and is found to occur at
all of the other stages influencing the outcome at each of the other stages.
The changing demographics and the corresponding changes occurring within organizations in
South Africa necessitates continuing research on the causes and consequences of stress in the
workplace. As the major causes of stress have been discussed affecting the individual in the
workplace some of the specific consequences need to be discussed in more depth. Research on
the phenomenon of aggression in the workplace has only mushroomed recently and no research at
the time of writing has been reported in South Africa.
40
CHAPTER 4
AGGRESSION IN THE WORKPLACE 4.1 Introduction
In Pretoria a male walks into one of the offices at his workplace. He shoots and kills three of his
female colleagues before he kills himself with a 7.65 pistol (Beeld, 22 August 1997).
Likewise similar incidences in other countries such as the United States of America, have been
the focus of the media. Baron and Neuman (1996: 162) report that each week, on average of 15
people are murdered at work. However it must be noted that not all individuals who are
murdered are as a result of an angry employee who shoots and kills his co-workers or
supervisors. Instead, it usually occurs when outsiders enter the workplace for criminal purposes
and attack workers. Workplace homicides were the second leading cause of death in the
workplace for all employees by 1993 in the United States (Bureau of Labor Statistics in Neuman
& Baron, 1998: 392). Other harmful but less dramatic aggressive acts occur with substantially
greater frequency but are often not reported. Aggression as well as any form of violence in the
workplace, whether physical or psychological in nature, is capable of causing harm to both the
individual and the organization (Leather et al, 1998: 162). The true extent of workplace
aggression is often underacknowledged (Randall, in Leather et al, 1998: 162) and the extent of
its consequences is understated (Barling, in Leather et al, 1998: 162).
Baron and Neuman (1996: 162) state that very limited numbers of individuals report that they
have been threatened with physical harm or actually experienced such incidences by others at
work. These researchers report incidences of 3% and 7%, respectively. Violence in the
workplace may be sensational but is actually part of a greater problem, namely that of
workplace aggression. Although some employees may be the victim of physical violence
resulting in bodily harm and even death, most employees are the targets of less dramatic forms
of aggression, such as ‘aggression that is verbal in nature, or physical actions that are far less
extreme than attacks with deadly weapons’ (Baron & Neuman, 1996: 163).
Workplace aggression has been the focus of research over the last two decades with the
majority of articles published after 1994 (Neuman & Baron, 1998: 392) with the emphasis on
workplace homicides perpetrated by outsiders. The focus of this study is on acts of aggression
that can be called covert (for example writing an anonymous letter, withholding of co-operation,
spreading of rumours) and overt (for example consistent arguing, intense arguments with
supervisors or co-workers, physical fights, destruction of property).

41
No literature at the time of writing could be found on aggression in the workplace for the South
African context.
4.2 Aggression
The term aggression is firmly established in everyday language and in the ‘technical vocabulary’
of psychologists (Krahé, 2001: 10). Aggression comes from the Latin aggressio meaning to
attack (Reader’s Digest Complete Wordfinder, 1997) and is defined by the dictionary as 1) the
act or practice of attack without provocation, especially beginning with a quarrel or war; 2) an
unprovoked attack; 3) self-assertiveness; forcefulness; and 4) psychologically a hostile or
destructive tendency or behaviour. This definition overlaps with the general definition given by
Buss (in Geen, 2001: 2), which states that aggression is ‘a response, that delivers noxious
stimuli to another organism’. Aggression as used in ordinary day-to-day language does involve
‘aversive stimulation of some sort and intensity, whether it be in the form of a bullet, a bomb, a
physical blow, or some subtle act like an insult or an undeserved criticism’ (Geen, 2001: 2).
However some critics assert that this definition is too broad as it includes many forms of
behaviour that should not be categorized as aggression, such as what is called “good
aggression”, and some assert it is too narrow as it excludes all non-behavioural processes,
such as thoughts and feelings (Krahé, 2001: 10). Aggression is more complex as a purely
behavioural definition would indicate. Additional elements need to be added to arrive at a more
balanced definition. The first element that needs to be included is the intent to harm the victim,
which, in turn presupposes the expectancy that the action will lead to a specific outcome (Geen,
2001: 2; Krahé, 2001: 10). The second element considers the motivation of the victim to avoid
the harmful treatment. A person might tolerate, and even want to be punished to atone for guilt.
This helps to exclude aggression, which is self-directed as in suicide or as a result of an injury
inflicted in the context of sadomasochistic sexual practices. In the context of the discussion the
definition that takes these elements into account is that proposed by Baron and Richardson
(1994: 7), which states that aggression is ‘any form of behavior directed toward the goal of
harming or injuring another living being who is motivated to avoid such treatment’. It leaves
sufficient room for a range of factors that characterize different forms of aggression (Krahé,
2001: 11) (Table 4.1).
Often researchers classify aggressive behaviour according to two categories, hostile or affective
aggression, and instrumental aggression. The former refers to the harming of the target as the
main motive for the act, and the latter which ‘may or may not involve strong emotions’ (Geen,
2001: 4) refers to ‘the aim to reach an intended goal by means of the aggressive act (Krahé,
2001: 11).
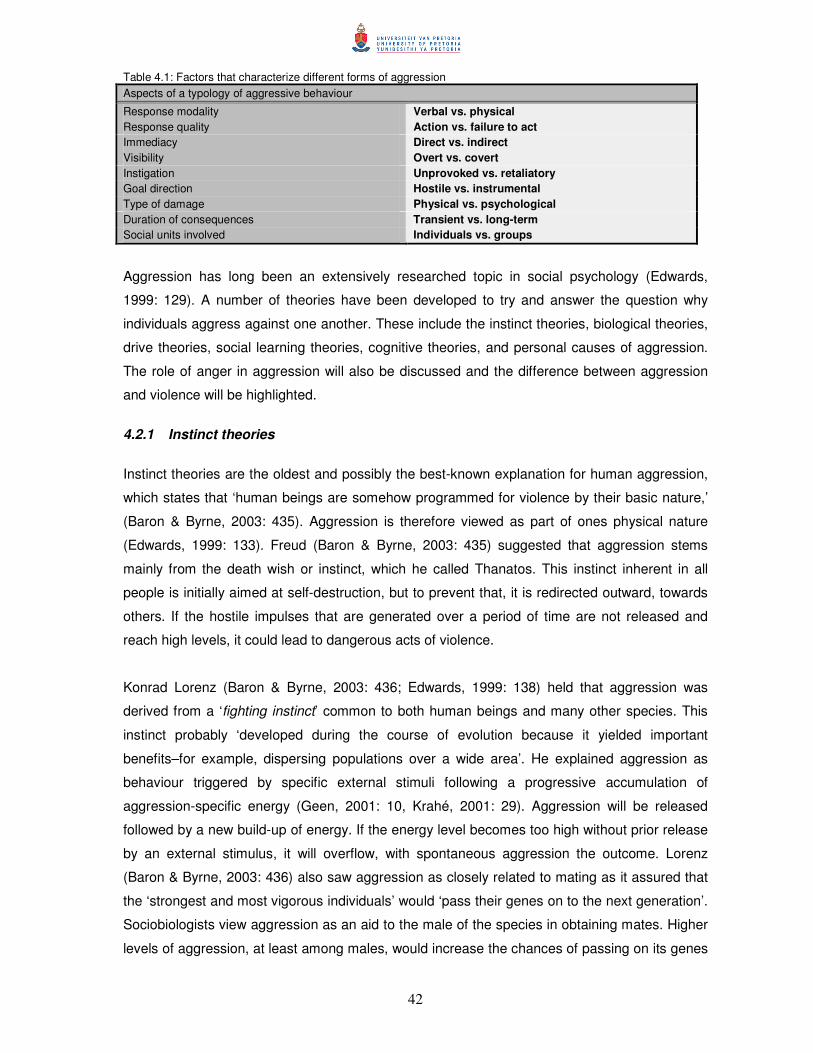
42
Table 4.1: Factors that characterize different forms of aggression Aspects of a typology of aggressive behaviour
Response modality Verbal vs. physical Response quality Action vs. failure to act Immediacy Direct vs. indirect Visibility Overt vs. covert Instigation Unprovoked vs. retaliatory Goal direction Hostile vs. instrumental Type of damage Physical vs. psychological Duration of consequences Transient vs. long-term Social units involved Individuals vs. groups
Aggression has long been an extensively researched topic in social psychology (Edwards,
1999: 129). A number of theories have been developed to try and answer the question why
individuals aggress against one another. These include the instinct theories, biological theories,
drive theories, social learning theories, cognitive theories, and personal causes of aggression.
The role of anger in aggression will also be discussed and the difference between aggression
and violence will be highlighted.
4.2.1 Instinct theories
Instinct theories are the oldest and possibly the best-known explanation for human aggression,
which states that ‘human beings are somehow programmed for violence by their basic nature,’
(Baron & Byrne, 2003: 435). Aggression is therefore viewed as part of ones physical nature
(Edwards, 1999: 133). Freud (Baron & Byrne, 2003: 435) suggested that aggression stems
mainly from the death wish or instinct, which he called Thanatos. This instinct inherent in all
people is initially aimed at self-destruction, but to prevent that, it is redirected outward, towards
others. If the hostile impulses that are generated over a period of time are not released and
reach high levels, it could lead to dangerous acts of violence.
Konrad Lorenz (Baron & Byrne, 2003: 436; Edwards, 1999: 138) held that aggression was
derived from a ‘fighting instinct’ common to both human beings and many other species. This
instinct probably ‘developed during the course of evolution because it yielded important
benefits–for example, dispersing populations over a wide area’. He explained aggression as
behaviour triggered by specific external stimuli following a progressive accumulation of
aggression-specific energy (Geen, 2001: 10, Krahé, 2001: 29). Aggression will be released
followed by a new build-up of energy. If the energy level becomes too high without prior release
by an external stimulus, it will overflow, with spontaneous aggression the outcome. Lorenz
(Baron & Byrne, 2003: 436) also saw aggression as closely related to mating as it assured that
the ‘strongest and most vigorous individuals’ would ‘pass their genes on to the next generation’.
Sociobiologists view aggression as an aid to the male of the species in obtaining mates. Higher
levels of aggression, at least among males, would increase the chances of passing on its genes

43
to the next generation thus favouring the principles of natural selection (Baron & Byrne, 2003:
436).
Lorenz’s application of animal studies to human aggression has been criticised on conceptual
and empirical grounds. Mummendey (in Krahé, 2001:29) believes that it is impossible to
measure the amount of aggressive energy found in an individual at a given time. This assertion
is debatable as the Szondi test may be used to measure the amount of aggressive energy
(Szondi, 1972: 307-311). The assumption that the available energy is used up in an aggressive
act is also problematic, as it would imply that it is not possible to trigger another aggressive
response before the reservoir is sufficiently filled. Research has shown that humans can act
aggressively in quick succession as the first aggressive act precipitates further acts of
aggression.
4.2.2 Biological theories
Biological theories view the role of biological factors as important in the understanding of
aggressive behaviour (Baron & Byrne, 1997: 394; Edwards, 1999: 133). Brain functions have
been studied in animals, which show the limbic system is associated with fragments of
aggressive acts (Edwards, 1999: 134). However it is difficult to study human brain function in
the same manner and the only information is typically obtained from accidents, disease, and
exploratory surgery. Neuroscientists have shown that the amygdala, found in the limbic system
is associated with emotions such as anger, rage and the fight or flight response (LeDoux in
Goleman, 1996: 16).
Neurotransmitters, hormones, and chemical poisoning are believed to play a role in aggression
(Baron & Byrne, 1997: 394; Edwards, 1999: 135). Neurotransmitters that are thought to be
associated with acts of aggression are serotonin, norepinephrine, and dopamine, when present
in high concentrations in the limbic system. However no direct link between neurotransmitters
and aggressive acts has been found. Higher levels of serotonin have been found in persons that
attempted suicide and those who were institutionalised since childhood because of extremely
high levels of aggression (Baron & Byrne, 1997: 395).
Sexual hormones are thought to be associated with aggressive acts (Edwards, 1999: 136). Men
are more likely to be aggressive and violent than women. This difference is thought to be due to
the relative proportions of male and female sex hormones. In a meta-analysis of 45 independent
studies Book et al (2001: 581) found a weak positive relationship between testosterone and
aggression which was consistent with past meta-analysis (Archer in Book et al, 2001: 581).
They also found that two variables moderated this relationship. The one variable referred to the
age of the participant, where the effect size was largest in the 13- to 20-year old males and it
44
declined with age. The other variable was the time of day the testosterone was measured as
this influenced the reliability of the testosterone levels. For males, the observed relationship
between testosterone and aggression was highest in the afternoon with the measurement being
the most reliable.
Chemical poisoning that is induced by abnormal brain chemistry is sometimes found to be
associated with aggression (Edwards, 1999: 136). Some individuals with low blood sugar
(hypoglycaemia) behave aggressively whereas others may become depressed and withdrawn.
Alcohol in some individuals may weaken their moral and social controls and they may act
aggressively.
These findings indicate that biological factors do play a role in human aggression but are
mediated by social and cognitive factors. Baron and Byrne (1997: 395) put it aptly stating ‘where
human aggression is concerned, biology may be important, but it is definitely not destiny’.
4.2.3 Drive theories
Drive theories of aggression view that aggressive acts stem from the presence of a drive called
aggression (Edwards, 1999: 142). The most well known of these theories is the frustration-
aggression hypothesis, which proposes that when people become frustrated, because their
ongoing, goal-directed behaviour is blocked or thwarted, a strong motive to respond
aggressively is aroused (Baron & Byrne, 2003: 436; Dollard et al., in Huessmann, 1994: 3). The
aggressive behaviour is directed towards the person or object perceived as the cause of the
frustration, with the intent to harm (Baron & Byrne, 2003: 436; Edwards, 1999: 142; Krahé,
2001: 34). However, research shows that not all kinds of frustration lead to aggression, and that
aggression sometimes does not stem from situations that are frustrating. Sometimes frustrated
individuals may rather withdraw from the situation or become depressed.
Miller modified the original theory (in Krahé, 2001: 34) and converted it from a deterministic
relationship between frustration and aggression into a probabilistic one, which states that
‘frustration produces instigations to a number of different types of response, one of which is an
instigation of some form of aggression’. Aggression is not the only response to frustration, but
one a number of possibilities.
Whether or not frustration will lead to an aggressive act will depend on the role of moderating
variables (Krahé, 2001: 35), for example fear of punishment for overt aggression or the
unavailability of the frustrator will inhibit aggression. In some instances the aggression is
“displaced” away from the frustrator onto a more easily accessible or less intimidating target.
45
4.2.4 Social learning theory
The social learning theory views that aggression is mainly learnt either through direct
experience or by observing and modelling aggressive behaviours (Baron & Byrne, 1997: 396;
Martinko & Zellars, 1998: 2). Bandura (in Eron, 1994: 5) proposed that an understanding of
aggressive acts was dependant on how they were learnt and maintained through direct or
vicarious experiences and the effect that factors such as role-reinforcement contingencies and
punishment had on this learning. Eron (1994: 5) mentions that he demonstrated in his research
that aggressive behaviours are learnt by “training” from ‘various socializing agents, specifically
parents, teachers, and peers’. Baron and Byrne (1997: 396) also mention that through both
direct and vicarious learning, individuals learn who or what to direct their aggression towards,
what actions by others justify or require an aggressive response, and when an aggressive
response is called for or not.
4.2.5 Cognitive theories
Cognitive theories focus on cognitive factors that help determine how an individual will react
towards environmental events impacting on him or her (Baron & Byrne, 1997: 396; Eron, 1994:
7). The first factor that plays a role is what Huesmann (in Eron, 1994: 7) described as cognitive
scripts, likened to programs for social behaviour that developed during an individual’s early
development. These programs are stored in memory and act as guides for behaviour.
Another cognitive factor that influences behaviour is how the individual interprets the situation.
This interpretation consists of an initial appraisal of the situation, which occurs very fast to
assess if malice was intended, and which may be followed by a reappraisal, taking a little longer
to assess the consequences if one responds in various ways (Anderson, in Baron & Byrne,
1997: 397).
Baron and Byrne (1997: 397) mention another factor that plays a role, namely the individual’s
current mood. Unpleasant or aversive experiences result in negative affect, which in turn
influences a person’s cognitive processes. This affect is associated on a primitive level with fight
or flight tendencies, but also to thoughts and memories related to similar experiences which
could result in aggressive behaviour (Berkowitz, in Edwards, 1999: 144). Baron and Byrne
(1997: 398) summarize the complex interplay between cognitive appraisals, present moods,
and the thoughts and memories associated with these experiences that may lead to aggressive
behaviour (Figure 4.1).
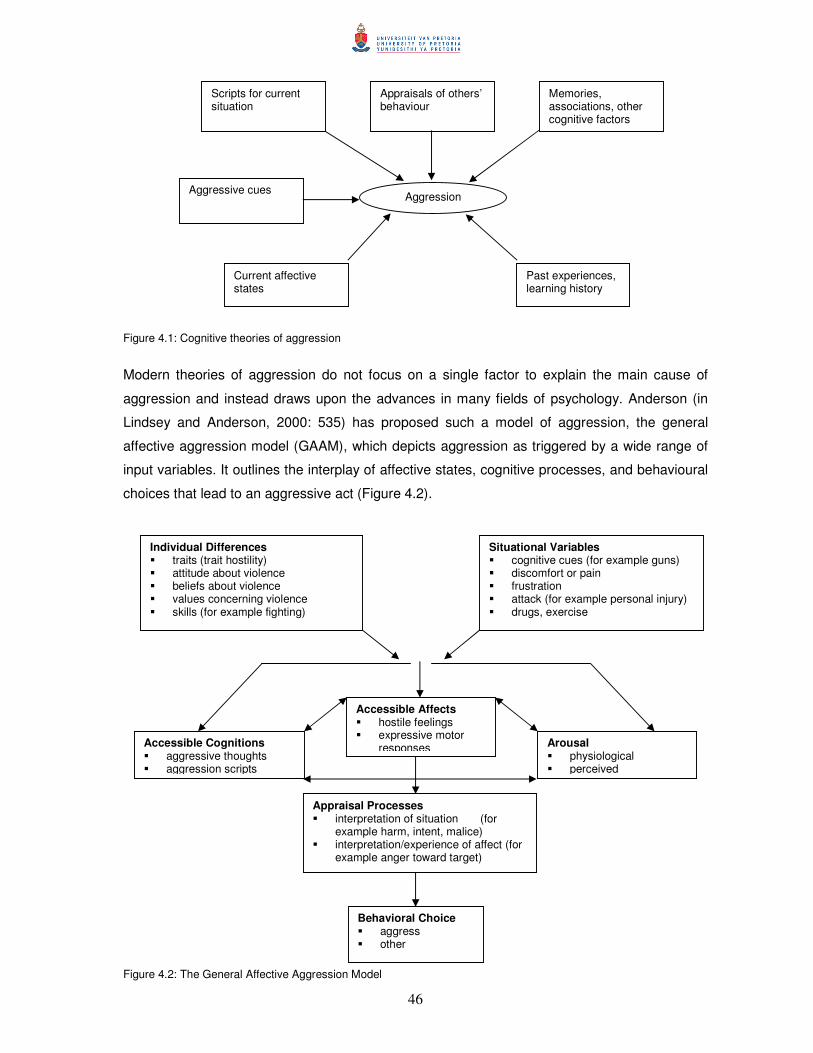
46
Figure 4.1: Cognitive theories of aggression
Modern theories of aggression do not focus on a single factor to explain the main cause of
aggression and instead draws upon the advances in many fields of psychology. Anderson (in
Lindsey and Anderson, 2000: 535) has proposed such a model of aggression, the general
affective aggression model (GAAM), which depicts aggression as triggered by a wide range of
input variables. It outlines the interplay of affective states, cognitive processes, and behavioural
choices that lead to an aggressive act (Figure 4.2).
Figure 4.2: The General Affective Aggression Model
Aggression
Scripts for current situation
Aggressive cues
Current affective states
Appraisals of others’ behaviour
Memories, associations, other cognitive factors
Past experiences, learning history
Behavioral Choice � aggress � other
Arousal � physiological � perceived
Accessible Cognitions � aggressive thoughts � aggression scripts
Accessible Affects � hostile feelings � expressive motor
responses
Appraisal Processes � interpretation of situation (for
example harm, intent, malice) � interpretation/experience of affect (for
example anger toward target)
Individual Differences � traits (trait hostility) � attitude about violence � beliefs about violence � values concerning violence � skills (for example fighting)
Situational Variables � cognitive cues (for example guns) � discomfort or pain � frustration � attack (for example personal injury) � drugs, exercise
47
4.2.6 Personal causes of aggression
Research has shown that certain personal characteristics inherent in an individual may
predispose him or her to engage in aggressive acts (Baron & Byrne, 1997: 411; Geen, 2001:
70; Krahé, 2001: 54). Type A personalities, hostile attribution bias, the “Big Five” dimensions of
personality, antecedents of aggression, i.e., irritability, emotional susceptibility, and dissipation-
rumination, and gender differences all are thought to play a role.
4.2.6.1 Type A personality
Type A, and B personalities have been discussed previously (see section 3.3.4.1.). Type A
personalities tend to be more aggressive than type B personalities associating them with
hostility and anger (Baron & Byrne, 2003: 449; Luthans, 2001: 402; Schell, 1997: 226). Type A
personalities are more likely to engage in hostile aggression, in which the main goal of the A-
type person is to inflict some kind of harm on the victim (Strube et al in Baron & Byrne (2003:
450). However, they are not more likely to engage in instrumental aggression than other
personality types.
4.2.6.2 Hostile attribution bias
Hostile attribution bias refers to the individual’s habitual tendency to interpret the actions or
intentions of others as hostile even when there is no evidence for this (Baron & Byrne, 2003:
451; Krahé, 2001: 56). Dodge and his colleagues (in Baron & Byrne, 1997: 412) showed in their
research with adolescents and adults in a prison setting that the ‘tendency to perceive malice in
the actions of others, even when it doesn’t exist, is one personal characteristic closely related to
high levels of aggression against others’. Krahé (2001: 56) notes that attribution style not only
affects the way in which individuals interpret actions directed at them, it also shapes their social
perceptions in general. She quotes Dill et al (Krahé, 2001: 56) who describe them as people
who ‘tend to view the world through tinted glasses’.
4.2.6.3 Antecedents of aggressive behaviour
Caprara et al (in Geen, 2001: 70) have found that a number of personality variables may act as
antecedents of aggressive behaviour. Their research was able to delineate three constructs,
namely irritability, emotional susceptibility, and dissipation versus rumination. Irritability refers to
the habitual ‘tendency to react impulsively, controversially, or rudely at the slightest provocation
or disagreement’. Individuals that were habitually irritable showed increased levels of
aggression compared to non-irritable individuals. When these individuals had been previously
been frustrated the level of aggression was more pronounced.
48
Emotional susceptibility is defined as a tendency ‘to experience feelings of discomfort,
helplessness, inadequacy, and vulnerability’ (Caprara et al, in Geen, 2001: 70). It is thought to
be indicative for a generally higher readiness for aggressive behaviour. Individuals that were
emotionally susceptible showed more aggressive behaviour, and similarly to irritability, more
pronounced after being frustrated. These two constructs are examples of hostile or affective
aggression (Krahé, 2001: 55).
Dissipation versus rumination refers to a tendency to ‘retain or augment feelings of anger over
time following provocation, as opposed to a tendency to dissipate such feelings and become
less angry’ (Caprara in Geen, 2001: 70). Individuals that are high dissipaters but low ruminators
get over a provocative or hostile encounter in a short time without spending much time and
effort in thinking about the encounter. However ruminators remain cognitively pre-occupied with
the provocative or hostile encounter and are likely to retaliate.
Caprara and his colleagues (in Baron & Byrne, 1997: 413) found that certain characteristics
including irritability, emotional susceptibility, and rumination were all related to aggression,
which in turn were related to two dimensions of the “Big Five”, i.e. agreeableness and emotional
reactivity.
4.2.6.4 “Big Five” dimensions of personality
Research in recent years has shown that there are only five basic personality dimensions with
respect to the human personality (Costa & McCrae, and Funder & Sneed, in Baron & Byrne,
1997: 413), which Baron and Byrne (1997: 413) describe as follows:
� Extraversion: A dimension ranging from sociable, talkative, fun-loving, affectionate,
adventurous at one end to retiring, sober, reserved, silent, and cautious at the other.
� Agreeableness: A dimension ranging from good-natured, gentle, co-operative, trusting,
and helpful at one end to irritable, ruthless, suspicious, unco-operative, and headstrong
at the other.
� Conscientiousness: A dimension ranging from being well organized, careful, self-
disciplined, responsible, and scrupulous at one end to being disorganized, careless,
weak-willed, and unscrupulous at the other.
� Emotional Stability: A dimension ranging from being poised, calm, composed, and not
hypochondriacally at one end to being nervous, anxious, excitable, and
hypochondriacally at the other.
� Openness to Experience: A dimension ranging from being imaginative, sensitive,
intellectual, and polished at one end to being down-to-earth, insensitive, crude and
simple at the other.

49
The five-factor model is a version of trait theory, which asserts that individuals differ in their
enduring emotional, cognitive, and behavioural styles along a mental-health continuum ranging
from low to high (Schell, 1997: 211).
4.2.6.5 Gender differences
Gender differences regarding aggression are thought to be complex (Baron & Byrne, 1997:
414). It appears that males are more likely to perform aggressive acts and to be the recipients
of such acts (Bogard & Harris, in Baron & Byrne, 1997: 414). Males, more than females, are
more likely to aggress against others although not having been provoked in any way
(Bettencourt & Miller, in Geen, 2001: 63). When provocation does occur, gender differences
tend to disappear. Males are more likely to than females to be involved in physical acts of
aggression such as hitting, punching, kicking, and use of weapons, amongst others. Females
tend to be involved in verbal and various forms of indirect aggression that make it difficult for the
victim to identify the aggressor or to even to realize that they have been the target of aggressive
behaviour (Lagerspetz et al, in Björkqvist, Österman, & Lagerspetz, 1994: 31).
4.2.7 Anger
Anger is defined as ‘extreme or passionate displeasure’ (Reader’s Digest Oxford Wordfinder,
1997) and is linked, but not always, to aggression. Aggressive acts are often associated with
angry people, but some aggressive acts occur in the absence of anger (Edwards, 1999: 145).
Anger is thought to be the result of brain activity specifically in the limbic system and specifically
the amygdala (Edwards, 1999: 146; Goleman, 1996: 15). Edwards (1999: 146) explains that
‘sensory information of events comes from cortex processing and is compared with space-time
memories in the hippocampus and compared with affective meaning in the amygdala’. The
amygdala can trigger an emotional response, which has a survival value such as the fight or
flight response (Goleman, 1996: 299). Anger prepares the body from a physiological point of
view for vigorous action by enabling blood to flow to the hands so as grasp a weapon or strike
at an enemy, to increase the heart rate and to release hormones such as adrenaline.
Anger produces elevated levels of testosterone for men, and also epinephrine, norepinephrine,
and cortisol (McKay et al, 2003: 21). Within a social context, anger can function as a way to
correct violations of social rules (Edwards, 1999: 146). Averill (in Berkowitz, 1994: 14) found
that individuals became angry when they were frustrated only to the extent that they regarded
the behaviour of the person thought causing the frustration as unjustified. The frustrations were
primarily unwarranted and violated some social rule.
50
The way anger is actualised by an individual is varied and can either be retained or projected
outward (Schell, 1997: 153). Buss and Durkee (in Schell, 1997: 153) have outlined seven
classes of anger and hostility:
� Assault: presents as physical violence against others. This outward sign of anger
includes getting into fights with others but not destroying objects.
� Indirect Hostility: presents as both roundabout and undirected aggression. Roundabout
aggression, like malicious gossip or practical jokes, is indirect in the sense that the
“hated object” is not attacked directly but by devious means. Undirected aggression, like
temper tantrums and door-slamming, consists of a discharge of negative affect against
no one in particular; it is a diffuse kind of rage that has no target or direction.
� Irritability: presents as a readiness to explode with negative affect at the slightest
provocation. This kind of aggression includes quick temper, grouchiness, exasperation,
and rudeness.
� Negativism: presents as oppositional behavior, usually directed against authority. This
kind of aggression involves a refusal to co-operate that may vary from passive non-
compliance to open rebellion against rules or conventions.
� Resentment: presents as jealousy and hatred of others. This kind of aggression refers to
a feeling of anger at the world over real or fantasized “mistreatment.”
� Suspicion: presents as projection of hostility onto others. This kind of aggression varies
from merely being distrustful and wary of people to beliefs that others are being
derogatory or are planning harm against them.
� Verbal Hostility: presents as negative affect expressed in both the style and content of
speech. Style includes arguing, shouting, and screaming. Content includes threats,
curses, and being overcritical.
4.2.8 Violence
It is necessary to distinguish between aggression and violence as these two terms are often
used interchangeably in ordinary language. Aggression is described as the actual act or
process, whereas violence is seen as the consequence or outcome of the aggressive act
(O’Leary-Kelly et al, 1996: 227). Violence is considered an extreme form of physical aggression
and defined as ‘the infliction of intense force upon persons or property for the purposes of
destruction, punishment, or control’ (Geen in Krahé, 2001: 13). The actions of an individual who
attempts to physically injure a co-worker would be seen as aggression, whereas the resulting
injury would be defined as violence. Tobin (2001: 100) defines violence as ‘a severe, extreme,
negative, and harmful disturbance to person or property, which includes violation of the rights of
those involved.’ He views the action taken at this level as ‘terminal by the individual.’ Mattaini et
al (in Krahé, 2001: 13) identified six potential functions of violent behaviour:
51
� Change of, or escape from, aversive situations.
� Positive reinforcement, i.e., attainment of a particular goal.
� Release of negative affective arousal.
� Resolution of conflict.
� Gaining of respect.
� Attack on a culturally defined “enemy’, i.e., a member of a devalued outgroup.
4.3 Aggression in the workplace
O’Leary-Kelly et al (1996: 228) propose a distinction between aggressive acts that are
“organization motivated” and those that have their bases in factors outside the organization.
They define organization-motivated aggression as ‘attempted injurious or destructive behaviour
initiated by either an organizational insider or outsider that is instigated by some factor in the
organizational context’. Adopting this position allows the underlying motivation for an act to be
the defining issue instead of the specific location where the act occurs, and this approach puts
the focus on the individuals presently or previously, employed by the organization thereby
limiting the nature of the relationship between the aggressor and the victim. Neuman and Baron
(1998: 393) conclude that all forms of intentional harm doing in organizations would qualify as
workplace aggression. The term violence would describe only serious instances of physical
assault. They define workplace aggression as efforts by which ‘individuals’ harm others with
whom they work, or have worked, or the organizations on which they are presently, or were
previously, employed’.
An extensive body of research has become available over the past two decades investigating
aggression in the workplace. Baron et al (1999: 282) write that less than 50 articles on
workplace violence were published during the period 1987-1993, whereas more than 200 were
published in the period 1994-1996 alone. Flannery (1996: 57) has reviewed a number of
research studies published in the period 1970-1995 focusing on physical forms of violence such
as homicide, assault, and rape, as well as exposure to danger and man-made disasters and
their impact on psychological health. These incidents of violence do not typically occur between
fellow workers but occur when individuals from outside the workplace attack the employees.
Considerably fewer studies have investigated less extreme forms of aggression taking place
between co-workers, producing mainly psychological damage (Kaukiainen et al, 2001: 367).
These types of aggressive actions may permit the aggressors to conceal their identity and in
some instances their malevolent intentions (Baron et al, 1999: 282).
Björkqvist et al (1994: 31) conclude that aggressors generally seek behaviours that maximize
the harm done to victims, while at the same time minimizing the danger to themselves. Physical
aggression, for example, is effective but also risky, and if unsuccessful, the aggressor him- or

52
herself may get hurt. The effect/danger ratio describes the aggressors’ subjective estimates of
these two aspects. Generally aggressors prefer a large effect/danger ratio. This tendency of
aggressors to disguise their identity and intentions has been described as covert, where as
aggressors who do reveal their identity and their aggressive intentions have been called overt.
A number of factors in the workplace tend to further strengthen a high effect/danger ratio.
Firstly, individuals in a given work environment are generally in repeated and prolonged contact
with one another over an extended period of time. This may increase the probability of
retaliation from these individuals Secondly, individuals in work settings often get to know one
another well, and as they have to co-ordinate their activities, they often pay close attention to
each other’s behaviour (Baron & Richardson, in Neuman & Baron, 1998: 395). Anonymity,
which has been shown to increase aggression, is found to be absent (Prentice-Dunn & Rogers,
in Baron et al, 1999: 282). Thirdly, work settings have many potential witnesses who may
observe aggressive actions. This may encourage aggressors to use forms of aggression that
may conceal their identity from intended victims and other individuals so as to avoid disapproval
of such behaviours. These reasons may motivate the aggressors to use covert forms of
aggression rather than overt forms. Combining these three dichotomies, results in eight types of
aggression, which can be applied to the workplace (Table 4.2).
Table 4.2: Types of aggression in the workplace
Types of aggression Examples
Verbal-Passive-Indirect Failing to deny false rumours about the target. Failing to transmit information needed by the target.
Verbal-Passive-Direct Failing to return the target’s phone calls. Giving the target the silent treatment.
Verbal-Active-Indirect Spreading false rumours about the target. Belittling the target’s opinions to others.
Verbal-Active-Direct Yelling, shouting, making insulting remarks. Flaunting status or authority; acting in a condescending, superior manner.
Physical-Passive-Indirect Causing others to delay action on matters of importance to the target. Failing to take steps that would protect the target’s welfare or safety.
Physical-Passive-Direct
Purposely leaving a work area when the target enters. Reducing targets’ opportunities to express themselves (for example scheduling them at the end of a session so that they don’t get their turn).
Physical-Active-Indirect Theft or destruction of property belonging to the target. Needlessly consuming resources needed by the target.
Physical-Active-Direct Physical attack (for example pushing, shoving, hitting). Negative or obscene gestures toward the target.
A framework was developed by Buss (in Baron & Neuman, 1996: 163) to describe covert
aggression. According to Buss (in Baron & Neuman, 1996: 163) aggressive acts can be
classified in terms of three dichotomies: verbal-physical, direct-indirect, and active-passive.
Verbal forms of aggression refer to efforts by the aggressor to inflict harm on others through
53
words rather than deeds, where as physical forms of aggression refer to overt actions with the
intention to harm the recipient in some or other manner. Direct forms of aggression refer to
aggressive acts in which harm is delivered directly to the victim, where as indirect forms of
aggression seek to deliver harm through the actions of agents or through assaults on people or
objects valued by the target. Active forms of aggression describe the harm achieved through the
performance of some act, whereas passive forms of aggression describe the harm resulting
from withholding of some action.
Research done by Baron and Neuman (1996: 169) using the eight combinations within the
Buss framework showed that respondents reported witnessing verbal forms of aggression more
frequently than physical forms. They also reported witnessing more passive forms of aggression
than active forms, and indirect forms more than direct forms of aggression.
Exploratory factor analysis of this data revealed 33 variables subsumed by three dimensions,
which were expressions of hostility, obstructionism, and overt aggression (Baron et al, 1999;
286; Neuman & Baron, 1998: 397). Expressions of hostility include behaviours that are
primarily verbal or symbolic in nature (for example gestures, facial expressions, and verbal
assaults) and occurred more often than any other form of aggression. Obstructionism includes
actions that are aimed at impeding an individual’s ability to perform his of her job or interfere
with an organization’s ability to achieve its objective. These tend to be passive or covert forms
of aggression such as withholding some behaviour or resource. Obstructionism was significantly
more prevalent in work settings than overt aggression. Overt aggression refers typically to
workplace violence, which includes workplace homicide, but also non-fatal physical or sexual
assault. However, the vast majority of employees never witness or experience these forms of
assault. Sabotage and vandalism which includes property damage, destruction of machinery
and goods, passing on defective work, flattening of tyres, scratching cars, planting computer
viruses, deletion of important computer records, and writing on company furniture, as well as
theft may also occur.
Kaukiainen et al (2001: 363) measured four types of observed and experienced aggression:
direct overt, indirect manipulative, covert insinuating, and rational-appearing aggression. They
found that indirect manipulative and rational-appearing aggression was perceived to be the
most widely used aggression styles in the work place. These studies support the view that much
of the aggression found in the workplace is covert rather than overt in nature.
4.3.1 Causes of workplace aggression
Aggression stems from the complex interplay of social, situational, and individual or personal
factors (Douglas & Martinko, 2001: 548; Neuman & Baron, 1998: 402). These same factors may
54
be applied to organizational settings to understand workplace aggression and aid in the
development of models of workplace aggression.
4.3.1.1 Social determinants of workplace aggression
Neuman and Baron (1998: 402) examined the potential effects of several social factors that
seem especially relevant to aggression in the workplace. They included unfair treatment,
frustration-inducing events, increased workforce diversity, and aggression-related norms of
behaviour. The perception of unfair treatment, depending on the circumstances, is associated
with conflict (Cropanzano & Baron in Neuman & Baron, 1998: 402), workplace aggression
(Baron et al, 1999: 289), employee theft (Greenberg in Neuman & Baron, 1998: 402) and
negative reactions to employee layoffs (Brockner et al, 1994: 402). Frustration-inducing events
refer to the interference of ongoing, goal-directed behaviour (Neuman & Baron, 1998: 405).
Frustration has been found to be positively correlated with aggression against others,
interpersonal hostility, sabotage, strikes, work slowdowns, stealing, and employee withdrawal
(Spector in Neuman & Baron, 1998: 403; and Storms & Spector in Neuman & Baron, 1998:
403).
Increased workforce diversity refers to the fact that the workplace is becoming increasingly
diverse (Neuman & Baron, 1998: 403). This increased diversity may lead to heightened tension
and interpersonal conflict because it places individuals with many differences such as age,
gender, ethnicity, culture, and physical and/or mental capabilities, in close proximity of one
another. When these differences are perceived as repulsive, it may generate feelings of
negative affect, resulting in decreased levels of interpersonal attraction and increased potential
for aggression. Aggression- related norms of behaviour refer to normative behaviour and norm
violations that occur in an organization such as the wide held belief that aggression is just a
normal part of the job, the fostering of a contentious organizational climate or the promotion of
the appearance of toughness (Neuman & Baron, 1998: 403).
4.3.1.2 Situational factors
Over the last several years many organizations have undergone far-reaching changes, and a
number of these changes appear to contribute to increased levels of workplace aggression.
Some of the most important changes include downsizing and concomitant layoffs, mergers and
acquisitions, restructuring, reengineering, budget cuts, pay cuts or freezes on salary increases,
technological change, change in management, increased diversity in the workforce,
implementation of affirmative action policies, computer monitoring of employee performance,
increased use of part-time workers, and job sharing (Arnold, 1997: 21-28; Baron & Neuman,
1996: 168; Cartwright & Cooper, 1997: 25,31,47; Luthans, 2002: 12). When downsizing and
layoffs occur, both the victims and the survivors experience considerable general distress,
55
anxiety and stress (Greenglass & Burke, 2001: 3), depression, resentment, and hostility
(Catalano et al in Neuman & Baron, 1998: 404) as well as uncertainty (Pollard, 2001: 25) and
low morale (Campbell-Jamison et al, 2001: 53). Downsizing, layoffs, budget cuts, pay cuts or
freezes, change in management, restructuring, and reengineering are significantly related to
expressions of hostility and obstructionism (Baron & Neuman, in Neuman & Baron, 1998: 404).
Computer monitoring of employees has been linked to increased levels of stress (Aiello & Shao
in Neuman & Baron, 1998: 404). Evidence suggests that the use of part-time workers and job-
sharing are associated with workplace aggression (Baron & Neuman, 1996: 169).
Environmental conditions such as hot temperatures, high humidity, extreme cold, poor lighting
and air quality, high noise levels, and overcrowding, have all been linked to an increase of
aggression (Geen, 2001: 32; Neuman & Baron, 1998: 404).
4.3.1.3 Individual differences
Douglas and Martinko (2001: 547) feel that although a number of frameworks have been put
forward discussing individual and situational factors as antecedents to workplace aggression
(e.g, Neuman & Baron, 1998: 401; O’Leary-Kelly et al, 1996: 233) they point out that ‘there are
some inconsistencies as to the importance of individual differences as independent predictors of
aggressive workplace behavior’. Mainly organizational or group level factors as predictors of
workplace aggression, although not thoroughly articulated, are emphasized.
Douglas and Martinko (2001: 547) state that the literature on aggression describe numerous
individual differences associated with workplace aggression, which include but is not limited to
trait anger, emotional susceptibility, negative affectivity, impulsivity, self-control, perceived
controllability, hostile attribution bias, Type A behaviour, emotional reactivity, attitudes towards
revenge, egotism, agreeableness, anxiety, gender, and past history. Baron et al (1999: 289)
studied perceived injustice (for example unfairness) and Type A behaviour as these two factors
seemed relevant to aggression in the workplace. They did find that perceived injustice was
related to aggression in the workplace, whether being the aggressor or being the victim of
workplace aggression. Those individuals that exhibited Type A behaviour were found to engage
in a higher frequency of workplace aggression than Type B. Interestingly Type As were also
more frequently the target of workplace aggression than Type Bs.
Neuman and Baron (1998: 405) add self-monitoring behaviour and hostile attribution bias to
their list of factors that contribute to individual differences. They use the classification of self-
monitoring by Snyder and Gangestad (in Neuman & Baron, 1998: 405) that states that ‘persons
classified as high in self-monitoring possess considerable social sensitivity and alter their words
or deeds to produce favourable impressions on others. When individuals are low in self-
monitoring, they seem less aware of others’ reactions or for that matter less concerned with
them. They behave in a manner ‘consistent with their lasting attitudes and values and do not
56
readily adjust their actions to changing situational conditions’ (Snyder, in Neuman & Baron,
1998: 405). Neuman and Baron (in Neuman & Baron, 1998: 405) found a significant relationship
between self-monitoring and obstructionism. Hostile attribution bias occurs when individuals
interpret another person’s behaviour as hostile, feel aggrieved and retaliate. Some may
perceive hostile intent by others even when this is not the case. They may develop an
expectancy that others will respond to them in hostile ways before any interaction has taken
place and are therefore more likely to behave aggressively in response to even minor
provocations (e.g., Dodge & Coie in Neuman & Baron, 1998: 405).
Douglas and Martinko (2001: 548) in their research design, selected trait anger, attitude toward
revenge, negative affectivity, self-control, attribution style, and past history as they felt it was
based on theory and research and it appeared to have a reasonable possibility of accounting for
a significant proportion of the variability in the incidence of workplace aggression. They did find
that in general the variables they selected accounted for more than 60% of the variance. Neither
negative affectivity nor low self-control could be independently associated with workplace
aggression. They conclude that individual differences are as important in predicting workplace
aggression as organizational or group level variables. It should be kept in mind that it is
impossible to determine which types of variables account for more variability in predicting the
incidence of workplace aggression. They argue that both individual differences and situational
causes should be included in any model of workplace aggression.
4.3.1.4 Models of workplace aggression
A number of models have been developed to understand aggression in the workplace that is
based on contemporary theories of aggression. The first theoretical model that will be outlined is
that put forward by Neuman and Baron (1998: 401). It combines social factors, situational
factors, personal determinants, internal states, and cognitive appraisal, which may lead to either
an aggressive or a non-aggressive response by the individual (Figure 4.3).
Social factors, situational factors, and personal factors (individual differences) have been
discussed previously (confer 4.3.1.3.). Internal states includes unpleasant feelings and hostile
or aggressive thoughts. Neuman and Baron (1998: 406) state that regardless of the source,
negative affect may evoke unpleasant thoughts and memories, which may lead to irritation,
annoyance, and anger. Further, the converse is also true. Aggression-related thoughts and
memories might elicit unpleasant feelings and arousal. Thus both subtle feelings and thoughts
may predispose individuals to particular forms of behaviour. Cognitive appraisal describes the
response to internal stimulation, which is an attempt to understand these thoughts and feelings.
It may happen that especially in an ambiguous situation, a person may be incorrect in his or her
causal attribution. Neuman and Baron (1998: 406) give an example based on Zillmann (in
Neuman & Baron, 1998: 406) where an individual may misattribute a state of physiological
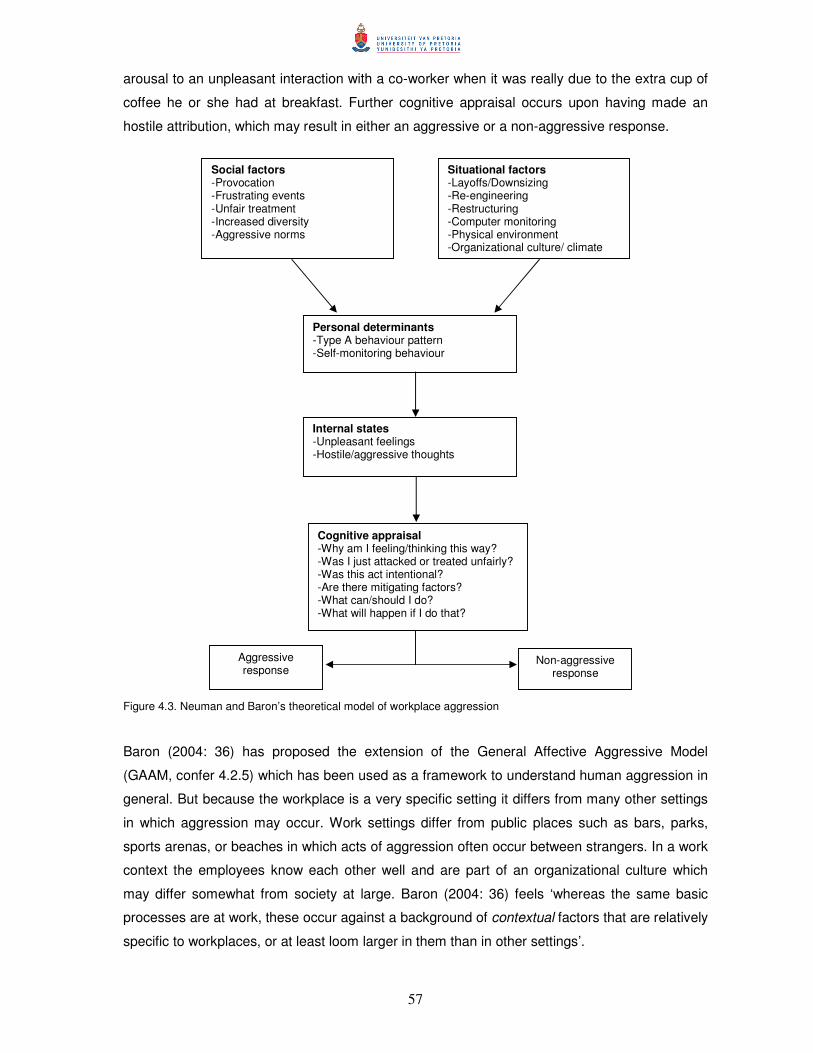
57
arousal to an unpleasant interaction with a co-worker when it was really due to the extra cup of
coffee he or she had at breakfast. Further cognitive appraisal occurs upon having made an
hostile attribution, which may result in either an aggressive or a non-aggressive response.
Figure 4.3. Neuman and Baron’s theoretical model of workplace aggression
Baron (2004: 36) has proposed the extension of the General Affective Aggressive Model
(GAAM, confer 4.2.5) which has been used as a framework to understand human aggression in
general. But because the workplace is a very specific setting it differs from many other settings
in which aggression may occur. Work settings differ from public places such as bars, parks,
sports arenas, or beaches in which acts of aggression often occur between strangers. In a work
context the employees know each other well and are part of an organizational culture which
may differ somewhat from society at large. Baron (2004: 36) feels ‘whereas the same basic
processes are at work, these occur against a background of contextual factors that are relatively
specific to workplaces, or at least loom larger in them than in other settings’.
Personal determinants -Type A behaviour pattern -Self-monitoring behaviour
Social factors -Provocation -Frustrating events -Unfair treatment -Increased diversity -Aggressive norms
Situational factors -Layoffs/Downsizing -Re-engineering -Restructuring -Computer monitoring -Physical environment -Organizational culture/ climate
Internal states -Unpleasant feelings -Hostile/aggressive thoughts
Cognitive appraisal -Why am I feeling/thinking this way? -Was I just attacked or treated unfairly? -Was this act intentional? -Are there mitigating factors? -What can/should I do? -What will happen if I do that?
Non-aggressive response
Aggressive response
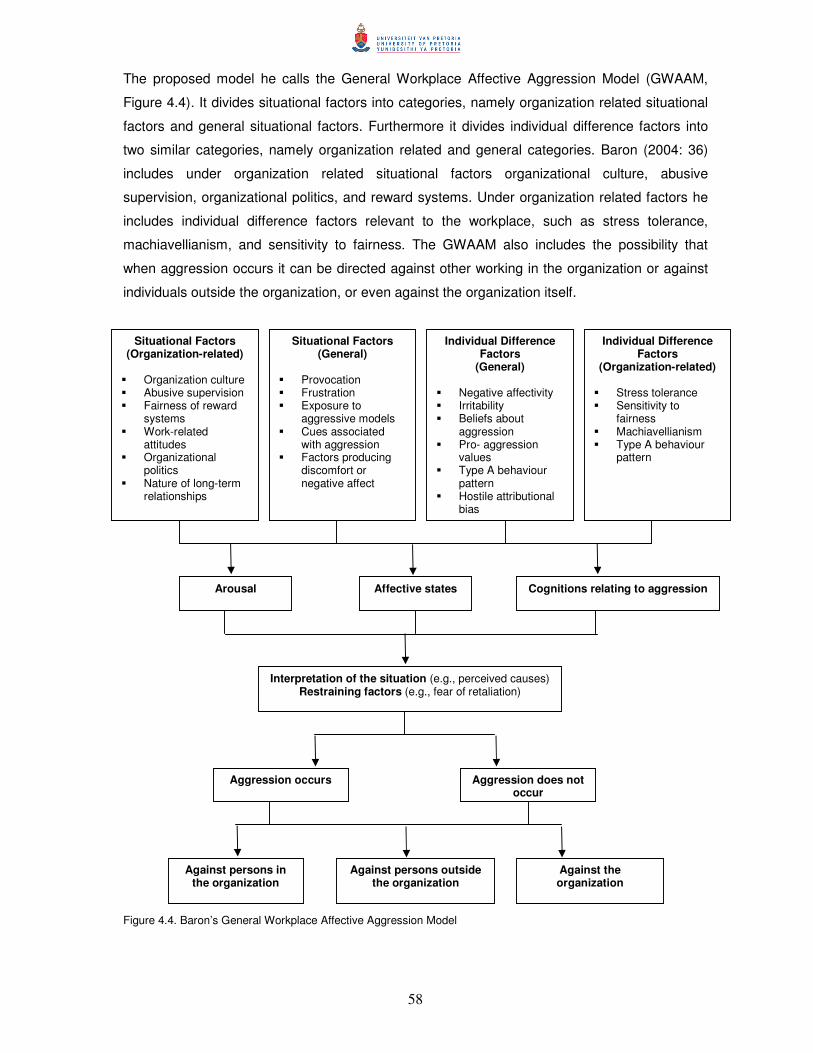
58
The proposed model he calls the General Workplace Affective Aggression Model (GWAAM,
Figure 4.4). It divides situational factors into categories, namely organization related situational
factors and general situational factors. Furthermore it divides individual difference factors into
two similar categories, namely organization related and general categories. Baron (2004: 36)
includes under organization related situational factors organizational culture, abusive
supervision, organizational politics, and reward systems. Under organization related factors he
includes individual difference factors relevant to the workplace, such as stress tolerance,
machiavellianism, and sensitivity to fairness. The GWAAM also includes the possibility that
when aggression occurs it can be directed against other working in the organization or against
individuals outside the organization, or even against the organization itself.
Figure 4.4. Baron’s General Workplace Affective Aggression Model
Interpretation of the situation (e.g., perceived causes) Restraining factors (e.g., fear of retaliation)
Aggression occurs
Arousal
Situational Factors (Organization-related)
� Organization culture � Abusive supervision � Fairness of reward
systems � Work-related
attitudes � Organizational
politics � Nature of long-term
relationships
Situational Factors (General)
� Provocation � Frustration � Exposure to
aggressive models � Cues associated
with aggression � Factors producing
discomfort or negative affect
Individual Difference Factors
(General)
� Negative affectivity � Irritability � Beliefs about
aggression � Pro- aggression
values � Type A behaviour
pattern � Hostile attributional
bias
Individual Difference Factors
(Organization-related)
� Stress tolerance � Sensitivity to
fairness � Machiavellianism � Type A behaviour
pattern
Affective states Cognitions relating to aggression
Aggression does not occur
Against persons in the organization
Against the organization
Against persons outside the organization

59
Martinko and Zellars (1998: 5) have developed a cognitive appraisal model of workplace
aggression based on cognitive appraisal theories developed amongst others by Smith and
Lazarus (in Martinko & Zellars, 1998: 7) and Weiner (in Martinko & Zellars, 1998: 7), Bandura’s
theory of aggression (in Martinko & Zellars, 1998: 7) and their knowledge of the literature
regarding workplace aggression (Figure 4.5).
Their model has been designed in the form of a path diagram. The arrows in the model depict
the causal sequence that represents the hypothesized model that would be most appropriate for
testing. The researchers refer to workplace violence and workplace aggression as to ‘retaliatory
aggression by an employee or former employee of an organization against individual(s) within
the organization, with the intent to do harm’. Further they explain that ‘the onset of violent
behaviour is often triggered by a specific negative outcome such as being fired or severely
disciplined. This outcome results in a primary appraisal that increases the individual’s overall
level of arousal and a causal search is initiated. This search (for example, secondary appraisal)
is influenced by the organizational context and individual difference factors that affect the
probability of specific causal attributions. If the specific cause is internal such as lack of effort or
ability, it usually leads to an emotional response such as shame or guilt and a non-violent
response is likely. On the other hand, if the cause is attributed to an external cause which is
perceived to be stable, controllable, and intentional, without mitigating circumstances, anger is
likely and aggression or violence may occur’.
They feel that the cognitive appraisal, thus the attribution interpretation of the outcomes in the
workplace, play a critical role in determining both the emotions and behaviours associated with
acts of aggression. As the model only refers to retaliatory aggression, the black box has been
included to allude to instrumental and other forms of aggression not mentioned in the model and
which lead directly to violent behaviours.
4.4 Conclusion
Aggression and violence in the workplace has become an important topic over the last two
decades. Workplace aggression may be defined as actions by individuals that “harm others with
whom they work, or have worked, or the organizations on which they are presently, or were
previously, employed’. Although the media highlights acts of violence such as homicide, it is
clear that the vast majority of aggressive acts in work environments do not involve aggressive
acts that are overt, such as physical or sexual assaults, but are covert, verbal and passive in
nature.

Figure 4.5: A cognitive appraisal model of workplace aggression
Nonviolence and nonaggression
Decreased expectations of triggers
Organizational context -Authoritarian leadership -Numerous rules and procedures -Adverse physical conditions -Inflexible policies -Culture of aggression -Stimulus similarity -Proximity and association -Policies discouraging aggression -Discipline for aggression -Grievance procedures -Social sanctions
Primary appraisal
Individual differences -Negative affectivity -External locus of control -Hostile attribution style -Impulsivity -Extreme control -Gender/Male -Personal history -Emotional susceptibility -Aggressive culture -Reinforcement of aggression -Aggressive role models BLACK BOX
Secondary appraisal
Trigger event Typical frustrating events -Disciplinary hearings -Job termination -Multiple reprimands -Poor annual appraisal Repetition of frustrating events
Emotional arousal
Causal attribution
Uncontrollable
External
Controllable
Mitigating circumstances
No Mitigating Circumstances (Intentionality/ responsibility
Anger
No anger Unstable/Specific cause
Stable/Global cause
Aggression or violence
Tertiary appraisal
61
Baxter (in Duvenhage, Rapport, Sunday 10 February 2002) states that a study in the USA
showed that 10% of the workers have seen the use of force in their work environment, nearly
half feel that workers shout at one another, and 30% state that they experience sleep
disturbances as a result of the tension at work.
The present research is concerned with the potential causes of workplace aggression, which
are numerous. They include social determinants (for example frustration, unfair treatment),
situational factors (for example downsizing, increased workforce diversity), and individual
differences (Type A personality, attribution style). The purpose of the present research is to
determine the role that stress generated outside and within the organization has on the
individual in terms of both overt and covert aggression in the workplace. Little evidence
currently exists that relates sources of stress to aggression in the workplace. The research is
also aimed at presenting empirical evidence on the different forms and relative frequency of
workplace aggression within the South African context based on the work of Baron and Neuman
(1996: 161).
Research of stress experienced in the workplace has repeatedly shown negative psychological
reactions by the employees, which include anxiety, worry, and depression. The next chapter
will focus on these three factors and the role they play in the lives of individuals affected by
stress.

62
CHAPTER 5
ANXIETY, DEPRESSION, AND WORRY 5.1 Introduction
When some individuals experiences one or more stressors over a period of time, whether they
occur at work or outside the work context, they are not able to cope with these stressful situations.
This may have negative consequences on a behavioural, physical, and psychological level for
them.
Behavioural consequences may include overeating, undernourishment, sleeplessness, smoking,
drinking, and aggression. Physical consequences may refer to medical conditions such as
headaches, migraine, hypertension, and heart disease. Psychological consequences are
associated with feelings of helplessness, mood changes, anger, anxiety, and depression
(Cartwright & Cooper, 1997: 2, 8; Luthans, 2002: 411; Quick et al, 1997: 71). The psychological
consequences of stress, specifically anxiety, worry, and depression, are the focus of this chapter.
Anxiety, worry, and depression will be discussed in general terms, together with a brief discussion
of the most relevant theories applicable. The role of anxiety, worry, and depression due to stress
found in the workplace will complete the discussion.
5.2 Anxiety
The term anxiety has a long history and is difficult to define and distinguish from fear. There has
never been complete agreement as to whether these two words are indeed distinct from each
other. Historically, fear has been distinguished from anxiety by whether there is a clear and obvious
source of danger that would be regarded as real by most people (Butcher et al, 2004: 174). When
anxiety is experienced, the danger frequently cannot be clearly specified. Butcher et al (2004: 174)
state that ‘anxiety seems to be experienced as an unpleasant inner state in which we are
anticipating some dreadful thing happening that is not predictable from our actual circumstances’.
Anxiety includes feelings of uneasiness or distress, often associated with apprehension of
misfortune and danger (Edwards, 1999: 178). A more recent distinction between fear or panic, and
anxiety views fear or panic as a basic emotion that involves the activation of the “fight or flight”
response, allowing the individual to react quickly when faced with and immediate threat. Butcher et
al (2004: 175) adhere to Barlow’s view that anxiety ‘is best thought of as a complex blend of
emotions and cognitions that is much more diffuse than fear’. Further ‘at the cognitive/subjective
level, anxiety involves negative mood, worry about possible future threat or danger, self-
63
preoccupation, and a sense of being unable to predict the future threat or to control it if it occurs’.
Anxiety therefore involves preparing for the fight or flight response should it become necessary.
Together with the cognitive/subjective component a physiological and a behavioural component of
anxiety are found. The physiological component reflects a state of chronic excessive arousal, which
may indicate a state of readiness for dealing with danger should it occur. The behavioural
component according to Barlow (in Butcher et al, 2004: 175) refers to a ‘strong tendency to avoid
situations where the danger or threat might be encountered, but there is no immediate urge to flee
associated with anxiety as there is with fear’. Butcher et al (2004: 175) find that ‘the adaptive value
of anxiety may derive from the fact that it helps us plan for and prepare for possible threat, and in
mild to moderate degrees, anxiety actually enhances learning and performance’.
Anxiety may often be adaptive in mild or moderate degrees, but it can be maladaptive when it
becomes chronic and severe. Mild or moderate anxiety and chronic and severe anxiety are also
referred to as normal and pathological anxiety respectively (Kaplan et al, 1994: 573).
5.2.1 Normal anxiety
Anxiety is a sensation that is experienced by virtually all human beings. Kaplan et al (1994: 573)
describe anxiety as characterized by a feeling of ‘a diffuse, unpleasant, vague apprehension, often
accompanied by autonomic symptoms, such as headache, perspiration, palpitations, tightness in
the chest, and mild stomach discomfort’. Sometimes such an individual may feel restless, often
reflected in his or her inability to sit or stand still for long periods. The exact way these symptoms
present varies from person to person.
5.2.2 Pathological anxiety
When anxiety becomes chronic and severe it becomes pathological. Kaplan et al (1994: 573)
describe it as ‘an inappropriate response to a given stimulus by virtue of either its intensity or its
duration’. On a practical level it is differentiated from normal anxiety by the feedback given by the
person, his or her family, friends, and the assessment of the medical practitioner. The DSM-IV-TR
recognizes seven primary types of anxiety disorder: specific and social phobias, panic disorder with
or without agoraphobia, generalized anxiety disorder, obsessive-compulsive disorder, and post-
traumatic stress disorder (Butcher et al, 2004: 173).
64
5.2.3 Theories of anxiety
One way to better understand anxiety is to look at the most relevant theories that have contributed
to the understanding of the causes of anxiety. Each theory has a somewhat different conceptual
approach and practical usefulness. The most relevant theories include the psychoanalytic, learning,
existential, and biological theories.
5.2.3.1 Psychoanalytical theories
Freud (in Kaplan et al, 1994: 575; Edwards, 1999: 179) developed his theory of anxiety over a
period of time. Initially he proposed that anxiety came from a blocked libido, which meant that when
it was not possible to carry out a sexual urge, feelings of anxiety were experienced. Later he
modified his theory and in 1926 he proposed that anxiety was a signal to the ego that an
unacceptable drive was pressing for conscious representation and discharge. The ego then has to
take defensive action including repression. If the defensive action was inadequate, the anxiety may
emerge as a fully blown panic attack. Other defense mechanisms may result in symptom formation
producing a classic neurotic disorder such as hysteria, phobia, and obsessive-compulsive neurosis.
Kaplan et al (1994: 575) state that within psychoanalytic theory anxiety is seen as falling into four
major categories, depending on the nature of the feared consequences. The first being id or
impulse anxiety, the second separation anxiety, the third castration anxiety, and the fourth
superego anxiety. Generally these categories are hypothesized to develop at various stags of
growth and development. Kaplan et al (1994: 576) explain:
Id or impulse anxiety is related to the primitive, diffuse discomforts of infants when they feel overwhelmed with
needs and stimuli over which their helpless state provides on control. Separation anxiety occurs on somewhat
older but still pre-oedipal children, who fear the loss of love or even abandonment by their parents of they fail
to control and direct their impulses on conformity with their parents’ standards and demands. The fantasies of
castration that characterize the Oedipal child, particularly in relation to the child’s developing sexual impulses,
are reflected in the castration anxiety of the adult. Superego anxiety is the direct result of the final development
of the superego that marks the passing of the Oedipus complex and the advent of the pre-pubertal period of
latency.
5.2.3.2 Learning theories
Learning or behavioural theories view anxiety as a conditioned response brought about by the
conjunction on one or more occasions of an initially neutral stimulus with a painful event (Edwards,
1999: 179; Kaplan et al, 1994: 576; Maddi, 1996: 448). Kaplan et al (1994: 576) give the example
where a person who does not have food allergies may become sick after eating contaminated

65
shellfish. He or she may be exposed to shellfish again on numerous occasions and this may cause
him or her to feel sick. This person may come to distrust all food prepared by others through the
process of generalization. Others may learn to respond to certain situations with anxiety through
vicarious learning often from their parents.
Cognitive approaches have proposed alternative theories to explain the causes of anxiety. Faulty,
distorted, or counterproductive thinking patterns accompany or occur just before the experience of
anxiety, which may lead to or be associated with any of the anxiety disorders (Edwards, 1999: 180;
Kaplan et al, 1994: 576).
5.2.3.3 Existential theories
Søren Kierkegaard (in Edwards, 1999: 178) in the early part of the nineteenth century thought that
anxiety was part of the human condition. Anxiety would be the result of having the freedom to
choose, without knowing if the choice was correct. He saw choice as a burden.
Existential theorists define anxiety more broadly than other theorists (May & Yalom, 1989: 364).
They see anxiety as arising from the personal need to survive, to preserve and to assert one’s
being (May & Yalom, 1989: 364). When persons become aware of a profound nothingness in their
lives, they may experience feelings that may be even more profoundly discomforting than an
acceptance of their inevitable death. Anxiety results from this vast void of existence and meaning
(Kaplan et al, 1994: 576).
5.2.3.4 Biological theories
Biological theories of anxiety have developed out of animal studies, studies of patients with known
anxiety inducing biological factors, neuroscience, and the actions of psychotherapeutic drugs
(Kaplan et al, 1994: 576). Two schools of thought exist regarding the role of biological factors in
anxiety. One school proposes that measurable biological changes in individuals are psychologically
induced, whereas the other school proposes that biological changes precede the occurrence of
psychological problems.
The autonomic nervous system is thought to play a role in the manifestation of anxiety. Stimulation
of the autonomic nervous system causes cardiovascular, muscular, gastrointestinal, and respiratory
symptoms often associated with the subjective experience of anxiety. Neurotransmitters are
associated with anxiety on the basis of animal studies and these include norepinephrine, serotonin,
and �-aminobutyric acid. Kaplan et al (1994: 576) explain the role of norepinephrine as follows:

66
The general theory regarding the role of norepinephrine in anxiety disorders is that affected patients may have
a poorly regulated noradrenergic system that has occasional bursts of activity. The cell bodies of the
noradrenergic system are primarily localized to the locus ceruleus in the rostral pons, and they project their
axons to the cerebral cortex, the limbic system, the brainstem, and the spinal cord. Experiments in primates
have demonstrated that stimulation of the locus ceruleus produces a fear response in the animals and that
ablation of the same area inhibits or completely blocks the ability of the animals to form a fear response.
Interest in serotonin was initially due to observation that serotonergic antidepressants had
therapeutic affects in some anxiety disorders, which stimulated the search for serotonin receptor
types. Kaplan et al (1994: 577) explain:
The cell bodies of most of the serotonergic neurons are located in the raphe nuclei in the rostral brainstem and
project to the cerebral cortex, the limbic system (especially the amygdala and the hippocampus), and the
hypothalamus. Although the administration of serotonergic agents to animals results in behavior suggestive of
anxiety, the data on similar effects in humans are less robust.
The role of �-aminobutyric acid (GABA) in anxiety disorders is most strongly supported by the
observation that benzodiazepines, which are known to enhance the activity of GABA, are effective
in the treatment of some types of anxiety. Researchers hypothesize that some patients with anxiety
disorders have abnormal functioning of their GABAA receptors. However, this connection is difficult
to prove (Kaplan et al, 1994: 577).
Brain-imaging studies have revealed that some patients had an increase in the size of cerebral
ventricles, whereas others reported abnormal findings in the right hemisphere but not in the left
hemisphere. These abnormal findings suggested that some type of cerebral asymmetry might be
important in the development of anxiety in specific patients (Kaplan et al, 1994: 577).
Finally, genetic studies have shown that some genetic linkage, which plays a role in the
development of anxiety disorders. Kaplan et al (1994: 477) reports that almost half of all patients
diagnosed with panic disorder have at least one relative who also suffers from panic attacks. The
figures for the other anxiety disorders are not as high, but also indicate a higher occurrence
amongst first-degree relatives.
5.2.4 Stress and anxiety
The term stress is often used interchangeably with anxiety and Lazarus (in Cotton, 1990: 29)
acknowledges a great deal of overlap between the two concepts. Anxiety may be seen as a sign of
stress, or it could be part of the stress response. Cotton (1990: 29) views anxiety as a trait or
individual personality characteristic, and stress as a function of a particular set of circumstances.
67
An individual may experience stress when exposed to a stressor, exhibiting a stress response.
Anxiety may be part of the stress response. Edwards (1999: 189) sees anxiety as a mildly stressing
part of life, which can come to dominate and interfere with ones functioning.
Stressful life events are often associated with both panic attacks and generalized anxiety disorder
(Schell, 1997: 141). For both anxiety disorders, stressful life events that are perceived by the
individual as a threat that involve a future crises or danger often occur around the time of onset.
5.3 Depression
Depression is a term that is not only used to describe an individual’s mood, but also a disorder.
When used to describe a mood, depression is seen as part of the normal range of human
experience, often a result of some frustration or disappointment. These include painful but common
life events, such as significant personal, interpersonal, or economic losses (Butcher et al, 2004:
218; Schell, 1997: 150). Individuals may experience feelings of sadness, discouragement,
pessimism, and hopelessness. Depression is unpleasant when one is caught up in it, but it does
not last long. Butcher et al (2004: 218) calls this experience of depression normal, as it is brief and
mild. Normal depressions are almost always triggered by recent stress such as the loss of a loved
one, loss of a favoured status or position, separation or divorce, financial loss, the break-up of a
romantic affair, retirement, separation from a friend absence from home for the first time, or even
the loss of a cherished pet (Butcher et al, 2004: 218).
At a certain point normal depression becomes a mood disorder, where depression is associated
with significant functional impairment. However, there is a grey area where the mood disorder does
not fulfil the criteria for normal depression and clinical depression. Two categories are included in
the DSM-IV-TR and they are dysthemic disorder and adjustment disorder with depressed mood
(Butcher et al, 2004: 219). Both are characterized by the presence of symptoms that are less
severe than those of major depressive disorder. When an individual exhibits more symptoms than
required for the diagnosis of dysthemia, and the symptoms are more persistent then a diagnoses of
major depression can be made. Kaplan et al (1994: 516) describe individuals who have been
diagnosed with major depression as having ‘a loss of energy and interest, feelings of guilt, difficulty
in concentrating, loss of appetite, and thoughts of death or suicide’. Other signs and symptoms of
mood disorders mentioned include ‘changes in activity level, cognitive abilities, speech, and
vegetative functions (such as sleep, appetite, sexual activity, and other biological rhythms)’.
Depressive illness occurs all over the world and does not differ from country or culture (Schell,
1997: 151; Kaplan et al, 1994: 517). Approximately twice as many women are diagnosed with

68
major depressive disorder than men. The possible reasons for this difference is thought to be found
in hormonal differences, possible effects of childbirth, differing psychosocial stressors for women
than men, and the role of learned helplessness (Kaplan et al, 1994: 517).
5.3.1 Causal factors of depression
The causes of depression can be divided into biological and genetic factors, as well as
psychosocial factors (Butcher et al, 2004: 223; Kaplan et al, 1994: 518). Kaplan et al (1994: 518)
feel that this division is artificial because of the probability that these different factors interact with
one another. The example they give is that psychosocial and genetic factors can affect biological
factors such as neurotransmitters, biological and psychosocial factors can again affect gene
expression, and finally biological and genetic factors can affect an individual’s response to
psychosocial factors.
To further understand the causes of depression it is necessary to turn to those theories that have
received much attention over the years, which include psychodynamic theories, cognitive theory,
learned helplessness and interpersonal effects of mood disorders (Butcher et al, 2004: 237).
5.3.1.1 Biological and genetic factors
Researchers who have attempted to find the biological factors that cause depression have
investigated genetic and constitutional factors, as well as neurophysiological,
neuroendocrinological, and biochemical factors (Butcher et al, 2004: 224).
1) Genetic and constitutional factors
Research has shown that genetics does play an important role in the development of depression.
Family studies have shown that the prevalence of mood disorders is higher amongst first-degree
relatives. Butcher et al (2004: 224) caution that because of the difficultly of disentangling hereditary
and environmental influences, a higher rate of disorder among family members can never in itself
be taken a conclusive proof of genetic causation.
Twin studies have shown that there may be a moderate genetic contribution to unipolar depression.
Monozygotic twins are about twice as likely to develop major depression, as are dizygotic twins of a
depressed twin. The concordance rate varies from 33 to 90 percent depending on the particular
study (Butcher et al, 2004: 224, Kaplan et al, 1994: 522).
69
Adoption studies, although limited in number, have also provided evidence for the genetic basis of
mood disorders. Two studies have found a strong genetic component for the inheritance of major
depressive disorder (Butcher et al, 2004: 224; Kaplan et al, 1994: 522). One study estimated that
genes contribute about 50 percent of the variance in the tendency to develop unipolar depression.
2) Neurophysiological and neuroendocrinological factors
Research on potential neurophysiological and neuroendocrine correlates of mood disorders has
shown that the hypothalamus is central to the regulation of the neuroendocrine axes. The one axis
focuses on the hypothalamic-pituitary-adrenal axis, and in particular the hormone cortisol, which is
excreted by the outermost portion of he adrenal glands. Butcher et al (2004: 225) mention that
blood plasma levels of cortisol are known to be elevated in from 50 to 60 percent of seriously
depressed patients, indicative of a possible cause. The other axis focuses on the hypothalamic-
pituitary-thyroid, as it is known that disturbances to this axis are linked to mood disorders.
Individuals with low thyroid levels often tend to be depressed. About 30 percent of depressed
patients who have normal thyroid levels, show deregulation of this axis upon the infusion of
thyrotropin-releasing hormone (Butcher et al, 2004: 225; Kaplan et al, 1994: 520).
Other neurophysiological research has shown that lesions of the left anterior or prefrontal cortex,
often lead to depression. Even when no lesions were present lowered levels of brain activity in this
region was linked to depression (Butcher et al, 2004: 225).
Another interesting area of research focuses of the role sleep abnormalities and circadian rhythms
play in the aetiology of depression (Butcher et al, 2004: 226; Kaplan et al, 1994: 520). Problems
with sleeping such as early morning awakening, multiple awakenings during the night, and
hypersomnia are typical symptoms of depression. Research using EEG recordings has found that
many depressed patients show a shorter than expected latency to the first period of REM sleep as
well as greater amounts REM sleep early in the night than non-depressed individuals. Thus a
depressed person is subjected to a lower amount of deep sleep (Butcher et al, 2004: 226).
Sleep, body temperature, the secretion of cortisol and thyroid stimulating hormones, as well as
melatonin, are all part of circadian cycles that humans have (Butcher et al, 2004: 227). Two related
central “oscillators” (also described as internal biological clocks), one strong and the other one
weak, control these circadian rhythms. The strong oscillator, which is relatively impervious to
environmental influences, controls the regulation of body temperature, the secretion of hormones,
and REM sleep rhythms. The weak oscillator, which responds readily to environmental influences,
70
controls the rest-activity and sleep-wake cycles (Goodwin & Jamison, in Butcher et al, 2004: 227).
Some abnormalities have been found in all of these rhythms in depressed patients, although not all
patients show abnormalities in all rhythms (Howland & Thase; Thase & Howland; in Butcher et al,
2004: 227).
3) Biochemical factors
Biogenic amines, specifically norepinephrine and serotonin, are neurotransmitters that are
implicated in the cause of mood disorders (Butcher et al, 2004: 224; Kaplan et al, 1994: 518).
Depression is thought to result from the disruptions in the delicate balance of these
neurotransmitters that regulate the activity of the brain’s nerve cells or neurons. When they are
released by the activated presynaptic neuron, they mediate the transfer of merge ompulaes across
the synaptic cleft from one neuron to the next on a neuronal pathway. They may either stimulate or
inhibit the firing of the next neuron in the chain (Carson et al, 2000: 214). A low concentration of
these neurotransmitters at the synapse may precipitate depression.
5.3.1.2 Psychosocial factors
Psychosocial factors play an equally important role in the aetiology of depression as biological
factors of which the most important factor is stress.
Research has demonstrated that stress has been implicated in the onset of depression and
specifically unipolar depression (Butcher et al, 2004: 228; Kaplan et al, 1994: 522). Stressful life
events most often serve as the precipitating factor for mood disorders. Beck (in Carson et al, 2000:
217) presented a broad classification of those factors that most frequently precede the onset of
depression:
� Situations that tend to lower self-esteem;
� The thwarting of an important goal or the posing of an insoluble dilemma;
� A physical disease or abnormality that activates ideas of deterioration or death;
� Single stressors of overwhelming magnitude;
� Several stressors occurring in a series;
� Insidious stressors unrecognised as such by an affected person.
Paykel (in Carson et al, 2000: 217) added that in particular separations, whether through loss or
other causes from people important in ones life are strongly associated with depression. Data
suggests that when an individual looses a parent before the age of 11, the likelihood of depression
71
developing later in life is very good. The loss of a spouse is the life stressor most associated with
the onset of depression (Kaplan et al, 1994: 523). Care giving to a spouse with a debilitating
disease such as Alzheimer’s is known to precede the onset of mood disorders for the caregiver
(Russo et al, in Butcher et al, 2004: 228).
5.3.2 Theories of depression
A number of theories have been developed to try and explain why individuals become depressed.
These include psychodynamic theories, cognitive theories, learned helplessness, and the role that
interpersonal effects have on mood disorders.
5.3.2.1 Psychodynamic theories
Freud (in Butcher et al, 2004: 231) observed the similarity between the symptoms of clinical
depression and the symptoms of someone in mourning. He postulated a relationship between the
loss of someone or some object and melancholia. Butcher et al, (2004: 231) explain that ‘upon the
loss of a loved one, the mourner regresses to the oral stage of development (when the infant
cannot distinguish self from other) and introjects or incorporates the lost person, feeling all the
same feelings toward the self as toward the lost person’. These were believed to include both anger
and hostility because the person unconsciously holds negative feelings toward the loved one partly
due to their power over him or her. In the case of depression, which was due to imagined or
symbolic losses, the person’s anger and hostility would be directed towards the self. Also
depressed people showed lower self-esteem and were more self-critical.
Melanie Klein (in Butcher et al, 2004: 231) later emphasized more than Freud did the importance of
the quality of the mother-infant relationship. According to her, depressed individuals had failed to
establish loving introjects during childhood (Kaplan et al, 1994: 523). Bowlby (in Butcher et al,
2004: 231) also found that there was a relationship between the child’s need for a secure
attachment to parental figures as to be resistant to depression.
5.3.2.2 Cognitive theory
One of the most prominent theories of depression for more than 35 years is Beck’s cognitive theory
of depression (Butcher et al, 2004: 232). This theory maintains that how one thinks largely
determines how one feels and behaves. This thinking is often expressed as the individual’s
‘negative automatic thoughts’ or appraisals of a specific situation (Wills & Sanders, 1997: 10).
These appraisals are often dysfunctional and involve cognitive distortions such as all-or-nothing
thinking, overgeneralizations, jumping to conclusions, ‘should’ statements, and mind reading to
72
mention a few. In the case of depression the negative thinking revolves around the theme of loss,
whether it involves loss of a loved object or loss of a sense of self-esteem (Wills & Sanders, 1997:
12). Important to depression is the loss of a sense of hopefulness about the world and the future.
Negative automatic thoughts are those cognitions closest to the surface of consciousness.
However, there are also deeper cognitions, which predispose an individual to interpret events in a
relatively specific way (Wills & Sanders, 1997: 12). These deeper cognitions are also known as
dysfunctional beliefs. These beliefs are thought to originate during childhood and adolescence as a
result of specific experiences with one’s parents and significant others and may lie dormant for
years before triggered by significant stressors (Butcher et al, 2004: 232).
5.3.2.3 Learned helplessness
The learned helplessness theory was first proposed by Seligman (in Butcher et al, 2004: 234) and
was based upon laboratory experiments in which dogs were repeatedly exposed to electric shocks
from which they could not escape. The dogs, when placed in new situations made no attempt to
escape even when they could, as they had given up. They learnt that they were helpless. When
applied to depressed humans who were experiencing stressful life events over which they had no
control, they showed the same reaction of helplessness as seen with the dogs (Butcher et al, 2004:
234; Kaplan et al, 1994: 523). A major revision of the learned helplessness theory by Abramson et
al (in Butcher et al, 2004: 234) introduced the concept of a pessimistic attribution style, which in
conjunction with one or more negative life events put a person at risk for depression. A further
revision by Abramson et al (in Butcher et al, 2004: 235) known as hopelessness theory, proposed
that ‘having a pessimistic attributional style in conjunction with one or more negative life events was
not sufficient to produce depression unless one first experienced a state of hopelessness’. An
expectancy of hopelessness was defined as ‘ the perception that one had no control over what was
going to happen and by absolute certainty that an important bad outcome was going to occur or
that a highly desired good outcome was not going to occur’.
5.3.2.4 Interpersonal effects of mood disorders
A considerable amount of research has shown the importance of interpersonal factors in the
aetiology of depression (Butcher et al, 2004: 235). One factor refers to people who lack social
support and this is associated with vulnerability to depression. Interestingly, depressed individuals
have smaller and less supportive social networks than non-depressed individuals (Hammen, in
Butcher et al, 2004: 235). Another factor refers to the evidence that depressed persons have social
skills deficits. They tend to speak slowly and monotonously; they maintain less eye contact and are
poorer at interpersonal problem solving (Gotlib & Hammen, in Butcher et al, 2004: 235).
73
Marital distress may lead to depression because research shows that marital distress often occurs
before a depressive episode (Gotlib & Hammen, in Butcher et al, 2004: 237). The opposite also
holds true in that a depressed person may induce negative affect in their spouse, which leads to
marital distress (Butcher et al, 2004: 237).
5.4 Worry
Worry was not well researched until in the second half of the twentieth century when Liebert and
Morris (in Fresco et al, 2002: 313) discovered that responses in a test anxiety questionnaire
consisted of two distinct factors, which they called Worry and Emotionality. Fresco et al, (2002:
314) explain that the Worry factor represented self-evaluative negative cognition about test
performance, where as the Emotionality factor appeared to focus on awareness of feeling states
and physiological activity. Worry was found to have a stronger relationship than Emotionality to
actual test performance, task-generated interference of attention, and grade point average.
Borkovec (in Fresco et al, 2002: 314) was the first to research the experience of worry in its own
right when he sought a treatment for insomnia. Borkovec found that many individuals who had
difficulty in sleeping had engaged in excessive cognitive activity with a negative valence and he
termed this state as worrying.
Worry is a universal phenomenon, which was defined by Borkovec, Robinson, Prusinsky, and
DePree (in Borkovec, 1994: 7) as ‘a chain of thoughts and images, negatively affect-laden and
relatively incontrollable; it represents an attempt to engage in mental problem-solving on an issue
whose outcome is uncertain but contains the possibility of one or more negative outcomes;
consequently, worry relates closely to the fear process’.
Borkovec (1994: 7) later modified this definition by stating that worry predominantly involves
thought activity rather than imagery, which can be described as a type of internal verbal-linguistic
activity, for example thinking.
Borkovec, Alcaine, and Behar (in Fresco et al, 2002: 314) propose that the most important function
of worry is its use as ‘an avoidance response as it allows individuals to process emotional topics at
an abstract, conceptual level and thus to avoid aversive images, autonomic arousal, and intense
negative emotions on the short-run’. Therefore worry most likely prevents full access to fear
structures in memory and may inhibit emotional processing necessary for anxiety reduction.
74
Worry is associated with all the anxiety disorders (Barlow, in Fresco et al, 2002: 314) and is the
main feature of generalized anxiety disorder (Butcher et al, 2004: 200). Butcher et al (2004: 197)
describe people suffering from generalized anxiety disorder as living in a constant state of tension,
worry, and diffuse uneasiness. The fundamental process is described as one of anxious
apprehension, which is defined as a ‘future-orientated mood state in which a person attempts to be
constantly ready to deal with upcoming negative events’ (Barlow et al, in Butcher et al, 2004: 197).
It is a highly significant contributor to the maintenance of anxiety (Borkovec, 1994: 6). Worry also
appears to be a common aspect of depression (Andrews & Borkovec in Molina et al, 1998: 110).
Davey (1994: 38) alludes to the fact that worry is also associated to problem solving and coping.
Davey et al. (in Davey, 1994: 38) initially found no significant correlations between frequency of
worrying and the frequency of problem-focused coping activities. When the effect of anxiety was
partialled out, they found that worrying was significantly associated with problem-focused coping
activities. These included active cognitive coping, active behavioural coping, information seeking
and problem solving. This suggests that although anxiety and worry are correlated, they have
separate effects. Davey (1994: 38) argues that worry is essentially made up of two components.
The first component that is unique to worry is associated with constructive problem solving,
whereas the second that is shared with anxiety is pathological. This does not deny the adaptive
functions of anxiety.
Borkovec et al (in Borkovec, 1994: 9) report that worry correlates most highly with social evaluation
and little with non-social items. Molina and Borkovec (1994: 265) found that individuals high in
social anxiety report the highest levels of worry. Self-consciousness is also associated with worry
and people who worry tend to score significantly higher on the self-conscious scale (Pruzinsky &
Borkovec, in Borkovec, 1994: 9). Fenigstein (in Keogh, French, & Reidy, 1998: 68) asserts that self-
consciousness is either private, focusing inwardly towards thoughts, or public, focusing on outside
factors.
5.5 Work-related stress, anxiety, depression and worry
Work-related stress is found in all areas of work and both depression and health problems increase
as the stress continues (Baron & Byrne, 1997: 527). In times of stress the individual may
experience depression, worry, and anxiety (e.g, Campbell-Jamison et al, 2001: 45; Dormann &
Zapf,2002: 34; Terluin et al, 2004: 195), which in turn may not only interfere with health-related
behaviours such as eating a balanced diet, exercising, and getting sufficient sleep (Wiebe &
75
McCallum, 1986: 436), but when high, may adversely affect the body’s immune system resulting in
stress-related illnesses (Quick et al, 1997: 42).
Campbell-Jamison et al, (2001: 45) examined the psychological affects of downsizing and
redundancy on those remaining behind within the organization after large-scale redundancy
programs. They felt amongst others, vulnerable and stressed expressing worry and anxiety about
their future. With downsizing there is an increase in job insecurity that can result in an increase in
general distress, anxiety, and depression. Roskies and Louis-Guerin (1990: 356) found that
managers who were insecure about their jobs showed poorer health and their levels of distress
rose proportionally with their level of insecurity. Worrall and Cooper (in Sparks et al, 2001: 490) for
example, found that over 60% of a national sample of 5 000 British managers had experienced a
major restructuring during the previous year involving downsizing and outsourcing. Nearly two out
of three experienced increased job insecurity, lowered morale, and a loss in motivation and loyalty.
Electronic monitoring, which is used to monitor employees by many organizations, invades the
privacy of the employee and leads to increased worker stress (Ross in Alder &Tompkins, 1997:
262). Nussbaum and Du Rivage (in Alder & Tompkins, 1997: 262) found that highly monitored
employees showed a higher degree of depression, anxiety, instability, fatigue, and anger than
employees that were not monitored. The effect of affirmative action amongst a group of black
employees in South Africa showed that amongst the symptoms of stress they experienced, both
anxiety and depression were found (Van Zyl, 1998: 24). Schonfeld (2000: 366) in an update on
depressive symptoms and job satisfaction in first-year women teachers found that depressive
symptoms were the highest amongst those women who experienced the most adverse work
environments.
5.6 Conclusion
Anxiety, depression and worry all play a role in the stress process. Anxiety can be adaptive when
mild, but when it becomes extreme and pervasive it may interfere with the individual’s functioning.
Stress and anxiety are sometimes used interchangeably Most individuals that may experience high
levels of stress who exhibit symptoms of anxiety will not meet the formal criteria for a diagnosis of
an anxiety state.
Depression is clearly associated with the stress response especially when the individual is
confronted with loss of some kind, whether it is a loss of a relationship, status, or competence.
Individuals who suffer from depression are often unable to work or are able to work at a reduced
level of efficiency.

76
Worry is an area that has been associated with anxiety, more specifically generalized anxiety. It is a
phenomenon that involves ‘a chain of thoughts and images, negatively affect-laden and relatively
uncontrollable’ and is an attempt at problem solving. It also is associated with depression, social
evaluation, and correlates significantly with coping.
Within the work context the relationship between stress, anxiety and depression is well
documented. However research specifically correlating stress and worry within the workplace does
not abound. The purpose of the present study is to determine consequences of stress experienced
by employees in the workplace within the South African context in terms of anxiety, depression and
worry. This information is important in the context of developing awareness within organizations of
the extent of the health problems that exist as a result of stress and the costs that are associated
with the resultant poor performance of their employees. This knowledge should be used in the
development of stress management policies and programmes within the organization.
Not all individuals react negatively to stress. Some are able to deal effectively with the impact of the
stressor and even thrive as a result of it. The next chapter considers the role that coping plays in
dealing with stress.

77
CHAPTER 6
COPING 6.1 Introduction
Stress and coping are two interrelated and dependent processes (Butcher et al, 2004: 140). When
one considers the different possible events or situations that might be viewed as stressful, it is not
difficult to conclude that everything is potentially stressful. However this is not the case and is
dependent not only on the amount of stress experienced by the individual, but also on the ability of
the individual to cope with the stressor (Cotton, 1990: 39). The importance of coping has not only
been supported by research in psychology but other disciplines such as epidemiology, sociology,
and physiology (Parkes, 1994: 111). Coping will first be defined in this chapter, hereafter the focus
will be on a number of specific coping strategies that individuals use to deal with stress within and
outside of the work context as well as on organizational coping strategies designed by
management to prevent or reduce work stress.
6.2 Coping defined
Individuals will often state that “they are coping”, implying that they are able to deal with a
perceived situation successfully (Stone & Neale in Cox & Ferguson, 1991: 19). The Reader’s
Digest Oxford Complete Wordfinder (1993) defines the word cope a: 1) to deal effectively or
contend successfully with a person or a task; and to 2) manage successfully; deal with the situation
or problem. However, for research purposes, definitions of coping need to be independent of
outcome (Lazarus and Folkman, 1984: 142).
Lazarus and Folkman (1984: 141) define coping as ‘constantly changing cognitive and behavioral
efforts to manage specific external and/or internal demands that are appraised as taxing or
exceeding the resources of the person’. This definition addresses certain limitations of traditional
approaches, which according to Lazarus and Folkman (1984: 141) are as follows:
� It is process-oriented rather than trait-orientated, as indicated by the use of the words
“constantly changing” and “specific” demands and conflicts.
� This definition implies that there is a distinction between coping and automatic adaptive
behaviour by limiting coping to demands that are appraised as taxing or exceeding a
person’s resources. Therefore coping is limited to conditions of psychological stress, which
requires mobilization and excludes reflexive behaviour and thoughts that do not require any
effort.
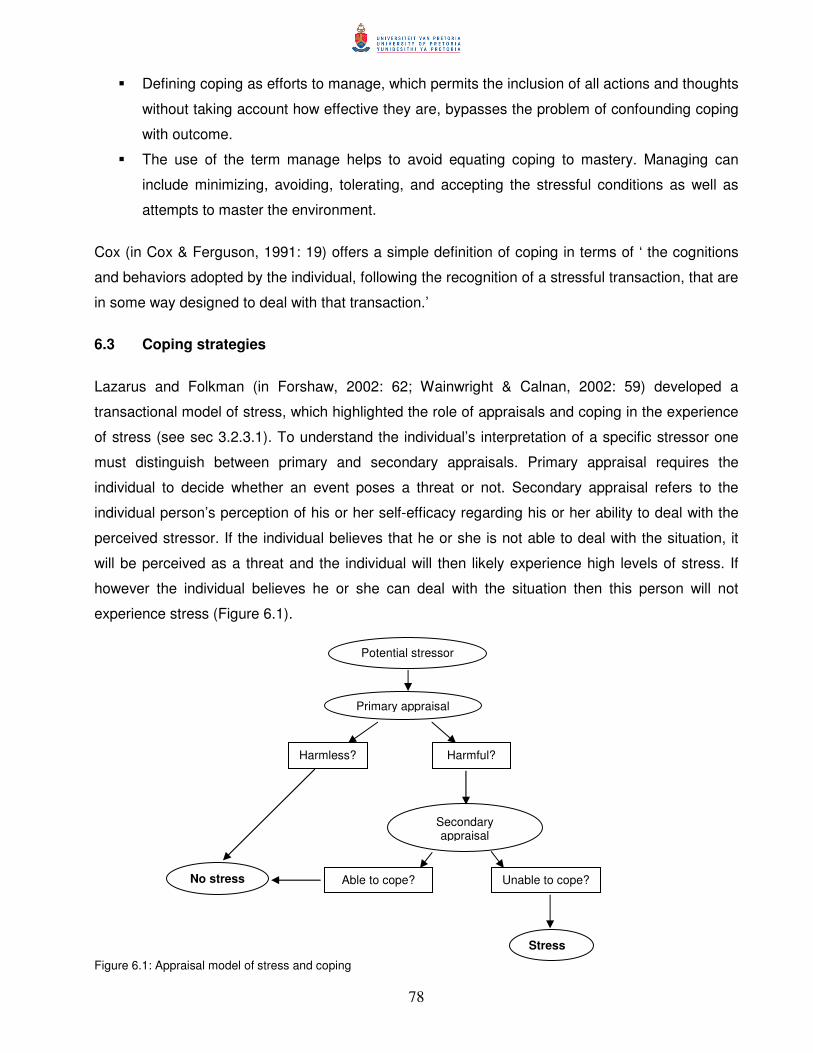
78
� Defining coping as efforts to manage, which permits the inclusion of all actions and thoughts
without taking account how effective they are, bypasses the problem of confounding coping
with outcome.
� The use of the term manage helps to avoid equating coping to mastery. Managing can
include minimizing, avoiding, tolerating, and accepting the stressful conditions as well as
attempts to master the environment.
Cox (in Cox & Ferguson, 1991: 19) offers a simple definition of coping in terms of ‘ the cognitions
and behaviors adopted by the individual, following the recognition of a stressful transaction, that are
in some way designed to deal with that transaction.’
6.3 Coping strategies
Lazarus and Folkman (in Forshaw, 2002: 62; Wainwright & Calnan, 2002: 59) developed a
transactional model of stress, which highlighted the role of appraisals and coping in the experience
of stress (see sec 3.2.3.1). To understand the individual’s interpretation of a specific stressor one
must distinguish between primary and secondary appraisals. Primary appraisal requires the
individual to decide whether an event poses a threat or not. Secondary appraisal refers to the
individual person’s perception of his or her self-efficacy regarding his or her ability to deal with the
perceived stressor. If the individual believes that he or she is not able to deal with the situation, it
will be perceived as a threat and the individual will then likely experience high levels of stress. If
however the individual believes he or she can deal with the situation then this person will not
experience stress (Figure 6.1).
Figure 6.1: Appraisal model of stress and coping
Potential stressor
Primary appraisal
Harmless? Harmful?
Secondary appraisal
Able to cope? Unable to cope? No stress
Stress

79
Folkman et al (in Forshaw, 2002: 64) delineated eight types of coping strategies used by individuals
exposed to perceived stressors.
� Confrontational coping: this type consists of aggressive efforts to alter the situation by
standing ones ground and fighting for what one wants. It also involves a degree of hostility
by expressing one’s anger to the person who caused the problem and risk-taking by taking
a chance and by doing something.
� Distancing: this type is characterised by efforts to detach oneself from the situation by not
letting it get to one and by not thinking about it. It also refers to creating a positive outlook by
making situation appear trivial and by trying to look at the bright side of things.
� Self-controlling: this type involves keeping one’s feelings to oneself and not telling others
about the situation. It also refers to actions involving restraint by not burning proverbial
bridges or acting too hastily.
� Seeking social support: this type requires efforts to seek informed support by talking to
someone to obtain more information. It also includes seeking tangible support by talking to
someone who could do something about the situation and emotional support by obtaining
sympathy and understanding from someone.
� Accepting responsibility: this approach acknowledges one’s own role in the situation and
attempts to put things right by deeds, for example by apologizing or trying to do something
about the situation.
� Escape-avoidance: this type entails escapism by either wishful thinking or real efforts to
escape or avoid the situation, by for example eating, smoking, drinking, sleeping, or
avoiding people.
� Planned problem solving: this type refers to one’s deliberate efforts to change a situation,
linked to an analytic approach to solve the problem and by finding a workable solution.
� Positive reappraisal: this strategy centres on one’s efforts to find positive meaning through
personal growth, which may include a religious component.
Most coping behaviour falls into one or more of these eight categories. An individual may use one
or more of these coping strategies even when these strategies may give rise to contradictory
cognitions. An individual may for example employ contradictory coping strategies, sometimes being
confronting and sometimes being escape-avoidant.
In addition to the above eight categories Lazarus and Folkman (1984: 150) divide coping strategies
into two main categories which they call either emotion-focused or problem-focused. Emotion-
focused coping is centred on the emotional reaction to the problem, whereas problem-focused

80
coping is concerned with directly addressing the problem. The above strategies of escape-
avoidance, distancing, self-control, positive appraisal, and accepting responsibility are viewed as
emotion-focused coping strategies, whereas planned problem solving and confrontational coping
are problem-focused coping strategies (Scheck & Kinicki, 2000: ; Forshaw, 2002: 65). Seeking
social support can be both emotional-focused (sharing of feelings) and problem-focused (getting
advice to help dealing with the problem).
Nolen-Hoeksema et al (1997: 859) describe two other classifications of coping based on the
personalities of the individuals themselves. Individuals can either be ruminators or non-ruminators.
Ruminators are described as individuals who passively and repetitively focus on their symptoms of
distress and the circumstances surrounding those symptoms. Individuals who use ruminative
coping do not tend to use any structured problem solving approach to cope (Nolen-Hoeksema &
Morrow, in Nolen-Hoeksema et al, 1997: 859). They tend to think about or talk about how
unmotivated, sad, or lethargic they feel without any attempt to relieve their symptoms. Ruminators
would spend much time pondering questions like “Will I ever feel better?” and “Why am I such a
mess?” without trying to find ways out of their predicament. Non-ruminators on the other hand
devise ways for dealing with their problems and work through to achieve their goals.
6.3.1 Key coping strategies
A number of coping strategies have been developed to help the individual to cope with and
therefore eliminate or effectively manage stress. Organizations have developed organizational
coping strategies to eliminate or control stressors that occur at the organizational level.
6.3.1.1 Individual coping strategies
A number of individual coping strategies have been researched and found to be effective, which
includes exercise, relaxation, time management, behavioural self-control and social support as well
as cognitive therapeutic techniques such as stress inoculation and problem solving.
1) Exercise
Exercise is one method put forward by researchers to relieve stress whether it is walking, jogging,
swimming, bicycling, or playing ball sports such as tennis or squash. Exercise results in increased
fitness, which is the maintenance of a good physical condition as indicated by one’s endurance and
strength (Baron & Byrne, 2003: 545). Fitness, for example, lowers blood pressure (Brownell in
Cotton, 1990: 170); reduces cardiovascular morbidity and mortality (Oberman in Brown, 1991: 556);
assists with the metabolism of carbohydrates (Lennon et al in Brown, 1991: 556); and effects
81
plasma insulin levels as well as plasma lipid and lipoprotein levels (Brownell in Brown, 1991: 556).
Fitness is also known to be associated with a number of psychological benefits such as
improvements in self-concept (Hughes in Brown, 1991: 556), improved mood states (Folkins &
Sime in Cotton, 1990: 171), as well as cognitive functioning (Tomporowski & Ellis in Brown, 1991:
556).
Brown (1991: 558) conducted research on the long-term effects of exercise. Altogether 37 female
and 73 male undergraduate students took part in the study requiring riding of an exercise bike
under standard conditions. Using the student’s self-reports and measuring each student’s heart
rate before, during, and after riding the exercise bike, each participant’s fitness was assessed. The
frequency of illness was by obtained from self-reports and objective data highlighting the number of
visits to the college health centre over a period of two semesters. The number and severity of
negative events over the previous year determined stress levels for each individual student. The
results showed that students who experienced low levels of stress throughout the year had very
few illnesses, regardless of their physical fitness. However, when students experienced high levels
of stress, it was found that high-fitness students made significantly less visits to the health centre
than did the low-fitness students.
Sufficient evidence exits to the beneficial effects of exercise and taking steps to implementing an
exercise program for an individual appears straightforward. The problem with exercise is not getting
started, but rather adhering to the chosen exercise routine (Cotton, 1990: 172). Brownell (in Cotton,
1990: 172) estimates that attrition from exercise programmes averages at least 50% after six
months. Smoking appears to be one of the most reliable predictors of exercise adherence and is
associated with lower enrolment as well as higher dropout rates in exercise programmes (Martin &
Dubbert, in Cotton, 1990: 173).
2) Relaxation
Relaxation is a related method individuals can use to manage stress. Relaxation can take many
forms. An individual can use specific relaxation techniques such as biofeedback, progressive
relaxation, or meditation with the purpose to effectively reduce the perceived stress and to manage
a prolonged stressful situation (Cotton, 1990: 128; Forshaw, 2002: 73; Luthans, 2002: 416). The
individual can therefore counter the undesirable physiological effects of stress thus decreasing
muscle tension, and also learning to lower blood pressure or heart rate, and gastric activity (Cotton,
1990: 128; Forshaw, 2002: 73).
82
Another form that relaxation can take is to take regular vacations or just taking it easy. Lounsbury
and Hoopes (1986: 137) found that the attitudes of individual’s toward a variety of workplace
characteristics improved significantly following a vacation. These included job satisfaction, job
involvement, organizational commitment, turnover intention, and life satisfaction. Luthans (2002:
416) suggests that taking it easy may ‘mean curling up with a good book in front of a fireplace or
watching something “light” (not a violent program or a sports program) on television.’
3) Time management
Amongst others time pressures are of the major causes of stress among managers (Luthans, 2002:
415). Time management is a common technique used for reducing the stress by eliminating the
sense of being under time pressure (Forshaw, 2002: 73). Many organizations train their staff in the
use of these techniques. Luthans (2002: 415) lists some of the most helpful guidelines for effective
time management:
� Make out a “to-do” list that identifies everything that must be done during the day. This helps
keep track of work progress.
� Delegate as much minor work as possible to subordinates.
� Determine when you do the best work – morning or afternoon – and schedule the most
difficult assignments for this time period.
� Set time aside during the day, preferably at least one hour, when visitors or other
interruptions are not permitted.
� Have the secretary screen all incoming calls in order to turn away those that are minor or do
not require your personal attention.
� Eat lunch in the office one or two days a week in order to save time and give yourself the
opportunity to catch up on paperwork.
� Discourage drop-in visitors by turning your desk so that you do not have eye contact with
the door or hallway.
� Read standing up. The average person reads faster and more accurately when in a slightly
uncomfortable position.
� Make telephone calls between 4:30 and 5:00 p.m. People tend to keep these conversations
brief so that they can go home.
� Do not feel guilty about those things that have not been accomplished today. Put them on
the top of the “to-do” list for tomorrow.
83
4) Social support
A key factor in reducing stress is to seek social support in friendships and family, as well as from
professional and other significant others (Forshaw, 2002: 66, Baron & Byrne, 2003: 548). Stroebe
(in Forshaw, 2002: 66) has outlined the main categories of social support given below.
� Appraisal support: This refers to where a person is enabled or encouraged to evaluate his
or her own state of health or problem-state, possibly by obtaining information and being
empowered. They are therefore able to put their stressors into context.
� Emotional support: It refers to being loved, cared for, protected, listened to, empathized
and sympathized with. It is what is often meant when someone says they have a ‘shoulder
to cry on’.
� Esteem support: This gives the individual a sense that he or she is valued, or held in
esteem, by others. The feelings of self-worth and self-esteem depend how the individual
perceives others’ opinions of him or her. The more competent and skilful, worthwhile, and
good a person feels, the more likely he or she is able to cope with stressful demands.
� Informational support: This is often provided in the form of advice, knowledge, and
feedback, which can assist the individual in finding the most effective approach to deal with
the stressful situation.
� Instrumental support: It refers to down-to-earth practical matters where the individual
cannot attend an exercise class if he or she has no one to look after the children, or does
not have the financial resources to go.
Social support is hypothesized to moderate stress in three main ways (House in Lim, 1996: 172):
� Social support may have a main effect on outcomes such as that individuals who
experienced higher levels of support are expected to experience better health, less
dissatisfaction with their jobs (Fisher in Lims: 1996: 172) and generally protecting them
against powerful stressors (Forshaw, 2002: 69).
� Social support may have a direct or main effect on perceived stress such that when social
support is present, the level of perceived stress is reduced or alleviated.
� The third effect is a buffering, moderating, or interactive one, where social support can alter
the relationship between stress and its outcomes.
84
Social support interacts with stress such that the relationship between stress and its outcomes
becomes more pronounced for individuals with low levels of support than for individuals with high
levels of support (Lim, 1996: 190; Forshaw, 2002: 69).
Baron and Byrne (1997: 533) conclude that ‘people who interact closely with others are better able
to avoid illness than those who remain isolated from interpersonal contact.’ When illness does
occur, those that receive social support recover more quickly than those who do not receive
support. Within a work setting forming close associations with trusted empathetic co-workers and
colleagues as well as the organization who provide support helps to lessen the effects of stressors
(Quick et al, 1997: 199). The effect of social support has been researched in relation to work-
related stressors such as role overload, and role conflict (Ganster, Fusilier, & Mayes in Lim, 1996:
172), role ambiguity (Erera in Lim, 1996: 172) and job insecurity (Lim, 1996: 190). Work-based
support such as support from supervisor and colleagues at work has been found to be more
important than support that are not based on work, such as support from family and friends in
moderating the effects of stress specific to the work setting except in the case of job insecurity
where both contributed significantly (Lim, 1996: 190).
5) Cognitive therapy techniques
Beck (in Cotton, 1990: 189) has proposed a cognitive model of stress, which relates the role of
cognitions in the formulation of stress, and the role of stress in the formulation of cognitions. Cotton
(1990: 189) quotes Beck’s first principle in his model: “The construction of a situation (cognitive set)
is an active, continuing process that includes successive appraisals of the external situation and the
risks, costs, and gains of a particular response. “When the individual’s vital interests appear to be at
stake, the cognitive process provides a highly selective conceptualization” (p.258). At the present
there is no single set of techniques that define cognitive therapy approaches (Carson et al, 2004:
581). The various approaches are characterized by the conviction that cognitive processes
influence emotion, motivation, and behaviour, and the techniques that bring about change are
pragmatic in nature. Cognitive approaches can be used as either problem-focused or emotion-
focused strategies in dealing with stress. As a problem-focused tool it can be used to change the
individual’s perception of stress and as an emotion-focused tool it can be used to modify the
subjective response to stress or change coping behaviour (Cotton, 1991: 189).
When Beck’s conceptualisation of the stress process is applied to Lazarus and Folkman’s
transactional model of stress (see section 3.2.4.1) cognitive techniques can be applied to
85
maladaptive thought patterns to attempt to change primary appraisal, secondary appraisal, or
reappraisal (Cotton, 1990: 190).
The three leading cognitive therapists, Albert Ellis, Aaron Beck, and Donald Meichenbaum differ in
some respects in their general approaches to therapy, and in the specific techniques employed in
therapy. The approach of both Beck and Ellis emphasize the reduction of idiosyncratic thought
patterns whereas Meichenbaum focuses on the reinforcement of adaptive functioning (Butcher et
al, 2004: 582; Cotton, 1990: 191).
a) Stress inoculation
Meichenbaum (Butcher et al, 2004: 582; Cotton, 1990: 196) has developed a primarily cognitive
strategy consisting of three phases for dealing with stress, which he calls Stress Inoculation
Training (SIT). The purpose of SIT is to modify the individual’s response to stress and to maximize
cognitive coping, which emphasizes the use of self-instruction in bringing about the desired
behaviour.
The first phase of SIT aims to educate the client with the purpose of understanding the stress
response and creating a connection between the individual’s self-statements and the resultant
stress reaction. The second phase focuses on the teaching of a number of coping skills for dealing
with the stressors with the main emphasis on cognitive coping. Self-instruction plays an important
role during this phase. The purpose of self-instruction is to encourage individuals to analyse the
problem in a systematic way. They learn to:
� Assess the reality of the situation.
� Control negative thoughts.
� Acknowledge, use, and relabel arousal.
� Prepare to confront a stressor.
� Cope with the reaction to a stressor.
� Evaluate performance and self-reinforcement.
The third stage involves exposure to the stress-inducing situation and the application of the coping
skills, which had been learned. Initially the stressors that are chosen are less demanding. When
they are mastered more demanding situations are selected. In this way the individual is inoculated
as in medicine where the individual is inoculated against disease. The focus is on developing and
86
applying specific problem solving and coping skills. Standard behavioural procedures such as
modelling, rehearsal, reinforcement, shaping, and self-monitoring are used to learn these skills.
b) Problem solving
Another technique utilized to effect change used by cognitive orientated therapists is that of
problem solving. Many stressed clients may need to be taught the process of problem solving
(Cotton, 1990: 199). The application of problem solving as it occurs in everyday living has become
known as social problem solving (D’Zurilla & Nezu in Kant et al, 1997: 74). Research in social
problem solving has been increasing in recent years and empirical support has accumulated
showing that problem solving is and important coping strategy having a significant influence on
psychological wellbeing and adjustment (Nezu & D’Zurilla in Maydeu-Olivares & D’Zurilla, 1996:
130). Most of the research in social problem solving has been based on a model of problem
solving originally developed by D’Zurilla and Goldfried (in Kant et al, 1997: 74) that later was
expanded and refined by D’Zurilla and Nezu (in Maydeu-Olivares & D’Zurilla, 1996: 116). The
problem solving outcomes are largely determined by two major, partially independent processes,
problem orientation and problem solving proper, for example application of problem solving skills
described below (Kant et al, 1997: 77).
� Problem orientation is the motivational component of the problem solving-process, involving
the operation of a set of relatively stable cognitive schemas (constructive as well as
dysfunctional) that reflect a person’s general awareness and perceptions of everyday
problems, as well as his or her own problem solving ability (for example, challenge or threat
appraisals, self-efficacy expectancies in problem solving, outcome expectancies of problem
solving). Together with the emotions and behavioral approach-avoidance tendencies that
are assumed to accompany them, these cognitive schemas can facilitate or inhibit problem
solving performance in specific situations, but they do not include the specific problem
solving techniques that enable individuals to maximize their problem solving effectiveness.
� Problem solving per se, on the other hand, refers to the rational search for a solution
through the application of specific problem solving skills and techniques that are designed to
increase the probability of finding the “best” or most adaptive solution for a particular
problem.
The overall process of problem solving can be conceived as consisting of the general motivational
component, problem orientation, and a set of four specific problem solving skills, which include
problem definition and formulation, generation of alternative solutions, decision making, and
87
solution implementation and verification (D’Zurilla and Nezu, 1990: 159). A stressed client may
have a poor understanding of what exactly the problem actually is and may only see one possible
solution. Applying these steps requires the following application (Perri et al, 1992: 117):
� Establishing a problem orientation where the client must recognize the problem, realize that
problems are part of normal life, and be prepared to work on them.
� Problem definition and formulation requires the client to identify the specific aspects of the
situation that makes it a problem in a way that separates relevant from irrelevant information
and to set realistic goals or objectives.
� Generation of alternative solutions requires the generation of a variety of possible solutions by
brainstorming as many ideas as possible without judging them. In addition Perri et al (1992:
118) also advocate the use of the strategies-tactics approach, which requires that clients initially
conceptualise general means or strategies for solving a problem and then subsequently
produce various tactics or specific ways in which the strategy may be implemented.
� Decision-making involves the evaluation of each alternative and to select the most effective
alternative for the client.
� Implementation and verification of solution involve taking the selected solution to the client’s
problem and implementing it. The effectiveness of the solution can now be monitored and
evaluated and if deemed necessary modified appropriately.
Problem solving is a logical, systematic, and reasonably easily learned approach, which can be
used to help individuals and is based on principles of common sense (Hawton & Kirk, 1989: 425).
6.3.1.2 Organizational strategies
Many organizations have realized that high levels of stress in the workplace can often lead to sharp
losses in productivity, increased absenteeism, bigger health care spending as well as increased
disability and workers compensation claims (Murphy, 1995: 41). There are two ways to deal
effectively with this phenomenon (Moorhead & Griffin, 1989: 211). Organizations are inherently
responsible for creating some of the experienced stress and therefore should also aid in relieving it
by introducing institutional and collateral programmes.
1) Institutional programmes
Institutional programmes are undertaken through established organizational mechanisms (Randall
& Jackson, in Moorhead & Griffin, 1989: 213). For example the work-environment fit as a result of
effective job design and work schedules may decrease the level of stress. The reorganization of
88
working time schedules has occurred over the last decade as a result of economic restructuring
(Bosch, in Sparks, Faragher, & Cooper, 2001: 492). This includes greater flexibility in work
schedules to cover extended operating or opening hours. Flexible work-time systems, based on
weekly, monthly or yearly work hours, are used by many organizations across Europe (Brewster,
Mayne, Tregaskis, Parsons, & Atterbury, in Sparks, Faragher, & Cooper, 2001: 493). Flexible work
hours have resulted in lower stress levels, increased job enrichment, morale and autonomy,
reduced absenteeism and tardiness, and improved job satisfaction and productivity (Pierce et al in
Sutherland & Cooper, 2000: 178) especially when the employees could choose their work time
schedules (CARNET and Work Family Directions, in Sparks, Faragher, and Cooper, 2001: 494).
Organizational culture, which expects the employee for example not to take time off or go on leave,
may contribute to high levels of stress (Moorhead & Griffin, 1989: 214). When workers feel that they
do not belong and that they lack opportunities to participate and be involved in decision-making,
they may feel unduly restricted, which is associated with high levels of stress (Sauter, Hurrell, &
Cooper, in Cartwright & Cooper, 1997: 20).
Supervision can play an important role in managing stress (Moorhead & Griffin, 1989:214; Sparks,
Faragher, Cooper, 2001: 501). Managers and supervisors intentionally or unintentionally can be a
source of stress for their subordinates. A more democratic management style was associated with
lower levels of perceived stress (Beehr & Gupta, in Sparks, Faragher, & Cooper, 2001: 501)
whereas a bullying management style has been linked with ill health of employees, including stress,
anxiety, and depression (Höel, Rayner, & Cooper, in Sparks, Faragher, Cooper, 2001: 501).
Managerial support plays an important role in employee wellbeing. When supervisory support was
viewed as poor, it was linked with increased levels of stress (Greller et al in Quick et al, 1997: 200).
Existing research has identified two leadership styles that can improve work performance and
benefit employee wellbeing, for example transformational and transactional leadership (Burns, in
Luthans, 2002:591; Sparks, Faragher, & Cooper, 2001: 502). Transactional leadership is based of
and exchange relationship that involves goal-setting, feedback, and reinforcement strategies to
help employees work more effectively. Transformational leadership is based more on leader’s
encouragement of their employees to find meaning in their work, inspiring them, effecting
intellectual stimulation, giving individual consideration, involving them in participative decision-
making and elective delegation (Bass, in Luthans, 2002: 591; Sparks, Faragher, & Cooper, 2001:
502).
89
2) Collateral programmes
Many organizations have also introduced collateral programmes to aid in the reduction of stress
(Moorhead & Griffin, 1989: 215). Collateral programmes refer to programmes that the organization
has specifically introduced to help employees deal with stress and they include stress management
programmes, work-family initiatives, and employee assistance programmes (EAP) (Moorhead &
Griffin, 1989: 214; Luthans, 2002: 417).
Stress management refers to specific interventions that are designed to aid the employee in the
identification and analysis of stressful situations, and the application of a variety of techniques to
either change the cause of stress, to modify the employee’s appraisal of stressful situations or to
deal more effectively with the symptoms of stress (Cotton, 1990: 4; Murphy, 1996: 112). The
approach to stress management is determined largely by the employee’s needs (Cotton, 1990: 13).
They can choose either individual therapy or group therapy, which some organizations offer
through their EAP programmes. Stress management workshops are often the most popular.
Murphy (1996: 112) reviewed a variety of stress management programmes, which used a variety of
techniques including muscle relaxation, meditation, biofeedback, cognitive-behavioural skills and a
combination of two or more of these techniques. He found that the most effective approach with
regards to health outcomes, i.e. psychological (e.g., anxiety) or physiological (e.g., blood pressure),
were obtained when two or more techniques were combined such as muscle relaxation and
cognitive-behavioural skills. However, none of the stress interventions was consistently effective on
producing effects on job/organization-relevant outcomes such as absenteeism or job satisfaction.
Stress management programmes often combine the above mentioned techniques with aspects
such as the role of physical exercise and diet, assertiveness training, time management, and
communication skills.
Bunce and West (1996: 228) found in a follow-up study one year later that the improvements they
measured in psychological strain associated with the traditional and organizationally orientated
stress management programme had dropped back to the initial levels. This is indicative of the need
to introduce methods to maintain the impact of the intervention.
Organizations are effecting the reduction of stress through work-family initiatives (Sutherland &
Cooper, 2000: 177; Overman in Luthans, 2002: 417). These include restructuring of jobs and job
duties, telecommuting, part-time work and job sharing, and flexible scheduling. Many organizations
provide on-site child-care facilities and in some organizations even elder care, paid family and

90
medical leave, release time for personal and or family events, and limits on the frequency and
distance of business travel.
Employee assistance programmes (EAP) have become a very valuable aid to organizations in
helping employees deal with stress (Cooper et al, 2002: 290; Luthans, 2002: 417; Murphy, 1995:
43). EAP’s provide employees with specific services such as counselling for personal or work-
related issues, alcohol and drug rehabilitation, and financial and legal advice. They offer workshops
and consultations on topics such as marriage, single parenting, working parents, stress
management, and personal support. EAP’s have been found to effectively reduce absenteeism,
health care costs, and disciplinary action in many cases.
6.4 Conclusion
Stress in the workplace is here to stay and those employees who cope with perceived stressors
tend to use a problem solving approach and not an emotional-focused approach to managing their
stress. When they cannot deal with their perceived stress it is possible for them learn ways to deal
more effectively with it by either changing the cause of the stress within the environment, or by
learning new ways to appraise the stressor and to deal more effectively with the symptoms. It is
clear that as the organization contributes to the individual’s experience of stress it has a
responsibility to aid in the reduction of the experienced stress. Employee assistance programmes
and work-family interventions have been found to be effective over the long run in reducing
absenteeism, increasing job satisfaction, and decreasing health care costs. Stress management
workshops however initially appear to be effective and generally report positive outcomes, but over
the long-term benefits are not maintained and therefore a way to maintain the initial benefits needs
to be found.
The present research seeks to determine the role problem solving plays in the effective coping or
lack thereof in dealing with perceived stress. This information is important in developing stress
management programmes that focus on the necessary skills that will teach employees how to deal
more effectively with work stress thus reducing the negative health outcomes and costs to the
organization.
91
CHAPTER 7
METHODOLOGY
7.1 Introduction
In South Africa the cost per year as a result of absenteeism and loss of productivity due to stress is
estimated to be approximately R500 million (“Executive Stress”, 1991: 102), with both white
managers and black high level employees suffering from high levels of work stress (Van Zyl, 1993:
36). Research has been conducted on stress inherent in specific groups within the work context
(Van Zyl, 1993: 36; Van Zyl 1998: 22; Van Zyl & Pietersen, 1999: 74) with some findings
suggesting that approximately 30-40% of South Africans suffer from high levels of stress (Van Zyl
in Van Zyl, 1993: 36). In the USA the comparative figures were found to be 13-25% (Spielberger &
Reheiser in Van Zyl, 1998: 22) which underlines the seriousness of the South African stress
experience. Generally the research focuses on the various sources of stress and on the symptoms
associated with the experience of stress, such as anxiety, depression, and aggression (Van Zyl,
1993: 37; Van Zyl, 1998: 24. However, no research relating stress and types of workplace
aggression could be traced in the South African research literature. Similarly only one study
researching the specific coping strategies used by South African managers was found
(Spangenberg & Orpen-Lyall, 2000: 6). No research investigating the social problem solving
strategies of employees coping with stress could be traced. Van Zyl (2002: 27) believes that the
levels of stress in the South African organizations are exceptionally high. The seriousness of the
stress experience in South Africa should encourage research to not only focus on the causes and
consequences of stress but also on how employees cope with their experienced stress with the aim
to aid organizations and individuals to develop improved strategies and programmes to counter the
negative effect of stress. In view of the above discussion, the main aims of the present study were
to determine:
� Overall levels of stress experienced by a sample of high-level employees.
� Ramifications or branched structures of stress in the workplace experienced by employees
by comparing biographic substructures such as gender, marital state, age, type of
organization, qualification, and position level in the organization.
� Types of stressors that contribute towards participants’ experience of stress.
� Levels of workplace aggression experienced and witnessed by these high-level employees.
� The psychological Impact that stress might have on the sample of high-level employees
with regard to anxiety, depression, and worry.
� Coping strategies used by the sample with respect to social problem solving.
92
� Multivariate relationships between stress, aggression in the workplace, anxiety, depression,
worry, and social problem solving with the biographical variables mentioned earlier, for
example the total group, gender as well as age, marital status, type of organization,
qualification, and position level substructures in the organization.
� The co-relationship between on the one hand stress and on the other hand aggression in
the workplace, anxiety, depression, worry as well as social problem solving.
This chapter sets out the methodological approach that was used to achieve the aims of the
outlined study.
7.2 Research hypotheses
The research hypotheses that will be tested in the main investigation are as follows:
7.2.1 First set
This set of hypotheses refers to all instances where the z test was used.
� Null hypothesis H0: z(j) = 0
Levels of overall stress or stress from causes outside the workplace, witnessed and
experienced aggression in the workplace, characteristics of anxiety, depression, sources of
worry and social-problem solving approaches did not differ from zero and thus were
insignificant.
� Alternative hypotheses H1: z > 0
All the above levels referred to were greater than 0 and were thus of significance.
The above hypotheses are referred to in sections 9.4.1.1, 1) a) to 9.4.1.1, 1) h), sections
9.4.1.1, 2) a) to 9.4.1.1, 2) b), sections 9.4.1.1, 3) a) to 9.4.1.1, 3) b), sections 9.4.1.1, 4) and
9.4.1.1, 5) as well as sections 9.4.1.1, 6) a) to 9.4.1.1, 6) j) of chapter 9.
7.2.2 Second set
This particular set of hypotheses refers to all instances where the student’s T- test was used.
� Null hypotheses H0:�D = 0
The two genders and marital groups did not differ significantly in terms of stress, experienced
and witnessed aggression in the workplace, anxiety, depression, worry and social problem-
solving approaches.
93
� Alternative hypotheses H1:�D > 0
The first mentioned gender and marital group obtained significantly higher scores in terms of
stress, experienced and witnessed aggression in the workplace, anxiety, depression, worry and
social problem-solving approaches.
� Alternative hypotheses H1:�D < 0
The first mentioned gender and marital group obtained significantly lower scores in terms of
stress, experienced and witnessed aggression in the workplace, anxiety, depression, worry and
social problem-solving approaches.
The above hypotheses are referred to in sections 9.4.2.1,1), sections 9.4.2.1, 2) a) and 9.4.2.1, 2)
b), sections 9.4.2.1, 3), 9.4.2.1, 4), 9.4.2.1, 5) and 9.4.2.1, 6), sections 9.4.2.2, 1) and 9.4.2.2, 2) a)
and 9.4.2.2, 2) b) as well as sections 9.4.2.2, 3), 9.4.2.2, 4), 9.4.2.2, 5) and 9.4.2.2, 6) of chapter 9.
7.2.3 Third set
This particular set of hypotheses refers to all instances where advanced analysis of variance was
undertaken by the simultaneous comparison of three or more biographical subgroups for each
particular variable. Analysis of variance might lead to two other sets of calculations. Firstly, two or
more biographic variables occasionally might produce significant interactions (RxC). Secondly,
where this is the case, subgroups are paired two-at-a-time and subjected to further analysis by
means of the Scheffé test. All of these calculations provide information relevant to the various
ramifications of stress and other stress-related variables of importance in the study that was
undertaken.
� Null hypotheses �(1) = �(2) = �(j)
The first, second and jth subgroups of a particular biographical variable did not differ significantly
in terms of stress, experienced and witnessed aggression in the workplace, anxiety,
depression, worry and social problem-solving approaches.
� Alternative hypotheses �(1) � �(2) � �(j)
The first, second and jth subgroups of a particular biographical variable did differ significantly in
terms of stress, experienced and witnessed aggression in the workplace, anxiety, depression,
worry and social problem-solving
94
� Null hypothesis RxC = 0
This hypothesis states that no noticeable interaction of any significance was observed between
subgroups of the relevant biographical variables.
� Alternative hypothesis RxC > 0
This hypothesis states that significant interaction occurred between two or more of the
subgroups of relevant biographical variables.
During post-hoc comparisons subgroups are paired off two-at-a-time. The null and alternative
hypotheses have the same structure as those that are applicable to the T-test as set out in section
7.2.2 of chapter 7.
Sections 9.4.3.1, 1) to 9.4.3.1, 8), sections 9.4.3.2, 1) a) to 9.4.3.2, 2) d), sections 9.4.3.3, 1) to
9.4.3.3, 8), sections 9.4.3.4 and, 9.4.3.5 as well as sections 9.4.3.6, 1) to 9.4.3.6, 10) are
applicable.
7.2.4 Fourth set
The fourth set of calculations refers to all instances where Bravais-Pearson product-moment
correlation coefficients were calculated.
� Null hypothesis �xy � 0
The co-relationships between stress and the variables pertaining to aggression in the
workplace, anxiety, depression, worry as well as social problem solving, all approximate 0 and
are thus insignificant.
� Alternative hypothesis �xy � 1
The co-relationships between stress and the variables pertaining to aggression in the
workplace, anxiety, depression, worry as well as social problem solving, all approximate 1 and
are thus particularly significant.
Likewise, Bravais-Pearson product-moment correlation coefficients between aggression in the
workplace, anxiety, depression, worry as well as social problem solving were calculated for the
different gender, age, marital status, organizational type as well as the qualification and position
level subgroups of the biographical variables. The null and alternative hypotheses are expressed in
the same way as above but hold for subgroups only and not for the total sample.

95
The final set of hypotheses refers to sections 9.5.1.1, 1) to 9.5.1.1, 2), sections 9.5.1.2 to 9.5.1.5,
sections 9.5.2.1, 1) to 9.5.2.1, 2), sections 9.5.2.2 to 9.5.2.5, section 9.5.3.1, 1) to 9.5.3.1, 2),
sections 9.5.3.2 to 9.5.3.5, sections 9.5.4.1, 1) to 9.5.4.1, 2), sections 9.5.4.2 to 9.5.4.5, section
9.5.5.1, 1) to 9.5.5.1, 2), sections 9.5.5.2 to 9.5.5.5, sections 9.5.6.1, 1) to 9.5.6.1, 2), sections
9.5.6.2 to 9.5.6.5, section 9.5.7.1, 1) to 9.5.7.1, 2), sections 9.5.7.2 to 9.5.7.5 of Chapter 9.
Hypothesis testing throughout the entire study was done at least at the 5% (< 0.05) level.
7.3 Research design
The first phase of the research was to approach various organizations so as to obtain permission
for the outlined study. A simple random sampling of high-level employees throughout the country
could not be carried out and instead a sample of convenience was chosen, as the organizations
that could be approached were accessible to the researcher (McMillan & Schumacher, 2001:175).
Fifteen organizations were approached of which two declined based on the fact that they were
undergoing major restructuring and one declined because management felt it would waste valuable
time. In all cases the research was discussed with the relevant personnel manager. Once
permission had been obtained the testing was completed in conjunction with the relevant personnel
manager. A passive design was chosen where the researcher ‘neither actively forms groups or
conditions through random or non-random assignment, nor manipulates an independent variable’
(Heppner, Kivlighan, & Wampold, 1992: 213). A simple passive design is also called a correlation
design in which the investigator collects data on two variables and then uses a statistical analysis,
to describe their relationship.
7.3.1 Data collection
To minimize costs the organizations that were approached were either in Pretoria itself or in
adjacent major industrial cities and towns within travelling distance of Pretoria. For statistical
reasons a return rate of 100 useable questionnaires was required. However this requirement was
surpassed. The study was begun on the 19th of October 1999 and the last questionnaires were
completed by the 22nd of February 2000. A comprehensive description of the sample is given in
Chapter 8.
7.3.1.1 Psychometric instruments
Twelve biographical items were combined with Experience of Work and Life Circumstances
Questionnaire developed by the HSRC (Van Zyl & Van der Walt, 1991), Aggression in the

96
Workplace Questionnaire developed by Baron and Neuman (1996), IPAT Anxiety Scale, Beck’s
Depression Inventory, the Penn State Worry Questionnaire, and the Social Problem Solving
Inventory-Revised developed by D’Zurilla, Nezu, and Maydeu-Olivares (1996).
7.3.1.2 Biographical questionnaire
The participants responded to 12 items, for example by stating their sex, age in years and months,
ethnicity, marital status, home language, highest qualification achieved, the organization they
presently work for, their present position title, their overall work experience, their work experience
with their present employer, the department they were presently in, and their occupation. Their
name was not required so as to maintain confidentiality.
7.3.1.3 Experience of Work and Life Circumstances Questionnaire
The Experience of Work and Life Circumstances Questionnaire (WLQ) was developed by the
Human Sciences Research Council (Van Zyl & Van der Walt, 1991) with the view to meeting the
need for a stress questionnaire standardized for South African circumstances. It not only attempts
to measure the level of stress, but also the causes of stress an employee may be experiencing.
The WLQ consists of two parts, experience of work, and circumstances and expectations.
The experience of work part of the questionnaire determines the individual’s level of stress. The
value obtained is an indication of whether the individual’s experiences a normal, high or very high
level of stress. This result is based on the answers of 40 questions. Ratings are made on a five-
point scale ranging from “Virtually never” to “Virtually always”, which are indicative of how often
certain feelings of stress, such as depression, anxiety, and frustration, occur.
The circumstances and expectations part of the questionnaire analyses the causes of the
individual’s level of stress. The respondent selects one of the answers according to a five-point
Likert scale that is indicative of how often certain aspects occur. It is made up of two subsections,
Scale A and Scale B, totalling 76 questions about the individuals’ circumstances and unfulfilled
expectations.
The circumstances that are viewed as stressful may be found within and/or outside the work
situation. Within the work environment seven items assess the functioning of the organization, the
characteristics of the task(s) to be performed, physical working conditions and job equipment,
social as well as career matters, and remuneration, fringe benefits and personnel policy. A high
score is indicative that the individuals experience the above issues as problematic.
97
Outside the work situation 16 items assess family problems, financial circumstances, phase of life,
general economic situation in the country, changing technology, facilities at home, social situations,
status, health, background, effect of work on home life, transport facilities, religious life, political
view, the availability of accommodation and recreational facilities.
The reliability of the different fields of the WLQ, calculated according to the Kuder-Richardson
formula 8 as modified by Ferguson ranges from 0.83 to 0.92. The test-retest reliability coefficients
vary from 0.62 to 0.80. Based on these results the reliability of the WLQ may be regarded as
satisfactory.
The WLQ was found to have both face and logical validity, each regarded as indications of content
validity (Van Zyl & Van der Walt, 1991). Construct validity was determined by both the intratest and
intertest methods (Van Zyl & Van der Walt, 1991). The intratest method reflected a fairly significant
relation between the different fields/scales of the WLQ. The intertest method showed a good
relation with the 16 PF Questionnaire, the PHSF Relations Questionnaire, and the Reaction to the
Demands of Life Questionnaire.
7.3.1.4 Aggression in the Workplace Questionnaire
The Aggression in the Workplace Questionnaire (AWQ) was obtained directly from Robert A. Baron
to be used in the study. The AWQ consists of a total of 53 items of which 40 items relate to the
perceived frequency of various forms of aggression, both witnessed and experienced. Five items
represent each of the eight types of aggression suggested by Buss’ three dichotomies: physical-
verbal, active-passive, direct-indirect (Buss in Baron & Neuman, 1996: 164). Participants were
asked to rate the extent to which they had personally witnessed and experienced each type of
aggression. Ratings were made on a five-point scale ranging from “Never” to “Very Often” for both
witnessed and experienced aggression. The reliability of both these scales were high, Cronbach’s
alpha = 0.94 for witnessed aggression, Cronbach’s alpha = 0.95 for experienced aggression.
7.3.1.5 IPAT Anxiety Scale
The IPAT Anxiety Scale (IAS) was adapted for use in South Africa by the Human Sciences
Research Council (Cattel et al, 1995). The IAS was developed from extensive research and
practice as a means of measuring anxiety. It is applicable to all age groups from the ages of 14 or
15 years upwards throughout the adult range.
98
It consists of 40 items distributed among five anxiety-measuring factors. These factors consist of
Defective Integration, lack of Self-sentiment (-Q3), Ego Weakness, lack of Ego Strength (-C),
Suspiciousness or Paranoid Insecurity (L), Guilt Proneness (O), and Frustrative Tension or Id
Pressure (Q4). The items can be divided into those items, which manifestly refer to anxiety (B-
score), also called overt, symptomatic, conscious anxiety, and the more covert hidden-purpose
cryptic probes of anxiety (A-score). The responses are arranged so that left-right position
preferences cannot speciously affect anxiety scores. The total score on these 40 items measures
the total anxiety experienced by the respondent. Each item has three alternative answers, with the
high-score keyed responses somewhat more frequently acquiescent (“yes”, “true”) rather than
disagreeing (“no”, “false”). This actually adds to the validity of the score, since acquiescence has
been established empirically as itself an expression of anxiety.
The reliability coefficients for the total anxiety score, as well as the covert and the overt part score
based on Ferguson’s variation of the Kuder-Richardson Formula 20 varied from 0.76 to 0.88. The
internal consistency reliability coefficients for the five personality components based on Ferguson’s
variation of the Kuder-Richardson Formula 20 varied from 0.27 to 0.70 for English and Afrikaans
speaking girls and boys, which were remarkably high for the brevity of the subscales.
Correlating the covert and the overt scores, as well as the total anxiety score of the IAS with the NB
Adjustment Questionnaire assessed construct validity. The coefficients varied from -0.21 to –0.55
and from 0.40 to 0.53.
7.3.1.6 Beck Depression Inventory
The Beck Depression Inventory (BDI) is a device that detects depression and accurately rates its
severity (Beck et al, 1988). It consists of 21 items that deal with how a person has been feeling
during the past few days. Each question consists of four possibilities ranging from the least severe
to the most severe, e.g. “I do not feel sad” to “I am so sad or unhappy that I can’t stand it”. The
least severe possibility is assigned a score of zero and the most severe a score of four. The
respondent reads each item carefully and selects one answer out of the four that reflects the
severity of how he or she is feeling. The 21 scores are totalled with the lowest possible score being
zero and the highest possible score being 63. The total obtained is then compared to table and a
category selected that describes the severity of the depression ranging from “These ups and downs
are considered normal” to “Extreme depression”.

99
7.3.1.7 Penn State Worry Questionnaire
The Penn State Worry Questionnaire (PSWQ) was obtained directly from Tom Borkovec of
Pennsylvania State University. It consists of 16 items all relating to worry as a trait and to crucial
aspects of clinically significant worry. The subject rates each item on a five-point scale ranging from
“not at all typical” to “very typical”. After correcting the reverse-score items, the sum of the 16 items
is obtained. The total value can be compared to the mean for a number of criterion groups, for
example the Unselected Groups, which provides an estimate of worry in a general population,
bearing in mind that the vast majority of its subjects were college students. The mean for this group
nearly matches the actual middle score (48) of the PSWQ (Molina & Borkovec, 1994: 270).
The 16-item PSWQ has been found to possess high internal consistency in both college samples
(Davey; Ladouceur et al; Meyer et al in Molina & Borkovec, 1994: 269) and in a large sample of
mixed anxiety disorders and GAD clients (Brown et al in Molina & Borkovec, 1994: 269), the
coefficient alphas varying from 0.86 to 0.95.
The PSWQ has been found to correlate significantly to two alternative questionnaires for assessing
worry, the Student Worry Scale (SWS) and the Worry Domains Questionnaire (WDQ). The
correlation between the PSWQ and the SWS was r = 0.59 and that between the PSWQ and the
WDQ was r = 0.67. These moderately high correlations are to be expected as the PSWQ was
designed as a trait measure of the general predisposition to engage in pathological worry
irrespective of worry content, whereas the other two questionnaires were created to tap into normal
worry based on specific content areas.
7.3.1.8 Social Problem-Solving Inventory-Revised
The Social Problem-Solving Inventory–Revised (SPSI-R) is a 52-item self-report instrument that is
linked to a five-dimensional model of social problem solving, which was derived from a factor-
analytic study (Maydeu-Olivares & D’Zurilla, 1996: 119) of the original Social Problem-Solving
Inventory (D’Zurilla & Nezu, 1990: 158). The SPSI-R consists of two constructive or adaptive
problem solving scales, Positive Problem Orientation and Rational Problem Solving, and three
dysfunctional scales, Negative Problem Orientation, Impulsivity/ Carelessness Style, and
Avoidance Style. The Rational Problem Scale can be broken down into four subscales, Problem
Definition and Formulation, Generation of Alternatives Solutions, Decision Making, and Solution
Implementation and Verification (D’Zurilla, Nezu, & Maydeu-Olivares, 1996: 9). D’Zurilla, Nezu, and
Maydeu-Olivares (1996: 9) describe each of these scales as follows:
100
Positive Problem Orientation may be described as a constructive, problem solving cognitive set that
involves the general disposition to; (a) appraise a problem as a challenge (for example opportunity
for benefit or gain) rather than a threat; (b) a belief that problems are solvable (optimism); (c) belief
in one’s own personal ability to solve problems successfully (“self-efficacy”); (d) belief that
successful problem solving takes time, effort, and persistence; and (e) committing oneself to
solving problems with dispatch rather than avoiding them.
In contrast, Negative Problem Orientation is a dysfunctional or inhibitive cognitive-emotional set
that involves the general tendency to: (a) view a problem as a significant threat to well-being; (b)
expect problems to be insolvable (pessimism), doubt one’s own personal ability to solve problems
successfully (low self-efficacy); and (d) become frustrated and upset when confronted with
problems on living (low frustration tolerance).
Turning to the proper dimensions of problem solving, Rational Problem Solving is a constructive
dimension that may be defined as the rational, deliberate, systematic, and skilful application of
effective or adaptive problem solving principles and techniques (for example problem definition and
formulation, generation of alternative solutions, etc.). When faced with a problem, the person
carefully and systematically gathers facts and information, identifies demands and obstacles, sets a
problem solving goal, generates a variety of different alternative solutions, evaluates the possible
consequences, judges and compares the alternatives, and then chooses and implements a solution
while carefully monitoring and evaluating the outcome.
The Impulsivity/Carelessness Style is a deficient problem solving pattern characterized by active
attempts to apply problem solving strategies and techniques. However, these attempts are
narrowed, impulsive, careless, hurried, and incomplete. The person who scores high on this scale
considers only a few solution alternatives, often impulsively going with the first idea that comes to
mind; alternatives and consequences are scanned quickly, carelessly, and unsystematically, and
solution outcomes are monitored and evaluated carelessly and inadequately.
Finally, the Avoidance Style is another defective problem solving pattern characterized by
procrastination, passivity or inaction, and dependency. The person scoring high on this scale
prefers to avoid problems rather than confronting them, puts off solving problems for as long as
possible, waits for problems to resolve themselves, and attempts to shift the responsibility for
solving his or her problems to others.
101
The reliability coefficients for the SPSI-R in four different samples found that all five scales of the
SPSI-R showed adequate to high internal consistency in all four samples with the coefficient alpha
varying from 0.69 to 0.95. The test-retest reliability for two samples was also adequate to high
varying from 0.68 to 0.91 (D’Zurilla, Nezu, & Maydeu-Olivares, 1996: 19).
7.4 Quantitative analysis of test data
The quantitative analysis of the data obtained was carried out by means of different statistical
techniques that are described below. Calculations were done using the SAS computer programme.
The statistical procedures that were chosen for the data set of 206 respondents were the SAS
procedures of Proc Print, Proc Frequency, Proc Means, Proc Anova and Proc Uniwrite. Pearson
Correlations and the reliability coefficients Cronbach-alpha were obtained using the ITEMMAN item
and test analysis program.
7.4.1 Descriptive and other statistics
Descriptive statistics are used to summarize, organize, and reduce large numbers of observations
(McMillan & Schumacher, 2001: 207). When data are collected the observations must be organized
in such a fashion to allow the researcher to correctly interpret the data and trace underlying trends.
The methods that a commonly used to provide grouped data include frequency distributions,
measures of central tendency such as the mean, skewness, measures of variability such as the
standard deviation, a numerical index that indicates the average variability of the scores from the
mean and variance a measure of dispersion related to the standard deviation.
7.4.1.1 The z-test
The z-test is a parametric statistical test that permits the testing of the null hypothesis for a single
sample when the population variance is known (Jackson, 2006: 151). Jackson (2006: 151) states
that this procedure permits the comparison of a ‘sample with a population in order to assess
whether the sample differs significantly from the population’. If a difference between the randomly
drawn sample and the broader population upon comparison is obtained then it can be concluded
that the sample population differs significantly from the reference population.
7.4.1.2 The t-test
The t-test is a parametric statistical test that allows the comparison of the means of two different
and independent samples of participants (Jackson, 2006: 197). If the results show that the two
102
samples do not differ significantly then it may be that they are likely from the same population, or if
they do differ significantly then it may be concluded that they represent two different populations.
The test has two versions, namely unpooled or pooled (Bordens & Abbott, 2002: 392). The choice
depends on the error term selected. Bordens & Abbot (2002: 392) state that the ‘unpooled version
computes an error term based on standard error of the mean provided separately by each sample’.
In the case of the pooled version it computes and error term ‘based on the two samples combined,
under the assumption that both samples come from populations having the same variance’.
7.4.1.3 Correlation coefficient
One of the basic tools for evaluating and understanding the relationship between two variables is
the correlation coefficient (McMillan & Schumacher, 2001: 230). The most common correlation
technique is the Pearson product-moment coefficient and is represented by the symbol r.
Correlation coefficients can be described by in terms of their sign and their size. The sign of the
correlation is indicative of the direction of the relationship, i.e., a negative sign indicates that the
variables are negatively related and a positive sign shows that the variables are positively related.
The size of the correlation is represented by a number that can vary from –1.00 to 0.00 for a
negative correlation and from 0.00 to +1.00 for a positive correlation. This number is a reflection of
the strength of the relationship and the closer it becomes to –1.00 or +1.00 the stronger it is.
7.4.1.4 Analysis of variance
Analysis of variance refers to statistical techniques that allow the comparison of two or more means
to determine if a significant difference exists between these means (McMillan & Schumacher, 2001:
373). When two or more sample means are compared on one independent variable, it is possible to
test the null hypothesis by applying a procedure called a one-way analysis of variance (ANOVA).
The ANOVA uses the variances of the groups and not the means to calculate a value that reflects
the degree of differences in the means. It calculates the F statistic. If the F statistic is large enough,
then the null hypothesis can be rejected with confidence and it may be concluded that at least two
means are different.
7.4.1.5 Post hoc comparisons (Scheffé)
When the ANOVA is used to test the null hypothesis and the F statistic allows the conclusion that
two or more of the means are different then post hoc comparisons are used to indicate those
means that are different from each other (McMillan & Schumacher, 2001: 374). The two most
103
common tests are Tukey and Scheffé of which the Scheffé is considered the most conservative.
When employing Scheffé’s test, a single range value for all comparisons is used, which is
appropriate for examining all possible linear combinations of group means and not just pairwise
comparisons. The Scheffé test is exact, even for unequal group sizes.
7.4.1.6 Reliability coefficient
Reliability refers to the consistency of measurement, which is indicative of the extent the results are
similar over different forms of the same instrument or occasions of data collection (McMillan &
Schumacher, 2001: 244). Another way to view reliability is to determine the extent to the measure
is free from error. If a measure has little error it is considered reliable, and if it has a great amount
of error it is considered unreliable. Reliability can be estimated in a number of ways of which the
two most common are internal consistency and stability (Heppner, Kivlighan, & Wampold, 1992:
244). Only internal consistency will be discussed, as the same tests were not administered on two
occasions. Internal consistency is a measure of the homogeneity of the items and can be estimated
from giving one form of the measure once. It can be obtained by calculating Cronbach’s alpha, the
coefficient derived from the Kuder-Richardson 20 formula, and split-half coefficients. The Cronbach
alpha assumes equivalence of all items and is used for items that are not scored right or wrong
(McMillan & Schumacher, 2001: 247). The Kuder-Richardson 20 formula is a special case of
Cronbach’s alpha where each item is scored right or wrong. The split-half coefficients are obtained
when the test after it has been administered is divided into two halves and a correlation coefficient
is calculated between the halves. The Spearman-Brown formula may be used to determine the
reliability of the whole test from the split-half reliabilities.
The reliability coefficient varies from 0.00 to 1.00. When the reliability coefficient is found to be 0.70
and higher, it is considered to be high and the scores have little error and are highly reliable.
7.5 Impact of response patterns
When respondents take part in research that requires them to complete a questionnaire or
inventory some may present themselves in a positive light, which can affect the validity of their self-
reports (Leak & Parsons, 2001: 23; Bartz et al, 1996: 248). Response biases due to social
desirability continue to be a problematic issue distorting the findings of the research. Responding
due to social desirability may occur in two forms, namely by impression management or by self-
deception. The former is viewed as valid indicator of lying and intentionally deceptive while the
latter is an ‘honest, but perhaps inaccurate, overly positive self-description’ (Leak & Parsons, 2001:
104
23; Bartz et al, 1996: 248). Within organizational research demographic or factual data are the least
susceptible to response biases (Podsakoff & Organ, 1986: 532). Data obtained by the use of
scaling, for example job attitude or stress, is subject to response biases. One way to overcome this
problem is to develop a self-report measure that contains ‘multiple, Likert-type items that, after
summation, produce scores with an acceptable coefficient alpha (Gardener et al, 1998: 1). Another
major problem occurs when measures of two or more variables are obtained from the same
respondents using self-reports based on scaling to determine a relationship between them
(Gardener et al, 1998: 1; Podsakoff & Organ, 1986: 533). This may result in what is called common
methods variance which refers to the fact that when items intended to measure different but related
constructs have similar item contents and identical scale response formats, it may cause spurious
correlations to some degree. One way to reduce common methods variance is to develop “good”
items that differ substantially in format from the other measures used in the research. This
interrupts the respondent’s response style (Harrison & McLaughlin in Gardener et al, 1998: 1). All of
the questionnaires and inventories used in the study had and acceptable coefficient alpha (see
section 7.3.1). Although Likert scales were used throughout the format varied from one set of
questionnaires and inventories to another (see section 7.3.1).
7.6 Effect size
Analysis of data obtained from social and behavioural research traditionally focuses on the
statistical significance of the results (Whitley, 2002: 431). However, statistical significance does not
mean that the results are always important or meaningful but only say something of the likelihood of
the obtained result (Hays in Whitley, 2002: 431). Effect size is one of the ways to overcome this
discrepancy.
Effect size according to Whitley (2002: 431) refers to ‘the magnitude of the impact an independent
variable has on a dependent variable in experimental research and to the size of the relationship
between two variables in non-experimental research.’ Essentially effect size is an indication of how
much of the variance in the dependent variable is due to or caused by the independent variable.
For categorical independent variables the effect size, d, is obtained by finding the difference
between the means of two conditions, for example between experimental and control conditions of
an experiment, and then dividing by the pooled or combined standard deviation of the conditions
(Whitley, 2002: 526). However, when using the pooled standard deviation it is still slightly biased
particularly when using small samples (Coe, 2000). Hedges and Olkin (in Coe, 2000) have found a
way to correct for this bias. The closer the obtained value is to zero, the smaller the effect size.
105
Judgement of the impact of the effect size on research results is useful and necessary. However it
needs to viewed in the context of the operational definitions used in the research to ensure that the
appropriateness of the result is not questioned (Whitley, 2002: 432).
7.7 Conclusion
It is essential that any study be grounded in well-established research methodology to ensure the
attainment of the research objectives. To answer the research question it is critical that all terms
and constructs are defined concretely. This then leads to the selection of the research design that
would be effective in answering the research question. All research studies have limitations and
influence the choice of research design. Costs, availability, and accessibility of respondents may
impose such limitations. This may influence the manner the research data is collected, whether
quantitatively or qualitatively. The research question again dictates the statistical methods chosen.
The researcher has the responsibility to not only plan and conduct research, but also to evaluate its
ethical acceptability. The researcher has a responsibility to report the research findings and present
them in a clear and understandable way whether they support the research question or not.

106
CHAPTER 8
DESCRIPTION OF SAMPLE 8.1 Introduction
Chapter eight deals with the description of the sample of 206 respondents with the focus on
demographic factors, for example sex, age, ethnicity, marital status, home language, highest
qualification achieved, the organization they presently work for, their present position title, their
overall work experience, their work experience with their present employer, the department they
were presently in, and their occupation.
8.2 Subjects
Individuals with at least one year working experience as well as at least a half a year working
experience with their present employer were approached. A minimum qualification of each
participating respondent was set to ensure an adequate level of literacy and language proficiency.
The groups that were targeted were senior management, middle management and specialists who
were professionals working mainly in their field of expertise. The number of questionnaires given
out and completed is given (Table 8.1).
Table 8.1: Balance of questionnaires
Business sector No given out No completed Response rate
Commercial bank A Commercial bank B Private Hospital in major rural area Provincial Development Cooperation Bakery in major rural area Manganese producer Quality control organization Petrochemical company Academic department of a Technikon in major rural area Academic department of a Technikon in major urban area Academic department of a university University library Insurance company
106 30 26 30 17 31 20 70 10
15
18 61 25
40 20 8
10 8 7 8
39 6
7
15 21 17
37.7% 66.7% 30.8% 66.7% 47.1% 22.6% 40.0% 55.7% 60.0%
46.7%
83.3% 34.4% 68.0%
Total 459 206 44.9%
However, of all the questionnaires used in the statistical analysis, 206 completed the Experience of
Work and Life Circumstances Questionnaire (WLQ), Aggression in the Workplace Questionnaire
(AWQ), IPAT Anxiety Scale (IAS), Beck’s Depression Inventory (BDI), and the Social Problem
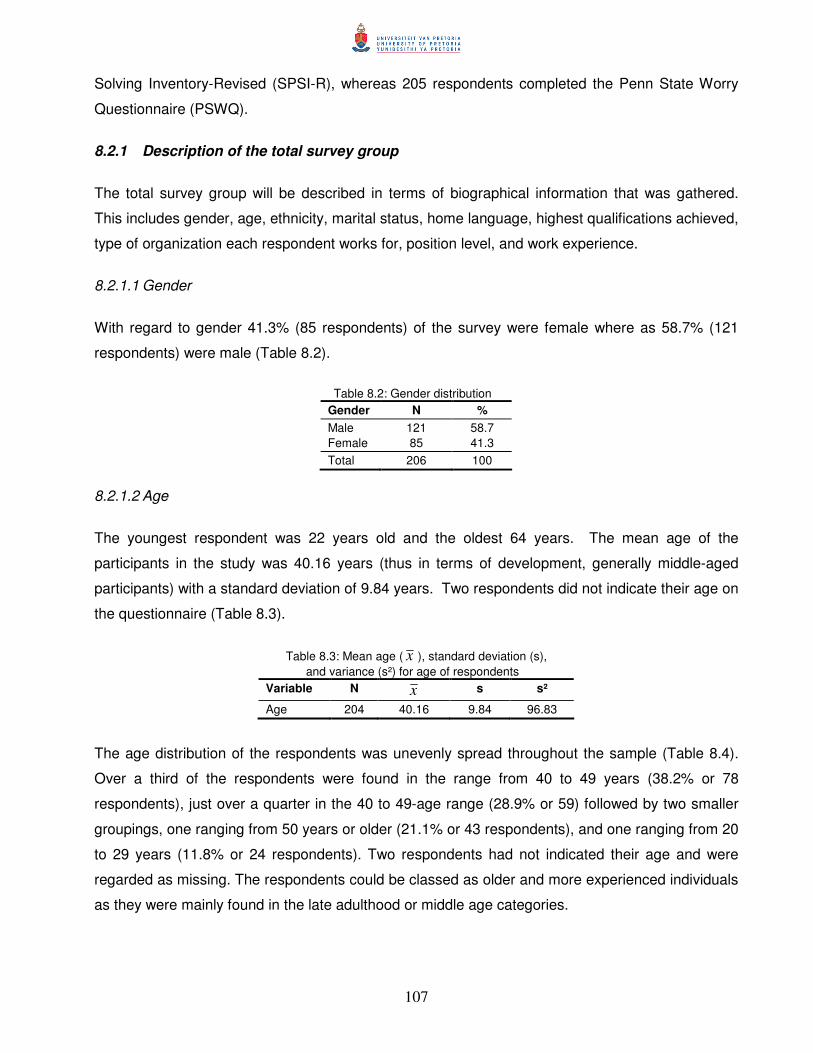
107
Solving Inventory-Revised (SPSI-R), whereas 205 respondents completed the Penn State Worry
Questionnaire (PSWQ).
8.2.1 Description of the total survey group
The total survey group will be described in terms of biographical information that was gathered.
This includes gender, age, ethnicity, marital status, home language, highest qualifications achieved,
type of organization each respondent works for, position level, and work experience.
8.2.1.1 Gender
With regard to gender 41.3% (85 respondents) of the survey were female where as 58.7% (121
respondents) were male (Table 8.2).
Table 8.2: Gender distribution
Gender N % Male Female
121 85
58.7 41.3
Total 206 100
8.2.1.2 Age
The youngest respondent was 22 years old and the oldest 64 years. The mean age of the
participants in the study was 40.16 years (thus in terms of development, generally middle-aged
participants) with a standard deviation of 9.84 years. Two respondents did not indicate their age on
the questionnaire (Table 8.3).
Table 8.3: Mean age ( x ), standard deviation (s), and variance (s²) for age of respondents
Variable N x s s²
Age 204 40.16 9.84 96.83
The age distribution of the respondents was unevenly spread throughout the sample (Table 8.4).
Over a third of the respondents were found in the range from 40 to 49 years (38.2% or 78
respondents), just over a quarter in the 40 to 49-age range (28.9% or 59) followed by two smaller
groupings, one ranging from 50 years or older (21.1% or 43 respondents), and one ranging from 20
to 29 years (11.8% or 24 respondents). Two respondents had not indicated their age and were
regarded as missing. The respondents could be classed as older and more experienced individuals
as they were mainly found in the late adulthood or middle age categories.

108
Table 8.4: Age distribution of respondents Age range N % 20-29 24 11.8 30-39 78 38.2 40-49 59 28.9 50 or older 43 21.1
8.2.1.3 Ethnicity
With regard to ethnicity the majority (88.3% or 182 respondents) described themselves as Whites
while the remainder of the respondents described themselves as Africans (5.8% or 12
respondents), Coloureds (2.4% or 5 respondents), or Indians (3.4% or 7 respondents) (Table 8.5).
Table 8.5: Ethnicity
Ethnicity N % African 12 5.8 Coloured 5 2.4 Indian 7 3.4 White 182 88.3
8.2.1.4 Marital status
Of all the respondents, less than a fifth were unmarried (15.5% or 32 respondents), about three-
quarters were married (74.8% or 154 respondents), with the remaining respondents either being
divorced (8.7% or 18 respondents) or having lost a spouse (1.0% or 2 respondents) (Table 8.6).
For the purposes of statistical calculations, the marital status was simplified into two categories,
namely married (74.8% or 154 respondents) and non-married (25.2% or 52 respondents).
Table 8.6: Marital status
Marital Status N % Unmarried 32 15.5 Married 154 74.8 Divorced 18 8.7 Widow/er 2 1.0
8.2.1.5 Home language
With regard to home languages it was found that the majority of respondents were Afrikaans
speaking (66.0% equal to 136 respondents), a quarter were English speaking (24.8% or 51
respondents) and the remaining respondents considered themselves either bilingual
(English/Afrikaans) (2.9% or 6 respondents), Zulu speaking (2.4% equal to 5 respondents), German
speaking (1.0%, 2 respondents), Se-Pedi (1.0%, 2 respondents), Xhosa (0.5% or 1 respondent),

109
Swazi (0.5%, also 1 respondent), Tswana (0.5% or 1 respondent) or Se-Sotho (0.5% or 1
respondent) (Table 8.7).
Table 8.7: Home language distribution
8.2.1.6 Organizations
A number of organizations were approached of which three large organizations declined to take
part in the survey. The types of institutions that took part come from a wide range of organizations
mostly from the private sector (Table 8.8).
Table 8.8: Type of institution
Type of Institution Organization N % Financial sector Commercial banks 60 29.1 Production/Services Private sector 50 24.3 Research and Development State-owned & research 47 22.8 Academic/ Auxiliary Services Academic institutions 49 23.8
8.2.1.7 Qualifications
The minimum requirement with regard to the survey sample was a matric qualification. An
exception was made if the individuals had completed either their grade 8, 9 10, or 11 and had
worked themselves up into a management position within their organizations. Of the survey group,
a quarter of the respondents had completed their grade 12 or lower (26.2% equal to 54
respondents), a sixth had obtained a National Diploma or a grade 12 with a Bank diploma (17.0%
or 35 respondents), just over one fifth had Bachelors degrees (11.7% or 24 respondents), another
sixth had obtained Honours and Law degrees (16.0% or 33 respondents) and about a third had
obtained their Masters or Doctoral degrees (29.1% or 60 respondents) (Table 8.9).
Home Language N % Afrikaans 136 66.0 English 51 24.8 English/Afrikaans 6 2.9 German 2 1.0 Se-Pedi 2 1.0 Se-Sotho 1 0.5 Swazi 1 0.5 Tswana 1 0.5 Xhosa 1 0.5 Zulu 5 2.4
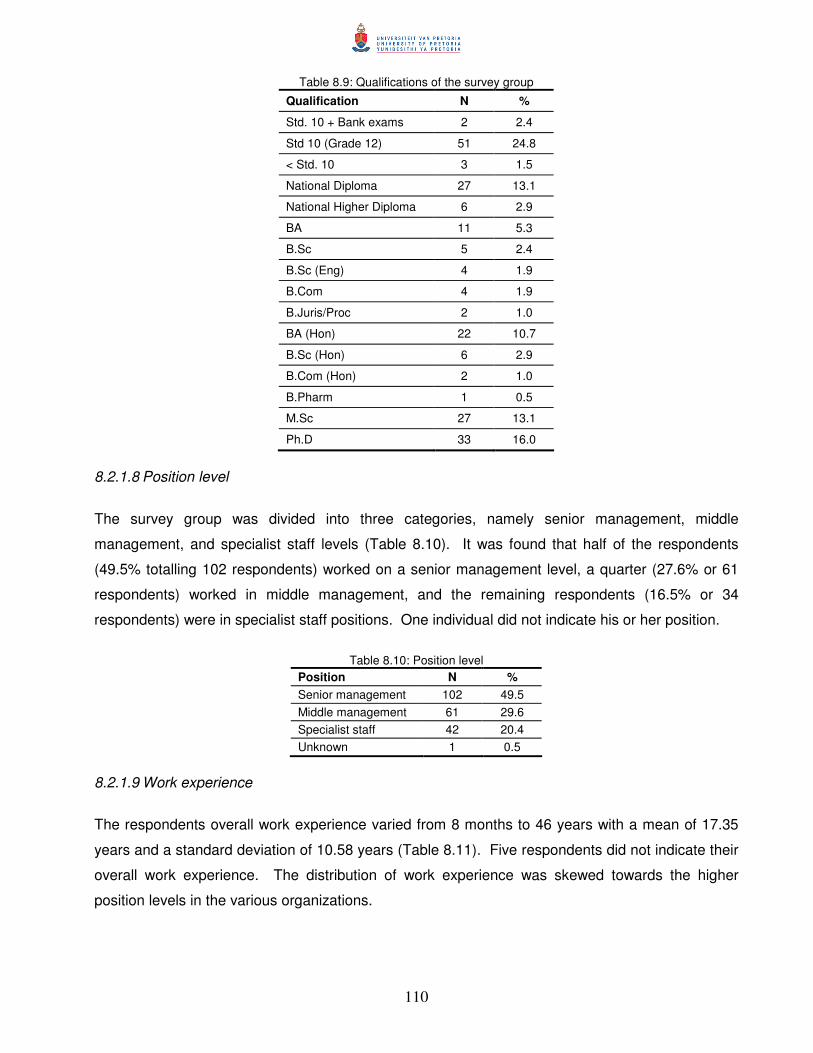
110
Table 8.9: Qualifications of the survey group
Qualification N %
Std. 10 + Bank exams 2 2.4
Std 10 (Grade 12) 51 24.8
< Std. 10 3 1.5
National Diploma 27 13.1
National Higher Diploma 6 2.9
BA 11 5.3
B.Sc 5 2.4
B.Sc (Eng) 4 1.9
B.Com 4 1.9
B.Juris/Proc 2 1.0
BA (Hon) 22 10.7
B.Sc (Hon) 6 2.9
B.Com (Hon) 2 1.0
B.Pharm 1 0.5
M.Sc 27 13.1
Ph.D 33 16.0
8.2.1.8 Position level
The survey group was divided into three categories, namely senior management, middle
management, and specialist staff levels (Table 8.10). It was found that half of the respondents
(49.5% totalling 102 respondents) worked on a senior management level, a quarter (27.6% or 61
respondents) worked in middle management, and the remaining respondents (16.5% or 34
respondents) were in specialist staff positions. One individual did not indicate his or her position.
Table 8.10: Position level
Position N % Senior management 102 49.5 Middle management 61 29.6 Specialist staff 42 20.4 Unknown 1 0.5
8.2.1.9 Work experience
The respondents overall work experience varied from 8 months to 46 years with a mean of 17.35
years and a standard deviation of 10.58 years (Table 8.11). Five respondents did not indicate their
overall work experience. The distribution of work experience was skewed towards the higher
position levels in the various organizations.
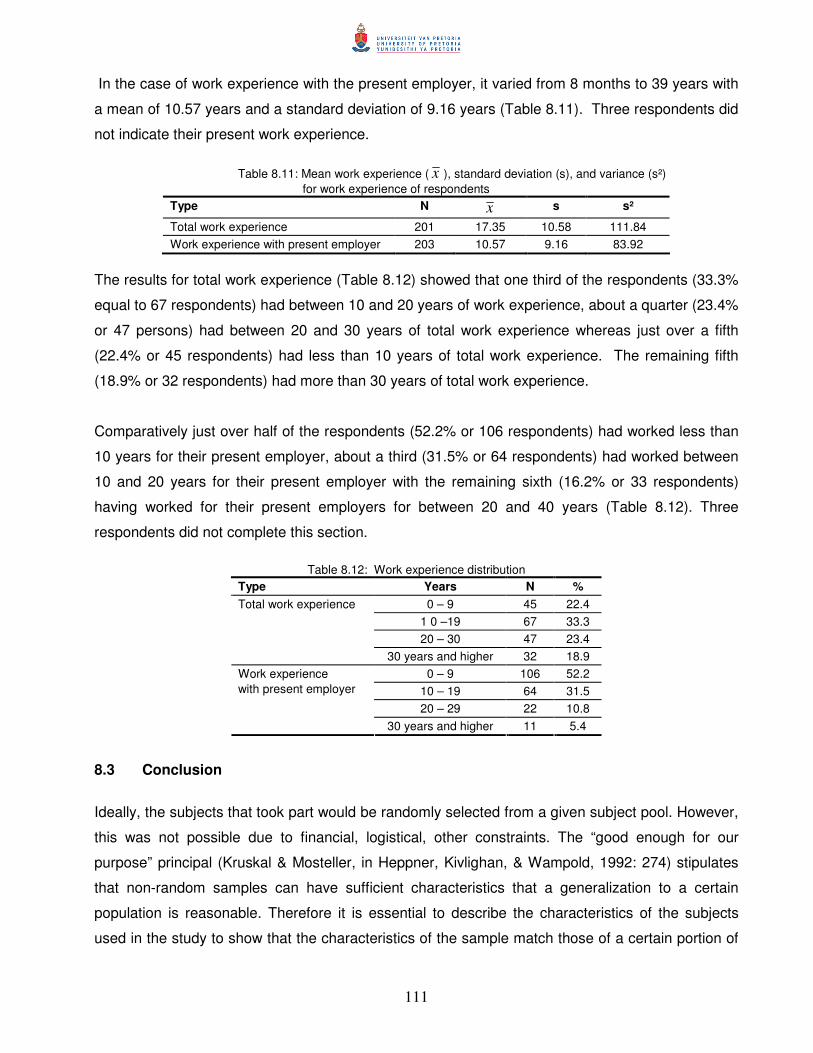
111
In the case of work experience with the present employer, it varied from 8 months to 39 years with
a mean of 10.57 years and a standard deviation of 9.16 years (Table 8.11). Three respondents did
not indicate their present work experience.
Table 8.11: Mean work experience ( x ), standard deviation (s), and variance (s²)
for work experience of respondents Type N x s s²
Total work experience 201 17.35 10.58 111.84 Work experience with present employer 203 10.57 9.16 83.92
The results for total work experience (Table 8.12) showed that one third of the respondents (33.3%
equal to 67 respondents) had between 10 and 20 years of work experience, about a quarter (23.4%
or 47 persons) had between 20 and 30 years of total work experience whereas just over a fifth
(22.4% or 45 respondents) had less than 10 years of total work experience. The remaining fifth
(18.9% or 32 respondents) had more than 30 years of total work experience.
Comparatively just over half of the respondents (52.2% or 106 respondents) had worked less than
10 years for their present employer, about a third (31.5% or 64 respondents) had worked between
10 and 20 years for their present employer with the remaining sixth (16.2% or 33 respondents)
having worked for their present employers for between 20 and 40 years (Table 8.12). Three
respondents did not complete this section.
Table 8.12: Work experience distribution
Type Years N % 0 – 9 45 22.4
1 0 –19 67 33.3 20 – 30 47 23.4
Total work experience
30 years and higher 32 18.9 0 – 9 106 52.2
10 – 19 64 31.5 20 – 29 22 10.8
Work experience with present employer
30 years and higher 11 5.4
8.3 Conclusion
Ideally, the subjects that took part would be randomly selected from a given subject pool. However,
this was not possible due to financial, logistical, other constraints. The “good enough for our
purpose” principal (Kruskal & Mosteller, in Heppner, Kivlighan, & Wampold, 1992: 274) stipulates
that non-random samples can have sufficient characteristics that a generalization to a certain
population is reasonable. Therefore it is essential to describe the characteristics of the subjects
used in the study to show that the characteristics of the sample match those of a certain portion of
112
the population. Furthermore the biographical characteristics chosen impinge on the type of
statistical analysis selected to answer the research question.
113
CHAPTER 9
RESULTS 9.1 Introduction
This chapter outlines the quantitative analysis of the scored data collected by means of the
questionnaires. The statistical procedures used include descriptive statistics for the variables
measured by each questionnaire, determination of the Cronbach alpha reliability coefficients for
each of these instruments, correlations between the various variables measured by the tests
with respect to the total group and five biographical variables, inferential statistics including z-
tests, t-tests for related groups, general linear modelling with ANOVA option, Scheffé tests, and
effect size for the different variables measured by the various questionnaires and five
biographical variables.
9.2 Descriptive statistics
A detailed description analysis of the scored data for this study was obtained for the total group,
the two genders, the four age groups, the two marital categories, the four business sectors, the
five qualification divisions, and the three position levels with regard to the eight scales of the
Experience of Work and Life Circumstances Questionnaire, the four scales for both experienced
and witnessed aggression of the Aggression in the Workplace Questionnaire, the eight IPAT
Anxiety Scales, the Beck Depression Inventory, the Penn State Worry Questionnaire, and the
ten scales of the Social Problem-Solving Inventory– Revised (Reported in Appendix A).
9.3 Cronbach alpha reliability coefficients
The Cronbach alpha reliability coefficients were obtained for the Experience of Work and Life
Circumstances Questionnaire and its subscales (WLQ), the Aggression in the Workplace
Questionnaire and its subscales, witnessed and experienced (AWQ), the IPAT Anxiety Scale,
the Beck Depression Inventory, the Penn State Worry Questionnaire, and the Social Problem-
Solving Inventory-Revised and its subscales (SPSIR) (Reported in Appendix A). This was
achieved by using the Item and Test Analysis Program – ITEMMAN™ version 3.50.
The Cronbach alpha reliability coefficients and its subscales ranged from 0.74 to 0.95 that was
indicative that the WLQ and its subscales had a good to very good reliability. In the case of the
AWQ the values were found to vary from 0.87 to 0.88 with the overall value for witnessed
aggression being 0.94 and 0.87 to 0.90 with the overall value for experienced aggression equal
to 0.95. Once again it could be concluded that the AWQ had a very good reliability for both the
witnessed and experienced aggression. For the IPAT Anxiety Scale the values varied from 0.84
to 0.98 indicating that this scale had an excellent reliability. The Cronbach alpha for the Beck
114
Depression Inventory was found to be equal to 0.95, hence indicative of a high reliability.
Similarly a value of 0.91 was obtained for the Penn State Worry Questionnaire which meant that
this questionnaire also had a high reliability. Finally the Cronbach alpha obtained for the SPSIR
was found to range from 0.73 to 0.94 also implying that this inventory and its subscales had a
very good reliability.
9.4 Inferential statistics
9.4.1 Z-test statistic
The z-test was calculated for a single population mean for a large known sample based on the
sample mean, sample size, and the standard deviation. The calculation was based on the
following z transformation formula:
x
xz
σµ−= where xσ was estimated by
ns
The level of significance was set at 95%(1 – p) that in the case of directional hypothesis testing
converted to critical z values within the range of –1.645 to 1.645. Values for x and s were
directly calculated from the data set. Values for � were estimated in different ways. In the case
of the Experience of Work and Life Circumstances Questionnaire (WLQ) the cut-off point
demarcating normal and abnormal responses on each subscale, as was described in the official
WLQ Test Manual (Van Zyl & Van der Walt, 1991:27) was used as the � value. This approach
also held for the Beck Depression Inventory. For the Aggression in the Workplace
Questionnaire, IPAT Anxiety Scale, the Worry Scale, and the Social Problem-solving Inventory
Revised the midscore for each subscale was used as the � value. This last � value was
determined by the sum of midpoints across all items in the subtest and the scoring code system
that was developed by the originators of the various psychological tests.
Three hypotheses were set in each comparison. In their generalized form they were:
H0: ≅ 0 if -1.645 � z � 1.645
H1: < 0 if z < -1.645 H2: > 0 if z > 1.645
The null hypothesis stated that the value xx σµ− for statistical purposes approximated 0,
suggesting that any z value within the range –1.645 to 1.645 described a difference between �
and x that was so small that it could not be reliably interpreted as a significant difference
beyond any reasonable doubt. H1, in turn, implied two things, namely that � deviated
significantly from x (significantly smaller than 0) and that relative to the value of �, the value of
x as well as the raw scores from which it was calculated, were located at the lower end of the
subscale. H2 on the other hand implied that the difference between � and x was significantly
115
larger than 0, whereas x and its associated raw scores were located at the upper end of the
subscale that contained the larger raw scores.
9.4.1.1 Total sample
1) Experience of Work and Life Circumstances Questionnaire
As was stated in paragraph 9.4, each of the subscales of the Experience of Work and Life
Circumstances Questionnaire (WLQ) was subjected to the z transformation formula. The mean
value and the standard deviation were calculated from the raw scores whilst � was estimated as
was indicated earlier on.
a) Level of stress
Specific hypotheses were set in further comparisons. For the first subscale of the WLQ, level of
stress (LOS) these were:
H0: ≅ 0 if -1.645 � z � 1.645 H1: < 0 if z < -1.645 H2: >0 if z > 1.645
When the subscale of level of stress (LOS) was subjected to the z transformation formula using
a mean value of 73.76, a standard deviation of 20.09, a sample size of 206, and �x = 79, the z
value obtained was –3.74. This is indicative that the null and H2 hypotheses are rejected in
favour of the alternative hypothesis H1. The mean score of the total sample was significantly
lower than the cut-off point of the subscale meaning that the respondents generally reported low
levels of stress within the range designated as normal.
b) Causes outside the work situation
For the second subscale of the WLQ, causes outside the work situation (OWS) the hypotheses
that were investigated were as follows:
H0: ≅ 0 if -1.645 � z � 1.645 H1: < 0 if z < -1.645 H2: >0 if z > 1.645
When the subscale of causes outside the work situation (OWS) was subjected to the z
transformation formula using a mean value of 25.30, a standard deviation of 6.59, a sample size
of 206, and �x = 33, the z value obtained was –16.77. This is indicative that the null and H2
hypotheses are rejected in favour of the alternative hypothesis H1. The mean score of the total
sample was significantly lower than the cut-off point of the subscale meaning that respondents

116
generally reported low levels of stress due to causes arising outside the work situation and fell
within the range designated as normal.
c) Organizational functioning
The hypotheses that were investigated for the third subscale of the WLQ, organizational
functioning (IWSOF) were as follows:
H0: ≅ 0 if -1.645 � z � 1.645 H1: < 0 if z < -1.645 H2: >0 if z > 1.645 (Scales have been reversed)
In this comparison the subscale of organizational functioning (IWSOF) was subjected to the z
transformation formula using a mean value of 20.31, a standard deviation of 5.62, a sample size
of 206, and �x= 17, the z value obtained was 8.45. This is indicative that the null and H1
hypotheses are rejected in favour of the alternative hypothesis H2. The mean score of the total
sample was significantly higher than the stated cut-off point of the subscale meaning that the
respondents reported lower levels of stress due to organizational functioning and generally fell
in the normal range.
d) Task characteristics
The hypotheses that were investigated regarding the fourth subscale of the WLQ, task
characteristics (IWSTC) were as follows:
H0: ≅ 0 if -1.645 � z � 1.645 H1: < 0 if z < -1.645 H2: >0 if z > 1.645 (Scales have been reversed)
The subscale of task characteristics (IWSTC) was subjected to the z transformation formula
using a mean value of 50.24, a standard deviation of 7.17, a sample size of 206, and �x= 41, the
z value obtained was 18.50. This is indicative that the null and H1 hypotheses are rejected in
favour of the alternative hypothesis H2. The mean score of the total sample was significantly
higher than the given cut-off point meaning that the respondents reported lower levels of stress
due to task characteristics and generally fell within the normal range.
e) Physical working conditions and job equipment
For the fifth subscale of the WLQ, physical working conditions and job equipment (IWSPW) the
hypotheses that were investigated were as follows:
H0: ≅ 0 if -1.645 � z � 1.645 H1: < 0 if z < -1.645 H2: >0 if z > 1.645 (Scales have been reversed)
117
In this instance the subscale of physical working conditions and job equipment (IWSPW) was
subjected to the z transformation formula using a mean value of 24.54, a standard deviation of
5.87, a sample size of 206, and �x = 19, providing a z value of 13.55. This is indicative that the
null and H1 hypotheses are rejected in favour of the alternative hypothesis H2. The mean score
of the total sample was significantly higher than the cut-off point meaning that the respondents
reported lower levels of stress due to the physical working conditions and job equipment within
the organization and thus were generally categorized as within the normal range.
f) Career matters
The hypotheses that were investigated for the sixth subscale of the WLQ, career matters
(IWSCM) were as follows:
H0: ≅ 0 if -1.645 � z � 1.645 H1: < 0 if z < -1.645 H2: >0 if z > 1.645 (Scales have been reversed)
Next, when the subscale of career matters (IWSCM) was subjected to the z transformation
formula using a mean value of 24.34, a standard deviation of 6.35, a sample size of 206, and
�x= 22, the z value obtained was 5.29. This is indicative that the null and H1 hypotheses were
rejected in favour of the alternative hypothesis H2. The mean score of the total sample was
significantly higher than the given cut-off point of the subscale indicating that the respondents
reported low levels of stress due to the career matters within the organization. The participants
were generally classified as within the normal range.
g) Social matters
For the seventh subscale of the WLQ, social matters (IWSSM), the hypotheses that were
investigated were as follows:
H0: ≅ 0 if -1.645 � z � 1.645 H1: < 0 if z < -1.645 H2: >0 if z > 1.645 (Scales have been reversed)
When the subscale of social matters (IWSSM) was subjected to the z transformation formula
using a mean value of 24.56, a standard deviation of 4.63, a sample size of 206, and �x= 21, the
z value was found to be 11.04. This is indicative that the null and H1 hypotheses were rejected
in favour of the alternative hypothesis H2. The mean score of the total sample was significantly
higher than the cut-off point meaning that the respondents reported low levels of stress arising
from the social interactions within the organization. Once again the sample was generally
classified as within the normal range.
118
h) Remuneration, fringe benefits and personnel policy
Finally, for the eighth subscale of the WLQ, remuneration, fringe benefits and personnel policy
(IWSRF), the hypotheses that were investigated were as follows:
H0: ≅ 0 if -1.645 � z � 1.645 H1: < 0 if z < -1.645 H2: >0 if z > 1.645 (Scales have been reversed)
When the subscale of remuneration, fringe benefits and personnel policy (IWSRF) was
subjected to the z transformation formula using a mean value of 28.43, a standard deviation of
8.74, a sample size of 206, and �x = 23, the z value obtained was 8.92. This again required that
the null and H1 hypotheses be rejected in favour of the alternative hypothesis H2. The mean
score of the total sample was significantly higher than the cut-off point of the subscale provided
in the test manual meaning that the respondents reported low levels of stress arising from their
concerns regarding the remuneration and the fringe benefits they receive as well as the
personnel policy of the organization. The responses were generally found in the normal range.
2) Aggression in the Workplace Questionnaire
The aggression in the workplace questionnaire (AWQ) was also subjected to the z
transformation formula. The mean value and standard deviation were calculated from the raw
scores whereas � was estimated as stated in paragraph 9.4.
a) Aggression in the workplace-witnessed
The three general hypotheses that were investigated for each of the subscales of the
aggression in the workplace questionnaire-witnessed (AWQ) were as follows:
H0: ≅ 0 if -1.645 � z � 1.645 H1: < 0 if z < -1.645 H2: >0 if z > 1.645
The calculations of the z-values show that both the null hypothesis and H2 hypothesis in each
case are rejected in favour of the alternative hypothesis H1 (Table 9.1). All the minus signs
indicate that the respondents witnessed significantly low levels of aggression in the workplace in
all its varying forms. Furthermore the sample means in all comparisons occurred at the lower
end of each subscale thus indicating low levels of witnessed aggression in the workplace.

119
Table 9.1: Calculations of z-values for aggression in the workplace-witnessed
b) Aggression in the workplace-experienced
The three general hypotheses that were investigated for each of the subscales of the
aggression in the workplace questionnaire-experienced (AWQ) were as follows:
H0: ≅ 0 if -1.645 � z � 1.645 H1: < 0 if z < -1.645 H2: >0 if z > 1.645
All the calculations of the z-values show that the null and H2 hypotheses in each case were
rejected in favour of the alternative hypothesis H1 (Table 9.2). The mean scores of the total
sample were significantly lower than the midpoints of the subscales indicating that the
respondents generally experienced low levels of aggression in the workplace in its varying
forms.
Table 9.2: Calculations of z-values for aggression in the workplace-experienced Scale
(Experienced) N Mean Standard
deviation Midpoint z
Overall 206 63.18 19.34 120 -42.17* Expressions of Hostility 206 30.30 10.36 54 -32.84* Obstructionism 205 22.49 7.98 39 -29.61* Overt Aggression 203 10.66 2.78 27 -83.90*
3) IPAT Anxiety Scale
Each of the subscales of the IPAT Anxiety Scale was subjected to the z transformation formula.
The mean value and standard deviation were calculated from the raw scores whereas � was
estimated as indicated in paragraph 9.4.
a) Factor -C
The three hypotheses for ego weakness or lack of ego strength that were investigated were as
follows:
H0: ≅ 0 if -1.645 � z � 1.645 H1: < 0 if z < -1.645 H2: >0 if z > 1.645 (Scales have been reversed)
Scale (Witnessed)
N Mean Standard deviation Midpoint z
Overall 205 75.58 20.69 120 -30.74* Expressions of Hostility 205 37.27 11.57 54 -20.70* Obstructionism 205 26.43 8.05 39 -22.34* Overt Aggression 205 11.87 3.37 27 -64.25*
120
When factor –C was subjected to the z transformation formula using a mean value of 3.69, a
standard deviation of 2.44, a midpoint of 6 and a sample size of 206, the z value obtained was
–13.59. This is indicative that the null and H2 hypotheses are rejected in favour of the alternative
hypothesis H1. The mean score of the total sample was significantly lower than the midpoint of
the scale indicating that the respondents in general reported adequate levels of ego strength
and therefore were not prone to ego weakness.
b) Factor L
The three hypotheses for suspiciousness or paranoid insecurity versus trust that were
investigated were as follows:
H0: ≅ 0 if -1.645 � z � 1.645 H1: < 0 if z < -1.645 H2: >0 if z > 1.645
In the next comparison factor L was subjected to the z transformation formula using a mean
value of 3.36, a standard deviation of 1.92, a midpoint of 4 and a sample size of 206, the z
value obtained was –4.78. This is indicative that the null and H2 hypotheses are rejected in
favour of the alternative hypothesis H1. The mean score of the total sample was significantly
lower than the midpoint of the scale indicating that the respondents did not experience
significantly high levels of suspiciousness.
c) Factor O
The three hypotheses for guilt proneness versus untroubled adequacy that were investigated
were as follows:
H0: ≅ 0 if -1.645 � z � 1.645 H1: < 0 if z < -1.645 H2: >0 if z > 1.645
When factor O was subjected to the z transformation formula using a mean value of 8.24, a
standard deviation of 4.18, a midpoint of 12 and a sample size of 206, the z value obtained was
–12.91. This is indicative that the null and H2 hypotheses are rejected in favour of the alternative
hypothesis H1. The mean score of the total sample was significantly lower than the midpoint of
the scale indicating that the respondents in general were inclined towards untroubled adequacy.

121
d) Factor -Q3
The three hypotheses for defective integration and lack of self-sentiment that were investigated
were as follows:
H0: ≅ 0 if -1.645 � z � 1.645 H1: < 0 if z < -1.645 H2: >0 if z > 1.645 (Scales have been reversed)
Hereafter factor -Q3 was subjected to the z transformation formula using a mean value of 4.82,
a standard deviation of 2.89, a midpoint of 8 and a sample size of 206, the z value obtained was
–15.79. This is indicative that the null and H2 hypotheses are rejected in favour of the alternative
hypothesis H1. The mean score of the total sample was lower than the midpoint of the scale
indicating that the respondents did not experience significantly high levels of defective
integration and lack of self-sentiment.
e) Factor Q4
The three hypotheses for frustrative tension that were investigated were as follows:
H0: ≅ 0 if -1.645 � z � 1.645 H1: < 0 if z < -1.645 H2: >0 if z > 1.645
When factor Q4 was subjected to the z transformation formula using a mean value of 6.56, a
standard deviation of 3.91, a midpoint of 10 and a sample size of 206, the z value obtained was
–12.63. This is indicative that the null and H2 hypotheses are rejected in favour of the alternative
hypothesis H1. The mean score of the total sample was significantly lower than the midpoint of
the scale, thus indicating that the respondents did not experience significantly high levels of
frustrative tension.
f) Score A
The three hypotheses for covert hidden anxiety that were investigated were as follows:
H0: ≅ 0 if -1.645 � z � 1.645 H1: < 0 if z < -1.645 H2: >0 if z > 1.645
Next, when Score A was subjected to the z transformation formula using a mean value of 13.89,
a standard deviation of 6.29, a midpoint of 20 and a sample size of 206, the z value obtained
was –13.94. This is indicative that the null and H2 hypotheses are rejected in favour of the
alternative hypothesis H1. The mean score of the total sample was significantly lower than the
122
midpoint of the scale and this indicated that the respondents did not experience significantly
high levels of covert hidden anxiety.
g) Score B
The three hypotheses for overt, symptomatic, and conscious anxiety that were investigated
were as follows:
H0: ≅ 0 if -1.645 � z � 1.645 H1: < 0 if z < -1.645 H2: >0 if z > 1.645
For Score B, when subjected to the z transformation formula using a mean value of 12.80, a
standard deviation of 7.04, a midpoint of 20 and a sample size of 206, the z value obtained was
–14.68. This is indicative that the null and H2 hypotheses are rejected in favour of the alternative
hypothesis H1. The mean score of the total sample was lower than the midpoint of the scale and
is indicative of the respondents not experiencing any obvious levels of overt, symptomatic, and
conscious anxiety.
h) Total anxiety
The three hypotheses for the total anxiety that were investigated were as follows:
H0: ≅ 0 if -1.645 � z � 1.645 H1: < 0 if z < -1.645 H2: >0 if z > 1.645
Finally, when the total score was subjected to the z transformation formula using a mean value
of 26.68, a standard deviation of 12.17, a midpoint of 40 and a sample size of 206, the z value
obtained was –15.71. This is indicative that both the null and H2 hypotheses are rejected in
favour of the alternative hypothesis H1. The mean score of the total sample was lower than the
midpoint of the scale and indicates that the respondents did not experience high levels of total
anxiety.
4) Beck Depression Inventory
The depression scale was subjected to the z transformation formula. The mean value and
standard deviation were calculated from the raw scores whereas � was estimated as stated in
paragraph 9.4.
123
The three hypotheses for the Beck Depression Inventory that were investigated were as follows:
H0: ≅ 0 if -1.645 � z � 1.645 H1: < 0 if z < -1.645 H2: >0 if z > 1.645
When the total score was subjected to the z transformation formula using a mean value of 6.93,
a standard deviation of 6.57, a cut-off point of 16 and a sample size of 205, the z value obtained
was –19.77. This is indicative that the null and H2 hypotheses are rejected in favour of the
alternative hypothesis H1. The mean score of the total sample was lower than the cut-off point of
the scale indicating that in general the respondents reported significantly low levels of
depression.
5) Penn State Worry Questionnaire
The worry scale was subjected to the z transformation formula. The mean value and standard
deviation were calculated from the raw scores whereas � was estimated as mentioned in
paragraph 9.4.
The three hypotheses for the worry scale that were investigated were as follows:
H0: ≅ 0 if -1.645 � z � 1.645 H1: < 0 if z < -1.645 H2: >0 if z > 1.645
When the total score obtained for the worry scale was subjected to the z transformation formula
using a mean value of 41.36, a standard deviation of 11.14, a midpoint of 48 and a sample size
of 203, the z value obtained was –8.49. This is indicative that the null and H2 hypotheses are
rejected in favour of the alternative hypothesis H1. The mean of the total sample was lower than
the midpoint of the scale indicating that the respondents experienced significantly low levels of
worry.
6) Social Problem-Solving Inventory-Revised
Each of the subscales of the Social Problem-Solving Inventory-Revised was subjected to the z
transformation formula. The mean value and standard deviation were calculated from the raw
scores whereas � was estimated as indicated in paragraph 9.4.
124
a) Positive problem orientation
The three hypotheses for positive problem orientation that were investigated were as follows:
H0: ≅ 0 if -1.645 � z � 1.645 H1: < 0 if z < -1.645 H2: >0 if z > 1.645
When the total score obtained for the positive problem orientation scale was subjected to the z
transformation formula using a mean value of 18.23, a standard deviation of 3.28, a midpoint of
15 and a sample size of 205, the z value obtained was 14.10. This is indicative that the null and
H1 hypotheses are rejected in favour of the alternative hypothesis H2. The mean of the total
sample was higher than the midpoint of the scale indicating that the respondents generally had
a high positive problem orientation.
b) Negative problem orientation
The three hypotheses for negative problem orientation that were investigated were as follows:
H0: ≅ 0 if -1.645 � z � 1.645 H1: < 0 if z < -1.645 H2: >0 if z > 1.645
Next, when the total score for the negative problem orientation scale was subjected to the z
transformation formula using a mean value of 18.48, a standard deviation of 6.24, a midpoint of
30 and a sample size of 206, the z value obtained was –26.50. This is indicative that the null
and H2 hypotheses are rejected in favour of the alternative hypothesis H1. The mean of the total
sample was lower than the midpoint of the scale meaning that the respondents generally
reported significantly low levels of negative problem orientation.
c) Rational problem solving
The three hypotheses for rational problem solving that were investigated were as follows:
H0: ≅ 0 if -1.645 � z � 1.645 H1: < 0 if z < -1.645 H2: >0 if z > 1.645
The total score for the rational problem solving scale was subjected to the z transformation
formula using a mean value of 67.45, a standard deviation of 12.40, a midpoint of 60 and a
sample size of 205, the z value obtained was 8.60. This is indicative that the null and H1
hypotheses are rejected in favour of the alternative hypothesis H2. The mean score of the total
sample was higher than the midpoint of the scale indicating that the majority of respondents
considered themselves as having good rational problem solving abilities.

125
d) Problem definition and formulation
The three hypotheses for problem definition and formulation that were investigated were as
follows:
H0: ≅ 0 if -1.645 � z � 1.645 H1: < 0 if z < -1.645 H2: >0 if z > 1.645
When the total score for the problem definition and formulation subscale was subjected to the z
transformation formula using a mean value of 17.77, a standard deviation of 3.35, a midpoint of
15 and a sample size of 205, the z value obtained was 11.84. This is indicative that the null and
H1 hypotheses are rejected in favour of the alternative hypothesis H2. The mean of the total
sample was higher than the midpoint of the subscale meaning that the majority of respondents
felt that they had a significant ability to define and formulate problems.
e) Generation of alternatives
The three hypotheses for generation of alternatives that were investigated were as follows:
H0: ≅ 0 if -1.645 � z � 1.645 H1: < 0 if z < -1.645 H2: >0 if z > 1.645
When the total score for the generation of alternatives subscale was subjected to the z
transformation formula using a mean value of 17.18, a standard deviation of 3.50, a midpoint of
15 and a sample size of 205, the z value obtained was 8.92. This is indicative that the null and
H1 hypotheses are rejected in favour of the alternative hypothesis H2. The mean of the total
sample was higher than the midpoint of the subscale indicating that the majority of the
respondents believed they had developed a significant ability to generate alternatives to a
problem.
f) Decision making
The three hypotheses for decision making that were investigated were as follows:
H0: ≅ 0 if -1.645 � z � 1.645 H1: < 0 if z < -1.645 H2: >0 if z > 1.645
In the next case the total score of the decision making subscale was subjected to the z
transformation formula using a mean value of 16.39, a standard deviation of 3.29, a midpoint of
15 and a sample size of 205, the z value obtained was 6.05. This is indicative that the null and
H1 hypotheses are rejected in favour of the alternative hypothesis H2. The mean of the total
126
sample was higher than the midpoint of the subscale meaning that the majority of respondents
viewed themselves as having a significant ability to make effective decisions regarding a
problem.
g) Solution implementation and verification
The three hypotheses for solution implementation and verification that were investigated were
as follows:
H0: ≅ 0 if -1.645 � z � 1.645 H1: < 0 if z < -1.645 H2: >0 if z > 1.645
When the total score of the solution implementation and verification subscale was subjected to
the z transformation formula using a mean value of 16.11, a standard deviation of 3.75, a
midpoint of 15 and a sample size of 205, the z value obtained was 4.24. This is indicative that
the null and H1 hypotheses are rejected in favour of the alternative hypothesis H2. The mean of
the total sample was higher than the midpoint of the subscale indicating that the majority of the
respondents believed that they could effectively implement and verify solutions regarding a
specific problem.
h) Impulsivity/carelessness style
The three hypotheses for impulsivity/carelessness style that were investigated were as follows:
H0: ≅ 0 if -1.645 � z � 1.645 H1: < 0 if z < -1.645 H2: >0 if z > 1.645
Next, when the total score of the impulsivity/carelessness style scale was subjected to the z
transformation formula using a mean value of 18.36, a standard deviation of 5.33, a midpoint of
30 and a sample size of 205 the z value obtained was -31.27. This is indicative that the null and
H2 hypotheses are rejected in favour of the alternative hypothesis H1. The mean of the total
sample was lower than the midpoint of the scale showing that the majority of respondents did
not in any significant way resort to a style of impulsivity or carelessness.
i) Avoidance style
The three hypotheses for avoidance style that were investigated were as follows:
H0: ≅ 0 if -1.645 � z � 1.645 H1: < 0 if z < -1.645 H2: >0 if z > 1.645
127
When the total score for the avoidance style scale was subjected to the z transformation
formula using a mean value of 12.74, a standard deviation of 4.10, a midpoint of 21 and a
sample size of 205, the z value obtained was -28.85. This is indicative that the null and H2
hypotheses are rejected in favour of the alternative hypothesis H1. The mean of the total sample
was lower than the midpoint of the scale meaning that generally the respondents seldom
resorted to an avoidance style to any noticeable extent.
j) Total social problem solving
The three hypotheses for total social problem solving that were investigated were as follows:
H0: ≅ 0 if -1.645 � z � 1.645 H1: < 0 if z < -1.645 H2: >0 if z > 1.645
Finally, when the total score for the total social problem solving scale was subjected to the z
transformation formula using a mean value of 16.44, a standard deviation of 2.48, a midpoint of
15 and a sample size of 206, the z value obtained was 8.51. This is indicative that the null and
H1 hypotheses are rejected in favour of the alternative hypothesis H2. The mean of the total
sample was higher than the midpoint of the scale indicating that the majority of respondents did
have significantly high levels of total social-problem solving abilities.
9.4.2 T-test statistic
The t-test was calculated to determine the probability that two corresponding population means
were different when comparing the mean of one group with that of another group. To achieve
this, the sample means, standard deviation, and size of the samples were used using the
following t-transformation formula:
21
21
xxSxx
t−
−=
A 95% confidence level was chosen. If the t-value obtained from the calculation was smaller
than the critical t-value obtained from the t-distribution table, then the null hypotheses was
rejected in favour of the alternative hypotheses. A test for homogeneity or heterogeneity of
variance was also conducted in order to make precise conclusions with regard to group
differences.
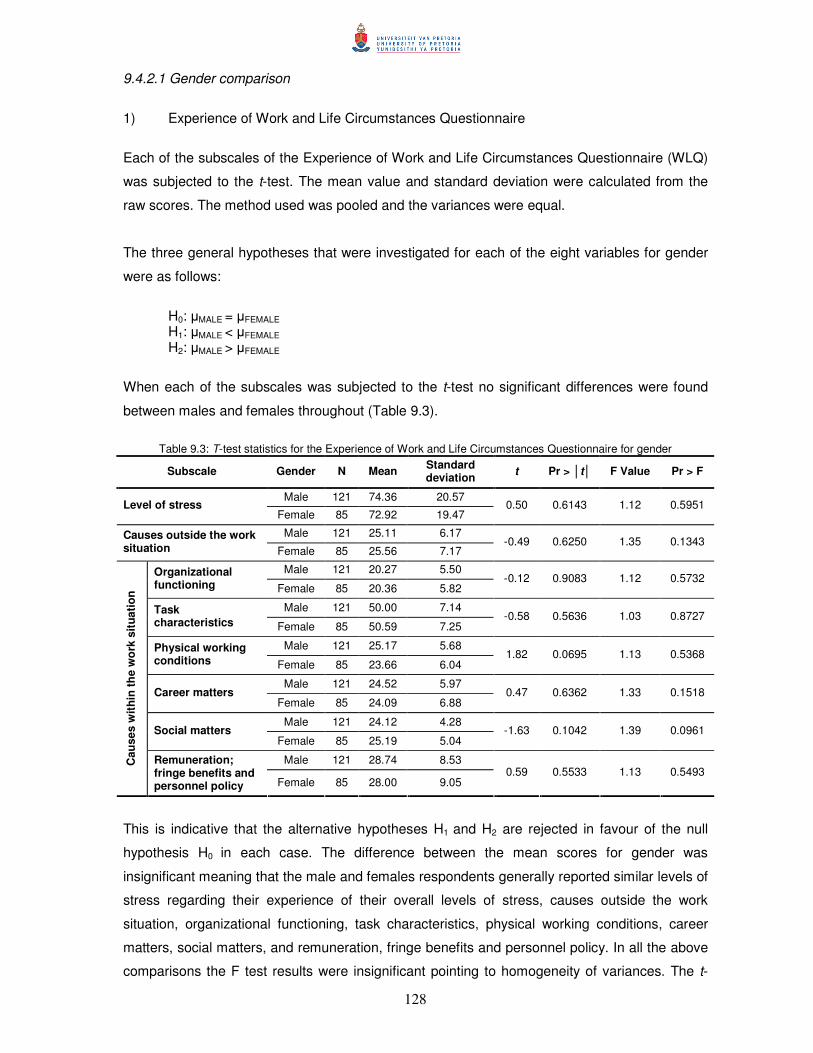
128
9.4.2.1 Gender comparison
1) Experience of Work and Life Circumstances Questionnaire
Each of the subscales of the Experience of Work and Life Circumstances Questionnaire (WLQ)
was subjected to the t-test. The mean value and standard deviation were calculated from the
raw scores. The method used was pooled and the variances were equal.
The three general hypotheses that were investigated for each of the eight variables for gender
were as follows:
H0: �MALE = �FEMALE H1: �MALE < �FEMALE H2: �MALE > �FEMALE
When each of the subscales was subjected to the t-test no significant differences were found
between males and females throughout (Table 9.3).
Table 9.3: T-test statistics for the Experience of Work and Life Circumstances Questionnaire for gender
Subscale Gender N Mean Standard deviation t Pr > �t� F Value Pr > F
Male 121 74.36 20.57 Level of stress
Female 85 72.92 19.47 0.50 0.6143 1.12 0.5951
Male 121 25.11 6.17 Causes outside the work situation Female 85 25.56 7.17
-0.49 0.6250 1.35 0.1343
Male 121 20.27 5.50 Organizational functioning Female 85 20.36 5.82
-0.12 0.9083 1.12 0.5732
Male 121 50.00 7.14 Task characteristics Female 85 50.59 7.25
-0.58 0.5636 1.03 0.8727
Male 121 25.17 5.68 Physical working conditions Female 85 23.66 6.04
1.82 0.0695 1.13 0.5368
Male 121 24.52 5.97 Career matters
Female 85 24.09 6.88 0.47 0.6362 1.33 0.1518
Male 121 24.12 4.28 Social matters
Female 85 25.19 5.04 -1.63 0.1042 1.39 0.0961
Male 121 28.74 8.53 Cau
ses
with
in th
e w
ork
situ
atio
n
Remuneration; fringe benefits and personnel policy Female 85 28.00 9.05
0.59 0.5533 1.13 0.5493
This is indicative that the alternative hypotheses H1 and H2 are rejected in favour of the null
hypothesis H0 in each case. The difference between the mean scores for gender was
insignificant meaning that the male and females respondents generally reported similar levels of
stress regarding their experience of their overall levels of stress, causes outside the work
situation, organizational functioning, task characteristics, physical working conditions, career
matters, social matters, and remuneration, fringe benefits and personnel policy. In all the above
comparisons the F test results were insignificant pointing to homogeneity of variances. The t-

129
values described a lack of significance of difference between the two genders (differences
between groups) that were not in any way affected by differences within groups.
2) Aggression in the Workplace Questionnaire
The aggression in the workplace questionnaire (AWQ) was also subjected to the t-test. The
mean values and the standard deviation were based on the raw scores.
a) Aggression in the workplace-witnessed
The three general hypotheses that were investigated for each of the four variables for gender
were as follows:
H0: �WITMALE = �WITFEMALE
H1: �WITMALE < �WITFEMALE H2: �WITMALE > �WITFEMALE
The calculations of the t-values show that the null hypothesis H0 is maintained in favour of the
alternative hypotheses H1 or H2 (Table 9.4) in all four cases. One F test was significant, namely
that of overt aggression. However its accompanying t-value was insignificant and therefore
further interpretation was not necessary.
Table 9.4: T-test statistics for aggression in the workplace-witnessed for gender
Scale (Witnessed)
Gender N Mean Standard deviation t Pr > �t� F Value Pr > F
Male 120 77.11 19.33 Overall
Female 85 73.40 22.41 1.27 0.2059 1.34 0.1374
Male 120 37.75 10.81 Expressions of Hostility
Female 85 36.60 12.59 0.70 0.4845 1.36 0.1260
Male 120 27.25 7.57 Obstructionism
Female 85 25.28 8.60 1.73 0.0848 1.29 0.1983
Male 120 12.12 3.68 Overt Aggression
Female 85 11.52 2.86 1.25 0.2110 1.66 0.0145
b) Aggression in the workplace-experienced
The three general hypotheses that were investigated for each of the four variables for gender
were as follows:
H0: �EXPMALE = �EXPFEMALE H1: �EXPMALE < �EXPFEMALE H2: �EXPMALE > �EXPFEMALE
The calculations of the t-values show that the null hypothesis is maintained (Table 9.5) in the
case of three out of the four variables. Only one comparison proved significant, namely the
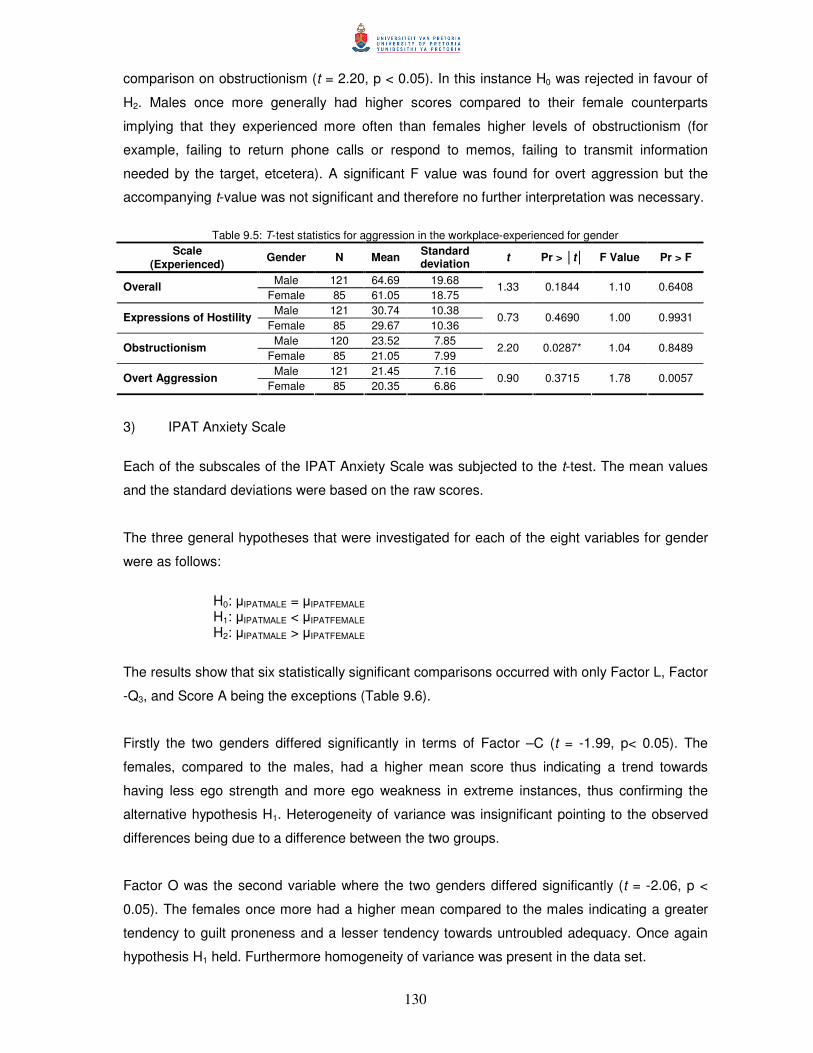
130
comparison on obstructionism (t = 2.20, p < 0.05). In this instance H0 was rejected in favour of
H2. Males once more generally had higher scores compared to their female counterparts
implying that they experienced more often than females higher levels of obstructionism (for
example, failing to return phone calls or respond to memos, failing to transmit information
needed by the target, etcetera). A significant F value was found for overt aggression but the
accompanying t-value was not significant and therefore no further interpretation was necessary.
Table 9.5: T-test statistics for aggression in the workplace-experienced for gender
Scale (Experienced) Gender N Mean Standard
deviation t Pr > �t� F Value Pr > F
Male 121 64.69 19.68 Overall Female 85 61.05 18.75
1.33 0.1844 1.10 0.6408
Male 121 30.74 10.38 Expressions of Hostility Female 85 29.67 10.36
0.73 0.4690 1.00 0.9931
Male 120 23.52 7.85 Obstructionism Female 85 21.05 7.99
2.20 0.0287* 1.04 0.8489
Male 121 21.45 7.16 Overt Aggression Female 85 20.35 6.86
0.90 0.3715 1.78 0.0057
3) IPAT Anxiety Scale
Each of the subscales of the IPAT Anxiety Scale was subjected to the t-test. The mean values
and the standard deviations were based on the raw scores.
The three general hypotheses that were investigated for each of the eight variables for gender
were as follows:
H0: �IPATMALE = �IPATFEMALE H1: �IPATMALE < �IPATFEMALE H2: �IPATMALE > �IPATFEMALE
The results show that six statistically significant comparisons occurred with only Factor L, Factor
-Q3, and Score A being the exceptions (Table 9.6).
Firstly the two genders differed significantly in terms of Factor –C (t = -1.99, p< 0.05). The
females, compared to the males, had a higher mean score thus indicating a trend towards
having less ego strength and more ego weakness in extreme instances, thus confirming the
alternative hypothesis H1. Heterogeneity of variance was insignificant pointing to the observed
differences being due to a difference between the two groups.
Factor O was the second variable where the two genders differed significantly (t = -2.06, p <
0.05). The females once more had a higher mean compared to the males indicating a greater
tendency to guilt proneness and a lesser tendency towards untroubled adequacy. Once again
hypothesis H1 held. Furthermore homogeneity of variance was present in the data set.
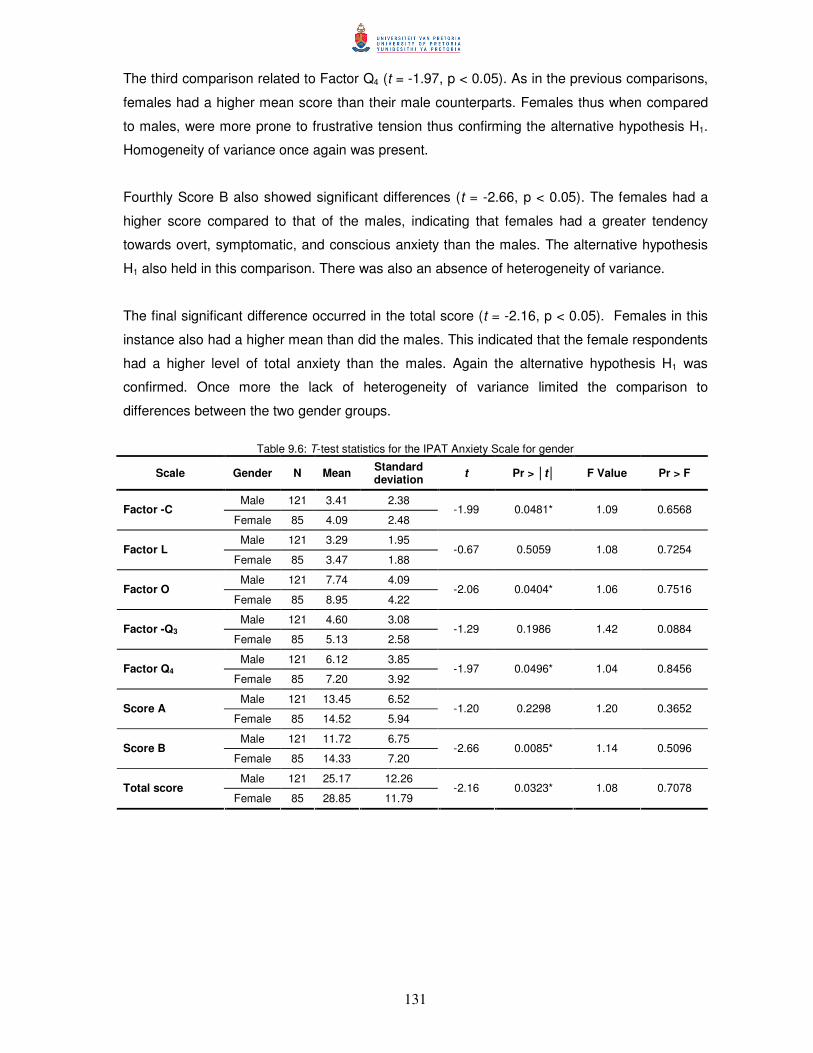
131
The third comparison related to Factor Q4 (t = -1.97, p < 0.05). As in the previous comparisons,
females had a higher mean score than their male counterparts. Females thus when compared
to males, were more prone to frustrative tension thus confirming the alternative hypothesis H1.
Homogeneity of variance once again was present.
Fourthly Score B also showed significant differences (t = -2.66, p < 0.05). The females had a
higher score compared to that of the males, indicating that females had a greater tendency
towards overt, symptomatic, and conscious anxiety than the males. The alternative hypothesis
H1 also held in this comparison. There was also an absence of heterogeneity of variance.
The final significant difference occurred in the total score (t = -2.16, p < 0.05). Females in this
instance also had a higher mean than did the males. This indicated that the female respondents
had a higher level of total anxiety than the males. Again the alternative hypothesis H1 was
confirmed. Once more the lack of heterogeneity of variance limited the comparison to
differences between the two gender groups.
Table 9.6: T-test statistics for the IPAT Anxiety Scale for gender
Scale Gender N Mean Standard deviation t Pr > �t� F Value Pr > F
Male 121 3.41 2.38 Factor -C
Female 85 4.09 2.48 -1.99 0.0481* 1.09 0.6568
Male 121 3.29 1.95 Factor L
Female 85 3.47 1.88 -0.67 0.5059 1.08 0.7254
Male 121 7.74 4.09 Factor O
Female 85 8.95 4.22 -2.06 0.0404* 1.06 0.7516
Male 121 4.60 3.08 Factor -Q3
Female 85 5.13 2.58 -1.29 0.1986 1.42 0.0884
Male 121 6.12 3.85 Factor Q4
Female 85 7.20 3.92 -1.97 0.0496* 1.04 0.8456
Male 121 13.45 6.52 Score A
Female 85 14.52 5.94 -1.20 0.2298 1.20 0.3652
Male 121 11.72 6.75 Score B
Female 85 14.33 7.20 -2.66 0.0085* 1.14 0.5096
Male 121 25.17 12.26 Total score
Female 85 28.85 11.79 -2.16 0.0323* 1.08 0.7078

132
4) Beck Depression Inventory
The depression scale was subjected to the t-test. The mean values and the standard deviations
were based on the raw scores.
The three general hypotheses that were investigated for depression and gender were as
follows:
H0: �BDIMALE = �BDIFEMALE H1: �BDIMALE < �BDIFEMALE H2: �BDIMALE > �BDIFEMALE
The results show that the null hypothesis H0 is not rejected in favour of the alternative
hypothesis H1 (Table 9.7). This implies that there were no significant differences in the levels of
depression between males and females. The variances of the two groups were homogenous.
Table 9.7: T-test statistics for the Beck Depression Inventory for gender
Scale Gender N Mean Standard deviation t Pr > �t� F Value Pr > F
Male 120 6.65 6.31 Depression
Female 85 7.34 6.94 -0.74 0.4595 1.21 0.3344
5) Penn State Worry Questionnaire
The Penn State Worry Questionnaire was subjected to the t-test. The mean values and the
standard deviations were based on the raw scores.
The three general hypotheses that were investigated for worry among gender groups were as
follows:
H0: �WORMALE = �WORFEMALE H1: �WORMALE < �WORFEMALE H2: �WORMALE > �WORFEMALE
The results show that the null hypothesis is rejected in favour of the alternative hypothesis H1
(Table 9.8). The result showed that the females had a higher mean thus indicating a greater
tendency towards resorting to worry as a means of coping, thus the alternative hypothesis H1
was confirmed. The difference between the two means was quite big. Homogeneity of variance
occurred.
Table 9.8: T-test statistics for the Penn State Worry Questionnaire for gender
Scale Gender N Mean Standard deviation t Pr > �t� F Value Pr > F
Male 118 39.25 10.22 Worry
Female 85 44.31 11.74 -3.27 0.0013* 1.32 0.1670
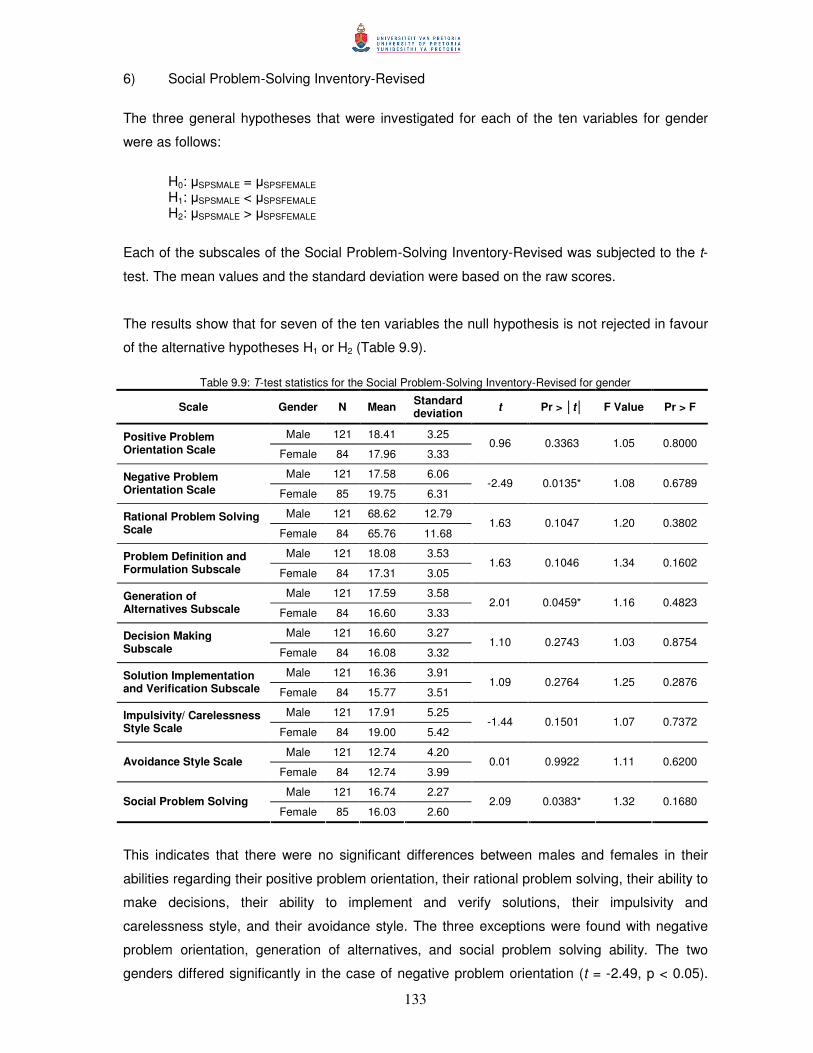
133
6) Social Problem-Solving Inventory-Revised
The three general hypotheses that were investigated for each of the ten variables for gender
were as follows:
H0: �SPSMALE = �SPSFEMALE H1: �SPSMALE < �SPSFEMALE H2: �SPSMALE > �SPSFEMALE
Each of the subscales of the Social Problem-Solving Inventory-Revised was subjected to the t-
test. The mean values and the standard deviation were based on the raw scores.
The results show that for seven of the ten variables the null hypothesis is not rejected in favour
of the alternative hypotheses H1 or H2 (Table 9.9).
Table 9.9: T-test statistics for the Social Problem-Solving Inventory-Revised for gender
Scale Gender N Mean Standard deviation t Pr > �t� F Value Pr > F
Male 121 18.41 3.25 Positive Problem Orientation Scale Female 84 17.96 3.33
0.96 0.3363 1.05 0.8000
Male 121 17.58 6.06 Negative Problem Orientation Scale Female 85 19.75 6.31
-2.49 0.0135* 1.08 0.6789
Male 121 68.62 12.79 Rational Problem Solving Scale Female 84 65.76 11.68
1.63 0.1047 1.20 0.3802
Male 121 18.08 3.53 Problem Definition and Formulation Subscale Female 84 17.31 3.05
1.63 0.1046 1.34 0.1602
Male 121 17.59 3.58 Generation of Alternatives Subscale Female 84 16.60 3.33
2.01 0.0459* 1.16 0.4823
Male 121 16.60 3.27 Decision Making Subscale Female 84 16.08 3.32
1.10 0.2743 1.03 0.8754
Male 121 16.36 3.91 Solution Implementation and Verification Subscale Female 84 15.77 3.51
1.09 0.2764 1.25 0.2876
Male 121 17.91 5.25 Impulsivity/ Carelessness Style Scale Female 84 19.00 5.42
-1.44 0.1501 1.07 0.7372
Male 121 12.74 4.20 Avoidance Style Scale
Female 84 12.74 3.99 0.01 0.9922 1.11 0.6200
Male 121 16.74 2.27 Social Problem Solving
Female 85 16.03 2.60 2.09 0.0383* 1.32 0.1680
This indicates that there were no significant differences between males and females in their
abilities regarding their positive problem orientation, their rational problem solving, their ability to
make decisions, their ability to implement and verify solutions, their impulsivity and
carelessness style, and their avoidance style. The three exceptions were found with negative
problem orientation, generation of alternatives, and social problem solving ability. The two
genders differed significantly in the case of negative problem orientation (t = -2.49, p < 0.05).
134
Female respondents had a higher mean value on this subscale indicating that they had a higher
tendency towards a negative problem orientation, thus confirming the alternative hypothesis H1.
With regards to the generation of alternatives females had a lower mean score than their male
counterparts pointing to a lesser ability to generate alternatives (t = 2.01, p < 0.05). The
alternative hypothesis H2 was confirmed in this case. The females also had a lower mean score
than the males with respect to their overall problem solving ability (t = 2.09, p < 0.05). Again the
alternative hypothesis H2 was confirmed. This indicated that the females had a lesser total
problem solving ability. In all three comparisons homogeneity of variance was observed.
9.4.2.2 Marital status
1) Experience of Work and Life Circumstances Questionnaire
Each of the subscales of the Experience of Work and Life Circumstances Questionnaire (WLQ)
was subjected to the t-test. The mean values and the standard deviation were based on the raw
scores.
The three general hypotheses that were investigated for each of the eight variables for marital
status were as follows:
H0: �MARRIED = �NON-MAR H1: �MARRIED < �NON-MARRIED H2: �MARRIED > �NON-MARRIED
When each of the subscales was subjected to the t-test no significant differences were found for
seven of the eight variables regarding the two marital status groups except for causes outside
the work situation (Table 9.10). This is indicative that the null hypothesis is retained at the cost
of alternative hypotheses H1 or H2 in each case except in the case of causes outside the work
situation. The difference between the mean scores for the married and non-married group was
insignificant meaning that the respondents making up each group generally reported similar low
levels of stress regarding their experience of stress, organizational functioning, task
characteristics, physical working conditions, career matters, social matters, and remuneration,
fringe benefits and personnel policy.
The single exception was stress caused by factors outside the work situation. The two marital
groups differed significantly from one another (t = -2.63, p < 0.01). Subjects categorized as non-
married had a higher mean score than the married subjects and therefore generally
experienced higher levels of stress outside the workplace than their married counterparts. The
alternative hypothesis H1 was thus confirmed. The F ratio for this comparison was insignificant.
The resultant homogeneity of variance limited the significance to differences between the two
groups unaffected by differences within the two groups.

135
Table 9.10: T-test statistics for the Experience of Work and Life Circumstances Questionnaire for marital status
Subscale Marital Status N Mean Standard
deviation t Pr > �t� F Value Pr > F
Married 154 73.00 19.84 Level of stress
Non-married 52 76.04 20.86 -0.94 0.3459 1.11 0.6317
Married 154 24.60 6.23 Causes outside the work situation Non-married 52 27.35 7.24
-2.63 0.0091* 1.35 0.1690
Married 154 20.35 5.71 Organizational functioning Non-married 52 20.19 5.41
0.18 0.8611 1.12 0.6626
Married 154 50.23 7.36 Task characteristics Non-married 52 50.29 6.66
-0.05 0.9577 1.22 0.4171
Married 154 24.60 5.94 Physical working conditions Non-married 52 24.39 5.69
0.23 0.8217 1.09 0.7287
Married 154 24.44 6.46 Career matters
Non-married 52 24.08 6.08 0.35 0.7261 1.13 0.6274
Married 154 24.73 4.78 Social matters
Non-married 52 25.08 4.12 0.88 0.3820 1.35 0.2212
Married 154 28.55 8.96
Cau
ses
wit
hin
the
wor
k si
tuat
ion
Remuneration, fringe benefits and personnel policy Non-married 52 28.10 8.12
0.32 0.7494 1.22 0.4244
2) Aggression in the Workplace Questionnaire
The aggression in the workplace questionnaire (AWQ) was subjected to the t-test. The mean
values and the standard deviation were based on the raw scores.
a) Aggression in the workplace-witnessed
The three general hypotheses that were investigated for each of the fifteen variables for marital
status were as follows:
H0: �WITMARRIED = �WITNON-MARRIED H1: �WITMARRIED < �WITNON-MARRIED H2: �WITMARRIED >�WITNON-MARRIED
The calculations of the t-values show that the null hypothesis is retained at the cost of the
alternative hypotheses H1 and H2 (Table 9.11) for all four variables. The respondents belonging
to either the married or the non-married group did not witness any significant differences in their
levels of aggression no matter in which form. A significant F value was found for overt
aggression but the accompanying t-value was not significant and therefore no further
interpretation was necessary.
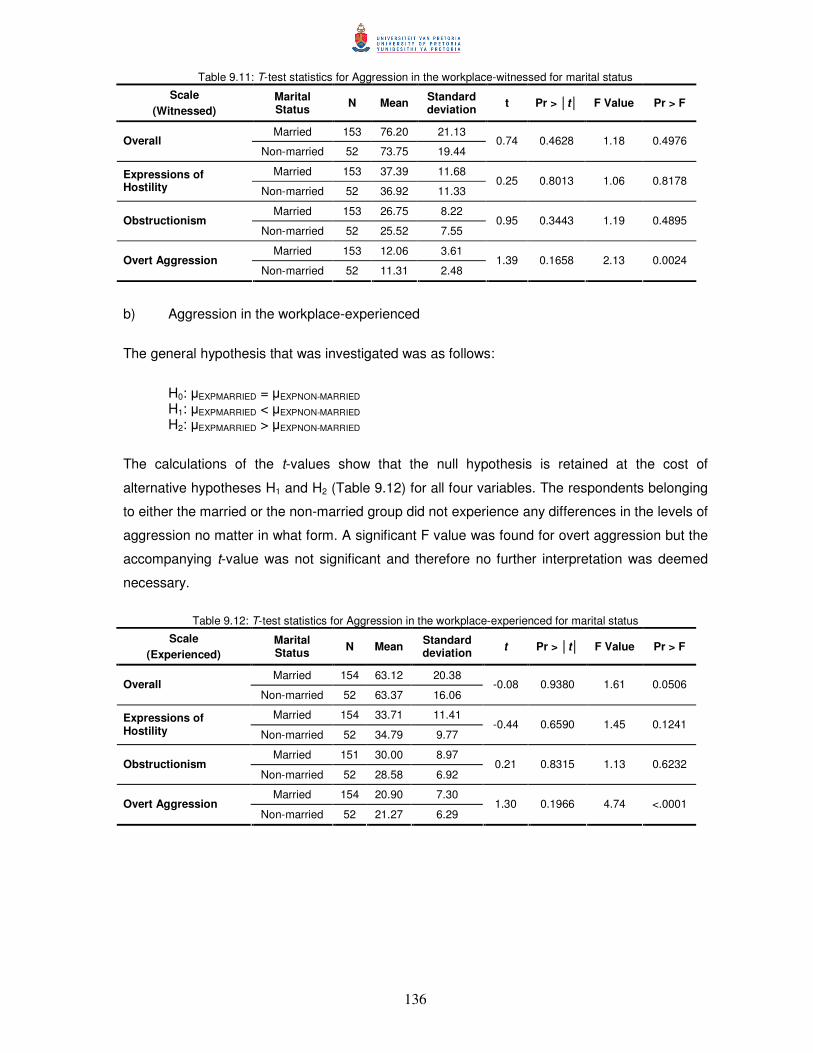
136
Table 9.11: T-test statistics for Aggression in the workplace-witnessed for marital status
Scale (Witnessed)
Marital Status N Mean Standard
deviation t Pr > �t� F Value Pr > F
Married 153 76.20 21.13 Overall
Non-married 52 73.75 19.44 0.74 0.4628 1.18 0.4976
Married 153 37.39 11.68 Expressions of Hostility Non-married 52 36.92 11.33
0.25 0.8013 1.06 0.8178
Married 153 26.75 8.22 Obstructionism
Non-married 52 25.52 7.55 0.95 0.3443 1.19 0.4895
Married 153 12.06 3.61 Overt Aggression
Non-married 52 11.31 2.48 1.39 0.1658 2.13 0.0024
b) Aggression in the workplace-experienced
The general hypothesis that was investigated was as follows:
H0: �EXPMARRIED = �EXPNON-MARRIED
H1: �EXPMARRIED < �EXPNON-MARRIED H2: �EXPMARRIED > �EXPNON-MARRIED
The calculations of the t-values show that the null hypothesis is retained at the cost of
alternative hypotheses H1 and H2 (Table 9.12) for all four variables. The respondents belonging
to either the married or the non-married group did not experience any differences in the levels of
aggression no matter in what form. A significant F value was found for overt aggression but the
accompanying t-value was not significant and therefore no further interpretation was deemed
necessary.
Table 9.12: T-test statistics for Aggression in the workplace-experienced for marital status
Scale (Experienced)
Marital Status N Mean Standard
deviation t Pr > �t� F Value Pr > F
Married 154 63.12 20.38 Overall
Non-married 52 63.37 16.06 -0.08 0.9380 1.61 0.0506
Married 154 33.71 11.41 Expressions of Hostility Non-married 52 34.79 9.77
-0.44 0.6590 1.45 0.1241
Married 151 30.00 8.97 Obstructionism
Non-married 52 28.58 6.92 0.21 0.8315 1.13 0.6232
Married 154 20.90 7.30 Overt Aggression
Non-married 52 21.27 6.29 1.30 0.1966 4.74 <.0001
137
3) IPAT Anxiety Scale
Each of the subscales of the IPAT Anxiety Scale was subjected to the t-test. The mean values
and the standard deviation were based on the raw scores.
The three general hypotheses that were investigated for each of the eight variables for marital
status were as follows:
H0: �IPATMARRIED = �IPATNON-MARRIED H1: �IPATMARRIED < �IPATNON-MARRIED H2: �IPATMARRIED > �IPATNON-MARRIED
The results show that five statistically significant comparisons occurred with Factor L, Factor Q4,
and Score A being the exceptions (Table 9.13).
Firstly the two marital status groups differed significantly in terms of Factor –C (t = -2.66, p <
0.01). Respondents categorized as non-married had a higher mean score than the married
group, thus indicating a trend towards having slightly less ego strength and somewhat more ego
weakness in general. The alternative hypothesis H1 was thus confirmed. Heterogeneity of
variance did occur implying that the observed differences were not only due to a difference
between the two groups, but also due to the significant difference in dispersion of score around
the two means. This result implied that there were differences between the two groups as well
as within the groups themselves.
Factor O was the second variable where the two marital status groups differed significantly (t =
-2.26, p < 0.05). The subjects falling into the category non-married once more had a higher
mean compared to the married group indicating a greater tendency to guilt proneness and a
lesser tendency towards untroubled adequacy again confirming the alternative hypothesis H1.
Once again homogeneity of variance was present in the data set.
The third comparison related to Factor -Q3 (t = -1.97, p < 0.05). As in the previous comparisons,
the non-married group had a higher mean score than the married group. The respondents of the
non-married group tended towards more defective integration and lack of self-sentiment when
compared to those in the married group. Homogeneity of variance once again was present.
Fourthly Score B also showed significant differences (t = -2.66, p < 0.01). The subjects that
made up the non-married group had a somewhat higher mean score compared to that of the
subjects of the married group, indicating that the non-married group members had a greater
tendency towards overt, symptomatic, and conscious anxiety thus confirming the alternative
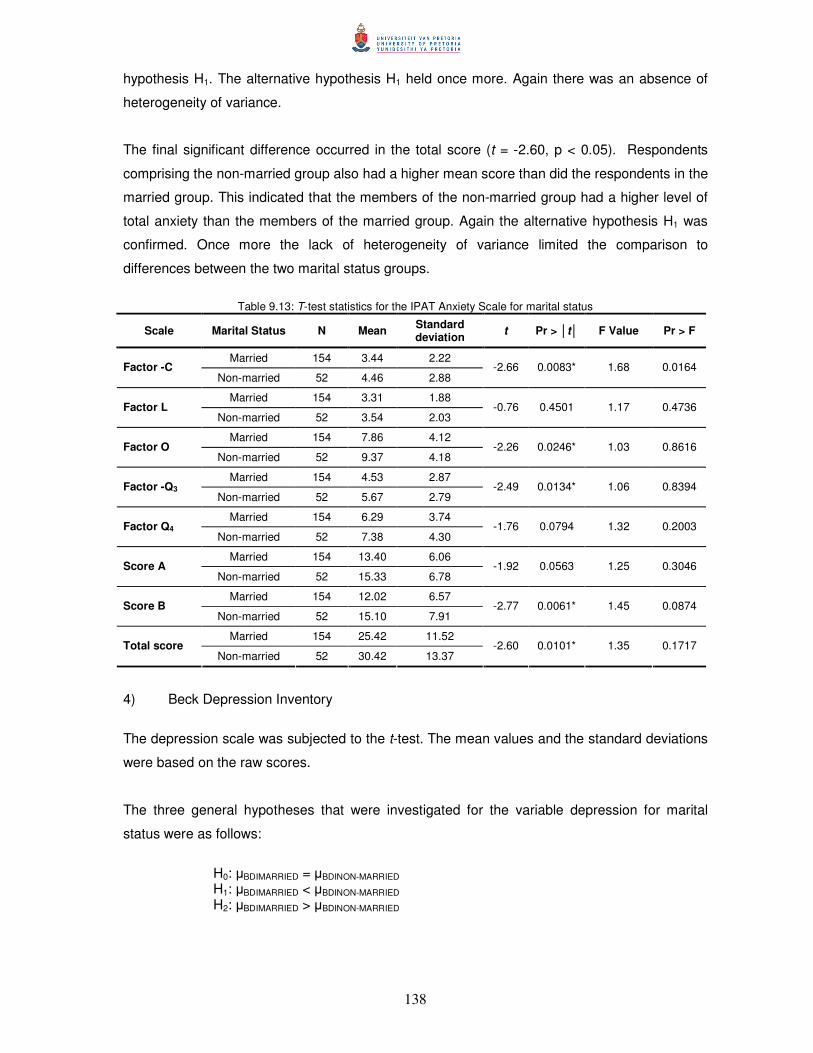
138
hypothesis H1. The alternative hypothesis H1 held once more. Again there was an absence of
heterogeneity of variance.
The final significant difference occurred in the total score (t = -2.60, p < 0.05). Respondents
comprising the non-married group also had a higher mean score than did the respondents in the
married group. This indicated that the members of the non-married group had a higher level of
total anxiety than the members of the married group. Again the alternative hypothesis H1 was
confirmed. Once more the lack of heterogeneity of variance limited the comparison to
differences between the two marital status groups.
Table 9.13: T-test statistics for the IPAT Anxiety Scale for marital status
Scale Marital Status N Mean Standard deviation t Pr > �t� F Value Pr > F
Married 154 3.44 2.22 Factor -C
Non-married 52 4.46 2.88 -2.66 0.0083* 1.68 0.0164
Married 154 3.31 1.88 Factor L
Non-married 52 3.54 2.03 -0.76 0.4501 1.17 0.4736
Married 154 7.86 4.12 Factor O
Non-married 52 9.37 4.18 -2.26 0.0246* 1.03 0.8616
Married 154 4.53 2.87 Factor -Q3
Non-married 52 5.67 2.79 -2.49 0.0134* 1.06 0.8394
Married 154 6.29 3.74 Factor Q4
Non-married 52 7.38 4.30 -1.76 0.0794 1.32 0.2003
Married 154 13.40 6.06 Score A
Non-married 52 15.33 6.78 -1.92 0.0563 1.25 0.3046
Married 154 12.02 6.57 Score B
Non-married 52 15.10 7.91 -2.77 0.0061* 1.45 0.0874
Married 154 25.42 11.52 Total score
Non-married 52 30.42 13.37 -2.60 0.0101* 1.35 0.1717
4) Beck Depression Inventory
The depression scale was subjected to the t-test. The mean values and the standard deviations
were based on the raw scores.
The three general hypotheses that were investigated for the variable depression for marital
status were as follows:
H0: �BDIMARRIED = �BDINON-MARRIED H1: �BDIMARRIED < �BDINON-MARRIED H2: �BDIMARRIED > �BDINON-MARRIED

139
The results show that the null hypothesis is not rejected in favour of the alternative hypothesis
H1 or H2 (Table 9.14). This implies that there were no significant differences in the levels of
depression experienced between the married and the non-married groups.
Table 9.14: T-test statistics for the Beck Depression Inventory for marital status
Scale Marital Status N Mean Standard
deviation t Pr > �t� F Value Pr > F
Married 154 6.44 6.18 Depression
Non-married 51 8.43 7.51 -1.89 0.0607 1.48 0.0741
5) Penn State Worry Questionnaire
The Penn State Worry Questionnaire was subjected to the t-test. The mean values and the
standard deviations were based on the raw scores.
The three general hypotheses that were investigated for the variable worry for marital status
were as follows:
H0: �WORMARRIED = �WORNON-MARRIED H1: �WORMARRIED < �WORNON-MARRIED H2: �WORMARRIED > �WORNON-MARRIED
The results show that the null hypothesis is rejected in favour of the alternative hypothesis H1
(Table 9.15). The married group had a lower mean score than the non-married group, which
implied that the former experienced lower levels of worry than the latter.
Table 9.15: T-test statistics for the Penn State Worry Questionnaire for marital status
Scale Marital Status N Mean Standard
deviation t Pr > �t� F Value Pr > F
Married 152 40.28 10.98 Worry
Non-married 51 44.59 11.11 -2.42 0.0166* 1.02 0.8855
6) Social Problem-Solving Inventory-Revised
The three general hypotheses that were investigated for each of the ten variables for marital
status were as follows:
H0: �SPMARRIED = �SPFNON-MARRIED H1: �SPMARRIED < �SPSNON-MARRIED H2: �SPMARRIED > �SPSNON-MARRIED
Each of the subscales of the Social Problem-Solving Inventory-Revised was subjected to the t-
test. The mean values and the standard deviation were based on the raw scores.
The results show that in the case of three of the ten subscales the null hypothesis is retained at
the expense of the alternative hypothesis H1 or H2 (Table 9.16). This implies that there were no
140
significant differences between the married and non-married groups regarding their abilities to
generate alternatives, make decisions, and implementing and verifying solutions. A significant
difference did exist between the two groups with respect to the remaining seven variables,
namely positive problem orientation, negative problem orientation, rational problem solving,
problem definition and formulation, impulsivity and carelessness style, avoidance style, and
social problem solving.
With regard to the first variable, positive problem orientation a significant difference was
delineated (t = 2.12, p < 0.05). The mean score of the married subjects was found to be higher
than that of the non-married group implying that the married subjects had more of a positive
problem orientation than their unmarried and divorced counterparts. The alternative hypothesis
H2 was confirmed. Homogeneity of variance was present.
The second variable that was significant was negative problem orientation (t = -3.72, p < 0.01).
In this case the non-married group had a higher mean score than the married subjects. The
members of the former group tended to resort more to negative problem orientation than those
of the latter group. The alternative hypothesis H1 held in this case. Once again homogeneity of
variance was found.
The third significant difference was found with the variable rational problem solving (t = 2.01, p <
0.05). Married subjects had a higher mean score than the non-married group. Married subjects
were thus more inclined to use this intellectual approach, thus confirming the alternative
hypothesis H2. Heterogeneity of variance was not present.
The fourth comparison that showed a significant difference was with the variable problem
definition and formulation (t = 2.17, p< 0.05). Married subjects had a higher mean score than
their non-married counterparts implying that the former performed better by being more inclined
to use problem definition and formulation than the latter. The alternative hypothesis H2 was
upheld again. In this case heterogeneity of variance did occur. Besides differences between
groups differences within groups also occurred thus confounding any clear conclusion.
In the fifth place the variable impulsivity/carelessness style was found to be significant (t = -2.96,
p < 0.01). In this case the respondents that fell into the non-married group had a higher mean
score than the married respondents indicating that first mentioned group tended to have a more
impulsive and careless approach to dealing with problems than the second mentioned group.
The alternative hypothesis H1 was applicable in this case. Once again heterogeneity of variance
did not occur.
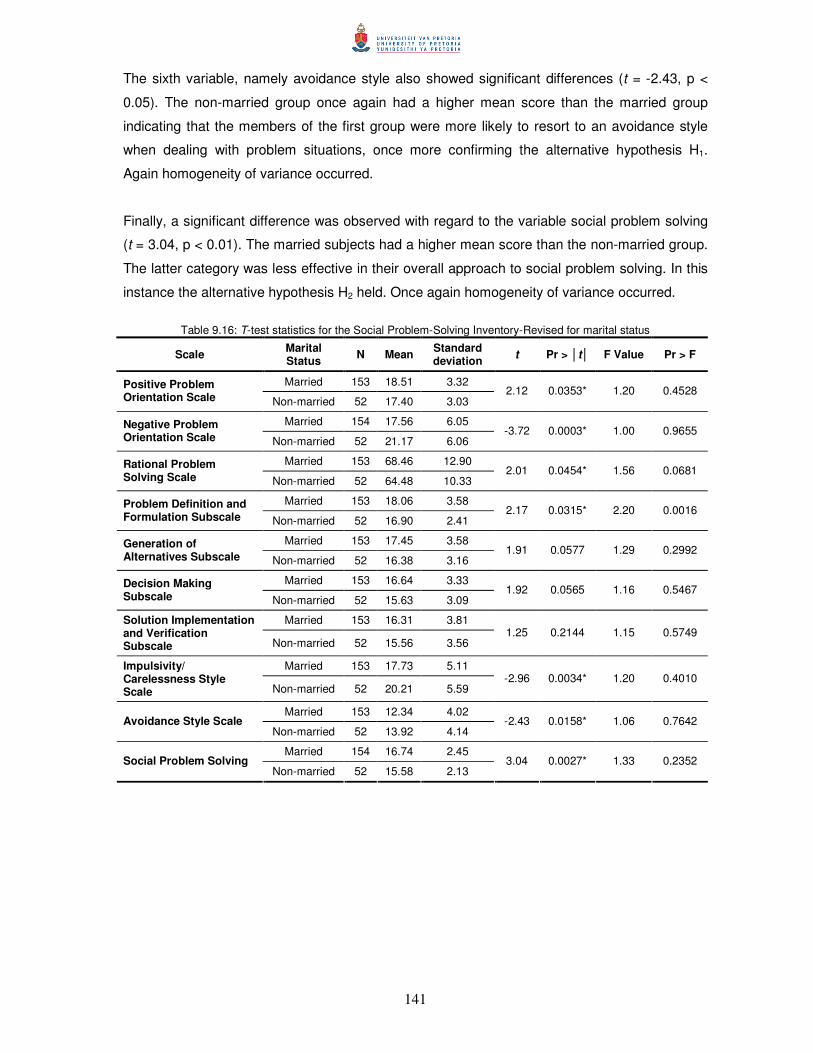
141
The sixth variable, namely avoidance style also showed significant differences (t = -2.43, p <
0.05). The non-married group once again had a higher mean score than the married group
indicating that the members of the first group were more likely to resort to an avoidance style
when dealing with problem situations, once more confirming the alternative hypothesis H1.
Again homogeneity of variance occurred.
Finally, a significant difference was observed with regard to the variable social problem solving
(t = 3.04, p < 0.01). The married subjects had a higher mean score than the non-married group.
The latter category was less effective in their overall approach to social problem solving. In this
instance the alternative hypothesis H2 held. Once again homogeneity of variance occurred.
Table 9.16: T-test statistics for the Social Problem-Solving Inventory-Revised for marital status
Scale Marital Status N Mean Standard
deviation t Pr > �t� F Value Pr > F
Married 153 18.51 3.32 Positive Problem Orientation Scale Non-married 52 17.40 3.03
2.12 0.0353* 1.20 0.4528
Married 154 17.56 6.05 Negative Problem Orientation Scale Non-married 52 21.17 6.06
-3.72 0.0003* 1.00 0.9655
Married 153 68.46 12.90 Rational Problem Solving Scale Non-married 52 64.48 10.33
2.01 0.0454* 1.56 0.0681
Married 153 18.06 3.58 Problem Definition and Formulation Subscale Non-married 52 16.90 2.41
2.17 0.0315* 2.20 0.0016
Married 153 17.45 3.58 Generation of Alternatives Subscale Non-married 52 16.38 3.16
1.91 0.0577 1.29 0.2992
Married 153 16.64 3.33 Decision Making Subscale Non-married 52 15.63 3.09
1.92 0.0565 1.16 0.5467
Married 153 16.31 3.81 Solution Implementation and Verification Subscale Non-married 52 15.56 3.56
1.25 0.2144 1.15 0.5749
Married 153 17.73 5.11 Impulsivity/ Carelessness Style Scale Non-married 52 20.21 5.59
-2.96 0.0034* 1.20 0.4010
Married 153 12.34 4.02 Avoidance Style Scale
Non-married 52 13.92 4.14 -2.43 0.0158* 1.06 0.7642
Married 154 16.74 2.45 Social Problem Solving
Non-married 52 15.58 2.13 3.04 0.0027* 1.33 0.2352
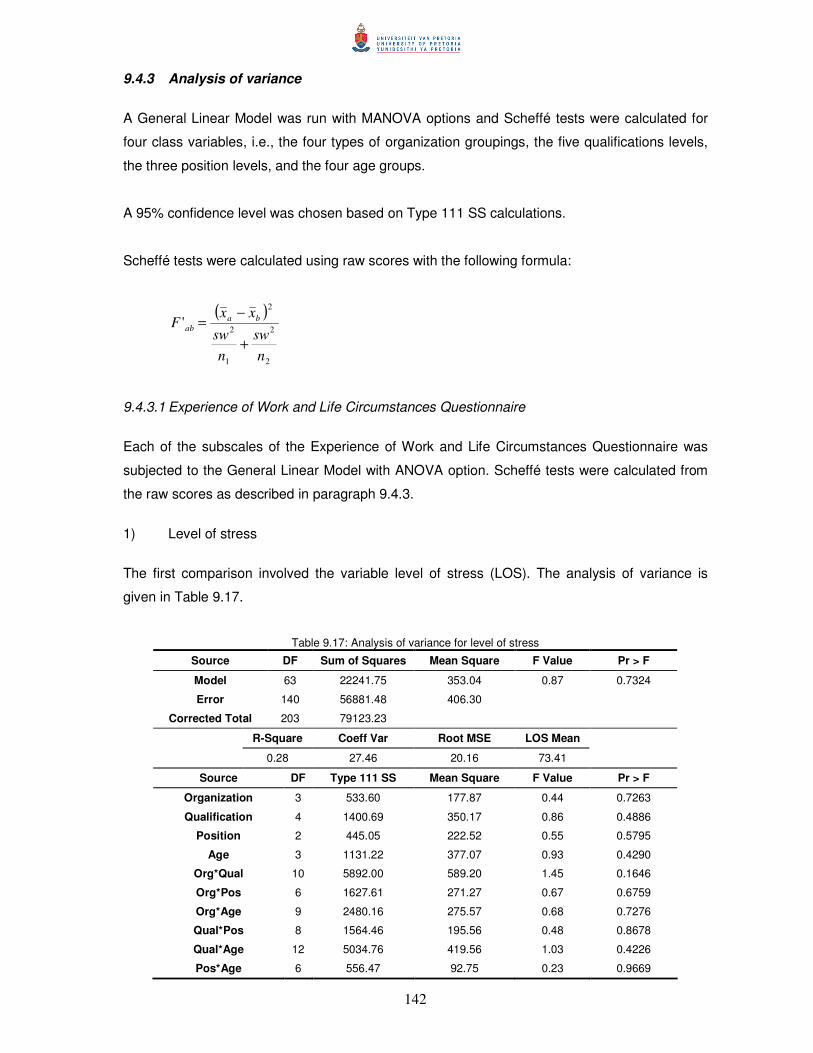
142
9.4.3 Analysis of variance
A General Linear Model was run with MANOVA options and Scheffé tests were calculated for
four class variables, i.e., the four types of organization groupings, the five qualifications levels,
the three position levels, and the four age groups.
A 95% confidence level was chosen based on Type 111 SS calculations.
Scheffé tests were calculated using raw scores with the following formula:
( )
2
2
1
2
2
'
nsw
nsw
xxF ba
ab
+
−=
9.4.3.1 Experience of Work and Life Circumstances Questionnaire
Each of the subscales of the Experience of Work and Life Circumstances Questionnaire was
subjected to the General Linear Model with ANOVA option. Scheffé tests were calculated from
the raw scores as described in paragraph 9.4.3.
1) Level of stress
The first comparison involved the variable level of stress (LOS). The analysis of variance is
given in Table 9.17.
Table 9.17: Analysis of variance for level of stress
Source DF Sum of Squares Mean Square F Value Pr > F
Model 63 22241.75 353.04 0.87 0.7324
Error 140 56881.48 406.30
Corrected Total 203 79123.23
R-Square Coeff Var Root MSE LOS Mean
0.28 27.46 20.16 73.41
Source DF Type 111 SS Mean Square F Value Pr > F
Organization 3 533.60 177.87 0.44 0.7263
Qualification 4 1400.69 350.17 0.86 0.4886
Position 2 445.05 222.52 0.55 0.5795
Age 3 1131.22 377.07 0.93 0.4290
Org*Qual 10 5892.00 589.20 1.45 0.1646
Org*Pos 6 1627.61 271.27 0.67 0.6759
Org*Age 9 2480.16 275.57 0.68 0.7276
Qual*Pos 8 1564.46 195.56 0.48 0.8678
Qual*Age 12 5034.76 419.56 1.03 0.4226
Pos*Age 6 556.47 92.75 0.23 0.9669
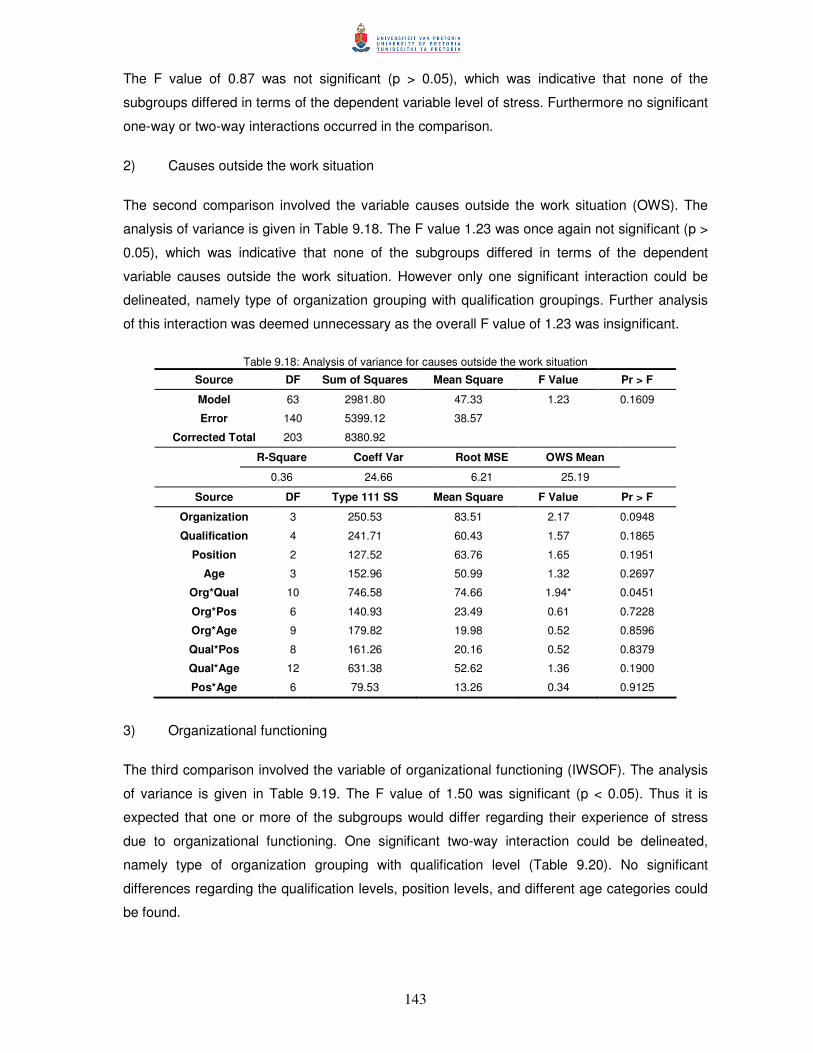
143
The F value of 0.87 was not significant (p > 0.05), which was indicative that none of the
subgroups differed in terms of the dependent variable level of stress. Furthermore no significant
one-way or two-way interactions occurred in the comparison.
2) Causes outside the work situation
The second comparison involved the variable causes outside the work situation (OWS). The
analysis of variance is given in Table 9.18. The F value 1.23 was once again not significant (p >
0.05), which was indicative that none of the subgroups differed in terms of the dependent
variable causes outside the work situation. However only one significant interaction could be
delineated, namely type of organization grouping with qualification groupings. Further analysis
of this interaction was deemed unnecessary as the overall F value of 1.23 was insignificant.
Table 9.18: Analysis of variance for causes outside the work situation
Source DF Sum of Squares Mean Square F Value Pr > F
Model 63 2981.80 47.33 1.23 0.1609
Error 140 5399.12 38.57
Corrected Total 203 8380.92
R-Square Coeff Var Root MSE OWS Mean
0.36 24.66 6.21 25.19
Source DF Type 111 SS Mean Square F Value Pr > F
Organization 3 250.53 83.51 2.17 0.0948
Qualification 4 241.71 60.43 1.57 0.1865
Position 2 127.52 63.76 1.65 0.1951
Age 3 152.96 50.99 1.32 0.2697
Org*Qual 10 746.58 74.66 1.94* 0.0451
Org*Pos 6 140.93 23.49 0.61 0.7228
Org*Age 9 179.82 19.98 0.52 0.8596
Qual*Pos 8 161.26 20.16 0.52 0.8379
Qual*Age 12 631.38 52.62 1.36 0.1900
Pos*Age 6 79.53 13.26 0.34 0.9125
3) Organizational functioning
The third comparison involved the variable of organizational functioning (IWSOF). The analysis
of variance is given in Table 9.19. The F value of 1.50 was significant (p < 0.05). Thus it is
expected that one or more of the subgroups would differ regarding their experience of stress
due to organizational functioning. One significant two-way interaction could be delineated,
namely type of organization grouping with qualification level (Table 9.20). No significant
differences regarding the qualification levels, position levels, and different age categories could
be found.
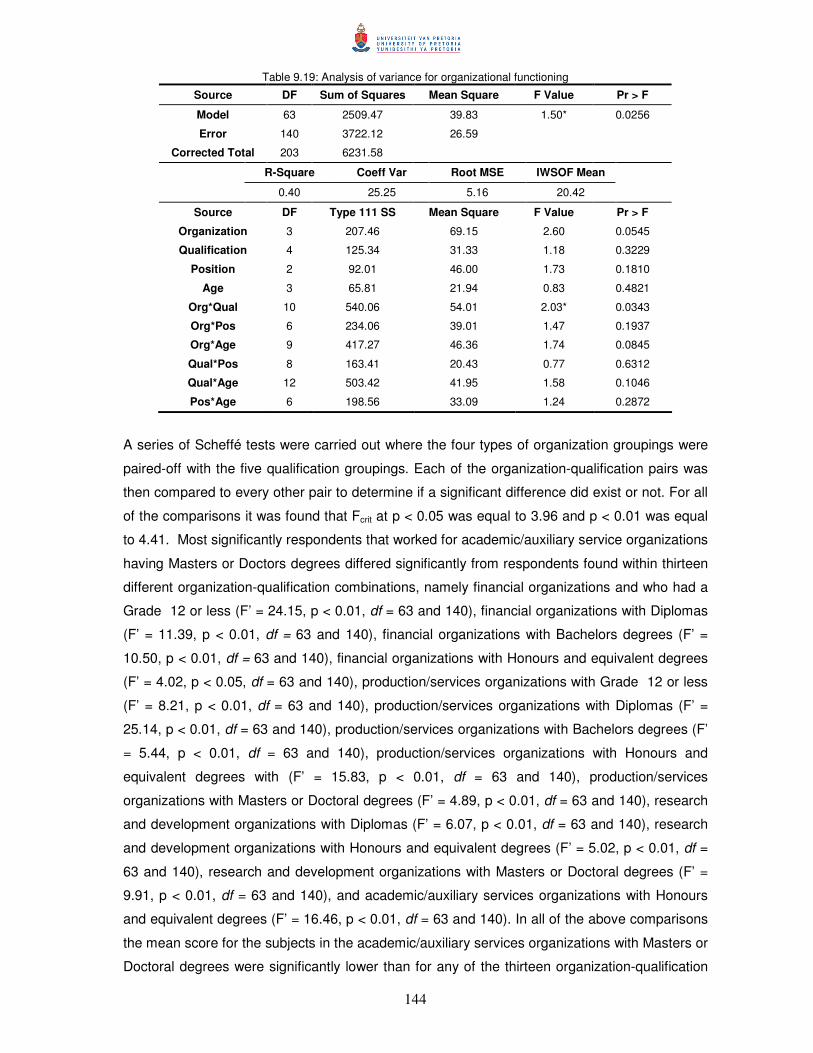
144
Table 9.19: Analysis of variance for organizational functioning
Source DF Sum of Squares Mean Square F Value Pr > F
Model 63 2509.47 39.83 1.50* 0.0256
Error 140 3722.12 26.59
Corrected Total 203 6231.58
R-Square Coeff Var Root MSE IWSOF Mean
0.40 25.25 5.16 20.42
Source DF Type 111 SS Mean Square F Value Pr > F
Organization 3 207.46 69.15 2.60 0.0545
Qualification 4 125.34 31.33 1.18 0.3229
Position 2 92.01 46.00 1.73 0.1810
Age 3 65.81 21.94 0.83 0.4821
Org*Qual 10 540.06 54.01 2.03* 0.0343
Org*Pos 6 234.06 39.01 1.47 0.1937
Org*Age 9 417.27 46.36 1.74 0.0845
Qual*Pos 8 163.41 20.43 0.77 0.6312
Qual*Age 12 503.42 41.95 1.58 0.1046
Pos*Age 6 198.56 33.09 1.24 0.2872
A series of Scheffé tests were carried out where the four types of organization groupings were
paired-off with the five qualification groupings. Each of the organization-qualification pairs was
then compared to every other pair to determine if a significant difference did exist or not. For all
of the comparisons it was found that Fcrit at p < 0.05 was equal to 3.96 and p < 0.01 was equal
to 4.41. Most significantly respondents that worked for academic/auxiliary service organizations
having Masters or Doctors degrees differed significantly from respondents found within thirteen
different organization-qualification combinations, namely financial organizations and who had a
Grade 12 or less (F’ = 24.15, p < 0.01, df = 63 and 140), financial organizations with Diplomas
(F’ = 11.39, p < 0.01, df = 63 and 140), financial organizations with Bachelors degrees (F’ =
10.50, p < 0.01, df = 63 and 140), financial organizations with Honours and equivalent degrees
(F’ = 4.02, p < 0.05, df = 63 and 140), production/services organizations with Grade 12 or less
(F’ = 8.21, p < 0.01, df = 63 and 140), production/services organizations with Diplomas (F’ =
25.14, p < 0.01, df = 63 and 140), production/services organizations with Bachelors degrees (F’
= 5.44, p < 0.01, df = 63 and 140), production/services organizations with Honours and
equivalent degrees with (F’ = 15.83, p < 0.01, df = 63 and 140), production/services
organizations with Masters or Doctoral degrees (F’ = 4.89, p < 0.01, df = 63 and 140), research
and development organizations with Diplomas (F’ = 6.07, p < 0.01, df = 63 and 140), research
and development organizations with Honours and equivalent degrees (F’ = 5.02, p < 0.01, df =
63 and 140), research and development organizations with Masters or Doctoral degrees (F’ =
9.91, p < 0.01, df = 63 and 140), and academic/auxiliary services organizations with Honours
and equivalent degrees (F’ = 16.46, p < 0.01, df = 63 and 140). In all of the above comparisons
the mean score for the subjects in the academic/auxiliary services organizations with Masters or
Doctoral degrees were significantly lower than for any of the thirteen organization-qualification

145
combinations implying that the subjects who had a Masters or Doctoral degree working in an
academic/auxiliary services environment experienced organizational functioning as more
problematic than subjects in any of the other combinations.
The second comparison involved subjects working in production/services organizations with
Diplomas, which differed significantly from four organization-qualification combinations of which
one involving subjects working in academic/auxiliary services organizations with a Masters or
Doctoral degree has been reported previously. The remaining three included subjects working
in research and development organizations with a Masters or Doctoral degree (F’ = 7.19, p <
0.01, df = 63 and 140), in academic/auxiliary services organizations with a Diploma a (F’ = 6.85,
p < 0.01, df = 63 and 140), and a Bachelors Degree (F’ = 4.39, p < 0.05, df = 63 and 140). The
mean score of the former was significantly higher than for the latter groups indicating that
subjects working in an production/services environment with a Diploma degree experienced
organizational functioning as less problematic than those working in research and development
environments with a Grade 12 or lower, a Diploma, a Bachelors and a Masters or Doctoral
degree.
Another two significant comparisons were found. The first of these comparisons involved
respondents working in production/services organizations with Honours or equivalent degrees,
which differed significantly from subjects found in research and development organizations with
Masters or Doctoral degrees (F’ = 4.22, p < 0.01, df = 63 and 140) and subjects found in
academic/auxiliary services organizations with a Diploma (F’ = 5.02, p < 0.01, df = 63 and 140).
In the comparison the mean score for the subjects that worked in production/services with
Honours or equivalent degrees was significantly higher than for the subjects working in research
and development organizations with Masters or Doctoral degrees and those working in
academic/auxiliary services organizations which was indicative that the former experienced
organization functioning as less problematic than the latter. The second comparison involved
subjects that worked for financial organizations with Honours and equivalent degrees who
differed significantly from production/services organizations with Diplomas (F’ = 4.87, p < 0.05,
df = 63 and 140). The respondents with an Honours or equivalent degree working for a financial
organization had a lower mean average than the respondents with Diplomas working for the
production/services organizations indicating that the former experienced organizational
functioning as more problematic compared to the latter.
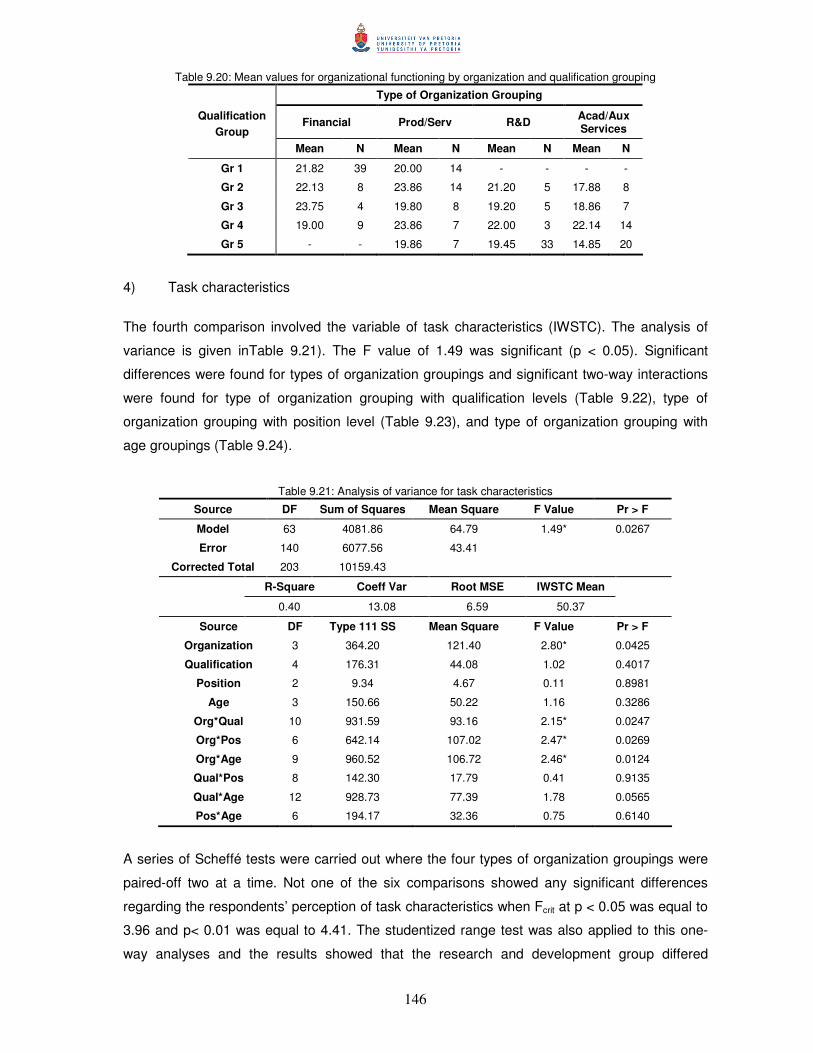
146
Table 9.20: Mean values for organizational functioning by organization and qualification grouping
Type of Organization Grouping
Financial Prod/Serv R&D Acad/Aux Services
Qualification Group
Mean N Mean N Mean N Mean N
Gr 1 21.82 39 20.00 14 - - - -
Gr 2 22.13 8 23.86 14 21.20 5 17.88 8
Gr 3 23.75 4 19.80 8 19.20 5 18.86 7
Gr 4 19.00 9 23.86 7 22.00 3 22.14 14
Gr 5 - - 19.86 7 19.45 33 14.85 20
4) Task characteristics
The fourth comparison involved the variable of task characteristics (IWSTC). The analysis of
variance is given inTable 9.21). The F value of 1.49 was significant (p < 0.05). Significant
differences were found for types of organization groupings and significant two-way interactions
were found for type of organization grouping with qualification levels (Table 9.22), type of
organization grouping with position level (Table 9.23), and type of organization grouping with
age groupings (Table 9.24).
Table 9.21: Analysis of variance for task characteristics
Source DF Sum of Squares Mean Square F Value Pr > F
Model 63 4081.86 64.79 1.49* 0.0267
Error 140 6077.56 43.41
Corrected Total 203 10159.43
R-Square Coeff Var Root MSE IWSTC Mean
0.40 13.08 6.59 50.37
Source DF Type 111 SS Mean Square F Value Pr > F
Organization 3 364.20 121.40 2.80* 0.0425
Qualification 4 176.31 44.08 1.02 0.4017
Position 2 9.34 4.67 0.11 0.8981
Age 3 150.66 50.22 1.16 0.3286
Org*Qual 10 931.59 93.16 2.15* 0.0247
Org*Pos 6 642.14 107.02 2.47* 0.0269
Org*Age 9 960.52 106.72 2.46* 0.0124
Qual*Pos 8 142.30 17.79 0.41 0.9135
Qual*Age 12 928.73 77.39 1.78 0.0565
Pos*Age 6 194.17 32.36 0.75 0.6140
A series of Scheffé tests were carried out where the four types of organization groupings were
paired-off two at a time. Not one of the six comparisons showed any significant differences
regarding the respondents’ perception of task characteristics when Fcrit at p < 0.05 was equal to
3.96 and p< 0.01 was equal to 4.41. The studentized range test was also applied to this one-
way analyses and the results showed that the research and development group differed

147
significantly from the financial group (Q = 9.04 > Q =4.76, � = 0.05), the production/services
group (Q = 9.04 > Q = 4.76, � = 0.05), as well as the academic/auxiliary services group (Q =
7.20 > Q = 4.76, � = 0.05). In these comparisons the mean score for subjects working in
research and development organizations was higher than for subjects working in financial,
production/services, and academic/auxiliary organizations implying that the former experienced
task characteristics as more problematic than the latter.
Another series of Scheffé tests were carried out where the four types of organization groupings
were paired-off with the five qualification groupings. Each of the organization-qualification pairs
was then compared to every other pair to determine if a significant difference did exist or not.
For all of the comparisons it was found that Fcrit at p < 0.05 was equal to 3.96 and p < 0.01 was
equal to 4.41. Most significantly respondents that worked for research and development
organizations with Diplomas differed significantly from nine other organization-qualification
combinations, namely financial organizations with Grade 12 or lower (F’ = 4.06, p < 0.05, df =
63 and 140), financial organizations with Diplomas (F’ = 6.22, p < 0.01, df = 63 and 140),
financial organizations with Bachelors degrees (F’ = 5.12, p < 0.01, df = 63 and 140), financial
organizations with Honours and equivalent degrees (F’ = 6.29, p < 0.01, df = 63 and 140),
production/services organizations with Grade 12 or less (F’ = 6.34, p < 0.01, df = 63 and 140),
production/services organizations with Bachelors degrees (F’ = 5.74, p < 0.01, df = 63 and 140),
production/services organizations with Masters or Doctoral degrees (F’ = 5.61, p < 0.01, df = 63
and 140), academic/auxiliary services organizations with Diplomas (F’ = 6.22, p < 0.01, df = 63
and 140), academic/auxiliary services organizations with Bachelors degrees (F’ = 4.15, p <
0.05, df = 63 and 140), and academic/auxiliary services organizations with Masters or Doctoral
degrees (F’ = 6.97, p < 0.01, df = 63 and 140). In all of the above comparisons the mean score
for subjects with Diplomas working for research and development organizations was
significantly higher than for the nine organization-qualification combinations implying that the
former found task characteristics less problematic than those in the latter groupings.
Further differences were found for subjects with academic/auxiliary services organizations with
Honours or equivalent degrees with five other organization-qualification combinations, namely
financial organizations with Diplomas (F’ = 4.04, p < 0.05, df = 63 and 140), financial
organizations with Honours degrees (F’ = 4.13, p < 0.05, df = 63 and 140), production/services
organizations with Grade 12 or lower (F’ = 4.26, p < 0.05, df = 63 and 140), academic/auxiliary
services organizations with Diplomas (F’ = 4.04, p < 0.05, df = 63 and 140), and
academic/auxiliary services organizations with Masters or Doctoral degrees (F’ = 5.13, p < 0.01,
df = 63 and 140). The mean score for the respondents with and Honours degree found in an
academic/auxiliary services environment was higher than for any of the comparative
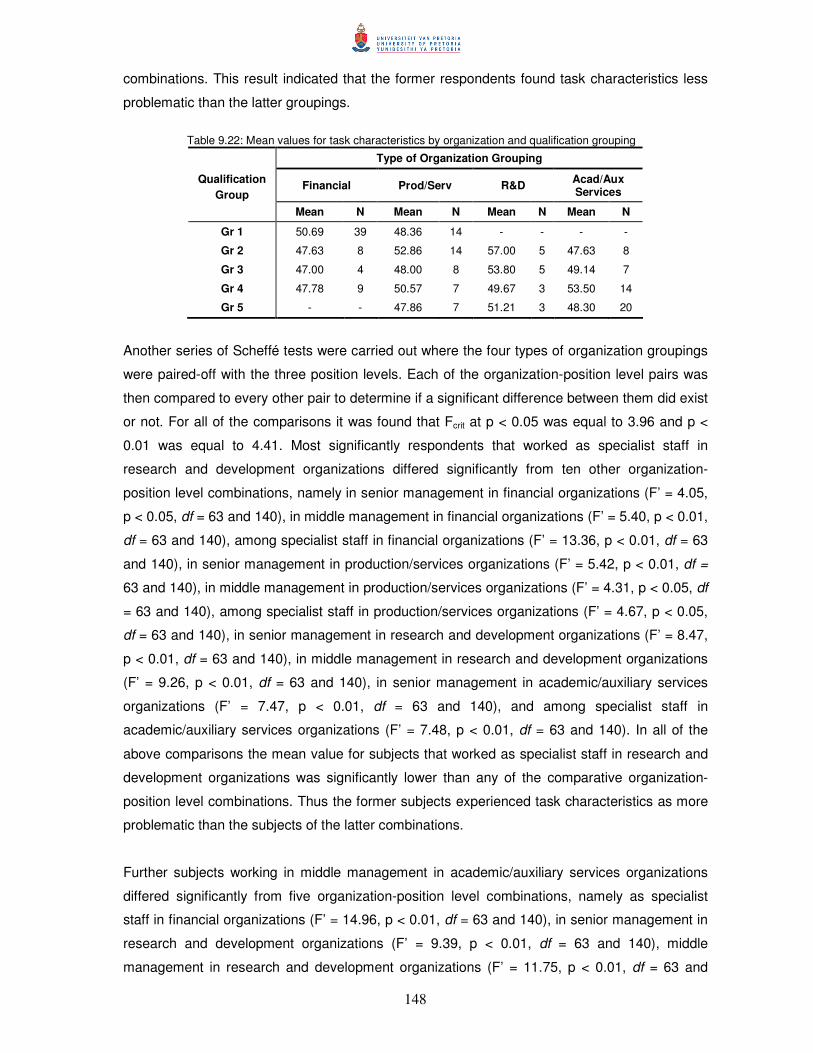
148
combinations. This result indicated that the former respondents found task characteristics less
problematic than the latter groupings.
Table 9.22: Mean values for task characteristics by organization and qualification grouping
Type of Organization Grouping
Financial Prod/Serv R&D Acad/Aux Services
Qualification Group
Mean N Mean N Mean N Mean N
Gr 1 50.69 39 48.36 14 - - - -
Gr 2 47.63 8 52.86 14 57.00 5 47.63 8
Gr 3 47.00 4 48.00 8 53.80 5 49.14 7
Gr 4 47.78 9 50.57 7 49.67 3 53.50 14
Gr 5 - - 47.86 7 51.21 3 48.30 20
Another series of Scheffé tests were carried out where the four types of organization groupings
were paired-off with the three position levels. Each of the organization-position level pairs was
then compared to every other pair to determine if a significant difference between them did exist
or not. For all of the comparisons it was found that Fcrit at p < 0.05 was equal to 3.96 and p <
0.01 was equal to 4.41. Most significantly respondents that worked as specialist staff in
research and development organizations differed significantly from ten other organization-
position level combinations, namely in senior management in financial organizations (F’ = 4.05,
p < 0.05, df = 63 and 140), in middle management in financial organizations (F’ = 5.40, p < 0.01,
df = 63 and 140), among specialist staff in financial organizations (F’ = 13.36, p < 0.01, df = 63
and 140), in senior management in production/services organizations (F’ = 5.42, p < 0.01, df =
63 and 140), in middle management in production/services organizations (F’ = 4.31, p < 0.05, df
= 63 and 140), among specialist staff in production/services organizations (F’ = 4.67, p < 0.05,
df = 63 and 140), in senior management in research and development organizations (F’ = 8.47,
p < 0.01, df = 63 and 140), in middle management in research and development organizations
(F’ = 9.26, p < 0.01, df = 63 and 140), in senior management in academic/auxiliary services
organizations (F’ = 7.47, p < 0.01, df = 63 and 140), and among specialist staff in
academic/auxiliary services organizations (F’ = 7.48, p < 0.01, df = 63 and 140). In all of the
above comparisons the mean value for subjects that worked as specialist staff in research and
development organizations was significantly lower than any of the comparative organization-
position level combinations. Thus the former subjects experienced task characteristics as more
problematic than the subjects of the latter combinations.
Further subjects working in middle management in academic/auxiliary services organizations
differed significantly from five organization-position level combinations, namely as specialist
staff in financial organizations (F’ = 14.96, p < 0.01, df = 63 and 140), in senior management in
research and development organizations (F’ = 9.39, p < 0.01, df = 63 and 140), middle
management in research and development organizations (F’ = 11.75, p < 0.01, df = 63 and
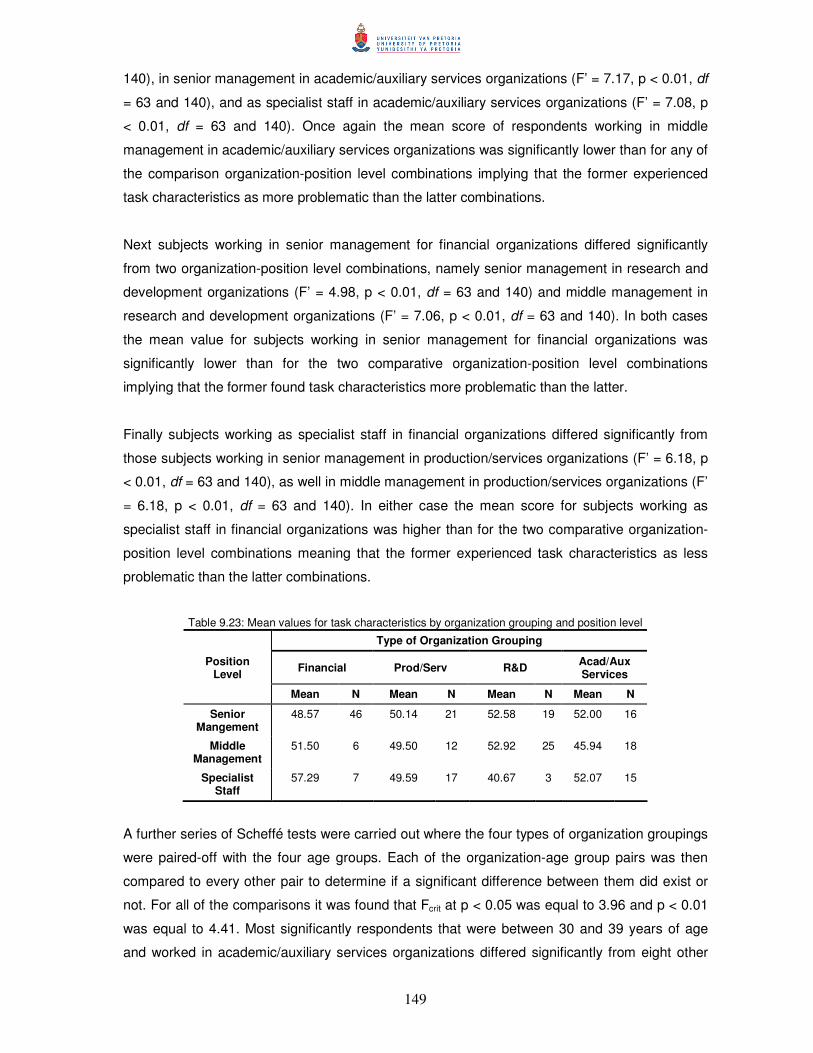
149
140), in senior management in academic/auxiliary services organizations (F’ = 7.17, p < 0.01, df
= 63 and 140), and as specialist staff in academic/auxiliary services organizations (F’ = 7.08, p
< 0.01, df = 63 and 140). Once again the mean score of respondents working in middle
management in academic/auxiliary services organizations was significantly lower than for any of
the comparison organization-position level combinations implying that the former experienced
task characteristics as more problematic than the latter combinations.
Next subjects working in senior management for financial organizations differed significantly
from two organization-position level combinations, namely senior management in research and
development organizations (F’ = 4.98, p < 0.01, df = 63 and 140) and middle management in
research and development organizations (F’ = 7.06, p < 0.01, df = 63 and 140). In both cases
the mean value for subjects working in senior management for financial organizations was
significantly lower than for the two comparative organization-position level combinations
implying that the former found task characteristics more problematic than the latter.
Finally subjects working as specialist staff in financial organizations differed significantly from
those subjects working in senior management in production/services organizations (F’ = 6.18, p
< 0.01, df = 63 and 140), as well in middle management in production/services organizations (F’
= 6.18, p < 0.01, df = 63 and 140). In either case the mean score for subjects working as
specialist staff in financial organizations was higher than for the two comparative organization-
position level combinations meaning that the former experienced task characteristics as less
problematic than the latter combinations.
Table 9.23: Mean values for task characteristics by organization grouping and position level
Type of Organization Grouping
Financial Prod/Serv R&D Acad/Aux Services
Position Level
Mean N Mean N Mean N Mean N
Senior Mangement
48.57 46 50.14 21 52.58 19 52.00 16
Middle Management
51.50 6 49.50 12 52.92 25 45.94 18
Specialist Staff
57.29 7 49.59 17 40.67 3 52.07 15
A further series of Scheffé tests were carried out where the four types of organization groupings
were paired-off with the four age groups. Each of the organization-age group pairs was then
compared to every other pair to determine if a significant difference between them did exist or
not. For all of the comparisons it was found that Fcrit at p < 0.05 was equal to 3.96 and p < 0.01
was equal to 4.41. Most significantly respondents that were between 30 and 39 years of age
and worked in academic/auxiliary services organizations differed significantly from eight other
150
organization-age group combinations, namely between 20 and 29 years of age in financial
organizations (F’ = 4.09, p < 0.05, df = 63 and 140), between 30 and 39 years of age in financial
organizations (F’ = 3.99, p < 0.05, df = 63 and 140), between 30 and 39 years of age in
production/services organizations (F’ = 4.21, p < 0.05, df = 63 and 140), 50 years of age and
older in production/services organizations (F’ = 5.42, p < 0.01, df = 63 and 140), between 30
and 39 years of age in research and development organizations (F’ = 4.39, p < 0.05, df = 63
and 140), between 40 and 49 years of age in research and development organizations (F’ =
4.93, p < 0.01, df = 63 and 140), 50 years of age and older in research and development
organizations (F’ = 8.68, p < 0.01, df = 63 and 140), and 50 years of age older and in
academic/auxiliary services organizations (F’ = 6.22, p < 0.01, df = 63 and 140). In all of the
above comparisons the mean value for subjects between 30 and 39 years of age working in an
academic/auxiliary services environment was significantly lower than any of the comparative
organization-age group combinations. Thus the former subjects experienced task
characteristics as more problematic than the subjects of the latter combinations.
Another significant comparison similar to the above was found for respondents that were 50
years of age and older and worked in financial organizations, which differed significantly from
seven other organization-age group combinations, namely between 20 and 29 years of age in
financial organizations (F’ = 4.25, p < 0.05, df = 63 and 140), between 30 and 39 years of age in
production/services organizations (F’ = 4.03, p < 0.05, df = 63 and 140), 50 years of age and
older and in production/services organizations (F’ = 5.35, p < 0.01, df = 63 and 140), between
30 and 39 years of age in research and development organizations (F’ = 4.15, p < 0.05, df = 63
and 140), between 40 and 49 years of age in research and development organizations (F’ =
4.70, p < 0.01, df = 63 and 140), 50 years of age and older in research and development
organizations (F’ = 8.05, p < 0.01, df = 63 and 140), and 50 years of age and older in
academic/auxiliary services organizations (F’ = 5.71, p < 0.01, df = 63 and 140). The
combination of subjects between 30 and 39 years of age in academic/auxiliary services
organizations was excluded. In all of the above comparisons the mean value for subjects that
were 50 years of age and older working in a financial environment was significantly lower than
any of the comparative organization-age group combinations. Thus the former subjects
experienced task characteristics as more problematic than the subjects of the latter
combinations.
Finally subjects 50 years of age and older and working in research and development
organizations were found to differ significantly from five other organization-age group
combinations of which respondents that were between 30 and 39 years of age and worked in
academic/auxiliary services organizations and that were 50 years of age and older and that
worked in financial organizations, have been reported above. The remaining combinations
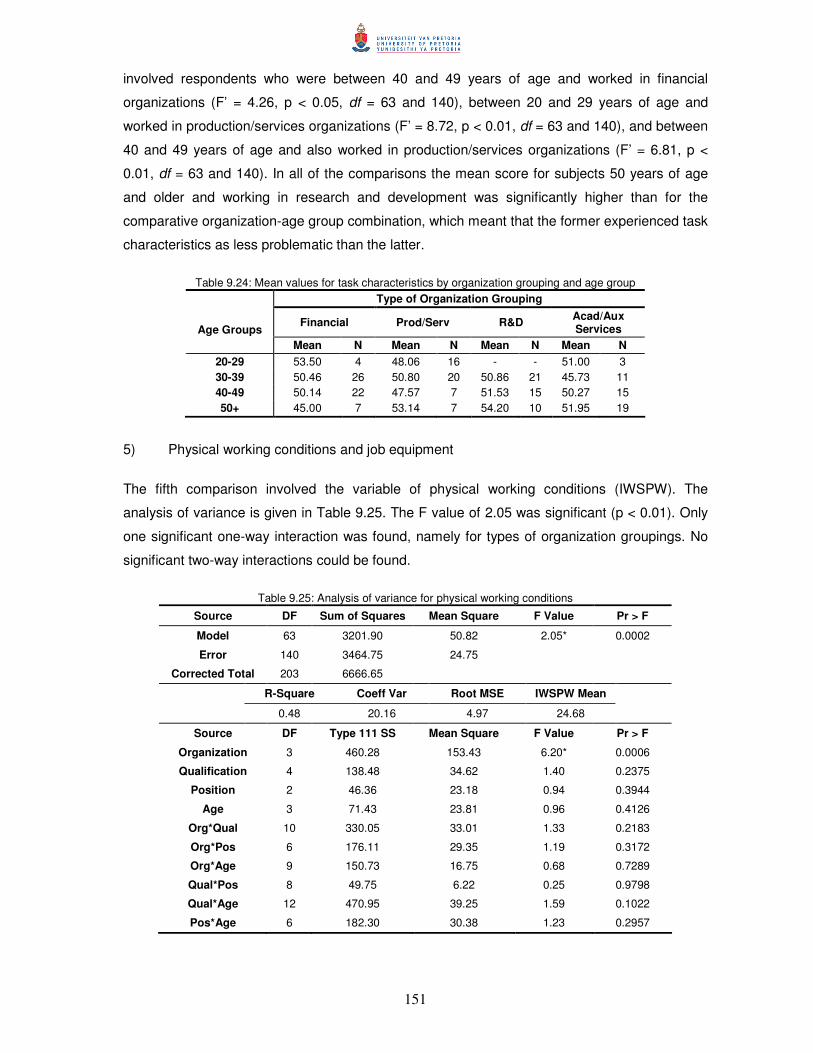
151
involved respondents who were between 40 and 49 years of age and worked in financial
organizations (F’ = 4.26, p < 0.05, df = 63 and 140), between 20 and 29 years of age and
worked in production/services organizations (F’ = 8.72, p < 0.01, df = 63 and 140), and between
40 and 49 years of age and also worked in production/services organizations (F’ = 6.81, p <
0.01, df = 63 and 140). In all of the comparisons the mean score for subjects 50 years of age
and older and working in research and development was significantly higher than for the
comparative organization-age group combination, which meant that the former experienced task
characteristics as less problematic than the latter.
Table 9.24: Mean values for task characteristics by organization grouping and age group Type of Organization Grouping
Financial Prod/Serv R&D Acad/Aux Services Age Groups
Mean N Mean N Mean N Mean N 20-29 53.50 4 48.06 16 - - 51.00 3 30-39 50.46 26 50.80 20 50.86 21 45.73 11 40-49 50.14 22 47.57 7 51.53 15 50.27 15 50+ 45.00 7 53.14 7 54.20 10 51.95 19
5) Physical working conditions and job equipment
The fifth comparison involved the variable of physical working conditions (IWSPW). The
analysis of variance is given in Table 9.25. The F value of 2.05 was significant (p < 0.01). Only
one significant one-way interaction was found, namely for types of organization groupings. No
significant two-way interactions could be found.
Table 9.25: Analysis of variance for physical working conditions
Source DF Sum of Squares Mean Square F Value Pr > F
Model 63 3201.90 50.82 2.05* 0.0002
Error 140 3464.75 24.75
Corrected Total 203 6666.65
R-Square Coeff Var Root MSE IWSPW Mean
0.48 20.16 4.97 24.68
Source DF Type 111 SS Mean Square F Value Pr > F
Organization 3 460.28 153.43 6.20* 0.0006
Qualification 4 138.48 34.62 1.40 0.2375
Position 2 46.36 23.18 0.94 0.3944
Age 3 71.43 23.81 0.96 0.4126
Org*Qual 10 330.05 33.01 1.33 0.2183
Org*Pos 6 176.11 29.35 1.19 0.3172
Org*Age 9 150.73 16.75 0.68 0.7289
Qual*Pos 8 49.75 6.22 0.25 0.9798
Qual*Age 12 470.95 39.25 1.59 0.1022
Pos*Age 6 182.30 30.38 1.23 0.2957
152
A series of Scheffé tests were carried out where the four types of organization groupings were
paired-off two at a time. Five of the six comparisons showed significant differences regarding
the respondent’s perception of their physical working conditions. For the five comparisons it was
found that Fcrit was equal to 3.96 (p < 0.05) and equal to 4.41 (p < 0.01). Firstly financial
organizations differed significantly from production/services organizations (F’ = 10.12, p < 0.01,
df = 63 and 140). The mean score for the former was lower than for the latter meaning that
subjects working for financial organizations saw their physical working conditions as more
problematic than those working for production/services organizations. Secondly financial
organizations differed significantly form academic/auxiliary services organizations (F’ = 16.15, p
< 0.01, df = 63 and 140). In this case the mean score of subjects working in financial
organizations was significantly higher than for those working in academic/auxiliary services
organizations implying that the former experienced their physical working conditions as less
problematic than the latter. Thirdly production/services organizations differed significantly from
research and development organizations (F’ = 7.14, p < 0.01, df = 63 and 140). The mean score
of the first was significantly higher than for the second, which meant that production/services
organizations perceived their physical working conditions as less perturbing than their
counterparts in research and development organizations. Fourthly production/services
organizations differed significantly from academic/auxiliary services organizations (F’ = 47.33, p
< 0.01, df = 63 and 140). Again the mean score for subjects working in production/services
organizations was significantly higher than for those working in academic/auxiliary services
organizations implying that the former experienced their physical working conditions as less
worrisome than the latter. Finally research and development organizations differed significantly
from academic/auxiliary services organizations (F’ = 16.94, p < 0.01, df = 63 and 140). Here the
first organization’s subjects also had a higher mean score than that for the second organization,
which was indicative that respondents in research and development organizations perceived
their physical working conditions as less perturbing than those found in academic/auxiliary
services environments. No differences were found between financial and research and
development organizations in terms of physical working conditions.
6) Career matters
The sixth comparison involved the variable of task characteristics (IWSCM). The analysis of
variance is given in Table 9.26. The F value of 1.76 was significant (p < 0.01). Significant
differences were found for types of organization groupings and significant interactions were
found for type of organization grouping with qualification levels (Table 9.27).

153
Table 9.26: Analysis of variance for career matters
Source DF Sum of Squares Mean Square F Value Pr > F
Model 63 3491.57 55.42 1.76* 0.0031
Error 140 4403.26 31.45
Corrected Total 203 7894.82
R-Square Coeff Var Root MSE CM Mean
0.44 22.92 5.61 24.47
Source DF Type 111 SS Mean Square F Value Pr > F
Organization 3 302.18 100.73 3.20* 0.0253
Qualification 4 271.83 67.96 2.16 0.0765
Position 2 91.38 45.69 1.45 0.2374
Age 3 120.66 40.22 1.28 0.2841
Org*Qual 10 611.51 61.15 1.94* 0.0440
Org*Pos 6 159.78 26.63 0.85 0.5360
Org*Age 9 539.23 59.91 1.90 0.0559
Qual*Pos 8 113.72 14.22 0.45 0.8876
Qual*Age 12 397.98 33.17 1.05 0.4033
Pos*Age 6 95.39 15.90 0.51 0.8034
A series of Scheffé tests were carried out where the four types of organization groupings were
paired-off two at a time. Four of the six comparisons showed significant differences regarding
the respondents’ experience of career matters. For the four comparisons it was found that Fcrit
was equal to 3.96 (p < 0.05) and equal to 4.41 (p < 0.01). Firstly financial organizations differed
significantly from research and development organizations (F’ = 4.51, p < 0.01, df = 63 and
140). The mean score for the former was higher than that for the latter implying that subjects
working in financial organizations found career matters less of an issue than for those in
research and development organizations. Secondly financial organizations also differed
significantly from academic/auxiliary services organizations (F’ = 10.99, p < 0.01, df = 63 and
140). The mean score for subjects found in financial organizations was significantly higher than
that for subjects found in academic/auxiliary services organizations, which allowed the
conclusion that the former experienced that career matters was less worrisome than for the
latter. Thirdly production/services organizations differed significantly from research and
development organizations (F’ = 4.81, p < 0.01, df = 63 and 140). In this case the mean score
also was higher for those subjects working in production/services organizations than for
subjects in research and development organizations indicating that the former found career
matters less perturbing than the latter. Finally production/services organizations also differed
significantly from academic/auxiliary services organizations (F’ = 11.12, p < 0.01, df = 63 and
140). The mean score for the first organization was significantly higher than for the second
organization meaning that subjects in a production/services environment perceived career
matters as less problematic than subjects in academic/auxiliary services organizations.
154
A series of two-way Scheffé tests were carried out where the four types of organization
groupings were paired-off with the five qualification groupings. Each of the organization-
qualification pairs was then compared to every other pair to determine if a significant difference
between them did exist or not. For all of the comparisons it was found that Fcrit at p < 0.05 was
equal to 3.96 and p < 0.01 was equal to 4.41. Most significantly subjects that had a Masters or
Doctoral degree and worked in academic/auxiliary services organizations differed significantly
from ten other organization-qualification grouping combinations, namely with a Grade 12 or
lower in financial organizations (F’ = 15.13, p < 0.01, df = 63 and 140), with a Diploma in
financial organizations (F’ = 8.98, p < 0.01, df = 63 and 140), with a Bachelors degree in
financial organizations (F’ = 14.39, p < 0.01, df = 63 and 140), with a Diploma in
production/services organizations (F’ = 20.23, p < 0.01, df = 63 and 140), with a Bachelors
degree in production/services organizations (F’ = 4.15, p < 0.05, df = 63 and 140), with an
Honours or equivalent degree in production/services organizations (F’ = 10.95, p < 0.01, df = 63
and 140), with a Masters of Doctoral degree in production/services organizations (F’ = 4.61, p <
0.01, df = 63 and 140), with a Bachelors degree in research and development organizations (F’
= 4.50, p < 0.01, df = 63 and 140), with Masters or Doctoral degrees in research and
development organizations (F’ = 4.16, p < 0.05, df = 63 and 140), and with an Honours or
equivalent degree in academic/auxiliary services organizations (F’ = 9.46, p < 0.01, df = 63 and
140). In all of the above comparisons the mean value for subjects with a Masters or Doctoral
degree working in an academic/auxiliary services environment was significantly lower than any
of the comparative organization-qualification groupings combinations. Thus the former subjects
experienced career matters as more of a concern than the subjects of the latter combinations.
The next significant comparison involved subjects that had a Diploma and worked in
academic/auxiliary services organizations differed significantly from eight other organization-
qualification groupings combinations, namely with a Grade 12 or lower in financial
organizations (F’ = 9.19, p < 0.01, df = 63 and 140), with a Diploma in financial organizations (F’
= 7.40, p < 0.01, df = 63 and 140), with a Bachelors degree in financial organizations (F’ =
12.72, p < 0.01, df = 63 and 140), with a Diploma in production/services organizations (F’ =
14.27, p < 0.01, df = 63 and 140), with an Honours or equivalent degree in production/services
organizations (F’ = 9.09, p < 0.01, df = 63 and 140), with a Masters of Doctoral degree in
production/services organizations (F’ = 4.12, p < 0.05, df = 63 and 140), with a Bachelors
degree in research and development organizations (F’ = 4.20, p < 0.05, df = 63 and 140), and
with an Honours or equivalent degree in academic/auxiliary services organizations (F’ = 7.07, p
< 0.01, df = 63 and 140). In all of the above comparisons the mean value for subjects that had a
Diploma and worked in an academic/auxiliary services environment was significantly lower than
any of the comparative organization-qualification groupings combinations. Thus the former
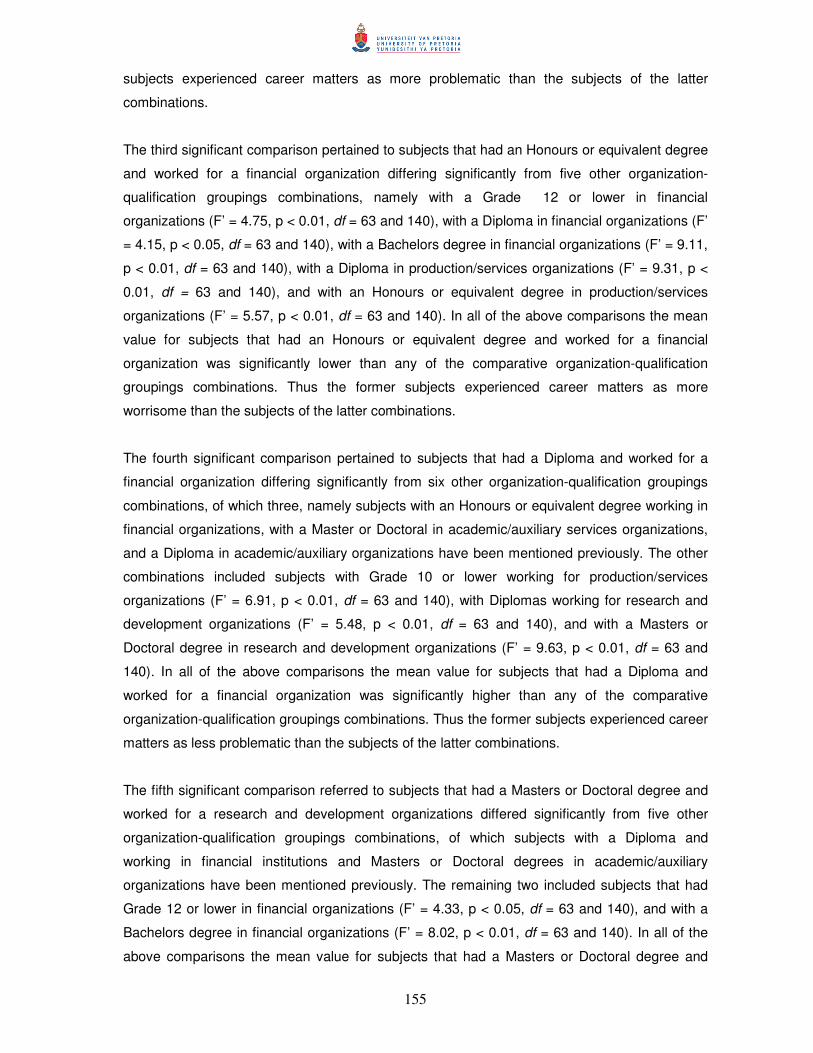
155
subjects experienced career matters as more problematic than the subjects of the latter
combinations.
The third significant comparison pertained to subjects that had an Honours or equivalent degree
and worked for a financial organization differing significantly from five other organization-
qualification groupings combinations, namely with a Grade 12 or lower in financial
organizations (F’ = 4.75, p < 0.01, df = 63 and 140), with a Diploma in financial organizations (F’
= 4.15, p < 0.05, df = 63 and 140), with a Bachelors degree in financial organizations (F’ = 9.11,
p < 0.01, df = 63 and 140), with a Diploma in production/services organizations (F’ = 9.31, p <
0.01, df = 63 and 140), and with an Honours or equivalent degree in production/services
organizations (F’ = 5.57, p < 0.01, df = 63 and 140). In all of the above comparisons the mean
value for subjects that had an Honours or equivalent degree and worked for a financial
organization was significantly lower than any of the comparative organization-qualification
groupings combinations. Thus the former subjects experienced career matters as more
worrisome than the subjects of the latter combinations.
The fourth significant comparison pertained to subjects that had a Diploma and worked for a
financial organization differing significantly from six other organization-qualification groupings
combinations, of which three, namely subjects with an Honours or equivalent degree working in
financial organizations, with a Master or Doctoral in academic/auxiliary services organizations,
and a Diploma in academic/auxiliary organizations have been mentioned previously. The other
combinations included subjects with Grade 10 or lower working for production/services
organizations (F’ = 6.91, p < 0.01, df = 63 and 140), with Diplomas working for research and
development organizations (F’ = 5.48, p < 0.01, df = 63 and 140), and with a Masters or
Doctoral degree in research and development organizations (F’ = 9.63, p < 0.01, df = 63 and
140). In all of the above comparisons the mean value for subjects that had a Diploma and
worked for a financial organization was significantly higher than any of the comparative
organization-qualification groupings combinations. Thus the former subjects experienced career
matters as less problematic than the subjects of the latter combinations.
The fifth significant comparison referred to subjects that had a Masters or Doctoral degree and
worked for a research and development organizations differed significantly from five other
organization-qualification groupings combinations, of which subjects with a Diploma and
working in financial institutions and Masters or Doctoral degrees in academic/auxiliary
organizations have been mentioned previously. The remaining two included subjects that had
Grade 12 or lower in financial organizations (F’ = 4.33, p < 0.05, df = 63 and 140), and with a
Bachelors degree in financial organizations (F’ = 8.02, p < 0.01, df = 63 and 140). In all of the
above comparisons the mean value for subjects that had a Masters or Doctoral degree and
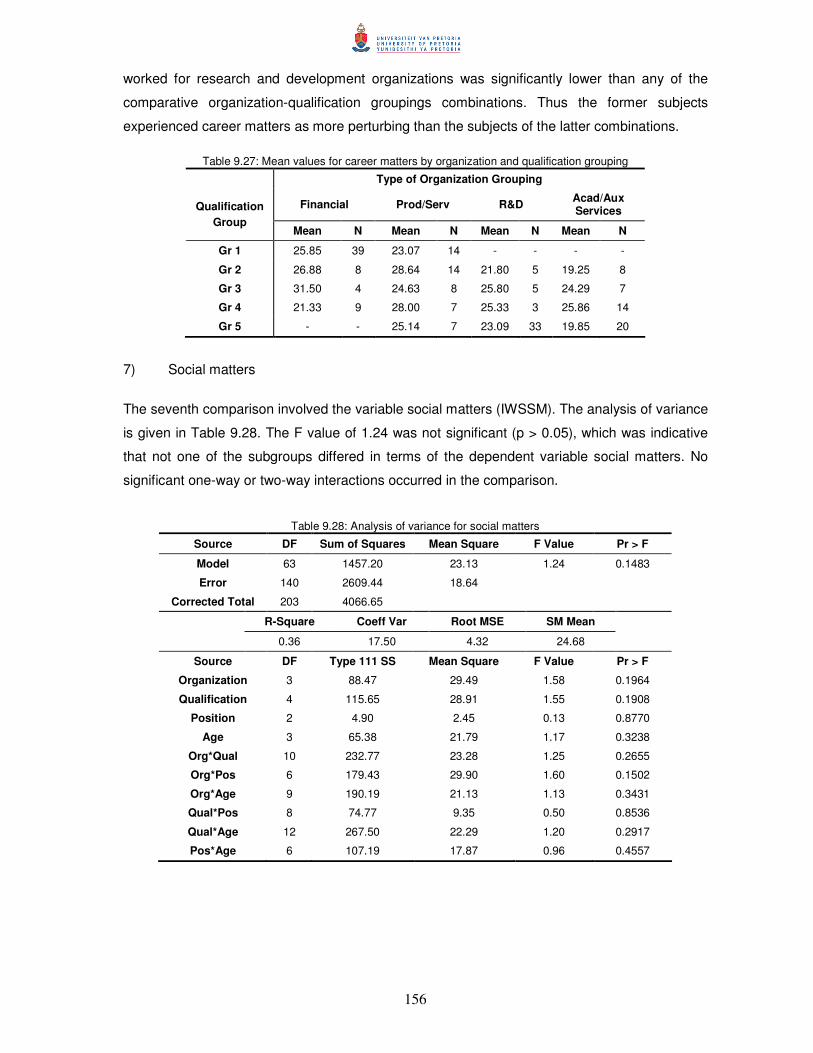
156
worked for research and development organizations was significantly lower than any of the
comparative organization-qualification groupings combinations. Thus the former subjects
experienced career matters as more perturbing than the subjects of the latter combinations.
Table 9.27: Mean values for career matters by organization and qualification grouping
Type of Organization Grouping
Financial Prod/Serv R&D Acad/Aux Services Qualification
Group Mean N Mean N Mean N Mean N
Gr 1 25.85 39 23.07 14 - - - -
Gr 2 26.88 8 28.64 14 21.80 5 19.25 8
Gr 3 31.50 4 24.63 8 25.80 5 24.29 7
Gr 4 21.33 9 28.00 7 25.33 3 25.86 14
Gr 5 - - 25.14 7 23.09 33 19.85 20
7) Social matters
The seventh comparison involved the variable social matters (IWSSM). The analysis of variance
is given in Table 9.28. The F value of 1.24 was not significant (p > 0.05), which was indicative
that not one of the subgroups differed in terms of the dependent variable social matters. No
significant one-way or two-way interactions occurred in the comparison.
Table 9.28: Analysis of variance for social matters
Source DF Sum of Squares Mean Square F Value Pr > F
Model 63 1457.20 23.13 1.24 0.1483
Error 140 2609.44 18.64
Corrected Total 203 4066.65
R-Square Coeff Var Root MSE SM Mean
0.36 17.50 4.32 24.68
Source DF Type 111 SS Mean Square F Value Pr > F
Organization 3 88.47 29.49 1.58 0.1964
Qualification 4 115.65 28.91 1.55 0.1908
Position 2 4.90 2.45 0.13 0.8770
Age 3 65.38 21.79 1.17 0.3238
Org*Qual 10 232.77 23.28 1.25 0.2655
Org*Pos 6 179.43 29.90 1.60 0.1502
Org*Age 9 190.19 21.13 1.13 0.3431
Qual*Pos 8 74.77 9.35 0.50 0.8536
Qual*Age 12 267.50 22.29 1.20 0.2917
Pos*Age 6 107.19 17.87 0.96 0.4557

157
8) Remuneration, fringe benefits and personnel policy
The final comparison involved the variable remuneration, fringe benefits and personnel policy
(IWSRF). The analysis of variance is given in Table 9.29. The F value of1.52 was significant (p
< 0.01). Significant differences were only found for types of organization groupings and
significant interactions were found for type of organization grouping with qualification levels
(Table 9.30), type of organization grouping with age (Table 9.31), and qualification level with
age (Table 9.32).
Table 9.29: Analysis of variance for remuneration, fringe benefits and personnel policy
Source DF Sum of Squares Mean Square F Value Pr > F
Model 63 6271.65 99.55 1.52* 0.0217
Error 140 9167.18 65.48
Corrected Total 203 15438.82
R-Square Coeff Var Root MSE RF Mean
0.41 28.36 8.09 28.53
Source DF Type 111 SS Mean Square F Value Pr > F
Organization 3 1071.50 357.17 5.45* 0.0014
Qualification 4 234.72 58.68 0.90 0.4681
Position 2 366.66 183.33 2.80 0.0642
Age 3 56.48 18.83 0.29 0.8343
Org*Qual 10 1514.88 151.49 2.31* 0.0150
Org*Pos 6 693.69 115.61 1.77 0.1104
Org*Age 9 1351.58 150.18 2.29* 0.0197
Qual*Pos 8 686.81 85.85 1.31 0.2427
Qual*Age 12 1851.96 154.33 2.36* 0.0086
Pos*Age 6 94.32 15.72 0.24 0.9625
Firstly a one-way series of Scheffé tests were carried out where the four types of organization
groupings were paired-off two at a time. Four of the six comparisons showed significant
differences regarding the respondents’ experience of remuneration, fringe benefits and
personnel policy. For the four comparisons it was found that Fcrit was equal to 3.96 (p < 0.05)
and equal to 4.41 (p < 0.01). Firstly financial organizations differed significantly from research
and development organizations (F’ = 10.06, p < 0.01, df = 63 and 140) and from
academic/auxiliary service organizations (F’ = 4.06, p < 0.05, df = 63 and 140). In the first case
the mean score for financial organizations was lower than that for research and development
organizations implying that the former experienced remuneration, fringe benefits and personnel
policy as more problematic than the latter. In the second case the mean score for financial
organizations was higher than for academic/auxiliary services organizations indicating that in
this case subjects in financial organizations perceived remuneration, fringe benefits and
personnel policy as less problematic as those in academic/auxiliary services organizations.
Secondly production/services organizations only differed significantly from academic/auxiliary
158
services organizations (F’ = 10.34, p < 0.01, df = 63 and 140). The mean score for
production/services organizations was higher when compared to academic/auxiliary services
organizations. Subjects working for production/services organizations experienced
remuneration, fringe benefits and personnel policy as less worrisome compared to those
working in academic/auxiliary services organizations. Thirdly research and development
organizations differed significantly from academic/auxiliary services organizations (F’ = 24.28, p
< 0.01, df = 63 and 140). Here the mean score of the former was higher than for the latter
meaning that subjects found in research and development organizations found remuneration,
fringe benefits and personnel policy less of an issue than the subjects found in an
academic/auxiliary services environment. No differences were found between financial and
production/services organizations and research and development organizations in terms of
remuneration, fringe benefits and personnel policy.
Secondly a two-way series of Scheffé tests were carried out where the four types of
organization groupings were paired-off with the five qualification groupings. Each of the
organization-qualification pairs was then compared to every other pair to determine if a
significant difference between them did exist or not. For all of the comparisons it was found that
Fcrit at p < 0.05 was equal to 3.96 and p < 0.01 was equal to 4.41. Most significantly subjects
that had a Masters or Doctoral degree and worked in academic/auxiliary services organizations
differed significantly from eight other organization-qualification groupings combinations, namely
with a Grade 12 or lower in financial organizations (F’ = 4.85.13, p < 0.01, df = 63 and 140),
with a Bachelors degree in financial organizations (F’ = 5.67, p < 0.01, df = 63 and 140), with a
Diploma in production/services organizations (F’ = 9.35, p < 0.01, df = 63 and 140), with a
Bachelors degree in production/services organizations (F’ = 6.96, p < 0.01, df = 63 and 140),
with an Honours or equivalent degree in production/services organizations (F’ = 10.44, p < 0.01,
df = 63 and 140), with a Diploma in research and development organizations (F’ = 9.78, p <
0.01, df = 63 and 140), with a Bachelors degree in research and development organizations (F’
= 5.46, p < 0.01, df = 63 and 140), and with an Masters or Doctoral degree in research and
development organizations (F’ = 16.95, p < 0.01, df = 63 and 140). In all of the above
comparisons the mean value for subjects with a Masters or Doctoral degree working in an
academic/auxiliary services environment was significantly lower than any of the comparative
organization-qualification groupings combinations. Thus the former subjects experienced
remuneration, fringe benefits and personnel policy as a greater concern than the subjects of the
latter combinations.
The second most significant comparison involved subjects that had an Honours or equivalent
degree and worked in financial organizations. They differed significantly from seven other
organization-qualification groupings combinations, namely with a Bachelors degree in financial
organizations (F’ = 5.38.13, p < 0.01, df = 63 and 140), with a Diploma in production/services
159
organizations (F’ = 7.31, p < 0.01, df = 63 and 140), with a Bachelors degree in
production/services organizations (F’ = 6.04, p < 0.01, df = 63 and 140), with an Honours or
equivalent degree in production/services organizations (F’ = 8.96, p < 0.01, df = 63 and 140),
with a Diploma in research and development organizations (F’ = 8.79, p < 0.01, df = 63 and
140), with a Bachelors degree in research and development organizations (F’ = 5.09, p < 0.01,
df = 63 and 140), and with an Masters or Doctoral degree in research and development
organizations (F’ = 11.17, p < 0.01, df = 63 and 140). In all of the above comparisons the mean
value for subjects with an Honours or equivalent degree working in a financial environment was
significantly lower than any of the comparative organization-qualification groupings
combinations. Thus the former subjects experienced remuneration, fringe benefits and
personnel policy as more worrisome than the subjects of the latter combinations.
The third most significant comparison involved subjects that had a Diploma and worked in
research and development organizations. They differed significantly from seven other
organization-qualification groupings combinations, of which those with an Honours or equivalent
degree working in a financial environment and with Masters and Doctoral degrees have been
reported earlier. The remaining five included subjects with a Grade 12 or lower in financial
organizations (F’ = 4.07, p < 0.05, df = 63 and 140), with a Grade 12 or lower in
production/services organizations (F’ = 6.57, p < 0.01, df = 63 and 140), with a Diploma in
academic/auxiliary services organizations (F’ = 4.67, p < 0.01, df = 63 and 140), with an
Bachelors degree in academic/auxiliary services organizations (F’ = 3.99, p < 0.05, df = 63 and
140), and with an Honours or equivalent in academic/auxiliary services organizations (F’ = 6.49,
p < 0.01, df = 63 and 140). In all of the above comparisons the mean value for subjects with a
Diploma working in research and development environments was significantly higher than any
of the comparative organization-qualification groupings combinations. Thus the former subjects
experienced remuneration, fringe benefits and personnel policy as less problematic than the
subjects of the latter combinations.
The fourth most significant comparison involved subjects that had a Masters or Doctoral degree
and worked in research and development organizations. They differed significantly from five
other organization-qualification groupings combinations, of which those with an Honours or
equivalent degree working in a financial environment and with Masters and Doctoral degrees
have been reported earlier. The remaining three included subjects with a Grade 12 or lower in
financial organizations (F’ = 5.63, p < 0.01, df = 63 and 140) and in production/services
organizations (F’ = 8.67, p < 0.01, df = 63 and 140), and with an Honours or equivalent degree
in academic/auxiliary services organizations (F’ = 8.51, p < 0.01, df = 63 and 140). In all of the
above comparisons the mean value for subjects with a Masters or Doctoral degree working in a
research and development environments was significantly higher than any of the comparative
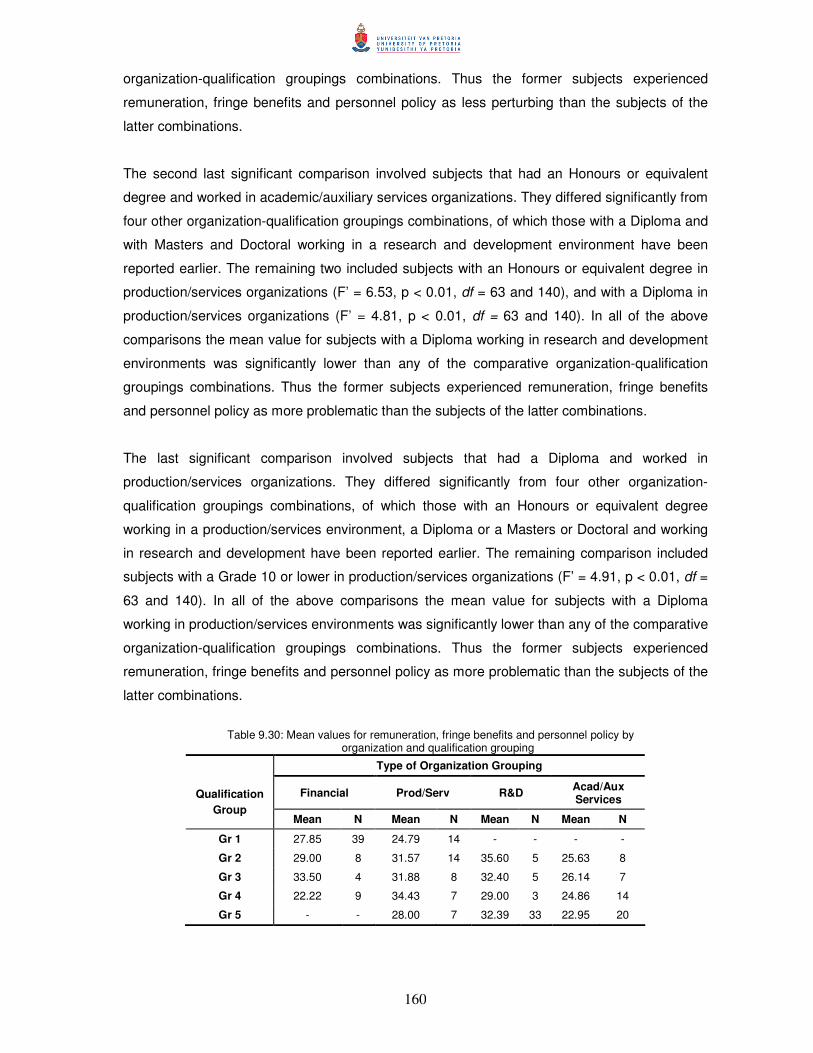
160
organization-qualification groupings combinations. Thus the former subjects experienced
remuneration, fringe benefits and personnel policy as less perturbing than the subjects of the
latter combinations.
The second last significant comparison involved subjects that had an Honours or equivalent
degree and worked in academic/auxiliary services organizations. They differed significantly from
four other organization-qualification groupings combinations, of which those with a Diploma and
with Masters and Doctoral working in a research and development environment have been
reported earlier. The remaining two included subjects with an Honours or equivalent degree in
production/services organizations (F’ = 6.53, p < 0.01, df = 63 and 140), and with a Diploma in
production/services organizations (F’ = 4.81, p < 0.01, df = 63 and 140). In all of the above
comparisons the mean value for subjects with a Diploma working in research and development
environments was significantly lower than any of the comparative organization-qualification
groupings combinations. Thus the former subjects experienced remuneration, fringe benefits
and personnel policy as more problematic than the subjects of the latter combinations.
The last significant comparison involved subjects that had a Diploma and worked in
production/services organizations. They differed significantly from four other organization-
qualification groupings combinations, of which those with an Honours or equivalent degree
working in a production/services environment, a Diploma or a Masters or Doctoral and working
in research and development have been reported earlier. The remaining comparison included
subjects with a Grade 10 or lower in production/services organizations (F’ = 4.91, p < 0.01, df =
63 and 140). In all of the above comparisons the mean value for subjects with a Diploma
working in production/services environments was significantly lower than any of the comparative
organization-qualification groupings combinations. Thus the former subjects experienced
remuneration, fringe benefits and personnel policy as more problematic than the subjects of the
latter combinations.
Table 9.30: Mean values for remuneration, fringe benefits and personnel policy by
organization and qualification grouping
Type of Organization Grouping
Financial Prod/Serv R&D Acad/Aux Services Qualification
Group Mean N Mean N Mean N Mean N
Gr 1 27.85 39 24.79 14 - - - -
Gr 2 29.00 8 31.57 14 35.60 5 25.63 8
Gr 3 33.50 4 31.88 8 32.40 5 26.14 7
Gr 4 22.22 9 34.43 7 29.00 3 24.86 14
Gr 5 - - 28.00 7 32.39 33 22.95 20
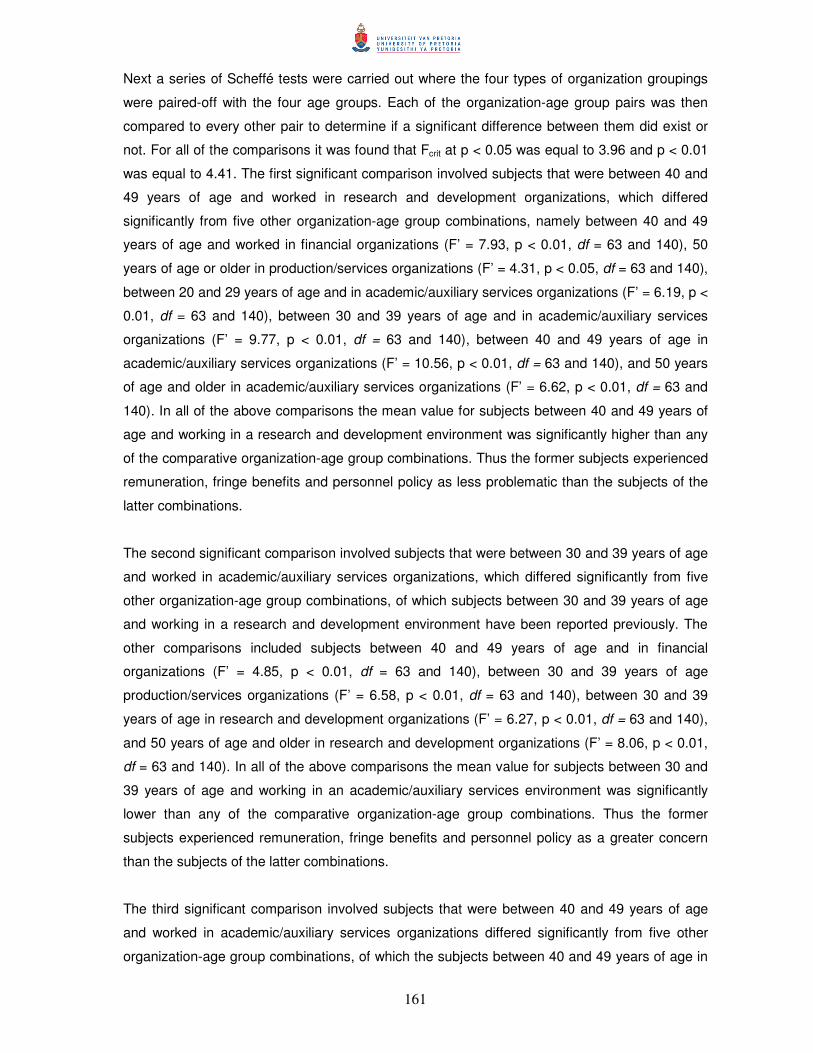
161
Next a series of Scheffé tests were carried out where the four types of organization groupings
were paired-off with the four age groups. Each of the organization-age group pairs was then
compared to every other pair to determine if a significant difference between them did exist or
not. For all of the comparisons it was found that Fcrit at p < 0.05 was equal to 3.96 and p < 0.01
was equal to 4.41. The first significant comparison involved subjects that were between 40 and
49 years of age and worked in research and development organizations, which differed
significantly from five other organization-age group combinations, namely between 40 and 49
years of age and worked in financial organizations (F’ = 7.93, p < 0.01, df = 63 and 140), 50
years of age or older in production/services organizations (F’ = 4.31, p < 0.05, df = 63 and 140),
between 20 and 29 years of age and in academic/auxiliary services organizations (F’ = 6.19, p <
0.01, df = 63 and 140), between 30 and 39 years of age and in academic/auxiliary services
organizations (F’ = 9.77, p < 0.01, df = 63 and 140), between 40 and 49 years of age in
academic/auxiliary services organizations (F’ = 10.56, p < 0.01, df = 63 and 140), and 50 years
of age and older in academic/auxiliary services organizations (F’ = 6.62, p < 0.01, df = 63 and
140). In all of the above comparisons the mean value for subjects between 40 and 49 years of
age and working in a research and development environment was significantly higher than any
of the comparative organization-age group combinations. Thus the former subjects experienced
remuneration, fringe benefits and personnel policy as less problematic than the subjects of the
latter combinations.
The second significant comparison involved subjects that were between 30 and 39 years of age
and worked in academic/auxiliary services organizations, which differed significantly from five
other organization-age group combinations, of which subjects between 30 and 39 years of age
and working in a research and development environment have been reported previously. The
other comparisons included subjects between 40 and 49 years of age and in financial
organizations (F’ = 4.85, p < 0.01, df = 63 and 140), between 30 and 39 years of age
production/services organizations (F’ = 6.58, p < 0.01, df = 63 and 140), between 30 and 39
years of age in research and development organizations (F’ = 6.27, p < 0.01, df = 63 and 140),
and 50 years of age and older in research and development organizations (F’ = 8.06, p < 0.01,
df = 63 and 140). In all of the above comparisons the mean value for subjects between 30 and
39 years of age and working in an academic/auxiliary services environment was significantly
lower than any of the comparative organization-age group combinations. Thus the former
subjects experienced remuneration, fringe benefits and personnel policy as a greater concern
than the subjects of the latter combinations.
The third significant comparison involved subjects that were between 40 and 49 years of age
and worked in academic/auxiliary services organizations differed significantly from five other
organization-age group combinations, of which the subjects between 40 and 49 years of age in
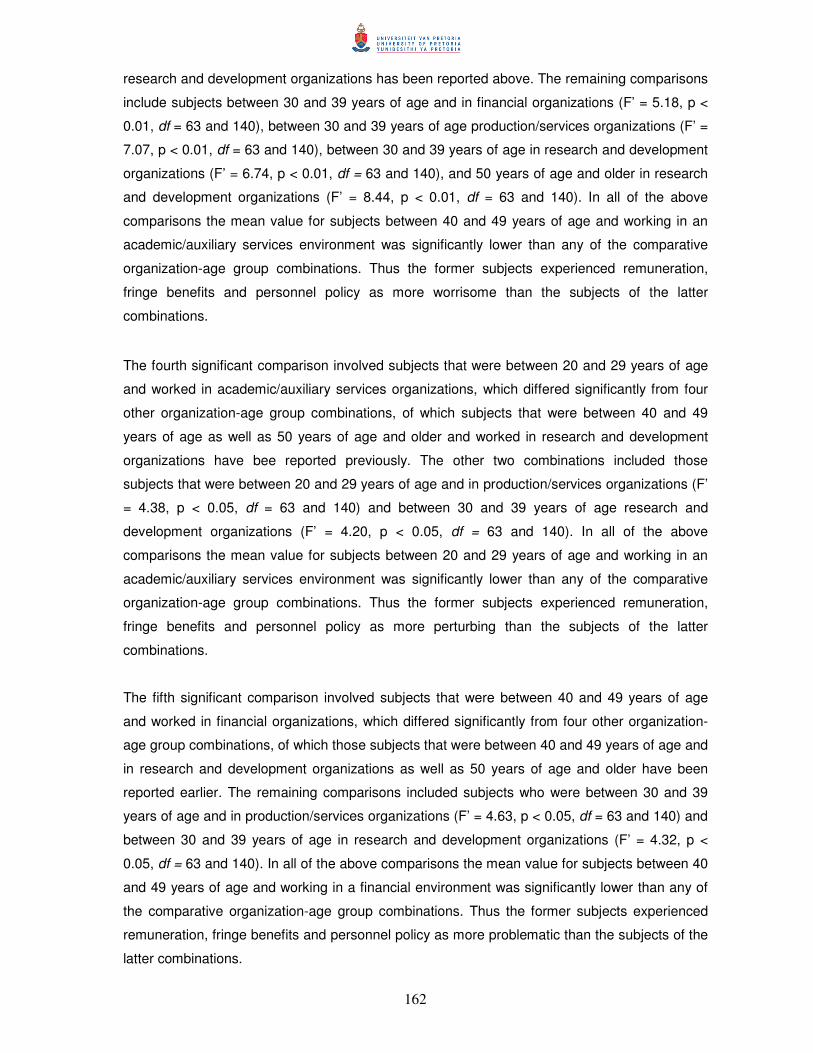
162
research and development organizations has been reported above. The remaining comparisons
include subjects between 30 and 39 years of age and in financial organizations (F’ = 5.18, p <
0.01, df = 63 and 140), between 30 and 39 years of age production/services organizations (F’ =
7.07, p < 0.01, df = 63 and 140), between 30 and 39 years of age in research and development
organizations (F’ = 6.74, p < 0.01, df = 63 and 140), and 50 years of age and older in research
and development organizations (F’ = 8.44, p < 0.01, df = 63 and 140). In all of the above
comparisons the mean value for subjects between 40 and 49 years of age and working in an
academic/auxiliary services environment was significantly lower than any of the comparative
organization-age group combinations. Thus the former subjects experienced remuneration,
fringe benefits and personnel policy as more worrisome than the subjects of the latter
combinations.
The fourth significant comparison involved subjects that were between 20 and 29 years of age
and worked in academic/auxiliary services organizations, which differed significantly from four
other organization-age group combinations, of which subjects that were between 40 and 49
years of age as well as 50 years of age and older and worked in research and development
organizations have bee reported previously. The other two combinations included those
subjects that were between 20 and 29 years of age and in production/services organizations (F’
= 4.38, p < 0.05, df = 63 and 140) and between 30 and 39 years of age research and
development organizations (F’ = 4.20, p < 0.05, df = 63 and 140). In all of the above
comparisons the mean value for subjects between 20 and 29 years of age and working in an
academic/auxiliary services environment was significantly lower than any of the comparative
organization-age group combinations. Thus the former subjects experienced remuneration,
fringe benefits and personnel policy as more perturbing than the subjects of the latter
combinations.
The fifth significant comparison involved subjects that were between 40 and 49 years of age
and worked in financial organizations, which differed significantly from four other organization-
age group combinations, of which those subjects that were between 40 and 49 years of age and
in research and development organizations as well as 50 years of age and older have been
reported earlier. The remaining comparisons included subjects who were between 30 and 39
years of age and in production/services organizations (F’ = 4.63, p < 0.05, df = 63 and 140) and
between 30 and 39 years of age in research and development organizations (F’ = 4.32, p <
0.05, df = 63 and 140). In all of the above comparisons the mean value for subjects between 40
and 49 years of age and working in a financial environment was significantly lower than any of
the comparative organization-age group combinations. Thus the former subjects experienced
remuneration, fringe benefits and personnel policy as more problematic than the subjects of the
latter combinations.
163
Table 9.31: Mean values for remuneration, fringe benefits and personnel policy by organization grouping and age group
Type of Organization Grouping
Financial Prod/Serv R&D Acad/Aux Services Age
Groups Mean N Mean N Mean N Mean N
20-29 27.75 4 28.75 16 - - 20.67 3
30-39 29.77 26 31.15 20 30.90 21 23.36 11
40-49 25.77 22 31.14 7 33.40 15 23.80 15
50+ 26.29 7 25.71 7 33.40 10 26.21 19
Finally a series of Scheffé tests were carried out where the five qualification groupings were
paired-off with the four age groups. Each of the qualification-age group pairs was then
compared to every other pair to determine if a significant difference between them did exist or
not. For all of the comparisons it was found that Fcrit at p < 0.05 was equal to 3.96 and p < 0.01
was equal to 4.41. The only significant comparison involved subjects that had a Diploma and
were between 30 and 39 years of age, which differed significantly from six other qualification -
age group combinations, namely with a Grade 12 or lower and between 30 and 39 years of age
(F’ = 4.56, p < 0.01, df = 63 and 140), with a Grade 12 or lower and between 40 and 49 years of
age (F’ = 6.76, p < 0.01, df = 63 and 140), with a Diploma and 50 years of age and older (F’ =
5.21, p < 0.01, df = 63 and 140), with an Honours degree or equivalent and between 20 and 29
years of age (F’ = 4.59, p < 0.01, df = 63 and 140), with an Honours degree or equivalent and
between 40 and 49 years of age (F’ = 5.18, p < 0.01, df = 63 and 140), and with a Masters or
Doctoral degree and 50 years of age and older (F’ = 5.32, p < 0.01, df = 63 and 140). In all of
the above comparisons the mean value for subjects with a Diploma and between 30 and 39
years of age was significantly higher than any of the comparative organization-age group
combinations. Thus the former subjects experienced remuneration, fringe benefits and
personnel policy as less problematic than the subjects of the latter combinations.
Table 9.32: Mean values for remuneration, fringe benefits and personnel policy by qualification grouping and
age group
Qualification Groupings
Grade 10 or lower Diplomas Bachelors
Degrees Honours Degrees
Masters or Doctoral Degrees
Age Groups
Mean N Mean N Mean N Mean N Mean N
20-29 29.17 6 29.50 4 31.00 5 22.67 3 27.00 6
30-39 27.67 21 33.77 13 30.63 8 28.69 13 28.91 23
40-49 26.11 18 30.00 8 34.50 4 25.78 9 28.15 20
50+ 28.00 8 26.00 10 29.17 6 25.39 8 30.36 11
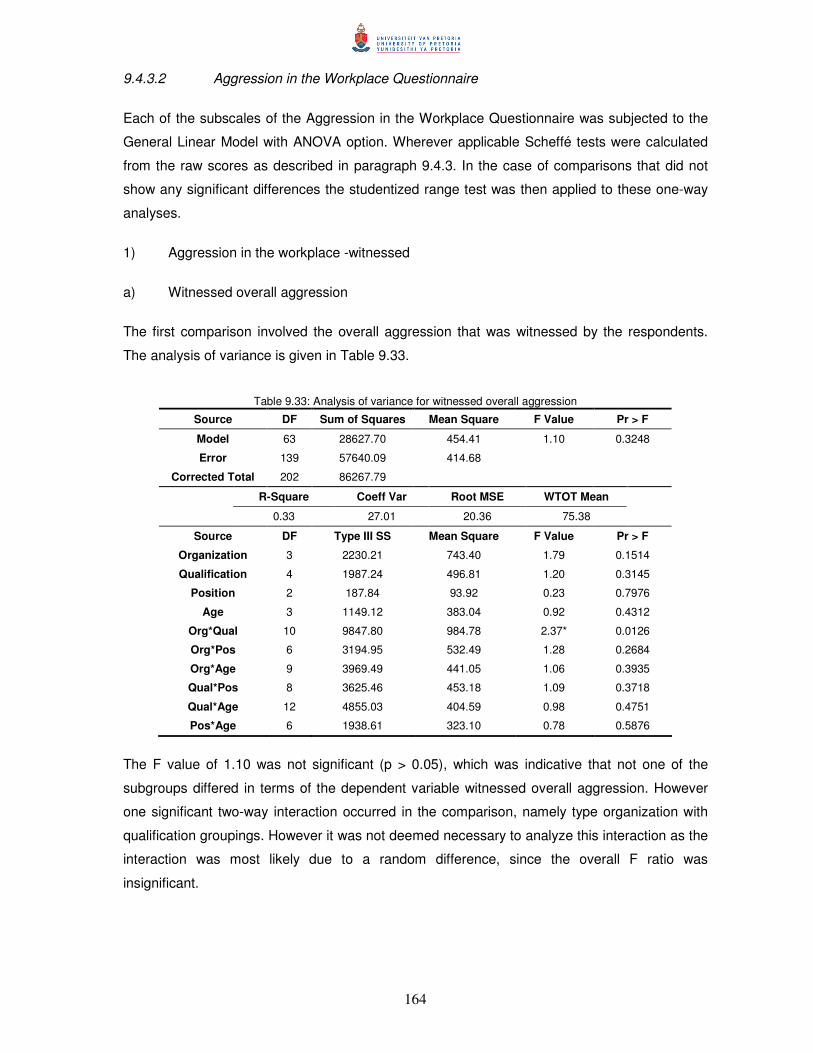
164
9.4.3.2 Aggression in the Workplace Questionnaire
Each of the subscales of the Aggression in the Workplace Questionnaire was subjected to the
General Linear Model with ANOVA option. Wherever applicable Scheffé tests were calculated
from the raw scores as described in paragraph 9.4.3. In the case of comparisons that did not
show any significant differences the studentized range test was then applied to these one-way
analyses.
1) Aggression in the workplace -witnessed
a) Witnessed overall aggression
The first comparison involved the overall aggression that was witnessed by the respondents.
The analysis of variance is given in Table 9.33.
Table 9.33: Analysis of variance for witnessed overall aggression
Source DF Sum of Squares Mean Square F Value Pr > F
Model 63 28627.70 454.41 1.10 0.3248
Error 139 57640.09 414.68
Corrected Total 202 86267.79
R-Square Coeff Var Root MSE WTOT Mean
0.33 27.01 20.36 75.38
Source DF Type III SS Mean Square F Value Pr > F
Organization 3 2230.21 743.40 1.79 0.1514
Qualification 4 1987.24 496.81 1.20 0.3145
Position 2 187.84 93.92 0.23 0.7976
Age 3 1149.12 383.04 0.92 0.4312
Org*Qual 10 9847.80 984.78 2.37* 0.0126
Org*Pos 6 3194.95 532.49 1.28 0.2684
Org*Age 9 3969.49 441.05 1.06 0.3935
Qual*Pos 8 3625.46 453.18 1.09 0.3718
Qual*Age 12 4855.03 404.59 0.98 0.4751
Pos*Age 6 1938.61 323.10 0.78 0.5876
The F value of 1.10 was not significant (p > 0.05), which was indicative that not one of the
subgroups differed in terms of the dependent variable witnessed overall aggression. However
one significant two-way interaction occurred in the comparison, namely type organization with
qualification groupings. However it was not deemed necessary to analyze this interaction as the
interaction was most likely due to a random difference, since the overall F ratio was
insignificant.

165
b) Witnessed expressions of hostility
The second comparison involved the expressions of hostility witnessed by the respondents. The
analysis of variance is given in Table 9.34. The F value of 0.86 once more was not significant (p
> 0.05), which was indicative that not one of the subgroups differed in terms of the dependent
variable witnessed expressions of hostility. There was no significant two-way interaction that
occurred in the comparison.
Table 9.34: Analysis of variance for witnessed expressions of hostility
Source DF Sum of Squares Mean Square F Value Pr > F
Model 63 7461.32 118.43 0.86 0.7512
Error 136 18783.96 138.12
Corrected Total 199 26245.28
R-Square Coeff Var Root MSE WEH Mean
0.28 31.71 11.75 37.06
Source DF Type III SS Mean Square F Value Pr > F
Organization 3 692.69 230.90 1.67 0.1760
Qualification 4 687.56 171.89 1.24 0.2951
Position 2 22.65 11.33 0.08 0.9213
Age 3 354.19 118.06 0.85 0.4663
Org*Qual 10 1532.47 153.25 1.11 0.3594
Org*Pos 6 445.61 74.27 0.54 0.7788
Org*Age 9 1258.83 139.87 1.01 0.4330
Qual*Pos 8 818.47 102.31 0.74 0.6554
Qual*Age 12 1423.89 118.66 0.86 0.5899
Pos*Age 6 728.29 121.38 0.88 0.5123
c) Witnessed obstructionism
The third comparison involved the obstructionism witnessed by the respondents. The analysis
of variance is given in Table 9.35. The F value of 1.11 was again not significant (p > 0.05),
which was indicative that not one of the subgroups differed in terms of the dependent variable
witnessed obstructionism. However one significant two-way interaction occurred in the
comparison, namely type of organization grouping with qualification groupings. It was not
deemed necessary to analyze this interaction as the interaction was most likely due to random
difference, since the overall F ratio was insignificant.
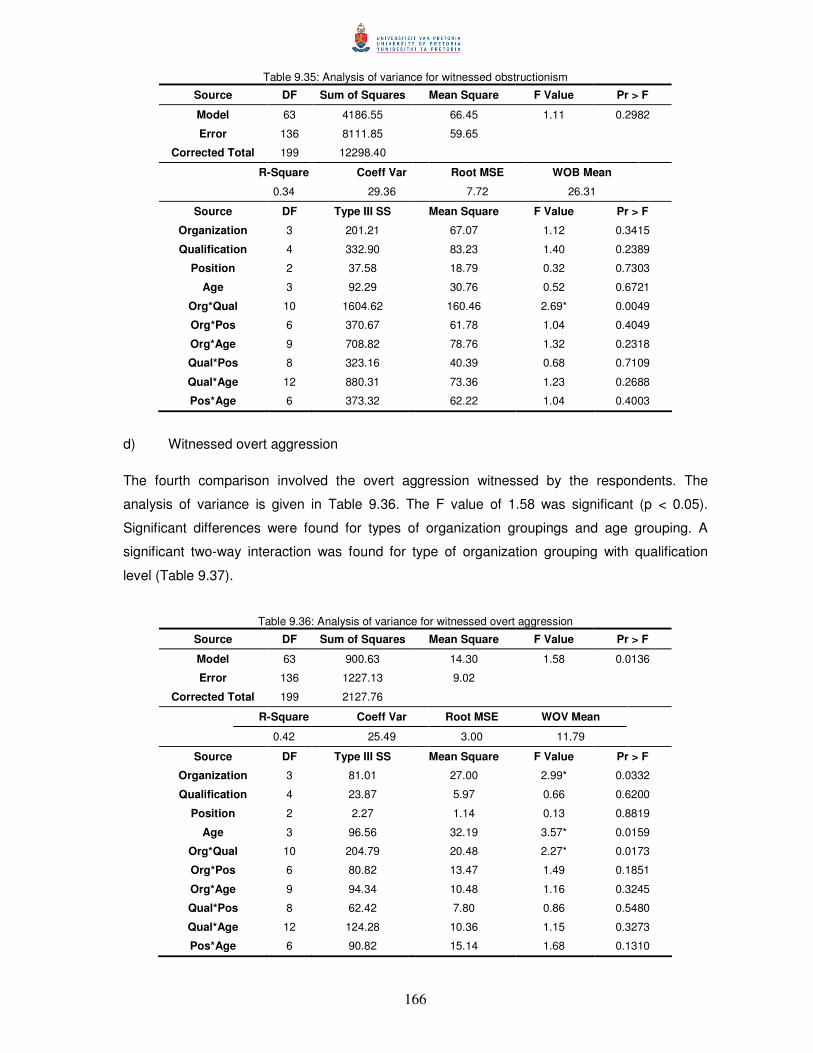
166
Table 9.35: Analysis of variance for witnessed obstructionism
Source DF Sum of Squares Mean Square F Value Pr > F
Model 63 4186.55 66.45 1.11 0.2982
Error 136 8111.85 59.65
Corrected Total 199 12298.40
R-Square Coeff Var Root MSE WOB Mean
0.34 29.36 7.72 26.31
Source DF Type III SS Mean Square F Value Pr > F
Organization 3 201.21 67.07 1.12 0.3415
Qualification 4 332.90 83.23 1.40 0.2389
Position 2 37.58 18.79 0.32 0.7303
Age 3 92.29 30.76 0.52 0.6721
Org*Qual 10 1604.62 160.46 2.69* 0.0049
Org*Pos 6 370.67 61.78 1.04 0.4049
Org*Age 9 708.82 78.76 1.32 0.2318
Qual*Pos 8 323.16 40.39 0.68 0.7109
Qual*Age 12 880.31 73.36 1.23 0.2688
Pos*Age 6 373.32 62.22 1.04 0.4003
d) Witnessed overt aggression The fourth comparison involved the overt aggression witnessed by the respondents. The
analysis of variance is given in Table 9.36. The F value of 1.58 was significant (p < 0.05).
Significant differences were found for types of organization groupings and age grouping. A
significant two-way interaction was found for type of organization grouping with qualification
level (Table 9.37).
Table 9.36: Analysis of variance for witnessed overt aggression
Source DF Sum of Squares Mean Square F Value Pr > F
Model 63 900.63 14.30 1.58 0.0136
Error 136 1227.13 9.02
Corrected Total 199 2127.76
R-Square Coeff Var Root MSE WOV Mean
0.42 25.49 3.00 11.79
Source DF Type III SS Mean Square F Value Pr > F
Organization 3 81.01 27.00 2.99* 0.0332
Qualification 4 23.87 5.97 0.66 0.6200
Position 2 2.27 1.14 0.13 0.8819
Age 3 96.56 32.19 3.57* 0.0159
Org*Qual 10 204.79 20.48 2.27* 0.0173
Org*Pos 6 80.82 13.47 1.49 0.1851
Org*Age 9 94.34 10.48 1.16 0.3245
Qual*Pos 8 62.42 7.80 0.86 0.5480
Qual*Age 12 124.28 10.36 1.15 0.3273
Pos*Age 6 90.82 15.14 1.68 0.1310
167
A series of one-way Scheffé tests were carried out where the four types of organization
groupings were-paired off two at a time. Three of the six comparisons showed significant
differences regarding the subjects’ witnessing of overt aggression. For the three comparisons it
was found that Fcrit at p < 0.05 was equal to 3.96 and p< 0.01 was equal to 4.41. Firstly
subjects who were working in financial organizations differed significantly from those working in
both production/services (F’ = 11.84, p <0.01, df = 63 and 140), and academic/auxiliary services
organizations (F’ = 4.09, p <0.05, df = 63 and 140). The mean score for subjects working in
financial organizations was significantly lower than for subjects working both in
production/services or academic/auxiliary services organizations suggesting that the former
witnessed lower levels of overt aggression than the latter. Secondly subjects working in
production/services organizations differed significantly form subjects working in research and
development organizations (F’ = 8.62, p <0.01, df = 63 and 140). Here the mean score for the
subjects found in production/services environments was significantly higher than that for
subjects found in research and development environments implying that the former witnessed
higher levels of overt aggression than the latter. No significant differences were found between
subjects working in financial organizations and research and development organizations,
between academic/auxiliary services organizations and both production/services and research
and development organizations.
A second series of Scheffé tests were carried out where the four age groupings were paired-off
two at a time. None of the six comparisons showed any significant difference regarding the
respondents’ witnessing of overt aggression when Fcrit at p < 0.05 was equal to 3.96 and p<
0.01 was equal to 4.41. The studentized range test in turn was also applied to this one-way
analyses and the results showed that the age group 20-29 years of age differed significantly
from the age group 30-39 (Q = 15.38 > Q =4.76 and � = 0.05), the age group 40-49 (Q = 9.28 >
Q = 4.76 and � = 0.05), and the age group 50 years and older (Q = 6.03 > Q = 4.76 and � =
0.05). Furthermore the age group 30-39 differs significantly from the age group 40-49 (Q = 6.10
> Q = 4.76 and � = 0.05) and the age group 50 years and older (Q = 9.35 > Q = 4.76 and � =
0.05). In these comparisons the mean score for subjects found in the age group 20-29 in the
first case was higher than for subjects found in the age groups 30-39, 40-49 and 50 years and
older implying that the youngest age group witnessed higher levels of overt aggression than the
other age groups. In the second case the mean score for subjects found in the age group 30-39
also was higher than for the age groups 40-49 and 50 years or older again implying that the
former witnessed higher levels of overt aggression than the latter age groups.
Another series of Scheffé tests were carried out where the four types of organization groupings
were paired-off with the five qualification groupings. Each of the organization-qualification pairs
was then compared to another pair to determine if a significant difference did exist or not. For all

168
of the comparisons it was found that Fcrit at p < 0.05 was equal to 3.96 and p < 0.01 was equal
to 4.41. Most significantly respondents that worked in production/services organizations and
had a Grade 12 or lower differed significantly from six other organization-qualification groupings,
namely form subjects who worked in financial organizations and had a Grade 12 or lower (F’ =
15.94, p < 0.01, df = 63 and 140), who worked in financial organizations and had a Diploma (F’
= 3.99, p < 0.05, df = 63 and 140), who worked in production/services organizations and had an
Honours or equivalent degree (F’ = 6.36, p < 0.01, df = 63 and 140), who worked in research
and development organizations and had a Bachelor degree (F’ = 4.88, p < 0.01, df = 63 and
140) or Masters or Doctoral degree (F’ = 12.96, p < 0.01, df = 63 and 140), and who were found
in academic/auxiliary services organizations and had an Honours or equivalent degree (F’ =
10.57, p < 0.01, df = 63 and 140). In all of the above comparisons the mean score for subjects
working in production/services organizations and who had a Grade 12 or lower was significantly
higher than for the other six organization-qualification combinations implying that the former
witnessed higher levels of overt aggression than the latter groupings.
The second significant comparison involved subjects that worked for academic/auxiliary
services organizations and who had a Diploma. They differed significantly from subjects from
two other organization-qualification groupings, namely from subjects who worked in financial
organizations and who had a Grade 12 or lower (F’ = 5.17, p < 0.01, df = 63 and 140) or in
production/services organizations who also had a Diploma (F’ = 3.99, p < 0.05, df = 63 and
140). In both of these comparisons the mean score for subjects working in academic/auxiliary
services organizations and who had a Diploma was significantly higher than for the other two
organization-qualification combinations meaning that the former witnessed higher levels of overt
aggression than the latter two groupings.
Finally the third significant comparison was for subjects who worked in academic/auxiliary
services organizations and who had a Masters or Doctoral degree differed significantly from one
other organization-qualification grouping, namely with subjects working for financial
organizations and who had a Grade 12 or lower (F’ = 4.75, p < 0.01, df = 63 and 140). In this
comparison the mean score for subjects who worked in academic/auxiliary services
organizations and who had a Masters or Doctoral degree was significantly higher than for those
working in financial organizations with a Grade 12 or lower, which meant that the former
experienced higher levels of overt aggression than the latter.
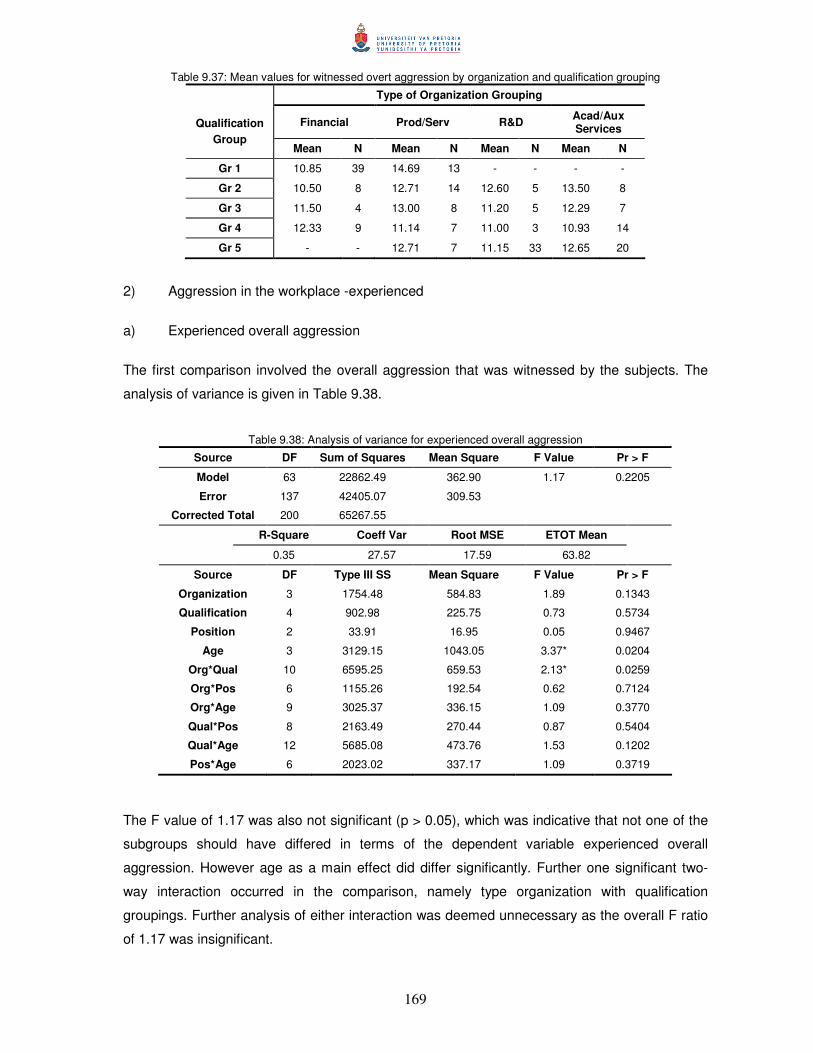
169
Table 9.37: Mean values for witnessed overt aggression by organization and qualification grouping
Type of Organization Grouping
Financial Prod/Serv R&D Acad/Aux Services Qualification
Group Mean N Mean N Mean N Mean N
Gr 1 10.85 39 14.69 13 - - - -
Gr 2 10.50 8 12.71 14 12.60 5 13.50 8
Gr 3 11.50 4 13.00 8 11.20 5 12.29 7
Gr 4 12.33 9 11.14 7 11.00 3 10.93 14
Gr 5 - - 12.71 7 11.15 33 12.65 20
2) Aggression in the workplace -experienced
a) Experienced overall aggression
The first comparison involved the overall aggression that was witnessed by the subjects. The
analysis of variance is given in Table 9.38.
Table 9.38: Analysis of variance for experienced overall aggression
Source DF Sum of Squares Mean Square F Value Pr > F
Model 63 22862.49 362.90 1.17 0.2205
Error 137 42405.07 309.53
Corrected Total 200 65267.55
R-Square Coeff Var Root MSE ETOT Mean
0.35 27.57 17.59 63.82
Source DF Type III SS Mean Square F Value Pr > F
Organization 3 1754.48 584.83 1.89 0.1343
Qualification 4 902.98 225.75 0.73 0.5734
Position 2 33.91 16.95 0.05 0.9467
Age 3 3129.15 1043.05 3.37* 0.0204
Org*Qual 10 6595.25 659.53 2.13* 0.0259
Org*Pos 6 1155.26 192.54 0.62 0.7124
Org*Age 9 3025.37 336.15 1.09 0.3770
Qual*Pos 8 2163.49 270.44 0.87 0.5404
Qual*Age 12 5685.08 473.76 1.53 0.1202
Pos*Age 6 2023.02 337.17 1.09 0.3719
The F value of 1.17 was also not significant (p > 0.05), which was indicative that not one of the
subgroups should have differed in terms of the dependent variable experienced overall
aggression. However age as a main effect did differ significantly. Further one significant two-
way interaction occurred in the comparison, namely type organization with qualification
groupings. Further analysis of either interaction was deemed unnecessary as the overall F ratio
of 1.17 was insignificant.
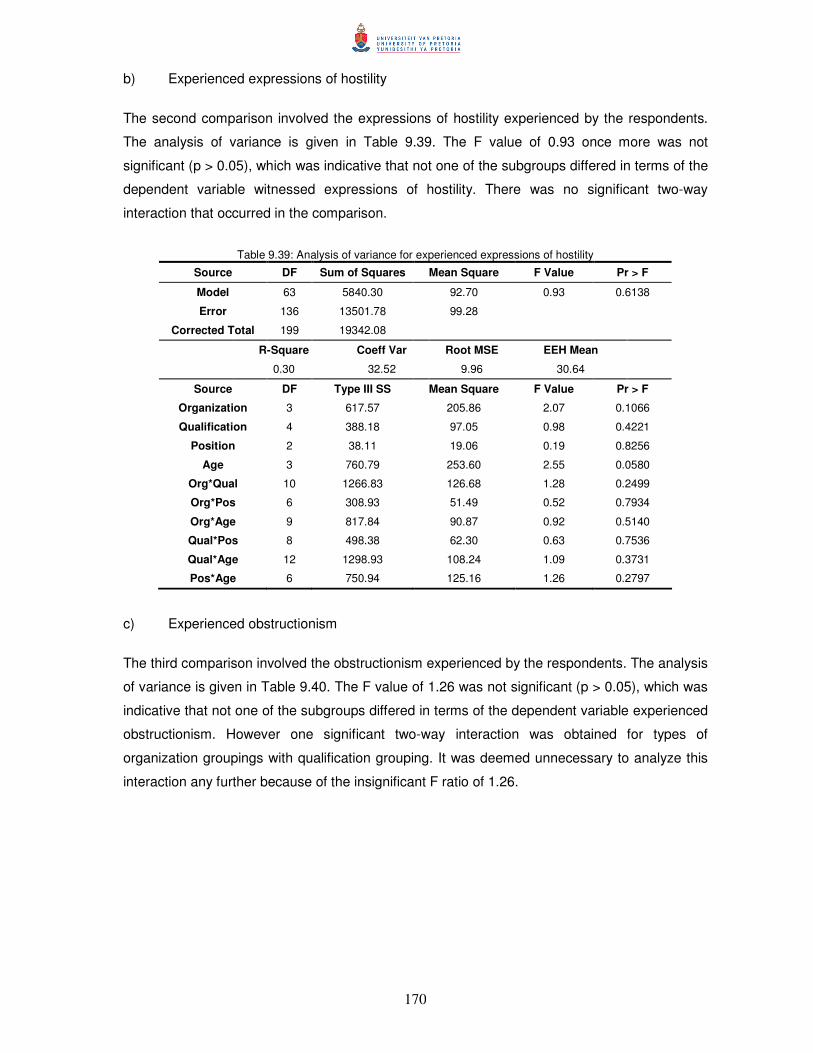
170
b) Experienced expressions of hostility
The second comparison involved the expressions of hostility experienced by the respondents.
The analysis of variance is given in Table 9.39. The F value of 0.93 once more was not
significant (p > 0.05), which was indicative that not one of the subgroups differed in terms of the
dependent variable witnessed expressions of hostility. There was no significant two-way
interaction that occurred in the comparison.
Table 9.39: Analysis of variance for experienced expressions of hostility
Source DF Sum of Squares Mean Square F Value Pr > F
Model 63 5840.30 92.70 0.93 0.6138
Error 136 13501.78 99.28
Corrected Total 199 19342.08
R-Square Coeff Var Root MSE EEH Mean
0.30 32.52 9.96 30.64
Source DF Type III SS Mean Square F Value Pr > F
Organization 3 617.57 205.86 2.07 0.1066
Qualification 4 388.18 97.05 0.98 0.4221
Position 2 38.11 19.06 0.19 0.8256
Age 3 760.79 253.60 2.55 0.0580
Org*Qual 10 1266.83 126.68 1.28 0.2499
Org*Pos 6 308.93 51.49 0.52 0.7934
Org*Age 9 817.84 90.87 0.92 0.5140
Qual*Pos 8 498.38 62.30 0.63 0.7536
Qual*Age 12 1298.93 108.24 1.09 0.3731
Pos*Age 6 750.94 125.16 1.26 0.2797
c) Experienced obstructionism
The third comparison involved the obstructionism experienced by the respondents. The analysis
of variance is given in Table 9.40. The F value of 1.26 was not significant (p > 0.05), which was
indicative that not one of the subgroups differed in terms of the dependent variable experienced
obstructionism. However one significant two-way interaction was obtained for types of
organization groupings with qualification grouping. It was deemed unnecessary to analyze this
interaction any further because of the insignificant F ratio of 1.26.
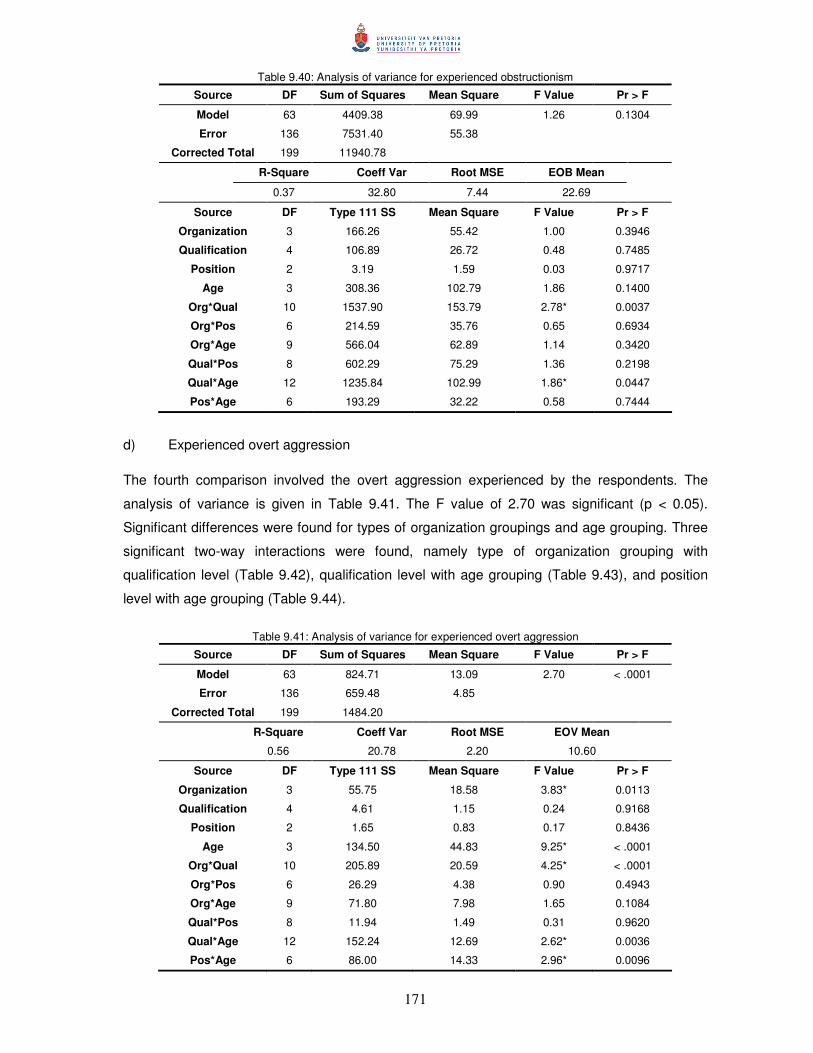
171
Table 9.40: Analysis of variance for experienced obstructionism
Source DF Sum of Squares Mean Square F Value Pr > F
Model 63 4409.38 69.99 1.26 0.1304
Error 136 7531.40 55.38
Corrected Total 199 11940.78
R-Square Coeff Var Root MSE EOB Mean
0.37 32.80 7.44 22.69
Source DF Type 111 SS Mean Square F Value Pr > F
Organization 3 166.26 55.42 1.00 0.3946
Qualification 4 106.89 26.72 0.48 0.7485
Position 2 3.19 1.59 0.03 0.9717
Age 3 308.36 102.79 1.86 0.1400
Org*Qual 10 1537.90 153.79 2.78* 0.0037
Org*Pos 6 214.59 35.76 0.65 0.6934
Org*Age 9 566.04 62.89 1.14 0.3420
Qual*Pos 8 602.29 75.29 1.36 0.2198
Qual*Age 12 1235.84 102.99 1.86* 0.0447
Pos*Age 6 193.29 32.22 0.58 0.7444
d) Experienced overt aggression
The fourth comparison involved the overt aggression experienced by the respondents. The
analysis of variance is given in Table 9.41. The F value of 2.70 was significant (p < 0.05).
Significant differences were found for types of organization groupings and age grouping. Three
significant two-way interactions were found, namely type of organization grouping with
qualification level (Table 9.42), qualification level with age grouping (Table 9.43), and position
level with age grouping (Table 9.44).
Table 9.41: Analysis of variance for experienced overt aggression
Source DF Sum of Squares Mean Square F Value Pr > F
Model 63 824.71 13.09 2.70 < .0001
Error 136 659.48 4.85
Corrected Total 199 1484.20
R-Square Coeff Var Root MSE EOV Mean
0.56 20.78 2.20 10.60
Source DF Type 111 SS Mean Square F Value Pr > F
Organization 3 55.75 18.58 3.83* 0.0113
Qualification 4 4.61 1.15 0.24 0.9168
Position 2 1.65 0.83 0.17 0.8436
Age 3 134.50 44.83 9.25* < .0001
Org*Qual 10 205.89 20.59 4.25* < .0001
Org*Pos 6 26.29 4.38 0.90 0.4943
Org*Age 9 71.80 7.98 1.65 0.1084
Qual*Pos 8 11.94 1.49 0.31 0.9620
Qual*Age 12 152.24 12.69 2.62* 0.0036
Pos*Age 6 86.00 14.33 2.96* 0.0096
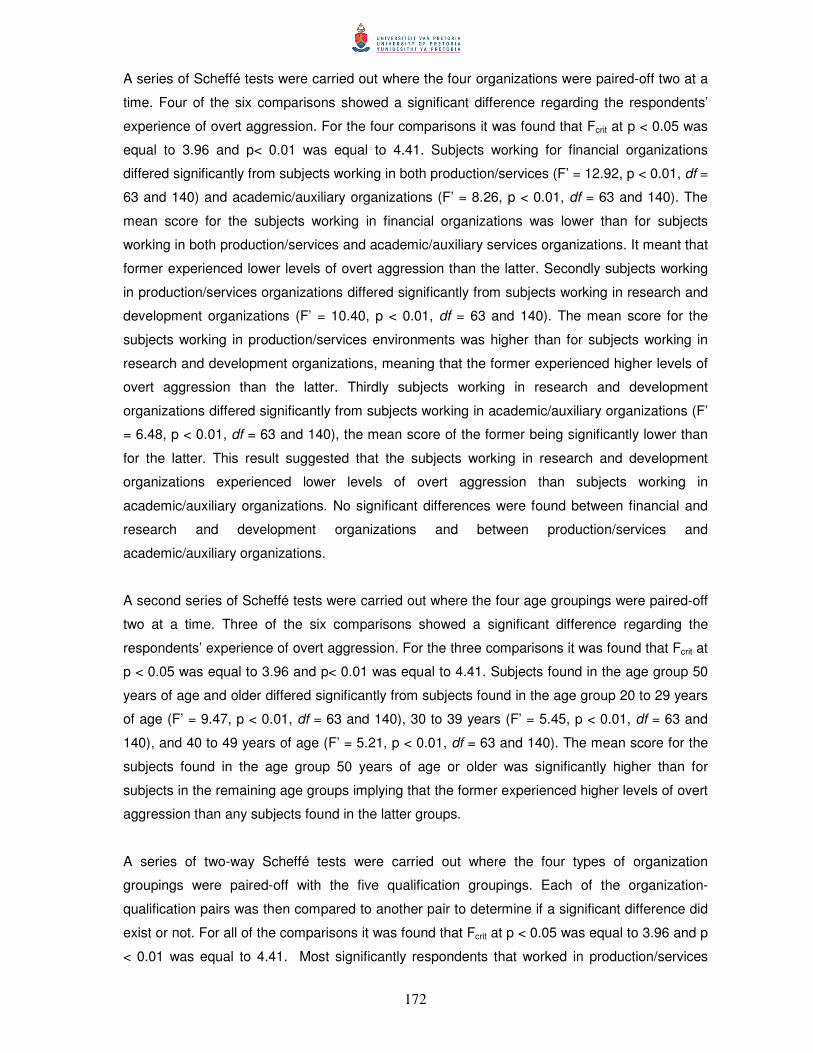
172
A series of Scheffé tests were carried out where the four organizations were paired-off two at a
time. Four of the six comparisons showed a significant difference regarding the respondents’
experience of overt aggression. For the four comparisons it was found that Fcrit at p < 0.05 was
equal to 3.96 and p< 0.01 was equal to 4.41. Subjects working for financial organizations
differed significantly from subjects working in both production/services (F’ = 12.92, p < 0.01, df =
63 and 140) and academic/auxiliary organizations (F’ = 8.26, p < 0.01, df = 63 and 140). The
mean score for the subjects working in financial organizations was lower than for subjects
working in both production/services and academic/auxiliary services organizations. It meant that
former experienced lower levels of overt aggression than the latter. Secondly subjects working
in production/services organizations differed significantly from subjects working in research and
development organizations (F’ = 10.40, p < 0.01, df = 63 and 140). The mean score for the
subjects working in production/services environments was higher than for subjects working in
research and development organizations, meaning that the former experienced higher levels of
overt aggression than the latter. Thirdly subjects working in research and development
organizations differed significantly from subjects working in academic/auxiliary organizations (F’
= 6.48, p < 0.01, df = 63 and 140), the mean score of the former being significantly lower than
for the latter. This result suggested that the subjects working in research and development
organizations experienced lower levels of overt aggression than subjects working in
academic/auxiliary organizations. No significant differences were found between financial and
research and development organizations and between production/services and
academic/auxiliary organizations.
A second series of Scheffé tests were carried out where the four age groupings were paired-off
two at a time. Three of the six comparisons showed a significant difference regarding the
respondents’ experience of overt aggression. For the three comparisons it was found that Fcrit at
p < 0.05 was equal to 3.96 and p< 0.01 was equal to 4.41. Subjects found in the age group 50
years of age and older differed significantly from subjects found in the age group 20 to 29 years
of age (F’ = 9.47, p < 0.01, df = 63 and 140), 30 to 39 years (F’ = 5.45, p < 0.01, df = 63 and
140), and 40 to 49 years of age (F’ = 5.21, p < 0.01, df = 63 and 140). The mean score for the
subjects found in the age group 50 years of age or older was significantly higher than for
subjects in the remaining age groups implying that the former experienced higher levels of overt
aggression than any subjects found in the latter groups.
A series of two-way Scheffé tests were carried out where the four types of organization
groupings were paired-off with the five qualification groupings. Each of the organization-
qualification pairs was then compared to another pair to determine if a significant difference did
exist or not. For all of the comparisons it was found that Fcrit at p < 0.05 was equal to 3.96 and p
< 0.01 was equal to 4.41. Most significantly respondents that worked in production/services

173
organizations and had a Grade 12 or lower differed significantly form fourteen other
organization-qualification groupings, namely from subjects who worked in financial services
organizations and had a Grade 12 or lower (F’ = 28.27, p < 0.01, df = 63 and 140), or Diploma
(F’ = 13.76, p < 0.01, df = 63 and 140), or a Bachelors degree (F’ = 11.61, p < 0.01, df = 63 and
140), or an Honours or equivalent degree (F’ = 5.36, p < 0.01, df = 63 and 140), who worked in
production/services organizations and had a Diploma (F’ = 12.84, p < 0.01, df = 63 and 140), or
an Honours or equivalent degree (F’ = 15.85, p < 0.01, df = 63 and 140), or a Masters or
Doctoral degree (F’ = 9.09, p < 0.01, df = 63 and 140), who worked in research and
development organizations and who had a Diploma (F’ = 8.31, p < 0.01, df = 63 and 140), or a
Bachelors degree (F’ = 7.34, p < 0.01, df = 63 and 140), or an Honours or equivalent degree (F’
= 6.30, p < 0.01, df = 63 and 140), or a Masters or Doctoral degree (F’ = 23.69, p < 0.01, df = 63
and 140), who a worked in academic/auxiliary services organizations and had a Bachelors
degree (F’ = 4.18, p < 0.05, df = 63 and 140), or an Honours or equivalent degree (F’ = 16.73, p
< 0.01, df = 63 and 140), or a Masters or Doctoral degree (F’ = 5.21, p < 0.01, df = 63 and 140).
In all of the above comparisons the mean score for subjects working in production/services
organizations was significantly higher than for the other organization-qualification combinations
implying that the former experienced higher levels of overt aggression than the latter groupings.
The second significant comparison involved subjects that worked for production/services
organizations and who had a Bachelors degree. They differed significantly from subjects from
nine other organization-qualification groupings, namely from subjects who worked in financial
organizations and had a Grade 12 or lower (F’ = 13.07, p < 0.01, df = 63 and 140), or with a
Diploma (F’ = 7.74, p < 0.01, df = 63 and 140), or with a Bachelors degree (F’ = 7.25, p < 0.01,
df = 63 and 140), production/services organizations with a Diploma (F’ = 5.95, p < 0.01, df = 63
and 140), or with and Honours or equivalent degree (F’ = 9.16, p < 0.01, df = 63 and 140), or
with a Masters or Doctoral degree (F’ = 5.16, p < 0.01, df = 63 and 140), who worked in
research and development organizations and had a Diploma (F’ = 4.56, p < 0.01, df = 63 and
140), or Masters or Doctoral degree (F’ = 10.78, p < 0.01, df = 63 and 140), and who worked in
academic/auxiliary services organizations and who had an Honours or equivalent degree (F’ =
8.29, p < 0.01, df = 63 and 140). In all of the nine comparisons the mean score for subjects
working in production/services organizations and who had a Grade 12 or lower was significantly
higher than for the other nine organization-qualification combinations meaning that the former
experienced higher levels of overt aggression than the latter groupings.
The third comparison that was found involved subjects that worked in academic/auxiliary
services organizations and who had a Masters or Doctoral degree. They differed significantly
form seven other organization-qualification groupings of which those working in
production/services with a Grade 12 or lower has been mentioned previously. The remaining
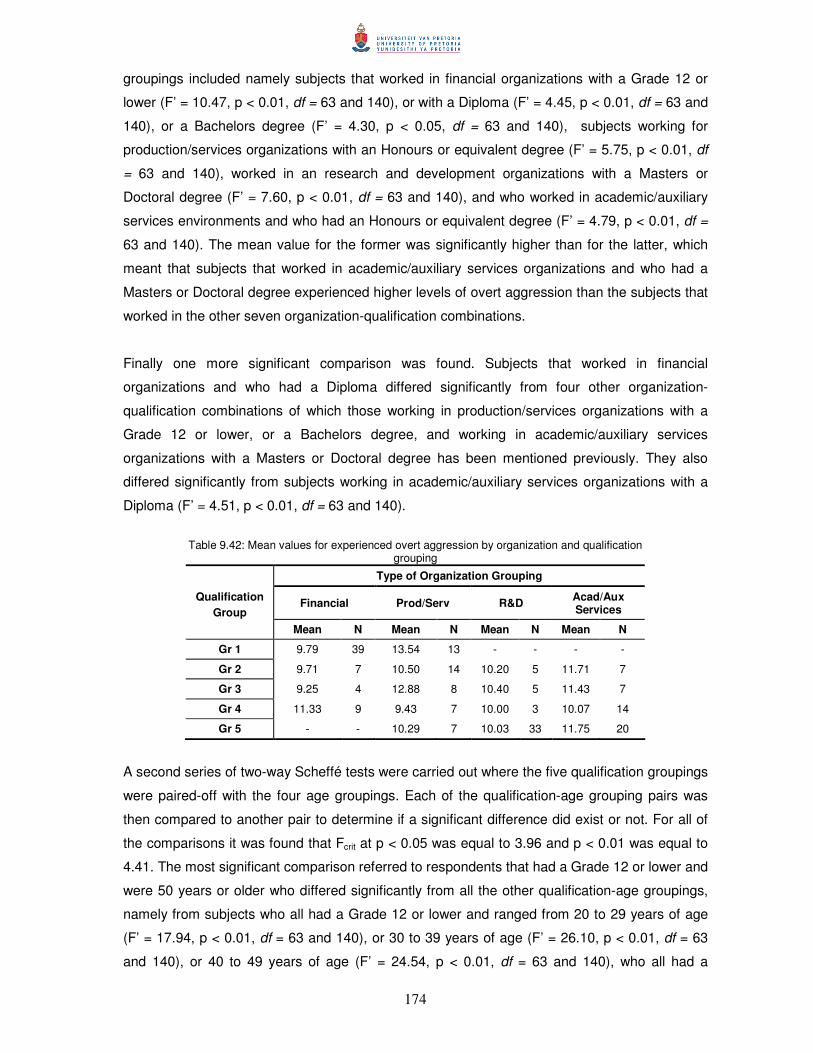
174
groupings included namely subjects that worked in financial organizations with a Grade 12 or
lower (F’ = 10.47, p < 0.01, df = 63 and 140), or with a Diploma (F’ = 4.45, p < 0.01, df = 63 and
140), or a Bachelors degree (F’ = 4.30, p < 0.05, df = 63 and 140), subjects working for
production/services organizations with an Honours or equivalent degree (F’ = 5.75, p < 0.01, df
= 63 and 140), worked in an research and development organizations with a Masters or
Doctoral degree (F’ = 7.60, p < 0.01, df = 63 and 140), and who worked in academic/auxiliary
services environments and who had an Honours or equivalent degree (F’ = 4.79, p < 0.01, df =
63 and 140). The mean value for the former was significantly higher than for the latter, which
meant that subjects that worked in academic/auxiliary services organizations and who had a
Masters or Doctoral degree experienced higher levels of overt aggression than the subjects that
worked in the other seven organization-qualification combinations.
Finally one more significant comparison was found. Subjects that worked in financial
organizations and who had a Diploma differed significantly from four other organization-
qualification combinations of which those working in production/services organizations with a
Grade 12 or lower, or a Bachelors degree, and working in academic/auxiliary services
organizations with a Masters or Doctoral degree has been mentioned previously. They also
differed significantly from subjects working in academic/auxiliary services organizations with a
Diploma (F’ = 4.51, p < 0.01, df = 63 and 140).
Table 9.42: Mean values for experienced overt aggression by organization and qualification
grouping
Type of Organization Grouping
Financial Prod/Serv R&D Acad/Aux Services
Qualification Group
Mean N Mean N Mean N Mean N
Gr 1 9.79 39 13.54 13 - - - -
Gr 2 9.71 7 10.50 14 10.20 5 11.71 7
Gr 3 9.25 4 12.88 8 10.40 5 11.43 7
Gr 4 11.33 9 9.43 7 10.00 3 10.07 14
Gr 5 - - 10.29 7 10.03 33 11.75 20
A second series of two-way Scheffé tests were carried out where the five qualification groupings
were paired-off with the four age groupings. Each of the qualification-age grouping pairs was
then compared to another pair to determine if a significant difference did exist or not. For all of
the comparisons it was found that Fcrit at p < 0.05 was equal to 3.96 and p < 0.01 was equal to
4.41. The most significant comparison referred to respondents that had a Grade 12 or lower and
were 50 years or older who differed significantly from all the other qualification-age groupings,
namely from subjects who all had a Grade 12 or lower and ranged from 20 to 29 years of age
(F’ = 17.94, p < 0.01, df = 63 and 140), or 30 to 39 years of age (F’ = 26.10, p < 0.01, df = 63
and 140), or 40 to 49 years of age (F’ = 24.54, p < 0.01, df = 63 and 140), who all had a
175
Diploma and who ranged from 20 to 29 years of age (F’ = 16.52, p < 0.01, df = 63 and 140), or
30 to 39 years of age (F’ = 19.42, p < 0.01, df = 63 and 140), or 40 to 49 years of age (F’ = 5.74,
p < 0.01, df = 63 and 140), or 50 years or older (F’ = 18.18, p < 0.01, df = 63 and 140), who all
had a Bachelors degree and who ranged from 20 to 29 years of age (F’ = 14.20, p < 0.01, df =
63 and 140), or 30 to 39 years of age (F’ = 5.74, p < 0.01, df = 63 and 140), or 40 to 49 years of
age (F’ = 13.70, p < 0.01, df = 63 and 140), or 50 years or older (F’ = 7.52, p < 0.01, df = 63 and
140), who all had an Honours or equivalent degree and who ranged from 20 to 29 years of age
(F’ = 13.24, p < 0.01, df = 63 and 140), or 30 to 39 years of age (F’ = 18.83, p < 0.01, df = 63
and 140), 40 to 49 years of age (F’ = 19.18, p < 0.01, df = 63 and 140), or 50 years or older (F’
= 13.00, p < 0.01, df = 63 and 140), and who had a Masters or Doctoral degree and who fell
between 20 to 29 years of age (F’ = 14.65, p < 0.01, df = 63 and 140), or 30 to 39 years of age
(F’ = 19.99, p < 0.01, df = 63 and 140), 40 to 49 years of age (F’ = 19.40, p < 0.01, df = 63 and
140), or 50 years or older (F’ = 13.14, p < 0.01, df = 63 and 140). In all of the above
comparisons the mean score for subjects with a Grade 12 or lower and who were 50 years or
older was significantly higher than for any of the other qualification-age group combinations
implying that the former experienced higher levels of overt aggression than the latter groupings.
The second significant comparison involved subjects who had a Diploma and ranged from 40 to
49 years of age. They differed significantly from subjects from six other qualification-age
groupings of which Grade 12 or lower and who were 50 years or older has been mentioned
previously. They also included subjects who also had a Grade 12 or lower and ranged from 20
to 29 years of age (F’ = 4.28, p < 0.05, df = 63 and 140), or from 30 to 39 years of age (F’ =
5.68, p < 0.01, df = 63 and 140), or from 40 to 49 years of age (F’ = 5.18, p < 0.01, df = 63 and
140), or who had Diploma and ranged from 20 to 29 years of age (F’ = 4.56, p < 0.01, df = 63
and 140), and who had an Honours or equivalent degree and ranged from 40 to 49 years of age
(F’ = 3.96, p < 0.05, df = 63 and 140). In all of the six comparisons the mean score for subjects
who had had a Diploma and ranged from 40 to 49 years of age was significantly higher than for
the six qualification-age group combinations meaning that the former experienced higher levels
of overt aggression than the latter groupings.
A third significant comparison was found involving subjects that had a Bachelors degree and
that were 30 to 39 years of age. They differed significantly form subjects from six other
qualification-age groupings, of which Grade 12 or lower and who were 50 years or older has
been mentioned previously. These included subjects who had a Grade 12 or lower and ranged
from 20 to 29 years of age (F’ = 4.27, p < 0.05, df = 63 and 140), or from 30 to 39 years of age
(F’ = 5.68, p < 0.01, df = 63 and 140), or from 40 to 49 years of age (F’ = 5.18, p < 0.01, df = 63
and 140), and from subjects who had a Diploma and who ranged from 20 to 29 years of age (F’
= 4.56, p < 0.01, df = 63 and 140), and who had an Honours or equivalent degree ranging from
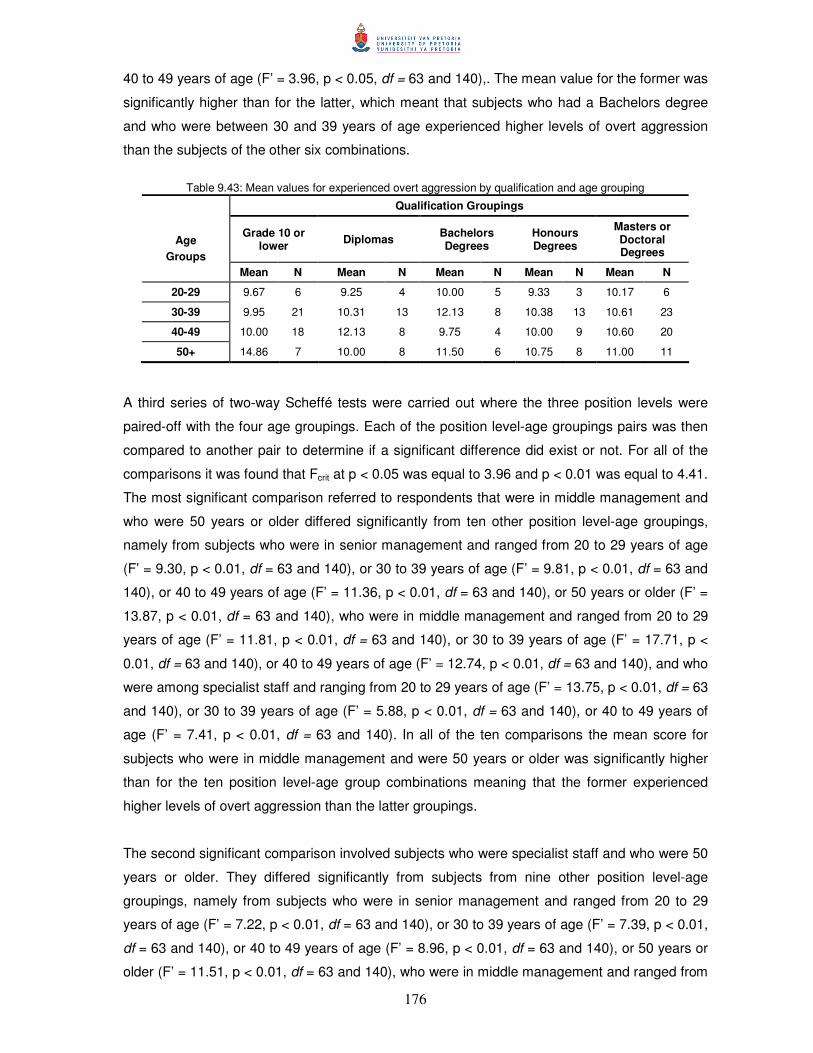
176
40 to 49 years of age (F’ = 3.96, p < 0.05, df = 63 and 140),. The mean value for the former was
significantly higher than for the latter, which meant that subjects who had a Bachelors degree
and who were between 30 and 39 years of age experienced higher levels of overt aggression
than the subjects of the other six combinations.
Table 9.43: Mean values for experienced overt aggression by qualification and age grouping
Qualification Groupings
Grade 10 or lower Diplomas Bachelors
Degrees Honours Degrees
Masters or Doctoral Degrees
Age Groups
Mean N Mean N Mean N Mean N Mean N
20-29 9.67 6 9.25 4 10.00 5 9.33 3 10.17 6
30-39 9.95 21 10.31 13 12.13 8 10.38 13 10.61 23
40-49 10.00 18 12.13 8 9.75 4 10.00 9 10.60 20
50+ 14.86 7 10.00 8 11.50 6 10.75 8 11.00 11
A third series of two-way Scheffé tests were carried out where the three position levels were
paired-off with the four age groupings. Each of the position level-age groupings pairs was then
compared to another pair to determine if a significant difference did exist or not. For all of the
comparisons it was found that Fcrit at p < 0.05 was equal to 3.96 and p < 0.01 was equal to 4.41.
The most significant comparison referred to respondents that were in middle management and
who were 50 years or older differed significantly from ten other position level-age groupings,
namely from subjects who were in senior management and ranged from 20 to 29 years of age
(F’ = 9.30, p < 0.01, df = 63 and 140), or 30 to 39 years of age (F’ = 9.81, p < 0.01, df = 63 and
140), or 40 to 49 years of age (F’ = 11.36, p < 0.01, df = 63 and 140), or 50 years or older (F’ =
13.87, p < 0.01, df = 63 and 140), who were in middle management and ranged from 20 to 29
years of age (F’ = 11.81, p < 0.01, df = 63 and 140), or 30 to 39 years of age (F’ = 17.71, p <
0.01, df = 63 and 140), or 40 to 49 years of age (F’ = 12.74, p < 0.01, df = 63 and 140), and who
were among specialist staff and ranging from 20 to 29 years of age (F’ = 13.75, p < 0.01, df = 63
and 140), or 30 to 39 years of age (F’ = 5.88, p < 0.01, df = 63 and 140), or 40 to 49 years of
age (F’ = 7.41, p < 0.01, df = 63 and 140). In all of the ten comparisons the mean score for
subjects who were in middle management and were 50 years or older was significantly higher
than for the ten position level-age group combinations meaning that the former experienced
higher levels of overt aggression than the latter groupings.
The second significant comparison involved subjects who were specialist staff and who were 50
years or older. They differed significantly from subjects from nine other position level-age
groupings, namely from subjects who were in senior management and ranged from 20 to 29
years of age (F’ = 7.22, p < 0.01, df = 63 and 140), or 30 to 39 years of age (F’ = 7.39, p < 0.01,
df = 63 and 140), or 40 to 49 years of age (F’ = 8.96, p < 0.01, df = 63 and 140), or 50 years or
older (F’ = 11.51, p < 0.01, df = 63 and 140), who were in middle management and ranged from
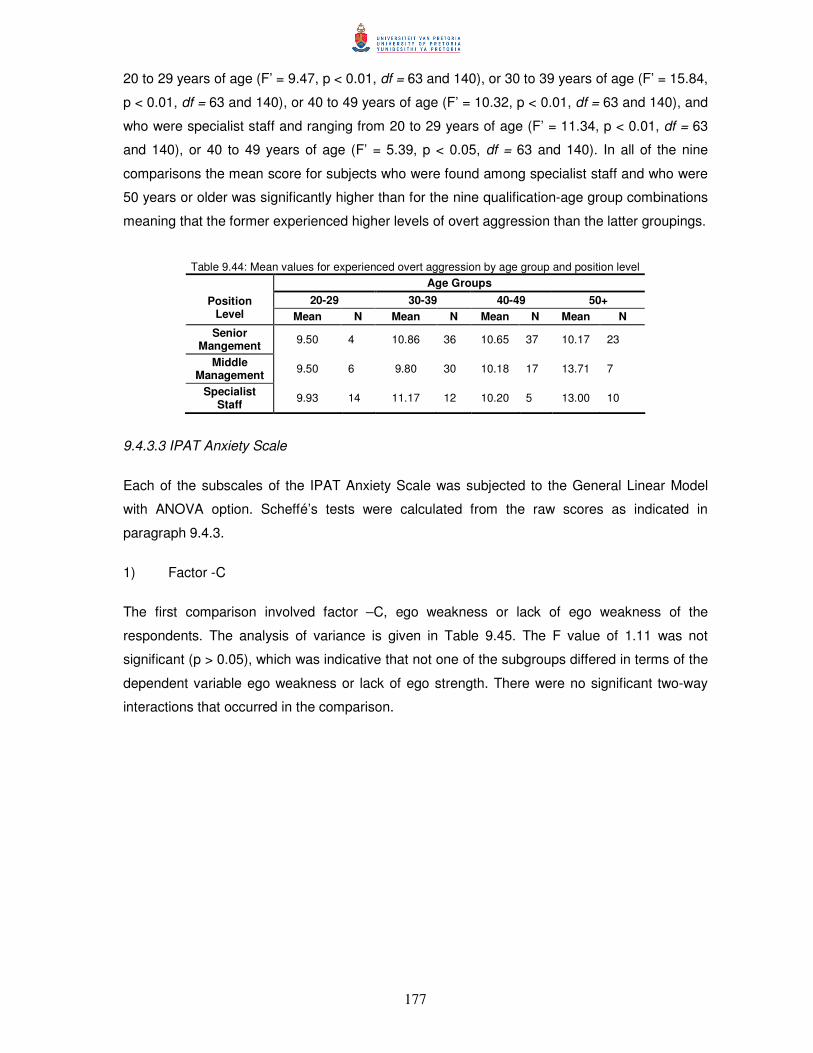
177
20 to 29 years of age (F’ = 9.47, p < 0.01, df = 63 and 140), or 30 to 39 years of age (F’ = 15.84,
p < 0.01, df = 63 and 140), or 40 to 49 years of age (F’ = 10.32, p < 0.01, df = 63 and 140), and
who were specialist staff and ranging from 20 to 29 years of age (F’ = 11.34, p < 0.01, df = 63
and 140), or 40 to 49 years of age (F’ = 5.39, p < 0.05, df = 63 and 140). In all of the nine
comparisons the mean score for subjects who were found among specialist staff and who were
50 years or older was significantly higher than for the nine qualification-age group combinations
meaning that the former experienced higher levels of overt aggression than the latter groupings.
Table 9.44: Mean values for experienced overt aggression by age group and position level Age Groups
20-29 30-39 40-49 50+ Position Level Mean N Mean N Mean N Mean N
Senior Mangement 9.50 4 10.86 36 10.65 37 10.17 23
Middle Management 9.50 6 9.80 30 10.18 17 13.71 7
Specialist Staff 9.93 14 11.17 12 10.20 5 13.00 10
9.4.3.3 IPAT Anxiety Scale
Each of the subscales of the IPAT Anxiety Scale was subjected to the General Linear Model
with ANOVA option. Scheffé’s tests were calculated from the raw scores as indicated in
paragraph 9.4.3.
1) Factor -C
The first comparison involved factor –C, ego weakness or lack of ego weakness of the
respondents. The analysis of variance is given in Table 9.45. The F value of 1.11 was not
significant (p > 0.05), which was indicative that not one of the subgroups differed in terms of the
dependent variable ego weakness or lack of ego strength. There were no significant two-way
interactions that occurred in the comparison.
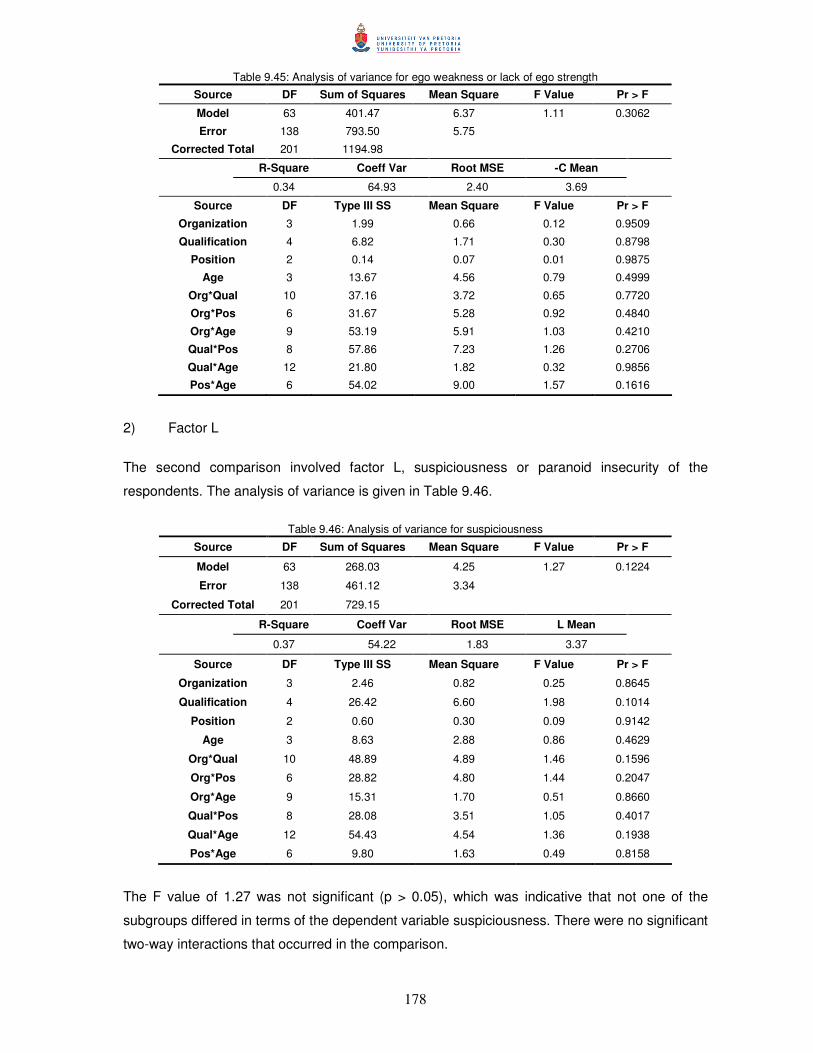
178
Table 9.45: Analysis of variance for ego weakness or lack of ego strength Source DF Sum of Squares Mean Square F Value Pr > F
Model 63 401.47 6.37 1.11 0.3062
Error 138 793.50 5.75
Corrected Total 201 1194.98
R-Square Coeff Var Root MSE -C Mean
0.34 64.93 2.40 3.69
Source DF Type III SS Mean Square F Value Pr > F
Organization 3 1.99 0.66 0.12 0.9509
Qualification 4 6.82 1.71 0.30 0.8798
Position 2 0.14 0.07 0.01 0.9875
Age 3 13.67 4.56 0.79 0.4999
Org*Qual 10 37.16 3.72 0.65 0.7720
Org*Pos 6 31.67 5.28 0.92 0.4840
Org*Age 9 53.19 5.91 1.03 0.4210
Qual*Pos 8 57.86 7.23 1.26 0.2706
Qual*Age 12 21.80 1.82 0.32 0.9856
Pos*Age 6 54.02 9.00 1.57 0.1616
2) Factor L
The second comparison involved factor L, suspiciousness or paranoid insecurity of the
respondents. The analysis of variance is given in Table 9.46.
Table 9.46: Analysis of variance for suspiciousness
Source DF Sum of Squares Mean Square F Value Pr > F
Model 63 268.03 4.25 1.27 0.1224
Error 138 461.12 3.34
Corrected Total 201 729.15
R-Square Coeff Var Root MSE L Mean
0.37 54.22 1.83 3.37
Source DF Type III SS Mean Square F Value Pr > F
Organization 3 2.46 0.82 0.25 0.8645
Qualification 4 26.42 6.60 1.98 0.1014
Position 2 0.60 0.30 0.09 0.9142
Age 3 8.63 2.88 0.86 0.4629
Org*Qual 10 48.89 4.89 1.46 0.1596
Org*Pos 6 28.82 4.80 1.44 0.2047
Org*Age 9 15.31 1.70 0.51 0.8660
Qual*Pos 8 28.08 3.51 1.05 0.4017
Qual*Age 12 54.43 4.54 1.36 0.1938
Pos*Age 6 9.80 1.63 0.49 0.8158
The F value of 1.27 was not significant (p > 0.05), which was indicative that not one of the
subgroups differed in terms of the dependent variable suspiciousness. There were no significant
two-way interactions that occurred in the comparison.
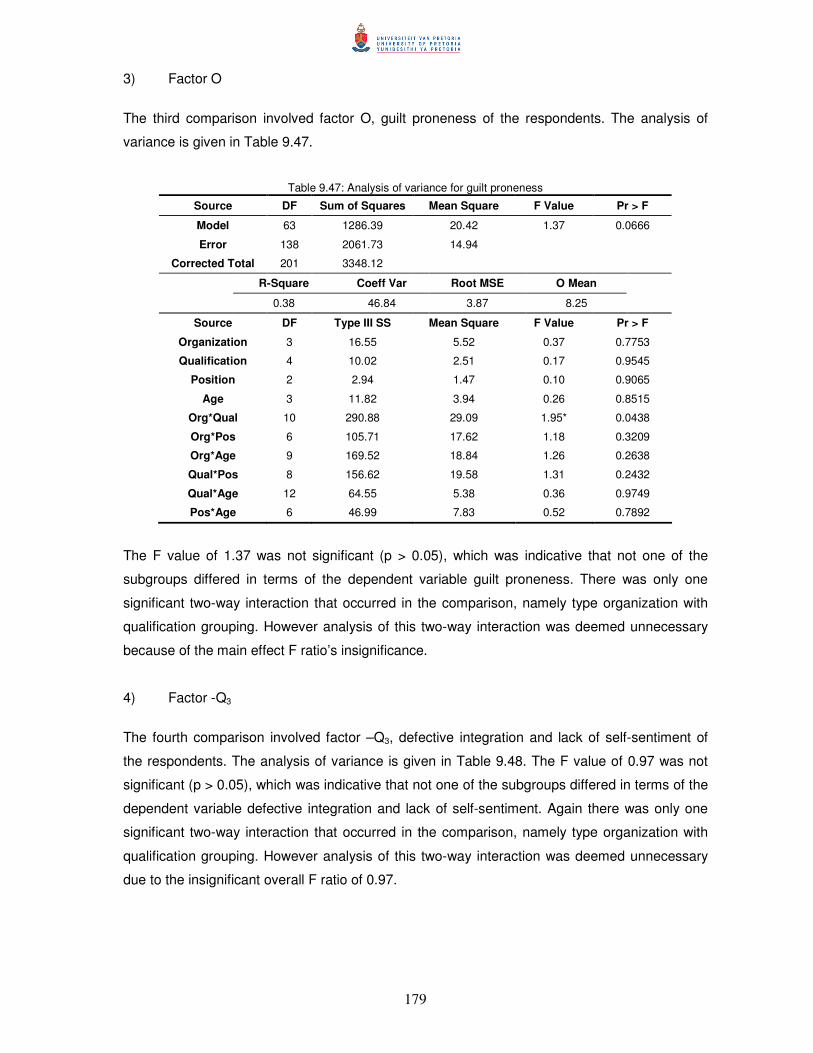
179
3) Factor O
The third comparison involved factor O, guilt proneness of the respondents. The analysis of
variance is given in Table 9.47.
Table 9.47: Analysis of variance for guilt proneness
Source DF Sum of Squares Mean Square F Value Pr > F
Model 63 1286.39 20.42 1.37 0.0666
Error 138 2061.73 14.94
Corrected Total 201 3348.12
R-Square Coeff Var Root MSE O Mean
0.38 46.84 3.87 8.25
Source DF Type III SS Mean Square F Value Pr > F
Organization 3 16.55 5.52 0.37 0.7753
Qualification 4 10.02 2.51 0.17 0.9545
Position 2 2.94 1.47 0.10 0.9065
Age 3 11.82 3.94 0.26 0.8515
Org*Qual 10 290.88 29.09 1.95* 0.0438
Org*Pos 6 105.71 17.62 1.18 0.3209
Org*Age 9 169.52 18.84 1.26 0.2638
Qual*Pos 8 156.62 19.58 1.31 0.2432
Qual*Age 12 64.55 5.38 0.36 0.9749
Pos*Age 6 46.99 7.83 0.52 0.7892
The F value of 1.37 was not significant (p > 0.05), which was indicative that not one of the
subgroups differed in terms of the dependent variable guilt proneness. There was only one
significant two-way interaction that occurred in the comparison, namely type organization with
qualification grouping. However analysis of this two-way interaction was deemed unnecessary
because of the main effect F ratio’s insignificance.
4) Factor -Q3
The fourth comparison involved factor –Q3, defective integration and lack of self-sentiment of
the respondents. The analysis of variance is given in Table 9.48. The F value of 0.97 was not
significant (p > 0.05), which was indicative that not one of the subgroups differed in terms of the
dependent variable defective integration and lack of self-sentiment. Again there was only one
significant two-way interaction that occurred in the comparison, namely type organization with
qualification grouping. However analysis of this two-way interaction was deemed unnecessary
due to the insignificant overall F ratio of 0.97.
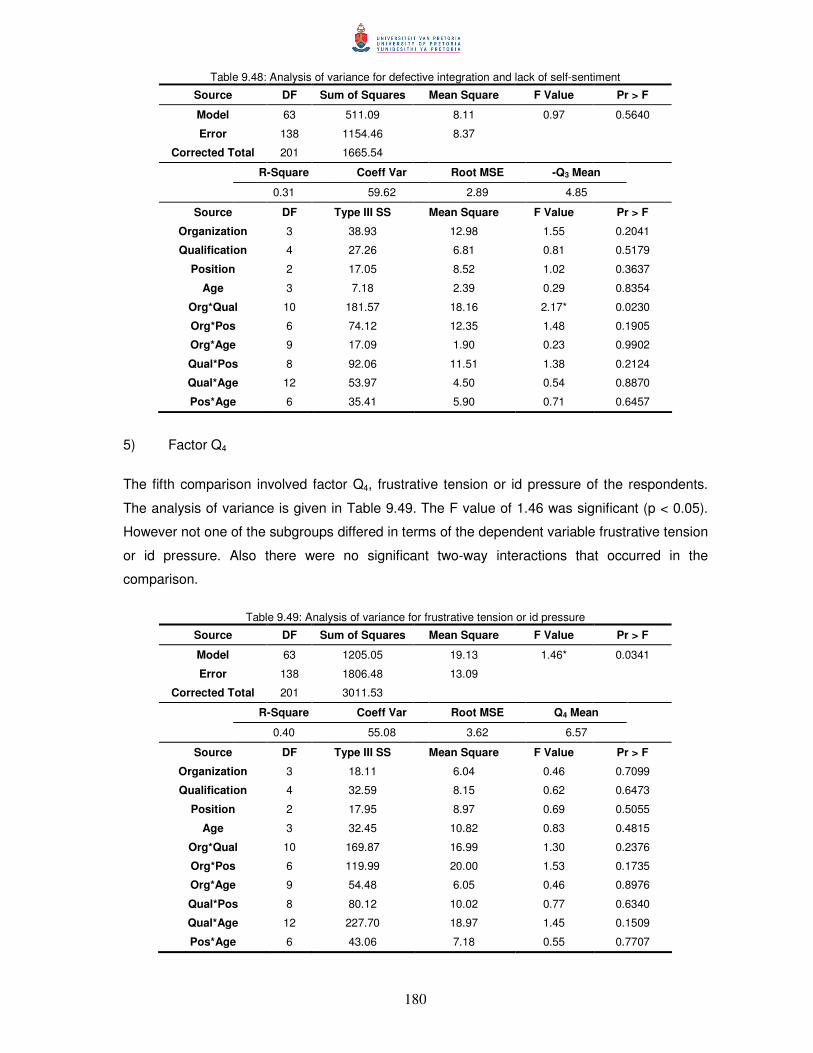
180
Table 9.48: Analysis of variance for defective integration and lack of self-sentiment
Source DF Sum of Squares Mean Square F Value Pr > F
Model 63 511.09 8.11 0.97 0.5640
Error 138 1154.46 8.37
Corrected Total 201 1665.54
R-Square Coeff Var Root MSE -Q3 Mean
0.31 59.62 2.89 4.85
Source DF Type III SS Mean Square F Value Pr > F
Organization 3 38.93 12.98 1.55 0.2041
Qualification 4 27.26 6.81 0.81 0.5179
Position 2 17.05 8.52 1.02 0.3637
Age 3 7.18 2.39 0.29 0.8354
Org*Qual 10 181.57 18.16 2.17* 0.0230
Org*Pos 6 74.12 12.35 1.48 0.1905
Org*Age 9 17.09 1.90 0.23 0.9902
Qual*Pos 8 92.06 11.51 1.38 0.2124
Qual*Age 12 53.97 4.50 0.54 0.8870
Pos*Age 6 35.41 5.90 0.71 0.6457
5) Factor Q4
The fifth comparison involved factor Q4, frustrative tension or id pressure of the respondents.
The analysis of variance is given in Table 9.49. The F value of 1.46 was significant (p < 0.05).
However not one of the subgroups differed in terms of the dependent variable frustrative tension
or id pressure. Also there were no significant two-way interactions that occurred in the
comparison.
Table 9.49: Analysis of variance for frustrative tension or id pressure
Source DF Sum of Squares Mean Square F Value Pr > F
Model 63 1205.05 19.13 1.46* 0.0341
Error 138 1806.48 13.09
Corrected Total 201 3011.53
R-Square Coeff Var Root MSE Q4 Mean
0.40 55.08 3.62 6.57
Source DF Type III SS Mean Square F Value Pr > F
Organization 3 18.11 6.04 0.46 0.7099
Qualification 4 32.59 8.15 0.62 0.6473
Position 2 17.95 8.97 0.69 0.5055
Age 3 32.45 10.82 0.83 0.4815
Org*Qual 10 169.87 16.99 1.30 0.2376
Org*Pos 6 119.99 20.00 1.53 0.1735
Org*Age 9 54.48 6.05 0.46 0.8976
Qual*Pos 8 80.12 10.02 0.77 0.6340
Qual*Age 12 227.70 18.97 1.45 0.1509
Pos*Age 6 43.06 7.18 0.55 0.7707

181
6) Score A
The sixth comparison involved Score A, covert anxiety of the respondents. The analysis of
variance is given in Table 9.50. The F value of 1.08 was not significant (p > 0.05), which was
indicative that not one of the subgroups differed in terms of the dependent variable covert
anxiety. Furthermore not one significant two-way interaction occurred in the comparison.
Table 9.50: Analysis of variance for covert anxiety
Source DF Sum of Squares Mean Square F Value Pr > F
Model 63 2586.80 41.06 1.08 0.3444
Error 138 5229.60 37.90
Corrected Total 201 7816.40
R-Square Coeff Var Root MSE SCOREA Mean
0.33 44.25 6.16 13.91
Source DF Type III SS Mean Square F Value Pr > F
Organization 3 27.14 9.05 0.24 0.8692
Qualification 4 39.27 9.82 0.26 0.9037
Position 2 0.66 0.33 0.01 0.9913
Age 3 33.04 11.01 0.29 0.8321
Org*Qual 10 495.52 49.55 1.31 0.2322
Org*Pos 6 145.47 24.24 0.64 0.6982
Org*Age 9 107.97 12.00 0.32 0.9685
Qual*Pos 8 249.04 31.13 0.82 0.5850
Qual*Age 12 391.88 32.66 0.86 0.5872
Pos*Age 6 41.67 6.94 0.18 0.9811
7) Score B
The seventh comparison involved Score B, overt anxiety of the respondents. The analysis of
variance is given in Table 9.51. The F value of 1.12 was not significant (p > 0.05), which was
indicative that not one of the subgroups differed in terms of the dependent variable overt
anxiety. Again not one significant two-way interaction occurred in the comparison.
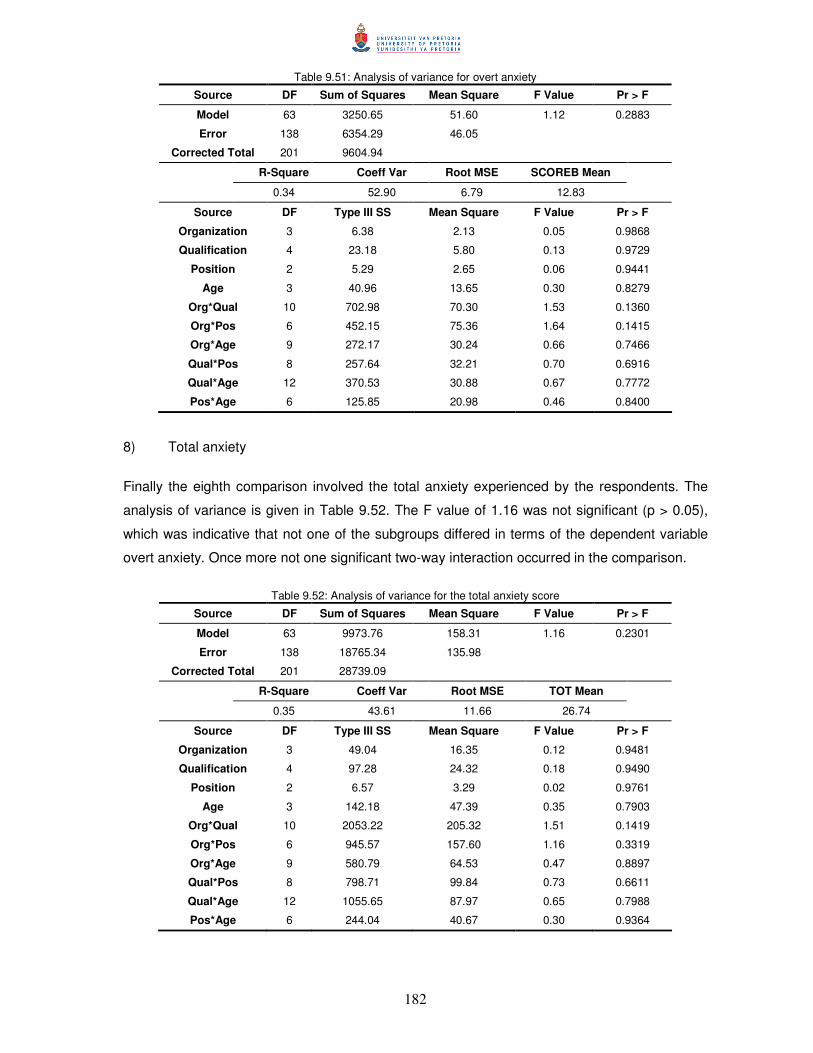
182
Table 9.51: Analysis of variance for overt anxiety
Source DF Sum of Squares Mean Square F Value Pr > F
Model 63 3250.65 51.60 1.12 0.2883
Error 138 6354.29 46.05
Corrected Total 201 9604.94
R-Square Coeff Var Root MSE SCOREB Mean
0.34 52.90 6.79 12.83
Source DF Type III SS Mean Square F Value Pr > F
Organization 3 6.38 2.13 0.05 0.9868
Qualification 4 23.18 5.80 0.13 0.9729
Position 2 5.29 2.65 0.06 0.9441
Age 3 40.96 13.65 0.30 0.8279
Org*Qual 10 702.98 70.30 1.53 0.1360
Org*Pos 6 452.15 75.36 1.64 0.1415
Org*Age 9 272.17 30.24 0.66 0.7466
Qual*Pos 8 257.64 32.21 0.70 0.6916
Qual*Age 12 370.53 30.88 0.67 0.7772
Pos*Age 6 125.85 20.98 0.46 0.8400
8) Total anxiety
Finally the eighth comparison involved the total anxiety experienced by the respondents. The
analysis of variance is given in Table 9.52. The F value of 1.16 was not significant (p > 0.05),
which was indicative that not one of the subgroups differed in terms of the dependent variable
overt anxiety. Once more not one significant two-way interaction occurred in the comparison.
Table 9.52: Analysis of variance for the total anxiety score
Source DF Sum of Squares Mean Square F Value Pr > F
Model 63 9973.76 158.31 1.16 0.2301
Error 138 18765.34 135.98
Corrected Total 201 28739.09
R-Square Coeff Var Root MSE TOT Mean
0.35 43.61 11.66 26.74
Source DF Type III SS Mean Square F Value Pr > F
Organization 3 49.04 16.35 0.12 0.9481
Qualification 4 97.28 24.32 0.18 0.9490
Position 2 6.57 3.29 0.02 0.9761
Age 3 142.18 47.39 0.35 0.7903
Org*Qual 10 2053.22 205.32 1.51 0.1419
Org*Pos 6 945.57 157.60 1.16 0.3319
Org*Age 9 580.79 64.53 0.47 0.8897
Qual*Pos 8 798.71 99.84 0.73 0.6611
Qual*Age 12 1055.65 87.97 0.65 0.7988
Pos*Age 6 244.04 40.67 0.30 0.9364
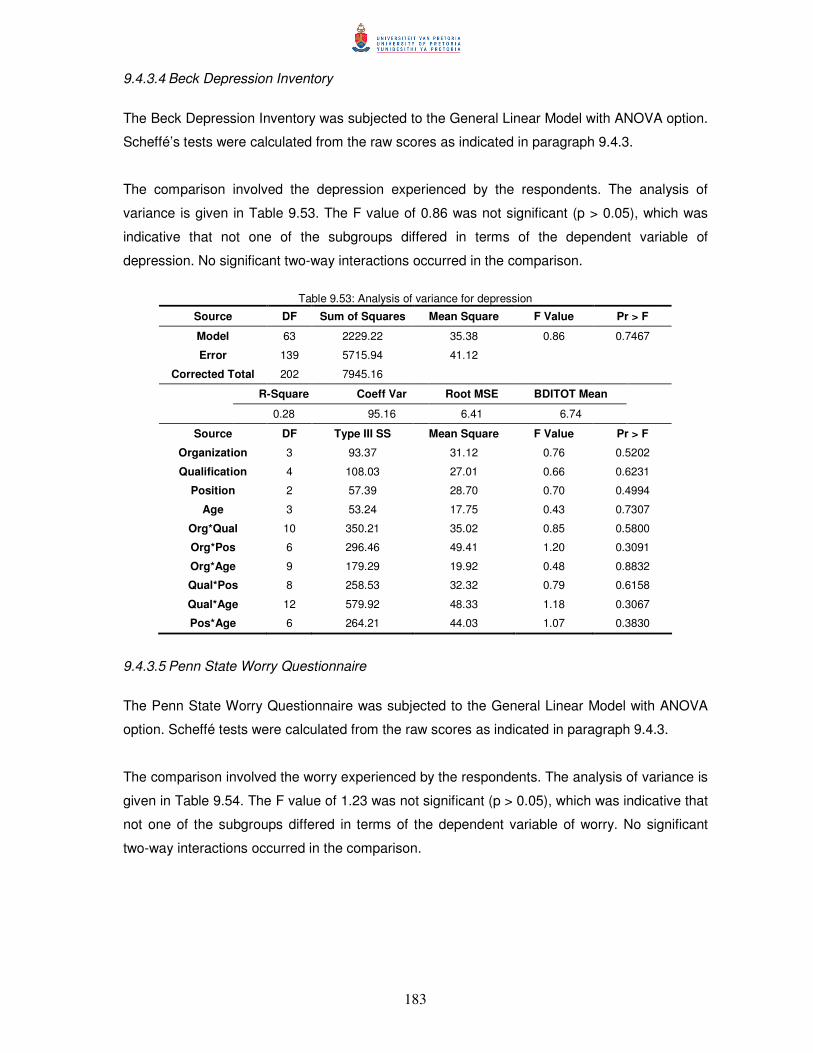
183
9.4.3.4 Beck Depression Inventory
The Beck Depression Inventory was subjected to the General Linear Model with ANOVA option.
Scheffé’s tests were calculated from the raw scores as indicated in paragraph 9.4.3.
The comparison involved the depression experienced by the respondents. The analysis of
variance is given in Table 9.53. The F value of 0.86 was not significant (p > 0.05), which was
indicative that not one of the subgroups differed in terms of the dependent variable of
depression. No significant two-way interactions occurred in the comparison.
Table 9.53: Analysis of variance for depression
Source DF Sum of Squares Mean Square F Value Pr > F
Model 63 2229.22 35.38 0.86 0.7467
Error 139 5715.94 41.12
Corrected Total 202 7945.16
R-Square Coeff Var Root MSE BDITOT Mean
0.28 95.16 6.41 6.74
Source DF Type III SS Mean Square F Value Pr > F
Organization 3 93.37 31.12 0.76 0.5202
Qualification 4 108.03 27.01 0.66 0.6231
Position 2 57.39 28.70 0.70 0.4994
Age 3 53.24 17.75 0.43 0.7307
Org*Qual 10 350.21 35.02 0.85 0.5800
Org*Pos 6 296.46 49.41 1.20 0.3091
Org*Age 9 179.29 19.92 0.48 0.8832
Qual*Pos 8 258.53 32.32 0.79 0.6158
Qual*Age 12 579.92 48.33 1.18 0.3067
Pos*Age 6 264.21 44.03 1.07 0.3830
9.4.3.5 Penn State Worry Questionnaire
The Penn State Worry Questionnaire was subjected to the General Linear Model with ANOVA
option. Scheffé tests were calculated from the raw scores as indicated in paragraph 9.4.3.
The comparison involved the worry experienced by the respondents. The analysis of variance is
given in Table 9.54. The F value of 1.23 was not significant (p > 0.05), which was indicative that
not one of the subgroups differed in terms of the dependent variable of worry. No significant
two-way interactions occurred in the comparison.
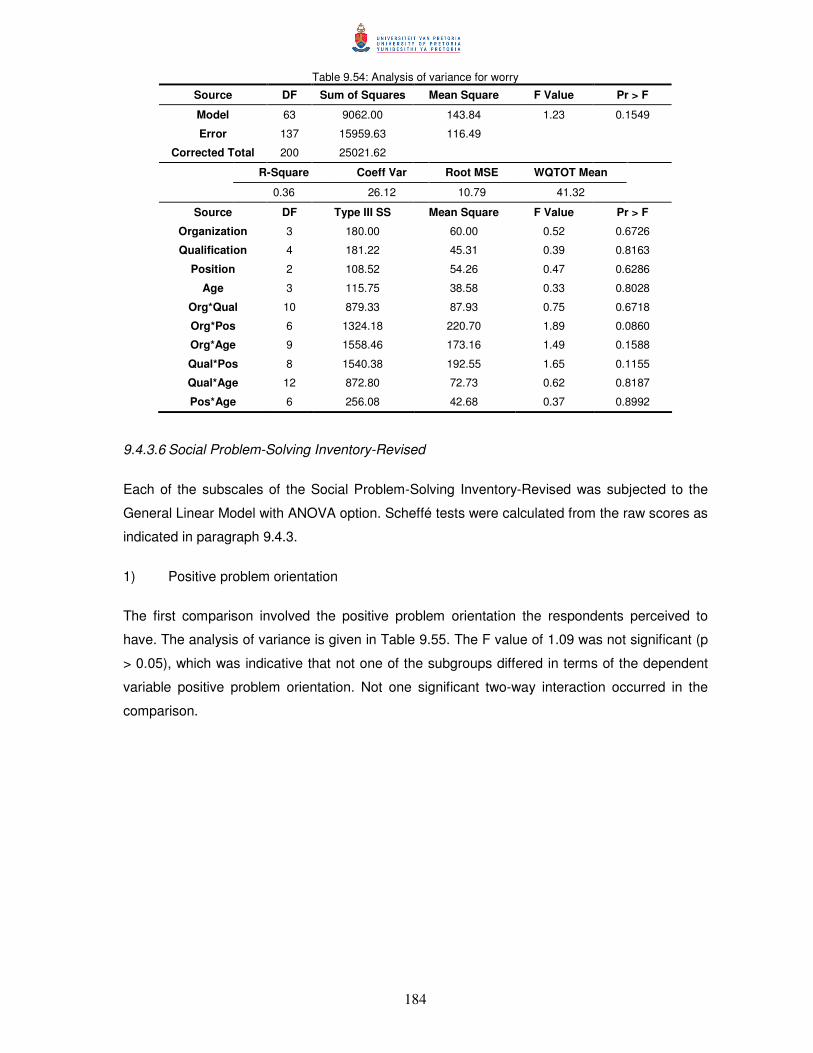
184
Table 9.54: Analysis of variance for worry
Source DF Sum of Squares Mean Square F Value Pr > F
Model 63 9062.00 143.84 1.23 0.1549
Error 137 15959.63 116.49
Corrected Total 200 25021.62
R-Square Coeff Var Root MSE WQTOT Mean
0.36 26.12 10.79 41.32
Source DF Type III SS Mean Square F Value Pr > F
Organization 3 180.00 60.00 0.52 0.6726
Qualification 4 181.22 45.31 0.39 0.8163
Position 2 108.52 54.26 0.47 0.6286
Age 3 115.75 38.58 0.33 0.8028
Org*Qual 10 879.33 87.93 0.75 0.6718
Org*Pos 6 1324.18 220.70 1.89 0.0860
Org*Age 9 1558.46 173.16 1.49 0.1588
Qual*Pos 8 1540.38 192.55 1.65 0.1155
Qual*Age 12 872.80 72.73 0.62 0.8187
Pos*Age 6 256.08 42.68 0.37 0.8992
9.4.3.6 Social Problem-Solving Inventory-Revised
Each of the subscales of the Social Problem-Solving Inventory-Revised was subjected to the
General Linear Model with ANOVA option. Scheffé tests were calculated from the raw scores as
indicated in paragraph 9.4.3.
1) Positive problem orientation
The first comparison involved the positive problem orientation the respondents perceived to
have. The analysis of variance is given in Table 9.55. The F value of 1.09 was not significant (p
> 0.05), which was indicative that not one of the subgroups differed in terms of the dependent
variable positive problem orientation. Not one significant two-way interaction occurred in the
comparison.

185
Table 9.55: Analysis of variance for positive problem orientation
Source DF Sum of Squares Mean Square F Value Pr > F
Model 63 667.00 10.59 1.09 0.3302
Error 139 1347.19 9.69
Corrected Total 202 2014.19
R-Square Coeff Var Root MSE PPO Mean
0.33 16.99 3.11 18.32
Source DF Type III SS Mean Square F Value Pr > F
Organization 3 40.90 13.63 1.41 0.2435
Qualification 4 15.95 3.99 0.41 0.8002
Position 2 41.14 20.57 2.12 0.1236
Age 3 13.56 4.52 0.47 0.7063
Org*Qual 10 79.59 7.96 0.82 0.6088
Org*Pos 6 98.46 16.41 1.69 0.1270
Org*Age 9 80.94 8.99 0.93 0.5031
Qual*Pos 8 90.05 11.26 1.16 0.3269
Qual*Age 12 111.27 9.27 0.96 0.4931
Pos*Age 6 10.63 1.77 0.18 0.9812
2) Negative problem orientation
The second comparison involved negative problem orientation which the respondents were
perceived to have. The analysis of variance is given in Table 9.56. The F value of 1.10 was not
significant (p > 0.05). However a significant one-way interaction in the variable organization was
observed. However it was not deemed necessary to analyze this interaction. No significant two-
way interactions occurred in the comparison.
Table 9.56: Analysis of variance for negative problem orientation
Source DF Sum of Squares Mean Square F Value Pr > F
Model 63 2533.56 40.22 1.10 0.3188
Error 139 5083.04 36.57
Corrected Total 202 7616.60
R-Square Coeff Var Root MSE NPO Mean
0.33 32.74 6.05 18.47
Source DF Type III SS Mean Square F Value Pr > F
Organization 3 400.46 133.49 3.65 0.0142
Qualification 4 12.87 3.22 0.09 0.9861
Position 2 29.60 14.80 0.40 0.6679
Age 3 74.29 24.76 0.68 0.5674
Org*Qual 10 145.84 14.58 0.40 0.9453
Org*Pos 6 54.89 9.15 0.25 0.9585
Org*Age 9 287.05 31.89 0.87 0.5518
Qual*Pos 8 181.46 22.68 0.62 0.7597
Qual*Age 12 414.81 34.57 0.95 0.5042
Pos*Age 6 136.86 22.81 0.62 0.7110
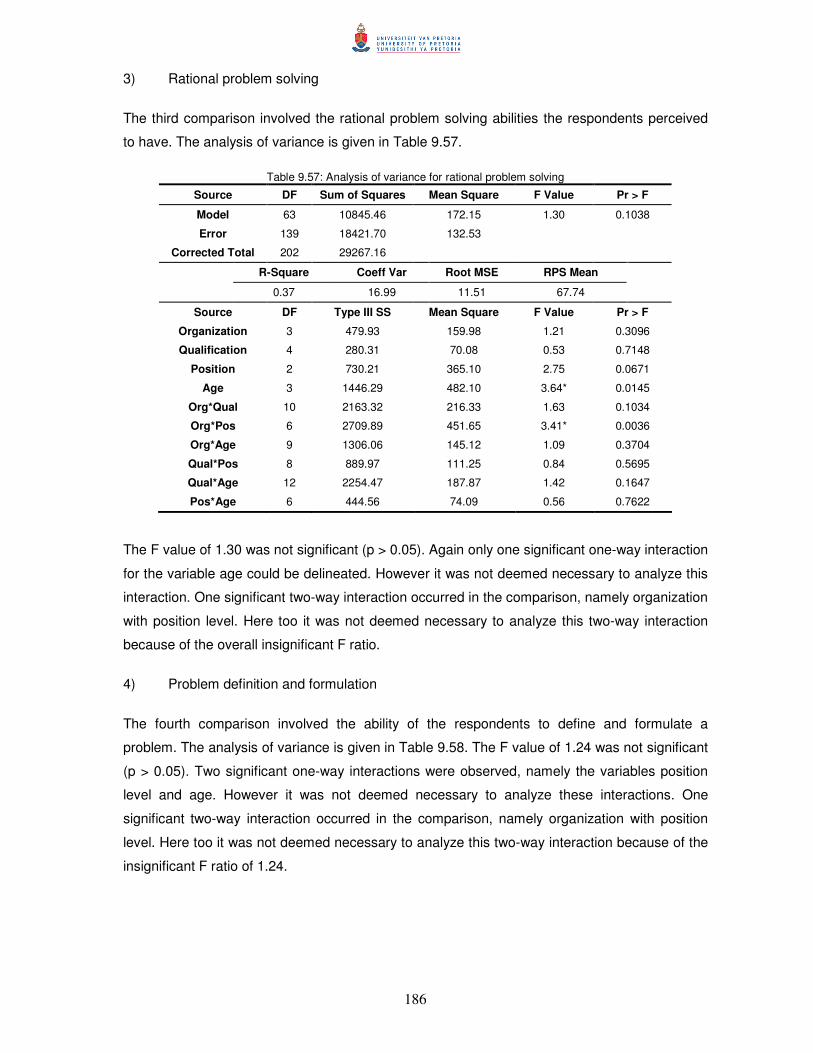
186
3) Rational problem solving
The third comparison involved the rational problem solving abilities the respondents perceived
to have. The analysis of variance is given in Table 9.57.
Table 9.57: Analysis of variance for rational problem solving
Source DF Sum of Squares Mean Square F Value Pr > F
Model 63 10845.46 172.15 1.30 0.1038
Error 139 18421.70 132.53
Corrected Total 202 29267.16
R-Square Coeff Var Root MSE RPS Mean
0.37 16.99 11.51 67.74
Source DF Type III SS Mean Square F Value Pr > F
Organization 3 479.93 159.98 1.21 0.3096
Qualification 4 280.31 70.08 0.53 0.7148
Position 2 730.21 365.10 2.75 0.0671
Age 3 1446.29 482.10 3.64* 0.0145
Org*Qual 10 2163.32 216.33 1.63 0.1034
Org*Pos 6 2709.89 451.65 3.41* 0.0036
Org*Age 9 1306.06 145.12 1.09 0.3704
Qual*Pos 8 889.97 111.25 0.84 0.5695
Qual*Age 12 2254.47 187.87 1.42 0.1647
Pos*Age 6 444.56 74.09 0.56 0.7622
The F value of 1.30 was not significant (p > 0.05). Again only one significant one-way interaction
for the variable age could be delineated. However it was not deemed necessary to analyze this
interaction. One significant two-way interaction occurred in the comparison, namely organization
with position level. Here too it was not deemed necessary to analyze this two-way interaction
because of the overall insignificant F ratio.
4) Problem definition and formulation
The fourth comparison involved the ability of the respondents to define and formulate a
problem. The analysis of variance is given in Table 9.58. The F value of 1.24 was not significant
(p > 0.05). Two significant one-way interactions were observed, namely the variables position
level and age. However it was not deemed necessary to analyze these interactions. One
significant two-way interaction occurred in the comparison, namely organization with position
level. Here too it was not deemed necessary to analyze this two-way interaction because of the
insignificant F ratio of 1.24.
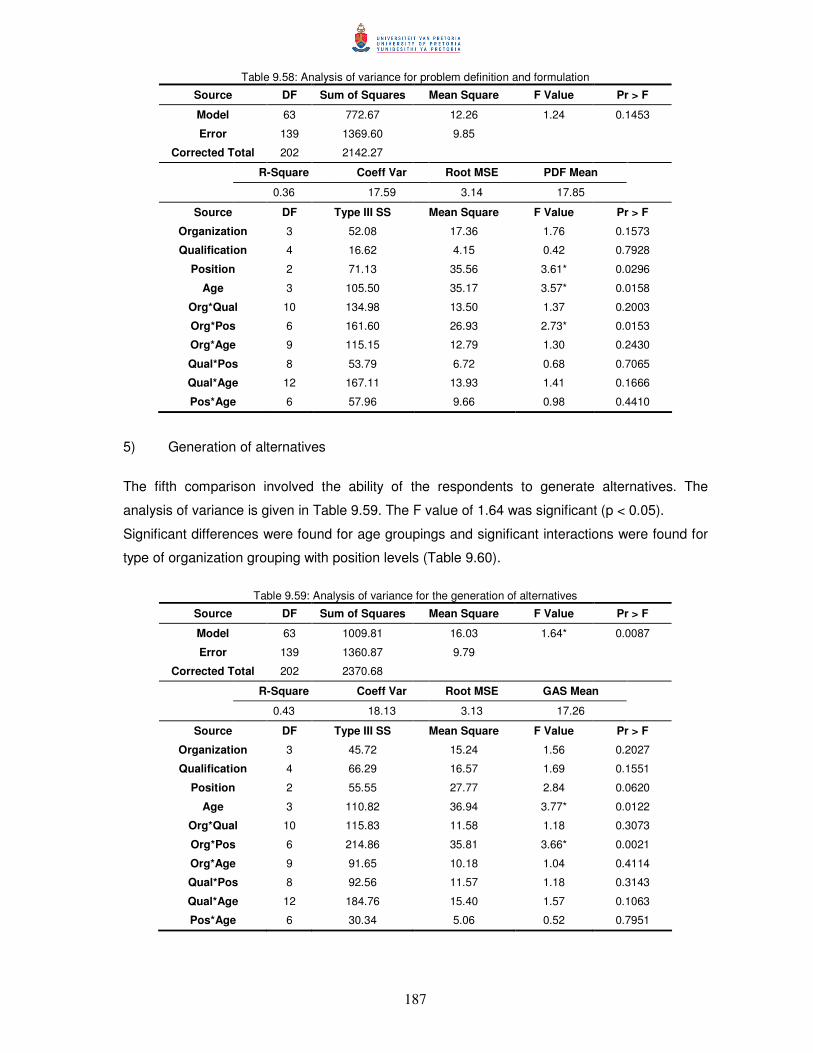
187
Table 9.58: Analysis of variance for problem definition and formulation
Source DF Sum of Squares Mean Square F Value Pr > F
Model 63 772.67 12.26 1.24 0.1453
Error 139 1369.60 9.85
Corrected Total 202 2142.27
R-Square Coeff Var Root MSE PDF Mean
0.36 17.59 3.14 17.85
Source DF Type III SS Mean Square F Value Pr > F
Organization 3 52.08 17.36 1.76 0.1573
Qualification 4 16.62 4.15 0.42 0.7928
Position 2 71.13 35.56 3.61* 0.0296
Age 3 105.50 35.17 3.57* 0.0158
Org*Qual 10 134.98 13.50 1.37 0.2003
Org*Pos 6 161.60 26.93 2.73* 0.0153
Org*Age 9 115.15 12.79 1.30 0.2430
Qual*Pos 8 53.79 6.72 0.68 0.7065
Qual*Age 12 167.11 13.93 1.41 0.1666
Pos*Age 6 57.96 9.66 0.98 0.4410
5) Generation of alternatives
The fifth comparison involved the ability of the respondents to generate alternatives. The
analysis of variance is given in Table 9.59. The F value of 1.64 was significant (p < 0.05).
Significant differences were found for age groupings and significant interactions were found for
type of organization grouping with position levels (Table 9.60).
Table 9.59: Analysis of variance for the generation of alternatives
Source DF Sum of Squares Mean Square F Value Pr > F
Model 63 1009.81 16.03 1.64* 0.0087
Error 139 1360.87 9.79
Corrected Total 202 2370.68
R-Square Coeff Var Root MSE GAS Mean
0.43 18.13 3.13 17.26
Source DF Type III SS Mean Square F Value Pr > F
Organization 3 45.72 15.24 1.56 0.2027
Qualification 4 66.29 16.57 1.69 0.1551
Position 2 55.55 27.77 2.84 0.0620
Age 3 110.82 36.94 3.77* 0.0122
Org*Qual 10 115.83 11.58 1.18 0.3073
Org*Pos 6 214.86 35.81 3.66* 0.0021
Org*Age 9 91.65 10.18 1.04 0.4114
Qual*Pos 8 92.56 11.57 1.18 0.3143
Qual*Age 12 184.76 15.40 1.57 0.1063
Pos*Age 6 30.34 5.06 0.52 0.7951
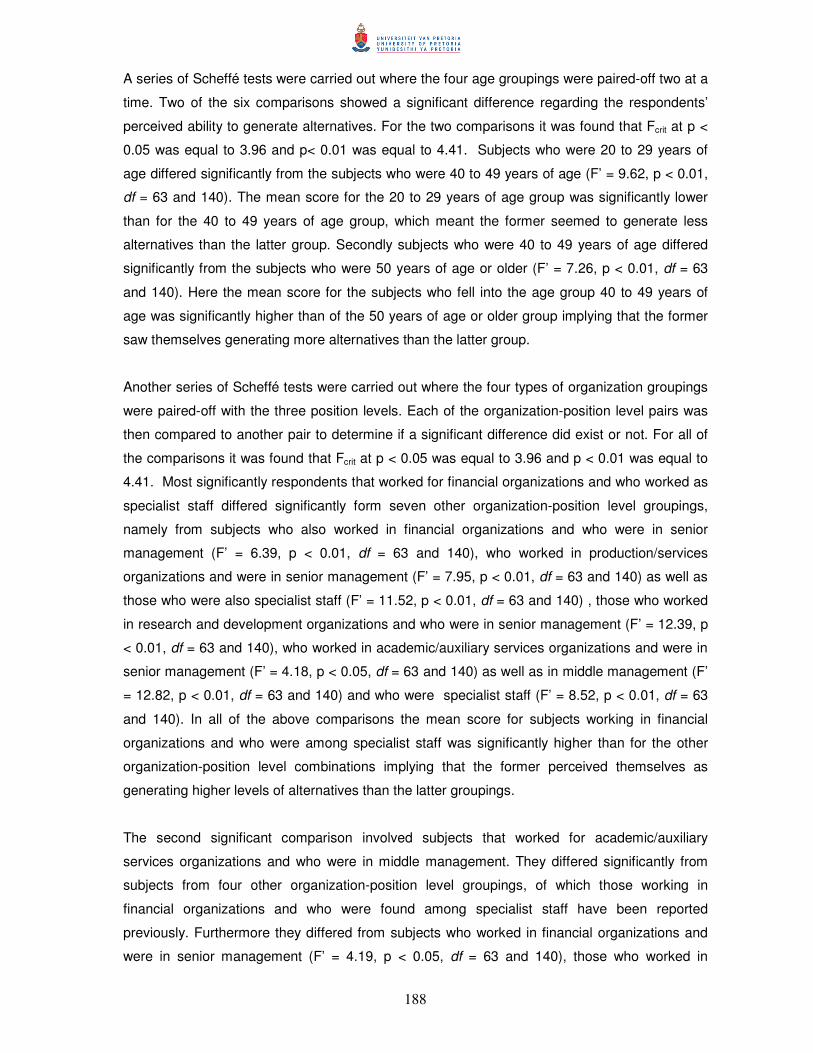
188
A series of Scheffé tests were carried out where the four age groupings were paired-off two at a
time. Two of the six comparisons showed a significant difference regarding the respondents’
perceived ability to generate alternatives. For the two comparisons it was found that Fcrit at p <
0.05 was equal to 3.96 and p< 0.01 was equal to 4.41. Subjects who were 20 to 29 years of
age differed significantly from the subjects who were 40 to 49 years of age (F’ = 9.62, p < 0.01,
df = 63 and 140). The mean score for the 20 to 29 years of age group was significantly lower
than for the 40 to 49 years of age group, which meant the former seemed to generate less
alternatives than the latter group. Secondly subjects who were 40 to 49 years of age differed
significantly from the subjects who were 50 years of age or older (F’ = 7.26, p < 0.01, df = 63
and 140). Here the mean score for the subjects who fell into the age group 40 to 49 years of
age was significantly higher than of the 50 years of age or older group implying that the former
saw themselves generating more alternatives than the latter group.
Another series of Scheffé tests were carried out where the four types of organization groupings
were paired-off with the three position levels. Each of the organization-position level pairs was
then compared to another pair to determine if a significant difference did exist or not. For all of
the comparisons it was found that Fcrit at p < 0.05 was equal to 3.96 and p < 0.01 was equal to
4.41. Most significantly respondents that worked for financial organizations and who worked as
specialist staff differed significantly form seven other organization-position level groupings,
namely from subjects who also worked in financial organizations and who were in senior
management (F’ = 6.39, p < 0.01, df = 63 and 140), who worked in production/services
organizations and were in senior management (F’ = 7.95, p < 0.01, df = 63 and 140) as well as
those who were also specialist staff (F’ = 11.52, p < 0.01, df = 63 and 140) , those who worked
in research and development organizations and who were in senior management (F’ = 12.39, p
< 0.01, df = 63 and 140), who worked in academic/auxiliary services organizations and were in
senior management (F’ = 4.18, p < 0.05, df = 63 and 140) as well as in middle management (F’
= 12.82, p < 0.01, df = 63 and 140) and who were specialist staff (F’ = 8.52, p < 0.01, df = 63
and 140). In all of the above comparisons the mean score for subjects working in financial
organizations and who were among specialist staff was significantly higher than for the other
organization-position level combinations implying that the former perceived themselves as
generating higher levels of alternatives than the latter groupings.
The second significant comparison involved subjects that worked for academic/auxiliary
services organizations and who were in middle management. They differed significantly from
subjects from four other organization-position level groupings, of which those working in
financial organizations and who were found among specialist staff have been reported
previously. Furthermore they differed from subjects who worked in financial organizations and
were in senior management (F’ = 4.19, p < 0.05, df = 63 and 140), those who worked in
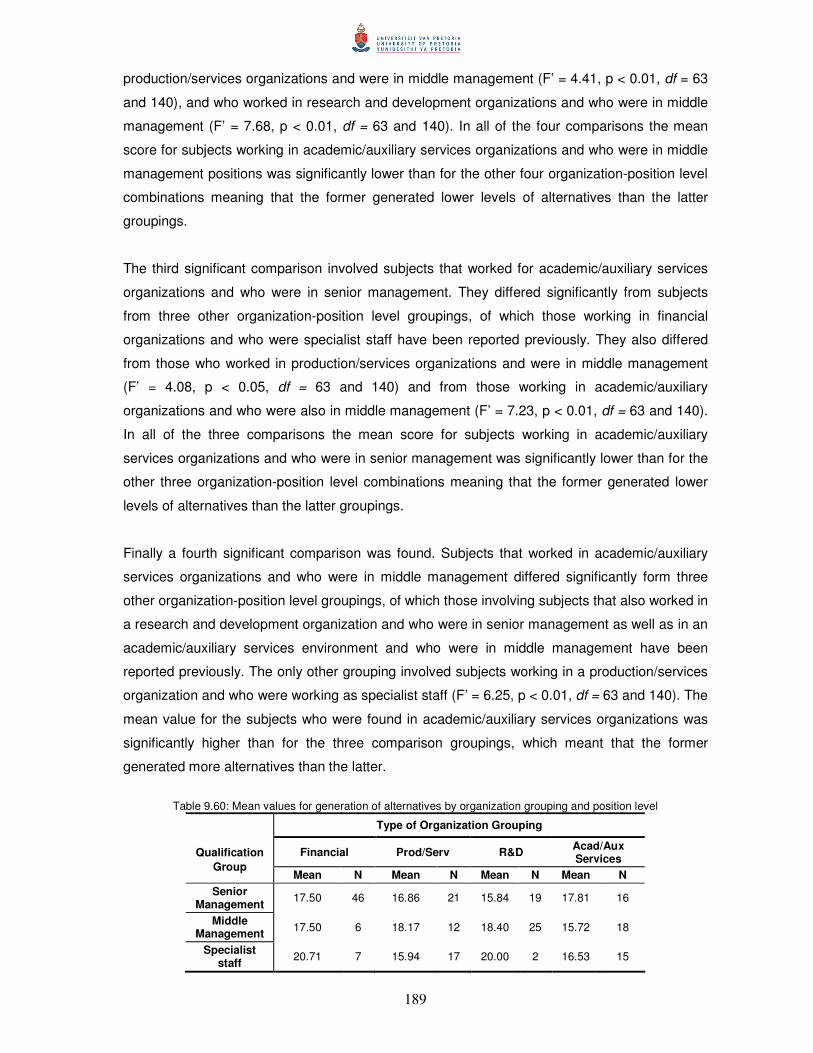
189
production/services organizations and were in middle management (F’ = 4.41, p < 0.01, df = 63
and 140), and who worked in research and development organizations and who were in middle
management (F’ = 7.68, p < 0.01, df = 63 and 140). In all of the four comparisons the mean
score for subjects working in academic/auxiliary services organizations and who were in middle
management positions was significantly lower than for the other four organization-position level
combinations meaning that the former generated lower levels of alternatives than the latter
groupings.
The third significant comparison involved subjects that worked for academic/auxiliary services
organizations and who were in senior management. They differed significantly from subjects
from three other organization-position level groupings, of which those working in financial
organizations and who were specialist staff have been reported previously. They also differed
from those who worked in production/services organizations and were in middle management
(F’ = 4.08, p < 0.05, df = 63 and 140) and from those working in academic/auxiliary
organizations and who were also in middle management (F’ = 7.23, p < 0.01, df = 63 and 140).
In all of the three comparisons the mean score for subjects working in academic/auxiliary
services organizations and who were in senior management was significantly lower than for the
other three organization-position level combinations meaning that the former generated lower
levels of alternatives than the latter groupings.
Finally a fourth significant comparison was found. Subjects that worked in academic/auxiliary
services organizations and who were in middle management differed significantly form three
other organization-position level groupings, of which those involving subjects that also worked in
a research and development organization and who were in senior management as well as in an
academic/auxiliary services environment and who were in middle management have been
reported previously. The only other grouping involved subjects working in a production/services
organization and who were working as specialist staff (F’ = 6.25, p < 0.01, df = 63 and 140). The
mean value for the subjects who were found in academic/auxiliary services organizations was
significantly higher than for the three comparison groupings, which meant that the former
generated more alternatives than the latter.
Table 9.60: Mean values for generation of alternatives by organization grouping and position level
Type of Organization Grouping
Financial Prod/Serv R&D Acad/Aux Services Qualification
Group Mean N Mean N Mean N Mean N
Senior Management 17.50 46 16.86 21 15.84 19 17.81 16
Middle Management 17.50 6 18.17 12 18.40 25 15.72 18
Specialist staff 20.71 7 15.94 17 20.00 2 16.53 15
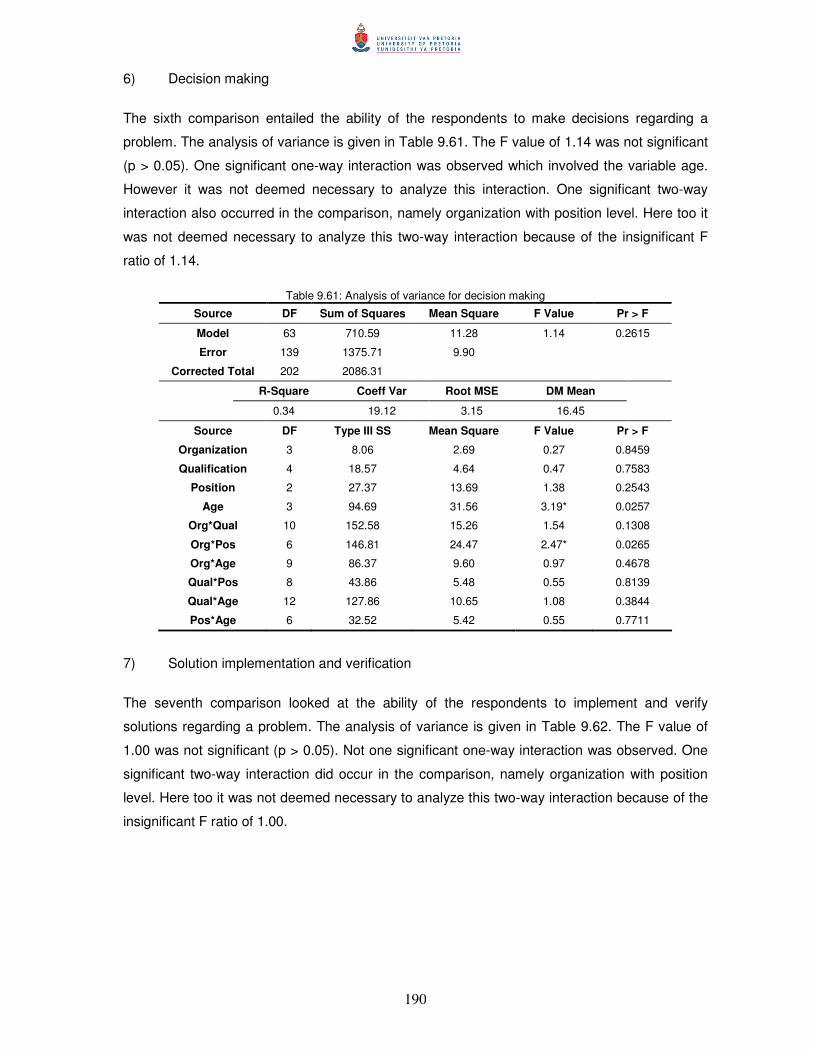
190
6) Decision making
The sixth comparison entailed the ability of the respondents to make decisions regarding a
problem. The analysis of variance is given in Table 9.61. The F value of 1.14 was not significant
(p > 0.05). One significant one-way interaction was observed which involved the variable age.
However it was not deemed necessary to analyze this interaction. One significant two-way
interaction also occurred in the comparison, namely organization with position level. Here too it
was not deemed necessary to analyze this two-way interaction because of the insignificant F
ratio of 1.14.
Table 9.61: Analysis of variance for decision making
Source DF Sum of Squares Mean Square F Value Pr > F
Model 63 710.59 11.28 1.14 0.2615
Error 139 1375.71 9.90
Corrected Total 202 2086.31
R-Square Coeff Var Root MSE DM Mean
0.34 19.12 3.15 16.45
Source DF Type III SS Mean Square F Value Pr > F
Organization 3 8.06 2.69 0.27 0.8459
Qualification 4 18.57 4.64 0.47 0.7583
Position 2 27.37 13.69 1.38 0.2543
Age 3 94.69 31.56 3.19* 0.0257
Org*Qual 10 152.58 15.26 1.54 0.1308
Org*Pos 6 146.81 24.47 2.47* 0.0265
Org*Age 9 86.37 9.60 0.97 0.4678
Qual*Pos 8 43.86 5.48 0.55 0.8139
Qual*Age 12 127.86 10.65 1.08 0.3844
Pos*Age 6 32.52 5.42 0.55 0.7711
7) Solution implementation and verification
The seventh comparison looked at the ability of the respondents to implement and verify
solutions regarding a problem. The analysis of variance is given in Table 9.62. The F value of
1.00 was not significant (p > 0.05). Not one significant one-way interaction was observed. One
significant two-way interaction did occur in the comparison, namely organization with position
level. Here too it was not deemed necessary to analyze this two-way interaction because of the
insignificant F ratio of 1.00.
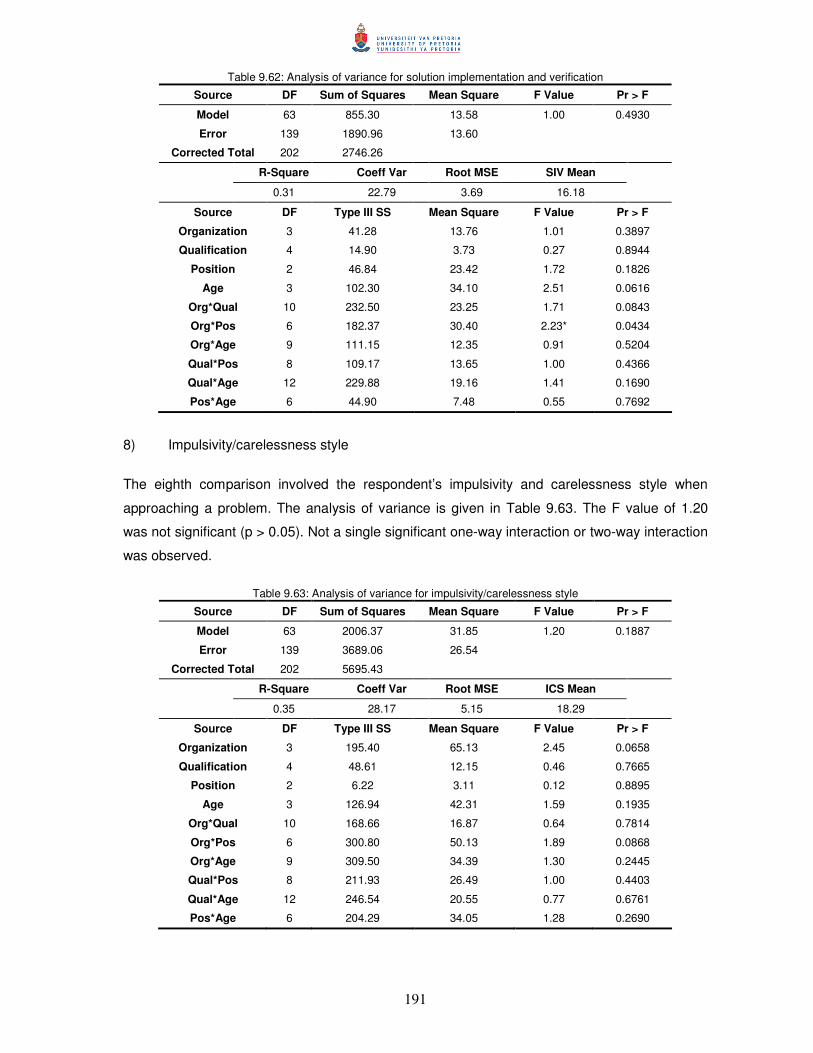
191
Table 9.62: Analysis of variance for solution implementation and verification
Source DF Sum of Squares Mean Square F Value Pr > F
Model 63 855.30 13.58 1.00 0.4930
Error 139 1890.96 13.60
Corrected Total 202 2746.26
R-Square Coeff Var Root MSE SIV Mean
0.31 22.79 3.69 16.18
Source DF Type III SS Mean Square F Value Pr > F
Organization 3 41.28 13.76 1.01 0.3897
Qualification 4 14.90 3.73 0.27 0.8944
Position 2 46.84 23.42 1.72 0.1826
Age 3 102.30 34.10 2.51 0.0616
Org*Qual 10 232.50 23.25 1.71 0.0843
Org*Pos 6 182.37 30.40 2.23* 0.0434
Org*Age 9 111.15 12.35 0.91 0.5204
Qual*Pos 8 109.17 13.65 1.00 0.4366
Qual*Age 12 229.88 19.16 1.41 0.1690
Pos*Age 6 44.90 7.48 0.55 0.7692
8) Impulsivity/carelessness style
The eighth comparison involved the respondent’s impulsivity and carelessness style when
approaching a problem. The analysis of variance is given in Table 9.63. The F value of 1.20
was not significant (p > 0.05). Not a single significant one-way interaction or two-way interaction
was observed.
Table 9.63: Analysis of variance for impulsivity/carelessness style
Source DF Sum of Squares Mean Square F Value Pr > F
Model 63 2006.37 31.85 1.20 0.1887
Error 139 3689.06 26.54
Corrected Total 202 5695.43
R-Square Coeff Var Root MSE ICS Mean
0.35 28.17 5.15 18.29
Source DF Type III SS Mean Square F Value Pr > F
Organization 3 195.40 65.13 2.45 0.0658
Qualification 4 48.61 12.15 0.46 0.7665
Position 2 6.22 3.11 0.12 0.8895
Age 3 126.94 42.31 1.59 0.1935
Org*Qual 10 168.66 16.87 0.64 0.7814
Org*Pos 6 300.80 50.13 1.89 0.0868
Org*Age 9 309.50 34.39 1.30 0.2445
Qual*Pos 8 211.93 26.49 1.00 0.4403
Qual*Age 12 246.54 20.55 0.77 0.6761
Pos*Age 6 204.29 34.05 1.28 0.2690

192
9) Avoidance style
The sixth comparison entailed the ability of the respondents to make decisions regarding a
problem. The analysis of variance is given in Table 9.64. The F value of 1.16 was not significant
(p > 0.05). Again not one significant one-way interaction or two-way interaction could be
delineated.
Table 9.64: Analysis of variance for avoidance style
Source DF Sum of Squares Mean Square F Value Pr > F
Model 63 1169.40 18.56 1.16 0.2412
Error 139 2233.59 16.07
Corrected Total 202 3403.00
R-Square Coeff Var Root MSE GAS Mean
0.34 31.52 4.01 12.72
Source DF Type III SS Mean Square F Value Pr > F
Organization 3 86.81 28.94 1.80 0.1499
Qualification 4 31.31 7.83 0.49 0.7452
Position 2 28.35 14.18 0.88 0.4162
Age 3 45.86 15.29 0.95 0.4178
Org*Qual 10 244.69 24.47 1.52 0.1373
Org*Pos 6 101.90 16.98 1.06 0.3915
Org*Age 9 103.24 11.47 0.71 0.6955
Qual*Pos 8 63.27 7.91 0.49 0.8602
Qual*Age 12 185.10 15.43 0.96 0.4900
Pos*Age 6 29.47 4.91 0.31 0.9951
10) Total social problem solving
The tenth comparison encompassed the total problem solving ability of the respondents
regarding a problem. The analysis of variance is given in Table 9.65. The F value of 1.24 was
not significant (p > 0.05). Not one significant one-way interaction was observed. One significant
two-way interaction occurred in the comparison, namely organization with position level. Again it
was not deemed necessary to analyze this two-way interaction because of the insignificant F
ratio of 1.24.
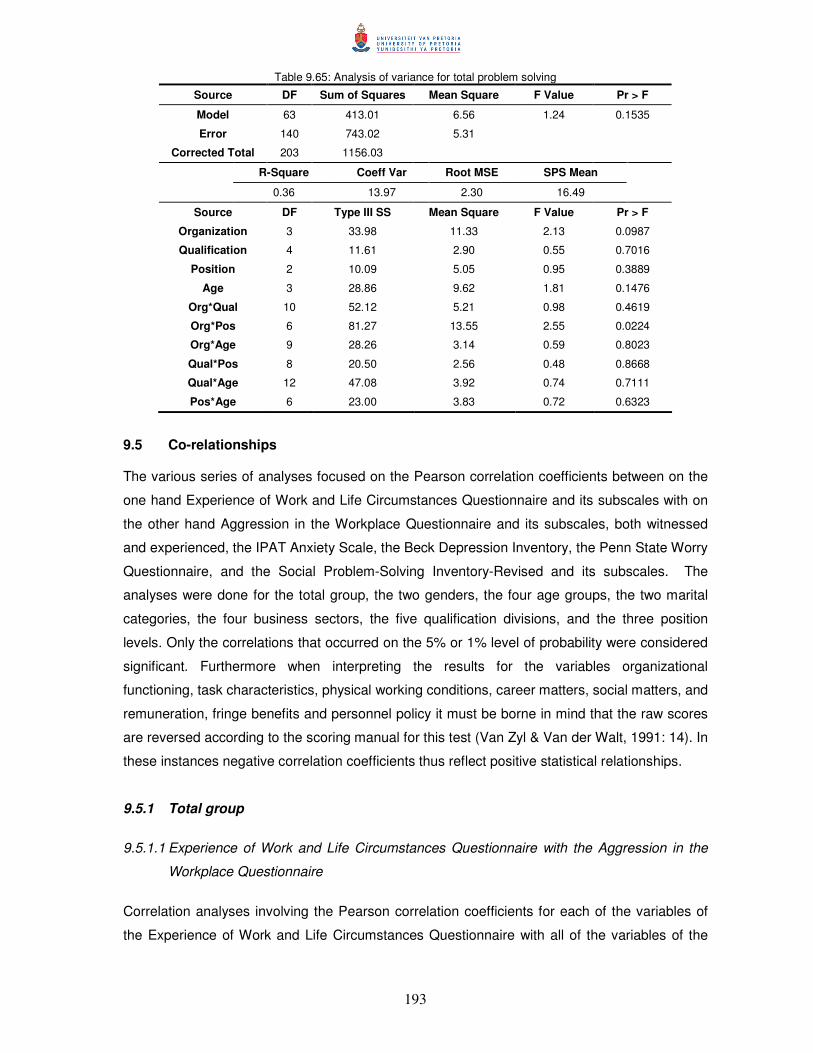
193
Table 9.65: Analysis of variance for total problem solving
Source DF Sum of Squares Mean Square F Value Pr > F
Model 63 413.01 6.56 1.24 0.1535
Error 140 743.02 5.31
Corrected Total 203 1156.03
R-Square Coeff Var Root MSE SPS Mean
0.36 13.97 2.30 16.49
Source DF Type III SS Mean Square F Value Pr > F
Organization 3 33.98 11.33 2.13 0.0987
Qualification 4 11.61 2.90 0.55 0.7016
Position 2 10.09 5.05 0.95 0.3889
Age 3 28.86 9.62 1.81 0.1476
Org*Qual 10 52.12 5.21 0.98 0.4619
Org*Pos 6 81.27 13.55 2.55 0.0224
Org*Age 9 28.26 3.14 0.59 0.8023
Qual*Pos 8 20.50 2.56 0.48 0.8668
Qual*Age 12 47.08 3.92 0.74 0.7111
Pos*Age 6 23.00 3.83 0.72 0.6323
9.5 Co-relationships The various series of analyses focused on the Pearson correlation coefficients between on the
one hand Experience of Work and Life Circumstances Questionnaire and its subscales with on
the other hand Aggression in the Workplace Questionnaire and its subscales, both witnessed
and experienced, the IPAT Anxiety Scale, the Beck Depression Inventory, the Penn State Worry
Questionnaire, and the Social Problem-Solving Inventory-Revised and its subscales. The
analyses were done for the total group, the two genders, the four age groups, the two marital
categories, the four business sectors, the five qualification divisions, and the three position
levels. Only the correlations that occurred on the 5% or 1% level of probability were considered
significant. Furthermore when interpreting the results for the variables organizational
functioning, task characteristics, physical working conditions, career matters, social matters, and
remuneration, fringe benefits and personnel policy it must be borne in mind that the raw scores
are reversed according to the scoring manual for this test (Van Zyl & Van der Walt, 1991: 14). In
these instances negative correlation coefficients thus reflect positive statistical relationships.
9.5.1 Total group
9.5.1.1 Experience of Work and Life Circumstances Questionnaire with the Aggression in the
Workplace Questionnaire
Correlation analyses involving the Pearson correlation coefficients for each of the variables of
the Experience of Work and Life Circumstances Questionnaire with all of the variables of the
194
Aggression in the Workplace Questionnaire-experienced and -witnessed were undertaken for
the total group (Appendix B).
The three hypotheses that were investigated for each of the variables of the Experience of Work
and Life Circumstances Questionnaire with the main variable of the Aggression in the
Workplace Questionnaire (witnessed as well as experienced) for the total group are as follows:
H0: �LOS,OWS = 0.00 or H0: �IWSOF-IWSRF = 0.00 H1: �LOS,OWS � 1.00 H1: �IWSOF-IWSRF � -1.00 H2: �LOS,OWS � -1.00 H2: �IWSOF-IWSRF � 1.00
The reader is referred to Appendix B. This addendum contains details of all the relevant
correlation coefficients. The results of only the main scales will be presented here.
1) Experience of Work and Life Circumstances Questionnaire with the Aggression in the
Workplace Questionnaire-witnessed
From the results it can be seen that the main scale scores of the subjects, namely level of
stress (LOS) correlated positively and significantly with the witnessed total aggression (WTOT, r
= 0.386) scale of the Aggression in the Workplace Questionnaire (AWQ).
The three subscales, namely witnessed expressions of hostility (WEH), witnessed
obstructionism (WOB), and witnessed overt aggression (WOV), supported the main scale
witnessed total aggression (WTOT).
The correlation obtained for level of stress with witnessed total aggression was the most
consistent co-relationship. Thus the indicator level of stress correlated significantly with
witnessed total aggression in the workplace. High levels of perceived stress on this indicator co-
related to high levels of witnessed aggression in the workplace and vice versa. This main
indicator thus confirmed the alternative hypothesis H1.
2) Experience of Work and Life Circumstances Questionnaire with the Aggression in the
Workplace Questionnaire-experienced
Level of stress (LOS) scores correlated positively and significantly with the experienced total
aggression (ETOT, r = 0.306) scale of the Aggression in the Workplace Questionnaire (AWQ).
The three subscales, namely witnessed expressions of hostility (WEH), witnessed
obstructionism (WOB), and witnessed overt aggression (WOV), supported the main scale
witnessed total aggression (WTOT).
195
The correlation obtained for LOS with experienced aggression was the most consistent co-
relationship. This indicator, namely level of stress correlated significantly with witnessed total
aggression in the workplace. Again high levels of perceived stress on this indicator co-related to
high levels of witnessed total aggression in the workplace and vice versa. Again this indicator
confirmed the alternative hypothesis H1.
9.5.1.2 Experience of Work and Life Circumstances Questionnaire with the IPAT Anxiety Scale
In this section correlation analyses focused on Pearson correlation coefficients describing the
co-relationship between each of the variables of the Experience of Work and Life
Circumstances Questionnaire and all the variables of the IPAT Anxiety Scale (IAS), for the
group as a whole (Appendix B). The three hypotheses that were investigated for each of the
variables of the Experience of Work and Life Circumstances Questionnaire with the main
variable of the IPAT Anxiety Scale, namely the total anxiety score (TAS) for the total group are
as follows:
H0: �LOS,OWS.TAS = 0.00 or H0: �IWSOF-IWSRF.TAS = 0.00 H1: �LOS,OWS.TAS � 1.00 H1: �IWSOF-IWSRF.TAS � -1.00 H2: �LOS,OWS.TAS � -1.00 H2: �IWSOF-IWSRF.TAS � 1.00
The reader will find detailed information in Appendix B. Thus the results of only the main scales
will be presented.
The level of stress (LOS) scores of the subjects correlated positively and significantly with the
total anxiety score (TAS, r = 0.586) scale of the IPAT Anxiety Scale (IAS).
The five subscales, namely factor -Q3, factor Q4, factor -C, factor L, factor O and the two derived
subscales Score A and Score B supported the main scale, namely the total anxiety scale (TAS)
for LOS.
Again the correlation found between level of stress and the total anxiety scale was the most
consistent. Thus the indicator level of stress correlated significantly with the total anxiety score.
High levels of perceived stress on this indicator correlated with high levels of total anxiety. Again
this indicator confirmed the alternative hypothesis H1.
9.5.1.3 Experience of Work and Life Circumstances Questionnaire with the Beck Depression
Inventory
Correlation analyses by means of the Pearson correlation coefficients focused on the
relationship between each of the variables of the Experience of Work and Life Circumstances

196
Questionnaire with those of the Beck Depression Inventory (BDI), once again done for the total
group (Appendix B). The three hypotheses that were investigated for each of the variables of
the Experience of Work and Life Circumstances Questionnaire with the Beck Depression
Inventory for the total group are as follows:
H0: �LOS,OWS.BDI = 0.00 or H0: �IWSOF-IWSRF.BDI = 0.00 H1: �LOS,OWS.BDI � 1.00 H1: �IWSOF-IWSRF.BDI � -1.00 H2: �LOS,OWS.BDI � -1.00 H2: �IWSOF-IWSRF.BDI � 1.00
Appendix B contains a detailed series of correlation coefficients. The discussion of results
focuses on the main scales only.
A significant and positive correlation was found between the subjects’ level of stress (LOS, r =
0.656) scores and depression.
The correlation obtained for LOS and depression was the most consistent co-relationship. Thus
the indicator level of stress correlated significantly with depression. High levels of perceived
stress on this indicator co-related with high levels of depression and vice versa. Once again this
indicator confirmed the alternative hypothesis H1.
9.5.1.4 Experience of Work and Life Circumstances Questionnaire with the Penn State Worry
Questionnaire
The next correlation analyses were based on the Pearson correlation coefficients obtained for
each of the variables of the Experience of Work and Life Circumstances Questionnaire with
those of the Penn State Worry Questionnaire (PSWQ), once more for the total group (Appendix
B). The three hypotheses that were investigated for each of the variables of the Experience of
Work and Life Circumstances Questionnaire with all of the variables of the Penn State Worry
Questionnaire for the total group are as follows:
H0: �LOS,OWS.PSWQ = 0.00 or H0: �IWSOF-IWSRF.PSWQ = 0.00 H1: �LOS,OWS.PSWQ � 1.00 H1: �IWSOF-IWSRF.PSWQ � -1.00 H2: �LOS,OWS.PSWQ � -1.00 H2: �IWSOF-IWSRF.PSWQ � 1.00
The detailed co-relations are provided in Appendix B. Here only the results of the main scales
will be presented.
A positive and significant correlation was found for the subjects’ level of stress (LOS, r = 0.499).
197
Again the main scale, namely level of stress was the most consistent co-relationship. High
levels of perceived stress on this indicator co-related to high levels of worry and vice versa. This
indicator thus confirmed the alternative hypothesis H1.
9.5.1.5 Experience of Work and Life Circumstances Questionnaire with the Social Problem-
Solving Inventory-Revised
Correlation analyses of the Pearson correlation coefficients between each of the variables of the
Experience of Work and Life Circumstances Questionnaire and those of the variables of the
Social Problem-Solving Inventory-Revised (SPSIR) were next done for the total group
(Appendix B). The three hypotheses that were investigated for each of the variables of the
Experience of Work and Life Circumstances Questionnaire with the main variable of the Social
Problem-Solving Inventory-Revised, namely social problem solving (SPS) for the total group are
as follows:
H0: �LOS,OWS.SPS = 0.00 or H0: �IWSOF-IWSRF.SPS = 0.00 H1: �LOS,OWS.SPS � 1.00 H1: �IWSOF-IWSRF.SPS � -1.00 H2: �LOS,OWS.SPS � -1.00 H2: �IWSOF-IWSRF.SPS � 1.00
If necessary, refer to Appendix B for detailed information. The results of only the main scales
will be described.
A negative but significant correlation was obtained for the subjects’ level of stress (LOS, r = -
0.333) with the main scale of the SPSIR, namely social problem solving (SPS).
In the case of LOS only four scales supported the main scale SPS, namely positive problem
orientation (PPO), negative problem orientation (NPO), impulsivity/carelessness style (ICS), and
avoidance style (AS).
A consistent co-relationship was obtained for levels of stress with social problem solving in
general. The results also showed that the indictor level of stress correlated significantly with
social problem solving. High levels of perceived stress co-related to lower levels of social
problem solving and vice versa thus confirming the alternative hypothesis H2.
9.5.2 Gender
9.5.2.1 Experience of Work and Life Circumstances Questionnaire with the Aggression in the
Workplace Questionnaire
The next correlation analyses involved Pearson correlation coefficients between each of the
variables of the Experience of Work and Life Circumstances Questionnaire and all of the
198
variables of the Aggression in the Workplace Questionnaire, both experienced and witnessed
aggression, per gender subgroup (Appendix B). The three hypotheses that were investigated for
each of the variables of the Experience of Work and Life Circumstances Questionnaire with all
of the variables of the Aggression in the Workplace Questionnaire-experienced and -witnessed
for gender are as follows:
H0: �LOS,OWS.AWQ = 0.00 or H0: �IWSOF-IWSRF.AWQ = 0.00 H1: �LOS,OWS.AWQ � 1.00 H1: �IWSOF-IWSRF.AWQ � -1.00 H2: �LOS,OWS.AWQ � -1.00 H2: �IWSOF-IWSRF.AWQ � 1.00
The reader might refer to Appendix B that contains detailed co-relational information. Only the
main scales will be analysed.
1) Experience of Work and Life Circumstances Questionnaire with the Aggression in the
Workplace Questionnaire-witnessed
The level of stress (LOS) scores for both the males and females correlated significantly and
positively with the witnessed total aggression scale (WTOT) of the Aggression in the Workplace
Questionnaire (AWQ). The respective correlations for the former was 0.295 and for the latter
0.504.
The three subscales, namely witnessed expressions of hostility (WEH), witnessed
obstructionism (WOB), and witnessed overt aggression (WOV) for both males and females
supported the main scale witnessed total aggression for LOS.
In the case of the males and the females the indicator level of stress was the most consistent
co-relationship with witnessed aggression in the workplace. High levels of perceived stress on
this indicator co-related to high levels of total witnessed aggression in the workplace. The
alternative hypothesis H1 was confirmed in general for this indicators.
2) Experience of Work and Life Circumstances Questionnaire with the Aggression in the
Workplace Questionnaire-experienced
The scores for level of stress (LOS) correlated significantly and positively with experienced total
aggression (ETOT) only for the females (r = 0.516).
For the females the main scale, namely LOS was supported by all three of the subscales,
namely experienced expressions of hostility (EEH), experienced obstructionism (EOB), and
experienced overt aggression (EOB).
199
For males no significant correlation was found between the indicator level of stress and
experienced total aggression in the workplace. Level of stress generally confirmed the null
hypothesis. When considering the females a consistent correlation was obtained between the
indicator level of stress and experienced total aggression in the workplace. High levels of
perceived stress on this indicator co-related with high levels of experienced total aggression in
the workplace and vice versa. Thus the alternative hypothesis H1 was confirmed in general for
this indicator.
9.5.2.2 Experience of Work and Life Circumstances Questionnaire with the IPAT Anxiety Scale
The ensuing correlation analyses focused on Pearson correlation coefficients derived from each
of the variables of the Experience of Work and Life Circumstances Questionnaire being
associated with each of the variables of the IPAT Anxiety Scale (IAS), separately done for each
gender group (Appendix B). The three hypotheses that were formulated for each of the
variables of the Experience of Work and Life Circumstances Questionnaire compared with all of
the variables of the IPAT Anxiety Scale (IAS), for gender are as follows:
H0: �LOS,OWS.IPAT = 0.00 or H0: �IWSOF-IWSRF.IPAT = 0.00 H1: �LOS,OWS.IPAT � 1.00 H1: �IWSOF-IWSRF.IPAT � -1.00 H2: �LOS,OWS.IPAT � -1.00 H2: �IWSOF-IWSRF.IPAT � 1.00
Appendix B contains detailed information related to the series of analyses. The results of the
main scales will be presented.
The level of stress (LOS) scores for males and females correlated significantly and positively
with the total anxiety score (TAS) scale of the IAS. The correlation for the former was 0.621 and
for the latter was 0.562.
The main scale, TAS in the case of LOS for both males and females were supported by all
seven of the subscales of the IAS.
In the case of males and females the correlations between the indicator levels of stress was the
most consistent. Thus high levels of perceived stress on this indicator co-related to higher levels
of total anxiety. Again this indicator confirmed the alternative hypothesis H1.
9.5.2.3 Experience of Work and Life Circumstances Questionnaire with the Beck Depression
Inventory
Analyses of Pearson correlation coefficients calculated between each of the variables of the
Experience of Work and Life Circumstances Questionnaire and those of the Beck Depression
200
Inventory (BDI) were done per gender group (Appendix B). The three hypotheses that were
studied for all variables of the Experience of Work and Life Circumstances Questionnaire with
the Beck Depression Inventory, by gender, are as follows:
H0: �LOS,OWS.BDI = 0.00 or H0: �IWSOF-IWSRF.BDI = 0.00 H1: �LOS,OWS.BDI � 1.00 H1: �IWSOF-IWSRF.BDI � -1.00 H2: �LOS,OWS.BDI � -1.00 H2: �IWSOF-IWSRF.BDI � 1.00
Only the results of only the main scales will be presented here. A detailed set of relevant
calculations are provided in Appendix B.
A significant and positive correlation was found for males and females level of stress (LOS)
scores with depression. The correlations for the former was 0.652 and for the latter 0.674.
In the case of both males and females the correlation between level of stress and depression
was the most consistent. Thus the indicator level of stress in both cases correlated significantly
with depression. High levels of perceived stress on this indicator co-related with high levels of
depression and vice versa. Throughout this indicator confirmed the alternative hypothesis H1.
9.5.2.4 Experience of Work and Life Circumstances Questionnaire with the Penn State Worry
Questionnaire
Correlation analyses based on an assessment of Pearson correlation coefficients for each of
the variables of the Experience of Work and Life Circumstances Questionnaire and the Penn
State Worry Questionnaire (PSWQ) were done for each gender grouping (refer to Appendix B).
The three hypotheses that were investigated for all variables of the Experience of Work and Life
Circumstances Questionnaire with the Penn State Worry Questionnaire, per gender grouping,
are as follows:
H0: �LOS,OWS.PSWQ = 0.00 or H0: �IWSOF-IWSRF.PSWQ = 0.00 H1: �LOS,OWS.PSWQ � 1.00 H1: �IWSOF-IWSRF.PSWQ � -1.00 H2: �LOS,OWS.PSWQ � -1.00 H2: �IWSOF-IWSRF.PSWQ � 1.00
Detailed relevant statistics are contained in Appendix B. Results of the main scales only will be
presented.
For both males and females, significant and positive correlations with the main scale, level of
stress (LOS) were noticed. The correlation for the former was 0.596 and for the latter 0.430.
For both males and females a consistent co-relationship was found for level of stress and worry.
The indicator level of stress correlated significantly with the variable worry. High levels of
201
perceived stress on this indicator co-related with high levels of worry and vice versa.
Throughout this indicator confirmed the alternative hypothesis H1.
9.5.2.5 Experience of Work and Life Circumstances Questionnaire with the Social Problem-
Solving Inventory-Revised
The next set of correlation analyses considered those Pearson correlation coefficients that were
derived from a comparison between each of the variables of the Experience of Work and Life
Circumstances Questionnaire and each of the variables of the Social Problem-Solving
Inventory-Revised (SPSIR), again being differentiated by gender (Appendix B). The three
hypotheses that were investigated for all variables of the Experience of Work and Life
Circumstances Questionnaire related to all the variables of the Social Problem-Solving
Inventory-Revised (SPSIR) for gender are as follows:
H0: �LOS,OWS.SPSIR = 0.00 or H0: �IWSOF-IWSRF.SPSIR = 0.00 H1: �LOS,OWS.SPSIR � 1.00 H1: �IWSOF-IWSRF.SPSIR � -1.00 H2: �LOS,OWS.SPSIR � -1.00 H2: �IWSOF-IWSRF.SPSIR � 1.00
The results of only the main scales will be presented while detailed relevant information is
available in Appendix B.
The level of stress (LOS) scores for both males and females correlated significantly but
negatively with social problem solving (SPS), with their respective correlations being -0.415 and
-0.248.
In the case of the males the main scale, namely social problem solving (SPS) for LOS was only
supported by four of the scales of the SPSIR, namely positive problem orientation (PPO),
negative problem orientation (NPO), impulsivity/carelessness style (ICS), and avoidance style
(AS).
In the case of both males and females a consistent co-relationship was found between the
indicator level of stress and social problem solving. This indicator correlated significantly with
social problem solving for both genders. Thus high levels of perceived stress on this indicator
co-related to low levels of social problem solving. Again this indicator confirmed the alternative
hypothesis H2.
202
9.5.3 Marital status
9.5.3.1 Experience of Work and Life Circumstances Questionnaire with the Aggression in the
Workplace Questionnaire
Statistical analyses of those Pearson correlation coefficients that were derived from the
association of each of the variables of the Experience of Work and Life Circumstances
Questionnaire with all of the variables of the Aggression in the Workplace Questionnaire, either
experienced or witnessed, were done for each marital status group (Appendix B). The three
hypotheses that were investigated for each of the variables of the Experience of Work and Life
Circumstances Questionnaire with all of the variables of the Aggression in the Workplace
Questionnaire (experienced and witnessed) for marital status are as follows:
H0: �WLQ.AWQ = 0.00 H1: �WLQ.AWQ � 1.00 H2: �WLQ.AWQ � -1.00
Appendix B once again contains further detailed information. The following discussion is limited
to the main scales only.
1) Experience of Work and Life Circumstances Questionnaire with the Aggression in the
Workplace Questionnaire-witnessed
The level of stress (LOS) scores for both the married and the non-married group correlated
significantly and positively with the witnessed total aggression (WTOT) scale of the Aggression
in the Workplace Questionnaire (AWQ). The corresponding correlation for the married group
was 0.313 and the non-married group called other was 0.633.
For both the married and the non-married groups all three subscales, namely witnessed
expressions of hostility (WEH), witnessed obstructionism (WOB), and witnessed overt
aggression (WOV) confirmed the observed trends arising from the association of the main scale
witnessed total aggression with the LOS scale.
In the case of the married and non-married subjects the indicator level of stress and witnessed
total aggression was the most consistent co-relationship. For both groups this indicator
correlated significantly with witnessed total aggression. High levels of perceived stress on this
indicator co-related with high levels of witnessed aggression in the workplace and vice versa.
The alternative hypothesis H1 was confirmed for this indicator.
203
2) Experience of Work and Life Circumstances Questionnaire with the Aggression in the
Workplace Questionnaire-experienced
Level of stress (LOS) correlated significantly and positively for both the married and non-
married subjects with the main scale, namely experienced total aggression (ETOT) of the AWQ.
The corresponding correlations were found to be 0.201 and 0.699 respectively.
The three subscales, namely experienced expressions of hostility (EEH), experienced
witnessed obstructionism (EOB), and experienced overt aggression (EOV) for both the married
group and the non-married group supported the main scale experienced total aggression
(ETOT) in the case of LOS.
In the case of both married and non-married subjects the indicator level of stress with
experienced total aggression produced the most consistent co-relation. The indicator level of
stress correlated significantly with experienced total aggression. High levels of perceived stress
on these indicators co-related to high levels of experienced aggression in the workplace and
vice versa. The alternative hypothesis H1 was confirmed in general for these indicators.
9.5.3.2 Experience of Work and Life Circumstances Questionnaire with the IPAT Anxiety Scale
Analyses of relevant Pearson correlation coefficients that were made available by each of the
comparisons between the variables of the Experience of Work and Life Circumstances
Questionnaire and each of the variables of the IPAT Anxiety Scale (IAS) were done for the
marital status groups (Appendix B). The three hypotheses that were invoked for each of the
variables of the Experience of Work and Life Circumstances Questionnaire with all of the
variables of the IPAT Anxiety Scale for marital status are as follows:
H0: �WLQ.IPAT = 0.00 H1: �WLQ.IPAT � 1.00 H2: �WLQ.IPAT � -1.00
As usual, a detailed set of additional information is contained in Appendix B. The results of only
the main scales will be explained in somewhat more detail.
Significant and positive correlations once again were obtained for both the married and non-
married groups when level of stress (LOS) was associated with the main scale, namely the total
anxiety score (TAS) of the IAS. The corresponding correlations were found to be 0.565 and
0.635 respectively.
204
The statistical association between the main scale and LOS was confirmed by all seven
subscales, namely factor -Q3, factor Q4, factor -C, factor L, factor O, Score A, and Sore B, for
both the married and non-marred subjects.
For both married and non-married subjects the indicators level of stress and total anxiety
produced the most consistent co-relationship. The indicator level of stress correlated
significantly with total anxiety. High levels of perceived stress on this indicator co-related with
high levels of total anxiety and vice versa. The alternative hypothesis H1 in general was
confirmed by this indicator.
9.5.3.3 Experience of Work and Life Circumstances Questionnaire with the Beck Depression
Inventory
Further correlation analyses of the Pearson correlation coefficients were done for each of the
variables of the Experience of Work and Life Circumstances Questionnaire with the Beck
Depression Inventory (BDI). Analyses were obtained for each marital status group (Appendix
B). The three hypotheses that were investigated for all variables of the Experience of Work and
Life Circumstances Questionnaire with the Beck Depression Inventory for marital status are as
follows:
H0: �WLQ.BDI = 0.00 H1: �WLQ.BDI � 1.00 H2: �WLQ.BDI � -1.00
Further detailed information is presented in Appendix B. Accordingly, only the results of the
main scales will be presented here.
For both the married and non-married groups significant and positive correlations were obtained
for level of stress (LOS) and depression. The corresponding correlations were found to be 0.612
and 0.757 respectively.
For both the married and non-married subjects the most consistent co-relationship was found
between level of stress and depression. This indicator correlated significantly with depression.
Again high levels of perceived stress on this indicator co-related to high levels of depression
and vice versa. The indicator confirmed the alternative hypothesis H1.
205
9.5.3.4 Experience of Work and Life Circumstances Questionnaire with the Penn State Worry
Questionnaire
The following correlation analyses of the Pearson correlation coefficients focused on the co-
relation between each of the variables of the Experience of Work and Life Circumstances
Questionnaire and the Penn State Worry Questionnaire (PSWQ), done for each marital status
group (Appendix B). The three hypotheses that were investigated for all variables of the
Experience of Work and Life Circumstances Questionnaire with the Penn State Worry
Questionnaire for marital status are as follows:
H0: �WLQ.WORRY = 0.00 H1: �WLQ.WORRY � 1.00 H2: �WLQ.WORRY � -1.00
The reader is referred to Appendix B for detailed information. In the next section the focus will
be on the results of only the main scales.
Once again significant and positive correlations for both marital status groups were found for
level of stress (LOS) (OWS) and worry. The respective correlations were 0.425 for the married
group and 0.695 for the non-married group.
Again the most consistent co-relationship was obtained for level of stress with worry for both the
married and non-married subjects. This indicator correlated significantly with worry. High levels
of perceived stress on this indicator co-related to high levels of worry and vice versa. The
alternative hypothesis H1 was thus confirmed for this indicator.
9.5.3.5 Experience of Work and Life Circumstances Questionnaire with the Social Problem-
Solving Inventory-Revised
Correlation analyses of the Pearson correlation coefficients derived for each of the variables of
the Experience of Work and Life Circumstances Questionnaire and each of the variables of the
Social Problem-Solving Inventory-Revised (SPSIR) were done per marital status group
(Appendix B). The three hypotheses that were investigated for all variables of the Experience of
Work and Life Circumstances Questionnaire with all the variables of the Social Problem-Solving
Inventory-Revised (SPSIR) for marital status are as follows:
H0: �WLQ.SPSIR = 0.00 H1: �WLQ.SPSIR � 1.00 H2: �WLQ.SPSIR � -1.00
The reader will find relevant detailed information analysis in Appendix B. Here only the results
of the main scales will be presented.
206
For both marital status groups level of stress (LOS) correlated significantly but negatively with
the main scale social problem solving (SPS). The corresponding correlation for the married
group was -0.298 and that for the non-married group -0.426.
In the case of the married group, level of stress (LOS) correlated with four of the seven scales
and subscales, namely positive problem orientation (PPO), negative problem orientation (NPO),
impulsivity/carelessness style (ICS), and avoidance style (AS). For the non-married group the
main LOS scale co-varied with three of the nine scales and subscales, namely positive problem
orientation (PPO), negative problem orientation (NPO), and avoidance style (AS).
Regarding both the married and non-married subjects the most consistent co-relationships were
found for level of stress and social problem solving. This indicator also correlated significantly
with social problem solving. High levels of perceived stress on these indicators co-related to low
levels of social problem solving and vice versa. The alternative hypothesis H2 was confirmed in
general for this indicator.
9.5.4 Age groups
9.5.4.1 Experience of Work and Life Circumstances Questionnaire with the Aggression in the
Workplace Questionnaire
Correlation analyses of the Pearson correlation coefficients for each of the variables of the
Experience of Work and Life Circumstances Questionnaire associated with all of the variables
of the Aggression in the Workplace Questionnaire (both experienced and witnessed) were
undertaken for each of the four age groups (Appendix B). The three hypotheses that were
postulated for all variables of the Experience of Work and Life Circumstances Questionnaire
compared to all the variables of the Workplace Questionnaire (both experienced and
witnessed), for the four age groups are as follows:
H0: �LOS,OWS.AWQ = 0.00 or H0: �IWSOF-IWSRF.AWQ = 0.00 H1: �LOS,OWS.AWQ � 1.00 H1: �IWSOF-IWSRF.AWQ � -1.00 H2: �LOS,OWS.AWQ � -1.00 H2: �IWSOF-IWSRF.AWQ � 1.00
Once again detailed statistical information is provided in Appendix B. Discussion of results will
be limited to the main scales.
1) Experience of Work and Life Circumstances Questionnaire with the Aggression in the
Workplace Questionnaire-witnessed
The level of stress (LOS) scores for subjects belonging to the age group 20-29 and 40-49 did
not correlate significantly with the witnessed total aggression (WTOT) scale of the AWQ. For the
207
age group 30-39 and 50 years or older a significant and positive correlation was obtained with
witnessed total aggression (WTOT), namely 0.531 and 0.425 respectively. In both cases WTOT
was supported by the three subscales, namely witnessed expressions of hostility (WEH),
witnessed obstructionism (WOB), and witnessed overt aggression (WOV).
For the 20-29 and 40-49 year old subjects no significant correlation occurred between the
indicators level of stress and witnessed total aggression. Associated levels of stress for both
age groups generally confirmed the null hypothesis.
The most consistent co-relationships were found for the age groups 30-39 and 50 years or older
for the indicator level of stress with witnessed total aggression in the workplace. This indicator,
namely level of stress correlated significantly with witnessed total aggression in the workplace.
Again high levels of perceived stress co-related to high levels of witnessed aggression in the
workplace and vice versa. Thus this indicator once again confirmed the alternative hypothesis
H1.
2) Experience of Work and Life Circumstances Questionnaire with the Aggression in the
Workplace Questionnaire-experienced
For the age group 20-29 and 30-39 level of stress (LOS) scores correlated significantly and
positively with experienced total aggression (ETOT) of the AWQ with the correlations being
0.572 for the former and 0.522 for the latter. In both analyses all three subscales, namely
experienced expression of hostility (EEH), experienced obstructionism (EOB), and experienced
overt aggression (EOV) confirmed the trends of the main scale. However for the age group 40-
49 and 50 years or older no significant correlations could be traced.
For the age group 20-29 and 30-39 correlations between the indicator level of stress and
experienced total aggression were the most consistent co-relationships. This indicator also
correlated significantly with experienced total aggression in the workplace. High levels of stress
on this indicator co-related to high levels of experienced aggression in the workplace and vice
versa thus confirming the alternative hypothesis H1.
Regarding the 40-49 year old and 50 years or older subjects, no significant correlation between
the two main scales LOS and ETOT was obtained. In this case level of stress generally
confirmed the null hypothesis.
208
9.5.4.2 Experience of Work and Life Circumstances Questionnaire with the IPAT Anxiety Scale
Analyses of relevant Pearson correlation coefficients for each of the variables of the Experience
of Work and Life Circumstances Questionnaire associated with the each of the variables of the
IPAT Anxiety Scale (IAS) were done for each age grouping (refer to Appendix B). The three
hypotheses that were investigated for each of the variables of the Experience of Work and Life
Circumstances Questionnaire associated with all of the variables of the IPAT Anxiety Scale per
age groups are as follows:
H0: �LOS,OWS.IPAT = 0.00 or H0: �IWSOF-IWSRF.IPAT = 0.00 H1: �LOS,OWS.IPAT � 1.00 H1: �IWSOF-IWSRF.IPAT � -1.00 H2: �LOS,OWS.IPAT � -1.00 H2: �IWSOF-IWSRF.IPAT � 1.00
Detailed correlation coefficients appear in Appendix B. Hence only the results of only the main
scales will be presented.
The level of stress (LOS) scores for the age groups 20-29, 30-39, 40-49, and 50 years or older
correlated significantly and positively with the main scale, namely the total anxiety score (TAS)
of the IAS producing corresponding correlations of 0.529, 0.554, 0.623, and 0.608 respectively.
The main scale was supported by all of the subscales, namely factor -Q3, factor Q4, factor -C,
factor L, factor O, Score A, and Score B in the case of the second and third age groups. In the
case of the first age group it was supported only by five of the seven, namely factor -Q3, factor
Q4, factor O, Score A, and Score B for the first age group and by six of the seven subscales,
namely factor -Q3, factor Q4, factor -C, factor O, Score A, and Score B.
The most consistent co-relationship was obtained for level of stress associated with total anxiety
for each of the four age groups, namely 20-29, 30-39, 40-49, and 50 years or older. The
indicator level of stress for all four age groups correlated significantly with the scale total
anxiety. High levels of stress on this indicator co-related to high levels of total anxiety and vice
versa thus confirming the alternative hypothesis H1.
9.5.4.3 Experience of Work and Life Circumstances Questionnaire with the Beck Depression
Inventory
Correlation analyses of appropriate Pearson correlation coefficients derived from the
association between each of the variables of the Experience of Work and Life Circumstances
Questionnaire and the Beck Depression Inventory (BDI) were done for each of the four age
groups (Appendix B). The three hypotheses that were investigated for all variables of the
Experience of Work and Life Circumstances Questionnaire with the Beck Depression Inventory
for the age groups are as follows:
209
H0: �WLQ.BDI = 0.00 H1: �WLQ.BDI � 1.00 H2: �WLQ.BDI � -1.00
The reader will find further detailed information in Appendix B. Only the results of the main
scales will be presented here.
For all four age groups, namely 20-29, 30-39, 40-49, and 50 years or older a significant and
positive correlation was found for level of stress (LOS) and the depression scale of the Beck
Depression Inventory (BDI). The respective correlations for the four age groups were 0.649,
0.674, 0.627, and 0.754.
The most consistent co-relationship was delineated for level of stress and depression for
subjects from the age groups 20-29, 30-39, 40-49, and 50 years or older. This indicator also
correlated significantly with depression. High levels of stress on this indicator co-related to high
levels of depression and vice versa thus confirming the alternative hypothesis H1.
9.5.4.4 Experience of Work and Life Circumstances Questionnaire with the Penn State Worry
Questionnaire
Correlation analyses deriving the Pearson Correlation Coefficients for each of the variables of
the Experience of Work and Life Circumstances Questionnaire with the Penn State Worry
Questionnaire (PSWQ) were obtained for the four age groups (Appendix B). The three
hypotheses that were investigated for all variables of the Experience of Work and Life
Circumstances Questionnaire with the Penn State Worry Questionnaire for the age groups are
as follows:
H0: �WLQ.WORRY = 0.00 H1: �WLQ.WORRY � 1.00 H2: �WLQ.WORRY � -1.00
For a detailed analysis the reader is referred to Appendix B as the results of only the main
scales will be presented.
For the subjects’ belonging to the four age groups, namely 20-29, 30-39, 40-49, and 50 years or
older a significant and positive correlation was obtained for their level of stress (LOS) scores.
Their corresponding correlations were found to be 0.615, 0.498, 0.447, and 0.626 respectively.
Again the most consistent co-relationships were delineated for the age group 20-29, 30-39, 40-
49, and 50 years or older for level of stress with worry. Once again these indicators correlated
210
significantly with worry. High levels of stress on any indicator co-related to high levels of worry
and vice versa thus confirming the alternative hypothesis H1.
9.5.4.5 Experience of Work and Life Circumstances Questionnaire with the Social Problem-
Solving Inventory-Revised
Correlation analyses of the Pearson correlation coefficients for each of the variables of the
Experience of Work and Life Circumstances Questionnaire being associated with each of the
variables of the Social Problem-Solving Inventory-Revised (SPSIR) were done for the four age
groups (Appendix B). The three hypotheses that were studied for all variables of the Experience
of Work and Life Circumstances Questionnaire co-related with all the variables of the Social
Problem-Solving Inventory-Revised (SPSIR) for the different age groups are as follows:
H0: �WLQ.SPSIR = 0.00 H1: �WLQ.SPSIR � 1.00 H2: �WLQ.SPSIR � -1.00
Detailed statistical information is included in Appendix B. The results of the main scales will be
highlighted.
Level of stress (LOS) correlated significantly but negatively with the social problem solving
(SPS) scale of the SPSIR with regard to the age groups 30-39 and 40-49, the respective values
being -0.302 and -0.432. The main scale for the former was supported by three of the nine
scales and subscales, namely negative problem orientation (NPO), impulsivity/carelessness
style (ICS), and avoidance style (AS) and for the latter by four, namely positive problem
orientation (PPO), negative problem orientation (NPO), problem definition and formulation
(PDF), and impulsivity/carelessness style (ICS).
No significant correlations were observed for the age groups 20-29 and 50 years or older.
Likewise, for these two age groups no significant correlations were found between the main
scale SPS and level of stress thus generally confirming the null hypothesis.
In the case of the 30-39 and 40-49 year old subjects’ the indicator level of stress, when
associated with social problem solving, produced the most consistent co-relationship.
Furthermore this indicator correlated significantly with social problem solving. High levels of
perceived stress on this indicator co-related to low levels of social problem solving and vice
versa. They thus confirmed the alternative hypothesis H2.
211
9.5.5 Organization groupings
9.5.5.1 Experience of Work and Life Circumstances Questionnaire with the Aggression in
the Workplace Questionnaire
Correlation analyses next targeted the Pearson correlation coefficients between each of the
variables of the Experience of Work and Life Circumstances Questionnaire and all of the
variables of the Aggression in the Workplace Questionnaire (experienced and witnessed) and
differentiated for each type of organization grouping (Appendix B). The three hypotheses that
were investigated for all variables of the Experience of Work and Life Circumstances
Questionnaire with all the variables of the Workplace Questionnaire-experienced and
-witnessed for type of organization grouping are as follows:
H0: �WLQ.AWQ = 0.00 H1: �WLQ.AWQ � 1.00 H2: �WLQ.AWQ � -1.00
As usual detailed statistical data is presented in Appendix B. Hence, only the results of the
main scales will be presented.
1) Experience of Work and Life Circumstances Questionnaire with the Aggression in the
Workplace Questionnaire-witnessed
From the results it can be seen that for both production/services organizations and
academic/auxiliary service groupings the level of stress (LOS) scores of the subjects correlated
significantly and positively with the main scale, namely witnessed total aggression (WTOT) of
the AWQ. The respective correlation coefficients were found to be 0.406 and 0.652. The main
scale trends in both cases were supported by all three subscales, namely witnessed
expressions of hostility (WEH), witnessed obstructionism (WOB), and witnessed overt
aggression (WOV). No significant correlations were obtained for the remaining two types of
organization groupings.
For both financial and research and development organizations level of stress did not correlate
significantly with witnessed total aggression. In this instance, the indicator level of stress
therefore confirmed the null hypothesis.
Regarding production/services and academic/auxiliary services organizations the most
consistent co-relationships were obtained for level of stress and witnessed total aggression. The
indicator level of stress correlated again significantly with witnessed total aggression. High
levels of perceived stress on this indicator co-related to high levels of witnessed aggression in
212
the workplace and vice versa. The alternative hypothesis H1 was again confirmed in general for
this indicator.
2) Experience of Work and Life Circumstances Questionnaire with the Aggression in the
Workplace Questionnaire-experienced
In the case of the financial, production/services, and academic/auxiliary services organization
groupings, level of stress (LOS) correlated significantly and positively with the main AWQ scale,
namely experienced total aggression (ETOT). The respective correlations were found to be
0.364, 0.354, and 0.283. The main scale trend for the first organization grouping was supported
by experience expressions of hostility (EEH) and experienced overt aggression (EOV), for the
second organization grouping by EEH and experienced obstructionism (EOB), and for the third
organization grouping by all three subscales. No significant correlation could be delineated for
research and development organizations.
For financial, production/services as well as academic/auxiliary organizations the most
consistent co-relationship was found between level of stress and experienced total aggression.
Again the indicator level of stress correlated significantly with experienced total aggression.
High levels of perceived stress on this indicator co-related to high levels of experienced
aggression in the workplace and vice versa. The alternative hypothesis H1 was confirmed in
general for this indicator.
Only in the case of research and development organizations was no significant correlation with
level of stress found. Thus the indicator level of stress generally confirmed the null hypothesis.
9.5.5.2 Experience of Work and Life Circumstances Questionnaire with the IPAT Anxiety Scale
Correlation analyses next focused on those Pearson correlation coefficients calculated for each
of the variables of the Experience of Work and Life Circumstances Questionnaire and each of
the variables of the IPAT Anxiety Scale (IAS), done for each type of organization grouping
(Appendix B). The three hypotheses that were investigated for each of the variables of the
Experience of Work and Life Circumstances Questionnaire with all of the variables of the IPAT
Anxiety Scale for type of organization grouping are as follows:
H0: �WLQ.IPAT = 0.00 H1: �WLQ.IPAT � 1.00 H2: �WLQ.IPAT � -1.00
The contents of Appendix B provide detailed information relevant to theses analyses. Once
again the results of only the main scales will be presented.

213
Level of stress (LOS) correlated significantly and positively with the total anxiety score (TAS) of
the IAS main scale, the conclusion holding for all four organization groupings, namely financial
(r = 0.717), production/services (r = 0.660), research and development (r = 0.451), and
academic/auxiliary organizations (r = 0.434). The main scale in the first and second case was
supported by all seven IAS subscales, namely factor -Q3, factor Q4, factor -C, factor L, factor O,
Score A, and Sore B. For the third organization grouping LOS co-related with six of the seven
IAS subscales, namely factor -Q3, factor Q4, factor -C, factor O, Score A, and Sore B and in the
last case by five of the seven subscales, namely factor Q4, factor -C, factor O, Score A, and
Sore B.
For financial, production/services, research and development, and academic/auxiliary services
organizations the most consistent co-relationship was found between level of stress and total
anxiety. The indicator level of stress correlated significantly with total anxiety. High levels of
perceived stress on this indicator co-related to high levels of total anxiety and vice versa. The
alternative hypothesis H1 was confirmed in general for this indicator.
9.5.5.3 Experience of Work and Life Circumstances Questionnaire with the Beck Depression
Inventory
Correlation analyses of the Pearson correlation coefficients between on the one hand each of
the variables of the Experience of Work and Life Circumstances Questionnaire and on the other
hand the Beck Depression Inventory (BDI) followed next done separately for each type of
organization grouping (Appendix B). The three hypotheses that were investigated for all
variables of the Experience of Work and Life Circumstances Questionnaire with the Beck
Depression Inventory for type of organization grouping are as follows:
H0: �WLQ.BDI = 0.00 H1: �WLQ.BDI � 1.00 H2: �WLQ.BDI � -1.00
For a detailed analysis the reader is referred to Appendix B as the results of only the main
scales will be presented.
A significant and positive correlation was obtained between level of stress (LOS) and
depression, as measured by the Beck Depression Inventory (BDI), for all four types of
organization groupings. The respective correlations were for financial organizations 0.738,
production/services organizations 0.701, research and development organizations 0.498, and
academic/auxiliary services organizations 0.619.
214
The most consistent co-relationships between level of stress and depression were observed
with regard to financial, production/services, research and development, as well as
academic/auxiliary services organizations. Again the indicator level of stress correlated
significantly with depression. High levels of perceived stress on this indicator co-related to high
levels of depression and vice versa. The alternative hypothesis H1 was again confirmed in
general for this indicator.
9.5.5.4 Experience of Work and Life Circumstances Questionnaire with the Penn State Worry
Questionnaire
Correlation analyses based on the Pearson correlation coefficients obtained for each of the
variables of the Experience of Work and Life Circumstances Questionnaire with the Penn State
Worry Questionnaire (PSWQ), were done next by type of organization grouping (Appendix B).
The three hypotheses that were investigated considered the co-variation between all variables
of the Experience of Work and Life Circumstances Questionnaire and the Penn State Worry
Questionnaire per type of organization grouping and are as follows:
H0: �WLQ.WORRY = 0.00 H1: �WLQ.WORRY � 1.00 H2: �WLQ.WORRY � -1.00
The reader might peruse Appendix B for more detailed information. Here the focus will be on
the results of the main scales.
The subjects’ level of stress (LOS) scores correlated significantly and positively with worry as
measured by the Penn State Worry Questionnaire (PSWQ) for all four types of organization
groupings, namely financial (r = 0.452), production/services (r = 0.587), research and
development (r = 0.485), and academic/auxiliary services organizations (r = 0.488).
In the case of financial, production/services, research and development, and academic/auxiliary
services organizations the most consistent co-relationship with worry appeared to be the level of
stress. The indicator level of stress correlated significantly with worry. High levels of perceived
stress on this indicator co-related to high levels of worry and vice versa. The alternative
hypothesis H1 was confirmed in general for this indicator.
9.5.5.5 Experience of Work and Life Circumstances Questionnaire with the Social Problem-
Solving Inventory-Revised
Correlation analyses next were directed at the Pearson correlation coefficients relating to each
of the variables of the Experience of Work and Life Circumstances Questionnaire and all the
215
variables of the Social Problem-Solving Inventory-Revised (SPSIR), once again done per type
of organization grouping (Appendix B). The three hypotheses that were investigated for all
variables of the Experience of Work and Life Circumstances Questionnaire and the Social
Problem-Solving Inventory-Revised (SPSIR) by type of organization grouping are as follows:
H0: �WLQ.SPSIR = 0.00 H1: �WLQ.SPSIR � 1.00 H2: �WLQ.SPSIR � -1.00
The reader will find more detailed information in Appendix B. Thus only the results of the main
scales will be discussed here.
The subjects’ level of stress (LOS) scores correlated significantly but negatively with the main
scale of the SPSIR, namely social problem solving (SPS) but for only financial (r = -0.530) and
production/services organizations (r = -0.449). In the former case the main scale supported by
eight of the nine subscales, namely positive problem orientation (PPO), negative problem
orientation (NPO), rational problem solving (RPS), problem definition and formulation (PDF),
generation of alternatives (GA), decision making (DM), impulsivity/carelessness style (ICS), and
avoidance style (AS) and for the latter case by four scales and subscales of the SPSIR, namely
positive problem orientation (PPO), negative problem orientation (NPO),
impulsivity/carelessness style (ICS), and avoidance style (AS). No significant correlations could
be found for research and development and academic/auxiliary services organizations.
Regarding financial and production/services organizations the most consistent co-relationship
was found for level of stress associated with social problem solving. The indicator level of stress
correlated significantly with social problem solving. High levels of perceived stress on this
indicator co-related to low levels of social problem solving and vice versa. The alternative
hypothesis H2 was confirmed in general for this indicator.
In the case of research and development academic/auxiliary services organizations no
significant co-relationships were found. The indicator level of stress generally confirmed the null
hypothesis for both organization groupings.
9.5.6 Qualification groupings
9.5.6.1 Experience of Work and Life Circumstances Questionnaire with the Aggression in
the Workplace Questionnaire
Correlation analyses were also done on the Pearson correlation coefficients derived for each of
the variables of the Experience of Work and Life Circumstances Questionnaire compared with

216
all of the variables of the Aggression in the Workplace Questionnaire (both experienced and
witnessed), in this case for each the five qualification groupings (Appendix B). The three
hypotheses that were investigated for all variables of the Experience of Work and Life
Circumstances Questionnaire with all variables of the Aggression in the Workplace
Questionnaire (experienced and witnessed) for each of the five qualification groupings are as
follows:
H0: �WLQ.AWQ = 0.00 H1: �WLQ.AWQ � 1.00 H2: �WLQ.AWQ � -1.00
Detailed information is once more provided in Appendix B. Only the results of the main scales
will be presented.
1) Experience of Work and Life Circumstances Questionnaire with the Aggression in the
Workplace Questionnaire-witnessed
From the results it can be seen that the subjects’ level of stress (LOS) scores correlated
significantly and positively with their scores on the AWQ, namely for witnessed total aggression
(WTOT) for all subjects with Grade 12 or lower (r = 0.366), all holders of Diplomas (r = 0.359),
Honours or equivalent degrees (r = 0.587), and Masters or Doctoral degrees (r = 0.393). For
subjects with Grade 12 or lower or Honours or equivalent degrees, the main scale correlations
were supported by all three subscales, namely witnessed expressions of hostility (WEH),
witnessed obstructionism (WOB), and witnessed overt aggression (WOV). In the case of all
subjects with Diplomas the main scale trend was supported by only WOB and for those with
Masters or Doctoral degrees by WEH and WOV. No significant correlations with LOS were at all
found for recipients of Bachelors degrees.
For subjects with Grade 12 or lower, holders of Diplomas, Honours or equivalent degrees, and
for graduates with Masters or Doctoral degrees the most consistent co-relationship was found
for level of stress when associated with witnessed total aggression. The indicator level of stress
correlated significantly with witnessed total aggression. High levels of perceived stress on these
indicators co-related to high levels of witnessed aggression in the workplace and vice versa.
The alternative hypothesis H1 was confirmed in general for this indicator.
In the case of holders of Bachelors degrees no significant co-relationship was obtained. The
indicator level of stress generally confirmed the null hypothesis.
217
2) Experience of Work and Life Circumstances Questionnaire with the Aggression in the
Workplace Questionnaire-experienced
The subjects’ level of stress (LOS) scores correlated significantly and positively with their scores
on the main scale of the AWQ, namely witnessed total aggression (WTOT). The
aforementioned conclusion held for all subjects with Grade 12 or lower (r = 0.378), those with
Honours or equivalent degrees (r = 0.650), and for those with Masters or Doctoral degrees (r =
0.379). The main scale trend was supported by all three subscales, namely witnessed
expressions of hostility (WEH), witnessed obstructionism (WOB), and witnessed overt
aggression (WOV) in the case of subjects with Honours or equivalent degrees and holders of
Masters or Doctoral degrees. In the case of subjects who had achieved Grade 12 or lower, the
observed trend was supported by EEH and EOB. No significant correlations with LOS were
obtained for holders of Diplomas or Bachelors degrees.
For those participants with Grade 12 or lower, Honours or equivalent degrees, or Masters or
Doctoral degrees the most consistent co-relationship was found for level of stress when
associated with experienced total aggression. The indicator level of stress correlated
significantly with experienced total aggression. High levels of perceived stress on this indicator
co-related to high levels of experience aggression in the workplace and vice versa. The
alternative hypothesis H1 was confirmed in general for this indicator.
In the case of all Diplomas and all Bachelors degrees no significant co-relationship was
delineated. The indicator level of stress generally confirmed the null hypothesis.
9.5.6.2 Experience of Work and Life Circumstances Questionnaire with the IPAT Anxiety Scale
Correlation analyses aimed at the Pearson correlation coefficients that were obtained when
comparing the variables of the Experience of Work and Life Circumstances Questionnaire with
all the variables of the IPAT Anxiety Scale (IAS) were done for each qualification grouping
(Appendix B). The three hypotheses that were investigated for each of the variables of the
Experience of Work and Life Circumstances Questionnaire with all of the variables of the IPAT
Anxiety Scale for qualification grouping are as follows:
H0: �WLQ.IPAT = 0.00 H1: �WLQ.IPAT � 1.00 H2: �WLQ.IPAT � -1.00
Appendix B once again contains relevant detailed information. The discussion hereafter will be
limited to the results of the main scales.
218
Once more the subjects’ level of stress (LOS) scores correlated significantly and positively with
their total anxiety scores on the IAS, an assumption holding for all five qualification groupings,
namely for those with Grade 12 or lower (r = 0.740), Diplomas (r = 0.597), Bachelor degrees (r =
0.582), Honours or equivalent degrees (r = 0.564), and Masters or Doctoral degrees (r = 0.447).
In the case of subjects with grade 12 or lower the main scale trend was supported by all seven
of the subscales of the IAS, namely factor -Q3, factor Q4, factor -C, factor L, factor O, Score A,
and Sore B. For all holders of Diplomas, Honours or equivalent degrees, and Masters or
Doctoral degrees the trend was supported by six of the seven subscales excluding factor -C for
the first grouping, factor -Q3 for the second grouping, and factor L for the last grouping. In the
case of subjects with Bachelor degrees the main scale was supported by five of the subscales,
namely factor Q4, factor -C, factor O, Score A, and Sore B.
The most consistent co-relationship for all five qualification groupings, namely persons with
Grade 12 or lower, Diplomas, Bachelors degrees, Honours or equivalent degrees, and Masters
or Doctoral degrees was found when level of stress was associated with total anxiety. The
indicator level of stress correlated significantly with total anxiety. High levels of perceived stress
on this indicator co-related to high levels of total anxiety and vice versa. The alternative
hypothesis H1 was confirmed in general for this indicator.
9.5.6.3 Experience of Work and Life Circumstances Questionnaire with the Beck Depression
Inventory
The following correlation analyses centred on Pearson correlation coefficients that were
calculated for each of the variables of the Experience of Work and Life Circumstances
Questionnaire related to the Beck Depression Inventory (BDI), and were done for each
qualification grouping (Appendix B). The three hypotheses that were investigated for all
comparisons involving the variables of the Experience of Work and Life Circumstances
Questionnaire and the Beck Depression Inventory for the qualification groupings are as follows:
H0: �WLQ.BDI = 0.00 H1: �WLQ.BDI � 1.00 H2: �WLQ.BDI � -1.00
Further detailed information appears in Appendix B. As a result only the effect of the main
scales will be presented.
Also in this case the subjects’ level of stress (LOS) scores did correlate significantly and
positively for all five qualification groupings, namely for subjects with Grade 12 or lower (r =
0.773, all holders of Diplomas (r = 0.757), Bachelor degrees (r = 0.439), Honours or equivalent
degrees (r = 606), and Masters or Doctoral degrees (r = 0.614).
219
The most consistent co-relationship with depression was found for level of stress: this also held
for all five qualification groupings, namely subjects with Grade 12 or lower, holders of Diplomas,
Bachelors degrees, Honours or equivalent degrees, and for those with Masters or Doctoral
degrees. The indicator level of stress correlated significantly with depression. High levels of
perceived stress on this indicator co-related to high levels of depression and vice versa. The
alternative hypothesis H1 was confirmed in general for this indicator.
9.5.6.4 Experience of Work and Life Circumstances Questionnaire with the Penn State Worry
Questionnaire
Correlation analyses were done by means of the Pearson correlation coefficients that resulted
for the association of each of the variables of the Experience of Work and Life Circumstances
Questionnaire with the Penn State Worry Questionnaire (PSWQ) and were undertaken per
qualification grouping (Appendix B). The three hypotheses that were investigated by associating
all variables of the Experience of Work and Life Circumstances Questionnaire with the Penn
State Worry Questionnaire, done for each qualification grouping, are as follows:
H0: �WLQ.WORRY = 0.00 H1: �WLQ.WORRY � 1.00 H2: �WLQ.WORRY � -1.00
The reader will once more find detailed information in Appendix B. Here the results of only the
main scales will be presented.
The subjects’ level of stress scores correlated significantly and positively with worry for four of
the five qualification groupings, namely for participants with Grade 12 or lower (r = 0.601,
Diplomas (r = 0.508), Honours or equivalent degrees (r = 0.590), and Masters or Doctoral
degrees (r = 0.531). Only in the case of graduates with Bachelor degrees no significant
correlations were obtained.
The most consistent co-relationship with worry was found for level of stress, a trend that held for
four of the five qualification groupings, namely for those with Grade 12 or lower, Diplomas,
Honours or equivalent degrees, and Masters or Doctoral degrees. The indicator level of stress
noticeably correlated with worry. High levels of perceived stress on this indicator co-related to
high levels of worry and vice versa. The alternative hypothesis H1 in general was confirmed in
general for this indicator. However in the case of persons with Bachelors degrees no significant
correlation with the indicator level of stress was found. Thus for this qualification grouping the
null hypothesis was confirmed.
220
9.5.6.5 Experience of Work and Life Circumstances Questionnaire with the Social Problem-
Solving Inventory-Revised
Correlation analyses of all Pearson correlation coefficients derived from the comparison of all
the variables of the Experience of Work and Life Circumstances Questionnaire with every
variable of the Social Problem-Solving Inventory-Revised (SPSIR) were done next per
qualification grouping (Appendix B). The three hypotheses that were investigated for all
variables of the Experience of Work and Life Circumstances Questionnaire with all the variables
of the Social Problem-Solving Inventory-Revised (SPSIR) for qualification grouping are as
follows:
H0: �WLQ.SPSIR = 0.00 H1: �WLQ.SPSIR � 1.00 H2: �WLQ.SPSIR � -1.00
More detailed information appears in Appendix B. Hence only the results of the main scales will
be presented.
The subjects’ level of stress (LOS) scores correlated significantly but negatively with their
scores on the main scale of SPSIR, namely social problem solving (SPS), but only for subjects
with Grade 12 or lower (r = -0.614) or Masters or Doctoral degrees (r = -0.313). The remaining
qualification groupings did not produce significant correlations. For participants with Grade 12
or lower, the main scale trend was supported by all nine scales and subscales of the SPSIR,
namely positive problem orientation (PPO), negative problem orientation (NPO), rational
problem solving (RPS), problem definition and formulation (PDF), generation of alternatives
(GA), decision making (DM), solution implementation and verification (SIV),
impulsivity/carelessness style (ICS), as well as avoidance style (AS). In the case of participants
with Masters or Doctoral degrees the trend was supported by only three of the scales and
subscales, namely positive problem orientation (PPO), negative problem orientation (NPO), and
avoidance style (AS).
The most consistent co-relationship with level of stress was found for social problem solving but
for only two of the five qualification groupings, namely subjects with Grade 12 or less or Masters
or Doctoral degrees. The indicator level of stress correlated significantly with social problem
solving. High levels of perceived stress on this indicator co-related with low levels of social
problem solving and vice versa. In general the alternative hypothesis H1 was confirmed for this
indicator. However in the case of all participants with Diplomas, Bachelors degrees, or Honours
or equivalent degrees, no significant correlation with the indicator level of stress was found.
Thus for these three qualification groupings the null hypothesis was confirmed.
221
9.5.7 Position levels
9.5.7.1 Experience of Work and Life Circumstances Questionnaire with the Aggression in
the Workplace Questionnaire
Correlation analyses of relevant Pearson correlation coefficients arising from the comparisons
of each of the variables of the Experience of Work and Life Circumstances Questionnaire with
those of the Aggression in the Workplace Questionnaire, for both experienced and witnessed
aggression, were done for each of the three position levels (Appendix B). The three hypotheses
that were investigated for all variables of the Experience of Work and Life Circumstances
Questionnaire with all the variables of the Workplace Questionnaire-experienced and
-witnessed for the three position levels are as follows:
H0: �WLQ.AWQ = 0.00 H1: �WLQ.AWQ � 1.00 H2: �WLQ.AWQ � -1.00
More detailed statistical information appears in Appendix B. Here the results of the main scales
will be presented.
1) Experience of Work and Life Circumstances Questionnaire with the Aggression in the
Workplace Questionnaire-witnessed
Level of stress (LOS) scores of the subjects’ correlated significantly and positively with their
witnessed total aggression scores (WTOT) on the AWQ, a trend that held for all three position
levels, namely senior management (r = 0.335), middle management (r = 0.484), and specialist
staff (r = 0.387). For participants from senior management, middle management as well as
specialist staff, the main scale WTOT was supported by all three of the subscales of the AWQ,
namely witnessed expression of hostility (WEH), witnessed obstructionism (WOB), and
witnessed overt aggression (WOB).
For all three position levels, namely senior management, middle management, and specialist
staff the most consistent co-relationship with level of stress was found for witnessed total
aggression. The indicator level of stress correlated significantly. High levels of perceived stress
on this indicator co-related to high levels of witnessed aggression in the workplace and vice
versa. The alternative hypothesis H1 was confirmed in general for this indicator.
222
2) Experience of Work and Life Circumstances Questionnaire with the Aggression in the
Workplace Questionnaire-experienced
The subjects’ level of stress (LOS) scores correlated significantly and positively with their
experienced total aggression (ETOT), as measured by the AWQ, producing coefficients of
0.549 in the case of middle management, and 0.356 in the case of specialist staff. No
significant correlation was delineated for senior management.
The main scale ETOT for both middle management and specialist staff was supported by two of
the three subscales of the AWQ, namely witnessed expression of hostility (WEH) and witnessed
obstructionism (WOB).
Again the most consistent co-relationship was found for level of stress but only for those from
the middle management level and among specialist staff. The indicator level of stress correlated
significantly with experienced total aggression. High levels of perceived stress on this indicator
co-related to high levels of experienced aggression in the workplace and vice versa. In the case
of middle management and specialist staff the alternative hypothesis H1 was confirmed in
general for this indicator. Senior management on the other hand did not correlate significantly
with the indicator level of stress thus confirming the null hypothesis.
9.5.7.2 Experience of Work and Life Circumstances Questionnaire with the IPAT Anxiety Scale
Correlation analyses based on Pearson correlation coefficients pertaining to each of the
variables of the Experience of Work and Life Circumstances Questionnaire and those of the
IPAT Anxiety Scale (IAS) were done once again for each individual position level (Appendix B).
The three hypotheses that were investigated for each of the variables of the Experience of Work
and Life Circumstances Questionnaire with all of the variables of the IPAT Anxiety Scale for the
three position levels are as follows:
H0: �WLQ.IPAT = 0.00 H1: �WLQ.IPAT � 1.00 H2: �WLQ.IPAT � -1.00
The reader is referred to Appendix B for more detailed information. Here the results of only the
main scales will be highlighted.
A significant and positive correlation was obtained for level of stress with the total anxiety score
of the IAS for the three position levels, namely senior management (r = 0.611), middle
management (r = 0.504), and specialist staff (r = 0.610).

223
The main scale for both senior and middle management was supported by all seven subscales
of the IAS, namely factor -Q3, factor Q4, factor -C, factor L, factor O, Score A, and Sore B.
However for specialist staff the main scale was supported by five of the seven subscales
excluding factor -C and factor L.
For all three position levels, namely senior management, middle management, and specialist
staff, level of stress once again produced the most consistent co-relationship. This indicator
correlated significantly with total anxiety. High levels of perceived stress on this indicator co-
related with high levels of total anxiety and vice versa. For all three position levels the
alternative hypothesis H1 was confirmed in general for this indicator.
9.5.7.3 Experience of Work and Life Circumstances Questionnaire with the Beck Depression
Inventory
The next correlation analyses focused on Pearson correlation coefficients for calculated for
each of the variables of the Experience of Work and Life Circumstances Questionnaire as they
related to the Beck Depression Inventory (BDI) and were obtained for each position level
(Appendix B). The three underlying hypotheses that were formulated for all variables of the
Experience of Work and Life Circumstances Questionnaire with the Beck Depression Inventory
for the three position levels are as follows:
H0: �WLQ.BDI = 0.00 H1: �WLQ.BDI � 1.00 H2: �WLQ.BDI � -1.00
Detailed co-relational information is provided in Appendix B. Results of the main scales will be
presented here.
The level of stress (LOS) scores of the subjects’ correlated significantly and positively with
depression, namely for all three position levels, that is for participants from senior management
(r = 0.727), middle management (r = 0.617), and specialist staff (r = 0.534).
The most consistent co-relationship for the three position levels, namely senior management,
middle management, and specialist staff, was the level of stress. The indicator level of stress
correlated significantly with depression. High levels of perceived stress on this indicator co-
related with high levels of depression and vice versa. In general the alternative hypothesis H1
was confirmed for this indicator.
224
9.5.7.4 Experience of Work and Life Circumstances Questionnaire with the Penn State Worry
Questionnaire
The penultimate correlation analyses targeted those Pearson correlation coefficients that were
produced when comparing each of the variables of the Experience of Work and Life
Circumstances Questionnaire with the Penn State Worry Questionnaire (PSWQ) scores:
analyses were done for each of the three position levels (Appendix B). The three hypotheses
that were investigated for all variables of the Experience of Work and Life Circumstances
Questionnaire with the Penn State Worry Questionnaire for the three position levels are as
follows:
H0: �WLQ.WORRY = 0.00 H1: �WLQ.WORRY � 1.00 H2: �WLQ.WORRY � -1.00
Detailed information appears in Appendix B. Here only the results of the main scales will be
discussed.
Again for all three position segments, the level of stress (LOS) scores of the subjects’ correlated
significantly and positively with worry, namely for senior management (r = 0.610), middle
management (r = 0.367), and for specialist staff (r = 0.512).
For the three position levels, namely senior management, middle management, and specialist
staff, the most consistent co-relationship with worry again was found to be the level of stress.
This particular indicator correlated significantly with worry. High levels of perceived stress on
this indicator co-related with high levels of worry and vice versa. For all three position levels the
alternative hypothesis H1 in general was confirmed for this indicator.
9.5.7.5 Experience of Work and Life Circumstances Questionnaire with the Social Problem-
Solving Inventory-Revised
The final correlation analyses investigated all Pearson correlation coefficients derived at by
associating each of the variables of the Experience of Work and Life Circumstances
Questionnaire with each of the variables of the Social Problem-Solving Inventory-Revised
(SPSIR), and were done for each of the three position levels (Appendix B). The three
hypotheses that were investigated for all variables of the Experience of Work and Life
Circumstances Questionnaire with all the variables of the Social Problem-Solving Inventory-
Revised (SPSIR) for position levels are as follows:

225
H0: �WLQ.SPSIR = 0.00 H1: �WLQ.SPSIR � 1.00 H2: �WLQ.SPSIR � -1.00
Appendix B contains further detailed information. The results of the main scales will be
presented here.
Again the subjects’ level of stress (LOS) scores correlated significantly but negatively with the
social problem solving scale of the SPSIR, but only for two of the three position levels, namely
senior (r = -0.342) and middle management (r = -0.421). No significant correlation was found for
the specialist staff category. Three of the nine scales and subscales of the SPSIR supported
the main scale trend, namely negative problem orientation (NPO), impulsivity/carelessness style
(ICS), and avoidance style (AS) with regard to senior management. In the case of middle
management the main scale was supported by four of the nine scales and subscales, namely
positive problem orientation (PPO), negative problem orientation (NPO),
impulsivity/carelessness style (ICS), and avoidance style (AS).
For senior and middle management the most consistent co-relationship with social problem
solving once again proved to be level of stress. The indicator level of stress correlated
significantly with social problem solving. High levels of perceived stress on this indicator co-
related to low levels of social problem solving and vice versa. For these two position levels the
alternative hypothesis H1 was confirmed in general for this indicator. However in the case of
specialist staff no significant correlations could be found. Thus in this case the indicator level of
stress in general confirmed the null hypothesis.
9.6 Effect size, d
The effect size was calculated by means of of the d-transformation formula:
pooledSxx
d 21 −=
where subscript 1 designated the arithmetic mean of the total sample (or experimental group)
and subscript 2 to that of the subsample (or control group). Any bias was corrected using the
following formula (Hedges & Olkin in Coe, 2000):
dd corrected ≅ ( ){ }����
���
�
−+−×
943
1CE NN
226
9.7 Conclusion
Quantitative analysis of the scored data collected by means of the questionnaires was
completed. It included descriptive statistics for the variables measured by each questionnaire,
determination of the Cronbach alpha reliability coefficients for each of these instruments,
inferential statistics including z-tests, t-tests for related groups, general linear modelling with
ANOVA option, Scheffé tests, the determination of Pearson correlation coefficients between the
various variables measured by the tests, and effect size with respect to the total group, the two
genders, the four age groups, the two marital categories, the four business sectors, the five
qualification divisions, and the three position levels. The results obtained allow the researcher to
determine the similarities and differences that occur for this specific group of participants as a
whole, but also for the five biographical variables. Also the Pearson correlation coefficients give
the researcher an indication of the underlying relationships that exist between the dependent an
independent variables. The results obtained in the analysis as outlined in this chapter will now
be interpreted and discussed in more detail in the following chapter.
227
CHAPTER 10
DISCUSSION 10.1 Introduction
The purpose of this chapter is to discuss the findings obtained for the quantitative analysis of the
scored data collected by means of the questionnaires. The discussion will focus on Cronbach’s
alpha reliability coefficients, inferential statistics and a range of Pearson correlation coefficients
calculated for the total group, the two genders, the four age groups, as well as for the two marital
categories, the four business sectors, the five qualification groupings, and the three position levels
with reference to the eight scales of the Experience of Work and Life Circumstances Questionnaire,
the four scales for both experienced and witnessed aggression of the Aggression in the Workplace
Questionnaire, the eight IPAT Anxiety Scales, the Beck Depression Inventory, the Penn State
Worry Questionnaire, and the ten scales and subscales of the Social Problem-Solving Inventory–
Revised. Effect size will also be briefly considered. A number of shortcomings and implications for
further research will be made based on the results and the discussion.
10.2 Cronbach alpha reliability coefficients
10.2.1 Experience of Work and Life Circumstances Questionnaire
The Experience of Work and Life Circumstances Questionnaire (WLQ) was developed by the
HSRC for the South African context to assess the levels of overall stress and the different sources
of stress experienced by the individual in the workplace (Van Zyl & Van der Walt, 1991: 1).
The Cronbach alpha reliability coefficient was determined for the WLQ and its subscales. Good to
very good reliability could be demonstrated for all the subscales and the overall scale. In
comparison, Van Zyl and Van der Walt (1991: 21) reported reliability coefficients for all of the
subscales ranging from 0.83 to 0.92 (KR) compared to 0.74 to 0.95 obtained in this study. There is
no immediate further need to re-evaluate the reliability of this questionnaire. The scales can
therefore be interpreted with confidence both in research and in counselling.
10.2.2 Aggression in the Workplace Questionnaire
Baron and Neuman (1996: 161) developed the Aggression in the Workplace Questionnaire (AWQ)
to assess non-violent types of aggression that individuals either witness or experience in the
workplace.
228
The Cronbach alpha reliability coefficient was determined for the AWQ and its main and subscales.
All subscales produced adequate to good reliability, with coefficients ranging from 0.57 to 0.91 for
witnessed aggression and from 0.60 to 0.92 for experienced aggression. Coefficients of 0.94 for the
overall scale of witnessed aggression and 0.95 for experienced aggression were calculated. The
estimates supported effective use of the questionnaire in organizational research and individual
counseling. No comparative data was available as Baron and Neuman (1996: 161) did not report
any reliability coefficients.
10.2.3 IPAT Anxiety Scale
The IPAT Anxiety Scale was developed as a brief, non-stressful instrument to measure anxiety.
Again the Cronbach alpha reliability coefficient was calculated for the IPAT Anxiety Scale and its
eight scales. All of the eight scales had very good reliability coefficients with their values ranging
from 0.84 to 0.98. For purposes of comparison, Cattell, Scheier, and Madge (1995: 5) reported
reliability estimates based only on the total score, and these ranged from 0.78 to 0.83 (Ferguson’s
variation on Kuder-Richardson 20) depending on the sample. For the specific sample under
consideration in this study the reliability coefficient for the total score was 0.98. The results are
indicative that the IPAT Anxiety Scale may be used with confidence in research and individual
counselling.
10.2.4 Beck Depression Inventory
The Beck Depression Inventory (BDI) was developed as a brief and efficient means of detecting
and determining the severity of depression. McDowell and Newell (in Michalak et al, 2004: 100)
generally consider it to be one of the best screening tools for depression.
The Cronbach alpha reliability coefficient was also obtained for the BDI. A coefficient of 0.95 was
achieved, indicating very good reliability. In a literature review focusing on the psychometric
properties of the BDI with both psychiatric and non-psychiatric samples, mean coefficient alphas of
0.86 for the former and 0.81 for the latter were obtained (Beck et al, 1988: 80). The result confirms
that the BDI may be used with confidence in both research and counselling.
229
10.2.5 Penn State Worry Questionnaire
The Penn State Worry Questionnaire (PSWQ) was developed to research the phenomenon of
worry and its relationship to anxiety.
The Cronbach alpha reliability coefficient for the 16-item PSWQ was determined and judged to
have a very high reliability, namely a coefficient of 0.91. Comparatively it has been found to
possess high internal consistency in both college samples (Davey; Ladouceur et al; Meyer et al in
Molina & Borkovec, 1994: 269) and in a large sample of persons with mixed anxiety disorders and
GAD clients (Brown et al in Molina & Borkovec, 1994: 269). In these studies the coefficient alphas
varied from 0.86 to 0.95. Again the result indicated that the questionnaire might be used with
confidence in both research and counselling.
10.2.6 Social Problem-Solving Inventory–Revised
The Social Problem-Solving Inventory-Revised (SPSIR) was developed to assess the social
problem solving abilities of individuals.
Cronbach alpha reliability coefficients for the scales and subscales were calculated and showed
good to very good reliability with values ranging from 0.73 to 0.94. These results compare well with
those reported in the manual of the SPSIR (D’Zurilla, Nezu, & Maydeu-Olivares, 2002: 56), where
the reliability coefficients for the SPSIR in four different samples for all five scales of the SPSI-R
showed adequate to high internal consistency with the coefficient alpha varying from 0.69 to 0.95.
The test-retest reliability for two samples was also adequate to high varying from 0.68 to 0.91
(D’Zurilla, Nezu, & Maydeu-Olivares, 1996: 19). The result once more supports confident use of
the questionnaire in both research and counselling.
10.3 Experience of stress and its consequences
10.3.1 Total sample, gender, marital status, and age
The subjects that made up the total sample generally reported low levels of stress, which was a
good indication that they did not experience negative circumstances which otherwise would have
led to the experience of negative feelings, such as restlessness, irritability, boredom, and guilt for
example. Subjects generally did not feel that their circumstances whether within or outside the
workplace contributed to any significant levels of stress, whether due to causes outside the
workplace such as problems at home, finances, health, transport among others, organizational
functioning, task characteristics, physical working conditions and job equipment, career matters,

230
social matters, or remuneration, fringe benefits and personnel policy. Furthermore when it came to
subjects’ expectations regarding their work situation, concerning organizational functioning, task
characteristics, physical working conditions and job equipment, career matters, social matters, or
remuneration, fringe benefits and personnel policy, the results showed that these were generally
met for most subjects. When looking at the level of stress the subjects belonging to the sample
experienced, it was found to fall within the normal range. In general the number of subjects falling
within the normal range fell between 70.9% and 89.8% depending on the variable (Appendix A).
These results to some extent paralleled the results Van Zyl (in Van Zyl, 2002: 26) reported in an
investigation conducted in South Africa. He found that 34.7% of Coloureds, 38.1% of Whites and
Asians, and 35% of black South Africans experienced high levels of stress. Correspondingly both
male and female subjects experienced similar low levels of stress as well as perceiving their
circumstances and expectations within the workplace as satisfactory. Generally the result
corresponds with the research regarding males and females when performing the same type of job
and positioned at the same level (Torkelson & Muhonen, 2003: 177). Furthermore no significant
differences could be found between the married and the non-married groups for seven of the eight
variables of the Work and Life Experiences Questionnaire. The married, single and divorced
subjects experienced similar low levels of stress and also perceived their circumstances and
expectations as satisfactory, except in the case of stress due to causes outside the work situation.
Married subjects reported lower levels of stress due to causes outside the workplace than the
single and divorced subjects. This meant that the married group found their circumstances outside
the workplace far more satisfactory than their single and divorced counterparts. This difference was
not surprising as one could expect that married subjects with intact marriages would experience
less stress and less of a spill over into the workplace. Regarding age, the results also showed
insignificant differences between the different age categories implying that a specific age category
did not impact on the individual’s level of stress and experience of his or her circumstances both
within and outside the workplace. However when age was combined with organization grouping, it
impacted on the subjects’ experience of their circumstances and expectations for task
characteristics and remuneration, fringe benefits and personnel policy (see section 10.3.2.3). In the
case of age and qualification, it only affected remuneration, fringe benefits and personnel policy
(see section 10.3.2.1).
Stress is hypothesized to impact upon an individual specifically within the context of the workplace.
Stress experienced due to the demands and stressors placed on the individual may lead to
behavioural, psychological, and physical consequences. The research focussed on one possible
behavioural outcome, namely the witnessing and experience of workplace aggression and three
possible psychological consequences.
231
The first ramification that was considered was that of witnessed and experienced aggression. The
results showed that subjects of the entire sample generally did not witness or experience significant
levels of workplace aggression in its varying forms. This result could be expected based on the fact
that the entire group experienced low levels of stress and that they judged their circumstances and
expectations to be within tolerable levels. Expressions of hostility, such as belittling others’
opinions, talking behind their backs, obstructionism, such as failure to return phone calls or respond
to memos, failure to transmit needed information, interfering with activities important to the target,
and overt aggression, for example physical assault, theft or destruction of property, threats of
physical violence, therefore, occurred at low levels within those environments in which participants
operated. This did not impact significantly over the long term. Neuman and Baron (1998: 398)
report that expressions of hostility occur more often than either obstructionism or overt aggression
that also is the least prevalent. Furthermore the results suggest that workplace aggression is
witnessed more often than actually experienced by the subjects. The Pearson correlations did
confirm significant relationships between the level of stress experienced by the subjects and the
level of witnessed and experienced aggression in the workplace. In both cases low levels of stress
were associated with low levels of witnessed and experienced aggression in the workplace. No
significant differences with regard to witnessed aggression were found between males and females
which meant that both groups witnessed similar low levels of workplace aggression in its various
forms. In the case of experienced aggression a significant difference was found for experienced
obstructionism (for example failing to return phone calls or respond to memos, failing to transmit
information needed by the target, et cetera). Here males experienced significantly higher levels of
aggression than their female co-workers. It is generally assumed that males more often than their
female counterparts resort to aggression (Bettencourt & Miller in Rutter & Hine, 2005: 254). Rutter
and Hine (2005: 262) confirmed these findings within the workplace. They found that males more
often than females engaged in all three types of aggression, namely expressions of hostility,
obstructionism, and overt aggression. The Pearson correlation coefficients suggest significant
relationships between the experience of stress and witnessed as well as experienced aggression in
the workplace. By implication the experience of stress was linked to low levels of witnessed
aggression for both males and females and low levels of experienced aggression in the workplace
only for females. Males on the other hand did not show such an association with experienced
aggression. The Pearson correlations described significant relationships between the experiences
of stress by both genders and witnessed as wells as experienced aggression.
With regard to both witnessed and experienced aggression the subjects belonging to both marital
status groups did not differ significantly from one another and therefore most married, single and
divorced subjects witnessed and experienced similar low levels of aggression within the workplace.

232
Both groups obviously worked in environments where they witnessed and experienced few
expressions of hostility, low levels of obstructionism, and overt aggression. No specific research
could be found to in the literature to support this finding. The magnitude of the Pearson correlations
suggests a significant relationship between the experience of stress and witnessed as well as
experienced aggression in the workplace.
Significant differences occurred in the four age brackets, specifically for witnessed and
experienced overt aggression. More specifically the age group 20-29 years witnessed higher levels
of overt aggression in the workplace than subjects in the remaining age groups. Furthermore the
age group 30-39 also witnessed higher levels of over aggression compared to subjects in the age
group 40-49 as well as in the age group 50 years and older. Subjects found in the age group 50
years of age and older experienced higher levels of over aggression in the workplace than subjects
found in any of the remaining age groups. Here the findings of the Pearson correlation suggest
significant relationships between the experience of stress and witnessed aggression for only the
subjects found in age groups 30-39 and 50 years or older. The other two age groups were not
affected by the witnessing of aggression in the workplace. However a significant relationship also
was delineated between the experience of stress and experienced aggression in the workplace for
only the subjects belonging to the 20-20 and 30-39 year old age groups.
The second ramification involved the experience of anxiety as determined by the IPAT Anxiety
Scale. The results implied that the subjects as a group could be described as having adequate
levels of ego strength and lacking in ego weakness, showing neither too high levels of trust or
suspiciousness, and that they were neither inclined towards untroubled adequacy or guilt
proneness. Furthermore they reported average levels of defective integration and lack of self-
sentiment, as well as average levels of frustrative tension. The sample also experienced average
levels of covert hidden anxiety and overt, symptomatic, and conscious anxiety. Also most of the
subjects experienced average levels of total anxiety. In general the subjects comprising the sample
therefore could be described as well adjusted. This result again was predictable based on the fact
that the group did not report high levels of stress and problems regarding their circumstances or
their expectations. Low levels of wellbeing are often defined, amongst others, as including anxiety
(Salmela-Aro in Kaukianen et al, 2001: 362). Terluin et al (2004: 195) also found that the levels of
anxiety in a working population were very low. Absence of significant levels of anxiety in the sample
implies that most of the subjects experienced a sense of wellbeing that could be characteristic of
subjects who were generally well adjusted. The Pearson correlations also confirmed a significant
relationship between the level of stress experienced by the subjects and the level of total anxiety
reported. Low levels of stress were associated with low levels of anxiety. Males and females had
233
similar average levels of trust and suspiciousness as well as covert hidden anxiety. Females
however did differ from males in that they had slightly less ego strength and more ego weakness, a
greater tendency to guilt proneness and lower tendency towards untroubled adequacy, were more
prone to defective integration and lack of self-sentiment as well as frustrative tension, higher levels
of overt, symptomatic, and conscious anxiety, and generally a higher level of total anxiety. Although
differences did occur, these were still within the average range.
The findings of the two marital status groups, furthermore, did not differ with regard to their levels of
suspiciousness, frustrative tension and covert hidden anxiety. Subjects belonging to the married
group differed from the single and divorced subjects in that they had slightly more ego strength and
less ego weakness, a lesser tendency to guilt proneness and higher tendency towards untroubled
adequacy, less prone to defective integration and lack of self-sentiment, a lower level of overt,
symptomatic, and conscious anxiety, and generally a slightly lower level of total anxiety. The result
probably could be better understood in terms of social support. The size of the Pearson correlation
suggests a significant relationship between the experience of stress and total anxiety. No specific
differences were found for subjects belonging to each of the age categories. Pearson correlations
suggest significant relationships between the experience of stress and total anxiety for both
genders, marital status groups, and the four age categories.
A third possible outcome of stress is depression. To ascertain the level of depression the Beck
Depression Inventory was used. The subjects that made up the sample reported significantly low
levels of depression. Again this result could be predicted as low levels of stress were reported, as
well as no particular problems due to their circumstances or expectations. The most common
indicators associated with absence of wellbeing are depression and depressive symptoms
(Salmela-Aro in Kaukianen et al, 2001: 362; Terluin et al, 2004: 195). The absence of any
significant levels of depression in the sample could thus be again indicative of a sense of general
wellbeing. Here the Pearson correlation confirmed a significant relationship between the level of
stress experienced by the subjects and the level of depression reported. Low levels of stress were
associated with low levels of depression. No statistically significant differences could be found
between the two genders, marital status groups, and four age categories. This meant that males
and females, subjects belonging to one of the marital status groups, and subjects belonging to the
four age categories experienced similar low levels of depression. The magnitudes of the Pearson
correlation also suggest significant relationships between the experience of stress and depression
for both genders, both marital status groups, and all four age categories.
234
Next the role of worry was considered. To obtain a measure of worry the Penn State Worry
Questionnaire was used. It was found that most subjects that made up the sample reported
significantly low levels of worry. Worry is seen as a form of task-oriented coping, a form of problem
solving, specifically at a non-clinical level (Davey in Keogh, French, & Reidy, 1998: 68).
Furthermore worry has often been found to be related to the level of anxiety (Davey in Keogh et al,
1998: 67). This result could be expected as the subjects, a non-clinical sample, only reported low
levels of both anxiety and worry, and generally good levels of social problem solving (see next
paragraph). The Pearson correlations again confirmed a significant relationship between the level
of stress experienced by the subjects and the level of worry found. Thus the low levels of stress
were also associated with low levels of worry. However a statistically significant difference between
males and female subjects and married and single or divorced subjects was found. Despite the
relevant levels of worry being low, females compared to males, tended to worry significantly more.
Similarly non-married subjects worried more than married subjects. In the case of the subjects
belonging to the four age groupings no significant differences were obtained for the level of worry.
The findings of the Pearson correlations also suggest significant relationships between the
experience of stress and worry for both genders, both marital status groups, and all of the four age
groupings.
Finally to answer the question as to how the subjects that made up the sample coped with stress
the Social Problem-Solving Inventory-Revised was used. The results showed that most of the
subjects in the sample had a high positive problem orientation, a corresponding low negative
problem orientation, good rational problem solving skills, which included good problem definition
and formulation abilities, significant abilities to generate alternatives, effective decision making
abilities, adequate ability to implement and verify solutions, a limited tendency to resort to an
impulsivity and/or carelessness as well as an avoidance style, that all added up to high levels of
total social problem solving ability. The results meant that most of the subjects had a general
disposition that allowed them to appraise a problem as a challenge rather than a threat, a believe
that any problem was solvable, basic trust that they had the ability to solve a problem, a willingness
to put in time and effort, persistence and generally to commit themselves to solving a problem at
hand. They also would not easily become frustrated and upset when dealing with a given problem.
When the majority of subjects applied themselves to a given problem, they were able to carefully
and systematically gather facts and information, identify demands and obstacles, set problem-
solving goals, generate a variety of alternatives, and then choose and implement a solution whilst
carefully monitoring and evaluating outcomes. For most of the subjects their attempts at problem-
solving were not narrow, impulsive, careless, hurried, and incomplete. Furthermore they were not
plagued by procrastination, passivity or inaction, and dependency. In general D’Zurilla and Chang
235
(D’Zurilla, Nezu, & Maydeu-Olivares, 2002: 61) found that especially positive problem orientation
and rational problem solving were related to the adaptive, problem-engagement coping strategies,
which the individual ‘uses to either change the stressful situation for the better through direct action,
or change the meaning of the situation to make it less threatening’. Furthermore negative problem
orientation was found to correlate significantly with psychological distress and general
psychological symptomatology (Chang & D’Zurilla in D’Zurilla, Nezu, & Maydeu-Olivares, 2002:
63).The findings of the Pearson correlation suggest a significant relationship between the
experience of stress and social problem solving in general. Furthermore the highest contribution to
the main scale is made by negative problem orientation supporting the earlier findings for Chang
and D’Zurilla (Chang & D’Zurilla in D’Zurilla, Nezu, & Maydeu-Olivares, 2002: 63). Thus the results
not only suggest that low levels of experienced stress is associated with high levels of social
problem solving, but also associated with low levels of negative problem orientation.
No significant differences could be found between male and female subjects for seven of the scales
and subscales of the Social Problem-Solving Inventory-Revised except with regard to negative
problem orientation, generation of alternatives, and overall problem solving ability. Females had a
greater negative problem orientation, a lesser ability to generate alternatives, and a lesser overall
problem solving ability. Females tended to see a problem as slightly more threatening to their
wellbeing, were slightly more pessimistic, slightly doubted their ability to solve problems
successfully, and becoming a little more frustrated and upset when confronted with problems of
existence. Due to these slight differences the total problem- solving score was slightly lower for the
females than for the males but still occurred within the range of effectiveness. Gender differences
were also found in some studies (D’Zurilla in D’Zurilla, Nezu, & Maydeu-Olivares, 2002: 55).
However the only consistent difference throughout these studies was that women scored higher on
the negative problem orientation-scale than men. The present study did overlap with the literature
regarding the negative problem orientation-scale. The findings of the Pearson correlation suggest a
significant relationship between the experience of stress and social problem solving in general.
Significant differences could be found between the married and the non-married groups regarding
their positive and negative problem orientation, rational problem-solving abilities, impulsivity and
carelessness style, avoidance style, and overall problem-solving ability. Although the married
subjects appear to outperform single and divorced subjects regarding their ability to define and
formulate a problem, this conclusion was confounded by the fact that differences also occurred
within the groups. The remaining results implied that the married subjects had a general disposition
that would allow them to appraise a problem slightly better as a challenge rather than a threat, to
believe that a problem was more solvable, to trust that they had the ability to solve the problem
236
more, to be willing to put in the time and effort more, persist and generally commit themselves more
to solving the problem at hand than the single and divorced subjects. They would also be
somewhat less easily frustrated and upset when dealing with a given problem. The married
subjects were able to apply themselves to a given problem more effectively than the single and
divorced subjects and they were able to carefully and systematically gather facts and information
slightly more effectively, identify demands and obstacles better, while carefully monitoring and
evaluating the outcome better. Both groups could equally well generate a variety of alternatives, set
a problem-solving goal, and then choose and implement a solution. The married subjects generally
were fractionally better off than their single and divorced counterparts in their attempts at problem
solving. No research findings have been reported in the literature regarding marital status. The
findings of the Pearson correlation suggest a significant relationship between the experience of
stress and social problem solving in general for both marital status groups.
Again no significant differences regarding most of the subjects belonging to the four different age
groups with regard to problem solving were found except in the case of subjects who were between
40 and 49 years old and who felt that they were more effective in generating alternatives than their
counterparts who were between 20 to 29 years of age. The former also perceived themselves as
more effective generators of alternatives than the subjects who were 50 years or older. The
Pearson correlations for the four age groups suggest significant relationships between the
experience of stress and age specifically for the subjects belonging to the age groups 30-39 and
40-49. This result could be understood in terms of the type of work they could be involved in and
the level of experience within that field.
10.3.2 Type of organization grouping
An analysis of variance was done on each of the eight variables of the Work and Life Experiences
Questionnaire to determine which of the four types of organization groupings the subjects worked
for could be described as the most stressful. Subjects employed in all four groups of organizations,
namely financial, production/services, research and development, as well as academic/auxiliary
services, experienced very similar low levels of stress. The subjects working for any one of the
various types of organization groupings experienced their circumstances, for instance outside the
workplace, organizational functioning, and social matters, as satisfactory. Similarly their
expectations regarding organizational functioning and social matters were also fulfilled. However
significant differences for both their circumstances and expectations were found with regard to task
characteristics, physical working conditions and job equipment, career matters, and remuneration,
fringe benefits and personnel policy. Subjects working in research and development organizations
237
found task characteristics far more problematic than those subjects working in financial,
production/services or academic/auxiliary services organizations. Subjects working in
academic/auxiliary services apparently found their physical working conditions and job equipment
far more bothersome than those working in financial, research and development, as well as in
production/services organizations. Subjects found in financial and research and development
organizations reported similar levels of problems but both still had greater levels than
production/services organizations (Academic or auxiliary services > financial = research and
development > production or services). Subjects working for financial or production/services
organizations did not differ significantly in their assessment of career matters nor did the subjects
working for academic/auxiliary services or research and development organizations. However
subjects belonging to the former two organization groupings experienced career matters as less
worrisome than subjects working for the latter (academic/auxiliary services = research and
development > financial = production/services). For those subjects working in academic/auxiliary
organizations remuneration, fringe benefits and personnel policy was experienced far more
worrisome than for those working in financial, production/services or research and development
organizations. Those subjects in financial organizations found it more perturbing than those in
research and development organizations. Interestingly no differences were found between financial
and production/services organizations as well as between production/services as well as the
research and development organizations.
The first ramification to be considered was that of witnessed and experienced aggression. In terms
of the four organizational groupings no differences could be found between them for each type of
witnessed or experienced aggression. Thus the subjects working in the four types of organization
groupings witnessed and experienced similar low levels of workplace aggression whether
expressions of hostility, obstructionism, or overt aggression. For the second ramification the
subjects in each type of organization grouping reported similar levels of lack of ego weakness and
ego strength, lower levels of suspiciousness, guilt proneness, defective integration and lack of self-
sentiment, frustrative tension, average levels of overt and covert anxiety, as well as total anxiety. In
the case of the third and fourth ramification, for example depression and worry the subjects found in
each type of organization grouping experienced similar low levels of depression and worry. No
specific differences between the four types of organizational groupings and social problem solving
could be delineated.
The findings of the Pearson correlation suggest a significant relationship between the experience of
stress and witnessed aggression for production/services and academic/auxiliary services
organizations. It did not play a role in financial or research and development organizations. For
238
financial, production/services, and academic/auxiliary organizations a significant relationship also
existed between the experience of stress and experienced aggression in the workplace. Finally
significant relationships occurred between the experience of stress and total anxiety, depression,
and worry for subjects working in all four types of organization groupings. Furthermore these
findings also suggest a significant relationship between the experience of stress and social problem
solving in general but only for subjects working for financial and production/services organizations.
10.3.2.1 Organization grouping with qualification level
The role that the level of qualifications played for the subjects regarding their experience of stress,
their circumstances within and without the workplace and their expectations within the workplace
within each organization was ascertained. The level of qualification did not impact on their
experience of stress nor did their circumstances regarding causes outside the workplace, their
physical working conditions and job equipment, and social matters as well as their expectations
regarding their physical working conditions and job equipment and social matters reflect the role of
qualification. However significant differences were found for organizational functioning, task
characteristics, career matters, and remuneration, fringe benefits and personnel policy. Only the
most significant results will be presented.
Firstly, with regard to organizational functioning, subjects with a Masters or Doctors degree working
in an academic/auxiliary services environment differed from thirteen other organization-qualification
combinations, with participants employed in financial organizations and holding Masters or Doctors
degrees, in research and development organizations with a Grade 12 or lower or a Bachelor
degree, and academic/auxiliary services organizations with a Grade 12 or lower, or Diploma or a
Bachelor degree, being the exceptions. Throughout they experienced organizational functioning
with their work environment as more problematic than the others.
When it came to task characteristics the qualification level of the subjects also played an important
role. Here the most important was for subjects working for research and development organizations
with Diplomas which differed significantly from nine other organization-qualification combinations.
Essentially they found task characteristics far less bothersome those working in financial
organizations with a Grade 12 or lower, a Diploma, a Bachelors degree, an Honours or equivalent
degree, production/services organizations with a Grade 12 or lower or a Bachelors degree, and
academic/auxiliary organizations with Diplomas, Bachelors degrees or Masters or Doctoral
degrees. In the case of career matters qualification differences did play and important role. Most
significantly subjects working in academic/auxiliary services organizations with a Masters or
239
Doctoral degree experienced career matters as more worrisome than subjects working in financial
organizations with a Grade 12 or lower, a Diploma, and Bachelors degree, in production/services
organizations with a Diploma, a Bachelors degree, an Honours or equivalent degree, and a Masters
or Doctoral degree, in research and development organizations with a Bachelors degree and a
Masters or Doctoral degree, and in academic/auxiliary services organization with an Honours or
equivalent degree. Also subjects working in academic/auxiliary services organizations with a
Diploma found career matters more problematic than subjects found in financial organizations with
Grade 12 or lower, a Diploma, and a Bachelors degree, in production/services organizations with a
Diploma, an Honours or equivalent degree, and a Masters or Doctoral degree, in research and
development with a Bachelors degree, and in academic/auxiliary services organizations with an
Honours or equivalent degree.
Finally for remuneration, fringe benefits and personnel policy qualification also played an important
role. Firstly for subjects working in academic/auxiliary organizations with a Masters or Doctoral
degree experienced remuneration, fringe benefits and personnel policy as greater concern than
subjects working in financial organizations with a Grade 12 or lower and a Bachelors degree, in
production/services organizations with a Diploma, a Bachelors degree and an Honours or
equivalent degree, in research and development organizations with a Diploma, a Bachelors degree
and a Masters or Doctoral degree. Similarly subjects working in financial organizations with an
Honours or equivalent degree also found remuneration, fringe benefits and personnel policy as
more problematic than subjects working in financial organizations with a Bachelors degree, in
production/services with a Diploma, a Bachelors degree and an Honours or equivalent degree, in
research and development organizations with a Diploma, a Bachelors degree and a Masters or
Doctoral degree. However subjects working in research and development with a Diploma felt more
satisfied with their remuneration, fringe benefits and personnel policy than subjects working in
financial organizations with a Grade 12 or lower, an Honours or equivalent degree and Masters or
Doctoral degree, in production/services organizations with a Grade 12 or lower, in
academic/auxiliary services organizations with a Diploma, a Bachelors degree and an Honours or
equivalent degree.
The first ramification to be assessed was that involving witnessed and experienced aggression. In
terms of type of organization grouping and qualification specific differences could be found for only
witnessed overt aggression. More specifically, subjects working in production/services
organizations and who had a Grade 12 or lower witnessed higher levels of overt aggression in the
workplace than subjects working in six other organization-qualification groupings, when compared
to subjects working in financial organizations and had a Grade 12 or lower, or in financial
240
organizations and had a Diploma, who worked in production/services organizations and had an
Honours or equivalent degree, who worked in research and development organizations and had a
Bachelor degree or Masters or Doctoral degree, and who were found in academic/auxiliary services
organizations and had an Honours or equivalent degree. However when considering experienced
aggression, the subjects also experienced significant differences when it came to experienced overt
aggression. The most significant results involved those subjects that worked in production/services
organizations and had a Grade 12 or lower experienced the higher levels of overt aggression than
their counterparts form fourteen other organization-qualification groupings, namely from subjects
who worked in financial services organizations and had a Grade 12 or lower, or Diploma, or a
Bachelors degree, or an Honours or equivalent degree, who worked in production/services
organizations and had a Diploma, or an Honours or equivalent degree, or a Masters or Doctoral
degree, who worked in research and development organizations and who had a Diploma, or a
Bachelors degree, or an Honours or equivalent degree, or a Masters or Doctoral degree, who a
worked in academic/auxiliary services organizations and had a Bachelors degree, or an Honours or
equivalent degree, or a Masters or Doctoral degree. Also the subjects with a Bachelor degree
working in production/services organizations experienced higher levels of overt aggression than
subjects from nine other organization-qualification groupings, namely from subjects who worked in
financial organizations and had a Grade 12 or lower, or with a Diploma, or with a Bachelors degree,
production/services organizations with a Diploma, or with and Honours or equivalent degree, or
with a Masters or Doctoral degree, who worked in research and development organizations and
had a Diploma, or Masters or Doctoral degree, and who worked in academic/auxiliary services
organizations and who had an Honours or equivalent degree.
For the second ramification the subjects in each organization-qualification combination reported
similar levels of lack of ego weakness and ego strength, low levels of suspiciousness, guilt
proneness, defective integration and lack of self-sentiment, frustrative tension, average levels of
overt and covert anxiety, as well as total anxiety. This was also the case for the third and fourth
ramification. Subjects again experienced similar low levels of depression and worry.
The fifth ramification, namely social problem solving was assessed. The subjects reported a
similarly high positive problem orientation and a corresponding low negative problem orientation,
high levels of rational problem solving ability, good problem definition and formulation ability, a
good ability to generate alternatives, effective decision making as well as solution implementation
and verification abilities, a low impulsivity/carelessness and avoidance style, and a high overall
social problem solving ability.
241
10.3.2.2 Organization grouping with position level
The role that the position level played regarding the subjects’ experience of stress, their
circumstances within and without the workplace, and their circumstances within the type of
organization grouping was also ascertained. Significant results were found only regarding their
circumstances and expectations for task characteristics. Only the most significant results will be
presented.
The most significant comparison involved subjects found in the specialist staff category and
working in research and development organizations. They described task characteristics as more
problematic compared to subjects working in financial organizations in senior management, middle
management, and as specialist staff, in production/services in senior management, middle
management and as specialist staff, research and development organizations in senior and middle
management, and in academic/auxiliary organizations in senior management and as specialist
staff.
When it came to the first ramification the subjects found in each organization grouping-position
level combination both witnessed and experienced similar low levels workplace aggression. Put in
another way they did not witness or experience worrying expressions of hostility, high levels of
obstructionism, or overt aggression. For the second ramification the subjects in each organization
grouping-position level combination reported similar levels of lack of ego weakness and ego
strength, low levels of suspiciousness, guilt proneness, defective integration and lack of self-
sentiment, frustrative tension, average levels of overt and covert anxiety, as well as total anxiety.
Again for the third and fourth ramification the subjects working in each organization grouping-
position level combination experienced similar low levels of depression and worry.
The fifth ramification, namely social problem solving was evaluated. Again no significant differences
could be found regarding the subjects social problem solving abilities in general. However the only
exception was found specifically for subjects working in financial organizations as specialist staff
who considered themselves more effective at generating alternatives than subjects working in
financial organizations and working in senior management, in production/services organizations in
senior management and as specialist staff, in research and development organizations in senior
management, and who worked in academic/auxiliary services organizations in senior management,
middle management, and as specialist staff. The opposite was true for subjects working in
academic/auxiliary services organization. These participants being active at the level of middle
management, felt that they were less good at generating alternatives than subjects working in
242
financial organizations and found and operating at both senior management and specialist staff
level, in production/services organizations found in middle management, as well as in research and
development organizations and also found in middle management.
10.3.2.3 Organization grouping with age
Age also played a significant role regarding both the circumstances and the expectations the
subjects had for task characteristics and remuneration, fringe benefits and personnel policy within
their respective organization groupings. They had similar low level of stress and they experienced
their circumstances outside the work situation as well as within the organization grouping for
organizational functioning, physical working conditions and job equipment, career matters, and
social matters as satisfactory. Similarly their expectations for organizational functioning, physical
working conditions and job equipment, career and social matters seemed to be met.
The most important result involved subjects between 30 to 39 years of age and working in
academic/auxiliary organizations that found task characteristics more bothersome than those
working in financial organizations between 20 and 29 years of age, and 30 and 39 years of age,
production/services organizations between 30 and 39 years of age and 50 years of age or older, in
research and development organizations between 30 and 39 years of age, 40 and 49 years of age,
and 50 years or older, and in academic/auxiliary services organizations 50 years of age or older.
Also those subjects 50 years of age or older that worked if financial organizations also experienced
task characteristics as more perturbing than subjects working in financial organizations between 20
and 29 years of age, in production/services organizations between 30 and 39 years of age and 50
years of age or older, in research and development organizations between 30 and 39 years of age,
40 and 49 years of age, and 50 years of age or older, and in academic/auxiliary services
organizations 50 years of age or older.
With regard to the impact of age, those subjects working in research and development
organizations and between 40 and 49 years of age found remuneration, fringe benefits and
personnel policy felt more satisfactory than their counterparts between the ages of 40 and 49 years
and who worked in financial organizations, those of 50 years or older in production/services
organizations, and participants from 20 all the way up to 50 years or older and working in
academic/auxiliary services organizations, However subjects working in academic/auxiliary
services organizations and being aged 30 and 39 years reported a greater concern with their
remuneration, fringe benefits and personnel policy than fellow participants also aged between 30
an 39 years and working in financial organizations or production/services organizations or in
243
research and development organizations and being 30 to 39 years old, between 40 and 49 years
and 50 years of age or older. Similarly subjects aged between 30 and 39 years and working in
academic/auxiliary services organizations found their remuneration, fringe benefits and personnel
policy more worrisome compared to their counterparts working in financial organizations
production/services organizations and being aged between 30 and 39 years, as well as working in
research and development organizations and being aged from 30 to 50 years or older.
The first ramification to be considered was that of witnessed aggression. In terms of the four
organization grouping-age combinations significant differences could be found between them and
only witnessed overt aggression. Actually the youngest age group 20-29 witnessed relatively more
acts of workplace aggression than the subjects of the older groupings. Also the age group 30-39
witnessed more than the remaining older two groups. However regarding the experience of
aggression in the work context the subjects belonging to the oldest group reported higher levels of
experienced overt aggression than any of the remaining age groups.
For the second ramification the subjects in each organization grouping-age combination reported
similar levels of lack of ego weakness and ego strength, low levels of suspiciousness, guilt
proneness, defective integration and lack of self-sentiment, frustrative tension, overt and covert
anxiety, as well as total anxiety. Again in the case of the third and fourth ramification the subjects
working in each organization grouping-age combination experienced similar low levels of
depression and worry. The fifth ramification, namely social problem solving was also assessed. The
subjects reported similar good levels of social problem solving in general.
10.3.3 Qualification level
The role of the level of qualification had on the subjects was also determined. However no
significant differences between each category for the subjects could be found implying that
qualification on its own did not impact on their experience of stress. Furthermore they experienced
their circumstances outside the work situation and within the workplace as favourable. Similarly an
analysis of the responses confirmed that the qualifications of subjects did not impact on their
expectations they had within the workplace regarding organizational functioning, task
characteristics, physical working conditions and job equipment, career matters, social matters, and
remuneration, fringe benefits and personnel policy. However when it came to organization grouping
taken with qualification level it did affect some of the variables as discussed previously.
244
The first ramification to be considered for qualification was that of witnessed and experienced
aggression. In terms of the five qualification levels no differences could be found between them for
each form of witnessed or experienced aggression. Thus the subjects witnessed and experienced
similar low levels of workplace aggression whether expressions of hostility, obstructionism, or overt
aggression. In the case of the second ramification the subjects in each qualification grouping
reported similar levels of lack of ego weakness and ego strength, low levels of suspiciousness, guilt
proneness, defective integration and lack of self-sentiment, frustrative tension, overt and covert
anxiety, as well as total anxiety. For the third and fourth ramification, the subjects found in each
qualification grouping reported similar low levels of depression and worry. The fifth ramification,
namely social problem solving was also evaluated. The subjects reported similar levels of social
problem solving in general.
The Pearson correlation did highlight a significant relationship between the experience of stress
and qualification level. With regard to witnessed aggression, the relationships for four of the five
qualification groupings, with subjects having Bachelors degrees being the exception, were
significant. For experienced aggression it was only applicable to Grade 12 or lower, Honours and
equivalent degrees, and Masters or Doctoral degrees. For total anxiety and depression it was
applicable to all five qualification levels. In the case of worry it applied to four of five qualification
levels, with the exception of those holding Bachelors degrees. Finally for social problem solving a
significant relationship was suggested for Grade 12 or lower and Masters or Doctoral degrees.
10.3.3.1 Qualification level with age
The role of qualification level and age for the eight variables of the work and life circumstances
questionnaire was assessed. Only remuneration, fringe benefits and personnel policy showed
significant differences. It was found that the subjects that had a Diploma and were between the
ages of 30 and 39 found their remuneration, fringe benefits and personnel policy more satisfying
than their counterparts with a Grade 12 or lower and between the ages of 30 and 49, with a
Diploma and 50 years of age or older, with an Honours or equivalent degree and between 20 and
29 and 40 and 49 years, and with a Masters or Doctoral degree and 50 years of age or older.
The first ramification to be considered was that of witnessed and experienced aggression. In terms
of the five qualification groupings with age, differences could be found specifically for experienced
overt aggression. Specifically subjects who had a Grade 12 or lower and were 50 years or older,
experienced higher levels of overt aggression than their counterparts from all the other
qualification-age groupings.
245
For the second ramification the subjects in each qualification-age combination reported similar
levels of lack of ego weakness and ego strength, low levels of suspiciousness, guilt proneness,
defective integration and lack of self-sentiment, frustrative tension, average levels of overt and
covert anxiety, as well as total anxiety. With regard to the third and fourth ramification the subjects
again experienced similar low levels of depression and worry. In the case of the fifth ramification
the subjects reported similar levels of social problem solving in general.
10.3.3.2 Qualification level with position level
Throughout the subjects in each qualification-position level combination reported similar low levels
of stress. They also experienced their circumstances as good regarding stress due to causes
originating outside the work situation, organizational functioning, task characteristics, physical
working conditions and job equipment, career matters, social matters, and remuneration, fringe
benefits and personnel policy. Furthermore their expectations were met when it came to
organizational functioning, task characteristics, physical working conditions and job equipment,
career matters, social matters, and remuneration, fringe benefits and personnel policy.
No differences were observed for the first ramification, namely witnessed and experienced
aggression in the workplace. Again the subjects reported low levels of both witnessed and
experienced expressions of hostility, obstructionisms, or overt aggression at work. For the second
ramification the subjects in each organization reported similar levels of lack of ego weakness and
ego strength, low levels of suspiciousness, guilt proneness, defective integration and lack of self-
sentiment, frustrative tension, overt and covert anxiety, as well as total anxiety. Regarding the third
and fourth ramification the subjects also experienced similar low levels of depression and worry.
The fifth ramification, namely social problem solving was assessed. Here the subjects reported
good levels of social problem solving in general.
10.3.4 Position level
The role that the position level played was also determined. Again the results showed no significant
differences implying that position level on its own did not impact on the level of stress, nor did it
affect the participants’ experience of their circumstances within or without the workplace negatively.
Also their expectations regarding organizational functioning, task characteristics, physical working
conditions and job equipment, career matters, social matters, and remuneration, fringe benefits and
personnel policy were met. However, when position level within an organization grouping was
246
considered, it did impact on their experience of their circumstances and expectations when it came
to task characteristics as discussed previously.
The first ramification to be considered was that of witnessed and experienced aggression. In terms
of the three position levels no differences could be found between them for each form of witnessed
or experienced aggression in the workplace. Thus they neither witnessed nor experienced
bothersome levels of expressions of hostility, obstructionisms, or overt aggression at work. For the
second ramification the subjects working in each position reported similar levels of lack of ego
weakness and ego strength, low levels of suspiciousness, guilt proneness, defective integration
and lack of self-sentiment, frustrative tension, average levels of overt and covert anxiety, as well as
total anxiety. When considering the third and fourth ramification, namely depression and worry, the
subjects found in the different position levels experienced similar low levels of depression and
worry. The fifth ramification, namely social problem solving, was evaluated. The subjects again
reported good levels of social problem solving in general.
10.3.4.1 Position level with age
Subjects, irrespective of their position level-age combinations, reported similar levels of stress and
they found their circumstances worthwhile both within and without the workplace. They also found
their expectations regarding organizational functioning, task characteristics, physical working
conditions and job equipment, career matters, social matters, and remuneration, fringe benefits and
personnel policy being met.
When it came to the first ramification subjects did not differ regarding any forms witnessed
aggression. However respondents that were in middle management and who were 50 years or
older, experienced higher levels of overt aggression than their counterparts found in ten other
position level-age groupings, namely from subjects who were in senior management and ranged
from 20 to 29 years of age, or 30 to 39 years of age, or 40 to 49 years of age, or 50 years or older,
who were in middle management and ranged from 20 to 29 years of age, or 30 to 39 years of age,
or 40 to 49 years of age, and who worked as specialist staff and ranging from 20 to 29 years of
age, or 30 to 39 years of age, or 40 to 49 years of age.
For the second ramification the subjects in each position level-age combination reported similar
levels of lack of ego weakness and ego strength, low levels of suspiciousness, guilt proneness,
defective integration and lack of self-sentiment, frustrative tension, average levels of overt and
covert anxiety, as well as total anxiety. In the case of the third and fourth ramifications again no
247
differences were found with regard to depression and worry. In the case of the fifth ramification,
namely social problem solving the subjects reported similar levels of social problem solving in
general.
10.4 Coping
The question arises as to how to explain the results of the present study, namely why were the
majority of subjects able to cope effectively with the stressors occurring outside as well as within
the organization. The first possibility is to consider the role of the organization. Is it possible that the
organizations involved in the study were doing something right? At the time the questionnaire was
completed the researcher was not aware that any of the organizations involved in the study were
implementing stress management interventions such as job and task redesign for example. Some
of the sectors within the financial and production/services organizations made use of an EAP which
on a regular basis presented stress management courses. This awareness may have impacted on
the individual but cannot be regarded as something the organization did to reduce or change the
impact of organizational stressors. It is well known that in contemporary organizations employees
are more likely to experience multiple environmental stressors in the workplace within a 2-to 3-year
period (Sikora et al, 2004: 11). The types of stressors may be either chronic or acute. Furthermore
changes, whether extraorganizational or occurring within the organization, whether on a macro or
micro level, do not occur sequentially but more often simultaneously. Change and stress are
inevitable within any organization.
What then could explain the fact that most of the subjects experienced acceptable levels of overall
stress and generally found that their circumstances and expectations fell within normal levels and
thus manageable? What is each individual doing that allows him or her to deal effectively with
chronic and acute stressors arising from their work environment? The most likely explanation lies
with the individuals that make up the sample. These participants can be viewed as individuals who
have the necessary resources, strengths and skills to either manage or resolve their concerns
(Presbury et al, 2002: 208). Furthermore the subjects’ ability to deal effectively with the demands
and stressors may be due to eustress (Nelson & Simmons, 2002: 104). They view the stress
response as both positive and negative, the former indicated by the presence of positive
psychological states (e.g., positive affect, meaningfulness, and hope), and the latter indicated by
the presence of negative psychological states (such as negative affect). Eustress may reflect ‘the
extent to which cognitive appraisal of a situation or event is seen to either benefit an individual or
enhance his or her well-being’. Most situations including work are expected to elicit both positive

248
and negative responses in individuals. Probably the majority of subjects in the sample were able to
accentuate the positive.
Generally the literature focuses on two general coping strategies that may influence the outcome:
emotion-focused and problem-focused or active coping (Elfering et al, 2005: 238). Wellbeing is
generally associated negatively with emotion-focused coping and positively with problem-focused
coping (Parker & Endler, in Elfering, 2005: 238). Emotion-focused coping is associated with
situations where the controllability is low and with behaviours such as withdrawal, self-blame, or
smoking a cigarette for example. On the other hand problem-focused coping is associated with
circumstances where controllability is high and with attempts to change the situation. Emotion-
focused coping has been measured in a problematic way leading to the perception that it is
maladaptive. Instead it has also been shown to lead to positive outcomes (Elfering et al, 2005: 240,
Stanton et al, 2005: 150). Strategies include ways to regulate emotions such as calming down in
stressful situations (Perrez & Reicherts in Elfering et al, 2005: 239) or the use of emotional
processing and expression (Stanton et al, 2005: 150). Social support, whether outside or within the
workplace, may play an important role in the latter case.
One approach to problem-focused or active coping is through the use of problem solving. How
individuals appraise their problem solving skills and whether they generally approach or avoid the
many problem situations they may be confronted with determines not only how they cope with
problems but also their social and psychological adjustment (Heppner & Lee, 2005: 290).
Individuals that see themselves as good problem solvers are more likely to exhibit lower levels of
depression and hopelessness under high stress conditions. Furthermore they tend to experience
lower levels of anxiety and anger. Generally these individuals also exhibit help-seeking behaviour.
Therefore the results may be understood in terms of the participants’ ability to use a problem-
focused or active coping approach, namely social problem solving. As active coping is seen as
having a protective function, either through its direct positive effect on the outcome or as a
moderator of the stressor-symptom relationship (Snow et al, 2003: 243) it may be concluded that
social problem solving as a specific form of active coping does the same. Furthermore researchers
have shown that problem solving is significantly related to adjustment deficits and psychological
distress, such as depressive symptomatology (Nezu in D’Zurilla et al, 2002: 5), anxiety (Nezu and
Nezu & Carnevale in D’Zurilla et al, 2002: 5), and aggression (D’Zurilla et al in D’Zurilla et al, 2002:
62). The more effective an individual was with problem solving the lower these indicators were.
Worry on the other hand was found to relate to positive problem orientation but not to the actual
problem-solving skills (Dugas et al, 1995: 117). Also effective problem solving has been shown to
impact positively on psychological wellbeing amongst others (Chang & D’Zurilla in D’Zurilla et al,
249
2002: 5). It may be concluded that social problem solving and specifically a high level of positive
problem orientation, a low negative problem orientation, good rational problem solving skills, a low
impulsivity/carelessness and avoidance style and thus generally a high overall social problem
solving score enabled the participants to deal with the demands and stressors within and without
the workplace thus also minimizing the negative consequences.
10.5 Overall assessment of effect size
Generally the effect sizes in the investigation under consideration were low, mainly varying
between -0.10 to 0.10. The important question that needs to be answered is: How did this impact
upon the results of the present study? Organizations participating in this study were involved in a
wide range of institutional activities and represented different work spheres that directly or indirectly
contributed to South Africa’s economy. This state of affairs implied a significant degree of
institutional heterogeneity which might be associated with large effect sizes.
However, the subjects that participated in the research were all drawn from two management levels
and specialized staff from these institutions. Whilst acknowledging heterogeneity, this final
intervention in the composition of the sample implied a greater degree of homogeneity among
participating individuals, which would be commensurate with lower effect sizes, as is confirmed by
the above range of effect sizes. In using and judging effect size, a researcher needs to assess the
presence of homogeneity and/or heterogeneity by accounting for all personal, environmental,
institutional, and other relevant factors that might impact upon the population, composition of the
sample, and potential results of an intended study.
10.6 Some limitations of the present research
The first limitation of the present study is that no specific information was obtained to determine the
individual differences that predispose individuals to cope effectively with stress. Nelson and
Simmons (2002: 108) suggest that possible factors that may be included in such studies are
amongst others optimism, locus of control, hardiness, self-reliance, and sense of coherence. These
factors are also seen as promoting eustress. Factors like these would account for more positive
primary appraisals with regard to the demands or stressors placed on them. Also it may influence at
a secondary appraisal level the individuals’ belief that they may more effectively handle a demand
or stressor.
250
A second limitation of the present study is that a convenience sample was used, consisting of
senior management, middle management, and specialist staff components specific to only four
organizational sectors and which does not represent all fields of management, types of
organizations, and ethnic distribution of all South African managers and specialist staff. The results
can therefore not be generalized to the broad spectrum of South African managers and specialist
staff.
A third limitation of the present study may be associated with the fact that only self-report data were
obtained. While self-report measures are often revealing and accurate, they can also be plagued by
many sources of error and bias, such as subjects presenting themselves in a positive light, which
can affect the validity of their self-reports (Leak & Parsons, 2001: 23; Bartz et al, 1996: 248). It
would seem important to develop alternative measures and to incorporate other sources of data.
Alternative or complementary sources of information may be obtained from human resources, from
one on one or group interviews, and the use of diaries for example.
10.7 Further research
Further research should focus on workplace stress to determine factors that may mediate the
individual’s response to stress that allows him or her to cope effectively with the demands and
stressors in and outside the workplace. These could include such factors as optimism, locus of
control, hardiness, self-reliance, and sense of coherence. With regard to workplace aggression
further research could focus on the actual frequency of workplace aggression and changes taking
place within the organization. Furthermore future research should focus on the application and
teaching of problem solving as a skill to aid those employees that are not dealing effectively with
the demands and stressors within the workplace. Other areas of interest could include the role of
emotion-focused coping thus focusing on the ability of the employee to emotionally adapt to the
stressful work situation.
10.7 Conclusion
The study set out to determine the levels and the causes of workplace stress as well as the
consequences of stress in terms of aggression in the workplace, both witnessed and experienced,
anxiety, depression, and worry for a group of 205 subjects. It also set out to assess the subjects’
ability to cope with the experienced stressors with regards to social problem solving. Generally it
was found that the subjects experienced normal levels of stress, witnessing and experiencing low
levels of workplace aggression, normal levels of anxiety, low levels of depression and worry. Their
251
ability to cope with the daily stressors in terms of social problem solving showed that they generally
had an overall high social problem solving ability and consequently normal levels of stress. The
possible explanation of the results was thought to be due to the role problem-focused or active
coping in the form of social problem solving played for participants dealing effectively with the
demands and stressors experienced in the workplace. The results may also be understood in terms
of the five stage model of Cox and McKay (Cox, 1978:18; Cox & MacKay, 1981: 101) which was
used as the basis in the development of the Work and Life Experiences Questionnaire (see section
3.2.4.1).
Cox (1978: 19) describes the first stage as representing ‘the sources of demand relating to the
person’ and it forms part of the individual’s environment. The demands and stressors impacting on
the individual both within and without the organization were measured. The second stage, which
consists of the individual’s perception of the demands and stressors and his or her ability to cope
with these, was also measured. Although it may be expected that the individual will experience
different demands and stressors in the workplace, he or she will not experience stress until he or
she has reached his or her limitations. The third stage is associated with the physical changes as
well as cognitive and behavioural responses. These aim to reduce the immediate impact of the
demands and stressors. Here the role of problem-focused coping or active through social problem
solving was found to play an important role. For most participants their positive problem orientation
as well as their rational problem solving abilities came into play enabling them to deal effectively
with the perceived demands and stressors found within and without their workplace. The fourth
stage focuses on the consequences of the coping responses, whether actual or perceived. These
include the effect of the response both on a cognitive and behavioural level. In terms of the study
this included the witnessing and experiencing of workplace aggression, anxiety, depression, and
worry. However the levels of each were found to be low or normal as could be expected when a
participant dealt effectively with their perceived stress. The fifth and last stage of the model
revolves around feedback and is found to occur at all of the other stages influencing the outcome at
each of the other stages. This could result in an individual strengthening and consolidating their
social problem solving ability in general. Homeostasis may be achieved in the face of a stressful
working environment. Furthermore it may be one factor that helps to maintain and even enhance
psychological wellbeing.
252
LIST OF REFERENCES Alder, G.S. & Tomkins, P.K. (1997). Electronic performance monitoring: An Organizational
Justice and Concertive Control Perspective. Management Communication Quarterly, 10 (3),
259 - 289.
Armstrong-Stassen, M. (2002). Designated Redundant but Escaping Lay-off: A Special Group
of Lay-off Survivors. Journal of Occupational and Organizational Psychology, 75 (1),
1 - 12.
Arnold, J. (1997). Managing careers into the 21st century. London: Paul Chapman Publishing
Ltd.
Atkinson, W. (1999). Employee fatigue. Management Review, 88 (9), 56 - 60.
Bandura, A., Taylor, C.B., Williams, S.L., Mefford, I.N., & Barchas, J.D. (1985). Catecholamine
Secretion as a Function of Perceived Coping Self-Efficacy. Journal of Consulting and Clinical
Psychology, 53 (3), 406 - 414.
Baron, R.A. (2004). Workplace Aggression and Violence. In Griffin, R.W. & O’Leary-Kelly, A.M.
(Eds). The Dark Side of Organizational Behavior. Hoboken: Jossey-Bass.
Baron, R.A. & Byrne, D. (1997). Social Psychology. 8th ed. Boston: Allyn and Bacon.
Baron, R.A. & Byrne, D. (2003). Social Psychology. 10th ed. Boston: Allyn and Bacon.
Baron, R.A., & Neuman, J.H. (1996). Workplace Violence and Workplace Aggression:
Evidence on their Relative Frequency and Potential Causes. Aggressive Behavior, 22 (3), 161 -
173.
Baron, R.A. & Richardson, D.R. (1994). Human aggression. 2nd ed. New York: Plenum.
Baron, R.A., Neuman, J.H., and Geddes, D. (1999). Social and Personal Determinants of
Workplace Aggression: Evidence for the Impact of Perceived Injustice and the Type A Behavior
Pattern. Aggressive Behavior, 25 (4), 281 - 296.
Bartz, A.E., Blume, N.E., & Rose, J. (1996). Gender Differences in Self-Report Measures of
Anger. Journal of Social Behavior and Personality, 11 (5), 241 - 253.
253
Beck, A. T., Steer, R. A., & Carbin, M. G. (1988). Psychometric properties of the Beck
Depression Inventory: Twenty-five years of evaluation. Clinical Psychology Review, 8 (1), 77 -
100.
Berkowitz, L. (1994). Is something missing? In Huessmann, L.R. (Ed.) (1994). Aggressive
Behavior: Current Perspectives. New York: Plenum Press.
Birkenbihl, V.G. (1989). Freude durch Stress. München: Moderne Verlagsgesellschaft GmBH.
Björkqvist, L., Österman, K., and Lagerspetz, K.M.J. (1994). Sex differences in covert
aggression among adults. Aggressive Behavior, 20 (1), 27 - 33.
Björkqvist, L., Österman, K., and Hjelt-Bäck, M. (1994). Aggression among university
employees. Aggressive Behavior, 20 (3), 173 - 184.
Book, A.S., Starzyk, K.B., and Quinsey, V.L. (2001). The relationship between testosterone and
aggression: a meta-analysis. Aggression and Violent Behavior, 6 (6), 579 - 599.
Bordens, K.S. & Abbott, B.B. (2002). Research Design and Methods: A Process Approach. 5th
Ed. Boston: McGraw-Hill.
Borkovec, T.D. (1994). The nature, functions, and origins of worry. In Davey, G.C.L., & Tallis, F.
(Eds.). Worrying: Perspectives on theory, assessment and treatment. Wiley series in clinical
psychology. Chichester: Wiley.
Brockner, J., Konovsky, M., Cooper-Schneider, R., Folger, R., Martin, C., & Bies, R.J. (1994).
Interactive Effects of Procedural Justice and Outcome Negativity on Victims and Survivors of
Job Loss. Academy of Mangement Journal, 37 (2), 397 - 409.
Brown, J.D. (1991). Staying Fit and Staying Well: Physical Fitness as a Moderator of Life
Stress. Journal of Personality and Social Psychology, 60 (4), 555 - 561.
Bunce, D. & West, M.A. (1996). Stress Management and Innovation Interventions at Work.
Human Relations, 49 (2), 209 - 232.
Butcher, J.N., Mineka, S. & Hooley, J.M. (2004). Abnormal Psychology. 12th ed. Boston:
Pearson-Allyn and Bacon.
254
Campbell-Jamison, F., Worral, L. & Cooper, C. (2001). Downsizing in Britain and its effects on
survivors and their organizations. Anxiety, Stress and Coping, 14 (1), 35 - 58.
Carlson, D.S., & Perrewé, P.L. (1999). The Role of Social Support in the Stressor-Strain
Relationship: An Examination of Work-Family Conflict. Journal of Management, 25 (4), 513 -
540.
Carson, R.C., Butcher, J.N. & Mineka, S. (2000). Abnormal Psychology and Modern Life. 11th
ed. Boston: Allyn and Bacon.
Cartwright, S. & Cooper, C.L. (1997). Managing Workplace Stress. Thousands Oaks: SAGE
Publications, Inc.
Carver, C.S. & Scheier, M.F. (2005). Optimism. In Snyder, C.R. & Lopez, S.J. (Eds). Handbook
of Positive Psychology. New York: Oxford University Press.
Cattell, R.B., Scheier, I.H., & Madge, E.M. (1995). Manual for the IPAT Anxiety Scale. Pretoria:
HSRC.
Chen, P.Y., & Spector, P.E. (1992). Relationships of Work Stressors with Aggression,
Withdrawal, Theft, and Substance Use: An Exploratory Study. Journal of Occupational and
Organizational Psychology, 65 (3), 177 - 184.
Chin, N.P., Monroe, A, Fiscella, K. (2000). Social Determinants of (Un)Healthy Behaviors.
Education for Health: Change in Learning and Practice, 13 (3), 317 - 328.
Coe, R. (2000). What is an ‘Effect Size’? A guide for users. CEM Centre, Durham University.
Cooper, C.L., Dewe, P. & O’Driscoll, M. (2002). Employee Assistance Programs. In Quick, J.P.
& Tetrick, L.E. (Eds). Handbook of Occupational Health Psychology. Washington: American
Psychological Association.
Cotton, D.H.G. (1990). Stress Management: An Integrated Approach to Therapy. New York:
Bruner/Mazel, Inc.
Cox, T. (1978). Stress. London: Mcmillan.
255
Cox, T. & Ferguson, E. (1991). Individual Differences, Stress and Coping. In Cooper, C.L. and
Payne, R. (Eds). Personality and stress: individual differences in the stress process. Chichester:
John Wiley & Sons Ltd.
Cox, T. & McKay, C. (1981). A transactional approach to occupational stress. In Corlett, E.N. &
Richardson, J. (Eds). Stress, work, design and productivity. Chichester: Wiley & Sons.
Cummings, T.G. & Cooper, C.L. (1998). A Cybernetic Theory of Organizational Stress. In
Cooper, C.L. (Ed.). Theories of Organizational Stress. Oxford: Oxford University Press.
Davey, G.C.L. (1994). Pathological worrying as exacerbated problem-solving. In Davey, G.C.L.,
& Tallis, F. (Eds.). Worrying: Perspectives on theory, assessment and treatment. Wiley series in
clinical psychology. Chichester: Wiley.
DeFrank, R. S. and Ivancevich, J. M. (1998). Stress on the job: An executive update. The
Academy of Management Executive, 12 (3), 55 - 66.
Densten, I. L. (2001). Re-thinking burnout. Journal of Organizational Behavior, 22 (8), 833 -
847.
Dormann, & Zapf, (2002). Social stressors at work, irritation, and depressive symptoms:
Accounting for unmeasured third variables in a multi-wave study. Journal of Occupational and
Organizational Psychology, 75 (1), 33 - 58.
Douglas, S.C. & Martinko, M.J. (2001). Exploring the Role of Individual Differences in the
Prediction of Workplace Aggression. Journal of Applied Psychology, 86 (4), 547 - 559.
Dugas, J.M., Letarte, H., Rhéaume, J., Freeston, M.H., & Ladouceur, R. (1995). Worry and
Problem Solving: Evidence of a Specific Relationship. Cognitive therapy and Research, 19 (1),
109 - 120.
Duvenhage, H. (2002). Lessenaarwoede die nuwe bedreiging by die werk. Rapport, Sunday,
10th February, 2002.
D’Zurilla, T.J. & Nezu, A.M. (1990). Development and Preliminary Evaluation of the Social
Problem-Solving Inventory. Psychological Assessment, 2 (2), 156 - 163.
256
D’Zurilla, T.J. Nezu, A.M., & Maydeu-Olivares, A. (1996). Social Problem-Solving Inventory-
Revised (SPSI-R) Test Manual. State University of New York at Stony Brook, Stony Brook: New
York.
D’Zurilla, T.J. Nezu, A.M., & Maydeu-Olivares, A. (2002). Social Problem-Solving Inventory-
Revised (SPSI-R) Test Manual. Multi-health Systems Inc.: North Tonawanda, NY.
Edwards, D.C. (1999). Motivation and Emotion: Evolutionary, Physiological, Cognitive, and
Social Influences. Thousand Oaks: SAGE Publications, Inc.
Elfering, A., Grebner, S., Semmer, N.K., Kaiser-Freiburghauser, D., Lauper-Del Ponte, S., &
Witschi, I. (2005). Chronic job stressors and job control: Effects on event-related coping
success and well-being. Journal of Occupational and Organizational Psychology, 78, 237 – 252.
Eron, L.D. (1994). Theories of Aggression. In Huesmann, L.R. (Ed.) (1994). Aggressive
Behavior: Current Perspectives. New York: Plenum Press.
Executive stress and the art of balanced living. (1991). Rehabilitation in South Africa,
(December), 102 - 104.
Flannery, R.B. Jr. (1996). Violence in the Workplace, 1970-1995: a review of the literature.
Aggression and Violent Behavior, 1(1), 57 - 68.
Forshaw, M. (2002). Essential Health Psychology. London: Oxford University Press Inc.
Fresco, D.M., Heimberg, R.G., Mennin, D.S., and Turk, C.L. (2002). Cofirmatory factor analysis
of the Penn State Worry Questionnaire. Behavior Research and Therapy, 40, 313 - 323.
Gardner, D.G., Cummings, L.L., Dunham, R.B., & Pierce, J.L. (1998). Single-item versus
multiple scales: An empirical comparison. Educational and Psychological Measurement, 58 (6),
1 - 13.
Geen, R.G. (2001). Human Aggression. (2nd Edition). Buckingham: Open University Press.
Genco, P. (2000). Technostress in Our Schools and Lives. Book Report, September/ October,
19 (2), 42 - 43.
257
Greenglass, E.R., & Burke, R.J. (2001). Editorial Introduction-Downsizing and Restructuring:
Implications for Stress and Anxiety. Anxiety, Stress & Coping, 14 (1), 1 - 13.
Goleman, D. (1996). Emotional Intelligence: Why it can matter more than IQ. London:
Bloomsbury.
Hammer, T.H., Saksvik, P.O., Nytrø, K., Torvatn, H., & Bayazit, M. (2004). Expanding the
Psychosocial Work Environment: Workplace Norms and Work-Family Conflict as Correlates of
Stress and Health. Journal of Occupational Psychology, 9 (1), 83 - 97.
Hawton, K & Kirk, J. (1989). Problem-solving. In Hawton, K., Salkovskis, P.M., Kirk, J. & Clark,
D.M. (Eds). Cognitive Behaviour Therapy for Psychiatric Problems: A Practical Guide. Oxford:
Oxford University Press.
Heppner, P.P., Kivlighan, D.M.,Jr, & Wampold, B.E. (1992). Research Design in Counseling.
Pacific Grove: Brooks/Cole Publishing Company.
Heppner, P.P. & Lee, D. (2005). In Snyder, C.R. & Lopez, S.J. (Eds.). Handbook of Positive
Psychology. New York: Oxford University Press.
Heylin, M. (2004). Employment and Salary Survey. Chemical and Engineering News, 82 (33),
26 - 38.
Hogh, A., Borg, V., & Mikkelsen, K.L. (2003). Work-related violence as a predictor of fatigue: A
5-year follow-up of the Danish Work Environment Cohort Study. Work & Stress, 17 (2), 182 -
194.
Jackson, S.E. (1983). Participation in Decision Making: A Strategy for Reducing Job-Related-
Strain. Journal of Applied Psychology, 68 (1), 3 - 19.
Jackson, S.L. (2006). Research Methods and Statistics: A Critical Thinking Approach. 2nd ed.
Belmont: Thomson-Wadsworth.
Jex, S.M. & Thomas, J.L. (2003). Relations between stressors and group perceptions: main and
mediating effects. Work & Stress, 17 (2), 158 - 169.
Jick, T.D., & Mitz, L.F. (1985). Sex Differences in Work Stress. Academy of Management
Review, 10 (3), 408 - 420.
258
Kant, G.L., D’Zurilla, T.J., and Maydeu-Olivares, A. (1997). Social Problem Solving as a
Mediator of Stress-Related Depression and Anxiety in Middle-Aged and Elderly Community
Residents. Cognitive Therapy and Research, 21 (1), 73 - 96.
Kaplan, H.I., Sadock, B.J., and Grebb, J.A. (1994). Synopsis of Psychiatry: Behavioral Sciences
Clinical Psychiatry. 7th ed. Baltimore: Williams & Wilkins.
Kaukiainen, A., Salmivalli, C., Björkqvist, K., Österman, K., Lahtinen, A., Kostamo, A., and
Lagerspetz, K. (2001). Overt and Covert Aggression in Work Settings in Relation to the
Subjective Well-Being of Employees. Aggressive Behavior, 27, 360 - 371.
Keogh, E., French, C., & Reidy, J. (1998). Predictors of Worry. Anxiety, Stress & Coping, 11(1),
67 - 80.
King, J.E. (2000). White-collar reactions to job insecurity and the role of the psychological
contract: implications for human resource management. Human Resource Management, 39 (1),
79 - 92.
Kivimäki, M., Vahtera, J., Thomson, L., Griffiths, A., Cox, T. & Pentti, J. (1997). Psychosocial
Factors Predicting Employee Sickness Absence During Economic Decline. Journal of Applied
Psychology, 82 (6), 858 - 872.
Kivimäki, M., Vahtera, J., Pentti, J. & Ferrie, J.E. (2000). Factors Underlying the Effect of
Organizational Downsizing on Health of Employees: Longitudinal Cohort Study. British Medical
Journal, 320 (724), 971 - 975.
Kobasa, S.C., Maddi, S.R., & Kahn, S. (1982). Hardiness and health: A prospective study.
Journal of Personality and Social Psychology, 42, 168 - 177.
Koeske, G.F. & Kirk, S.A. (1993). Coping with Job Stress: Which Strategies work best? Journal
of Occupational & Organizational Psychology, 66 (4), 319 - 335.
Krahé, B. (2001).The Social Psychology of Aggression. Hove, East Sussex: Psychology Press.
Lazarus, R.S. & Folkman, S. (1984). Stress, appraisal and coping. New York: Springer.
Leak, G.K & Parsons, C.J. (2001). The susceptibility of three attachment style measures to
socially desirable responding. Social Behavior and Personality, 29 (1), 21 - 30.
259
Leather, P., Lawrence, C., Beale, D., Cox, T., & Dickson, R. (1998). Exposure to occupational
violence and the buffering effects of intra-organizational support. Work & Stress, 12 (2), 161 -
178.
Lim, V.K.G. (1996). Job Insecurity and Its Outcomes: Moderating Effects of Work-Based and
Nonwork-Based Social Support. Human Relations, 49 (2), 171 - 194.
Lindsay, J.J. & Anderson, C.A. (2000). From Antecedent Conditions to Violent Actions: A
General Affective Aggression Model. Personality and Social Psychology Bulletin, 26 (5), 533 -
547.
Lounsbury, J.W. & Hoopes, L.L. (1986). A Vacation from Work: Changes in Work and Nonwork
Outcomes. Journal of Applied Psychology, 71 (3), 392 - 401.
Luthans, F. (2002). Organizational Behavior. 9thed. (International Edition). New York: McGraw-
Hill, Inc.
Maddi, S.R. (1996). Personality Theories: A Comparative Analysis. 6th ed. Pacific Grove:
Brooks/Cole Publishing Company.
Marais, E.N. & Schepers, J.M. (1996). The effect of organizational restructuring on job
satisfaction, career aspirations, and stress levels of employees. Journal of Industrial
Psychology, 22 (3), 1 - 6.
Martinko, M.J. & Zellars, K.L. (1998). Toward a theory of workplace violence and aggression: A
cognitive appraisal perspective. In Griffin, R.W., O’Leary-Kelly, A. & Collins, J. M. (Eds).
Dysfunctional behavior in organizations: Violent and deviant behavior (1 - 42). Stamford, CT:
JAI Press Inc.
Maslach, C., Schaufeli, W.B., & Leiter, M. (2001). Job Burnout. Annual Review of Psychology,
52, 397 - 422.
May, R. & Yalom, I. (1989). Existential Psychotherapy. In Corsini, R.J. & Wedding, D. Current
Psychotherapies. 4th ed. Itasca: F.E. Peacock Publishers, Inc.
Maydeu-Olivares, A., and D’Zurilla, T.J. (1996). A Factor-Analytic Study of the Social Problem-
Solving Inventory: An Integration of Theory and Data. Cognitive Therapy and Research, 20 (2),
115 - 133.
260
McKay, M., Rogers, P.D. & McKay, J. (2003). 2nd Ed. When Anger Hurts: Quieting the Storm
Within. Oakland: New Harbinger.
McMillan, J.H. & Schumacher, S. (2001). Research in Education: A Conceptual Introduction.
New York: Addison Wesley Longman.
Michalak, E. E., Murray, G., Wilkinson, C., Dowrick, C., Lasa, L., Lehtinen, V., Dalgard, O. S.,
Ayuso-Mateos, J. L., Vázquez-Barquero, J. L., Casey, P., the ODIN group. (2004). Estimating
depression prevalence from the Beck Depression Inventory: is season of administration a
moderator? Psychiatry Research, 129 (1), 99 - 106.
Molina, S., & Borkovec, T.D. (1994). In G.C.L. Davey. & F. Tallis. (Eds.). Worrying: Perspectives
on theory, assessment and treatment. Wiley series in clinical psychology. Chichester: Wiley.
Molina, S., Borkovec, T.D., Peasley, C., and Person, D. (1998). Content analysis of worrisome
streams of consciousness in anxious and dysphoric participants. Cognitive Therapy and
Research, 22 (2), 109 - 123.
Moller, A.T. & Spangenberg, J.J. (1996). Stress and coping amongst South African dentists in
private practice. Journal of the Dental Association of South Africa, 51 (6), 347 - 357.
Moorhead, G. & Griffin, R.W. (1989). Organizational Behavior. 2nd ed. Boston: Houghton Mifflin
Company.
Murphy, L.R. (1995). Managing Job Stress: An Employee Assistance Human Resource
Management Partnership. Personnel Review, 24 (1), 41 - 50.
Murphy, L.R. (1996). Stress Management in Work Settings: A Critical Review of the Health
Effects. American Journal of Health Promotion, 11 (2), 112 - 135.
Nelson, D.L., & Quick, J.C. (1985). Professional Women: Are Distress and Disease Inevitable?
Academy of Management Review, 10 (2), 206 - 218.
Nelson, D.L. & Simmons, B.L. (2002). Health Psychology and Work Stress. In Quick, J.P. &
Tetrick, L.E. (Eds). Handbook of Occupational Health Psychology. Washington: American
Psychological Association.
261
Neuman, J.H. & Baron, R.A. (1998). Workplace violence and workplace aggression: Evidence
concerning specific forms, potential causes, and preferred targets. Journal of Management, 24
(3), 391 - 419.
Nolen-Hoeksema, S., McBride, A. and Larson, J. (1997). Rumination and psychological distress
among bereaved partners. Journal of Personality and Social Psychology, 72, 855 - 862.
O’Leary-Kelly, A.M., Griffin, A.M., & Glew, D.J. (1996). Organization-motivated aggression: a
research framework. Academy of Management Review, 21 (1), 225 - 253.
Parkes, K.R. (1994). Personality and coping as moderators of work stress processes, methods
and measures. Work & Stress, 8 (2), 110 - 129.
Perri, M.G., Nezu, A.M. & Viegener, B.J. (1992). Improving the Long-Term Management of
Obesity: Theory, Research, and Clinical Guidelines. New York: John Wiley & Sons.
Podsakoff, P.M. & Organ, D.W. (1986). Self-Reports in Organizational Research: Problems and
Prospects. Journal or Management, 12 (4), 531 - 544.
Pollard, T.M. (2001). Changes in mental well-being, blood pressure and total cholesterol levels
during workplace reorganization: the impact of uncertainty. Work & Stress, 15 (1), 14-28.
Presbury, J.H., Echterling, L.G., & McKee, J. E. (2002). Ideas and Tools for Brief Counseling.
New Jersey: Pearson Education, Inc.
Quick, J.P. & Tetrick, L.E. (Eds). Handbook of Occupational Health Psychology. Washington:
American Psychological Association.
Quick, J.P., Quick, J.D., Nelson & Hurrell, J.J. (1997). Preventive Stress Management in
Organizations. Washington: American Psychological Association.
Reader’s Digest. (1993). The Reader’s Digest Oxford Complete Wordfinder. London:The
Reader’s Digest Association.
Robinson, S.L. & Greenberg, J. (1998). Employees Behaving Badly: Dimensions, determinants,
and Dilemmas in the Study of Workplace Deviance, In Rousseau, D.M. & Cooper, C. (Eds.).
Trends in Organizational Behavior. Vol 5, 1 - 30. New York: Wiley.
262
Rosa, R.R. (1995). Extended work shifts and excessive fatigue. Journal of Sleep Research, 4
(Suppl.), 51 - 56.
Roskies, E. & Louis-Guerin, C. (1990). Job insecurity in managers: Antecedents and
consequences. Journal of Organizational Behavior, 11 (5), 345 - 359.
Rutter, A. & Hine, D.W. (2005). Sex Differnces in Workplace Aggression: An Investigation of
Moderation and Mediation Effects. Journal of Aggressive Behavior, 31 (3), 254 - 270
Sanchez, J. I., Spector, P.E. & Cooper, C. L. (2000). Adapting to a boundaryless world: A
developmental expatriate model. The Academy of Management Executive, 14 (2), 96 - 106.
Schaufeli, W.B. (2003). Past Performance and Future Perspectives of Burnout Research. SA
Journal of Industrial Psychology, 29 (4), 1 - 15.
Scheck, C.L. and Kinicki, A.J. (2000). Identifying the antecedents of coping with an
organizational acquisition: a structural assessment. Journal of Organizational Behavior, 21, 627
- 648.
Schell, B.H. (1997). A Self-Diagnostic Approach to Understanding Organizational and Personal
Stressors. Westport, Connecticut: Quorum Books.
Schneider, K., & Northcraft, G.B. (1999). Three Social Dilemmas of Workforce Diversity in
Organizations: A Social Identity Perspective. Human Relations, 52 (11), 1445 - 1467.
Schonfeld, I.S. (2000). An updated look at depressive symptoms and job satisfaction in first-
year women teachers. Journal of Occupational and Organizational Psychology, 73 (3), 363 -
372).
Sikora, P.B., Beaty, E.D. & Forward, J. (2004). Updating Theory on Organizational Stress: The
Asynchronous Multiple Overlapping Change (AMOC) Model of Workplace Stress. Human
Resource Development Review, 3 (1), 3 - 35.
Smith, C.S., Folkard, S., & Fuller, J.A. (2002). Shiftwork and Working Hours. In Quick, J.P. &
Tetrick, L.E. (Eds). Handbook of Occupational Health Psychology. Washington: American
Psychological Association.
263
Smithson, J., & Lewis, S. (2000). Is Job Insecurity changing the Psychological Contract?
Personnel Review, 29 (6), 680 - 698.
Snow, D.L., Swan, S.C., Raghavan, C., Connel, C.M., & Klein, I. (2003). The relationship of
work stressors, coping and social support to psychological symptoms among female secretarial
employees. Work & Stress, 17 (3), 241 - 263.
Spangenberg, J.J. & Orpen-Lyall, M.R. (2000). Stress and Coping Strategies in a Sample of
South African Managers involved in Post-Graduate Managerial Studies. Journal of Industrial
Psychology, 26 (1), 6 - 10.
Sparks, K., Faragher , B., and Cooper, C. L. (2001). Well-being and occupational health in the
21st century workplace. Journal of Occupational and Organizational Psychology, 74 (4), 489 -
509.
Strydom, S.C. & Meyer, J.C. (2002). ‘n Ondersoek na die Bronne van Werkstevredenheid en
Werkstres onder Middelvlakbestuurders in die Wes-Kaap. South African Journal of Industrial
Psychology, 28 (2), 15 - 22.
Sutherland, V.L., & Cooper, C.L. (2000). Strategic Stress Management: An Organizational
Approach. Hampshire: Palgrave.
Szondi, L. (1972). Lehrbuch der experimentellen Triebdiagnostik Band I-Textband. Bern: Verlag
Huber.
Terluin, B., Van Rhenen, W., Schaufeli, W.B., & De Haan, M. (2004). The Four-Dimensional
Symptom Questionnaire (4DSQ): measuring distress and other mental health problems in a
working population. Work and Stress, 18 (3), 187 - 207.
Tetrick, L.E. & Quick, J.P. (2002). Prevention at Work: Public Health in Occupational Settings.
In Quick, J.P. & Tetrick, L.E. (Eds). Handbook of Occupational Health Psychology. Washington:
American Psychological Association.
Theorell, T. (2002). To be able to Exert Control Over One’s Own Situations: A Necessary
Condition for Coping with Stressors. In Quick, J.P. & Tetrick, L.E. (Eds). Handbook of
Occupational Health Psychology. Washington: American Psychological Association.
264
Torkelson, E. & Muhonen, T. (2003). Stress and health among women and men in a Swedish
telecom company. European Journal of Work and Organizational Psychology, 12 (2), 171 - 186.
Tulloch, S. (Ed.). (1993). Reader’s Digest Oxford Complete Wordfinder. London: The Reader’s
Digest Association Limited.
Van der Ploeg, E., Dorresteijn, S.M., & Kleber, R.J. (2003). Critical Incidents and Chronic
Stressors at Work: Their Impact on Forensic Doctors. Journal of Occupational Health
Psychology, 8 (2), 157 - 166.
Van Zyl, E.S. (1993). Stress, soos ervaar deur die hoëvlak Swart werknemer in Suid-Afrika.
Journal of Industrial Psychology, 19 (3), 36 - 39.
Van Zyl, E.S. (1996). The experience of stress in a group of lower level black and white
employees involved in manual tasks. South African Journal of Management Sciences, 18 (3),
118 - 134.
Van Zyl, E.S. (1997). Die verband tussen stress en organisasieklimaat by ‘n groep middelvlak
bestuurders in die finansiële sektor. Tydskrif vir Geesteswetenskappe, 19 (3), 138 - 143.
Van Zyl, E.S. (1998). Die Effek van Regstellende Aksie op die Streservaring van ‘n Groep Swart
Werknemers. Journal of Industrial Psychology, 24 (1), 22 - 25.
Van Zyl, E.S. (2002). The Measurement of Work Stress within South African Companies: A
Luxury or a Necessity? South African Journal of Industrial Psychology, 28 (3), 26 - 31.
Van Zyl, E.S., & Pietersen, C. (1999). An investigation into work stress experienced by a group
of secondary school teachers. South African Journal of Education, 19 (1), 74 - 78.
Van Zyl, E.S., & Van der Walt, H.S. (1991). Manual for the Experience of Work and Life
Circumstances Questionnaire. Pretoria: HSRC.
Wainwright, D. & Calnan, M. (2002). Work Stress: The making of a modern epidemic.
Buckingham: Open University Press.
Weiss, H.M., Ilgen, D.R. & Sharbaugh, M.E. (1982). Effects of Life and Job Stress on
Information Search Behaviors of Organizational Members. Journal of Applied Psychology, 67
(1), 60 - 66.
265
Wiebe, D.J. & McCallum, D.M. (1986). Health practices and hardiness of mediators in the
stress-illness relationship. Health Psychology, 5 (5), 425 - 438.
Williams, K.D., & Sommer, K.L. (1997). Social ostracism by coworkers: Does rejection lead to
loafing of compensation? Personality and Social Psychology Bulletin, 23 (7), 693 - 706.
Wills, F. & Sanders, D. (1997). Cognitive Therapy: Transforming the Image. London: SAGE
Publications.
Whitley, B.E. Jr. (2002). Principles of Research in Behavioral Science. 2nd ed. Boston: McGraw
Hill.
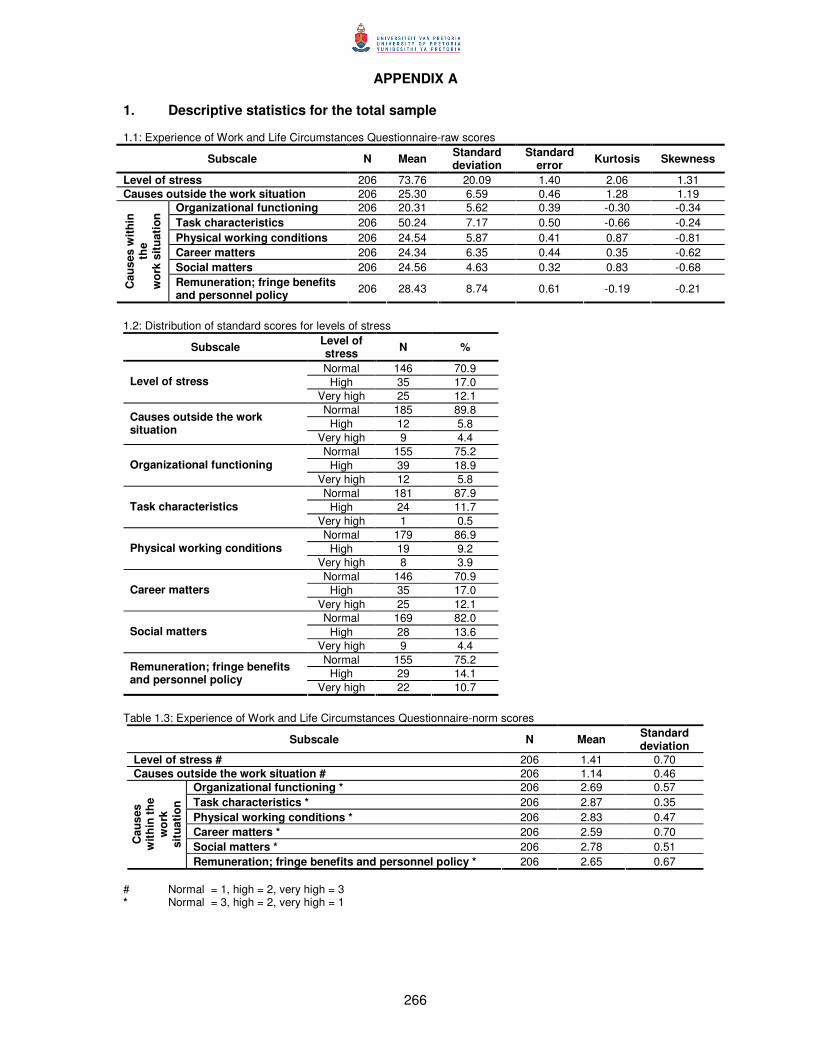
266
APPENDIX A
1. Descriptive statistics for the total sample
1.1: Experience of Work and Life Circumstances Questionnaire-raw scores Subscale N Mean Standard
deviation Standard
error Kurtosis Skewness
Level of stress 206 73.76 20.09 1.40 2.06 1.31 Causes outside the work situation 206 25.30 6.59 0.46 1.28 1.19
Organizational functioning 206 20.31 5.62 0.39 -0.30 -0.34 Task characteristics 206 50.24 7.17 0.50 -0.66 -0.24 Physical working conditions 206 24.54 5.87 0.41 0.87 -0.81 Career matters 206 24.34 6.35 0.44 0.35 -0.62 Social matters 206 24.56 4.63 0.32 0.83 -0.68
Cau
ses
with
in
the
wor
k si
tuat
ion
Remuneration; fringe benefits and personnel policy 206 28.43 8.74 0.61 -0.19 -0.21
1.2: Distribution of standard scores for levels of stress
Subscale Level of stress N %
Normal 146 70.9 High 35 17.0 Level of stress
Very high 25 12.1 Normal 185 89.8
High 12 5.8 Causes outside the work situation
Very high 9 4.4 Normal 155 75.2
High 39 18.9 Organizational functioning Very high 12 5.8 Normal 181 87.9
High 24 11.7 Task characteristics Very high 1 0.5 Normal 179 86.9
High 19 9.2 Physical working conditions Very high 8 3.9 Normal 146 70.9
High 35 17.0 Career matters Very high 25 12.1 Normal 169 82.0
High 28 13.6 Social matters Very high 9 4.4 Normal 155 75.2
High 29 14.1 Remuneration; fringe benefits and personnel policy
Very high 22 10.7 Table 1.3: Experience of Work and Life Circumstances Questionnaire-norm scores
Subscale N Mean Standard deviation
Level of stress # 206 1.41 0.70 Causes outside the work situation # 206 1.14 0.46
Organizational functioning * 206 2.69 0.57 Task characteristics * 206 2.87 0.35 Physical working conditions * 206 2.83 0.47 Career matters * 206 2.59 0.70 Social matters * 206 2.78 0.51 C
ause
s w
ithin
the
wor
k si
tuat
ion
Remuneration; fringe benefits and personnel policy * 206 2.65 0.67 # Normal = 1, high = 2, very high = 3 * Normal = 3, high = 2, very high = 1

267
1.4: Reliability coefficients Cronbach alpha for the Experience of Work and Life Circumstances Questionnaire Variable N Cronbach alpha
Overall WLQ 206 0.848 Level of stress 206 0.950 Causes outside the work situation 206 0.804
Organizational functioning 206 0.829 Task characteristics 206 0.738 Physical working conditions 206 0.837 Career matters 206 0.845 Social matters 206 0.794
Cau
ses
with
in
the
wor
k si
tuat
ion
Remuneration; fringe benefits and personnel policy 206 0.891 1.5: Aggression in the Workplace-witnessed
Scale (Witnessed) N Mean Standard
deviation Standard
error Kurtosis Skewness
Overall 205 75.58 20.69 1.45 -0.17 0.57 Expressions of Hostility 205 37.27 11.57 0.81 -0.21 0.52 Obstructionism 205 26.43 8.05 0.56 0.43 0.60 Overt Aggression 205 11.87 3.37 0.24 3.60 1.70
1.6: Aggression in the Workplace-experienced
Scale (Experienced) N Mean Standard
deviation Standard
error Kurtosis Skewness
Overall 206 63.18 19.34 1.35 1.93 0.71 Expressions of Hostility 206 30.30 10.36 0.72 1.53 0.80 Obstructionism 205 22.49 7.98 0.56 1.25 0.98 Overt Aggression 203 10.66 2.78 0.19 12.57 3.07
1.7: Reliability coefficients Cronbach alpha for the Aggression in the Workplace Questionnaire
Witnessed N Cronbach alpha Experienced N Cronbach alpha
Overall 205 0.943 Overall 206 0.950 Expressions of Hostility 202 0.881 Expressions of Hostility 202 0.874 Obstructionism 202 0.873 Obstructionism 202 0.876 Overt Aggression 202 0.886 Overt Aggression 202 0.901 1.8: IPAT Anxiety Scale
Scale N Mean Standard deviation
Standard error Kurtosis Skewness
Factor -C 206 3.69 2.44 0.17 -0.012 0.61 Factor L 206 3.36 1.92 0.13 -0.47 0.13 Factor O 206 8.24 4.18 0.29 -0.39 0.40 Factor -Q3 206 4.82 2.89 0.20 0.14 0.52 Factor Q4 206 6.56 3.91 0.27 -0.66 0.34 Score A 206 13.89 6.29 0.44 -0.12 0.43 Score B 206 12.80 7.04 0.49 -0.41 0.43 Total score 206 26.68 12.17 0.85 -0.22 0.41 1.9: Reliability coefficients Cronbach alpha for the IPAT Anxiety Scale
Scale N Cronbach alpha Factor -C 188 0.916 Factor L 189 0.917 Factor O 203 0.931 Factor -Q3 192 0.844 Factor Q4 199 0.930 Score A 205 0.932 Score B 204 0.956 Total score 206 0.977 1.10: Beck Depression Inventory
Scale N Mean Standard deviation
Standard error Kurtosis Skewness
Depression 205 6.93 6.57 0.46 3.08 1.70
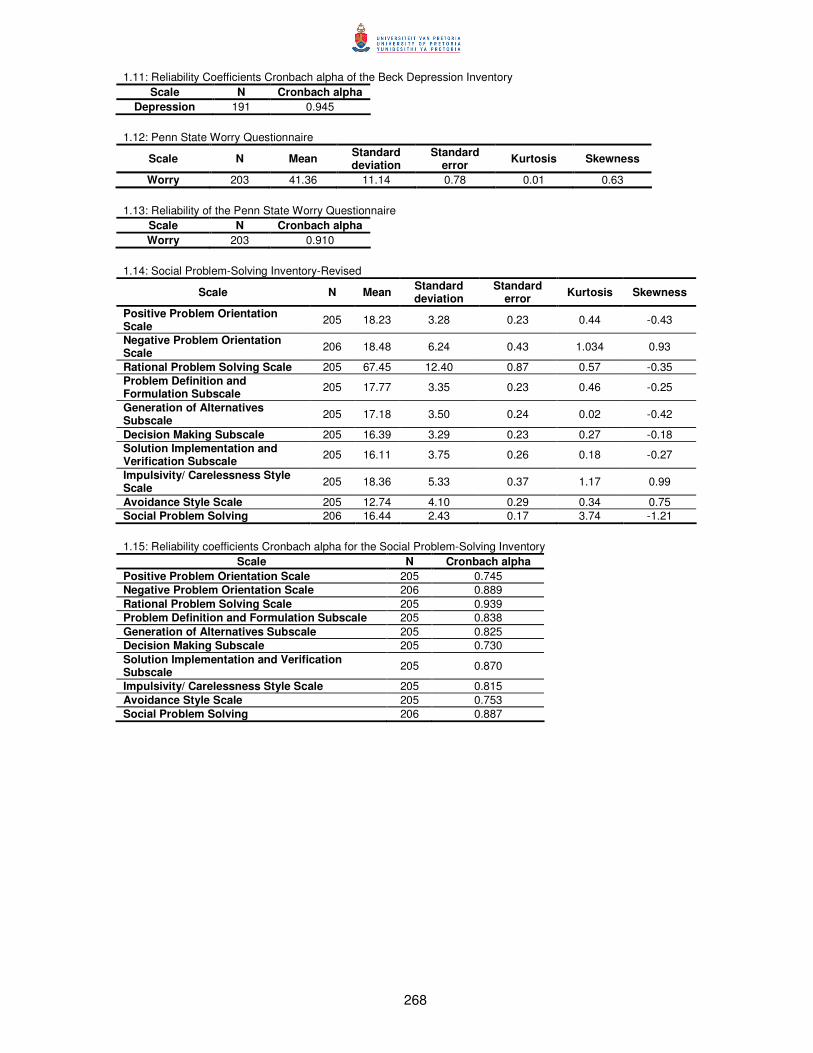
268
1.11: Reliability Coefficients Cronbach alpha of the Beck Depression Inventory Scale N Cronbach alpha
Depression 191 0.945 1.12: Penn State Worry Questionnaire
Scale N Mean Standard deviation
Standard error Kurtosis Skewness
Worry 203 41.36 11.14 0.78 0.01 0.63 1.13: Reliability of the Penn State Worry Questionnaire
Scale N Cronbach alpha Worry 203 0.910
1.14: Social Problem-Solving Inventory-Revised
Scale N Mean Standard deviation
Standard error Kurtosis Skewness
Positive Problem Orientation Scale 205 18.23 3.28 0.23 0.44 -0.43
Negative Problem Orientation Scale 206 18.48 6.24 0.43 1.034 0.93
Rational Problem Solving Scale 205 67.45 12.40 0.87 0.57 -0.35 Problem Definition and Formulation Subscale 205 17.77 3.35 0.23 0.46 -0.25
Generation of Alternatives Subscale 205 17.18 3.50 0.24 0.02 -0.42
Decision Making Subscale 205 16.39 3.29 0.23 0.27 -0.18 Solution Implementation and Verification Subscale 205 16.11 3.75 0.26 0.18 -0.27
Impulsivity/ Carelessness Style Scale 205 18.36 5.33 0.37 1.17 0.99
Avoidance Style Scale 205 12.74 4.10 0.29 0.34 0.75 Social Problem Solving 206 16.44 2.43 0.17 3.74 -1.21 1.15: Reliability coefficients Cronbach alpha for the Social Problem-Solving Inventory
Scale N Cronbach alpha Positive Problem Orientation Scale 205 0.745 Negative Problem Orientation Scale 206 0.889 Rational Problem Solving Scale 205 0.939 Problem Definition and Formulation Subscale 205 0.838 Generation of Alternatives Subscale 205 0.825 Decision Making Subscale 205 0.730 Solution Implementation and Verification Subscale 205 0.870
Impulsivity/ Carelessness Style Scale 205 0.815 Avoidance Style Scale 205 0.753 Social Problem Solving 206 0.887
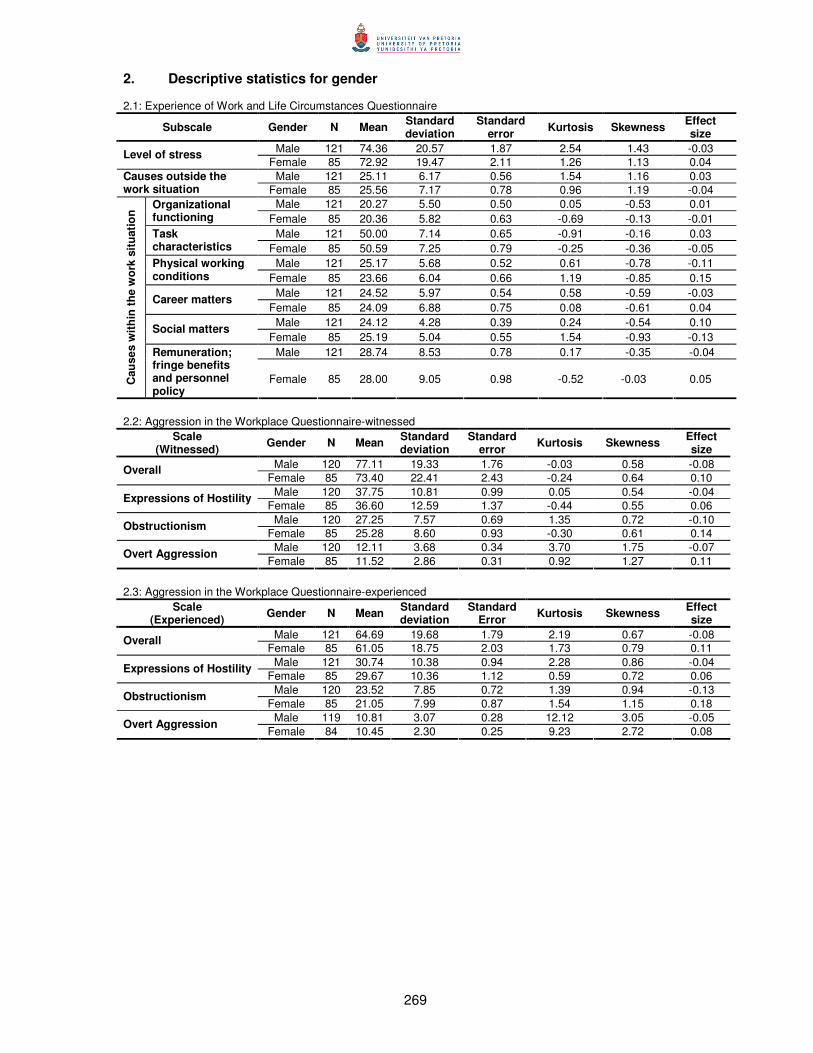
269
2. Descriptive statistics for gender 2.1: Experience of Work and Life Circumstances Questionnaire
Subscale Gender N Mean Standard deviation
Standard error Kurtosis Skewness Effect
size Male 121 74.36 20.57 1.87 2.54 1.43 -0.03 Level of stress
Female 85 72.92 19.47 2.11 1.26 1.13 0.04 Male 121 25.11 6.17 0.56 1.54 1.16 0.03 Causes outside the
work situation Female 85 25.56 7.17 0.78 0.96 1.19 -0.04 Male 121 20.27 5.50 0.50 0.05 -0.53 0.01 Organizational
functioning Female 85 20.36 5.82 0.63 -0.69 -0.13 -0.01 Male 121 50.00 7.14 0.65 -0.91 -0.16 0.03 Task
characteristics Female 85 50.59 7.25 0.79 -0.25 -0.36 -0.05 Male 121 25.17 5.68 0.52 0.61 -0.78 -0.11 Physical working
conditions Female 85 23.66 6.04 0.66 1.19 -0.85 0.15 Male 121 24.52 5.97 0.54 0.58 -0.59 -0.03 Career matters
Female 85 24.09 6.88 0.75 0.08 -0.61 0.04 Male 121 24.12 4.28 0.39 0.24 -0.54 0.10 Social matters
Female 85 25.19 5.04 0.55 1.54 -0.93 -0.13 Male 121 28.74 8.53 0.78 0.17 -0.35 -0.04
Cau
ses
with
in th
e w
ork
situ
atio
n
Remuneration; fringe benefits and personnel policy
Female 85 28.00 9.05 0.98 -0.52 -0.03 0.05
2.2: Aggression in the Workplace Questionnaire-witnessed
Scale (Witnessed) Gender N Mean Standard
deviation Standard
error Kurtosis Skewness Effect size
Male 120 77.11 19.33 1.76 -0.03 0.58 -0.08 Overall Female 85 73.40 22.41 2.43 -0.24 0.64 0.10
Male 120 37.75 10.81 0.99 0.05 0.54 -0.04 Expressions of Hostility Female 85 36.60 12.59 1.37 -0.44 0.55 0.06
Male 120 27.25 7.57 0.69 1.35 0.72 -0.10 Obstructionism Female 85 25.28 8.60 0.93 -0.30 0.61 0.14
Male 120 12.11 3.68 0.34 3.70 1.75 -0.07 Overt Aggression Female 85 11.52 2.86 0.31 0.92 1.27 0.11
2.3: Aggression in the Workplace Questionnaire-experienced
Scale (Experienced) Gender N Mean Standard
deviation Standard
Error Kurtosis Skewness Effect size
Male 121 64.69 19.68 1.79 2.19 0.67 -0.08 Overall Female 85 61.05 18.75 2.03 1.73 0.79 0.11
Male 121 30.74 10.38 0.94 2.28 0.86 -0.04 Expressions of Hostility Female 85 29.67 10.36 1.12 0.59 0.72 0.06
Male 120 23.52 7.85 0.72 1.39 0.94 -0.13 Obstructionism Female 85 21.05 7.99 0.87 1.54 1.15 0.18
Male 119 10.81 3.07 0.28 12.12 3.05 -0.05 Overt Aggression Female 84 10.45 2.30 0.25 9.23 2.72 0.08
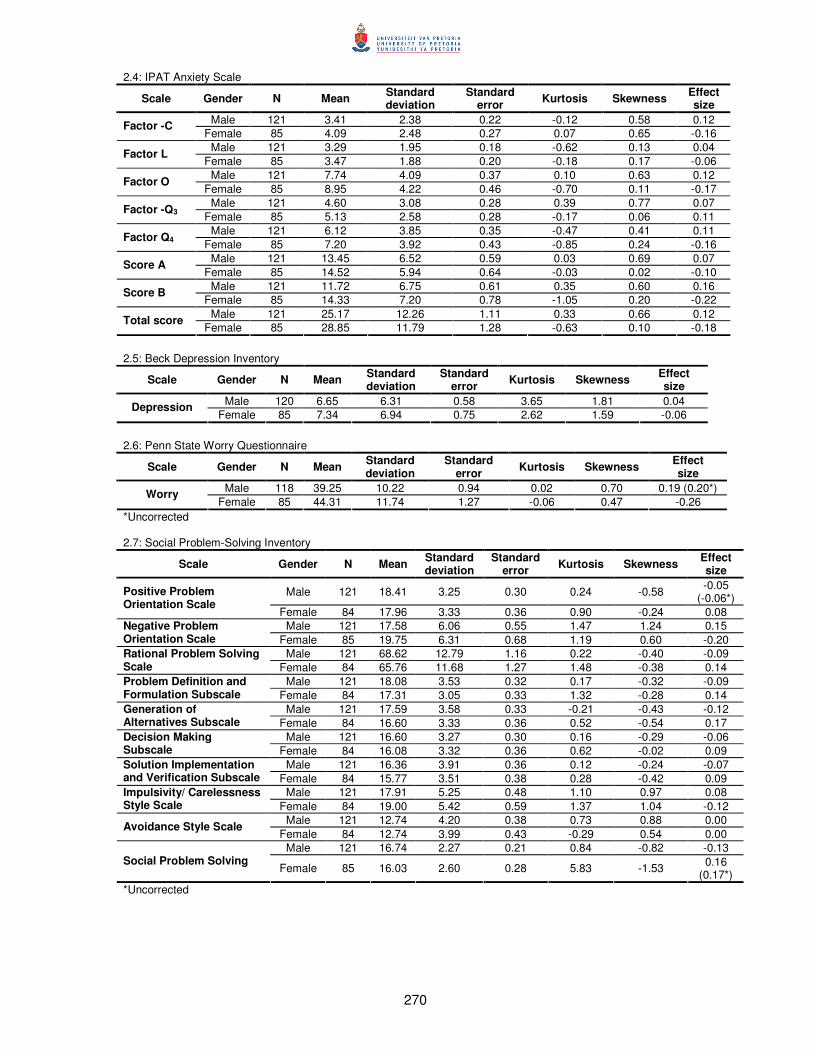
270
2.4: IPAT Anxiety Scale
Scale Gender N Mean Standard deviation
Standard error Kurtosis Skewness Effect
size Male 121 3.41 2.38 0.22 -0.12 0.58 0.12 Factor -C
Female 85 4.09 2.48 0.27 0.07 0.65 -0.16 Male 121 3.29 1.95 0.18 -0.62 0.13 0.04 Factor L
Female 85 3.47 1.88 0.20 -0.18 0.17 -0.06 Male 121 7.74 4.09 0.37 0.10 0.63 0.12 Factor O
Female 85 8.95 4.22 0.46 -0.70 0.11 -0.17 Male 121 4.60 3.08 0.28 0.39 0.77 0.07 Factor -Q3 Female 85 5.13 2.58 0.28 -0.17 0.06 0.11 Male 121 6.12 3.85 0.35 -0.47 0.41 0.11 Factor Q4 Female 85 7.20 3.92 0.43 -0.85 0.24 -0.16 Male 121 13.45 6.52 0.59 0.03 0.69 0.07 Score A
Female 85 14.52 5.94 0.64 -0.03 0.02 -0.10 Male 121 11.72 6.75 0.61 0.35 0.60 0.16 Score B
Female 85 14.33 7.20 0.78 -1.05 0.20 -0.22 Male 121 25.17 12.26 1.11 0.33 0.66 0.12 Total score
Female 85 28.85 11.79 1.28 -0.63 0.10 -0.18 2.5: Beck Depression Inventory
Scale Gender N Mean Standard deviation
Standard error Kurtosis Skewness Effect
size Male 120 6.65 6.31 0.58 3.65 1.81 0.04 Depression
Female 85 7.34 6.94 0.75 2.62 1.59 -0.06 2.6: Penn State Worry Questionnaire
Scale Gender N Mean Standard deviation
Standard error Kurtosis Skewness Effect
size Male 118 39.25 10.22 0.94 0.02 0.70 0.19 (0.20*) Worry
Female 85 44.31 11.74 1.27 -0.06 0.47 -0.26 *Uncorrected 2.7: Social Problem-Solving Inventory
Scale Gender N Mean Standard deviation
Standard error Kurtosis Skewness Effect
size
Male 121 18.41 3.25 0.30 0.24 -0.58 -0.05 (-0.06*) Positive Problem
Orientation Scale Female 84 17.96 3.33 0.36 0.90 -0.24 0.08
Male 121 17.58 6.06 0.55 1.47 1.24 0.15 Negative Problem Orientation Scale Female 85 19.75 6.31 0.68 1.19 0.60 -0.20
Male 121 68.62 12.79 1.16 0.22 -0.40 -0.09 Rational Problem Solving Scale Female 84 65.76 11.68 1.27 1.48 -0.38 0.14
Male 121 18.08 3.53 0.32 0.17 -0.32 -0.09 Problem Definition and Formulation Subscale Female 84 17.31 3.05 0.33 1.32 -0.28 0.14
Male 121 17.59 3.58 0.33 -0.21 -0.43 -0.12 Generation of Alternatives Subscale Female 84 16.60 3.33 0.36 0.52 -0.54 0.17
Male 121 16.60 3.27 0.30 0.16 -0.29 -0.06 Decision Making Subscale Female 84 16.08 3.32 0.36 0.62 -0.02 0.09
Male 121 16.36 3.91 0.36 0.12 -0.24 -0.07 Solution Implementation and Verification Subscale Female 84 15.77 3.51 0.38 0.28 -0.42 0.09
Male 121 17.91 5.25 0.48 1.10 0.97 0.08 Impulsivity/ Carelessness Style Scale Female 84 19.00 5.42 0.59 1.37 1.04 -0.12
Male 121 12.74 4.20 0.38 0.73 0.88 0.00 Avoidance Style Scale Female 84 12.74 3.99 0.43 -0.29 0.54 0.00
Male 121 16.74 2.27 0.21 0.84 -0.82 -0.13 Social Problem Solving
Female 85 16.03 2.60 0.28 5.83 -1.53 0.16 (0.17*)
*Uncorrected
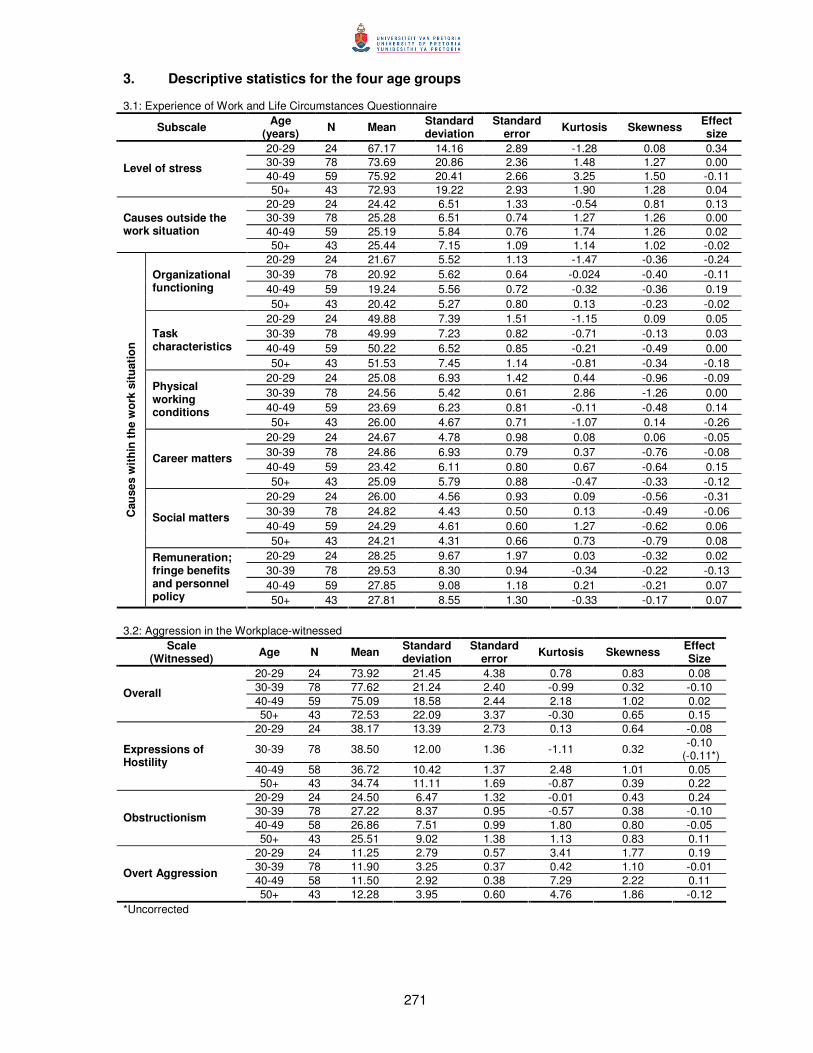
271
3. Descriptive statistics for the four age groups 3.1: Experience of Work and Life Circumstances Questionnaire
Subscale Age (years) N Mean Standard
deviation Standard
error Kurtosis Skewness Effect size
20-29 24 67.17 14.16 2.89 -1.28 0.08 0.34 30-39 78 73.69 20.86 2.36 1.48 1.27 0.00 40-49 59 75.92 20.41 2.66 3.25 1.50 -0.11
Level of stress
50+ 43 72.93 19.22 2.93 1.90 1.28 0.04 20-29 24 24.42 6.51 1.33 -0.54 0.81 0.13 30-39 78 25.28 6.51 0.74 1.27 1.26 0.00 40-49 59 25.19 5.84 0.76 1.74 1.26 0.02
Causes outside the work situation
50+ 43 25.44 7.15 1.09 1.14 1.02 -0.02 20-29 24 21.67 5.52 1.13 -1.47 -0.36 -0.24 30-39 78 20.92 5.62 0.64 -0.024 -0.40 -0.11 40-49 59 19.24 5.56 0.72 -0.32 -0.36 0.19
Organizational functioning
50+ 43 20.42 5.27 0.80 0.13 -0.23 -0.02 20-29 24 49.88 7.39 1.51 -1.15 0.09 0.05 30-39 78 49.99 7.23 0.82 -0.71 -0.13 0.03 40-49 59 50.22 6.52 0.85 -0.21 -0.49 0.00
Task characteristics
50+ 43 51.53 7.45 1.14 -0.81 -0.34 -0.18 20-29 24 25.08 6.93 1.42 0.44 -0.96 -0.09 30-39 78 24.56 5.42 0.61 2.86 -1.26 0.00 40-49 59 23.69 6.23 0.81 -0.11 -0.48 0.14
Physical working conditions
50+ 43 26.00 4.67 0.71 -1.07 0.14 -0.26 20-29 24 24.67 4.78 0.98 0.08 0.06 -0.05 30-39 78 24.86 6.93 0.79 0.37 -0.76 -0.08 40-49 59 23.42 6.11 0.80 0.67 -0.64 0.15
Career matters
50+ 43 25.09 5.79 0.88 -0.47 -0.33 -0.12 20-29 24 26.00 4.56 0.93 0.09 -0.56 -0.31 30-39 78 24.82 4.43 0.50 0.13 -0.49 -0.06 40-49 59 24.29 4.61 0.60 1.27 -0.62 0.06
Social matters
50+ 43 24.21 4.31 0.66 0.73 -0.79 0.08 20-29 24 28.25 9.67 1.97 0.03 -0.32 0.02 30-39 78 29.53 8.30 0.94 -0.34 -0.22 -0.13 40-49 59 27.85 9.08 1.18 0.21 -0.21 0.07
Cau
ses
with
in th
e w
ork
situ
atio
n
Remuneration; fringe benefits and personnel policy 50+ 43 27.81 8.55 1.30 -0.33 -0.17 0.07
3.2: Aggression in the Workplace-witnessed
Scale (Witnessed) Age N Mean Standard
deviation Standard
error Kurtosis Skewness Effect Size
20-29 24 73.92 21.45 4.38 0.78 0.83 0.08 30-39 78 77.62 21.24 2.40 -0.99 0.32 -0.10 40-49 59 75.09 18.58 2.44 2.18 1.02 0.02
Overall
50+ 43 72.53 22.09 3.37 -0.30 0.65 0.15 20-29 24 38.17 13.39 2.73 0.13 0.64 -0.08
30-39 78 38.50 12.00 1.36 -1.11 0.32 -0.10 (-0.11*)
40-49 58 36.72 10.42 1.37 2.48 1.01 0.05
Expressions of Hostility
50+ 43 34.74 11.11 1.69 -0.87 0.39 0.22 20-29 24 24.50 6.47 1.32 -0.01 0.43 0.24 30-39 78 27.22 8.37 0.95 -0.57 0.38 -0.10 40-49 58 26.86 7.51 0.99 1.80 0.80 -0.05
Obstructionism
50+ 43 25.51 9.02 1.38 1.13 0.83 0.11 20-29 24 11.25 2.79 0.57 3.41 1.77 0.19 30-39 78 11.90 3.25 0.37 0.42 1.10 -0.01 40-49 58 11.50 2.92 0.38 7.29 2.22 0.11
Overt Aggression
50+ 43 12.28 3.95 0.60 4.76 1.86 -0.12 *Uncorrected
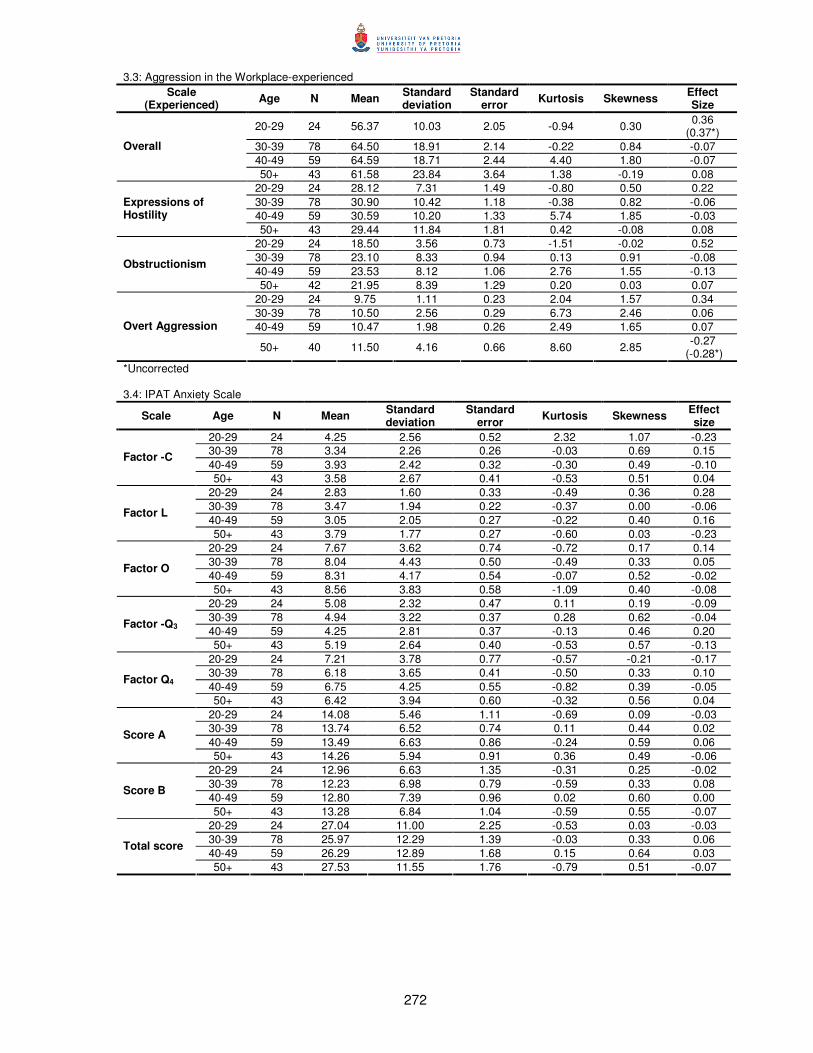
272
3.3: Aggression in the Workplace-experienced Scale
(Experienced) Age N Mean Standard deviation
Standard error Kurtosis Skewness Effect
Size
20-29 24 56.37 10.03 2.05 -0.94 0.30 0.36 (0.37*)
30-39 78 64.50 18.91 2.14 -0.22 0.84 -0.07 40-49 59 64.59 18.71 2.44 4.40 1.80 -0.07
Overall
50+ 43 61.58 23.84 3.64 1.38 -0.19 0.08 20-29 24 28.12 7.31 1.49 -0.80 0.50 0.22 30-39 78 30.90 10.42 1.18 -0.38 0.82 -0.06 40-49 59 30.59 10.20 1.33 5.74 1.85 -0.03
Expressions of Hostility
50+ 43 29.44 11.84 1.81 0.42 -0.08 0.08 20-29 24 18.50 3.56 0.73 -1.51 -0.02 0.52 30-39 78 23.10 8.33 0.94 0.13 0.91 -0.08 40-49 59 23.53 8.12 1.06 2.76 1.55 -0.13
Obstructionism
50+ 42 21.95 8.39 1.29 0.20 0.03 0.07 20-29 24 9.75 1.11 0.23 2.04 1.57 0.34 30-39 78 10.50 2.56 0.29 6.73 2.46 0.06 40-49 59 10.47 1.98 0.26 2.49 1.65 0.07 Overt Aggression
50+ 40 11.50 4.16 0.66 8.60 2.85 -0.27 (-0.28*)
*Uncorrected 3.4: IPAT Anxiety Scale
Scale Age N Mean Standard deviation
Standard error Kurtosis Skewness Effect
size 20-29 24 4.25 2.56 0.52 2.32 1.07 -0.23 30-39 78 3.34 2.26 0.26 -0.03 0.69 0.15 40-49 59 3.93 2.42 0.32 -0.30 0.49 -0.10
Factor -C
50+ 43 3.58 2.67 0.41 -0.53 0.51 0.04 20-29 24 2.83 1.60 0.33 -0.49 0.36 0.28 30-39 78 3.47 1.94 0.22 -0.37 0.00 -0.06 40-49 59 3.05 2.05 0.27 -0.22 0.40 0.16
Factor L
50+ 43 3.79 1.77 0.27 -0.60 0.03 -0.23 20-29 24 7.67 3.62 0.74 -0.72 0.17 0.14 30-39 78 8.04 4.43 0.50 -0.49 0.33 0.05 40-49 59 8.31 4.17 0.54 -0.07 0.52 -0.02
Factor O
50+ 43 8.56 3.83 0.58 -1.09 0.40 -0.08 20-29 24 5.08 2.32 0.47 0.11 0.19 -0.09 30-39 78 4.94 3.22 0.37 0.28 0.62 -0.04 40-49 59 4.25 2.81 0.37 -0.13 0.46 0.20
Factor -Q3
50+ 43 5.19 2.64 0.40 -0.53 0.57 -0.13 20-29 24 7.21 3.78 0.77 -0.57 -0.21 -0.17 30-39 78 6.18 3.65 0.41 -0.50 0.33 0.10 40-49 59 6.75 4.25 0.55 -0.82 0.39 -0.05
Factor Q4
50+ 43 6.42 3.94 0.60 -0.32 0.56 0.04 20-29 24 14.08 5.46 1.11 -0.69 0.09 -0.03 30-39 78 13.74 6.52 0.74 0.11 0.44 0.02 40-49 59 13.49 6.63 0.86 -0.24 0.59 0.06
Score A
50+ 43 14.26 5.94 0.91 0.36 0.49 -0.06 20-29 24 12.96 6.63 1.35 -0.31 0.25 -0.02 30-39 78 12.23 6.98 0.79 -0.59 0.33 0.08 40-49 59 12.80 7.39 0.96 0.02 0.60 0.00
Score B
50+ 43 13.28 6.84 1.04 -0.59 0.55 -0.07 20-29 24 27.04 11.00 2.25 -0.53 0.03 -0.03 30-39 78 25.97 12.29 1.39 -0.03 0.33 0.06 40-49 59 26.29 12.89 1.68 0.15 0.64 0.03
Total score
50+ 43 27.53 11.55 1.76 -0.79 0.51 -0.07

273
3.5: Beck Depression Inventory
Scale Age N Mean Standard deviation
Standard error Kurtosis Skewness Effect
size 20-29 24 6.75 5.70 1.16 0.51 1.10 0.03 30-39 77 5.81 5.86 0.67 3.64 1.82 0.17 40-49 59 7.17 7.15 0.93 3.94 1.96 -0.04
Depression
50+ 43 7.81 5.96 0.91 1.87 1.23 -0.14 3.6: Penn State Worry Questionnaire
Scale Age N Mean Standard deviation
Standard error Kurtosis Skewness Effect
size 20-29 24 41.63 10.43 2.13 -0.88 0.19 -0.02 30-39 77 41.94 11.55 1.32 -0.02 0.58 -0.05 40-49 59 41.61 12.09 1.57 0.02 0.80 -0.02 Worry
50+ 41 39.56 9.65 1.51 0.32 0.54 0.16 (0.17*)
*Uncorrected 3.7: Social Problem-Solving Inventory-Revised for age 20-29
Scale Age N Mean Standard deviation
Standard error Kurtosis Skewness Effect
size Positive Problem Orientation Scale 20-29 24 18.00 2.77 0.56 0.13 0.71 0.07
Negative Problem Orientation Scale 20-29 24 19.67 6.33 1.29 1.46 1.12 -0.19
Rational Problem Solving Scale 20-29 24 63.79 11.74 2.40 0.99 0.19 0.30
Problem Definition and Formulation Subscale 20-29 24 17.04 3.46 0.71 0.87 0.03 0.22
Generation of Alternatives Subscale 20-29 24 15.92 3.44 0.70 1.16 0.67 0.36
Decision Making Subscale 20-29 24 15.46 3.05 0.62 -1.07 0.02 0.28
Solution Implementation and Verification Subscale 20-29 24 15.38 3.21 0.66 0.26 0.04 0.20
Impulsivity/ Carelessness Style Scale 20-29 24 19.38 5.78 1.18 1.09 0.92 -0.19
Avoidance Style Scale 20-29 24 12.79 3.95 0.81 -0.83 0.41 -0.01 Social Problem Solving 20-29 24 16.07 1.97 0.40 -0.77 -0.18 0.15 3.8: Social Problem-Solving Inventory-Revised for age 30-39
Scale Age N Mean Standard deviation
Standard error Kurtosis Skewness Effect
size Positive Problem Orientation Scale 30-39 77 18.31 3.29 0.37 0.09 -0.34 -0.02
Negative Problem Orientation Scale 30-39 78 18.46 6.60 0.75 0.68 0.72 0.00
Rational Problem Solving Scale 30-39 77 67.48 12.85 1.46 0.09 -0.39 0.00
Problem Definition and Formulation Subscale 30-39 77 17.75 3.40 0.39 0.09 -0.19 0.01
Generation of Alternatives Subscale 30-39 77 17.27 3.46 0.39 0.52 -0.60 -0.03
Decision Making Subscale 30-39 77 16.53 3.41 0.39 0.11 -0.21 -0.04
Solution Implementation and Verification Subscale 30-39 77 15.92 3.95 0.45 -0.28 -0.30 0.05
Impulsivity/ Carelessness Style Scale 30-39 77 18.17 5.21 0.59 4.26 1.66 0.04
Avoidance Style Scale 30-39 77 12.88 4.25 0.48 0.08 0.75 -0.03 Social Problem Solving 30-39 78 16.35 2.79 0.32 5.31 -1.69 0.04

274
3.9: Social Problem-Solving Inventory-Revised for age 40-49
Scale Age N Mean Standard deviation
Standard error Kurtosis Skewness Effect
size Positive Problem Orientation Scale 40-49 59 18.90 3.11 0.41 -0.32 -0.23 -0.21
Negative Problem Orientation Scale 40-49 59 18.32 6.76 0.88 1.43 1.27 0.03
Rational Problem Solving Scale 40-49 59 70.97 10.46 1.36 -0.26 -0.15 -0.29
Problem Definition and Formulation Subscale 40-49 59 18.63 2.94 0.38 0.08 -0.11 -0.26
Generation of Alternatives Subscale 40-49 59 18.27 3.19 0.42 0.34 -0.83 -0.32
Decision Making Subscale 40-49 59 17.12 2.89 0.38 0.29 0.19 -0.23
Solution Implementation and Verification Subscale 40-49 59 16.95 3.43 0.45 0.32 -0.17 -0.23
Impulsivity/ Carelessness Style Scale 40-49 59 17.56 5.45 0.71 0.06 0.93 0.15
Avoidance Style Scale 40-49 59 12.46 4.44 0.58 1.24 1.11 0.07 Social Problem Solving 40-49 59 16.95 2.30 0.30 1.72 -1.07 -0.21 3.10: Social Problem-Solving Inventory-Revised for age 50+
Scale Age N Mean Standard deviation
Standard error Kurtosis Skewness Effect
size Positive Problem Orientation Scale 50+ 43 17.72 3.16 0.48 0.85 -0.71 0.16
Negative Problem Orientation Scale 50+ 43 17.67 4.53 0.69 -0.14 0.41 0.13
Rational Problem Solving Scale 50+ 43 65.98 12.03 1.83 1.44 0.03 0.12
Problem Definition and Formulation Subscale 50+ 43 17.40 3.19 0.49 1.17 -0.02 0.11
Generation of Alternatives Subscale 50+ 43 16.58 3.36 0.51 -0.03 -0.02 0.17
Decision Making Subscale 50+ 43 15.95 3.26 0.50 0.35 -0.04 0.14
Solution Implementation and Verification Subscale 50+ 43 16.05 3.73 0.57 0.61 -0.07 0.02
Impulsivity/ Carelessness Style Scale 50+ 43 18.88 5.03 0.77 -0.80 0.26 -0.10
Avoidance Style Scale 50+ 43 12.74 3.53 0.54 -0.02 0.25 0.00 Social Problem Solving 50+ 43 16.36 1.83 0.28 -0.31 0.43 0.03
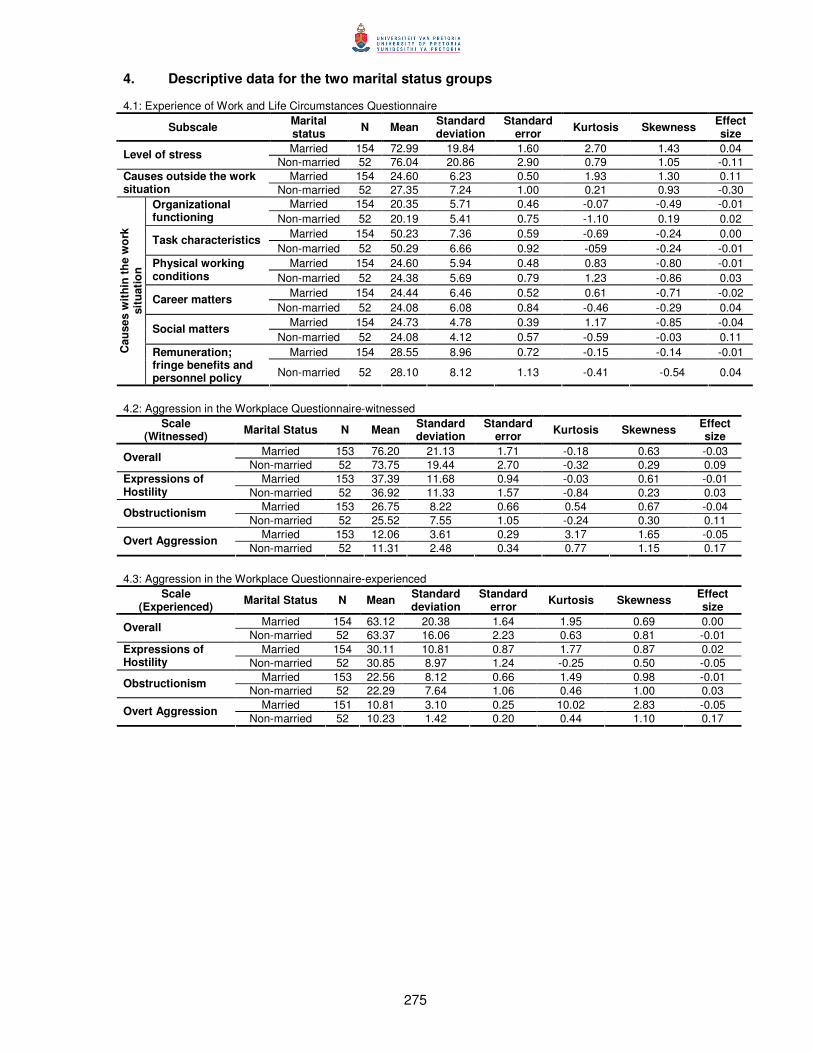
275
4. Descriptive data for the two marital status groups 4.1: Experience of Work and Life Circumstances Questionnaire
Subscale Marital status N Mean Standard
deviation Standard
error Kurtosis Skewness Effect size
Married 154 72.99 19.84 1.60 2.70 1.43 0.04 Level of stress Non-married 52 76.04 20.86 2.90 0.79 1.05 -0.11
Married 154 24.60 6.23 0.50 1.93 1.30 0.11 Causes outside the work situation Non-married 52 27.35 7.24 1.00 0.21 0.93 -0.30
Married 154 20.35 5.71 0.46 -0.07 -0.49 -0.01 Organizational functioning Non-married 52 20.19 5.41 0.75 -1.10 0.19 0.02
Married 154 50.23 7.36 0.59 -0.69 -0.24 0.00 Task characteristics Non-married 52 50.29 6.66 0.92 -059 -0.24 -0.01
Married 154 24.60 5.94 0.48 0.83 -0.80 -0.01 Physical working conditions Non-married 52 24.38 5.69 0.79 1.23 -0.86 0.03
Married 154 24.44 6.46 0.52 0.61 -0.71 -0.02 Career matters Non-married 52 24.08 6.08 0.84 -0.46 -0.29 0.04
Married 154 24.73 4.78 0.39 1.17 -0.85 -0.04 Social matters Non-married 52 24.08 4.12 0.57 -0.59 -0.03 0.11
Married 154 28.55 8.96 0.72 -0.15 -0.14 -0.01 Cau
ses
with
in th
e w
ork
situ
atio
n
Remuneration; fringe benefits and personnel policy Non-married 52 28.10 8.12 1.13 -0.41 -0.54 0.04
4.2: Aggression in the Workplace Questionnaire-witnessed
Scale (Witnessed) Marital Status N Mean Standard
deviation Standard
error Kurtosis Skewness Effect size
Married 153 76.20 21.13 1.71 -0.18 0.63 -0.03 Overall Non-married 52 73.75 19.44 2.70 -0.32 0.29 0.09
Married 153 37.39 11.68 0.94 -0.03 0.61 -0.01 Expressions of Hostility Non-married 52 36.92 11.33 1.57 -0.84 0.23 0.03
Married 153 26.75 8.22 0.66 0.54 0.67 -0.04 Obstructionism Non-married 52 25.52 7.55 1.05 -0.24 0.30 0.11
Married 153 12.06 3.61 0.29 3.17 1.65 -0.05 Overt Aggression Non-married 52 11.31 2.48 0.34 0.77 1.15 0.17
4.3: Aggression in the Workplace Questionnaire-experienced
Scale (Experienced) Marital Status N Mean Standard
deviation Standard
error Kurtosis Skewness Effect size
Married 154 63.12 20.38 1.64 1.95 0.69 0.00 Overall Non-married 52 63.37 16.06 2.23 0.63 0.81 -0.01
Married 154 30.11 10.81 0.87 1.77 0.87 0.02 Expressions of Hostility Non-married 52 30.85 8.97 1.24 -0.25 0.50 -0.05
Married 153 22.56 8.12 0.66 1.49 0.98 -0.01 Obstructionism Non-married 52 22.29 7.64 1.06 0.46 1.00 0.03
Married 151 10.81 3.10 0.25 10.02 2.83 -0.05 Overt Aggression Non-married 52 10.23 1.42 0.20 0.44 1.10 0.17
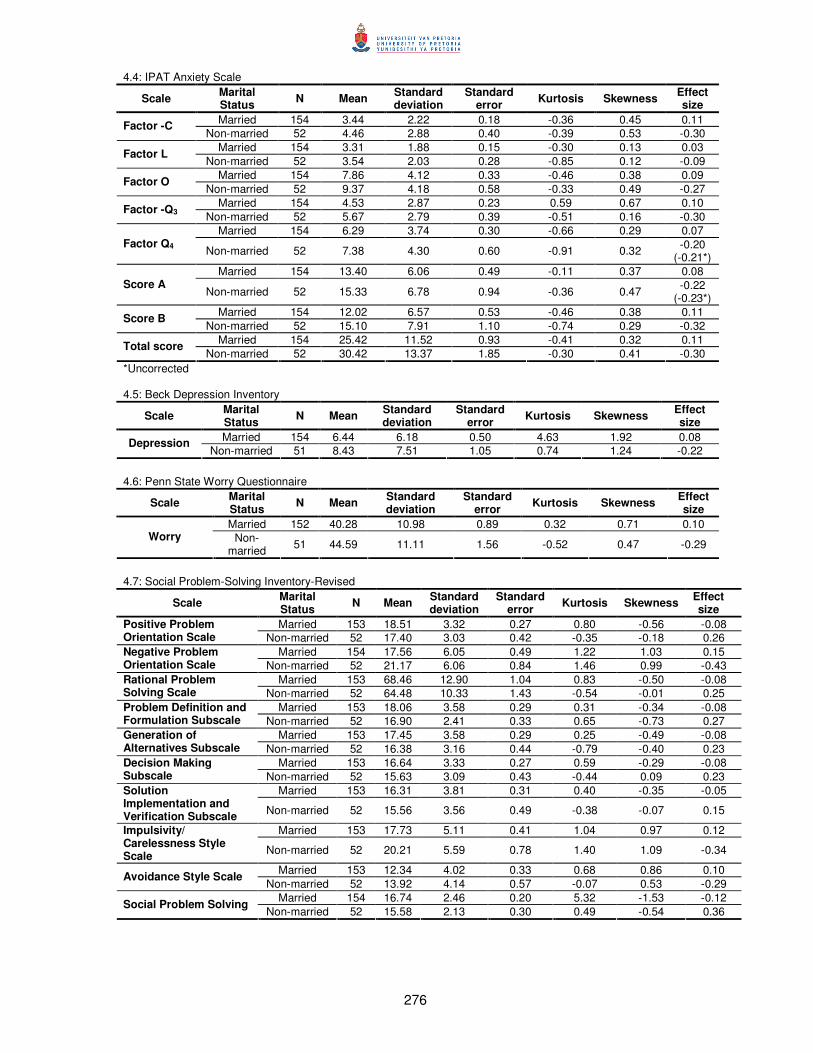
276
4.4: IPAT Anxiety Scale
Scale Marital Status N Mean Standard
deviation Standard
error Kurtosis Skewness Effect size
Married 154 3.44 2.22 0.18 -0.36 0.45 0.11 Factor -C Non-married 52 4.46 2.88 0.40 -0.39 0.53 -0.30
Married 154 3.31 1.88 0.15 -0.30 0.13 0.03 Factor L Non-married 52 3.54 2.03 0.28 -0.85 0.12 -0.09
Married 154 7.86 4.12 0.33 -0.46 0.38 0.09 Factor O Non-married 52 9.37 4.18 0.58 -0.33 0.49 -0.27
Married 154 4.53 2.87 0.23 0.59 0.67 0.10 Factor -Q3 Non-married 52 5.67 2.79 0.39 -0.51 0.16 -0.30 Married 154 6.29 3.74 0.30 -0.66 0.29 0.07
Factor Q4 Non-married 52 7.38 4.30 0.60 -0.91 0.32 -0.20 (-0.21*)
Married 154 13.40 6.06 0.49 -0.11 0.37 0.08 Score A
Non-married 52 15.33 6.78 0.94 -0.36 0.47 -0.22 (-0.23*)
Married 154 12.02 6.57 0.53 -0.46 0.38 0.11 Score B Non-married 52 15.10 7.91 1.10 -0.74 0.29 -0.32
Married 154 25.42 11.52 0.93 -0.41 0.32 0.11 Total score Non-married 52 30.42 13.37 1.85 -0.30 0.41 -0.30
*Uncorrected 4.5: Beck Depression Inventory
Scale Marital Status N Mean Standard
deviation Standard
error Kurtosis Skewness Effect size
Married 154 6.44 6.18 0.50 4.63 1.92 0.08 Depression Non-married 51 8.43 7.51 1.05 0.74 1.24 -0.22
4.6: Penn State Worry Questionnaire
Scale Marital Status N Mean Standard
deviation Standard
error Kurtosis Skewness Effect size
Married 152 40.28 10.98 0.89 0.32 0.71 0.10 Worry Non-
married 51 44.59 11.11 1.56 -0.52 0.47 -0.29
4.7: Social Problem-Solving Inventory-Revised
Scale Marital Status N Mean Standard
deviation Standard
error Kurtosis Skewness Effect size
Married 153 18.51 3.32 0.27 0.80 -0.56 -0.08 Positive Problem Orientation Scale Non-married 52 17.40 3.03 0.42 -0.35 -0.18 0.26
Married 154 17.56 6.05 0.49 1.22 1.03 0.15 Negative Problem Orientation Scale Non-married 52 21.17 6.06 0.84 1.46 0.99 -0.43
Married 153 68.46 12.90 1.04 0.83 -0.50 -0.08 Rational Problem Solving Scale Non-married 52 64.48 10.33 1.43 -0.54 -0.01 0.25
Married 153 18.06 3.58 0.29 0.31 -0.34 -0.08 Problem Definition and Formulation Subscale Non-married 52 16.90 2.41 0.33 0.65 -0.73 0.27
Married 153 17.45 3.58 0.29 0.25 -0.49 -0.08 Generation of Alternatives Subscale Non-married 52 16.38 3.16 0.44 -0.79 -0.40 0.23
Married 153 16.64 3.33 0.27 0.59 -0.29 -0.08 Decision Making Subscale Non-married 52 15.63 3.09 0.43 -0.44 0.09 0.23
Married 153 16.31 3.81 0.31 0.40 -0.35 -0.05 Solution Implementation and Verification Subscale Non-married 52 15.56 3.56 0.49 -0.38 -0.07 0.15
Married 153 17.73 5.11 0.41 1.04 0.97 0.12 Impulsivity/ Carelessness Style Scale Non-married 52 20.21 5.59 0.78 1.40 1.09 -0.34
Married 153 12.34 4.02 0.33 0.68 0.86 0.10 Avoidance Style Scale Non-married 52 13.92 4.14 0.57 -0.07 0.53 -0.29
Married 154 16.74 2.46 0.20 5.32 -1.53 -0.12 Social Problem Solving Non-married 52 15.58 2.13 0.30 0.49 -0.54 0.36
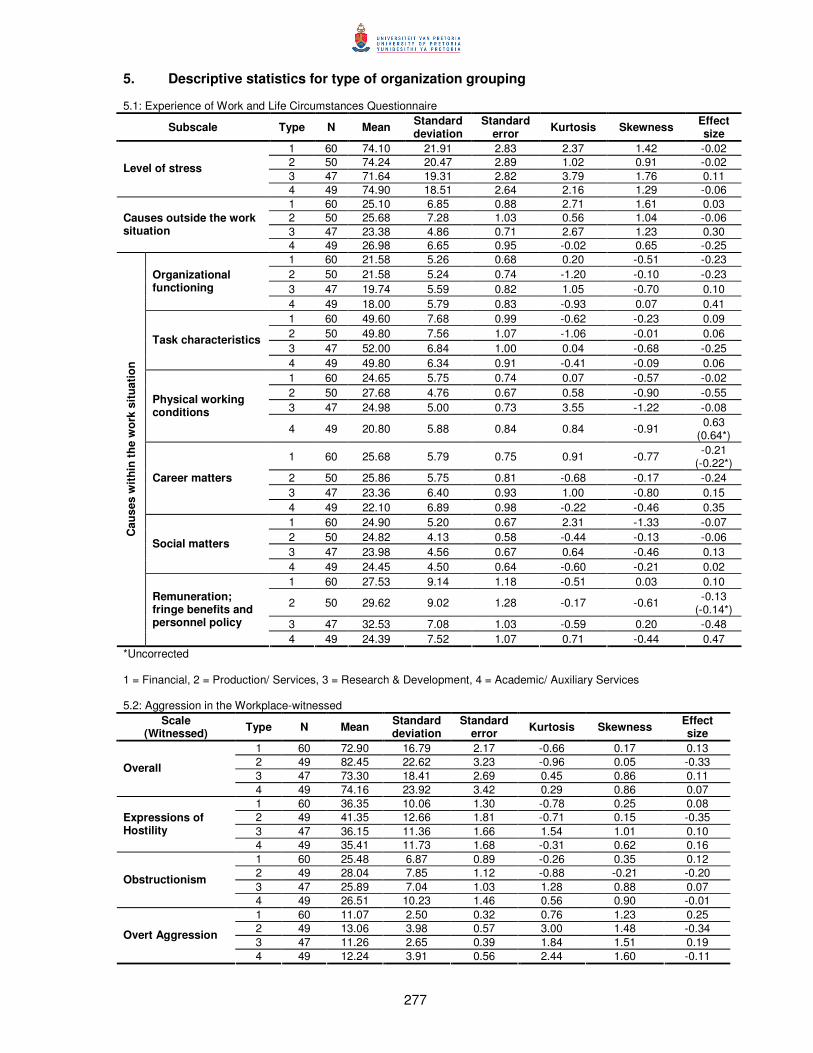
277
5. Descriptive statistics for type of organization grouping 5.1: Experience of Work and Life Circumstances Questionnaire
Subscale Type N Mean Standard deviation
Standard error Kurtosis Skewness Effect
size 1 60 74.10 21.91 2.83 2.37 1.42 -0.02 2 50 74.24 20.47 2.89 1.02 0.91 -0.02 3 47 71.64 19.31 2.82 3.79 1.76 0.11
Level of stress
4 49 74.90 18.51 2.64 2.16 1.29 -0.06 1 60 25.10 6.85 0.88 2.71 1.61 0.03 2 50 25.68 7.28 1.03 0.56 1.04 -0.06 3 47 23.38 4.86 0.71 2.67 1.23 0.30
Causes outside the work situation
4 49 26.98 6.65 0.95 -0.02 0.65 -0.25 1 60 21.58 5.26 0.68 0.20 -0.51 -0.23 2 50 21.58 5.24 0.74 -1.20 -0.10 -0.23 3 47 19.74 5.59 0.82 1.05 -0.70 0.10
Organizational functioning
4 49 18.00 5.79 0.83 -0.93 0.07 0.41 1 60 49.60 7.68 0.99 -0.62 -0.23 0.09 2 50 49.80 7.56 1.07 -1.06 -0.01 0.06 3 47 52.00 6.84 1.00 0.04 -0.68 -0.25
Task characteristics
4 49 49.80 6.34 0.91 -0.41 -0.09 0.06 1 60 24.65 5.75 0.74 0.07 -0.57 -0.02 2 50 27.68 4.76 0.67 0.58 -0.90 -0.55 3 47 24.98 5.00 0.73 3.55 -1.22 -0.08
Physical working conditions
4 49 20.80 5.88 0.84 0.84 -0.91 0.63 (0.64*)
1 60 25.68 5.79 0.75 0.91 -0.77 -0.21 (-0.22*)
2 50 25.86 5.75 0.81 -0.68 -0.17 -0.24 3 47 23.36 6.40 0.93 1.00 -0.80 0.15
Career matters
4 49 22.10 6.89 0.98 -0.22 -0.46 0.35 1 60 24.90 5.20 0.67 2.31 -1.33 -0.07 2 50 24.82 4.13 0.58 -0.44 -0.13 -0.06 3 47 23.98 4.56 0.67 0.64 -0.46 0.13
Social matters
4 49 24.45 4.50 0.64 -0.60 -0.21 0.02 1 60 27.53 9.14 1.18 -0.51 0.03 0.10
2 50 29.62 9.02 1.28 -0.17 -0.61 -0.13 (-0.14*)
3 47 32.53 7.08 1.03 -0.59 0.20 -0.48
Cau
ses
with
in th
e w
ork
situ
atio
n
Remuneration; fringe benefits and personnel policy
4 49 24.39 7.52 1.07 0.71 -0.44 0.47 *Uncorrected 1 = Financial, 2 = Production/ Services, 3 = Research & Development, 4 = Academic/ Auxiliary Services 5.2: Aggression in the Workplace-witnessed
Scale (Witnessed) Type N Mean Standard
deviation Standard
error Kurtosis Skewness Effect size
1 60 72.90 16.79 2.17 -0.66 0.17 0.13 2 49 82.45 22.62 3.23 -0.96 0.05 -0.33 3 47 73.30 18.41 2.69 0.45 0.86 0.11
Overall
4 49 74.16 23.92 3.42 0.29 0.86 0.07 1 60 36.35 10.06 1.30 -0.78 0.25 0.08 2 49 41.35 12.66 1.81 -0.71 0.15 -0.35 3 47 36.15 11.36 1.66 1.54 1.01 0.10
Expressions of Hostility
4 49 35.41 11.73 1.68 -0.31 0.62 0.16 1 60 25.48 6.87 0.89 -0.26 0.35 0.12 2 49 28.04 7.85 1.12 -0.88 -0.21 -0.20 3 47 25.89 7.04 1.03 1.28 0.88 0.07
Obstructionism
4 49 26.51 10.23 1.46 0.56 0.90 -0.01 1 60 11.07 2.50 0.32 0.76 1.23 0.25 2 49 13.06 3.98 0.57 3.00 1.48 -0.34 3 47 11.26 2.65 0.39 1.84 1.51 0.19
Overt Aggression
4 49 12.24 3.91 0.56 2.44 1.60 -0.11

278
5.3: Aggression in the Workplace-experienced Scale
(Experienced) Type N Mean Standard deviation
Standard error Kurtosis Skewness Effect
size 1 60 64.50 14.98 1.93 1.76 -0.31 -0.07 2 50 66.76 22.35 3.16 0.39 0.25 -0.18 3 47 62.53 18.30 2.67 5.52 2.02 0.03
Overall
4 49 63.51 21.62 3.09 1.44 0.60 -0.02 1 60 29.38 8.63 1.11 0.28 0.14 0.09
2 50 32.70 11.81 1.67 -0.37 0.12 -0.22 (-0.23*)
3 47 29.72 10.52 1.53 6.56 2.07 0.06
Expressions of Hostility
4 49 29.51 10.50 1.50 1.24 0.80 0.08 1 60 21.25 6.28 0.81 1.10 0.22 0.16 2 50 22.78 8.64 1.22 0.01 0.55 -0.04 3 47 22.74 7.69 1.12 2.93 1.65 -0.03
Obstructionism
4 48 23.50 9.40 1.36 0.59 1.03 -0.12 1 59 9.98 1.84 0.24 3.97 2.18 0.26
2 49 11.51 4.12 0.59 7.53 2.71 -0.27 (-0.28*)
3 47 10.06 1.51 0.22 2.13 1.63 0.23 Overt Aggression
4 48 11.21 2.71 0.39 1.29 1.45 -0.20 *Uncorrected 5.4: IPAT Anxiety Scale
Scale Type N Mean Standard deviation
Standard error Kurtosis Skewness Effect
size 1 60 3.57 2.44 0.31 -0.58 0.51 0.05
2 50 4.42 2.59 0.37 0.32 0.36 -0.29 (-0.30*)
3 47 3.09 2.10 0.31 0.17 0.54 0.25 Factor -C
4 49 3.69 2.46 0.35 0.23 0.91 0.00 1 60 3.42 2.09 0.27 -0.39 0.21 -0.03 2 50 3.38 1.78 0.25 -0.64 -0.18 -0.01 3 47 3.23 1.84 0.27 -0.18 0.33 0.07
Factor L
4 49 3.39 1.98 0.28 -0.62 0.09 -0.02 1 60 7.82 4.35 0.56 -0.36 0.76 0.10 2 50 8.76 4.35 0.62 -0.41 -0.29 -0.12 3 47 7.87 3.99 0.58 0.79 0.92 0.09
Factor O
4 49 8.59 3.97 0.57 -0.40 0.31 -0.08 1 60 4.27 2.66 0.34 -0.45 0.26 0.19 2 50 4.80 2.68 0.38 -0.19 0.45 0.01 3 47 5.19 3.40 0.50 0.39 0.94 -0.12
Factor -Q3
4 49 5.16 2.79 0.40 -0.33 -0.06 -0.12 1 60 6.37 3.85 0.50 -0.68 0.42 0.05 2 50 7.46 4.26 0.60 -0.52 -0.02 -0.23 3 47 5.79 3.54 0.52 -0.31 0.55 0.20
Factor Q4
4 49 6.63 3.86 0.55 -0.79 0.37 -0.02 1 60 13.25 6.30 0.81 0.01 0.76 0.10 2 50 14.78 6.26 0.89 -0.23 -0.10 -0.14 3 47 13.32 6.82 0.99 0.38 0.85 0.09
Score A
4 49 14.31 5.81 0.83 0.37 0.12 -0.07 1 60 12.18 7.53 0.97 -0.84 0.48 0.09 2 50 14.04 7.52 1.06 -0.12 0.00 -0.17
3 47 11.87 6.16 0.90 0.26 0.73 0.13 (0.14*)
Score B
4 49 13.16 6.70 0.96 -0.12 0.69 -0.05 1 60 25.43 12.27 1.58 -0.45 0.56 0.10 2 50 28.82 13.01 1.84 0.10 -0.09 -0.17 3 47 25.19 11.93 1.74 0.59 0.80 0.12
Total score
4 49 27.47 11.37 1.62 -0.24 0.52 -0.07 *Uncorrected

279
5.5: Beck Depression Inventory
Scale Type N Mean Standard deviation
Standard error Kurtosis Skewness Effect
size 1 60 6.88 7.10 0.92 4.20 2.07 0.01 2 49 7.24 6.47 0.92 2.00 1.36 -0.05 3 47 5.55 5.48 0.80 3.54 1.73 0.22
Depression
4 49 8.02 6.91 0.99 2.60 1.51 -0.16 5.6: Penn State Worry Questionnaire
Scale Type N Mean Standard deviation
Standard error Kurtosis Skewness Effect
size 1 60 41.98 12.47 1.61 0.20 0.95 -0.05 2 47 41.21 11.04 1.61 -0.90 0.12 0.01 3 47 38.94 9.47 1.38 -0.41 0.55 0.22
Worry
4 49 43.08 10.92 1.56 0.27 0.47 -0.15 5.7: Social Problem-Solving Inventory-Revised for Financial organizations
Scale Type N Mean Standard deviation
Standard error Kurtosis Skewness Effect
size Positive Problem Orientation Scale 1 60 19.03 3.51 0.45 1.53 -0.81 -0.24
Negative Problem Orientation Scale 1 60 16.92 5.01 0.65 1.50 1.23 0.26
Rational Problem Solving Scale 1 60 68.63 13.51 1.74 1.61 -1.04 -0.09
Problem Definition and Formulation Subscale 1 60 18.08 3.67 0.47 1.04 -0.87 -0.09
Generation of Alternatives Subscale 1 60 17.70 3.62 0.47 0.84 -0.64 -0.15
Decision Making Subscale 1 60 16.32 3.45 0.45 0.73 -0.73 0.02
Solution Implementation and Verification Subscale 1 60 16.53 3.99 0.51 1.05 -0.79 -0.11
Impulsivity/ Carelessness Style Scale 1 60 17.12 4.09 0.53 1.53 0.89 0.24
Avoidance Style Scale 1 60 11.33 3.18 0.41 0.46 0.85 0.36
Social Problem Solving 1 60 17.22 1.96 0.25 1.18 -0.79 -0.33 5.8: Social Problem-Solving Inventory-Revised for Production/ Services organizations
Scale Type N Mean Standard deviation
Standard error Kurtosis Skewness Effect
size Positive Problem Orientation Scale 2 50 18.02 3.48 0.49 0.51 -0.63 0.06
Negative Problem Orientation Scale 2 50 19.06 7.79 1.10 0.77 1.11 -0.09
Rational Problem Solving Scale 2 50 67.26 12.59 1.78 0.22 0.20 0.02
Problem Definition and Formulation Subscale 2 50 17.54 3.68 0.52 0.22 0.18 0.07
Generation of Alternatives Subscale 2 50 16.86 3.33 0.47 -0.30 -0.21 0.09
Decision Making Subscale 2 50 16.30 3.07 0.43 0.09 0.31 0.03
Solution Implementation and Verification Subscale 2 50 16.56 3.98 0.56 -0.07 0.05 -0.12
Impulsivity/ Carelessness Style Scale 2 50 19.34 6.30 0.89 0.67 0.96 -0.18
Avoidance Style Scale 2 50 13.18 4.39 0.62 -0.29 0.65 -0.11
Social Problem Solving 2 50 16.24 2.54 0.36 0.30 -0.63 0.08
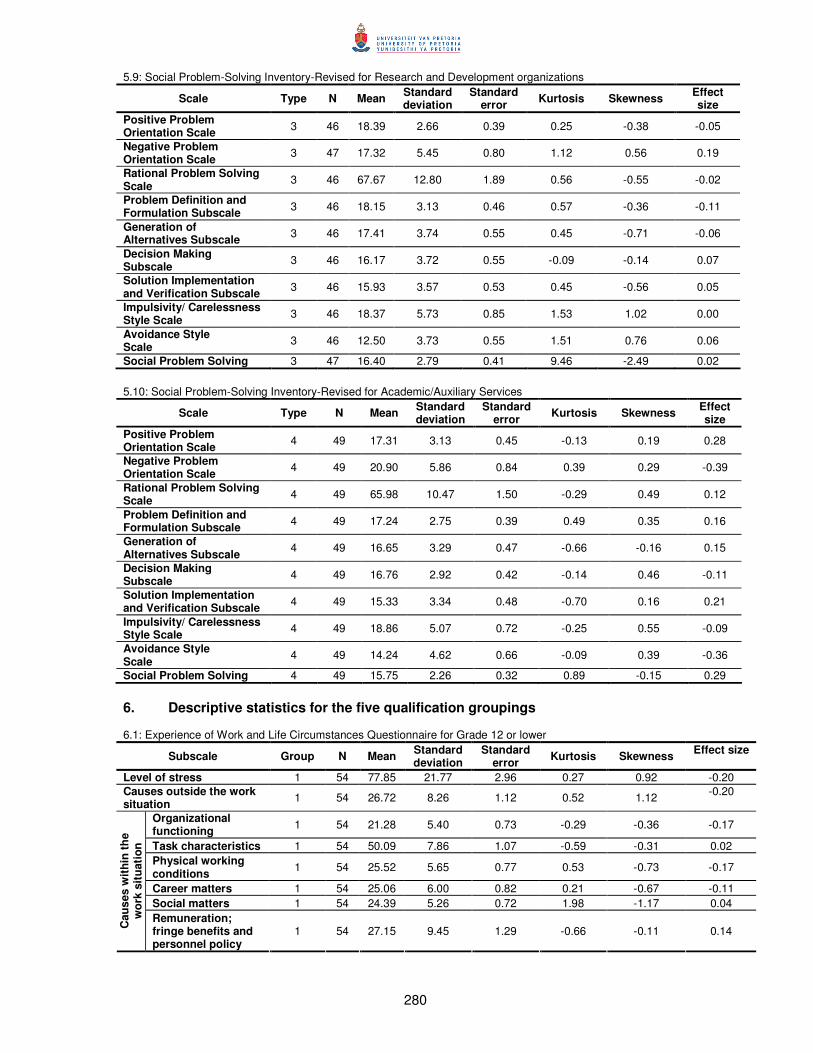
280
5.9: Social Problem-Solving Inventory-Revised for Research and Development organizations
Scale Type N Mean Standard deviation
Standard error Kurtosis Skewness Effect
size Positive Problem Orientation Scale 3 46 18.39 2.66 0.39 0.25 -0.38 -0.05
Negative Problem Orientation Scale 3 47 17.32 5.45 0.80 1.12 0.56 0.19
Rational Problem Solving Scale 3 46 67.67 12.80 1.89 0.56 -0.55 -0.02
Problem Definition and Formulation Subscale 3 46 18.15 3.13 0.46 0.57 -0.36 -0.11
Generation of Alternatives Subscale 3 46 17.41 3.74 0.55 0.45 -0.71 -0.06
Decision Making Subscale 3 46 16.17 3.72 0.55 -0.09 -0.14 0.07
Solution Implementation and Verification Subscale 3 46 15.93 3.57 0.53 0.45 -0.56 0.05
Impulsivity/ Carelessness Style Scale 3 46 18.37 5.73 0.85 1.53 1.02 0.00
Avoidance Style Scale 3 46 12.50 3.73 0.55 1.51 0.76 0.06
Social Problem Solving 3 47 16.40 2.79 0.41 9.46 -2.49 0.02 5.10: Social Problem-Solving Inventory-Revised for Academic/Auxiliary Services
Scale Type N Mean Standard deviation
Standard error Kurtosis Skewness Effect
size Positive Problem Orientation Scale 4 49 17.31 3.13 0.45 -0.13 0.19 0.28
Negative Problem Orientation Scale 4 49 20.90 5.86 0.84 0.39 0.29 -0.39
Rational Problem Solving Scale 4 49 65.98 10.47 1.50 -0.29 0.49 0.12
Problem Definition and Formulation Subscale 4 49 17.24 2.75 0.39 0.49 0.35 0.16
Generation of Alternatives Subscale 4 49 16.65 3.29 0.47 -0.66 -0.16 0.15
Decision Making Subscale 4 49 16.76 2.92 0.42 -0.14 0.46 -0.11
Solution Implementation and Verification Subscale 4 49 15.33 3.34 0.48 -0.70 0.16 0.21
Impulsivity/ Carelessness Style Scale 4 49 18.86 5.07 0.72 -0.25 0.55 -0.09
Avoidance Style Scale 4 49 14.24 4.62 0.66 -0.09 0.39 -0.36
Social Problem Solving 4 49 15.75 2.26 0.32 0.89 -0.15 0.29 6. Descriptive statistics for the five qualification groupings 6.1: Experience of Work and Life Circumstances Questionnaire for Grade 12 or lower
Subscale Group N Mean Standard deviation
Standard error Kurtosis Skewness Effect size
Level of stress 1 54 77.85 21.77 2.96 0.27 0.92 -0.20 Causes outside the work situation 1 54 26.72 8.26 1.12 0.52 1.12 -0.20
Organizational functioning 1 54 21.28 5.40 0.73 -0.29 -0.36 -0.17
Task characteristics 1 54 50.09 7.86 1.07 -0.59 -0.31 0.02 Physical working conditions 1 54 25.52 5.65 0.77 0.53 -0.73 -0.17
Career matters 1 54 25.06 6.00 0.82 0.21 -0.67 -0.11 Social matters 1 54 24.39 5.26 0.72 1.98 -1.17 0.04
Cau
ses
with
in th
e w
ork
situ
atio
n
Remuneration; fringe benefits and personnel policy
1 54 27.15 9.45 1.29 -0.66 -0.11 0.14

281
6.2: Experience of Work and Life Circumstances Questionnaire for all Diplomas
Subscale Group N Mean Standard deviation
Standard error Kurtosis Skewness Effect
size Level of stress 2 35 72.34 24.16 4.08 3.94 1.90 0.07 Causes outside the work situation 2 35 24.11 5.38 0.91 3.80 1.75 0.18
(0.19*) Organizational functioning 2 35 21.71 5.55 0.94 -0.22 -0.19 -0.25
Task characteristics 2 35 51.06 7.45 1.26 -0.76 -0.23 -0.11 Physical working conditions 2 35 23.49 6.42 1.08 0.65 -0.85 0.18
Career matters 2 35 25.11 6.46 1.09 0.50 -0.57 -0.12 Social matters 2 35 26.06 3.73 0.63 1.15 -0.79 -0.33
Cau
ses
with
in th
e w
ork
situ
atio
n
Remuneration; fringe benefits and personnel policy
2 35 30.20 9.06 1.53 0.41 -0.77 -0.20
*Uncorrected 6.3: Experience of Work and Life Circumstances Questionnaire for all Bachelors Degrees
Subscale Group N Mean Standard deviation
Standard error Kurtosis Skewness Effect
size
Level of stress 3 24 68.92 15.66 3.20 -0.64 0.56 0.24 (0.25*)
Causes outside the work situation 3 24 22.54 4.77 0.97 1.26 1.13 0.43
Organizational functioning 3 24 20.13 4.48 0.91 -1.01 -0.10 0.03
Task characteristics 3 24 49.38 6.09 1.24 -0.52 0.25 0.12 Physical working conditions 3 24 25.25 5.33 1.09 -0.27 -0.41 -0.12
Career matters 3 24 25.92 4.83 0.99 -0.16 0.29 -0.25 Social matters 3 24 24.96 4.70 0.96 -0.49 -0.56 -0.09
Cau
ses
with
in th
e w
ork
situ
atio
n
Remuneration; fringe benefits and personnel policy
3 24 30.58 7.91 1.62 -0.41 0.61 -0.25
*Uncorrected 6.4: Experience of Work and Life Circumstances Questionnaire for all Honors and equivalent Degrees
Subscale Group N Mean Standard deviation
Standard error Kurtosis Skewness Effect
size
Level of stress 4 33 72.09 16.50 2.87 2.49 1.07 0.08 (0.09*)
Causes outside the work situation 4 33 25.33 6.09 1.06 0.46 0.91 0.00
Organizational functioning 4 33 21.64 4.70 0.82 -0.24 -0.62 -0.24
Task characteristics 4 33 50.97 6.85 1.19 -0.13 -0.40 -0.10 Physical working conditions 4 33 24.12 5.91 1.03 1.03 -0.70 0.07
Career matters 4 33 25.03 6.28 1.09 -0.04 -0.63 -0.11 Social matters 4 33 25.91 3.85 0.67 -0.80 0.01 -0.30
Cau
ses
with
in th
e w
ork
situ
atio
n
Remuneration; fringe benefits and personnel policy
4 33 26.55 7.91 1.38 -1.08 -0.35 0.22
*Uncorrected

282
6.5: Experience of Work and Life Circumstances Questionnaire for all Masters and Doctoral Degrees
Subscale Group N Mean Standard deviation
Standard error Kurtosis Skewness Effect
size Level of stress 5 60 73.77 19.22 2.48 2.25 1.30 0.00 Causes outside the work situation 5 60 25.78 6.15 0.79 0.07 0.66 -0.07
Organizational functioning 5 60 17.97 6.13 0.79 -0.52 -0.12 0.41
Task characteristics 5 60 49.85 7.09 0.91 -0.90 -0.26 0.05 Physical working conditions 5 60 24.23 5.93 0.77 1.73 -1.02 0.05
Career matters 5 60 22.25 6.84 0.88 0.28 -0.57 0.32 Social matters 5 60 22.95 4.44 0.57 0.25 -0.11 0.35
Cau
ses
with
in th
e w
ork
situ
atio
n
Remuneration; fringe benefits and personnel policy
5 60 28.73 8.49 1.10 0.63 -0.16 -0.03
6.6: Aggression in the Workplace Questionnaire-witnessed
Scale (Witnessed) Age N Mean Standard
deviation Standard
error Kurtosis Skewness Effect size
1 53 74.77 18.86 2.59 -0.31 0.50 0.04 2 35 77.54 25.22 4.26 -0.27 0.66 -0.09 3 24 74.88 18.75 3.83 -1.14 -0.05 0.03 4 33 70.45 19.70 3.43 -0.58 0.48 0.25
Overall
5 60 78.23 20.68 2.67 -0.09 0.67 -0.13 1 53 36.98 10.46 1.44 -0.74 0.36 0.03 2 35 37.63 13.57 2.29 -0.25 0.66 -0.03 3 24 37.04 10.03 2.05 -0.98 -0.19 0.02 4 33 34.73 11.56 2.01 -0.48 0.47 0.22
Expressions of Hostility
5 60 38.82 11.93 1.54 0.05 0.67 -0.13 1 53 26.04 7.55 1.04 -0.87 0.32 0.05 2 35 27.54 9.99 1.69 0.71 0.79 -0.13 3 24 25.67 6.78 1.38 -0.70 0.14 0.10 4 33 24.36 7.66 1.33 -0.73 0.29 0.26
Obstructionism
5 60 27.58 7.86 1.02 0.80 0.74 -0.14 1 53 11.75 3.79 0.52 6.23 2.27 0.03 2 35 12.37 3.57 0.60 3.38 1.53 -0.15 3 24 12.17 4.12 0.84 1.67 1.48 -0.09 4 33 11.36 2.61 0.45 -0.77 0.78 0.16
Overt Aggression
5 60 11.83 2.94 0.38 0.77 1.22 0.01 6.7: Aggression in the Workplace Questionnaire-experienced
Scale (Experienced) Age N Mean Standard
deviation Standard
error Kurtosis Skewness Effect size
1 54 62.11 19.40 2.64 1.99 0.61 0.06 2 35 60.91 22.92 3.87 1.02 -0.10 0.11 3 24 65.29 17.64 3.60 -1.25 0.28 -0.11 4 33 59.73 14.49 2.52 -0.21 0.70 0.18
Overall
5 60 66.53 20.00 2.58 2.83 1.61 -0.17 1 54 29.83 10.10 1.37 0.31 0.36 0.05 2 35 28.97 11.45 1.94 0.52 0.24 0.13 3 24 32.00 8.85 1.81 -0.73 0.03 -0.17 4 33 28.18 8.65 1.51 1.19 1.08 0.21
Expressions of Hostility
5 60 31.97 11.26 1.45 2.84 1.49 -0.16 1 54 21.78 7.83 1.07 0.31 0.66 0.09 2 34 22.65 9.49 1.63 1.03 0.82 -0.02 3 24 21.96 7.95 1.62 -0.64 0.76 0.07 4 33 21.27 6.42 1.12 0.35 0.76 0.16
Obstructionism
5 60 23.93 8.02 1.04 2.54 1.52 -0.18 1 53 10.70 3.70 0.51 13.36 3.52 -0.01 2 33 10.55 2.08 0.36 1.62 1.48 0.04 3 24 11.33 3.52 0.72 3.14 1.91 -0.23 4 33 10.27 1.74 0.30 1.56 1.46 0.15
Overt Aggression
5 60 10.63 2.28 0.29 4.02 1.99 0.01
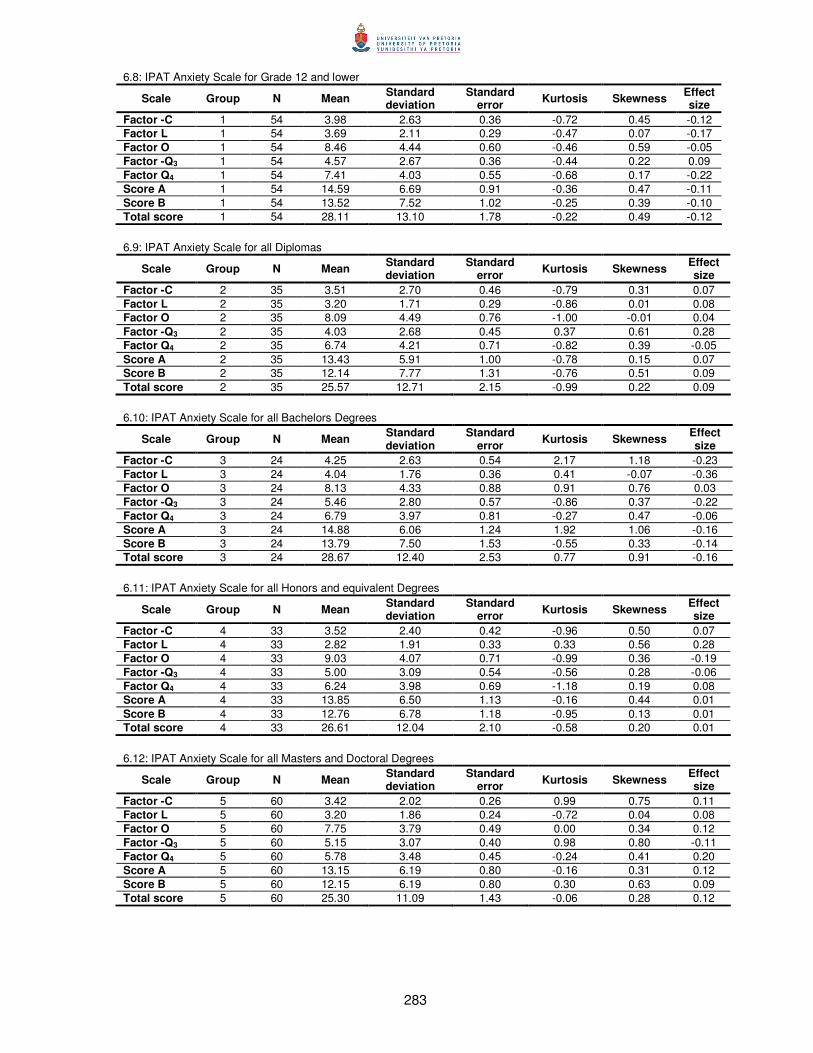
283
6.8: IPAT Anxiety Scale for Grade 12 and lower
Scale Group N Mean Standard deviation
Standard error Kurtosis Skewness Effect
size Factor -C 1 54 3.98 2.63 0.36 -0.72 0.45 -0.12 Factor L 1 54 3.69 2.11 0.29 -0.47 0.07 -0.17 Factor O 1 54 8.46 4.44 0.60 -0.46 0.59 -0.05 Factor -Q3 1 54 4.57 2.67 0.36 -0.44 0.22 0.09 Factor Q4 1 54 7.41 4.03 0.55 -0.68 0.17 -0.22 Score A 1 54 14.59 6.69 0.91 -0.36 0.47 -0.11 Score B 1 54 13.52 7.52 1.02 -0.25 0.39 -0.10 Total score 1 54 28.11 13.10 1.78 -0.22 0.49 -0.12 6.9: IPAT Anxiety Scale for all Diplomas
Scale Group N Mean Standard deviation
Standard error Kurtosis Skewness Effect
size Factor -C 2 35 3.51 2.70 0.46 -0.79 0.31 0.07 Factor L 2 35 3.20 1.71 0.29 -0.86 0.01 0.08 Factor O 2 35 8.09 4.49 0.76 -1.00 -0.01 0.04 Factor -Q3 2 35 4.03 2.68 0.45 0.37 0.61 0.28 Factor Q4 2 35 6.74 4.21 0.71 -0.82 0.39 -0.05 Score A 2 35 13.43 5.91 1.00 -0.78 0.15 0.07 Score B 2 35 12.14 7.77 1.31 -0.76 0.51 0.09 Total score 2 35 25.57 12.71 2.15 -0.99 0.22 0.09 6.10: IPAT Anxiety Scale for all Bachelors Degrees
Scale Group N Mean Standard deviation
Standard error Kurtosis Skewness Effect
size Factor -C 3 24 4.25 2.63 0.54 2.17 1.18 -0.23 Factor L 3 24 4.04 1.76 0.36 0.41 -0.07 -0.36 Factor O 3 24 8.13 4.33 0.88 0.91 0.76 0.03 Factor -Q3 3 24 5.46 2.80 0.57 -0.86 0.37 -0.22 Factor Q4 3 24 6.79 3.97 0.81 -0.27 0.47 -0.06 Score A 3 24 14.88 6.06 1.24 1.92 1.06 -0.16 Score B 3 24 13.79 7.50 1.53 -0.55 0.33 -0.14 Total score 3 24 28.67 12.40 2.53 0.77 0.91 -0.16 6.11: IPAT Anxiety Scale for all Honors and equivalent Degrees
Scale Group N Mean Standard deviation
Standard error Kurtosis Skewness Effect
size Factor -C 4 33 3.52 2.40 0.42 -0.96 0.50 0.07 Factor L 4 33 2.82 1.91 0.33 0.33 0.56 0.28 Factor O 4 33 9.03 4.07 0.71 -0.99 0.36 -0.19 Factor -Q3 4 33 5.00 3.09 0.54 -0.56 0.28 -0.06 Factor Q4 4 33 6.24 3.98 0.69 -1.18 0.19 0.08 Score A 4 33 13.85 6.50 1.13 -0.16 0.44 0.01 Score B 4 33 12.76 6.78 1.18 -0.95 0.13 0.01 Total score 4 33 26.61 12.04 2.10 -0.58 0.20 0.01 6.12: IPAT Anxiety Scale for all Masters and Doctoral Degrees
Scale Group N Mean Standard deviation
Standard error Kurtosis Skewness Effect
size Factor -C 5 60 3.42 2.02 0.26 0.99 0.75 0.11 Factor L 5 60 3.20 1.86 0.24 -0.72 0.04 0.08 Factor O 5 60 7.75 3.79 0.49 0.00 0.34 0.12 Factor -Q3 5 60 5.15 3.07 0.40 0.98 0.80 -0.11 Factor Q4 5 60 5.78 3.48 0.45 -0.24 0.41 0.20 Score A 5 60 13.15 6.19 0.80 -0.16 0.31 0.12 Score B 5 60 12.15 6.19 0.80 0.30 0.63 0.09 Total score 5 60 25.30 11.09 1.43 -0.06 0.28 0.12
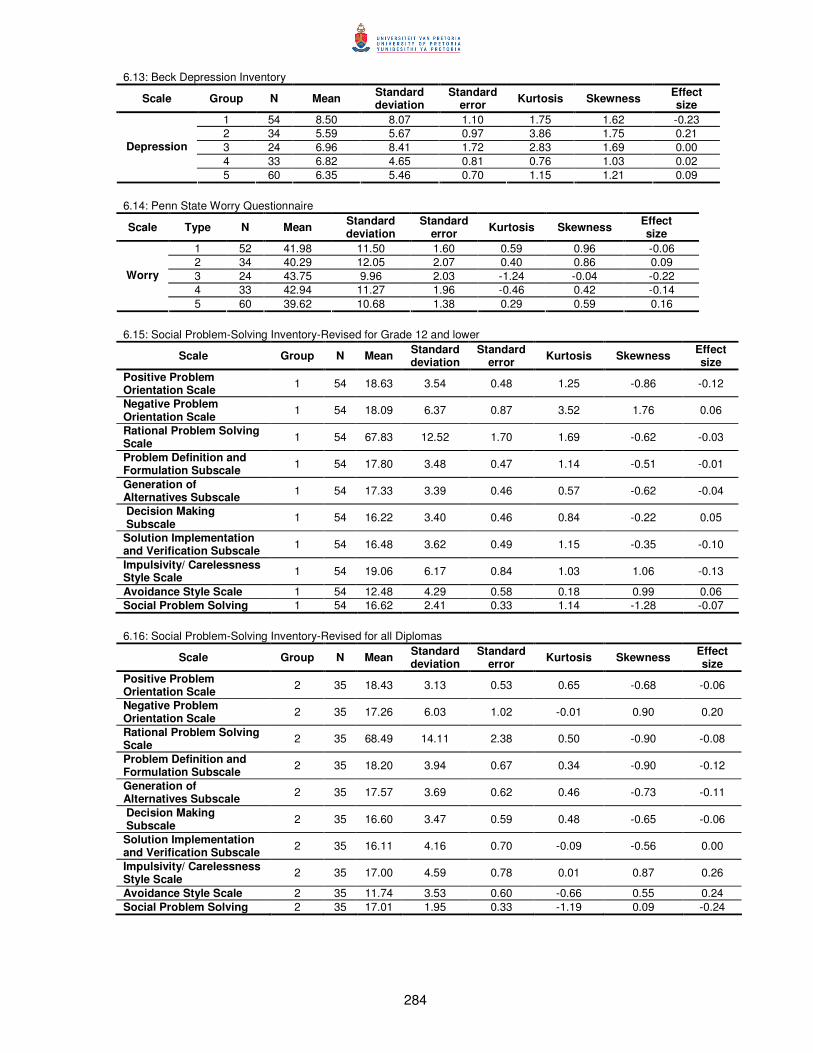
284
6.13: Beck Depression Inventory
Scale Group N Mean Standard deviation
Standard error Kurtosis Skewness Effect
size 1 54 8.50 8.07 1.10 1.75 1.62 -0.23 2 34 5.59 5.67 0.97 3.86 1.75 0.21 3 24 6.96 8.41 1.72 2.83 1.69 0.00 4 33 6.82 4.65 0.81 0.76 1.03 0.02
Depression
5 60 6.35 5.46 0.70 1.15 1.21 0.09 6.14: Penn State Worry Questionnaire
Scale Type N Mean Standard deviation
Standard error Kurtosis Skewness Effect
size 1 52 41.98 11.50 1.60 0.59 0.96 -0.06 2 34 40.29 12.05 2.07 0.40 0.86 0.09 3 24 43.75 9.96 2.03 -1.24 -0.04 -0.22 4 33 42.94 11.27 1.96 -0.46 0.42 -0.14
Worry
5 60 39.62 10.68 1.38 0.29 0.59 0.16 6.15: Social Problem-Solving Inventory-Revised for Grade 12 and lower
Scale Group N Mean Standard deviation
Standard error Kurtosis Skewness Effect
size Positive Problem Orientation Scale 1 54 18.63 3.54 0.48 1.25 -0.86 -0.12
Negative Problem Orientation Scale 1 54 18.09 6.37 0.87 3.52 1.76 0.06
Rational Problem Solving Scale 1 54 67.83 12.52 1.70 1.69 -0.62 -0.03
Problem Definition and Formulation Subscale 1 54 17.80 3.48 0.47 1.14 -0.51 -0.01
Generation of Alternatives Subscale 1 54 17.33 3.39 0.46 0.57 -0.62 -0.04
Decision Making Subscale 1 54 16.22 3.40 0.46 0.84 -0.22 0.05
Solution Implementation and Verification Subscale 1 54 16.48 3.62 0.49 1.15 -0.35 -0.10
Impulsivity/ Carelessness Style Scale 1 54 19.06 6.17 0.84 1.03 1.06 -0.13
Avoidance Style Scale 1 54 12.48 4.29 0.58 0.18 0.99 0.06 Social Problem Solving 1 54 16.62 2.41 0.33 1.14 -1.28 -0.07 6.16: Social Problem-Solving Inventory-Revised for all Diplomas
Scale Group N Mean Standard deviation
Standard error Kurtosis Skewness Effect
size Positive Problem Orientation Scale 2 35 18.43 3.13 0.53 0.65 -0.68 -0.06
Negative Problem Orientation Scale 2 35 17.26 6.03 1.02 -0.01 0.90 0.20
Rational Problem Solving Scale 2 35 68.49 14.11 2.38 0.50 -0.90 -0.08
Problem Definition and Formulation Subscale 2 35 18.20 3.94 0.67 0.34 -0.90 -0.12
Generation of Alternatives Subscale 2 35 17.57 3.69 0.62 0.46 -0.73 -0.11
Decision Making Subscale 2 35 16.60 3.47 0.59 0.48 -0.65 -0.06
Solution Implementation and Verification Subscale 2 35 16.11 4.16 0.70 -0.09 -0.56 0.00
Impulsivity/ Carelessness Style Scale 2 35 17.00 4.59 0.78 0.01 0.87 0.26
Avoidance Style Scale 2 35 11.74 3.53 0.60 -0.66 0.55 0.24 Social Problem Solving 2 35 17.01 1.95 0.33 -1.19 0.09 -0.24
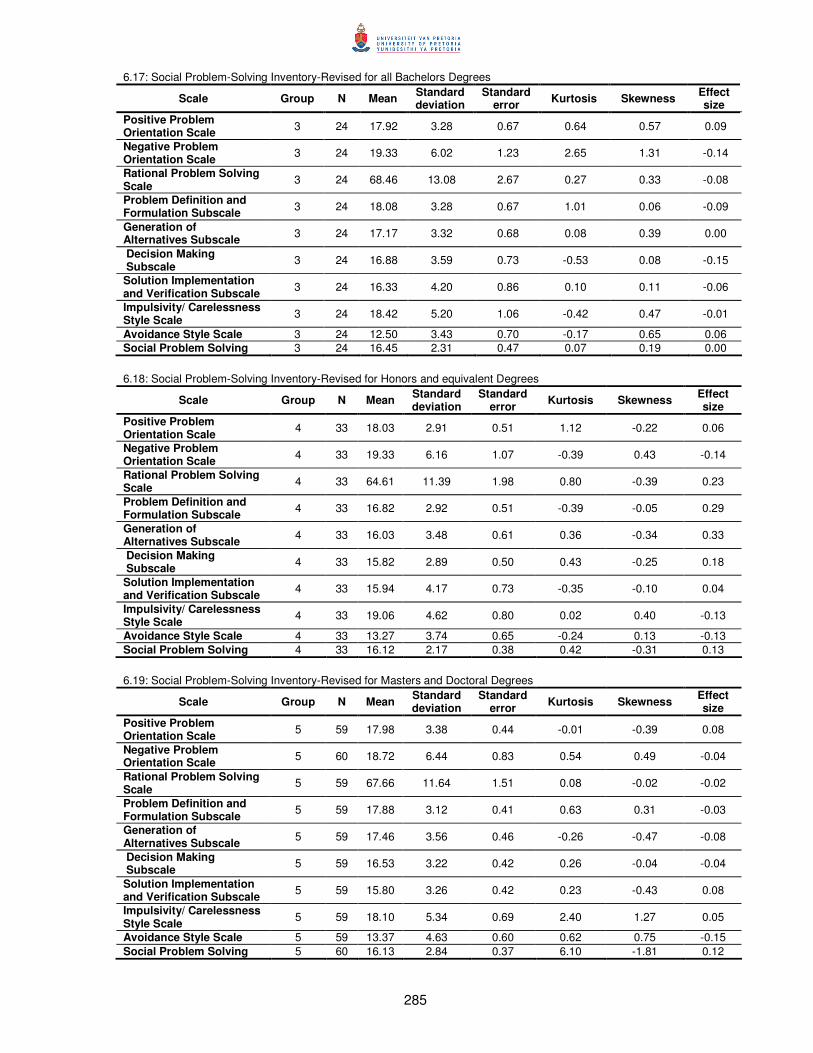
285
6.17: Social Problem-Solving Inventory-Revised for all Bachelors Degrees
Scale Group N Mean Standard deviation
Standard error Kurtosis Skewness Effect
size Positive Problem Orientation Scale 3 24 17.92 3.28 0.67 0.64 0.57 0.09
Negative Problem Orientation Scale 3 24 19.33 6.02 1.23 2.65 1.31 -0.14
Rational Problem Solving Scale 3 24 68.46 13.08 2.67 0.27 0.33 -0.08
Problem Definition and Formulation Subscale 3 24 18.08 3.28 0.67 1.01 0.06 -0.09
Generation of Alternatives Subscale 3 24 17.17 3.32 0.68 0.08 0.39 0.00
Decision Making Subscale 3 24 16.88 3.59 0.73 -0.53 0.08 -0.15
Solution Implementation and Verification Subscale 3 24 16.33 4.20 0.86 0.10 0.11 -0.06
Impulsivity/ Carelessness Style Scale 3 24 18.42 5.20 1.06 -0.42 0.47 -0.01
Avoidance Style Scale 3 24 12.50 3.43 0.70 -0.17 0.65 0.06 Social Problem Solving 3 24 16.45 2.31 0.47 0.07 0.19 0.00 6.18: Social Problem-Solving Inventory-Revised for Honors and equivalent Degrees
6.19: Social Problem-Solving Inventory-Revised for Masters and Doctoral Degrees
Scale Group N Mean Standard deviation
Standard error Kurtosis Skewness Effect
size Positive Problem Orientation Scale 5 59 17.98 3.38 0.44 -0.01 -0.39 0.08
Negative Problem Orientation Scale 5 60 18.72 6.44 0.83 0.54 0.49 -0.04
Rational Problem Solving Scale 5 59 67.66 11.64 1.51 0.08 -0.02 -0.02
Problem Definition and Formulation Subscale 5 59 17.88 3.12 0.41 0.63 0.31 -0.03
Generation of Alternatives Subscale 5 59 17.46 3.56 0.46 -0.26 -0.47 -0.08
Decision Making Subscale 5 59 16.53 3.22 0.42 0.26 -0.04 -0.04
Solution Implementation and Verification Subscale 5 59 15.80 3.26 0.42 0.23 -0.43 0.08
Impulsivity/ Carelessness Style Scale 5 59 18.10 5.34 0.69 2.40 1.27 0.05
Avoidance Style Scale 5 59 13.37 4.63 0.60 0.62 0.75 -0.15 Social Problem Solving 5 60 16.13 2.84 0.37 6.10 -1.81 0.12
Scale Group N Mean Standard deviation
Standard error Kurtosis Skewness Effect
size Positive Problem Orientation Scale 4 33 18.03 2.91 0.51 1.12 -0.22 0.06
Negative Problem Orientation Scale 4 33 19.33 6.16 1.07 -0.39 0.43 -0.14
Rational Problem Solving Scale 4 33 64.61 11.39 1.98 0.80 -0.39 0.23
Problem Definition and Formulation Subscale 4 33 16.82 2.92 0.51 -0.39 -0.05 0.29
Generation of Alternatives Subscale 4 33 16.03 3.48 0.61 0.36 -0.34 0.33
Decision Making Subscale 4 33 15.82 2.89 0.50 0.43 -0.25 0.18
Solution Implementation and Verification Subscale 4 33 15.94 4.17 0.73 -0.35 -0.10 0.04
Impulsivity/ Carelessness Style Scale 4 33 19.06 4.62 0.80 0.02 0.40 -0.13
Avoidance Style Scale 4 33 13.27 3.74 0.65 -0.24 0.13 -0.13 Social Problem Solving 4 33 16.12 2.17 0.38 0.42 -0.31 0.13

286
7. Descriptive statistics of the three position levels
7.1: Experience of Work and Life Circumstances Questionnaire for senior management
Subscale Level N Mean Standard deviation
Standard error Kurtosis Skewness Effect
size Level of stress 1 102 73.71 20.10 1.99 2.68 1.40 0.00 Causes outside the work situation 1 102 25.20 6.15 0.61 1.94 1.26 0.02
Organizational functioning 1 102 21.46 5.13 0.51 0.85 -0.75 -0.21
Task characteristics 1 102 50.18 6.95 0.69 -0.58 -0.21 0.01 Physical working conditions 1 102 25.41 5.34 0.53 0.87 -0.75 -0.15
Career matters 1 102 26.06 5.45 0.54 1.87 -0.87 -0.28 Social matters 1 102 24.81 4.38 0.43 1.46 -0.79 -0.05
Cau
ses
with
in th
e w
ork
situ
atio
n
Remuneration; fringe benefits and personnel policy
1 102 30.04 7.90 0.78 -0.66 -0.11 -0.19
7.2: Experience of Work and Life Circumstances Questionnaire for middle management
Subscale Level N Mean Standard deviation
Standard error Kurtosis Skewness Effect
size Level of stress 2 61 73.95 18.26 2.34 1.38 1.07 -0.01 Causes outside the work situation 2 61 24.01 6.77 0.87 1.37 1.22 0.19
Organizational functioning 2 61 19.00 5.85 0.75 -0.72 0.14 0.23
Task characteristics 2 61 50.05 6.81 0.87 -0.78 0.06 0.03 Physical working conditions 2 61 22.84 5.86 0.75 1.33 -0.84 0.29
Career matters 2 61 22.13 7.22 0.92 -0.45 -0.07 0.34 Social matters 2 61 23.95 4.44 0.57 -0.31 -0.04 0.13
Cau
ses
with
in th
e w
ork
situ
atio
n
Remuneration; fringe benefits and personnel policy
2 61 28.07 8.97 1.15 0.41 -0.28 0.04
7.3: Experience of Work and Life Circumstances Questionnaire for specialist staff
Subscale Level N Mean Standard deviation
Standard error Kurtosis Skewness Effect
size Level of stress 3 42 72.24 21.21 3.27 2.32 1.44 0.07 Causes outside the work situation 3 42 25.57 6.63 1.02 -0.46 0.82 -0.04
Organizational functioning 3 42 19.74 5.72 0.88 -0.38 -0.07 0.10
Task characteristics 3 42 51.12 7.85 1.21 -0.82 -0.43 -0.12 Physical working conditions 3 42 25.31 6.18 0.95 0.57 -0.85 -0.13
Career matters 3 42 23.81 5.49 0.85 0.48 -0.60 0.09 Social matters 3 42 25.24 4.79 0.74 0.40 -0.81 -0.15
Cau
ses
with
in th
e w
ork
situ
atio
n
Remuneration; fringe benefits and personnel policy
3 42 25.36 9.49 1.46 -0.29 0.01 0.35
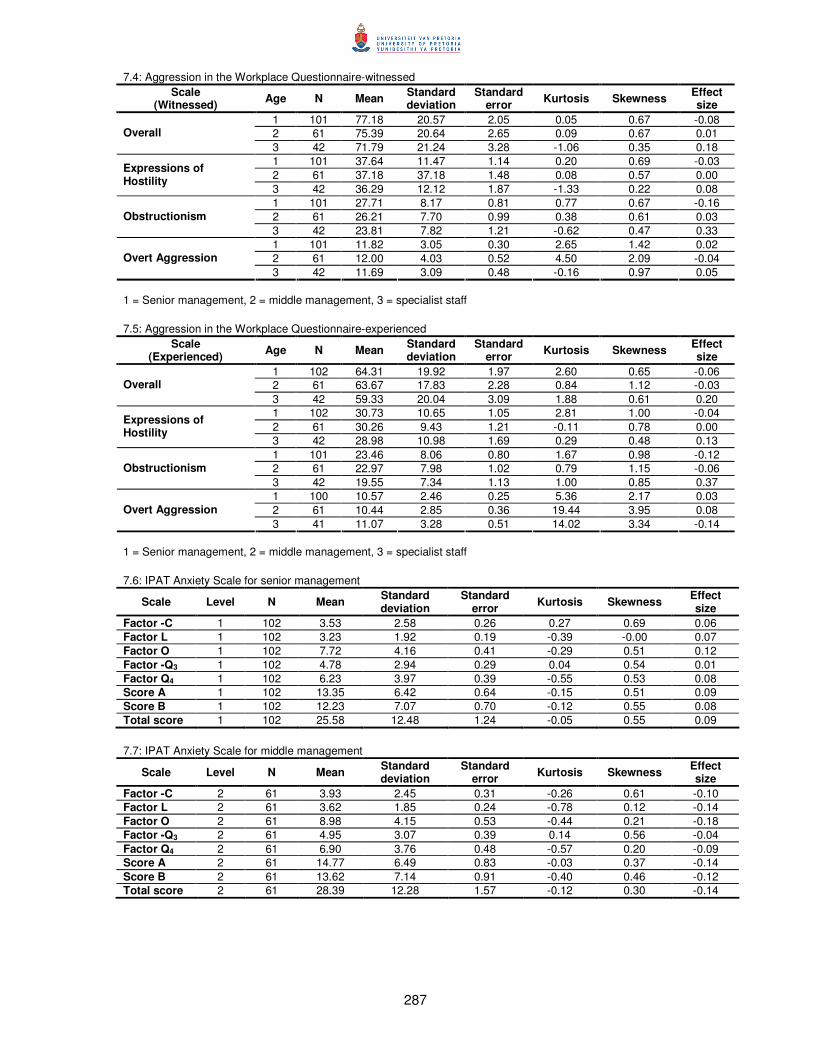
287
7.4: Aggression in the Workplace Questionnaire-witnessed Scale
(Witnessed) Age N Mean Standard deviation
Standard error Kurtosis Skewness Effect
size 1 101 77.18 20.57 2.05 0.05 0.67 -0.08 2 61 75.39 20.64 2.65 0.09 0.67 0.01 Overall 3 42 71.79 21.24 3.28 -1.06 0.35 0.18 1 101 37.64 11.47 1.14 0.20 0.69 -0.03 2 61 37.18 37.18 1.48 0.08 0.57 0.00
Expressions of Hostility
3 42 36.29 12.12 1.87 -1.33 0.22 0.08 1 101 27.71 8.17 0.81 0.77 0.67 -0.16 2 61 26.21 7.70 0.99 0.38 0.61 0.03 Obstructionism 3 42 23.81 7.82 1.21 -0.62 0.47 0.33 1 101 11.82 3.05 0.30 2.65 1.42 0.02 2 61 12.00 4.03 0.52 4.50 2.09 -0.04 Overt Aggression 3 42 11.69 3.09 0.48 -0.16 0.97 0.05
1 = Senior management, 2 = middle management, 3 = specialist staff
7.5: Aggression in the Workplace Questionnaire-experienced
Scale (Experienced) Age N Mean Standard
deviation Standard
error Kurtosis Skewness Effect size
1 102 64.31 19.92 1.97 2.60 0.65 -0.06 2 61 63.67 17.83 2.28 0.84 1.12 -0.03 Overall 3 42 59.33 20.04 3.09 1.88 0.61 0.20 1 102 30.73 10.65 1.05 2.81 1.00 -0.04 2 61 30.26 9.43 1.21 -0.11 0.78 0.00
Expressions of Hostility
3 42 28.98 10.98 1.69 0.29 0.48 0.13 1 101 23.46 8.06 0.80 1.67 0.98 -0.12 2 61 22.97 7.98 1.02 0.79 1.15 -0.06 Obstructionism 3 42 19.55 7.34 1.13 1.00 0.85 0.37 1 100 10.57 2.46 0.25 5.36 2.17 0.03 2 61 10.44 2.85 0.36 19.44 3.95 0.08 Overt Aggression 3 41 11.07 3.28 0.51 14.02 3.34 -0.14
1 = Senior management, 2 = middle management, 3 = specialist staff
7.6: IPAT Anxiety Scale for senior management
Scale Level N Mean Standard deviation
Standard error Kurtosis Skewness Effect
size Factor -C 1 102 3.53 2.58 0.26 0.27 0.69 0.06 Factor L 1 102 3.23 1.92 0.19 -0.39 -0.00 0.07 Factor O 1 102 7.72 4.16 0.41 -0.29 0.51 0.12 Factor -Q3 1 102 4.78 2.94 0.29 0.04 0.54 0.01 Factor Q4 1 102 6.23 3.97 0.39 -0.55 0.53 0.08 Score A 1 102 13.35 6.42 0.64 -0.15 0.51 0.09 Score B 1 102 12.23 7.07 0.70 -0.12 0.55 0.08 Total score 1 102 25.58 12.48 1.24 -0.05 0.55 0.09 7.7: IPAT Anxiety Scale for middle management
Scale Level N Mean Standard deviation
Standard error Kurtosis Skewness Effect
size Factor -C 2 61 3.93 2.45 0.31 -0.26 0.61 -0.10 Factor L 2 61 3.62 1.85 0.24 -0.78 0.12 -0.14 Factor O 2 61 8.98 4.15 0.53 -0.44 0.21 -0.18 Factor -Q3 2 61 4.95 3.07 0.39 0.14 0.56 -0.04 Factor Q4 2 61 6.90 3.76 0.48 -0.57 0.20 -0.09 Score A 2 61 14.77 6.49 0.83 -0.03 0.37 -0.14 Score B 2 61 13.62 7.14 0.91 -0.40 0.46 -0.12 Total score 2 61 28.39 12.28 1.57 -0.12 0.30 -0.14

288
7.8: IPAT Anxiety Scale for specialist staff
Scale Level N Mean Standard deviation
Standard error Kurtosis Skewness Effect
size Factor -C 3 42 3.67 2.03 0.31 -0.86 0.42 0.01 Factor L 3 42 3.02 1.98 0.31 0.24 0.60 0.18 Factor O 3 42 8.19 3.87 0.60 -0.48 0.30 0.01 Factor -Q3 3 42 4.71 2.57 0.40 0.44 0.30 0.04 Factor Q4 3 42 6.74 3.90 0.60 -0.54 0.14 -0.05 Score A 3 42 13.69 5.54 0.85 0.36 0.35 0.03 Score B 3 42 12.64 6.59 1.02 -1.12 0.04 0.02 Total score 3 42 26.33 10.77 1.66 -0.55 0.18 0.03 7.9: Beck Depression Inventory
Scale Level N Mean Standard deviation
Standard error Kurtosis Skewness Effect
size 1 101 6.32 6.20 0.62 5.87 2.24 0.09 2 61 7.39 7.05 0.90 2.67 1.58 -0.07 Depression 3 42 7.40 6.43 0.99 0.39 1.00 -0.07
1 = Senior management, 2 = middle management, 3 = specialist staff 7.10: Penn State Worry Questionnaire
Scale Level N Mean Standard deviation
Standard error Kurtosis Skewness Effect
size 1 101 40.23 10.64 1.06 0.07 0.73 0.10 2 60 41.62 11.93 1.54 0.24 0.69 -0.02 Worry 3 41 43.73 11.15 1.74 -0.17 0.34 -0.21
1 = Senior management, 2 = middle management, 3 = specialist staff 7.11: Social Problem-Solving Inventory-Revised for senior management
Scale Level N Mean Standard deviation
Standard error Kurtosis Skewness Effect
size Positive Problem Orientation Scale 1 102 18.28 3.39 0.34 0.34 -0.57 -0.02
Negative Problem Orientation Scale 1 102 17.68 5.93 0.59 1.10 1.12 0.13
Rational Problem Solving Scale 1 102 67.58 12.99 1.29 0.48 -0.54 -0.01
Problem Definition and Formulation Subscale 1 102 17.77 3.63 0.36 0.06 -0.34 0.00
Generation of Alternatives Subscale 1 102 17.11 3.52 0.35 0.08 -0.70 0.02
Decision Making Subscale 1 102 16.41 3.27 0.32 0.33 -0.33 -0.01
Solution Implementation and Verification Subscale 1 102 16.29 4.07 0.40 0.03 -0.42 -0.05
Impulsivity/ Carelessness Style Scale 1 102 17.71 4.81 0.48 2.25 1.08 0.13
Avoidance Style Scale 1 102 12.50 4.11 0.41 0.23 0.82 0.06 Social Problem Solving 1 102 16.72 2.20 0.22 0.93 -0.63 -0.12
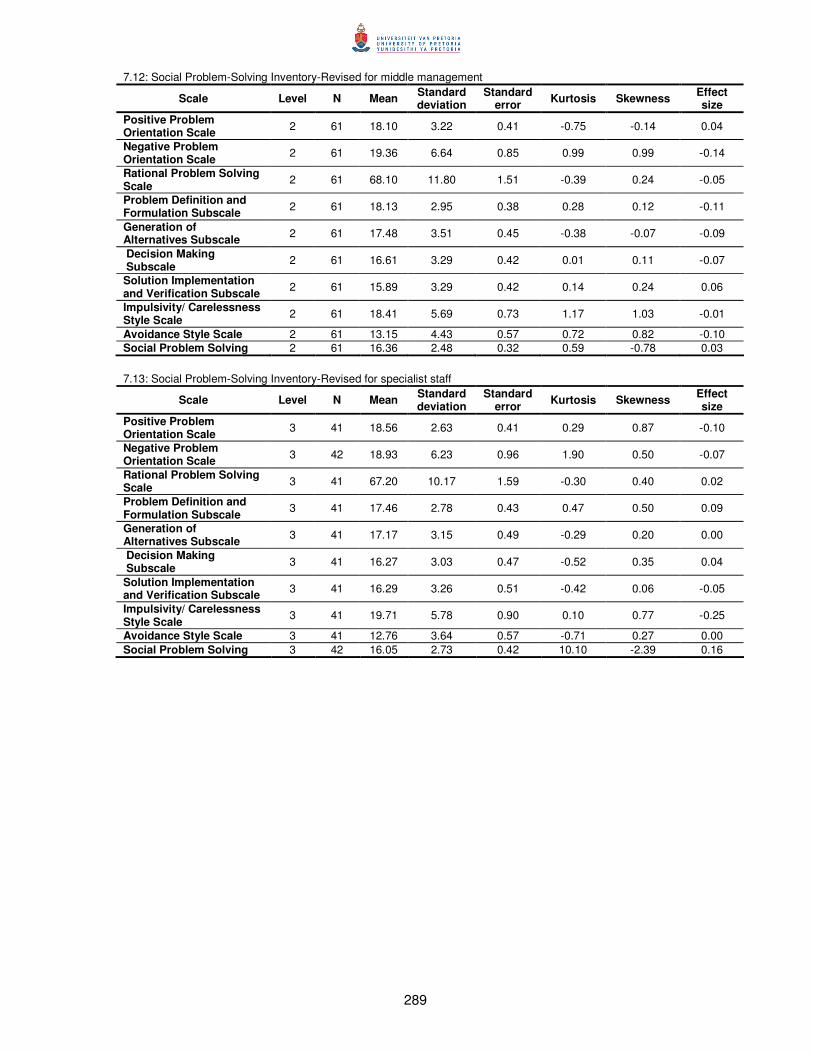
289
7.12: Social Problem-Solving Inventory-Revised for middle management
Scale Level N Mean Standard deviation
Standard error Kurtosis Skewness Effect
size Positive Problem Orientation Scale 2 61 18.10 3.22 0.41 -0.75 -0.14 0.04
Negative Problem Orientation Scale 2 61 19.36 6.64 0.85 0.99 0.99 -0.14
Rational Problem Solving Scale 2 61 68.10 11.80 1.51 -0.39 0.24 -0.05
Problem Definition and Formulation Subscale 2 61 18.13 2.95 0.38 0.28 0.12 -0.11
Generation of Alternatives Subscale 2 61 17.48 3.51 0.45 -0.38 -0.07 -0.09
Decision Making Subscale 2 61 16.61 3.29 0.42 0.01 0.11 -0.07
Solution Implementation and Verification Subscale 2 61 15.89 3.29 0.42 0.14 0.24 0.06
Impulsivity/ Carelessness Style Scale 2 61 18.41 5.69 0.73 1.17 1.03 -0.01
Avoidance Style Scale 2 61 13.15 4.43 0.57 0.72 0.82 -0.10 Social Problem Solving 2 61 16.36 2.48 0.32 0.59 -0.78 0.03 7.13: Social Problem-Solving Inventory-Revised for specialist staff
Scale Level N Mean Standard deviation
Standard error Kurtosis Skewness Effect
size Positive Problem Orientation Scale 3 41 18.56 2.63 0.41 0.29 0.87 -0.10
Negative Problem Orientation Scale 3 42 18.93 6.23 0.96 1.90 0.50 -0.07
Rational Problem Solving Scale 3 41 67.20 10.17 1.59 -0.30 0.40 0.02
Problem Definition and Formulation Subscale 3 41 17.46 2.78 0.43 0.47 0.50 0.09
Generation of Alternatives Subscale 3 41 17.17 3.15 0.49 -0.29 0.20 0.00
Decision Making Subscale 3 41 16.27 3.03 0.47 -0.52 0.35 0.04
Solution Implementation and Verification Subscale 3 41 16.29 3.26 0.51 -0.42 0.06 -0.05
Impulsivity/ Carelessness Style Scale 3 41 19.71 5.78 0.90 0.10 0.77 -0.25
Avoidance Style Scale 3 41 12.76 3.64 0.57 -0.71 0.27 0.00 Social Problem Solving 3 42 16.05 2.73 0.42 10.10 -2.39 0.16
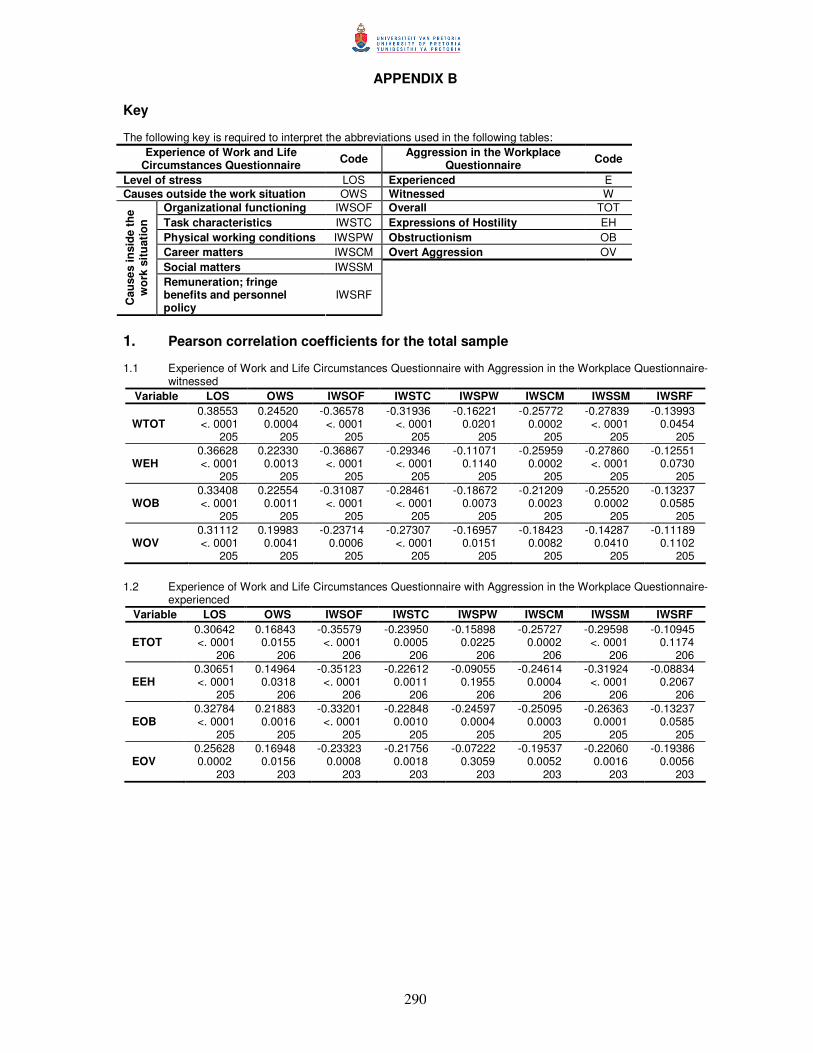
290
APPENDIX B
Key The following key is required to interpret the abbreviations used in the following tables:
Experience of Work and Life Circumstances Questionnaire Code Aggression in the Workplace
Questionnaire Code
Level of stress LOS Experienced E Causes outside the work situation OWS Witnessed W
Organizational functioning IWSOF Overall TOT Task characteristics IWSTC Expressions of Hostility EH Physical working conditions IWSPW Obstructionism OB Career matters IWSCM Overt Aggression OV Social matters IWSSM
Cau
ses
insi
de th
e w
ork
situ
atio
n
Remuneration; fringe benefits and personnel policy
IWSRF
1. Pearson correlation coefficients for the total sample 1.1 Experience of Work and Life Circumstances Questionnaire with Aggression in the Workplace Questionnaire-
witnessed Variable LOS OWS IWSOF IWSTC IWSPW IWSCM IWSSM IWSRF
WTOT 0.38553 <. 0001 205
0.24520 0.0004 205
-0.36578 <. 0001 205
-0.31936 <. 0001 205
-0.16221 0.0201 205
-0.25772 0.0002 205
-0.27839 <. 0001 205
-0.13993 0.0454 205
WEH 0.36628 <. 0001 205
0.22330 0.0013 205
-0.36867 <. 0001 205
-0.29346 <. 0001 205
-0.11071 0.1140 205
-0.25959 0.0002 205
-0.27860 <. 0001 205
-0.12551 0.0730 205
WOB 0.33408 <. 0001 205
0.22554 0.0011 205
-0.31087 <. 0001 205
-0.28461 <. 0001 205
-0.18672 0.0073 205
-0.21209 0.0023 205
-0.25520 0.0002 205
-0.13237 0.0585 205
WOV 0.31112 <. 0001 205
0.19983 0.0041 205
-0.23714 0.0006 205
-0.27307 <. 0001 205
-0.16957 0.0151 205
-0.18423 0.0082 205
-0.14287 0.0410 205
-0.11189 0.1102 205
1.2 Experience of Work and Life Circumstances Questionnaire with Aggression in the Workplace Questionnaire-
experienced Variable LOS OWS IWSOF IWSTC IWSPW IWSCM IWSSM IWSRF
ETOT 0.30642 <. 0001 206
0.16843 0.0155 206
-0.35579 <. 0001 206
-0.23950 0.0005 206
-0.15898 0.0225 206
-0.25727 0.0002 206
-0.29598 <. 0001 206
-0.10945 0.1174 206
EEH 0.30651 <. 0001 205
0.14964 0.0318 206
-0.35123 <. 0001 206
-0.22612 0.0011 206
-0.09055 0.1955 206
-0.24614 0.0004 206
-0.31924 <. 0001 206
-0.08834 0.2067 206
EOB 0.32784 <. 0001 205
0.21883 0.0016 205
-0.33201 <. 0001 205
-0.22848 0.0010 205
-0.24597 0.0004 205
-0.25095 0.0003 205
-0.26363 0.0001 205
-0.13237 0.0585 205
EOV 0.25628 0.0002 203
0.16948 0.0156 203
-0.23323 0.0008 203
-0.21756 0.0018 203
-0.07222 0.3059 203
-0.19537 0.0052 203
-0.22060 0.0016 203
-0.19386 0.0056 203
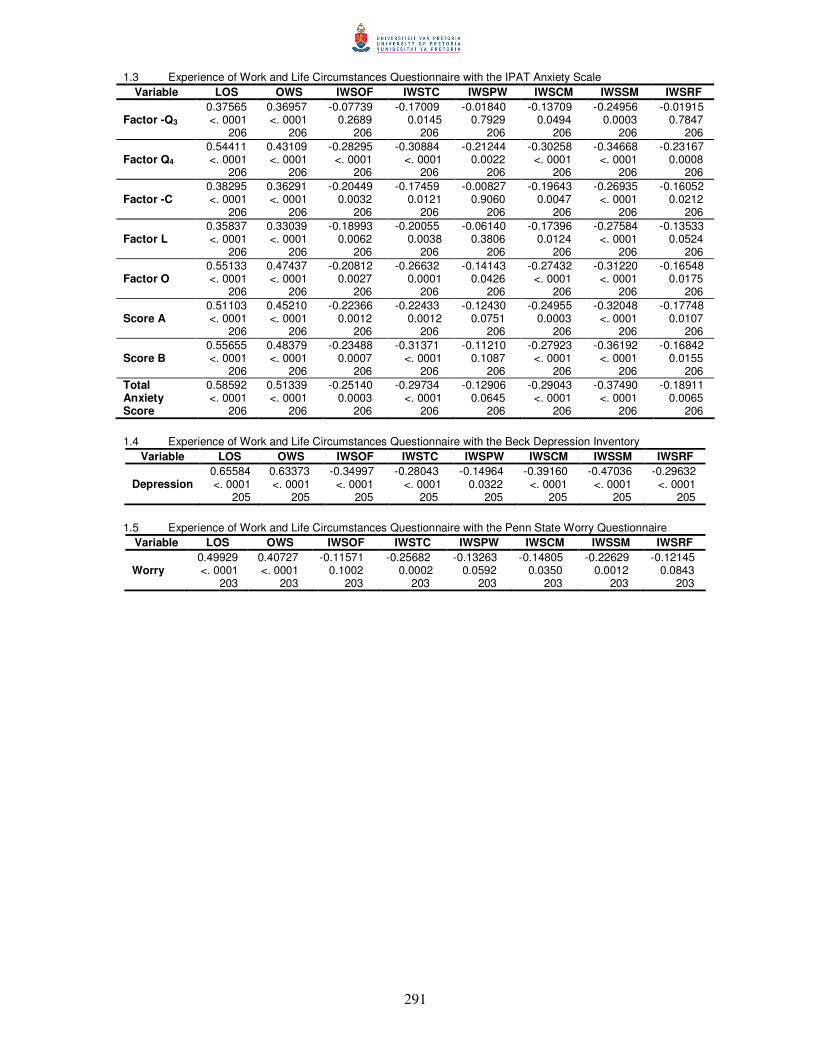
291
1.3 Experience of Work and Life Circumstances Questionnaire with the IPAT Anxiety Scale Variable LOS OWS IWSOF IWSTC IWSPW IWSCM IWSSM IWSRF
Factor -Q3 0.37565 <. 0001 206
0.36957 <. 0001 206
-0.07739 0.2689 206
-0.17009 0.0145 206
-0.01840 0.7929 206
-0.13709 0.0494 206
-0.24956 0.0003 206
-0.01915 0.7847 206
Factor Q4 0.54411 <. 0001 206
0.43109 <. 0001 206
-0.28295 <. 0001 206
-0.30884 <. 0001 206
-0.21244 0.0022 206
-0.30258 <. 0001 206
-0.34668 <. 0001 206
-0.23167 0.0008 206
Factor -C 0.38295 <. 0001 206
0.36291 <. 0001 206
-0.20449 0.0032 206
-0.17459 0.0121 206
-0.00827 0.9060 206
-0.19643 0.0047 206
-0.26935 <. 0001 206
-0.16052 0.0212 206
Factor L 0.35837 <. 0001 206
0.33039 <. 0001 206
-0.18993 0.0062 206
-0.20055 0.0038 206
-0.06140 0.3806 206
-0.17396 0.0124 206
-0.27584 <. 0001 206
-0.13533 0.0524 206
Factor O 0.55133 <. 0001 206
0.47437 <. 0001 206
-0.20812 0.0027 206
-0.26632 0.0001 206
-0.14143 0.0426 206
-0.27432 <. 0001 206
-0.31220 <. 0001 206
-0.16548 0.0175 206
Score A 0.51103 <. 0001 206
0.45210 <. 0001 206
-0.22366 0.0012 206
-0.22433 0.0012 206
-0.12430 0.0751 206
-0.24955 0.0003 206
-0.32048 <. 0001 206
-0.17748 0.0107 206
Score B 0.55655 <. 0001 206
0.48379 <. 0001 206
-0.23488 0.0007 206
-0.31371 <. 0001 206
-0.11210 0.1087 206
-0.27923 <. 0001 206
-0.36192 <. 0001 206
-0.16842 0.0155 206
Total Anxiety Score
0.58592 <. 0001 206
0.51339 <. 0001 206
-0.25140 0.0003 206
-0.29734 <. 0001 206
-0.12906 0.0645 206
-0.29043 <. 0001 206
-0.37490 <. 0001 206
-0.18911 0.0065 206
1.4 Experience of Work and Life Circumstances Questionnaire with the Beck Depression Inventory
Variable LOS OWS IWSOF IWSTC IWSPW IWSCM IWSSM IWSRF
Depression 0.65584 <. 0001 205
0.63373 <. 0001 205
-0.34997 <. 0001 205
-0.28043 <. 0001 205
-0.14964 0.0322 205
-0.39160 <. 0001 205
-0.47036 <. 0001 205
-0.29632 <. 0001 205
1.5 Experience of Work and Life Circumstances Questionnaire with the Penn State Worry Questionnaire
Variable LOS OWS IWSOF IWSTC IWSPW IWSCM IWSSM IWSRF
Worry 0.49929 <. 0001 203
0.40727 <. 0001 203
-0.11571 0.1002 203
-0.25682 0.0002 203
-0.13263 0.0592 203
-0.14805 0.0350 203
-0.22629 0.0012 203
-0.12145 0.0843 203
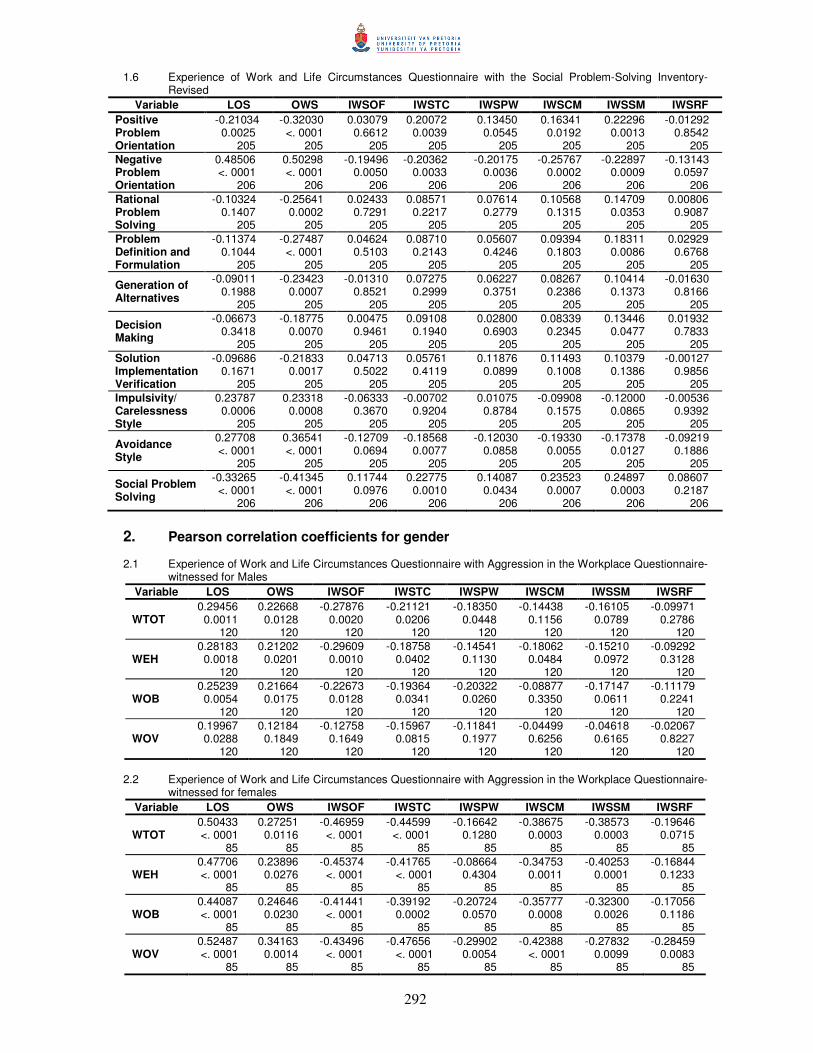
292
1.6 Experience of Work and Life Circumstances Questionnaire with the Social Problem-Solving Inventory-Revised
Variable LOS OWS IWSOF IWSTC IWSPW IWSCM IWSSM IWSRF Positive Problem Orientation
-0.21034 0.0025 205
-0.32030 <. 0001 205
0.03079 0.6612 205
0.20072 0.0039 205
0.13450 0.0545 205
0.16341 0.0192 205
0.22296 0.0013 205
-0.01292 0.8542 205
Negative Problem Orientation
0.48506 <. 0001 206
0.50298 <. 0001 206
-0.19496 0.0050 206
-0.20362 0.0033 206
-0.20175 0.0036 206
-0.25767 0.0002 206
-0.22897 0.0009 206
-0.13143 0.0597 206
Rational Problem Solving
-0.10324 0.1407 205
-0.25641 0.0002 205
0.02433 0.7291 205
0.08571 0.2217 205
0.07614 0.2779 205
0.10568 0.1315 205
0.14709 0.0353 205
0.00806 0.9087 205
Problem Definition and Formulation
-0.11374 0.1044 205
-0.27487 <. 0001 205
0.04624 0.5103 205
0.08710 0.2143 205
0.05607 0.4246 205
0.09394 0.1803 205
0.18311 0.0086 205
0.02929 0.6768 205
Generation of Alternatives
-0.09011 0.1988 205
-0.23423 0.0007 205
-0.01310 0.8521 205
0.07275 0.2999 205
0.06227 0.3751 205
0.08267 0.2386 205
0.10414 0.1373 205
-0.01630 0.8166 205
Decision Making
-0.06673 0.3418 205
-0.18775 0.0070 205
0.00475 0.9461 205
0.09108 0.1940 205
0.02800 0.6903 205
0.08339 0.2345 205
0.13446 0.0477 205
0.01932 0.7833 205
Solution Implementation Verification
-0.09686 0.1671 205
-0.21833 0.0017 205
0.04713 0.5022 205
0.05761 0.4119 205
0.11876 0.0899 205
0.11493 0.1008 205
0.10379 0.1386 205
-0.00127 0.9856 205
Impulsivity/ Carelessness Style
0.23787 0.0006 205
0.23318 0.0008 205
-0.06333 0.3670 205
-0.00702 0.9204 205
0.01075 0.8784 205
-0.09908 0.1575 205
-0.12000 0.0865 205
-0.00536 0.9392 205
Avoidance Style
0.27708 <. 0001 205
0.36541 <. 0001 205
-0.12709 0.0694 205
-0.18568 0.0077 205
-0.12030 0.0858 205
-0.19330 0.0055 205
-0.17378 0.0127 205
-0.09219 0.1886 205
Social Problem Solving
-0.33265 <. 0001 206
-0.41345 <. 0001 206
0.11744 0.0976 206
0.22775 0.0010 206
0.14087 0.0434 206
0.23523 0.0007 206
0.24897 0.0003 206
0.08607 0.2187 206
2. Pearson correlation coefficients for gender 2.1 Experience of Work and Life Circumstances Questionnaire with Aggression in the Workplace Questionnaire-
witnessed for Males Variable LOS OWS IWSOF IWSTC IWSPW IWSCM IWSSM IWSRF
WTOT 0.29456 0.0011 120
0.22668 0.0128 120
-0.27876 0.0020 120
-0.21121 0.0206 120
-0.18350 0.0448 120
-0.14438 0.1156 120
-0.16105 0.0789 120
-0.09971 0.2786 120
WEH 0.28183 0.0018 120
0.21202 0.0201 120
-0.29609 0.0010 120
-0.18758 0.0402 120
-0.14541 0.1130 120
-0.18062 0.0484 120
-0.15210 0.0972 120
-0.09292 0.3128 120
WOB 0.25239 0.0054 120
0.21664 0.0175 120
-0.22673 0.0128 120
-0.19364 0.0341 120
-0.20322 0.0260 120
-0.08877 0.3350 120
-0.17147 0.0611 120
-0.11179 0.2241 120
WOV 0.19967 0.0288 120
0.12184 0.1849 120
-0.12758 0.1649 120
-0.15967 0.0815 120
-0.11841 0.1977 120
-0.04499 0.6256 120
-0.04618 0.6165 120
-0.02067 0.8227 120
2.2 Experience of Work and Life Circumstances Questionnaire with Aggression in the Workplace Questionnaire-
witnessed for females Variable LOS OWS IWSOF IWSTC IWSPW IWSCM IWSSM IWSRF
WTOT 0.50433 <. 0001 85
0.27251 0.0116 85
-0.46959 <. 0001 85
-0.44599 <. 0001 85
-0.16642 0.1280 85
-0.38675 0.0003 85
-0.38573 0.0003 85
-0.19646 0.0715 85
WEH 0.47706 <. 0001 85
0.23896 0.0276 85
-0.45374 <. 0001 85
-0.41765 <. 0001 85
-0.08664 0.4304 85
-0.34753 0.0011 85
-0.40253 0.0001 85
-0.16844 0.1233 85
WOB 0.44087 <. 0001 85
0.24646 0.0230 85
-0.41441 <. 0001 85
-0.39192 0.0002 85
-0.20724 0.0570 85
-0.35777 0.0008 85
-0.32300 0.0026 85
-0.17056 0.1186 85
WOV 0.52487 <. 0001 85
0.34163 0.0014 85
-0.43496 <. 0001 85
-0.47656 <. 0001 85
-0.29902 0.0054 85
-0.42388 <. 0001 85
-0.27832 0.0099 85
-0.28459 0.0083 85
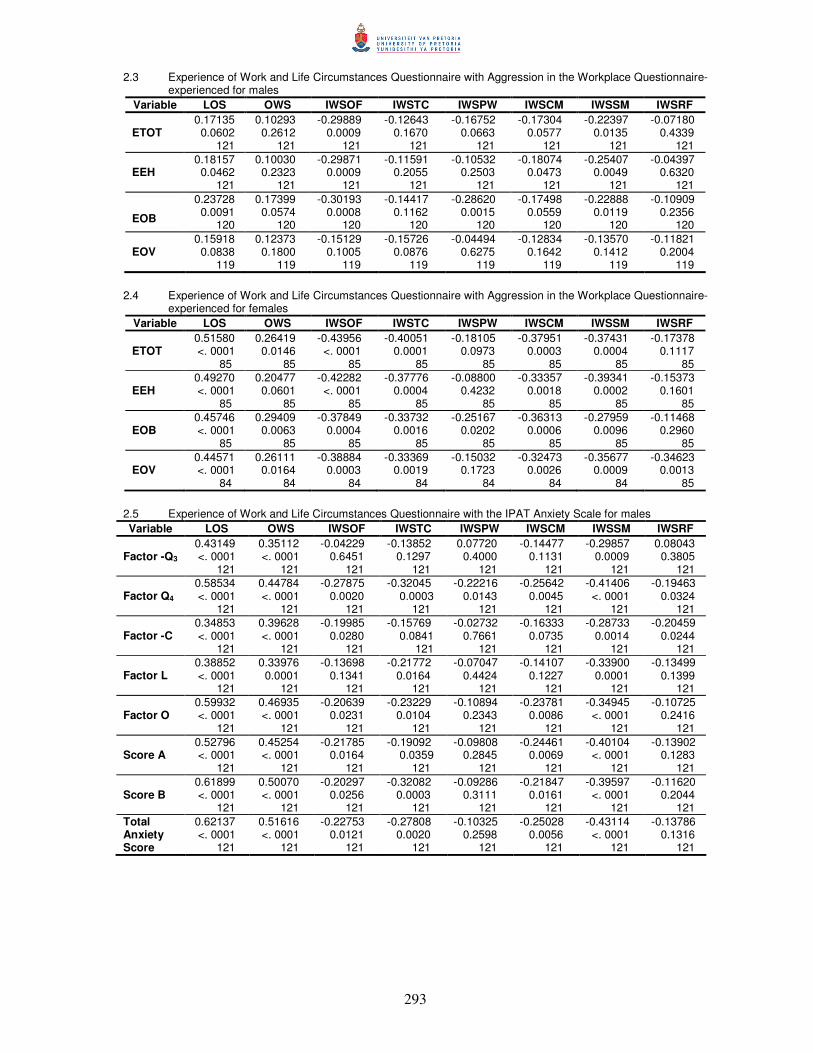
293
2.3 Experience of Work and Life Circumstances Questionnaire with Aggression in the Workplace Questionnaire-experienced for males
Variable LOS OWS IWSOF IWSTC IWSPW IWSCM IWSSM IWSRF
ETOT 0.17135 0.0602 121
0.10293 0.2612 121
-0.29889 0.0009 121
-0.12643 0.1670 121
-0.16752 0.0663 121
-0.17304 0.0577 121
-0.22397 0.0135 121
-0.07180 0.4339 121
EEH 0.18157 0.0462 121
0.10030 0.2323 121
-0.29871 0.0009 121
-0.11591 0.2055 121
-0.10532 0.2503 121
-0.18074 0.0473 121
-0.25407 0.0049 121
-0.04397 0.6320 121
EOB
0.23728 0.0091 120
0.17399 0.0574 120
-0.30193 0.0008 120
-0.14417 0.1162 120
-0.28620 0.0015 120
-0.17498 0.0559 120
-0.22888 0.0119 120
-0.10909 0.2356 120
EOV 0.15918 0.0838 119
0.12373 0.1800 119
-0.15129 0.1005 119
-0.15726 0.0876 119
-0.04494 0.6275 119
-0.12834 0.1642 119
-0.13570 0.1412 119
-0.11821 0.2004 119
2.4 Experience of Work and Life Circumstances Questionnaire with Aggression in the Workplace Questionnaire-
experienced for females Variable LOS OWS IWSOF IWSTC IWSPW IWSCM IWSSM IWSRF
ETOT 0.51580 <. 0001 85
0.26419 0.0146 85
-0.43956 <. 0001 85
-0.40051 0.0001 85
-0.18105 0.0973 85
-0.37951 0.0003 85
-0.37431 0.0004 85
-0.17378 0.1117 85
EEH 0.49270 <. 0001 85
0.20477 0.0601 85
-0.42282 <. 0001 85
-0.37776 0.0004 85
-0.08800 0.4232 85
-0.33357 0.0018 85
-0.39341 0.0002 85
-0.15373 0.1601 85
EOB 0.45746 <. 0001 85
0.29409 0.0063 85
-0.37849 0.0004 85
-0.33732 0.0016 85
-0.25167 0.0202 85
-0.36313 0.0006 85
-0.27959 0.0096 85
-0.11468 0.2960 85
EOV 0.44571 <. 0001 84
0.26111 0.0164 84
-0.38884 0.0003 84
-0.33369 0.0019 84
-0.15032 0.1723 84
-0.32473 0.0026 84
-0.35677 0.0009 84
-0.34623 0.0013 85
2.5 Experience of Work and Life Circumstances Questionnaire with the IPAT Anxiety Scale for males Variable LOS OWS IWSOF IWSTC IWSPW IWSCM IWSSM IWSRF
Factor -Q3 0.43149 <. 0001 121
0.35112 <. 0001 121
-0.04229 0.6451 121
-0.13852 0.1297 121
0.07720 0.4000 121
-0.14477 0.1131 121
-0.29857 0.0009 121
0.08043 0.3805 121
Factor Q4 0.58534 <. 0001 121
0.44784 <. 0001 121
-0.27875 0.0020 121
-0.32045 0.0003 121
-0.22216 0.0143 121
-0.25642 0.0045 121
-0.41406 <. 0001 121
-0.19463 0.0324 121
Factor -C 0.34853 <. 0001 121
0.39628 <. 0001 121
-0.19985 0.0280 121
-0.15769 0.0841 121
-0.02732 0.7661 121
-0.16333 0.0735 121
-0.28733 0.0014 121
-0.20459 0.0244 121
Factor L 0.38852 <. 0001 121
0.33976 0.0001 121
-0.13698 0.1341 121
-0.21772 0.0164 121
-0.07047 0.4424 121
-0.14107 0.1227 121
-0.33900 0.0001 121
-0.13499 0.1399 121
Factor O 0.59932 <. 0001 121
0.46935 <. 0001 121
-0.20639 0.0231 121
-0.23229 0.0104 121
-0.10894 0.2343 121
-0.23781 0.0086 121
-0.34945 <. 0001 121
-0.10725 0.2416 121
Score A 0.52796 <. 0001 121
0.45254 <. 0001 121
-0.21785 0.0164 121
-0.19092 0.0359 121
-0.09808 0.2845 121
-0.24461 0.0069 121
-0.40104 <. 0001 121
-0.13902 0.1283 121
Score B 0.61899 <. 0001 121
0.50070 <. 0001 121
-0.20297 0.0256 121
-0.32082 0.0003 121
-0.09286 0.3111 121
-0.21847 0.0161 121
-0.39597 <. 0001 121
-0.11620 0.2044 121
Total Anxiety Score
0.62137 <. 0001 121
0.51616 <. 0001 121
-0.22753 0.0121 121
-0.27808 0.0020 121
-0.10325 0.2598 121
-0.25028 0.0056 121
-0.43114 <. 0001 121
-0.13786 0.1316 121
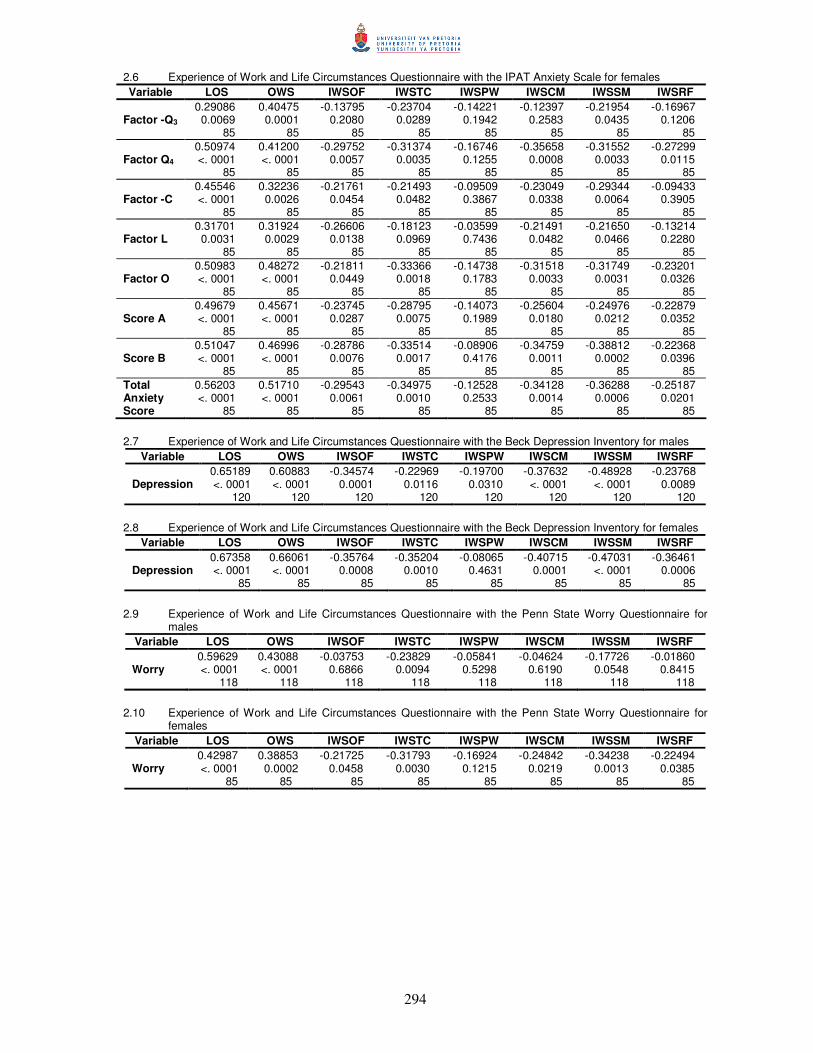
294
2.6 Experience of Work and Life Circumstances Questionnaire with the IPAT Anxiety Scale for females Variable LOS OWS IWSOF IWSTC IWSPW IWSCM IWSSM IWSRF
Factor -Q3 0.29086 0.0069 85
0.40475 0.0001 85
-0.13795 0.2080 85
-0.23704 0.0289 85
-0.14221 0.1942 85
-0.12397 0.2583 85
-0.21954 0.0435 85
-0.16967 0.1206 85
Factor Q4 0.50974 <. 0001 85
0.41200 <. 0001 85
-0.29752 0.0057 85
-0.31374 0.0035 85
-0.16746 0.1255 85
-0.35658 0.0008 85
-0.31552 0.0033 85
-0.27299 0.0115 85
Factor -C 0.45546 <. 0001 85
0.32236 0.0026 85
-0.21761 0.0454 85
-0.21493 0.0482 85
-0.09509 0.3867 85
-0.23049 0.0338 85
-0.29344 0.0064 85
-0.09433 0.3905 85
Factor L 0.31701 0.0031 85
0.31924 0.0029 85
-0.26606 0.0138 85
-0.18123 0.0969 85
-0.03599 0.7436 85
-0.21491 0.0482 85
-0.21650 0.0466 85
-0.13214 0.2280 85
Factor O 0.50983 <. 0001 85
0.48272 <. 0001 85
-0.21811 0.0449 85
-0.33366 0.0018 85
-0.14738 0.1783 85
-0.31518 0.0033 85
-0.31749 0.0031 85
-0.23201 0.0326 85
Score A 0.49679 <. 0001 85
0.45671 <. 0001 85
-0.23745 0.0287 85
-0.28795 0.0075 85
-0.14073 0.1989 85
-0.25604 0.0180 85
-0.24976 0.0212 85
-0.22879 0.0352 85
Score B 0.51047 <. 0001 85
0.46996 <. 0001 85
-0.28786 0.0076 85
-0.33514 0.0017 85
-0.08906 0.4176 85
-0.34759 0.0011 85
-0.38812 0.0002 85
-0.22368 0.0396 85
Total Anxiety Score
0.56203 <. 0001 85
0.51710 <. 0001 85
-0.29543 0.0061 85
-0.34975 0.0010 85
-0.12528 0.2533 85
-0.34128 0.0014 85
-0.36288 0.0006 85
-0.25187 0.0201 85
2.7 Experience of Work and Life Circumstances Questionnaire with the Beck Depression Inventory for males
Variable LOS OWS IWSOF IWSTC IWSPW IWSCM IWSSM IWSRF
Depression 0.65189 <. 0001 120
0.60883 <. 0001 120
-0.34574 0.0001 120
-0.22969 0.0116 120
-0.19700 0.0310 120
-0.37632 <. 0001 120
-0.48928 <. 0001 120
-0.23768 0.0089 120
2.8 Experience of Work and Life Circumstances Questionnaire with the Beck Depression Inventory for females
Variable LOS OWS IWSOF IWSTC IWSPW IWSCM IWSSM IWSRF
Depression 0.67358 <. 0001 85
0.66061 <. 0001 85
-0.35764 0.0008 85
-0.35204 0.0010 85
-0.08065 0.4631 85
-0.40715 0.0001 85
-0.47031 <. 0001 85
-0.36461 0.0006 85
2.9 Experience of Work and Life Circumstances Questionnaire with the Penn State Worry Questionnaire for
males Variable LOS OWS IWSOF IWSTC IWSPW IWSCM IWSSM IWSRF
Worry 0.59629 <. 0001 118
0.43088 <. 0001 118
-0.03753 0.6866 118
-0.23829 0.0094 118
-0.05841 0.5298 118
-0.04624 0.6190 118
-0.17726 0.0548 118
-0.01860 0.8415 118
2.10 Experience of Work and Life Circumstances Questionnaire with the Penn State Worry Questionnaire for
females Variable LOS OWS IWSOF IWSTC IWSPW IWSCM IWSSM IWSRF
Worry 0.42987 <. 0001 85
0.38853 0.0002 85
-0.21725 0.0458 85
-0.31793 0.0030 85
-0.16924 0.1215 85
-0.24842 0.0219 85
-0.34238 0.0013 85
-0.22494 0.0385 85
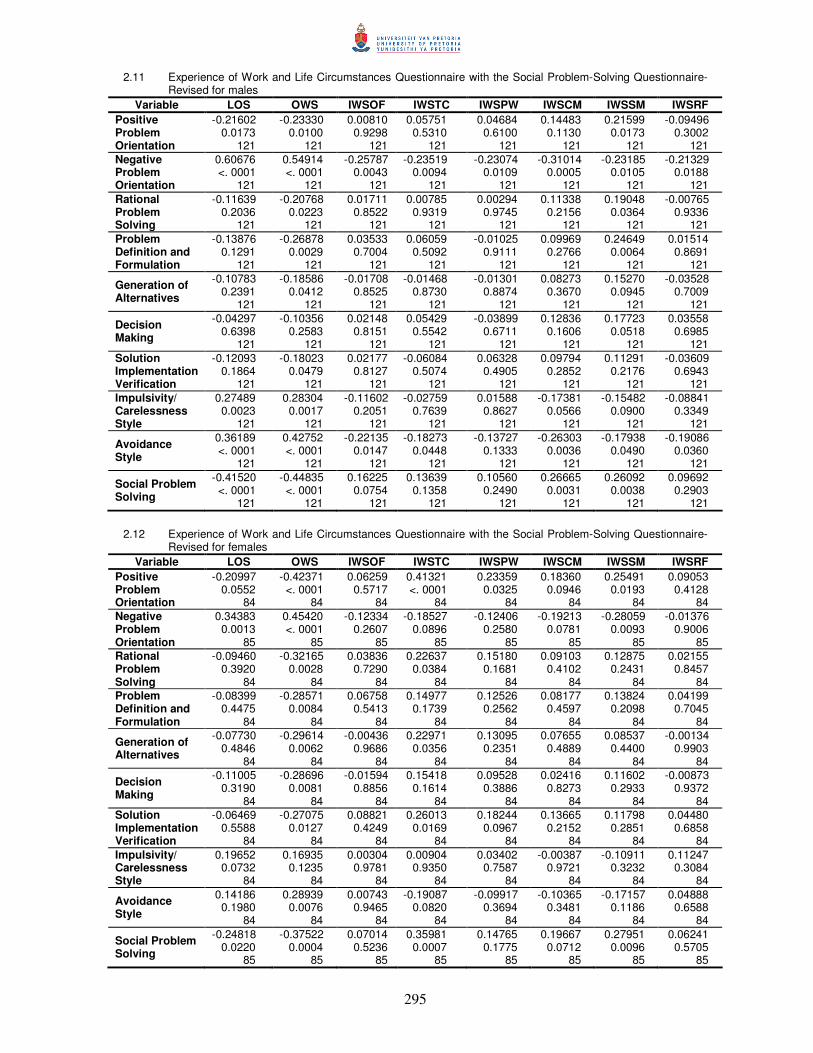
295
2.11 Experience of Work and Life Circumstances Questionnaire with the Social Problem-Solving Questionnaire-Revised for males
Variable LOS OWS IWSOF IWSTC IWSPW IWSCM IWSSM IWSRF Positive Problem Orientation
-0.21602 0.0173 121
-0.23330 0.0100 121
0.00810 0.9298 121
0.05751 0.5310 121
0.04684 0.6100 121
0.14483 0.1130 121
0.21599 0.0173 121
-0.09496 0.3002 121
Negative Problem Orientation
0.60676 <. 0001 121
0.54914 <. 0001 121
-0.25787 0.0043 121
-0.23519 0.0094 121
-0.23074 0.0109 121
-0.31014 0.0005 121
-0.23185 0.0105 121
-0.21329 0.0188 121
Rational Problem Solving
-0.11639 0.2036 121
-0.20768 0.0223 121
0.01711 0.8522 121
0.00785 0.9319 121
0.00294 0.9745 121
0.11338 0.2156 121
0.19048 0.0364 121
-0.00765 0.9336 121
Problem Definition and Formulation
-0.13876 0.1291 121
-0.26878 0.0029 121
0.03533 0.7004 121
0.06059 0.5092 121
-0.01025 0.9111 121
0.09969 0.2766 121
0.24649 0.0064 121
0.01514 0.8691 121
Generation of Alternatives
-0.10783 0.2391 121
-0.18586 0.0412 121
-0.01708 0.8525 121
-0.01468 0.8730 121
-0.01301 0.8874 121
0.08273 0.3670 121
0.15270 0.0945 121
-0.03528 0.7009 121
Decision Making
-0.04297 0.6398 121
-0.10356 0.2583 121
0.02148 0.8151 121
0.05429 0.5542 121
-0.03899 0.6711 121
0.12836 0.1606 121
0.17723 0.0518 121
0.03558 0.6985 121
Solution Implementation Verification
-0.12093 0.1864 121
-0.18023 0.0479 121
0.02177 0.8127 121
-0.06084 0.5074 121
0.06328 0.4905 121
0.09794 0.2852 121
0.11291 0.2176 121
-0.03609 0.6943 121
Impulsivity/ Carelessness Style
0.27489 0.0023 121
0.28304 0.0017 121
-0.11602 0.2051 121
-0.02759 0.7639 121
0.01588 0.8627 121
-0.17381 0.0566 121
-0.15482 0.0900 121
-0.08841 0.3349 121
Avoidance Style
0.36189 <. 0001 121
0.42752 <. 0001 121
-0.22135 0.0147 121
-0.18273 0.0448 121
-0.13727 0.1333 121
-0.26303 0.0036 121
-0.17938 0.0490 121
-0.19086 0.0360 121
Social Problem Solving
-0.41520 <. 0001 121
-0.44835 <. 0001 121
0.16225 0.0754 121
0.13639 0.1358 121
0.10560 0.2490 121
0.26665 0.0031 121
0.26092 0.0038 121
0.09692 0.2903 121
2.12 Experience of Work and Life Circumstances Questionnaire with the Social Problem-Solving Questionnaire-
Revised for females Variable LOS OWS IWSOF IWSTC IWSPW IWSCM IWSSM IWSRF
Positive Problem Orientation
-0.20997 0.0552 84
-0.42371 <. 0001 84
0.06259 0.5717 84
0.41321 <. 0001 84
0.23359 0.0325 84
0.18360 0.0946 84
0.25491 0.0193 84
0.09053 0.4128 84
Negative Problem Orientation
0.34383 0.0013 85
0.45420 <. 0001 85
-0.12334 0.2607 85
-0.18527 0.0896 85
-0.12406 0.2580 85
-0.19213 0.0781 85
-0.28059 0.0093 85
-0.01376 0.9006 85
Rational Problem Solving
-0.09460 0.3920 84
-0.32165 0.0028 84
0.03836 0.7290 84
0.22637 0.0384 84
0.15180 0.1681 84
0.09103 0.4102 84
0.12875 0.2431 84
0.02155 0.8457 84
Problem Definition and Formulation
-0.08399 0.4475 84
-0.28571 0.0084 84
0.06758 0.5413 84
0.14977 0.1739 84
0.12526 0.2562 84
0.08177 0.4597 84
0.13824 0.2098 84
0.04199 0.7045 84
Generation of Alternatives
-0.07730 0.4846 84
-0.29614 0.0062 84
-0.00436 0.9686 84
0.22971 0.0356 84
0.13095 0.2351 84
0.07655 0.4889 84
0.08537 0.4400 84
-0.00134 0.9903 84
Decision Making
-0.11005 0.3190 84
-0.28696 0.0081 84
-0.01594 0.8856 84
0.15418 0.1614 84
0.09528 0.3886 84
0.02416 0.8273 84
0.11602 0.2933 84
-0.00873 0.9372 84
Solution Implementation Verification
-0.06469 0.5588 84
-0.27075 0.0127 84
0.08821 0.4249 84
0.26013 0.0169 84
0.18244 0.0967 84
0.13665 0.2152 84
0.11798 0.2851 84
0.04480 0.6858 84
Impulsivity/ Carelessness Style
0.19652 0.0732 84
0.16935 0.1235 84
0.00304 0.9781 84
0.00904 0.9350 84
0.03402 0.7587 84
-0.00387 0.9721 84
-0.10911 0.3232 84
0.11247 0.3084 84
Avoidance Style
0.14186 0.1980 84
0.28939 0.0076 84
0.00743 0.9465 84
-0.19087 0.0820 84
-0.09917 0.3694 84
-0.10365 0.3481 84
-0.17157 0.1186 84
0.04888 0.6588 84
Social Problem Solving
-0.24818 0.0220 85
-0.37522 0.0004 85
0.07014 0.5236 85
0.35981 0.0007 85
0.14765 0.1775 85
0.19667 0.0712 85
0.27951 0.0096 85
0.06241 0.5705 85

296
3 Pearson correlation coefficients for the four age groups 3.1 Experience of Work and Life Circumstances Questionnaire with the Aggression in the Workplace
Questionnaire-witnessed for age group 20-29 Variable LOS OWS IWSOF IWSTC IWSPW IWSCM IWSSM IWSRF
WTOT 0.38498 0.0632 24
0.15075 0.4820 24
-0.65523 0.0005 24
-0.51311 0.0103 24
-0.19702 0.3561 24
-0.47370 0.0194 24
-0.34288 0.1010 24
-0.42155 0.0402 24
WEH 0.34781 0.0958 24
0.13487 0.5298 24
-0.70118 0.0001 24
-0.49208 0.0146 24
-0.10410 0.6283 24
-0.51603 0.0098 24
-0.39167 0.0584 24
-0.46713 0.0214 24
WOB 0.37168 0.0737 24
0.14568 0.4970 24
-0.54298 0.0061 24
-0.44556 0.0291 24
-0.30250 0.1508 24
-0.30666 0.1450 24
-0.28314 0.1800 24
-0.26685 0.2075 24
WOV 0.42867 0.0366 24
0.17389 0.4164 24
-0.41264 0.0451 24
-0.54994 0.0054 24
-0.31399 0.1351 24
-0.45392 0.0259 24
-0.09928 0.6444 24
-0.37993 0.0671 24
3.2 Experience of Work and Life Circumstances Questionnaire with the Aggression in the Workplace
Questionnaire-witnessed with age group 30-39 Variable LOS OWS IWSOF IWSTC IWSPW IWSCM IWSSM IWSRF
WTOT 0.53057 <. 0001 78
0.42941 <. 0001 78
-0.34982 0.0017 78
-0.36151 0.0011 78
-0.02880 0.8024 78
-0.16971 0.1374 78
-0.40652 0.0002 78
-0.11534 0.3146 78
WEH 0.50042 <. 0001 78
0.36653 0.0010 78
-0.32144 0.0041 78
-0.31745 0.0046 78
0.01478 0.8978 78
-0.13474 0.2395 78
-0.40657 0.0002 78
-0.04814 0.6755 78
WOB 0.43013 <. 0001 78
0.38636 0.0005 78
-0.30458 0.0067 78
-0.32287 0.0039 78
-0.06177 0.5911 78
-0.16601 0.1463 78
-0.34714 0.0018 78
-0.12802 0.2640 78
WOV 0.51203 <. 0001 78
0.45816 <. 0001 78
-0.31490 0.0050 78
-0.35905 0.0012 78
-0.08383 0.4656 78
-0.18417 0.1065 78
-0.26139 0.0208 78
-0.24661 0.0295 78
3.3 Experience of Work and Life Circumstances Questionnaire with the Aggression in the Workplace
Questionnaire-witnessed with age group 40-49 Variable LOS OWS IWSOF IWSTC IWSPW IWSCM IWSSM IWSRF
WTOT 0.14495 0.2777 58
0.05674 0.6722 58
-0.40905 0.0014 58
-0.24540 0.0634 58
-0.35577 0.0061 58
-0.39211 0.0023 58
-0.12096 0.3658 58
-0.16866 0.2057 58
WEH 0.15134 0.2568 58
0.07697 0.5658 58
-0.38307 0.0030 58
-0.22877 0.0841 58
-0.25957 0.0491 58
-0.40866 0.0014 58
-0.14269 0.2853 58
-0.15711 0.2389 58
WOB 0.11471 0.2784 58
0.05780 0.6665 58
-0.40785 0.0015 58
-0.24642 0.0622 58
-0.43099 0.0007 58
-0.35384 0.0064 58
-0.14545 0.2760 58
-0.22410 0.0908 58
WOV 0.00997 0.9408 58
-0.06240 0.6417 58
-0.18683 0.1602 58
-0.11132 0.4054 58
-0.22907 0.0837 58
-0.12653 0.3435 58
-0.11388 0.3947 58
-0.06411 0.6326 58
3.4 Experience of Work and Life Circumstances Questionnaire with the Aggression in the Workplace
Questionnaire-witnessed with age group 50+ Variable LOS OWS IWSOF IWSTC IWSPW IWSCM IWSSM IWSRF
WTOT 0.42517 0.0045 43
0.18382 0.2380 43
-0.19480 0.2107 43
-0.17851 0.2521 43
-0.01893 0.9041 43
-0.17063 0.2740 43
-0.20665 0.1837 43
0.01264 0.9359 43
WEH 0.41916 0.0051 43
0.16482 0.2909 43
-0.25504 0.0988 43
-0.10849 0.4886 43
0.00000 1.0000 43
-0.18650 0.2311 43
-0.14402 0.3569 43
0.01478 0.9250 43
WOB 0.41946 0.0051 43
0.23145 0.1354 43
-0.16049 0.3039 43
-0.24284 0.1166 43
-0.02656 0.8658 43
-0.15353 0.3256 43
-0.29471 0.0551 43
-0.02158 0.8908 43
WOV 0.24091 0.0065 43
0.03595 0.8190 43
-0.00574 0.9708 43
-0.13850 0.3758 43
-0.04513 0.7738 43
-0.07911 0.6141 43
-0.07751 0.6213 43
0.07834 0.6176 43
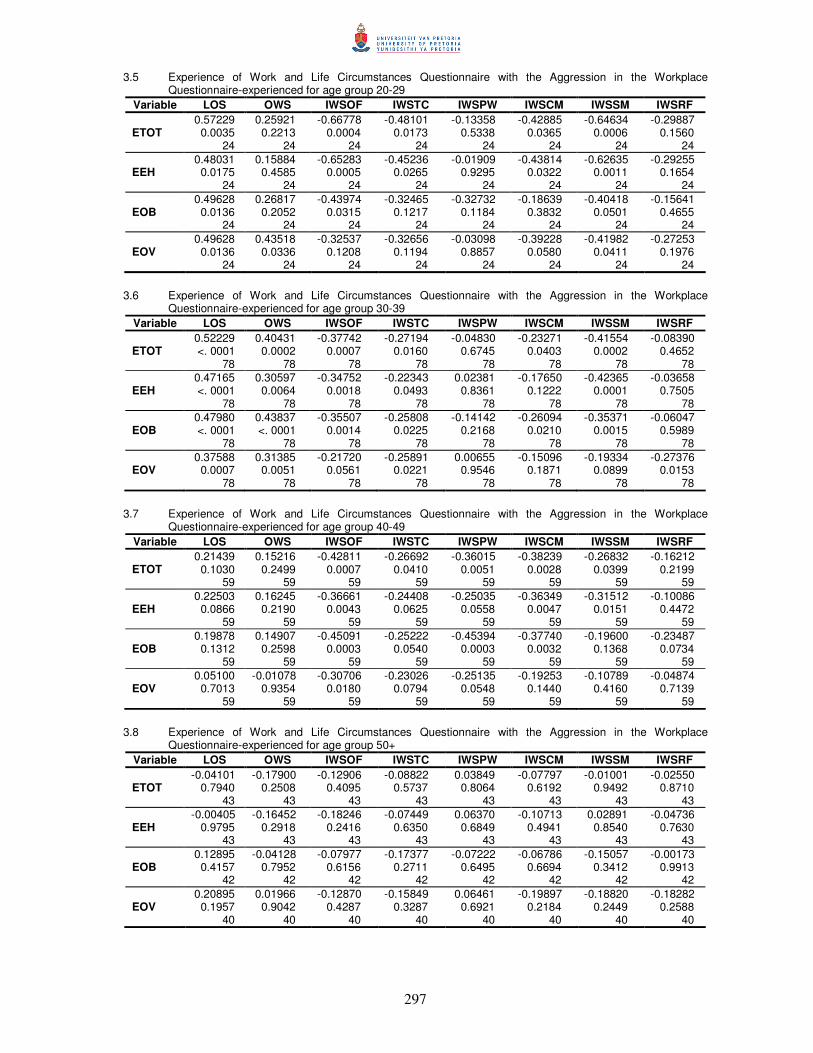
297
3.5 Experience of Work and Life Circumstances Questionnaire with the Aggression in the Workplace Questionnaire-experienced for age group 20-29
Variable LOS OWS IWSOF IWSTC IWSPW IWSCM IWSSM IWSRF
ETOT 0.57229 0.0035 24
0.25921 0.2213 24
-0.66778 0.0004 24
-0.48101 0.0173 24
-0.13358 0.5338 24
-0.42885 0.0365 24
-0.64634 0.0006 24
-0.29887 0.1560 24
EEH 0.48031 0.0175 24
0.15884 0.4585 24
-0.65283 0.0005 24
-0.45236 0.0265 24
-0.01909 0.9295 24
-0.43814 0.0322 24
-0.62635 0.0011 24
-0.29255 0.1654 24
EOB 0.49628 0.0136 24
0.26817 0.2052 24
-0.43974 0.0315 24
-0.32465 0.1217 24
-0.32732 0.1184 24
-0.18639 0.3832 24
-0.40418 0.0501 24
-0.15641 0.4655 24
EOV 0.49628 0.0136 24
0.43518 0.0336 24
-0.32537 0.1208 24
-0.32656 0.1194 24
-0.03098 0.8857 24
-0.39228 0.0580 24
-0.41982 0.0411 24
-0.27253 0.1976 24
3.6 Experience of Work and Life Circumstances Questionnaire with the Aggression in the Workplace
Questionnaire-experienced for age group 30-39 Variable LOS OWS IWSOF IWSTC IWSPW IWSCM IWSSM IWSRF
ETOT 0.52229 <. 0001 78
0.40431 0.0002 78
-0.37742 0.0007 78
-0.27194 0.0160 78
-0.04830 0.6745 78
-0.23271 0.0403 78
-0.41554 0.0002 78
-0.08390 0.4652 78
EEH 0.47165 <. 0001 78
0.30597 0.0064 78
-0.34752 0.0018 78
-0.22343 0.0493 78
0.02381 0.8361 78
-0.17650 0.1222 78
-0.42365 0.0001 78
-0.03658 0.7505 78
EOB 0.47980 <. 0001 78
0.43837 <. 0001 78
-0.35507 0.0014 78
-0.25808 0.0225 78
-0.14142 0.2168 78
-0.26094 0.0210 78
-0.35371 0.0015 78
-0.06047 0.5989 78
EOV 0.37588 0.0007 78
0.31385 0.0051 78
-0.21720 0.0561 78
-0.25891 0.0221 78
0.00655 0.9546 78
-0.15096 0.1871 78
-0.19334 0.0899 78
-0.27376 0.0153 78
3.7 Experience of Work and Life Circumstances Questionnaire with the Aggression in the Workplace
Questionnaire-experienced for age group 40-49 Variable LOS OWS IWSOF IWSTC IWSPW IWSCM IWSSM IWSRF
ETOT 0.21439 0.1030 59
0.15216 0.2499 59
-0.42811 0.0007 59
-0.26692 0.0410 59
-0.36015 0.0051 59
-0.38239 0.0028 59
-0.26832 0.0399 59
-0.16212 0.2199 59
EEH 0.22503 0.0866 59
0.16245 0.2190 59
-0.36661 0.0043 59
-0.24408 0.0625 59
-0.25035 0.0558 59
-0.36349 0.0047 59
-0.31512 0.0151 59
-0.10086 0.4472 59
EOB 0.19878 0.1312 59
0.14907 0.2598 59
-0.45091 0.0003 59
-0.25222 0.0540 59
-0.45394 0.0003 59
-0.37740 0.0032 59
-0.19600 0.1368 59
-0.23487 0.0734 59
EOV 0.05100 0.7013 59
-0.01078 0.9354 59
-0.30706 0.0180 59
-0.23026 0.0794 59
-0.25135 0.0548 59
-0.19253 0.1440 59
-0.10789 0.4160 59
-0.04874 0.7139 59
3.8 Experience of Work and Life Circumstances Questionnaire with the Aggression in the Workplace
Questionnaire-experienced for age group 50+ Variable LOS OWS IWSOF IWSTC IWSPW IWSCM IWSSM IWSRF
ETOT -0.04101 0.7940 43
-0.17900 0.2508 43
-0.12906 0.4095 43
-0.08822 0.5737 43
0.03849 0.8064 43
-0.07797 0.6192 43
-0.01001 0.9492 43
-0.02550 0.8710 43
EEH -0.00405 0.9795 43
-0.16452 0.2918 43
-0.18246 0.2416 43
-0.07449 0.6350 43
0.06370 0.6849 43
-0.10713 0.4941 43
0.02891 0.8540 43
-0.04736 0.7630 43
EOB 0.12895 0.4157 42
-0.04128 0.7952 42
-0.07977 0.6156 42
-0.17377 0.2711 42
-0.07222 0.6495 42
-0.06786 0.6694 42
-0.15057 0.3412 42
-0.00173 0.9913 42
EOV 0.20895 0.1957 40
0.01966 0.9042 40
-0.12870 0.4287 40
-0.15849 0.3287 40
0.06461 0.6921 40
-0.19897 0.2184 40
-0.18820 0.2449 40
-0.18282 0.2588 40
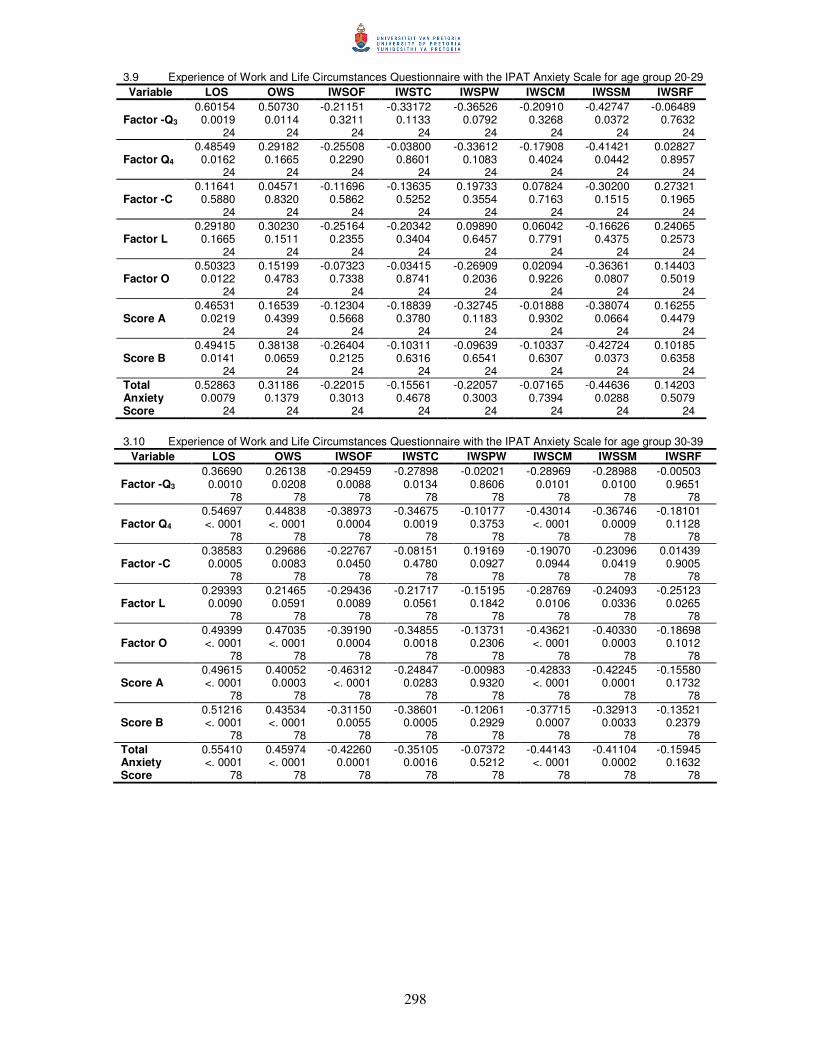
298
3.9 Experience of Work and Life Circumstances Questionnaire with the IPAT Anxiety Scale for age group 20-29 Variable LOS OWS IWSOF IWSTC IWSPW IWSCM IWSSM IWSRF
Factor -Q3 0.60154 0.0019 24
0.50730 0.0114 24
-0.21151 0.3211 24
-0.33172 0.1133 24
-0.36526 0.0792 24
-0.20910 0.3268 24
-0.42747 0.0372 24
-0.06489 0.7632 24
Factor Q4 0.48549 0.0162 24
0.29182 0.1665 24
-0.25508 0.2290 24
-0.03800 0.8601 24
-0.33612 0.1083 24
-0.17908 0.4024 24
-0.41421 0.0442 24
0.02827 0.8957 24
Factor -C 0.11641 0.5880 24
0.04571 0.8320 24
-0.11696 0.5862 24
-0.13635 0.5252 24
0.19733 0.3554 24
0.07824 0.7163 24
-0.30200 0.1515 24
0.27321 0.1965 24
Factor L 0.29180 0.1665 24
0.30230 0.1511 24
-0.25164 0.2355 24
-0.20342 0.3404 24
0.09890 0.6457 24
0.06042 0.7791 24
-0.16626 0.4375 24
0.24065 0.2573 24
Factor O 0.50323 0.0122 24
0.15199 0.4783 24
-0.07323 0.7338 24
-0.03415 0.8741 24
-0.26909 0.2036 24
0.02094 0.9226 24
-0.36361 0.0807 24
0.14403 0.5019 24
Score A 0.46531 0.0219 24
0.16539 0.4399 24
-0.12304 0.5668 24
-0.18839 0.3780 24
-0.32745 0.1183 24
-0.01888 0.9302 24
-0.38074 0.0664 24
0.16255 0.4479 24
Score B 0.49415 0.0141 24
0.38138 0.0659 24
-0.26404 0.2125 24
-0.10311 0.6316 24
-0.09639 0.6541 24
-0.10337 0.6307 24
-0.42724 0.0373 24
0.10185 0.6358 24
Total Anxiety Score
0.52863 0.0079 24
0.31186 0.1379 24
-0.22015 0.3013 24
-0.15561 0.4678 24
-0.22057 0.3003 24
-0.07165 0.7394 24
-0.44636 0.0288 24
0.14203 0.5079 24
3.10 Experience of Work and Life Circumstances Questionnaire with the IPAT Anxiety Scale for age group 30-39
Variable LOS OWS IWSOF IWSTC IWSPW IWSCM IWSSM IWSRF
Factor -Q3 0.36690 0.0010 78
0.26138 0.0208 78
-0.29459 0.0088 78
-0.27898 0.0134 78
-0.02021 0.8606 78
-0.28969 0.0101 78
-0.28988 0.0100 78
-0.00503 0.9651 78
Factor Q4 0.54697 <. 0001 78
0.44838 <. 0001 78
-0.38973 0.0004 78
-0.34675 0.0019 78
-0.10177 0.3753 78
-0.43014 <. 0001 78
-0.36746 0.0009 78
-0.18101 0.1128 78
Factor -C 0.38583 0.0005 78
0.29686 0.0083 78
-0.22767 0.0450 78
-0.08151 0.4780 78
0.19169 0.0927 78
-0.19070 0.0944 78
-0.23096 0.0419 78
0.01439 0.9005 78
Factor L 0.29393 0.0090 78
0.21465 0.0591 78
-0.29436 0.0089 78
-0.21717 0.0561 78
-0.15195 0.1842 78
-0.28769 0.0106 78
-0.24093 0.0336 78
-0.25123 0.0265 78
Factor O 0.49399 <. 0001 78
0.47035 <. 0001 78
-0.39190 0.0004 78
-0.34855 0.0018 78
-0.13731 0.2306 78
-0.43621 <. 0001 78
-0.40330 0.0003 78
-0.18698 0.1012 78
Score A 0.49615 <. 0001 78
0.40052 0.0003 78
-0.46312 <. 0001 78
-0.24847 0.0283 78
-0.00983 0.9320 78
-0.42833 <. 0001 78
-0.42245 0.0001 78
-0.15580 0.1732 78
Score B 0.51216 <. 0001 78
0.43534 <. 0001 78
-0.31150 0.0055 78
-0.38601 0.0005 78
-0.12061 0.2929 78
-0.37715 0.0007 78
-0.32913 0.0033 78
-0.13521 0.2379 78
Total Anxiety Score
0.55410 <. 0001 78
0.45974 <. 0001 78
-0.42260 0.0001 78
-0.35105 0.0016 78
-0.07372 0.5212 78
-0.44143 <. 0001 78
-0.41104 0.0002 78
-0.15945 0.1632 78

299
3.11 Experience of Work and Life Circumstances Questionnaire with the IPAT Anxiety Scale for age group 40-49 Variable LOS OWS IWSOF IWSTC IWSPW IWSCM IWSSM IWSRF
Factor -Q3 0.39512 0.0020 59
0.50794 <. 0001 59
0.13503 0.3079 59
0.05422 0.6834 59
0.16689 0.2065 59
0.11299 0.3942 59
-0.16781 0.2039 59
-0.06529 0.6232 59
Factor Q4 0.58829 <. 0001 59
0.49910 <. 0001 59
-0.04272 0.7480 59
-0.32931 0.0109 59
-0.12366 0.3507 59
-0.00375 0.9775 59
-0.18726 0.1555 59
-0.18405 0.1629 59
Factor -C 0.42983 0.0007 59
0.55949 <. 0001 59
-0.08981 0.4987 59
-0.08753 0.5098 59
0.05467 0.6809 59
-0.09715 0.4642 59
-0.25305 0.0532 59
-0.20613 0.1173 59
Factor L 0.48477 <. 0001 59
0.52643 <. 0001 59
0.02007 0.8801 59
-0.11152 0.4004 59
0.14544 0.2717 59
0.03534 0.7904 59
-0.29810 0.0218 59
-0.08371 0.5285 59
Factor O 0.57154 <. 0001 59
0.52304 <. 0001 59
0.03176 0.8112 59
-0.10323 0.4365 59
0.04610 0.7288 59
0.05232 0.6939 59
-0.03867 0.7712 59
-0.04563 0.7315 59
Score A 0.57966 <. 0001 59
0.59514 <. 0001 59
0.07589 0.5678 59
-0.15133 0.2526 59
-0.00466 0.9721 59
0.05437 0.6825 59
-0.10169 0.4434 59
-0.14517 0.2726 59
Score B 0.56641 <. 0001 59
0.57089 <. 0001 59
-0.04706 0.7234 59
-0.15066 0.2547 59
0.08101 0.5419 59
-0.00035 0.9979 59
-0.26766 0.0404 59
-0.11684 0.3781 59
Total Anxiety Score
0.62294 <. 0001 59
0.63347 <. 0001 59
0.01203 0.9280 59
-0.16423 0.2139 59
0.04407 0.7403 59
0.02776 0.8347 59
-0.20582 0.1178 59
-0.14166 0.2845 59
3.12 Experience of Work and Life Circumstances Questionnaire with the IPAT Anxiety Scale for age group 50+
Variable LOS OWS IWSOF IWSTC IWSPW IWSCM IWSSM IWSRF
Factor -Q3 0.41340 0.0059 43
0.44712 0.0026 43
0.10735 0.4932 43
-0.17587 0.2593 43
-0.19319 0.2145 43
-0.16156 0.3007 43
-0.27547 0.0738 43
0.04378 0.7804 43
Factor Q4 0.51623 0.0004 43
0.37335 0.0137 43
-0.40559 0.0070 43
-0.29799 0.0523 43
-0.38547 0.0107 43
-0.47514 0.0013 43
-0.46893 0.0015 43
-0.47170 0.0014 43
Factor -C 0.44226 0.0030 43
0.39945 0.0080 43
-0.29495 0.0548 43
-0.36953 0.0147 43
-0.38885 0.0100 43
-0.36467 0.0162 43
-0.30185 0.0492 43
-0.54799 0.0001 43
Factor L 0.26743 0.0830 43
0.25242 0.1025 43
-0.24628 0.1114 43
-0.28241 0.0665 43
-0.36646 0.0156 43
-0.33766 0.0268 43
-0.24722 0.1100 43
-0.18231 0.2420 43
Factor O 0.58452 <. 0001 43
0.47905 0.0012 43
-0.08266 0.5982 43
-0.34089 0.0253 43
-0.24350 0.1156 43
-0.36279 0.0168 43
-0.32568 0.0331 43
-0.40083 0.0077 43
Score A 0.45054 0.0024 43
0.47951 0.0011 43
-0.19317 0.2146 43
-0.23565 0.1282 43
-0.39333 0.0091 43
-0.34478 0.0236 43
-0.36670 0.0156 43
-0.41323 0.0059 43
Score B 0.63577 <. 0001 43
0.46150 0.0018 43
-0.25005 0.1058 43
-0.44372 0.0029 43
-0.33860 0.0264 43
-0.47022 0.0015 43
-0.42281 0.0047 43
-0.38241 0.0114 43
Total Anxiety Score
0.60808 <. 0001 43
0.51980 0.0004 43
-0.24737 0.1098 43
-0.38388 0.0110 43
-0.40272 0.0074 43
-0.45568 0.0021 43
-0.43889 0.0032 43
-0.43889 0.0032 43
3.13 Experience of Work and Life Circumstances Questionnaire with the Beck Depression Inventory for age
group 20-29 Variable LOS OWS IWSOF IWSTC IWSPW IWSCM IWSSM IWSRF
Depression 0.64933 0.0006 24
0.81337 <. 0001 24
-0.52518 0.0084 24
-0.31800 0.1299 24
-0.25480 0.2295 24
-0.26987 0.2022 24
-0.50724 0.0114 24
-0.37590 0.0703 24
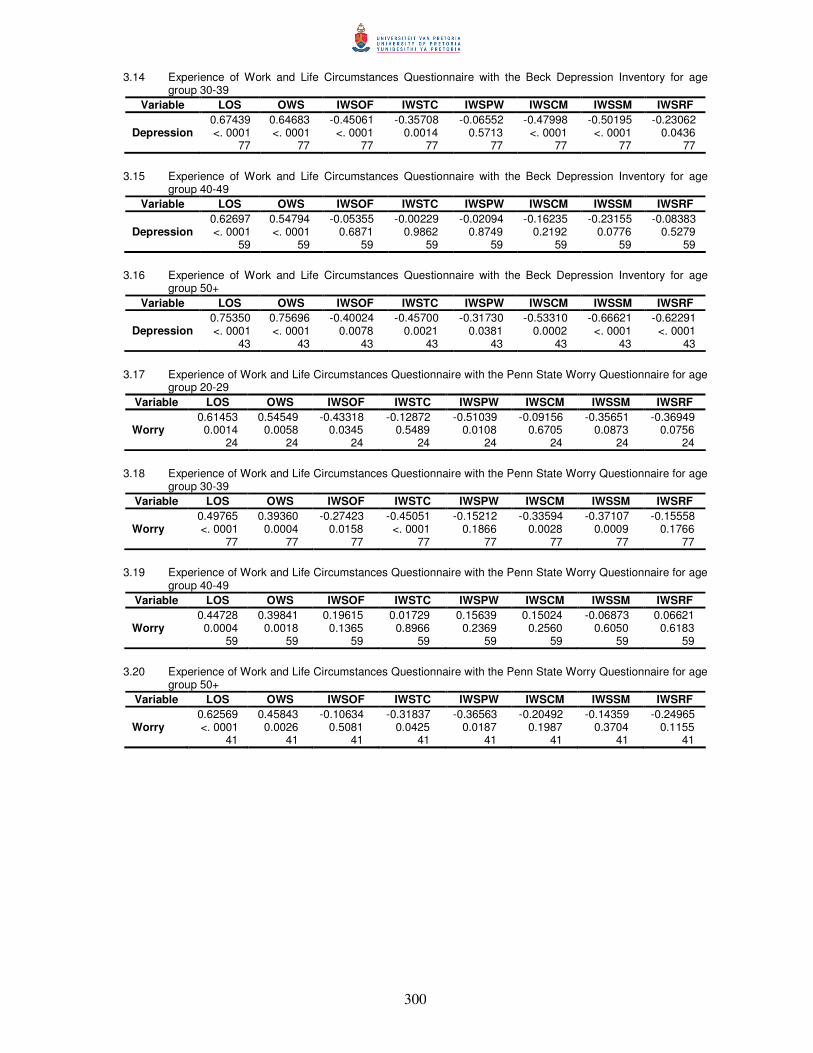
300
3.14 Experience of Work and Life Circumstances Questionnaire with the Beck Depression Inventory for age group 30-39
Variable LOS OWS IWSOF IWSTC IWSPW IWSCM IWSSM IWSRF
Depression 0.67439 <. 0001 77
0.64683 <. 0001 77
-0.45061 <. 0001 77
-0.35708 0.0014 77
-0.06552 0.5713 77
-0.47998 <. 0001 77
-0.50195 <. 0001 77
-0.23062 0.0436 77
3.15 Experience of Work and Life Circumstances Questionnaire with the Beck Depression Inventory for age
group 40-49 Variable LOS OWS IWSOF IWSTC IWSPW IWSCM IWSSM IWSRF
Depression 0.62697 <. 0001 59
0.54794 <. 0001 59
-0.05355 0.6871 59
-0.00229 0.9862 59
-0.02094 0.8749 59
-0.16235 0.2192 59
-0.23155 0.0776 59
-0.08383 0.5279 59
3.16 Experience of Work and Life Circumstances Questionnaire with the Beck Depression Inventory for age
group 50+ Variable LOS OWS IWSOF IWSTC IWSPW IWSCM IWSSM IWSRF
Depression 0.75350 <. 0001 43
0.75696 <. 0001 43
-0.40024 0.0078 43
-0.45700 0.0021 43
-0.31730 0.0381 43
-0.53310 0.0002 43
-0.66621 <. 0001 43
-0.62291 <. 0001 43
3.17 Experience of Work and Life Circumstances Questionnaire with the Penn State Worry Questionnaire for age
group 20-29 Variable LOS OWS IWSOF IWSTC IWSPW IWSCM IWSSM IWSRF
Worry 0.61453 0.0014 24
0.54549 0.0058 24
-0.43318 0.0345 24
-0.12872 0.5489 24
-0.51039 0.0108 24
-0.09156 0.6705 24
-0.35651 0.0873 24
-0.36949 0.0756 24
3.18 Experience of Work and Life Circumstances Questionnaire with the Penn State Worry Questionnaire for age
group 30-39 Variable LOS OWS IWSOF IWSTC IWSPW IWSCM IWSSM IWSRF
Worry 0.49765 <. 0001 77
0.39360 0.0004 77
-0.27423 0.0158 77
-0.45051 <. 0001 77
-0.15212 0.1866 77
-0.33594 0.0028 77
-0.37107 0.0009 77
-0.15558 0.1766 77
3.19 Experience of Work and Life Circumstances Questionnaire with the Penn State Worry Questionnaire for age
group 40-49 Variable LOS OWS IWSOF IWSTC IWSPW IWSCM IWSSM IWSRF
Worry 0.44728 0.0004 59
0.39841 0.0018 59
0.19615 0.1365 59
0.01729 0.8966 59
0.15639 0.2369 59
0.15024 0.2560 59
-0.06873 0.6050 59
0.06621 0.6183 59
3.20 Experience of Work and Life Circumstances Questionnaire with the Penn State Worry Questionnaire for age
group 50+ Variable LOS OWS IWSOF IWSTC IWSPW IWSCM IWSSM IWSRF
Worry 0.62569 <. 0001 41
0.45843 0.0026 41
-0.10634 0.5081 41
-0.31837 0.0425 41
-0.36563 0.0187 41
-0.20492 0.1987 41
-0.14359 0.3704 41
-0.24965 0.1155 41
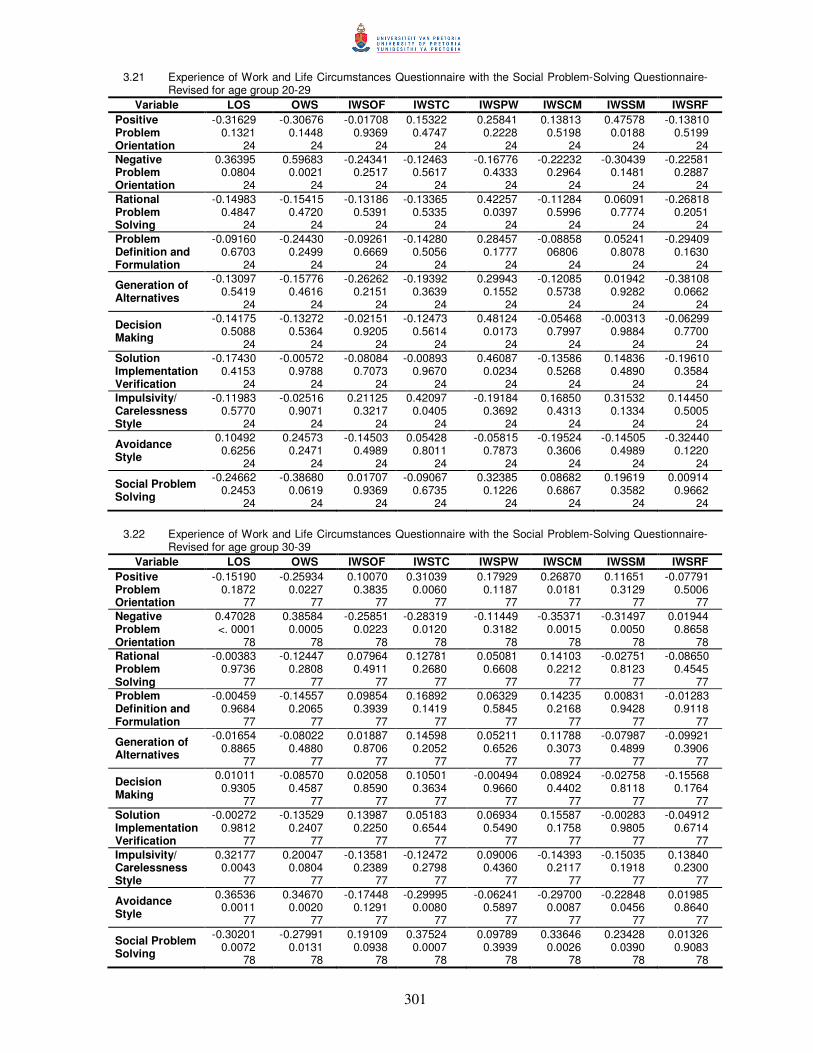
301
3.21 Experience of Work and Life Circumstances Questionnaire with the Social Problem-Solving Questionnaire-Revised for age group 20-29
Variable LOS OWS IWSOF IWSTC IWSPW IWSCM IWSSM IWSRF Positive Problem Orientation
-0.31629 0.1321 24
-0.30676 0.1448 24
-0.01708 0.9369 24
0.15322 0.4747 24
0.25841 0.2228 24
0.13813 0.5198 24
0.47578 0.0188 24
-0.13810 0.5199 24
Negative Problem Orientation
0.36395 0.0804 24
0.59683 0.0021 24
-0.24341 0.2517 24
-0.12463 0.5617 24
-0.16776 0.4333 24
-0.22232 0.2964 24
-0.30439 0.1481 24
-0.22581 0.2887 24
Rational Problem Solving
-0.14983 0.4847 24
-0.15415 0.4720 24
-0.13186 0.5391 24
-0.13365 0.5335 24
0.42257 0.0397 24
-0.11284 0.5996 24
0.06091 0.7774 24
-0.26818 0.2051 24
Problem Definition and Formulation
-0.09160 0.6703 24
-0.24430 0.2499 24
-0.09261 0.6669 24
-0.14280 0.5056 24
0.28457 0.1777 24
-0.08858 06806 24
0.05241 0.8078 24
-0.29409 0.1630 24
Generation of Alternatives
-0.13097 0.5419 24
-0.15776 0.4616 24
-0.26262 0.2151 24
-0.19392 0.3639 24
0.29943 0.1552 24
-0.12085 0.5738 24
0.01942 0.9282 24
-0.38108 0.0662 24
Decision Making
-0.14175 0.5088 24
-0.13272 0.5364 24
-0.02151 0.9205 24
-0.12473 0.5614 24
0.48124 0.0173 24
-0.05468 0.7997 24
-0.00313 0.9884 24
-0.06299 0.7700 24
Solution Implementation Verification
-0.17430 0.4153 24
-0.00572 0.9788 24
-0.08084 0.7073 24
-0.00893 0.9670 24
0.46087 0.0234 24
-0.13586 0.5268 24
0.14836 0.4890 24
-0.19610 0.3584 24
Impulsivity/ Carelessness Style
-0.11983 0.5770 24
-0.02516 0.9071 24
0.21125 0.3217 24
0.42097 0.0405 24
-0.19184 0.3692 24
0.16850 0.4313 24
0.31532 0.1334 24
0.14450 0.5005 24
Avoidance Style
0.10492 0.6256 24
0.24573 0.2471 24
-0.14503 0.4989 24
0.05428 0.8011 24
-0.05815 0.7873 24
-0.19524 0.3606 24
-0.14505 0.4989 24
-0.32440 0.1220 24
Social Problem Solving
-0.24662 0.2453 24
-0.38680 0.0619 24
0.01707 0.9369 24
-0.09067 0.6735 24
0.32385 0.1226 24
0.08682 0.6867 24
0.19619 0.3582 24
0.00914 0.9662 24
3.22 Experience of Work and Life Circumstances Questionnaire with the Social Problem-Solving Questionnaire-
Revised for age group 30-39 Variable LOS OWS IWSOF IWSTC IWSPW IWSCM IWSSM IWSRF
Positive Problem Orientation
-0.15190 0.1872 77
-0.25934 0.0227 77
0.10070 0.3835 77
0.31039 0.0060 77
0.17929 0.1187 77
0.26870 0.0181 77
0.11651 0.3129 77
-0.07791 0.5006 77
Negative Problem Orientation
0.47028 <. 0001 78
0.38584 0.0005 78
-0.25851 0.0223 78
-0.28319 0.0120 78
-0.11449 0.3182 78
-0.35371 0.0015 78
-0.31497 0.0050 78
0.01944 0.8658 78
Rational Problem Solving
-0.00383 0.9736 77
-0.12447 0.2808 77
0.07964 0.4911 77
0.12781 0.2680 77
0.05081 0.6608 77
0.14103 0.2212 77
-0.02751 0.8123 77
-0.08650 0.4545 77
Problem Definition and Formulation
-0.00459 0.9684 77
-0.14557 0.2065 77
0.09854 0.3939 77
0.16892 0.1419 77
0.06329 0.5845 77
0.14235 0.2168 77
0.00831 0.9428 77
-0.01283 0.9118 77
Generation of Alternatives
-0.01654 0.8865 77
-0.08022 0.4880 77
0.01887 0.8706 77
0.14598 0.2052 77
0.05211 0.6526 77
0.11788 0.3073 77
-0.07987 0.4899 77
-0.09921 0.3906 77
Decision Making
0.01011 0.9305 77
-0.08570 0.4587 77
0.02058 0.8590 77
0.10501 0.3634 77
-0.00494 0.9660 77
0.08924 0.4402 77
-0.02758 0.8118 77
-0.15568 0.1764 77
Solution Implementation Verification
-0.00272 0.9812 77
-0.13529 0.2407 77
0.13987 0.2250 77
0.05183 0.6544 77
0.06934 0.5490 77
0.15587 0.1758 77
-0.00283 0.9805 77
-0.04912 0.6714 77
Impulsivity/ Carelessness Style
0.32177 0.0043 77
0.20047 0.0804 77
-0.13581 0.2389 77
-0.12472 0.2798 77
0.09006 0.4360 77
-0.14393 0.2117 77
-0.15035 0.1918 77
0.13840 0.2300 77
Avoidance Style
0.36536 0.0011 77
0.34670 0.0020 77
-0.17448 0.1291 77
-0.29995 0.0080 77
-0.06241 0.5897 77
-0.29700 0.0087 77
-0.22848 0.0456 77
0.01985 0.8640 77
Social Problem Solving
-0.30201 0.0072 78
-0.27991 0.0131 78
0.19109 0.0938 78
0.37524 0.0007 78
0.09789 0.3939 78
0.33646 0.0026 78
0.23428 0.0390 78
0.01326 0.9083 78
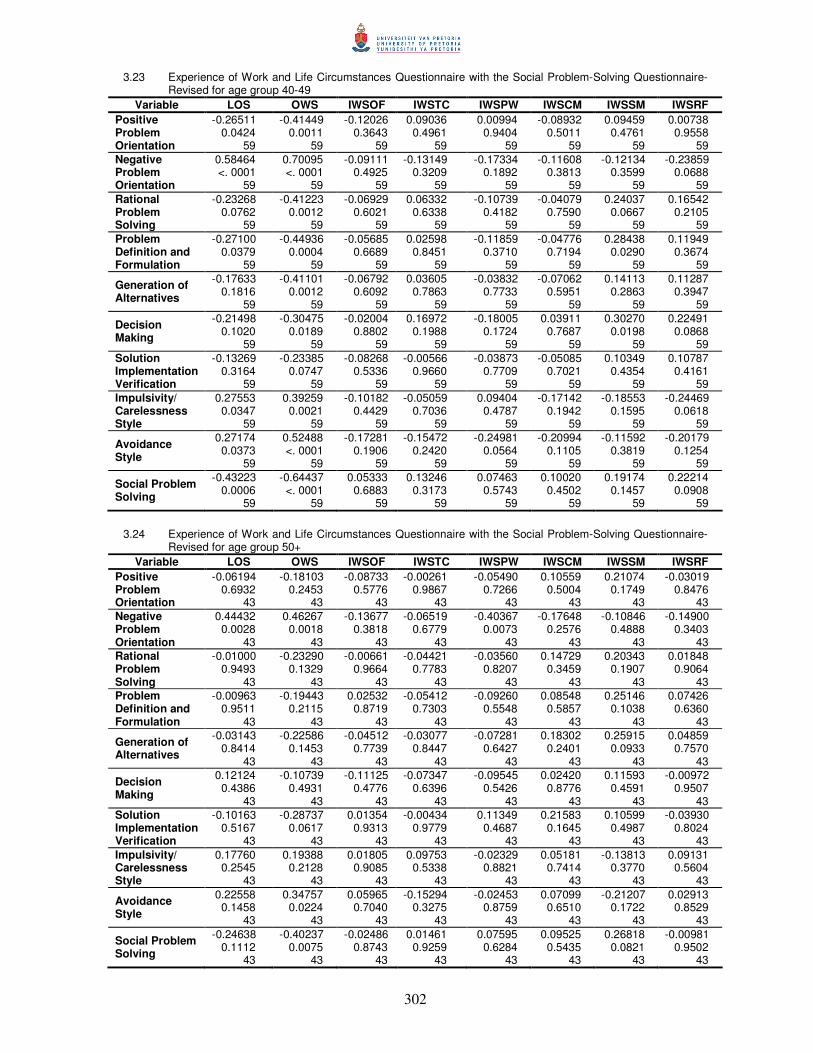
302
3.23 Experience of Work and Life Circumstances Questionnaire with the Social Problem-Solving Questionnaire-Revised for age group 40-49
Variable LOS OWS IWSOF IWSTC IWSPW IWSCM IWSSM IWSRF Positive Problem Orientation
-0.26511 0.0424 59
-0.41449 0.0011 59
-0.12026 0.3643 59
0.09036 0.4961 59
0.00994 0.9404 59
-0.08932 0.5011 59
0.09459 0.4761 59
0.00738 0.9558 59
Negative Problem Orientation
0.58464 <. 0001 59
0.70095 <. 0001 59
-0.09111 0.4925 59
-0.13149 0.3209 59
-0.17334 0.1892 59
-0.11608 0.3813 59
-0.12134 0.3599 59
-0.23859 0.0688 59
Rational Problem Solving
-0.23268 0.0762 59
-0.41223 0.0012 59
-0.06929 0.6021 59
0.06332 0.6338 59
-0.10739 0.4182 59
-0.04079 0.7590 59
0.24037 0.0667 59
0.16542 0.2105 59
Problem Definition and Formulation
-0.27100 0.0379 59
-0.44936 0.0004 59
-0.05685 0.6689 59
0.02598 0.8451 59
-0.11859 0.3710 59
-0.04776 0.7194 59
0.28438 0.0290 59
0.11949 0.3674 59
Generation of Alternatives
-0.17633 0.1816 59
-0.41101 0.0012 59
-0.06792 0.6092 59
0.03605 0.7863 59
-0.03832 0.7733 59
-0.07062 0.5951 59
0.14113 0.2863 59
0.11287 0.3947 59
Decision Making
-0.21498 0.1020 59
-0.30475 0.0189 59
-0.02004 0.8802 59
0.16972 0.1988 59
-0.18005 0.1724 59
0.03911 0.7687 59
0.30270 0.0198 59
0.22491 0.0868 59
Solution Implementation Verification
-0.13269 0.3164 59
-0.23385 0.0747 59
-0.08268 0.5336 59
-0.00566 0.9660 59
-0.03873 0.7709 59
-0.05085 0.7021 59
0.10349 0.4354 59
0.10787 0.4161 59
Impulsivity/ Carelessness Style
0.27553 0.0347 59
0.39259 0.0021 59
-0.10182 0.4429 59
-0.05059 0.7036 59
0.09404 0.4787 59
-0.17142 0.1942 59
-0.18553 0.1595 59
-0.24469 0.0618 59
Avoidance Style
0.27174 0.0373 59
0.52488 <. 0001 59
-0.17281 0.1906 59
-0.15472 0.2420 59
-0.24981 0.0564 59
-0.20994 0.1105 59
-0.11592 0.3819 59
-0.20179 0.1254 59
Social Problem Solving
-0.43223 0.0006 59
-0.64437 <. 0001 59
0.05333 0.6883 59
0.13246 0.3173 59
0.07463 0.5743 59
0.10020 0.4502 59
0.19174 0.1457 59
0.22214 0.0908 59
3.24 Experience of Work and Life Circumstances Questionnaire with the Social Problem-Solving Questionnaire-
Revised for age group 50+ Variable LOS OWS IWSOF IWSTC IWSPW IWSCM IWSSM IWSRF
Positive Problem Orientation
-0.06194 0.6932 43
-0.18103 0.2453 43
-0.08733 0.5776 43
-0.00261 0.9867 43
-0.05490 0.7266 43
0.10559 0.5004 43
0.21074 0.1749 43
-0.03019 0.8476 43
Negative Problem Orientation
0.44432 0.0028 43
0.46267 0.0018 43
-0.13677 0.3818 43
-0.06519 0.6779 43
-0.40367 0.0073 43
-0.17648 0.2576 43
-0.10846 0.4888 43
-0.14900 0.3403 43
Rational Problem Solving
-0.01000 0.9493 43
-0.23290 0.1329 43
-0.00661 0.9664 43
-0.04421 0.7783 43
-0.03560 0.8207 43
0.14729 0.3459 43
0.20343 0.1907 43
0.01848 0.9064 43
Problem Definition and Formulation
-0.00963 0.9511 43
-0.19443 0.2115 43
0.02532 0.8719 43
-0.05412 0.7303 43
-0.09260 0.5548 43
0.08548 0.5857 43
0.25146 0.1038 43
0.07426 0.6360 43
Generation of Alternatives
-0.03143 0.8414 43
-0.22586 0.1453 43
-0.04512 0.7739 43
-0.03077 0.8447 43
-0.07281 0.6427 43
0.18302 0.2401 43
0.25915 0.0933 43
0.04859 0.7570 43
Decision Making
0.12124 0.4386 43
-0.10739 0.4931 43
-0.11125 0.4776 43
-0.07347 0.6396 43
-0.09545 0.5426 43
0.02420 0.8776 43
0.11593 0.4591 43
-0.00972 0.9507 43
Solution Implementation Verification
-0.10163 0.5167 43
-0.28737 0.0617 43
0.01354 0.9313 43
-0.00434 0.9779 43
0.11349 0.4687 43
0.21583 0.1645 43
0.10599 0.4987 43
-0.03930 0.8024 43
Impulsivity/ Carelessness Style
0.17760 0.2545 43
0.19388 0.2128 43
0.01805 0.9085 43
0.09753 0.5338 43
-0.02329 0.8821 43
0.05181 0.7414 43
-0.13813 0.3770 43
0.09131 0.5604 43
Avoidance Style
0.22558 0.1458 43
0.34757 0.0224 43
0.05965 0.7040 43
-0.15294 0.3275 43
-0.02453 0.8759 43
0.07099 0.6510 43
-0.21207 0.1722 43
0.02913 0.8529 43
Social Problem Solving
-0.24638 0.1112 43
-0.40237 0.0075 43
-0.02486 0.8743 43
0.01461 0.9259 43
0.07595 0.6284 43
0.09525 0.5435 43
0.26818 0.0821 43
-0.00981 0.9502 43
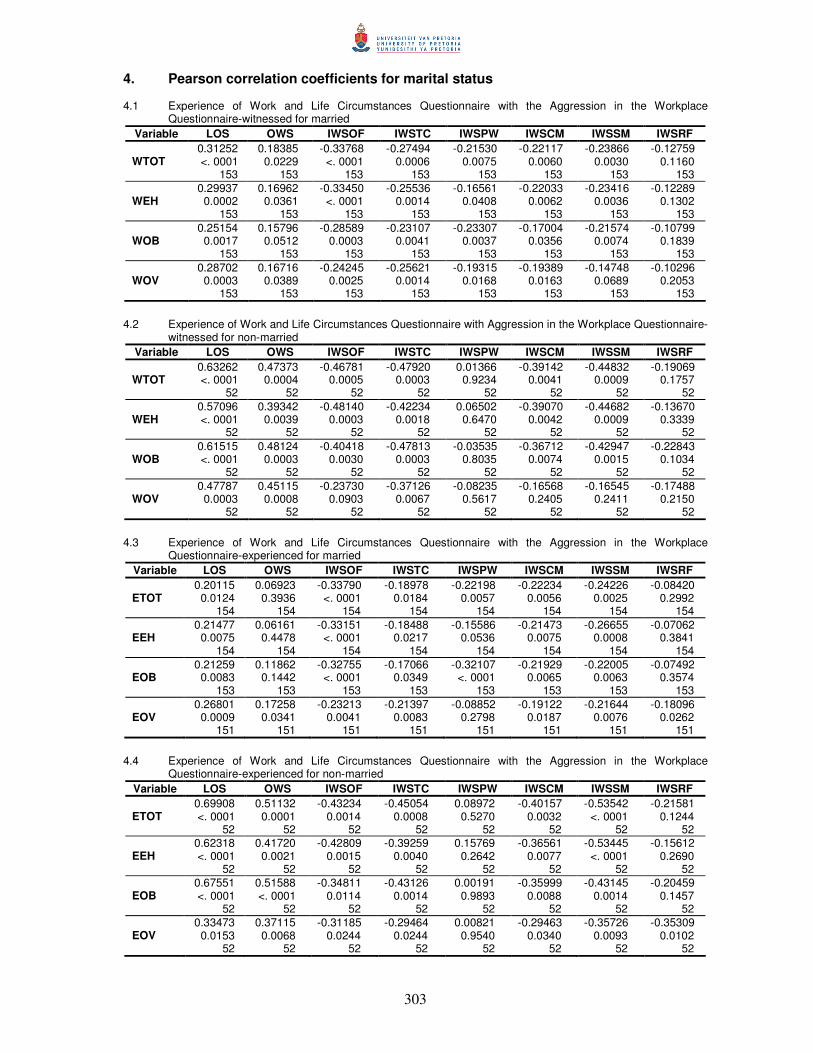
303
4. Pearson correlation coefficients for marital status 4.1 Experience of Work and Life Circumstances Questionnaire with the Aggression in the Workplace
Questionnaire-witnessed for married Variable LOS OWS IWSOF IWSTC IWSPW IWSCM IWSSM IWSRF
WTOT 0.31252 <. 0001 153
0.18385 0.0229 153
-0.33768 <. 0001 153
-0.27494 0.0006 153
-0.21530 0.0075 153
-0.22117 0.0060 153
-0.23866 0.0030 153
-0.12759 0.1160 153
WEH 0.29937 0.0002 153
0.16962 0.0361 153
-0.33450 <. 0001 153
-0.25536 0.0014 153
-0.16561 0.0408 153
-0.22033 0.0062 153
-0.23416 0.0036 153
-0.12289 0.1302 153
WOB 0.25154 0.0017 153
0.15796 0.0512 153
-0.28589 0.0003 153
-0.23107 0.0041 153
-0.23307 0.0037 153
-0.17004 0.0356 153
-0.21574 0.0074 153
-0.10799 0.1839 153
WOV 0.28702 0.0003 153
0.16716 0.0389 153
-0.24245 0.0025 153
-0.25621 0.0014 153
-0.19315 0.0168 153
-0.19389 0.0163 153
-0.14748 0.0689 153
-0.10296 0.2053 153
4.2 Experience of Work and Life Circumstances Questionnaire with Aggression in the Workplace Questionnaire-
witnessed for non-married Variable LOS OWS IWSOF IWSTC IWSPW IWSCM IWSSM IWSRF
WTOT 0.63262 <. 0001 52
0.47373 0.0004 52
-0.46781 0.0005 52
-0.47920 0.0003 52
0.01366 0.9234 52
-0.39142 0.0041 52
-0.44832 0.0009 52
-0.19069 0.1757 52
WEH 0.57096 <. 0001 52
0.39342 0.0039 52
-0.48140 0.0003 52
-0.42234 0.0018 52
0.06502 0.6470 52
-0.39070 0.0042 52
-0.44682 0.0009 52
-0.13670 0.3339 52
WOB 0.61515 <. 0001 52
0.48124 0.0003 52
-0.40418 0.0030 52
-0.47813 0.0003 52
-0.03535 0.8035 52
-0.36712 0.0074 52
-0.42947 0.0015 52
-0.22843 0.1034 52
WOV 0.47787 0.0003 52
0.45115 0.0008 52
-0.23730 0.0903 52
-0.37126 0.0067 52
-0.08235 0.5617 52
-0.16568 0.2405 52
-0.16545 0.2411 52
-0.17488 0.2150 52
4.3 Experience of Work and Life Circumstances Questionnaire with the Aggression in the Workplace
Questionnaire-experienced for married Variable LOS OWS IWSOF IWSTC IWSPW IWSCM IWSSM IWSRF
ETOT 0.20115 0.0124 154
0.06923 0.3936 154
-0.33790 <. 0001 154
-0.18978 0.0184 154
-0.22198 0.0057 154
-0.22234 0.0056 154
-0.24226 0.0025 154
-0.08420 0.2992 154
EEH 0.21477 0.0075 154
0.06161 0.4478 154
-0.33151 <. 0001 154
-0.18488 0.0217 154
-0.15586 0.0536 154
-0.21473 0.0075 154
-0.26655 0.0008 154
-0.07062 0.3841 154
EOB 0.21259 0.0083 153
0.11862 0.1442 153
-0.32755 <. 0001 153
-0.17066 0.0349 153
-0.32107 <. 0001 153
-0.21929 0.0065 153
-0.22005 0.0063 153
-0.07492 0.3574 153
EOV 0.26801 0.0009 151
0.17258 0.0341 151
-0.23213 0.0041 151
-0.21397 0.0083 151
-0.08852 0.2798 151
-0.19122 0.0187 151
-0.21644 0.0076 151
-0.18096 0.0262 151
4.4 Experience of Work and Life Circumstances Questionnaire with the Aggression in the Workplace
Questionnaire-experienced for non-married Variable LOS OWS IWSOF IWSTC IWSPW IWSCM IWSSM IWSRF
ETOT 0.69908 <. 0001 52
0.51132 0.0001 52
-0.43234 0.0014 52
-0.45054 0.0008 52
0.08972 0.5270 52
-0.40157 0.0032 52
-0.53542 <. 0001 52
-0.21581 0.1244 52
EEH 0.62318 <. 0001 52
0.41720 0.0021 52
-0.42809 0.0015 52
-0.39259 0.0040 52
0.15769 0.2642 52
-0.36561 0.0077 52
-0.53445 <. 0001 52
-0.15612 0.2690 52
EOB 0.67551 <. 0001 52
0.51588 <. 0001 52
-0.34811 0.0114 52
-0.43126 0.0014 52
0.00191 0.9893 52
-0.35999 0.0088 52
-0.43145 0.0014 52
-0.20459 0.1457 52
EOV 0.33473 0.0153 52
0.37115 0.0068 52
-0.31185 0.0244 52
-0.29464 0.0244 52
0.00821 0.9540 52
-0.29463 0.0340 52
-0.35726 0.0093 52
-0.35309 0.0102 52
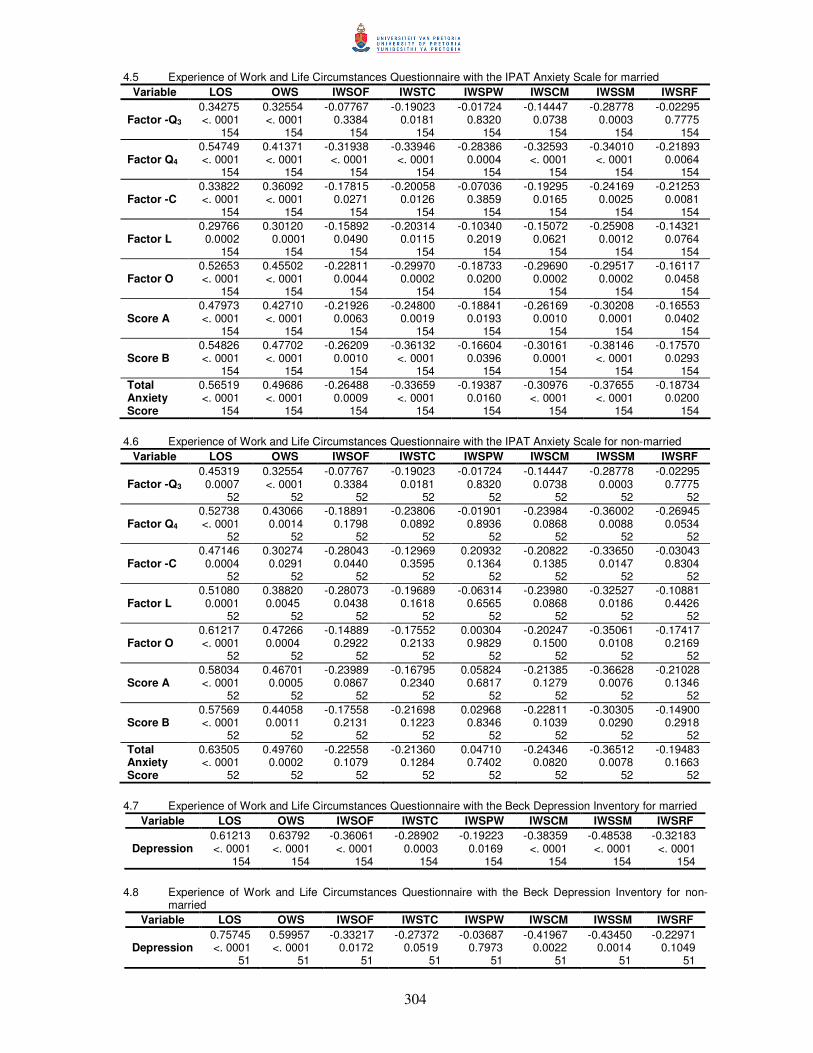
304
4.5 Experience of Work and Life Circumstances Questionnaire with the IPAT Anxiety Scale for married Variable LOS OWS IWSOF IWSTC IWSPW IWSCM IWSSM IWSRF
Factor -Q3 0.34275 <. 0001 154
0.32554 <. 0001 154
-0.07767 0.3384 154
-0.19023 0.0181 154
-0.01724 0.8320 154
-0.14447 0.0738 154
-0.28778 0.0003 154
-0.02295 0.7775 154
Factor Q4 0.54749 <. 0001 154
0.41371 <. 0001 154
-0.31938 <. 0001 154
-0.33946 <. 0001 154
-0.28386 0.0004 154
-0.32593 <. 0001 154
-0.34010 <. 0001 154
-0.21893 0.0064 154
Factor -C 0.33822 <. 0001 154
0.36092 <. 0001 154
-0.17815 0.0271 154
-0.20058 0.0126 154
-0.07036 0.3859 154
-0.19295 0.0165 154
-0.24169 0.0025 154
-0.21253 0.0081 154
Factor L 0.29766 0.0002 154
0.30120 0.0001 154
-0.15892 0.0490 154
-0.20314 0.0115 154
-0.10340 0.2019 154
-0.15072 0.0621 154
-0.25908 0.0012 154
-0.14321 0.0764 154
Factor O 0.52653 <. 0001 154
0.45502 <. 0001 154
-0.22811 0.0044 154
-0.29970 0.0002 154
-0.18733 0.0200 154
-0.29690 0.0002 154
-0.29517 0.0002 154
-0.16117 0.0458 154
Score A 0.47973 <. 0001 154
0.42710 <. 0001 154
-0.21926 0.0063 154
-0.24800 0.0019 154
-0.18841 0.0193 154
-0.26169 0.0010 154
-0.30208 0.0001 154
-0.16553 0.0402 154
Score B 0.54826 <. 0001 154
0.47702 <. 0001 154
-0.26209 0.0010 154
-0.36132 <. 0001 154
-0.16604 0.0396 154
-0.30161 0.0001 154
-0.38146 <. 0001 154
-0.17570 0.0293 154
Total Anxiety Score
0.56519 <. 0001 154
0.49686 <. 0001 154
-0.26488 0.0009 154
-0.33659 <. 0001 154
-0.19387 0.0160 154
-0.30976 <. 0001 154
-0.37655 <. 0001 154
-0.18734 0.0200 154
4.6 Experience of Work and Life Circumstances Questionnaire with the IPAT Anxiety Scale for non-married
Variable LOS OWS IWSOF IWSTC IWSPW IWSCM IWSSM IWSRF
Factor -Q3 0.45319 0.0007 52
0.32554 <. 0001 52
-0.07767 0.3384 52
-0.19023 0.0181 52
-0.01724 0.8320 52
-0.14447 0.0738 52
-0.28778 0.0003 52
-0.02295 0.7775 52
Factor Q4 0.52738 <. 0001 52
0.43066 0.0014 52
-0.18891 0.1798 52
-0.23806 0.0892 52
-0.01901 0.8936 52
-0.23984 0.0868 52
-0.36002 0.0088 52
-0.26945 0.0534 52
Factor -C 0.47146 0.0004 52
0.30274 0.0291 52
-0.28043 0.0440 52
-0.12969 0.3595 52
0.20932 0.1364 52
-0.20822 0.1385 52
-0.33650 0.0147 52
-0.03043 0.8304 52
Factor L 0.51080 0.0001 52
0.38820 0.0045 52
-0.28073 0.0438 52
-0.19689 0.1618 52
-0.06314 0.6565 52
-0.23980 0.0868 52
-0.32527 0.0186 52
-0.10881 0.4426 52
Factor O 0.61217 <. 0001 52
0.47266 0.0004 52
-0.14889 0.2922 52
-0.17552 0.2133 52
0.00304 0.9829 52
-0.20247 0.1500 52
-0.35061 0.0108 52
-0.17417 0.2169 52
Score A 0.58034 <. 0001 52
0.46701 0.0005 52
-0.23989 0.0867 52
-0.16795 0.2340 52
0.05824 0.6817 52
-0.21385 0.1279 52
-0.36628 0.0076 52
-0.21028 0.1346 52
Score B 0.57569 <. 0001 52
0.44058 0.0011 52
-0.17558 0.2131 52
-0.21698 0.1223 52
0.02968 0.8346 52
-0.22811 0.1039 52
-0.30305 0.0290 52
-0.14900 0.2918 52
Total Anxiety Score
0.63505 <. 0001 52
0.49760 0.0002 52
-0.22558 0.1079 52
-0.21360 0.1284 52
0.04710 0.7402 52
-0.24346 0.0820 52
-0.36512 0.0078 52
-0.19483 0.1663 52
4.7 Experience of Work and Life Circumstances Questionnaire with the Beck Depression Inventory for married
Variable LOS OWS IWSOF IWSTC IWSPW IWSCM IWSSM IWSRF
Depression 0.61213 <. 0001 154
0.63792 <. 0001 154
-0.36061 <. 0001 154
-0.28902 0.0003 154
-0.19223 0.0169 154
-0.38359 <. 0001 154
-0.48538 <. 0001 154
-0.32183 <. 0001 154
4.8 Experience of Work and Life Circumstances Questionnaire with the Beck Depression Inventory for non-
married Variable LOS OWS IWSOF IWSTC IWSPW IWSCM IWSSM IWSRF
Depression 0.75745 <. 0001 51
0.59957 <. 0001 51
-0.33217 0.0172 51
-0.27372 0.0519 51
-0.03687 0.7973 51
-0.41967 0.0022 51
-0.43450 0.0014 51
-0.22971 0.1049 51

305
4.9 Experience of Work and Life Circumstances Questionnaire with the Penn State Worry Questionnaire for married
Variable LOS OWS IWSOF IWSTC IWSPW IWSCM IWSSM IWSRF
Worry 0.42523 <. 0001 152
0.37079 <. 0001 152
-0.08132 0.3192 152
-0.25338 0.0016 152
-0.09656 0.2366 152
-0.09770 0.2311 152
-0.19730 0.0148 152
-0.08308 0.3089 152
4.10 Experience of Work and Life Circumstances Questionnaire with the Penn State Worry Questionnaire for
non-married Variable LOS OWS IWSOF IWSTC IWSPW IWSCM IWSSM IWSRF
Worry 0.69491 <. 0001 51
0.43737 0.0013 51
-0.21757 0.1251 51
-0.28384 0.0435 51
-0.24317 0.0855 51
-0.29276 0.0371 51
-0.29442 0.0360 51
-0.23130 0.1024 51
4.11 Experience of Work and Life Circumstances Questionnaire with the Social Problem-Solving Inventory-
Revised for married Variable LOS OWS IWSOF IWSTC IWSPW IWSCM IWSSM IWSRF
Positive Problem Orientation
-0.17553 0.0300 153
-0.28812 0.0003 153
0.07050 0.3865 153
0.21812 0.0068 153
0.14034 0.0836 153
0.21763 0.0069 153
0.26631 0.0009 153
-0.00518 0.9494 153
Negative Problem Orientation
0.46439 <. 0001 154
0.47564 <. 0001 154
-0.26213 0.0010 154
-0.24632 0.0021 154
-0.26391 0.0009 154
-0.29773 0.0002 154
-0.24352 0.0023 154
-0.18735 0.0200 154
Rational Problem Solving
-0.11031 0.1746 153
-0.27772 0.0005 153
0.06426 0.4300 153
0.12010 0.1392 153
0.07788 0.3387 153
0.15791 0.0512 153
0.23794 0.0031 153
0.02235 0.7839 153
Problem Definition and Formulation
-0.11183 0.1688 153
-0.28652 0.0003 153
0.07603 0.3503 153
0.12170 0.1340 153
0.04984 0.5407 153
0.13465 0.0970 153
0.24236 0.0025 153
0.03668 0.6526 153
Generation of Alternatives
-0.11146 0.1702 153
-0.24041 0.0028 153
0.04720 0.5623 153
0.12258 0.1312 153
0.06071 0.4560 153
0.16728 0.0388 153
0.20288 0.0119 153
0.00083 0.9918 153
Decision Making
-0.07955 0.3283 153
-0.22270 0.0057 153
0.02651 0.7449 153
0.12115 0.1358 153
0.02503 0.7588 153
0.11097 0.1721 153
0.23881 0.0030 153
0.04318 0.5961 153
Solution Implementation Verification
-0.09430 0.2463 153
-0.25092 0.0018 153
0.07867 0.3337 153
0.07143 0.3803 153
0.13793 0.0891 153
0.15411 0.0572 153
0.17893 0.0269 153
0.00278 0.9728 153
Impulsivity/ Carelessness Style
0.23738 0.0031 153
0.25860 0.0012 153
-0.13244 0.1027 153
-0.05677 0.4858 153
0.01135 0.8893 153
-0.13684 0.0917 153
-0.21308 0.0082 153
-0.05963 0.4640 153
Avoidance Style
0.20818 0.0098 153
0.29302 0.0002 153
-0.19355 0.0165 153
-0.20526 0.0109 153
-0.14779 0.0683 153
-0.22390 0.0054 153
-0.16530 0.0412 153
-0.11815 0.1458 153
Social Problem Solving
-0.29806 0.0002 154
-0.38432 <. 0001 154
0.18412 0.0223 154
0.27978 0.0004 154
0.16458 0.0414 154
0.29347 0.0002 154
0.30946 <. 0001 154
0.13064 0.1063 154

306
4.12 Experience of Work and Life Circumstances Questionnaire with the Social Problem-Solving Inventory-Revised for non-married
Variable LOS OWS IWSOF IWSTC IWSPW IWSCM IWSSM IWSRF Positive Problem Orientation
-0.29089 0.0364 52
-0.34716 0.0117 52
-0.11374 0.4220 52
0.14751 0.2967 52
0.11029 0.4363 52
-0.03472 0.8070 52
0.02727 0.8478 52
-0.05894 0.6781 52
Negative Problem Orientation
0.54454 <. 0001 52
0.49699 0.0002 52
0.00375 0.9789 52
-0.09647 0.4963 52
-0.01791 0.8997 52
-0.13991 0.3225 52
-0.14494 0.3053 52
0.05902 0.6777 52
Rational Problem Solving
-0.04359 0.7590 52
-0.11979 0.3976 52
-0.14074 0.3197 52
-0.05076 0.7208 52
0.06256 0.6595 52
-0.11365 0.4224 52
-0.28388 0.0414 52
-0.06854 0.6292 52
Problem Definition and Formulation
-0.08531 0.5476 52
-0.16327 0.2475 52
-0.09935 0.4835 52
-0.07268 0.6086 52
0.07713 0.5868 52
-0.11054 0.4353 52
-0.16090 0.2545 52
-0.02654 0.8518 52
Generation of Alternatives
0.01138 0.9362 52
-0.14930 0.2908 52
-0.23767 0.0898 52
-0.10977 0.4386 52
0.06042 0.6705 52
-0.23458 0.0942 52
-0.32003 0.0207 52
-0.09703 0.4938 52
Decision Making
0.00570 0.9680 52
-0.01881 0.8947 52
-0.07678 0.5885 52
-0.01193 0.9331 52
0.02939 0.8361 52
-0.02355 0.8684 52
-0.26876 0.0540 52
-0.07987 0.5735 52
Solution Implementation Verification
-0.08384 0.5545 52
-0.08844 0.5330 52
-0.06384 0.6530 52
0.00963 0.9460 52
0.05029 0.7233 52
-0.02652 0.8519 52
-0.19817 0.1590 52
-0.02565 0.8568 52
Impulsivity/ Carelessness Style
0.20959 0.1359 52
0.07570 0.5938 52
0.14070 0.3198 52
0.14199 0.3153 52
0.02330 0.8698 52
0.02317 0.8705 52
0.21521 0.1255 52
0.17822 0.2062 52
Avoidance Style
0.44178 0.0010 52
0.47834 0.0003 52
0.07771 0.5840 52
-0.13481 0.3407 52
-0.03285 0.8172 52
-0.09241 0.5147 52
-0.16943 0.2298 52
0.00255 0.9857 52
Social Problem Solving
-0.42607 0.0016 52
-0.42205 0.0018 52
-0.12612 0.3730 52
0.05730 0.6866 52
0.05467 0.7003 52
0.02195 0.8772 52
-0.02928 0.8368 52
-0.09769 0.4908 52
5. Pearson correlation coefficients for type of organization grouping 5.1 Experience of Work and Life Circumstances Questionnaire with Aggression in the Workplace Questionnaire-
witnessed for financial organizations Variable LOS OWS IWSOF IWSTC IWSPW IWSCM IWSSM IWSRF
WTOT 0.24961 0.0544 60
0.12283 0.3498 60
-0.41533 0.0010 60
-0.40643 0.0013 60
-0.32719 0.0107 60
-0.28701 0.0262 60
-0.24935 0.0547 60
-0.34245 0.0074 60
WEH 0.25415 0.0500 60
0.09589 0.4661 60
-0.44794 0.0003 60
-0.32369 0.0116 60
-0.24377 0.0605 60
-0.32308 0.0118 60
-0.17668 0.1769 60
-0.32989 0.0101 60
WOB 0.12316 0.3485 60
0.06129 0.6418 60
-0.22462 0.0844 60
-0.32914 0.0102 60
-0.26534 0.0405 60
-0.10404 0.4289 60
-0.22665 0.0816 60
-0.21369 0.1011 60
WOV 0.31592 0.0139 60
0.27112 0.0361 60
-0.37061 0.0036 60
-0.52394 <. 0001 60
-0.48847 <. 0001 60
-0.34232 0.0074 60
-0.34175 0.0075 60
-0.38619 0.0023 60
5.2 Experience of Work and Life Circumstances Questionnaire with Aggression in the Workplace Questionnaire-
witnessed for production/ services organizations Variable LOS OWS IWSOF IWSTC IWSPW IWSCM IWSSM IWSRF
WTOT 0.40613 0.0038 49
0.26568 0.0650 49
-0.38052 0.0070 49
-0.29413 0.0402 49
-0.06234 0.6704 49
-0.23696 0.1011 49
-0.27916 0.0521 49
0.04197 0.7746 49
WEH 0.35336 0.0128 49
0.23545 0.1034 49
-0.37728 0.0075 49
-0.28140 0.0501 49
-0.06842 0.6404 49
-0.24279 0.0928 49
-0.29470 0.0398 49
0.07597 0.6039 49
WOB 0.43873 0.0016 49
0.33187 0.0198 49
-0.40738 0.0037 49
-0.27884 0.0524 49
-0.06264 0.6689 49
-0.25403 0.0782 49
-0.30335 0.0341 49
-0.00682 0.9629 49
WOV 0.31894 0.0255 49
0.10662 0.4659 49
-0.15920 0.2746 49
-0.22665 0.1173 49
-0.01316 0.9285 49
-0.07355 0.6155 49
-0.05099 0.7279 49
0.01030 0.9440 49
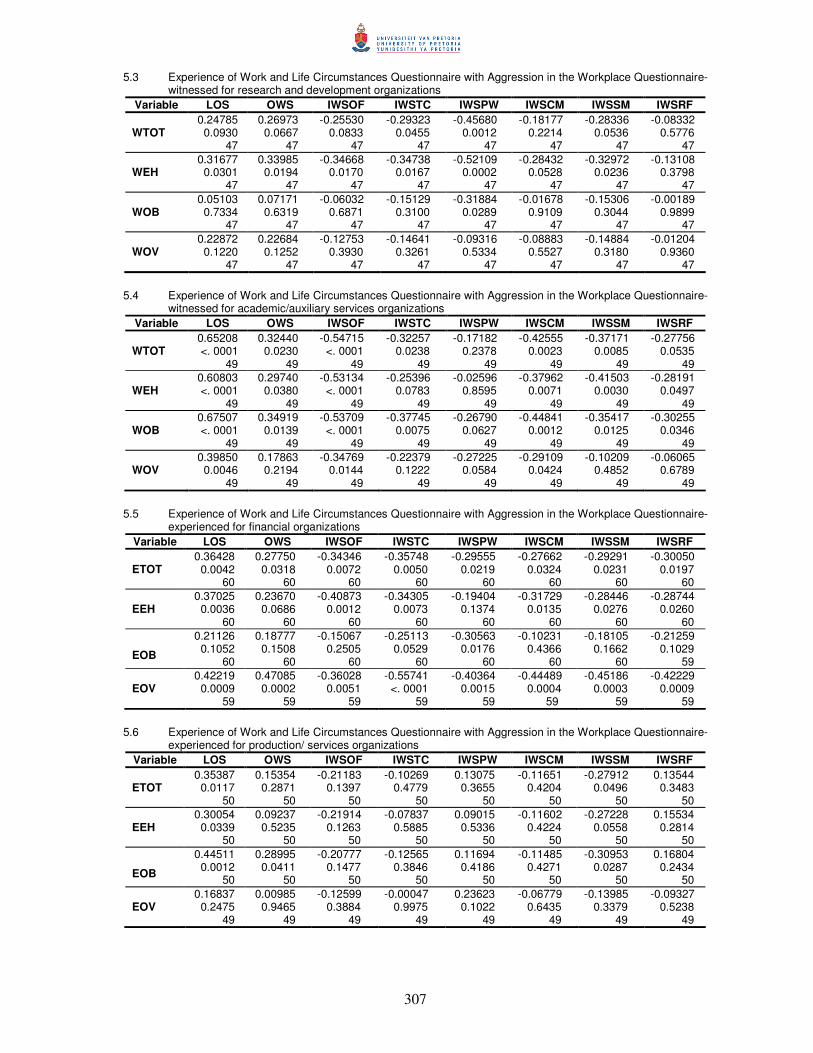
307
5.3 Experience of Work and Life Circumstances Questionnaire with Aggression in the Workplace Questionnaire-witnessed for research and development organizations
Variable LOS OWS IWSOF IWSTC IWSPW IWSCM IWSSM IWSRF
WTOT 0.24785 0.0930 47
0.26973 0.0667 47
-0.25530 0.0833 47
-0.29323 0.0455 47
-0.45680 0.0012 47
-0.18177 0.2214 47
-0.28336 0.0536 47
-0.08332 0.5776 47
WEH 0.31677 0.0301 47
0.33985 0.0194 47
-0.34668 0.0170 47
-0.34738 0.0167 47
-0.52109 0.0002 47
-0.28432 0.0528 47
-0.32972 0.0236 47
-0.13108 0.3798 47
WOB 0.05103 0.7334 47
0.07171 0.6319 47
-0.06032 0.6871 47
-0.15129 0.3100 47
-0.31884 0.0289 47
-0.01678 0.9109 47
-0.15306 0.3044 47
-0.00189 0.9899 47
WOV 0.22872 0.1220 47
0.22684 0.1252 47
-0.12753 0.3930 47
-0.14641 0.3261 47
-0.09316 0.5334 47
-0.08883 0.5527 47
-0.14884 0.3180 47
-0.01204 0.9360 47
5.4 Experience of Work and Life Circumstances Questionnaire with Aggression in the Workplace Questionnaire-
witnessed for academic/auxiliary services organizations Variable LOS OWS IWSOF IWSTC IWSPW IWSCM IWSSM IWSRF
WTOT 0.65208 <. 0001 49
0.32440 0.0230 49
-0.54715 <. 0001 49
-0.32257 0.0238 49
-0.17182 0.2378 49
-0.42555 0.0023 49
-0.37171 0.0085 49
-0.27756 0.0535 49
WEH 0.60803 <. 0001 49
0.29740 0.0380 49
-0.53134 <. 0001 49
-0.25396 0.0783 49
-0.02596 0.8595 49
-0.37962 0.0071 49
-0.41503 0.0030 49
-0.28191 0.0497 49
WOB 0.67507 <. 0001 49
0.34919 0.0139 49
-0.53709 <. 0001 49
-0.37745 0.0075 49
-0.26790 0.0627 49
-0.44841 0.0012 49
-0.35417 0.0125 49
-0.30255 0.0346 49
WOV 0.39850 0.0046 49
0.17863 0.2194 49
-0.34769 0.0144 49
-0.22379 0.1222 49
-0.27225 0.0584 49
-0.29109 0.0424 49
-0.10209 0.4852 49
-0.06065 0.6789 49
5.5 Experience of Work and Life Circumstances Questionnaire with Aggression in the Workplace Questionnaire-
experienced for financial organizations Variable LOS OWS IWSOF IWSTC IWSPW IWSCM IWSSM IWSRF
ETOT 0.36428 0.0042 60
0.27750 0.0318 60
-0.34346 0.0072 60
-0.35748 0.0050 60
-0.29555 0.0219 60
-0.27662 0.0324 60
-0.29291 0.0231 60
-0.30050 0.0197 60
EEH 0.37025 0.0036 60
0.23670 0.0686 60
-0.40873 0.0012 60
-0.34305 0.0073 60
-0.19404 0.1374 60
-0.31729 0.0135 60
-0.28446 0.0276 60
-0.28744 0.0260 60
EOB
0.21126 0.1052 60
0.18777 0.1508 60
-0.15067 0.2505 60
-0.25113 0.0529 60
-0.30563 0.0176 60
-0.10231 0.4366 60
-0.18105 0.1662 60
-0.21259 0.1029 59
EOV 0.42219 0.0009 59
0.47085 0.0002 59
-0.36028 0.0051 59
-0.55741 <. 0001 59
-0.40364 0.0015 59
-0.44489 0.0004 59
-0.45186 0.0003 59
-0.42229 0.0009 59
5.6 Experience of Work and Life Circumstances Questionnaire with Aggression in the Workplace Questionnaire-
experienced for production/ services organizations Variable LOS OWS IWSOF IWSTC IWSPW IWSCM IWSSM IWSRF
ETOT 0.35387 0.0117 50
0.15354 0.2871 50
-0.21183 0.1397 50
-0.10269 0.4779 50
0.13075 0.3655 50
-0.11651 0.4204 50
-0.27912 0.0496 50
0.13544 0.3483 50
EEH 0.30054 0.0339 50
0.09237 0.5235 50
-0.21914 0.1263 50
-0.07837 0.5885 50
0.09015 0.5336 50
-0.11602 0.4224 50
-0.27228 0.0558 50
0.15534 0.2814 50
EOB
0.44511 0.0012 50
0.28995 0.0411 50
-0.20777 0.1477 50
-0.12565 0.3846 50
0.11694 0.4186 50
-0.11485 0.4271 50
-0.30953 0.0287 50
0.16804 0.2434 50
EOV 0.16837 0.2475 49
0.00985 0.9465 49
-0.12599 0.3884 49
-0.00047 0.9975 49
0.23623 0.1022 49
-0.06779 0.6435 49
-0.13985 0.3379 49
-0.09327 0.5238 49
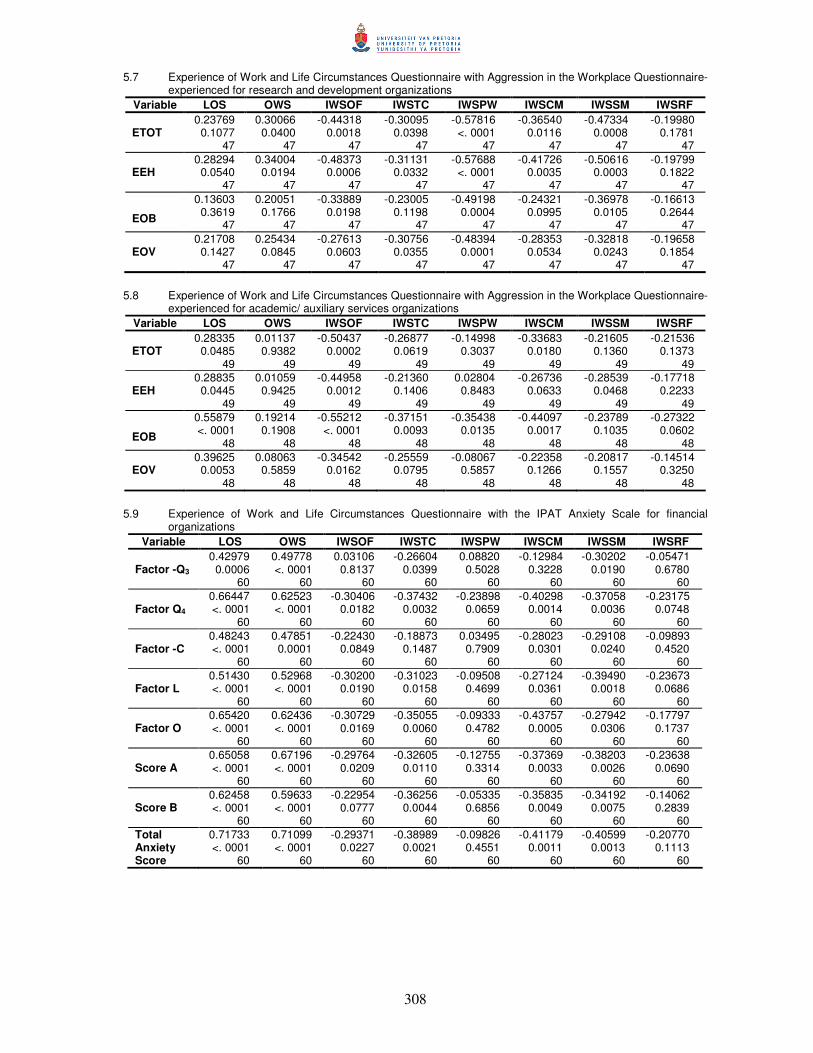
308
5.7 Experience of Work and Life Circumstances Questionnaire with Aggression in the Workplace Questionnaire-experienced for research and development organizations
Variable LOS OWS IWSOF IWSTC IWSPW IWSCM IWSSM IWSRF
ETOT 0.23769 0.1077 47
0.30066 0.0400 47
-0.44318 0.0018 47
-0.30095 0.0398 47
-0.57816 <. 0001 47
-0.36540 0.0116 47
-0.47334 0.0008 47
-0.19980 0.1781 47
EEH 0.28294 0.0540 47
0.34004 0.0194 47
-0.48373 0.0006 47
-0.31131 0.0332 47
-0.57688 <. 0001 47
-0.41726 0.0035 47
-0.50616 0.0003 47
-0.19799 0.1822 47
EOB
0.13603 0.3619 47
0.20051 0.1766 47
-0.33889 0.0198 47
-0.23005 0.1198 47
-0.49198 0.0004 47
-0.24321 0.0995 47
-0.36978 0.0105 47
-0.16613 0.2644 47
EOV 0.21708 0.1427 47
0.25434 0.0845 47
-0.27613 0.0603 47
-0.30756 0.0355 47
-0.48394 0.0001 47
-0.28353 0.0534 47
-0.32818 0.0243 47
-0.19658 0.1854 47
5.8 Experience of Work and Life Circumstances Questionnaire with Aggression in the Workplace Questionnaire-
experienced for academic/ auxiliary services organizations Variable LOS OWS IWSOF IWSTC IWSPW IWSCM IWSSM IWSRF
ETOT 0.28335 0.0485 49
0.01137 0.9382 49
-0.50437 0.0002 49
-0.26877 0.0619 49
-0.14998 0.3037 49
-0.33683 0.0180 49
-0.21605 0.1360 49
-0.21536 0.1373 49
EEH 0.28835 0.0445 49
0.01059 0.9425 49
-0.44958 0.0012 49
-0.21360 0.1406 49
0.02804 0.8483 49
-0.26736 0.0633 49
-0.28539 0.0468 49
-0.17718 0.2233 49
EOB
0.55879 <. 0001 48
0.19214 0.1908 48
-0.55212 <. 0001 48
-0.37151 0.0093 48
-0.35438 0.0135 48
-0.44097 0.0017 48
-0.23789 0.1035 48
-0.27322 0.0602 48
EOV 0.39625 0.0053 48
0.08063 0.5859 48
-0.34542 0.0162 48
-0.25559 0.0795 48
-0.08067 0.5857 48
-0.22358 0.1266 48
-0.20817 0.1557 48
-0.14514 0.3250 48
5.9 Experience of Work and Life Circumstances Questionnaire with the IPAT Anxiety Scale for financial
organizations Variable LOS OWS IWSOF IWSTC IWSPW IWSCM IWSSM IWSRF
Factor -Q3 0.42979 0.0006 60
0.49778 <. 0001 60
0.03106 0.8137 60
-0.26604 0.0399 60
0.08820 0.5028 60
-0.12984 0.3228 60
-0.30202 0.0190 60
-0.05471 0.6780 60
Factor Q4 0.66447 <. 0001 60
0.62523 <. 0001 60
-0.30406 0.0182 60
-0.37432 0.0032 60
-0.23898 0.0659 60
-0.40298 0.0014 60
-0.37058 0.0036 60
-0.23175 0.0748 60
Factor -C 0.48243 <. 0001 60
0.47851 0.0001 60
-0.22430 0.0849 60
-0.18873 0.1487 60
0.03495 0.7909 60
-0.28023 0.0301 60
-0.29108 0.0240 60
-0.09893 0.4520 60
Factor L 0.51430 <. 0001 60
0.52968 <. 0001 60
-0.30200 0.0190 60
-0.31023 0.0158 60
-0.09508 0.4699 60
-0.27124 0.0361 60
-0.39490 0.0018 60
-0.23673 0.0686 60
Factor O 0.65420 <. 0001 60
0.62436 <. 0001 60
-0.30729 0.0169 60
-0.35055 0.0060 60
-0.09333 0.4782 60
-0.43757 0.0005 60
-0.27942 0.0306 60
-0.17797 0.1737 60
Score A 0.65058 <. 0001 60
0.67196 <. 0001 60
-0.29764 0.0209 60
-0.32605 0.0110 60
-0.12755 0.3314 60
-0.37369 0.0033 60
-0.38203 0.0026 60
-0.23638 0.0690 60
Score B 0.62458 <. 0001 60
0.59633 <. 0001 60
-0.22954 0.0777 60
-0.36256 0.0044 60
-0.05335 0.6856 60
-0.35835 0.0049 60
-0.34192 0.0075 60
-0.14062 0.2839 60
Total Anxiety Score
0.71733 <. 0001 60
0.71099 <. 0001 60
-0.29371 0.0227 60
-0.38989 0.0021 60
-0.09826 0.4551 60
-0.41179 0.0011 60
-0.40599 0.0013 60
-0.20770 0.1113 60
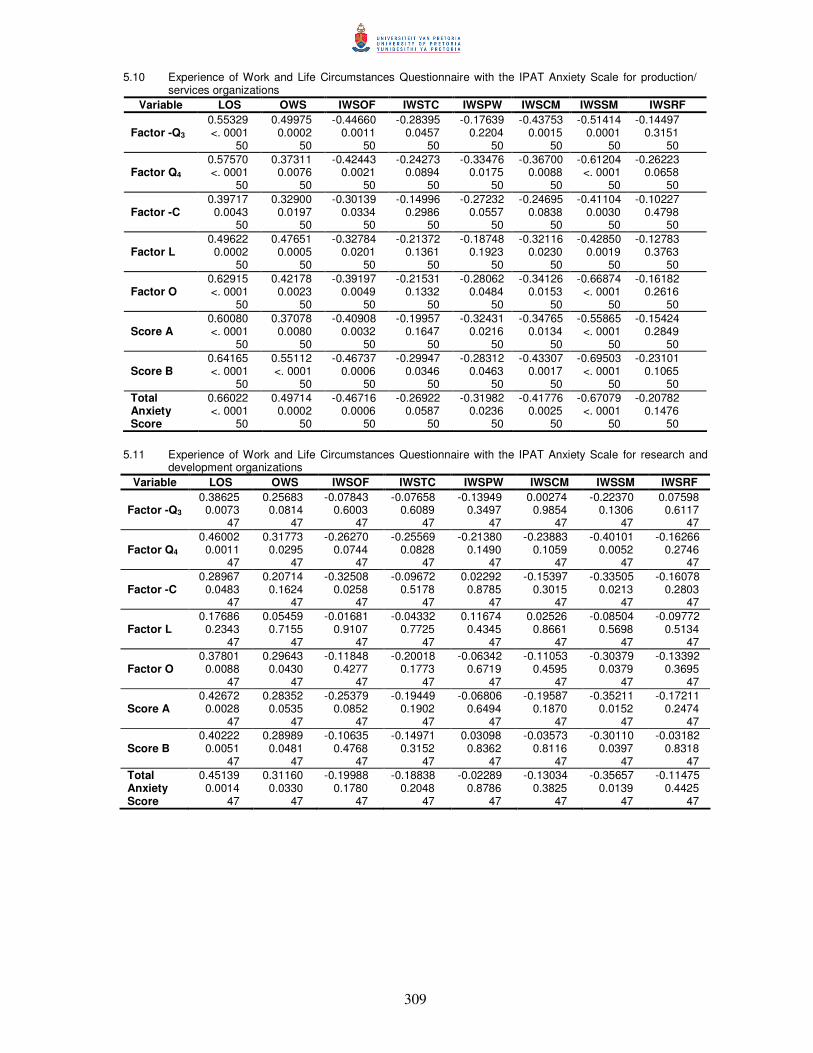
309
5.10 Experience of Work and Life Circumstances Questionnaire with the IPAT Anxiety Scale for production/ services organizations
Variable LOS OWS IWSOF IWSTC IWSPW IWSCM IWSSM IWSRF
Factor -Q3 0.55329 <. 0001 50
0.49975 0.0002 50
-0.44660 0.0011 50
-0.28395 0.0457 50
-0.17639 0.2204 50
-0.43753 0.0015 50
-0.51414 0.0001 50
-0.14497 0.3151 50
Factor Q4 0.57570 <. 0001 50
0.37311 0.0076 50
-0.42443 0.0021 50
-0.24273 0.0894 50
-0.33476 0.0175 50
-0.36700 0.0088 50
-0.61204 <. 0001 50
-0.26223 0.0658 50
Factor -C 0.39717 0.0043 50
0.32900 0.0197 50
-0.30139 0.0334 50
-0.14996 0.2986 50
-0.27232 0.0557 50
-0.24695 0.0838 50
-0.41104 0.0030 50
-0.10227 0.4798 50
Factor L 0.49622 0.0002 50
0.47651 0.0005 50
-0.32784 0.0201 50
-0.21372 0.1361 50
-0.18748 0.1923 50
-0.32116 0.0230 50
-0.42850 0.0019 50
-0.12783 0.3763 50
Factor O 0.62915 <. 0001 50
0.42178 0.0023 50
-0.39197 0.0049 50
-0.21531 0.1332 50
-0.28062 0.0484 50
-0.34126 0.0153 50
-0.66874 <. 0001 50
-0.16182 0.2616 50
Score A 0.60080 <. 0001 50
0.37078 0.0080 50
-0.40908 0.0032 50
-0.19957 0.1647 50
-0.32431 0.0216 50
-0.34765 0.0134 50
-0.55865 <. 0001 50
-0.15424 0.2849 50
Score B 0.64165 <. 0001 50
0.55112 <. 0001 50
-0.46737 0.0006 50
-0.29947 0.0346 50
-0.28312 0.0463 50
-0.43307 0.0017 50
-0.69503 <. 0001 50
-0.23101 0.1065 50
Total Anxiety Score
0.66022 <. 0001 50
0.49714 0.0002 50
-0.46716 0.0006 50
-0.26922 0.0587 50
-0.31982 0.0236 50
-0.41776 0.0025 50
-0.67079 <. 0001 50
-0.20782 0.1476 50
5.11 Experience of Work and Life Circumstances Questionnaire with the IPAT Anxiety Scale for research and
development organizations Variable LOS OWS IWSOF IWSTC IWSPW IWSCM IWSSM IWSRF
Factor -Q3 0.38625 0.0073 47
0.25683 0.0814 47
-0.07843 0.6003 47
-0.07658 0.6089 47
-0.13949 0.3497 47
0.00274 0.9854 47
-0.22370 0.1306 47
0.07598 0.6117 47
Factor Q4 0.46002 0.0011 47
0.31773 0.0295 47
-0.26270 0.0744 47
-0.25569 0.0828 47
-0.21380 0.1490 47
-0.23883 0.1059 47
-0.40101 0.0052 47
-0.16266 0.2746 47
Factor -C 0.28967 0.0483 47
0.20714 0.1624 47
-0.32508 0.0258 47
-0.09672 0.5178 47
0.02292 0.8785 47
-0.15397 0.3015 47
-0.33505 0.0213 47
-0.16078 0.2803 47
Factor L 0.17686 0.2343 47
0.05459 0.7155 47
-0.01681 0.9107 47
-0.04332 0.7725 47
0.11674 0.4345 47
0.02526 0.8661 47
-0.08504 0.5698 47
-0.09772 0.5134 47
Factor O 0.37801 0.0088 47
0.29643 0.0430 47
-0.11848 0.4277 47
-0.20018 0.1773 47
-0.06342 0.6719 47
-0.11053 0.4595 47
-0.30379 0.0379 47
-0.13392 0.3695 47
Score A 0.42672 0.0028 47
0.28352 0.0535 47
-0.25379 0.0852 47
-0.19449 0.1902 47
-0.06806 0.6494 47
-0.19587 0.1870 47
-0.35211 0.0152 47
-0.17211 0.2474 47
Score B 0.40222 0.0051 47
0.28989 0.0481 47
-0.10635 0.4768 47
-0.14971 0.3152 47
0.03098 0.8362 47
-0.03573 0.8116 47
-0.30110 0.0397 47
-0.03182 0.8318 47
Total Anxiety Score
0.45139 0.0014 47
0.31160 0.0330 47
-0.19988 0.1780 47
-0.18838 0.2048 47
-0.02289 0.8786 47
-0.13034 0.3825 47
-0.35657 0.0139 47
-0.11475 0.4425 47
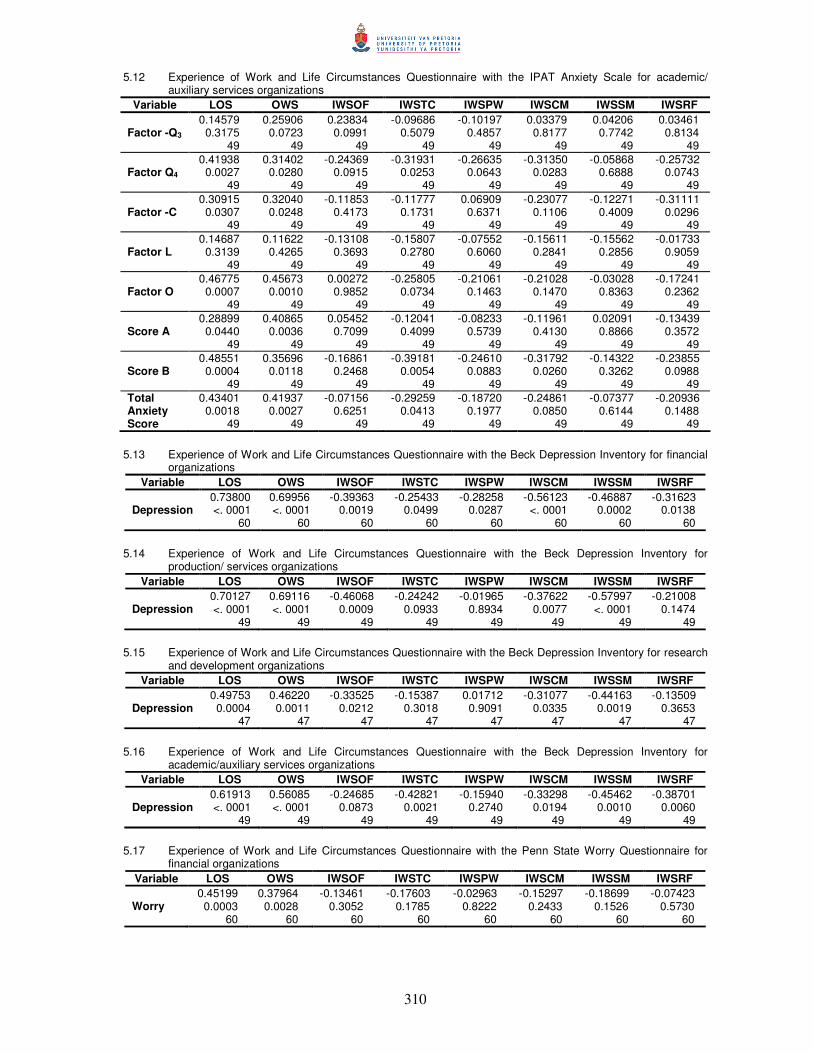
310
5.12 Experience of Work and Life Circumstances Questionnaire with the IPAT Anxiety Scale for academic/ auxiliary services organizations
Variable LOS OWS IWSOF IWSTC IWSPW IWSCM IWSSM IWSRF
Factor -Q3 0.14579 0.3175 49
0.25906 0.0723 49
0.23834 0.0991 49
-0.09686 0.5079 49
-0.10197 0.4857 49
0.03379 0.8177 49
0.04206 0.7742 49
0.03461 0.8134 49
Factor Q4 0.41938 0.0027 49
0.31402 0.0280 49
-0.24369 0.0915 49
-0.31931 0.0253 49
-0.26635 0.0643 49
-0.31350 0.0283 49
-0.05868 0.6888 49
-0.25732 0.0743 49
Factor -C 0.30915 0.0307 49
0.32040 0.0248 49
-0.11853 0.4173 49
-0.11777 0.1731 49
0.06909 0.6371 49
-0.23077 0.1106 49
-0.12271 0.4009 49
-0.31111 0.0296 49
Factor L 0.14687 0.3139 49
0.11622 0.4265 49
-0.13108 0.3693 49
-0.15807 0.2780 49
-0.07552 0.6060 49
-0.15611 0.2841 49
-0.15562 0.2856 49
-0.01733 0.9059 49
Factor O 0.46775 0.0007 49
0.45673 0.0010 49
0.00272 0.9852 49
-0.25805 0.0734 49
-0.21061 0.1463 49
-0.21028 0.1470 49
-0.03028 0.8363 49
-0.17241 0.2362 49
Score A 0.28899 0.0440 49
0.40865 0.0036 49
0.05452 0.7099 49
-0.12041 0.4099 49
-0.08233 0.5739 49
-0.11961 0.4130 49
0.02091 0.8866 49
-0.13439 0.3572 49
Score B 0.48551 0.0004 49
0.35696 0.0118 49
-0.16861 0.2468 49
-0.39181 0.0054 49
-0.24610 0.0883 49
-0.31792 0.0260 49
-0.14322 0.3262 49
-0.23855 0.0988 49
Total Anxiety Score
0.43401 0.0018 49
0.41937 0.0027 49
-0.07156 0.6251 49
-0.29259 0.0413 49
-0.18720 0.1977 49
-0.24861 0.0850 49
-0.07377 0.6144 49
-0.20936 0.1488 49
5.13 Experience of Work and Life Circumstances Questionnaire with the Beck Depression Inventory for financial
organizations Variable LOS OWS IWSOF IWSTC IWSPW IWSCM IWSSM IWSRF
Depression 0.73800 <. 0001 60
0.69956 <. 0001 60
-0.39363 0.0019 60
-0.25433 0.0499 60
-0.28258 0.0287 60
-0.56123 <. 0001 60
-0.46887 0.0002 60
-0.31623 0.0138 60
5.14 Experience of Work and Life Circumstances Questionnaire with the Beck Depression Inventory for
production/ services organizations Variable LOS OWS IWSOF IWSTC IWSPW IWSCM IWSSM IWSRF
Depression 0.70127 <. 0001 49
0.69116 <. 0001 49
-0.46068 0.0009 49
-0.24242 0.0933 49
-0.01965 0.8934 49
-0.37622 0.0077 49
-0.57997 <. 0001 49
-0.21008 0.1474 49
5.15 Experience of Work and Life Circumstances Questionnaire with the Beck Depression Inventory for research
and development organizations Variable LOS OWS IWSOF IWSTC IWSPW IWSCM IWSSM IWSRF
Depression 0.49753 0.0004 47
0.46220 0.0011 47
-0.33525 0.0212 47
-0.15387 0.3018 47
0.01712 0.9091 47
-0.31077 0.0335 47
-0.44163 0.0019 47
-0.13509 0.3653 47
5.16 Experience of Work and Life Circumstances Questionnaire with the Beck Depression Inventory for
academic/auxiliary services organizations Variable LOS OWS IWSOF IWSTC IWSPW IWSCM IWSSM IWSRF
Depression 0.61913 <. 0001 49
0.56085 <. 0001 49
-0.24685 0.0873 49
-0.42821 0.0021 49
-0.15940 0.2740 49
-0.33298 0.0194 49
-0.45462 0.0010 49
-0.38701 0.0060 49
5.17 Experience of Work and Life Circumstances Questionnaire with the Penn State Worry Questionnaire for
financial organizations Variable LOS OWS IWSOF IWSTC IWSPW IWSCM IWSSM IWSRF
Worry 0.45199 0.0003 60
0.37964 0.0028 60
-0.13461 0.3052 60
-0.17603 0.1785 60
-0.02963 0.8222 60
-0.15297 0.2433 60
-0.18699 0.1526 60
-0.07423 0.5730 60
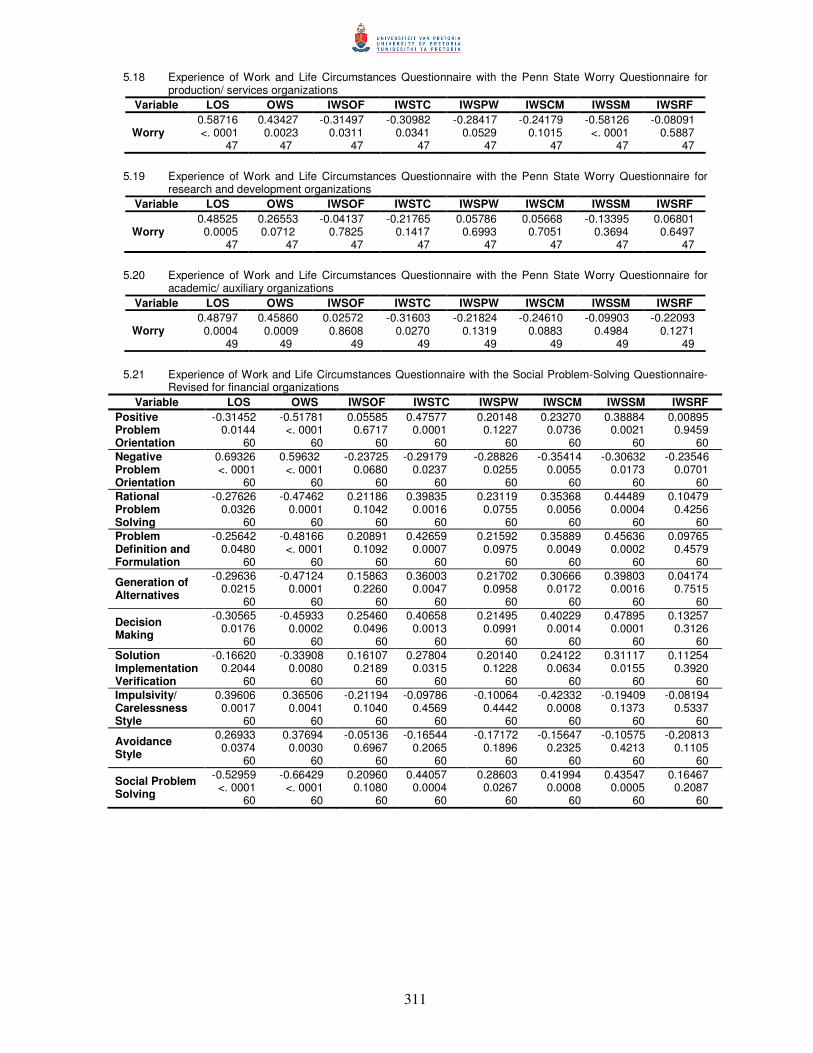
311
5.18 Experience of Work and Life Circumstances Questionnaire with the Penn State Worry Questionnaire for production/ services organizations
Variable LOS OWS IWSOF IWSTC IWSPW IWSCM IWSSM IWSRF
Worry 0.58716 <. 0001 47
0.43427 0.0023 47
-0.31497 0.0311 47
-0.30982 0.0341 47
-0.28417 0.0529 47
-0.24179 0.1015 47
-0.58126 <. 0001 47
-0.08091 0.5887 47
5.19 Experience of Work and Life Circumstances Questionnaire with the Penn State Worry Questionnaire for
research and development organizations Variable LOS OWS IWSOF IWSTC IWSPW IWSCM IWSSM IWSRF
Worry 0.48525 0.0005 47
0.26553 0.0712 47
-0.04137 0.7825 47
-0.21765 0.1417 47
0.05786 0.6993 47
0.05668 0.7051 47
-0.13395 0.3694 47
0.06801 0.6497 47
5.20 Experience of Work and Life Circumstances Questionnaire with the Penn State Worry Questionnaire for
academic/ auxiliary organizations Variable LOS OWS IWSOF IWSTC IWSPW IWSCM IWSSM IWSRF
Worry 0.48797 0.0004 49
0.45860 0.0009 49
0.02572 0.8608 49
-0.31603 0.0270 49
-0.21824 0.1319 49
-0.24610 0.0883 49
-0.09903 0.4984 49
-0.22093 0.1271 49
5.21 Experience of Work and Life Circumstances Questionnaire with the Social Problem-Solving Questionnaire-
Revised for financial organizations Variable LOS OWS IWSOF IWSTC IWSPW IWSCM IWSSM IWSRF
Positive Problem Orientation
-0.31452 0.0144 60
-0.51781 <. 0001 60
0.05585 0.6717 60
0.47577 0.0001 60
0.20148 0.1227 60
0.23270 0.0736 60
0.38884 0.0021 60
0.00895 0.9459 60
Negative Problem Orientation
0.69326 <. 0001 60
0.59632 <. 0001 60
-0.23725 0.0680 60
-0.29179 0.0237 60
-0.28826 0.0255 60
-0.35414 0.0055 60
-0.30632 0.0173 60
-0.23546 0.0701 60
Rational Problem Solving
-0.27626 0.0326 60
-0.47462 0.0001 60
0.21186 0.1042 60
0.39835 0.0016 60
0.23119 0.0755 60
0.35368 0.0056 60
0.44489 0.0004 60
0.10479 0.4256 60
Problem Definition and Formulation
-0.25642 0.0480 60
-0.48166 <. 0001 60
0.20891 0.1092 60
0.42659 0.0007 60
0.21592 0.0975 60
0.35889 0.0049 60
0.45636 0.0002 60
0.09765 0.4579 60
Generation of Alternatives
-0.29636 0.0215 60
-0.47124 0.0001 60
0.15863 0.2260 60
0.36003 0.0047 60
0.21702 0.0958 60
0.30666 0.0172 60
0.39803 0.0016 60
0.04174 0.7515 60
Decision Making
-0.30565 0.0176 60
-0.45933 0.0002 60
0.25460 0.0496 60
0.40658 0.0013 60
0.21495 0.0991 60
0.40229 0.0014 60
0.47895 0.0001 60
0.13257 0.3126 60
Solution Implementation Verification
-0.16620 0.2044 60
-0.33908 0.0080 60
0.16107 0.2189 60
0.27804 0.0315 60
0.20140 0.1228 60
0.24122 0.0634 60
0.31117 0.0155 60
0.11254 0.3920 60
Impulsivity/ Carelessness Style
0.39606 0.0017 60
0.36506 0.0041 60
-0.21194 0.1040 60
-0.09786 0.4569 60
-0.10064 0.4442 60
-0.42332 0.0008 60
-0.19409 0.1373 60
-0.08194 0.5337 60
Avoidance Style
0.26933 0.0374 60
0.37694 0.0030 60
-0.05136 0.6967 60
-0.16544 0.2065 60
-0.17172 0.1896 60
-0.15647 0.2325 60
-0.10575 0.4213 60
-0.20813 0.1105 60
Social Problem Solving
-0.52959 <. 0001 60
-0.66429 <. 0001 60
0.20960 0.1080 60
0.44057 0.0004 60
0.28603 0.0267 60
0.41994 0.0008 60
0.43547 0.0005 60
0.16467 0.2087 60
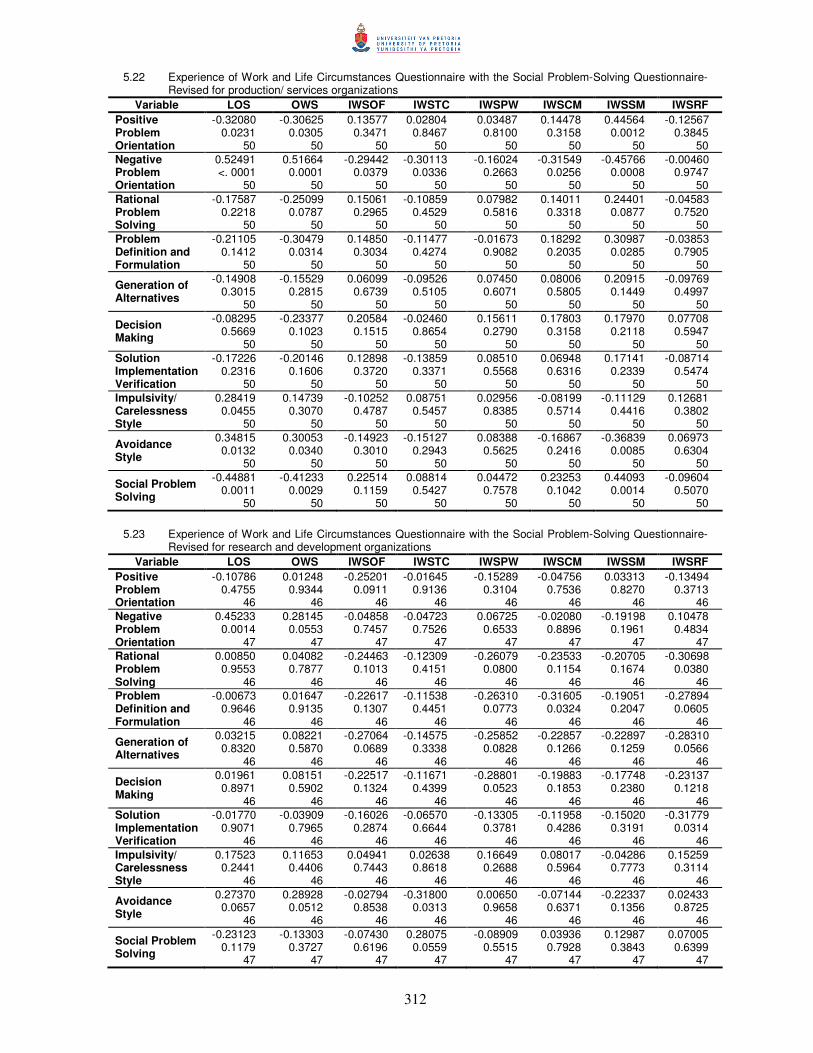
312
5.22 Experience of Work and Life Circumstances Questionnaire with the Social Problem-Solving Questionnaire-Revised for production/ services organizations
Variable LOS OWS IWSOF IWSTC IWSPW IWSCM IWSSM IWSRF Positive Problem Orientation
-0.32080 0.0231 50
-0.30625 0.0305 50
0.13577 0.3471 50
0.02804 0.8467 50
0.03487 0.8100 50
0.14478 0.3158 50
0.44564 0.0012 50
-0.12567 0.3845 50
Negative Problem Orientation
0.52491 <. 0001 50
0.51664 0.0001 50
-0.29442 0.0379 50
-0.30113 0.0336 50
-0.16024 0.2663 50
-0.31549 0.0256 50
-0.45766 0.0008 50
-0.00460 0.9747 50
Rational Problem Solving
-0.17587 0.2218 50
-0.25099 0.0787 50
0.15061 0.2965 50
-0.10859 0.4529 50
0.07982 0.5816 50
0.14011 0.3318 50
0.24401 0.0877 50
-0.04583 0.7520 50
Problem Definition and Formulation
-0.21105 0.1412 50
-0.30479 0.0314 50
0.14850 0.3034 50
-0.11477 0.4274 50
-0.01673 0.9082 50
0.18292 0.2035 50
0.30987 0.0285 50
-0.03853 0.7905 50
Generation of Alternatives
-0.14908 0.3015 50
-0.15529 0.2815 50
0.06099 0.6739 50
-0.09526 0.5105 50
0.07450 0.6071 50
0.08006 0.5805 50
0.20915 0.1449 50
-0.09769 0.4997 50
Decision Making
-0.08295 0.5669 50
-0.23377 0.1023 50
0.20584 0.1515 50
-0.02460 0.8654 50
0.15611 0.2790 50
0.17803 0.3158 50
0.17970 0.2118 50
0.07708 0.5947 50
Solution Implementation Verification
-0.17226 0.2316 50
-0.20146 0.1606 50
0.12898 0.3720 50
-0.13859 0.3371 50
0.08510 0.5568 50
0.06948 0.6316 50
0.17141 0.2339 50
-0.08714 0.5474 50
Impulsivity/ Carelessness Style
0.28419 0.0455 50
0.14739 0.3070 50
-0.10252 0.4787 50
0.08751 0.5457 50
0.02956 0.8385 50
-0.08199 0.5714 50
-0.11129 0.4416 50
0.12681 0.3802 50
Avoidance Style
0.34815 0.0132 50
0.30053 0.0340 50
-0.14923 0.3010 50
-0.15127 0.2943 50
0.08388 0.5625 50
-0.16867 0.2416 50
-0.36839 0.0085 50
0.06973 0.6304 50
Social Problem Solving
-0.44881 0.0011 50
-0.41233 0.0029 50
0.22514 0.1159 50
0.08814 0.5427 50
0.04472 0.7578 50
0.23253 0.1042 50
0.44093 0.0014 50
-0.09604 0.5070 50
5.23 Experience of Work and Life Circumstances Questionnaire with the Social Problem-Solving Questionnaire-
Revised for research and development organizations Variable LOS OWS IWSOF IWSTC IWSPW IWSCM IWSSM IWSRF
Positive Problem Orientation
-0.10786 0.4755 46
0.01248 0.9344 46
-0.25201 0.0911 46
-0.01645 0.9136 46
-0.15289 0.3104 46
-0.04756 0.7536 46
0.03313 0.8270 46
-0.13494 0.3713 46
Negative Problem Orientation
0.45233 0.0014 47
0.28145 0.0553 47
-0.04858 0.7457 47
-0.04723 0.7526 47
0.06725 0.6533 47
-0.02080 0.8896 47
-0.19198 0.1961 47
0.10478 0.4834 47
Rational Problem Solving
0.00850 0.9553 46
0.04082 0.7877 46
-0.24463 0.1013 46
-0.12309 0.4151 46
-0.26079 0.0800 46
-0.23533 0.1154 46
-0.20705 0.1674 46
-0.30698 0.0380 46
Problem Definition and Formulation
-0.00673 0.9646 46
0.01647 0.9135 46
-0.22617 0.1307 46
-0.11538 0.4451 46
-0.26310 0.0773 46
-0.31605 0.0324 46
-0.19051 0.2047 46
-0.27894 0.0605 46
Generation of Alternatives
0.03215 0.8320 46
0.08221 0.5870 46
-0.27064 0.0689 46
-0.14575 0.3338 46
-0.25852 0.0828 46
-0.22857 0.1266 46
-0.22897 0.1259 46
-0.28310 0.0566 46
Decision Making
0.01961 0.8971 46
0.08151 0.5902 46
-0.22517 0.1324 46
-0.11671 0.4399 46
-0.28801 0.0523 46
-0.19883 0.1853 46
-0.17748 0.2380 46
-0.23137 0.1218 46
Solution Implementation Verification
-0.01770 0.9071 46
-0.03909 0.7965 46
-0.16026 0.2874 46
-0.06570 0.6644 46
-0.13305 0.3781 46
-0.11958 0.4286 46
-0.15020 0.3191 46
-0.31779 0.0314 46
Impulsivity/ Carelessness Style
0.17523 0.2441 46
0.11653 0.4406 46
0.04941 0.7443 46
0.02638 0.8618 46
0.16649 0.2688 46
0.08017 0.5964 46
-0.04286 0.7773 46
0.15259 0.3114 46
Avoidance Style
0.27370 0.0657 46
0.28928 0.0512 46
-0.02794 0.8538 46
-0.31800 0.0313 46
0.00650 0.9658 46
-0.07144 0.6371 46
-0.22337 0.1356 46
0.02433 0.8725 46
Social Problem Solving
-0.23123 0.1179 47
-0.13303 0.3727 47
-0.07430 0.6196 47
0.28075 0.0559 47
-0.08909 0.5515 47
0.03936 0.7928 47
0.12987 0.3843 47
0.07005 0.6399 47
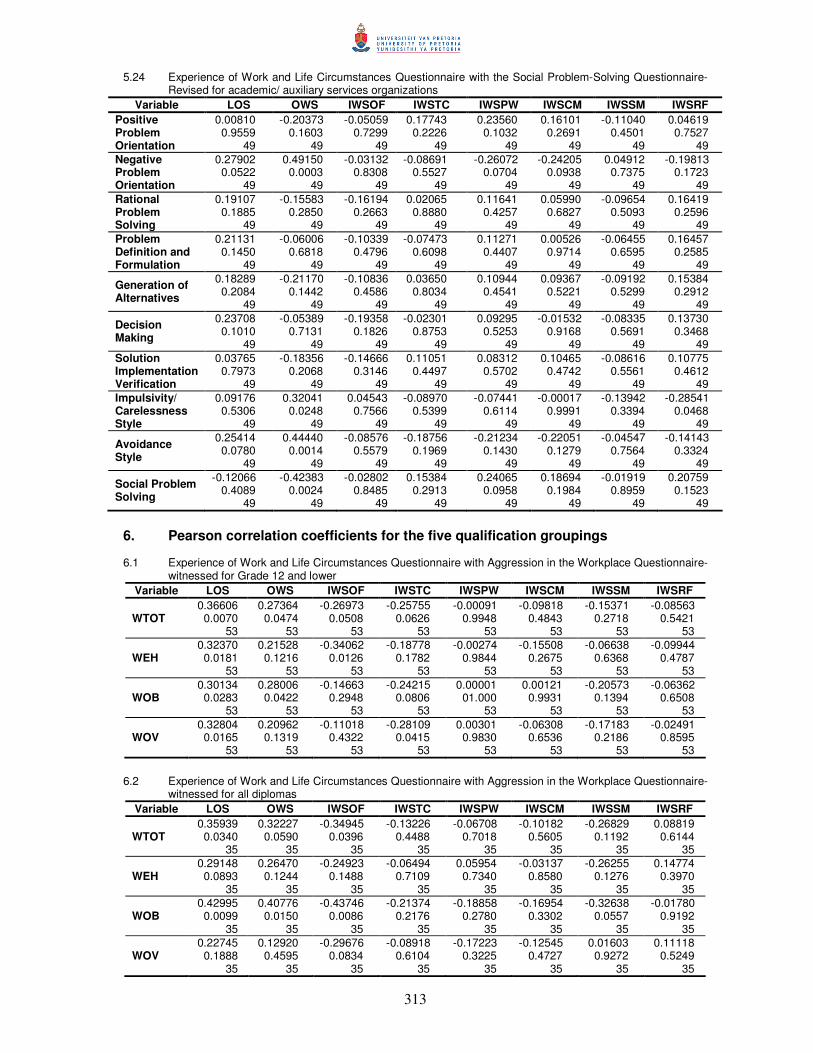
313
5.24 Experience of Work and Life Circumstances Questionnaire with the Social Problem-Solving Questionnaire-Revised for academic/ auxiliary services organizations
Variable LOS OWS IWSOF IWSTC IWSPW IWSCM IWSSM IWSRF Positive Problem Orientation
0.00810 0.9559 49
-0.20373 0.1603 49
-0.05059 0.7299 49
0.17743 0.2226 49
0.23560 0.1032 49
0.16101 0.2691 49
-0.11040 0.4501 49
0.04619 0.7527 49
Negative Problem Orientation
0.27902 0.0522 49
0.49150 0.0003 49
-0.03132 0.8308 49
-0.08691 0.5527 49
-0.26072 0.0704 49
-0.24205 0.0938 49
0.04912 0.7375 49
-0.19813 0.1723 49
Rational Problem Solving
0.19107 0.1885 49
-0.15583 0.2850 49
-0.16194 0.2663 49
0.02065 0.8880 49
0.11641 0.4257 49
0.05990 0.6827 49
-0.09654 0.5093 49
0.16419 0.2596 49
Problem Definition and Formulation
0.21131 0.1450 49
-0.06006 0.6818 49
-0.10339 0.4796 49
-0.07473 0.6098 49
0.11271 0.4407 49
0.00526 0.9714 49
-0.06455 0.6595 49
0.16457 0.2585 49
Generation of Alternatives
0.18289 0.2084 49
-0.21170 0.1442 49
-0.10836 0.4586 49
0.03650 0.8034 49
0.10944 0.4541 49
0.09367 0.5221 49
-0.09192 0.5299 49
0.15384 0.2912 49
Decision Making
0.23708 0.1010 49
-0.05389 0.7131 49
-0.19358 0.1826 49
-0.02301 0.8753 49
0.09295 0.5253 49
-0.01532 0.9168 49
-0.08335 0.5691 49
0.13730 0.3468 49
Solution Implementation Verification
0.03765 0.7973 49
-0.18356 0.2068 49
-0.14666 0.3146 49
0.11051 0.4497 49
0.08312 0.5702 49
0.10465 0.4742 49
-0.08616 0.5561 49
0.10775 0.4612 49
Impulsivity/ Carelessness Style
0.09176 0.5306 49
0.32041 0.0248 49
0.04543 0.7566 49
-0.08970 0.5399 49
-0.07441 0.6114 49
-0.00017 0.9991 49
-0.13942 0.3394 49
-0.28541 0.0468 49
Avoidance Style
0.25414 0.0780 49
0.44440 0.0014 49
-0.08576 0.5579 49
-0.18756 0.1969 49
-0.21234 0.1430 49
-0.22051 0.1279 49
-0.04547 0.7564 49
-0.14143 0.3324 49
Social Problem Solving
-0.12066 0.4089 49
-0.42383 0.0024 49
-0.02802 0.8485 49
0.15384 0.2913 49
0.24065 0.0958 49
0.18694 0.1984 49
-0.01919 0.8959 49
0.20759 0.1523 49
6. Pearson correlation coefficients for the five qualification groupings 6.1 Experience of Work and Life Circumstances Questionnaire with Aggression in the Workplace Questionnaire-
witnessed for Grade 12 and lower Variable LOS OWS IWSOF IWSTC IWSPW IWSCM IWSSM IWSRF
WTOT 0.36606 0.0070 53
0.27364 0.0474 53
-0.26973 0.0508 53
-0.25755 0.0626 53
-0.00091 0.9948 53
-0.09818 0.4843 53
-0.15371 0.2718 53
-0.08563 0.5421 53
WEH 0.32370 0.0181 53
0.21528 0.1216 53
-0.34062 0.0126 53
-0.18778 0.1782 53
-0.00274 0.9844 53
-0.15508 0.2675 53
-0.06638 0.6368 53
-0.09944 0.4787 53
WOB 0.30134 0.0283 53
0.28006 0.0422 53
-0.14663 0.2948 53
-0.24215 0.0806 53
0.00001 01.000 53
0.00121 0.9931 53
-0.20573 0.1394 53
-0.06362 0.6508 53
WOV 0.32804 0.0165 53
0.20962 0.1319 53
-0.11018 0.4322 53
-0.28109 0.0415 53
0.00301 0.9830 53
-0.06308 0.6536 53
-0.17183 0.2186 53
-0.02491 0.8595 53
6.2 Experience of Work and Life Circumstances Questionnaire with Aggression in the Workplace Questionnaire-
witnessed for all diplomas Variable LOS OWS IWSOF IWSTC IWSPW IWSCM IWSSM IWSRF
WTOT 0.35939 0.0340 35
0.32227 0.0590 35
-0.34945 0.0396 35
-0.13226 0.4488 35
-0.06708 0.7018 35
-0.10182 0.5605 35
-0.26829 0.1192 35
0.08819 0.6144 35
WEH 0.29148 0.0893 35
0.26470 0.1244 35
-0.24923 0.1488 35
-0.06494 0.7109 35
0.05954 0.7340 35
-0.03137 0.8580 35
-0.26255 0.1276 35
0.14774 0.3970 35
WOB 0.42995 0.0099 35
0.40776 0.0150 35
-0.43746 0.0086 35
-0.21374 0.2176 35
-0.18858 0.2780 35
-0.16954 0.3302 35
-0.32638 0.0557 35
-0.01780 0.9192 35
WOV 0.22745 0.1888 35
0.12920 0.4595 35
-0.29676 0.0834 35
-0.08918 0.6104 35
-0.17223 0.3225 35
-0.12545 0.4727 35
0.01603 0.9272 35
0.11118 0.5249 35
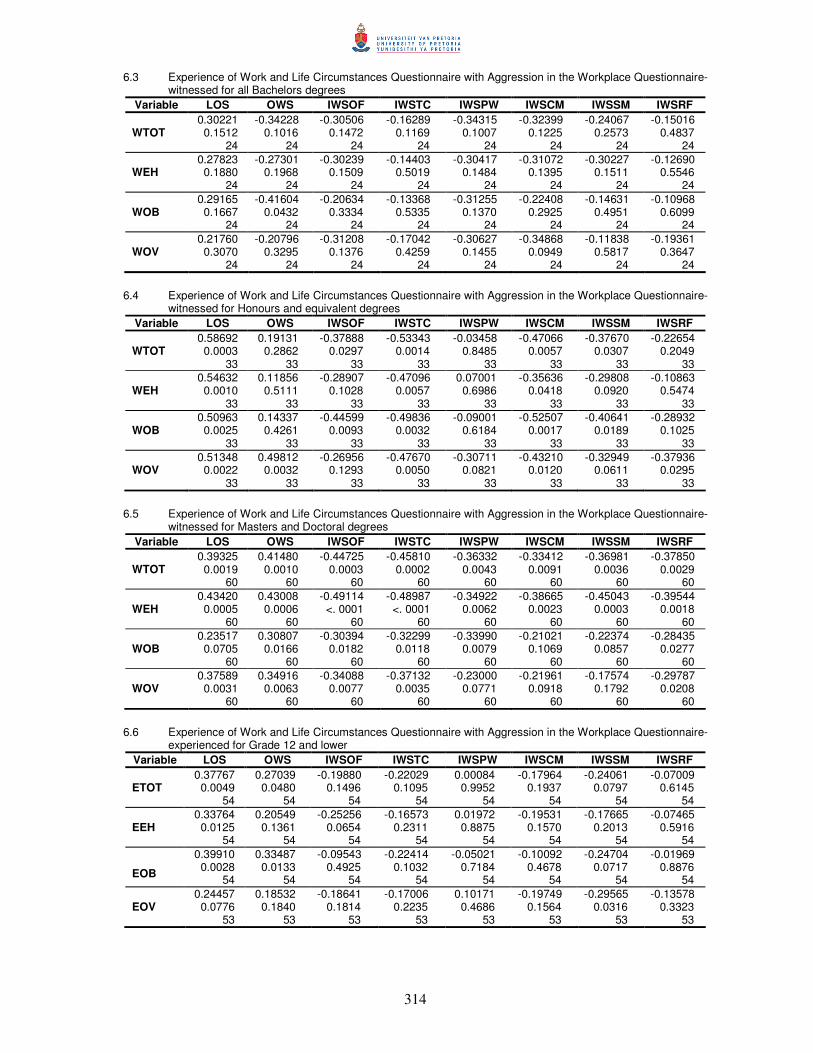
314
6.3 Experience of Work and Life Circumstances Questionnaire with Aggression in the Workplace Questionnaire-witnessed for all Bachelors degrees
Variable LOS OWS IWSOF IWSTC IWSPW IWSCM IWSSM IWSRF
WTOT 0.30221 0.1512 24
-0.34228 0.1016 24
-0.30506 0.1472 24
-0.16289 0.1169 24
-0.34315 0.1007 24
-0.32399 0.1225 24
-0.24067 0.2573 24
-0.15016 0.4837 24
WEH 0.27823 0.1880 24
-0.27301 0.1968 24
-0.30239 0.1509 24
-0.14403 0.5019 24
-0.30417 0.1484 24
-0.31072 0.1395 24
-0.30227 0.1511 24
-0.12690 0.5546 24
WOB 0.29165 0.1667 24
-0.41604 0.0432 24
-0.20634 0.3334 24
-0.13368 0.5335 24
-0.31255 0.1370 24
-0.22408 0.2925 24
-0.14631 0.4951 24
-0.10968 0.6099 24
WOV 0.21760 0.3070 24
-0.20796 0.3295 24
-0.31208 0.1376 24
-0.17042 0.4259 24
-0.30627 0.1455 24
-0.34868 0.0949 24
-0.11838 0.5817 24
-0.19361 0.3647 24
6.4 Experience of Work and Life Circumstances Questionnaire with Aggression in the Workplace Questionnaire-
witnessed for Honours and equivalent degrees Variable LOS OWS IWSOF IWSTC IWSPW IWSCM IWSSM IWSRF
WTOT 0.58692 0.0003 33
0.19131 0.2862 33
-0.37888 0.0297 33
-0.53343 0.0014 33
-0.03458 0.8485 33
-0.47066 0.0057 33
-0.37670 0.0307 33
-0.22654 0.2049 33
WEH 0.54632 0.0010 33
0.11856 0.5111 33
-0.28907 0.1028 33
-0.47096 0.0057 33
0.07001 0.6986 33
-0.35636 0.0418 33
-0.29808 0.0920 33
-0.10863 0.5474 33
WOB 0.50963 0.0025 33
0.14337 0.4261 33
-0.44599 0.0093 33
-0.49836 0.0032 33
-0.09001 0.6184 33
-0.52507 0.0017 33
-0.40641 0.0189 33
-0.28932 0.1025 33
WOV 0.51348 0.0022 33
0.49812 0.0032 33
-0.26956 0.1293 33
-0.47670 0.0050 33
-0.30711 0.0821 33
-0.43210 0.0120 33
-0.32949 0.0611 33
-0.37936 0.0295 33
6.5 Experience of Work and Life Circumstances Questionnaire with Aggression in the Workplace Questionnaire-
witnessed for Masters and Doctoral degrees Variable LOS OWS IWSOF IWSTC IWSPW IWSCM IWSSM IWSRF
WTOT 0.39325 0.0019 60
0.41480 0.0010 60
-0.44725 0.0003 60
-0.45810 0.0002 60
-0.36332 0.0043 60
-0.33412 0.0091 60
-0.36981 0.0036 60
-0.37850 0.0029 60
WEH 0.43420 0.0005 60
0.43008 0.0006 60
-0.49114 <. 0001 60
-0.48987 <. 0001 60
-0.34922 0.0062 60
-0.38665 0.0023 60
-0.45043 0.0003 60
-0.39544 0.0018 60
WOB 0.23517 0.0705 60
0.30807 0.0166 60
-0.30394 0.0182 60
-0.32299 0.0118 60
-0.33990 0.0079 60
-0.21021 0.1069 60
-0.22374 0.0857 60
-0.28435 0.0277 60
WOV 0.37589 0.0031 60
0.34916 0.0063 60
-0.34088 0.0077 60
-0.37132 0.0035 60
-0.23000 0.0771 60
-0.21961 0.0918 60
-0.17574 0.1792 60
-0.29787 0.0208 60
6.6 Experience of Work and Life Circumstances Questionnaire with Aggression in the Workplace Questionnaire-
experienced for Grade 12 and lower Variable LOS OWS IWSOF IWSTC IWSPW IWSCM IWSSM IWSRF
ETOT 0.37767 0.0049 54
0.27039 0.0480 54
-0.19880 0.1496 54
-0.22029 0.1095 54
0.00084 0.9952 54
-0.17964 0.1937 54
-0.24061 0.0797 54
-0.07009 0.6145 54
EEH 0.33764 0.0125 54
0.20549 0.1361 54
-0.25256 0.0654 54
-0.16573 0.2311 54
0.01972 0.8875 54
-0.19531 0.1570 54
-0.17665 0.2013 54
-0.07465 0.5916 54
EOB
0.39910 0.0028 54
0.33487 0.0133 54
-0.09543 0.4925 54
-0.22414 0.1032 54
-0.05021 0.7184 54
-0.10092 0.4678 54
-0.24704 0.0717 54
-0.01969 0.8876 54
EOV 0.24457 0.0776 53
0.18532 0.1840 53
-0.18641 0.1814 53
-0.17006 0.2235 53
0.10171 0.4686 53
-0.19749 0.1564 53
-0.29565 0.0316 53
-0.13578 0.3323 53
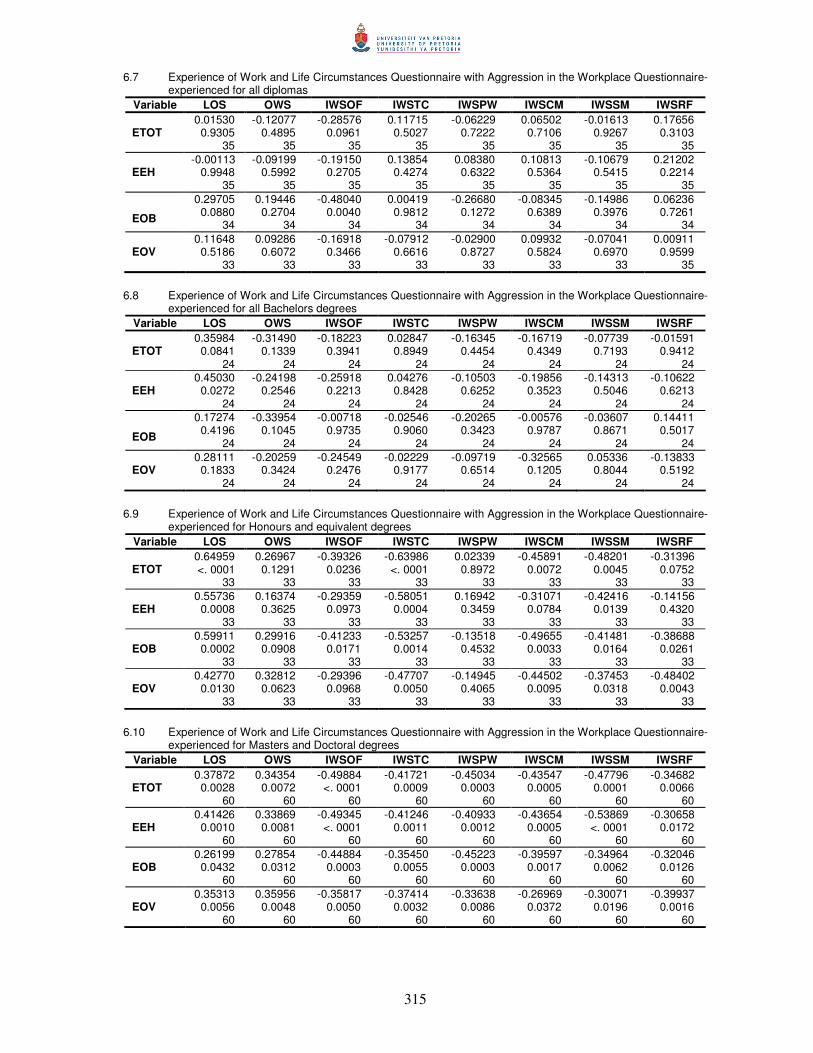
315
6.7 Experience of Work and Life Circumstances Questionnaire with Aggression in the Workplace Questionnaire-experienced for all diplomas
Variable LOS OWS IWSOF IWSTC IWSPW IWSCM IWSSM IWSRF
ETOT 0.01530 0.9305 35
-0.12077 0.4895 35
-0.28576 0.0961 35
0.11715 0.5027 35
-0.06229 0.7222 35
0.06502 0.7106 35
-0.01613 0.9267 35
0.17656 0.3103 35
EEH -0.00113 0.9948 35
-0.09199 0.5992 35
-0.19150 0.2705 35
0.13854 0.4274 35
0.08380 0.6322 35
0.10813 0.5364 35
-0.10679 0.5415 35
0.21202 0.2214 35
EOB
0.29705 0.0880 34
0.19446 0.2704 34
-0.48040 0.0040 34
0.00419 0.9812 34
-0.26680 0.1272 34
-0.08345 0.6389 34
-0.14986 0.3976 34
0.06236 0.7261 34
EOV 0.11648 0.5186 33
0.09286 0.6072 33
-0.16918 0.3466 33
-0.07912 0.6616 33
-0.02900 0.8727 33
0.09932 0.5824 33
-0.07041 0.6970 33
0.00911 0.9599 35
6.8 Experience of Work and Life Circumstances Questionnaire with Aggression in the Workplace Questionnaire-
experienced for all Bachelors degrees Variable LOS OWS IWSOF IWSTC IWSPW IWSCM IWSSM IWSRF
ETOT 0.35984 0.0841 24
-0.31490 0.1339 24
-0.18223 0.3941 24
0.02847 0.8949 24
-0.16345 0.4454 24
-0.16719 0.4349 24
-0.07739 0.7193 24
-0.01591 0.9412 24
EEH 0.45030 0.0272 24
-0.24198 0.2546 24
-0.25918 0.2213 24
0.04276 0.8428 24
-0.10503 0.6252 24
-0.19856 0.3523 24
-0.14313 0.5046 24
-0.10622 0.6213 24
EOB
0.17274 0.4196 24
-0.33954 0.1045 24
-0.00718 0.9735 24
-0.02546 0.9060 24
-0.20265 0.3423 24
-0.00576 0.9787 24
-0.03607 0.8671 24
0.14411 0.5017 24
EOV 0.28111 0.1833 24
-0.20259 0.3424 24
-0.24549 0.2476 24
-0.02229 0.9177 24
-0.09719 0.6514 24
-0.32565 0.1205 24
0.05336 0.8044 24
-0.13833 0.5192 24
6.9 Experience of Work and Life Circumstances Questionnaire with Aggression in the Workplace Questionnaire-
experienced for Honours and equivalent degrees Variable LOS OWS IWSOF IWSTC IWSPW IWSCM IWSSM IWSRF
ETOT 0.64959 <. 0001 33
0.26967 0.1291 33
-0.39326 0.0236 33
-0.63986 <. 0001 33
0.02339 0.8972 33
-0.45891 0.0072 33
-0.48201 0.0045 33
-0.31396 0.0752 33
EEH 0.55736 0.0008 33
0.16374 0.3625 33
-0.29359 0.0973 33
-0.58051 0.0004 33
0.16942 0.3459 33
-0.31071 0.0784 33
-0.42416 0.0139 33
-0.14156 0.4320 33
EOB 0.59911 0.0002 33
0.29916 0.0908 33
-0.41233 0.0171 33
-0.53257 0.0014 33
-0.13518 0.4532 33
-0.49655 0.0033 33
-0.41481 0.0164 33
-0.38688 0.0261 33
EOV 0.42770 0.0130 33
0.32812 0.0623 33
-0.29396 0.0968 33
-0.47707 0.0050 33
-0.14945 0.4065 33
-0.44502 0.0095 33
-0.37453 0.0318 33
-0.48402 0.0043 33
6.10 Experience of Work and Life Circumstances Questionnaire with Aggression in the Workplace Questionnaire-
experienced for Masters and Doctoral degrees Variable LOS OWS IWSOF IWSTC IWSPW IWSCM IWSSM IWSRF
ETOT 0.37872 0.0028 60
0.34354 0.0072 60
-0.49884 <. 0001 60
-0.41721 0.0009 60
-0.45034 0.0003 60
-0.43547 0.0005 60
-0.47796 0.0001 60
-0.34682 0.0066 60
EEH 0.41426 0.0010 60
0.33869 0.0081 60
-0.49345 <. 0001 60
-0.41246 0.0011 60
-0.40933 0.0012 60
-0.43654 0.0005 60
-0.53869 <. 0001 60
-0.30658 0.0172 60
EOB 0.26199 0.0432 60
0.27854 0.0312 60
-0.44884 0.0003 60
-0.35450 0.0055 60
-0.45223 0.0003 60
-0.39597 0.0017 60
-0.34964 0.0062 60
-0.32046 0.0126 60
EOV 0.35313 0.0056 60
0.35956 0.0048 60
-0.35817 0.0050 60
-0.37414 0.0032 60
-0.33638 0.0086 60
-0.26969 0.0372 60
-0.30071 0.0196 60
-0.39937 0.0016 60
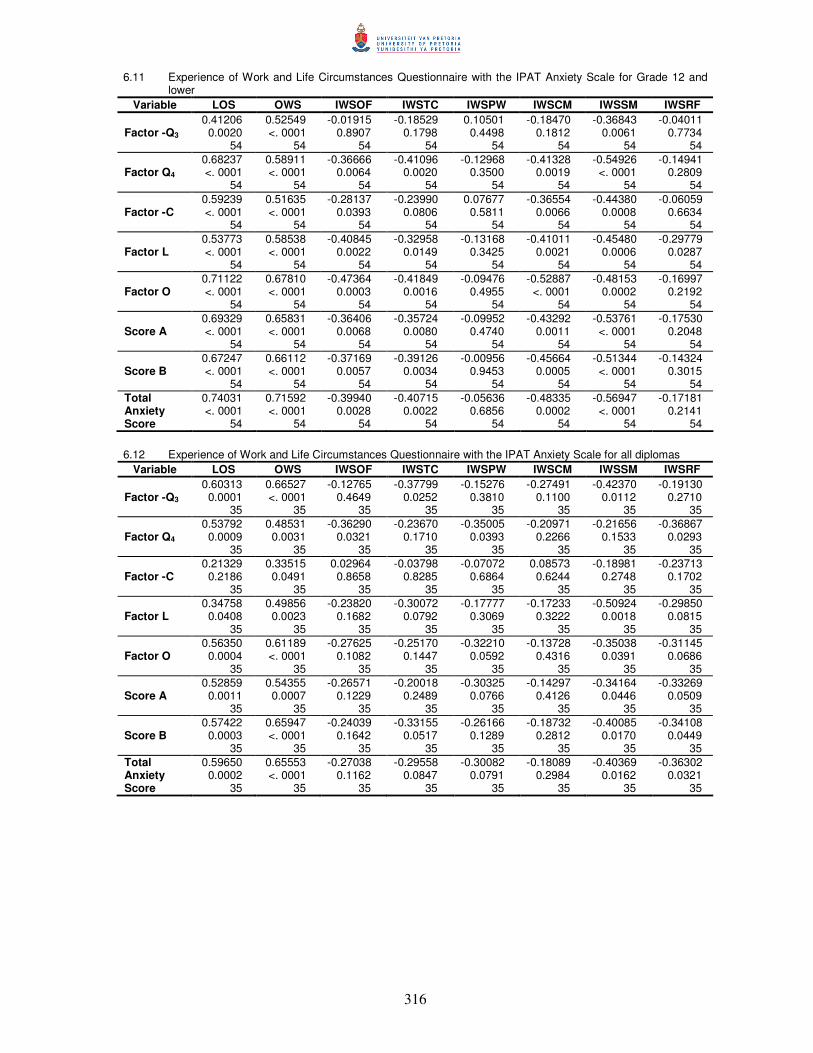
316
6.11 Experience of Work and Life Circumstances Questionnaire with the IPAT Anxiety Scale for Grade 12 and lower
Variable LOS OWS IWSOF IWSTC IWSPW IWSCM IWSSM IWSRF
Factor -Q3 0.41206 0.0020 54
0.52549 <. 0001 54
-0.01915 0.8907 54
-0.18529 0.1798 54
0.10501 0.4498 54
-0.18470 0.1812 54
-0.36843 0.0061 54
-0.04011 0.7734 54
Factor Q4 0.68237 <. 0001 54
0.58911 <. 0001 54
-0.36666 0.0064 54
-0.41096 0.0020 54
-0.12968 0.3500 54
-0.41328 0.0019 54
-0.54926 <. 0001 54
-0.14941 0.2809 54
Factor -C 0.59239 <. 0001 54
0.51635 <. 0001 54
-0.28137 0.0393 54
-0.23990 0.0806 54
0.07677 0.5811 54
-0.36554 0.0066 54
-0.44380 0.0008 54
-0.06059 0.6634 54
Factor L 0.53773 <. 0001 54
0.58538 <. 0001 54
-0.40845 0.0022 54
-0.32958 0.0149 54
-0.13168 0.3425 54
-0.41011 0.0021 54
-0.45480 0.0006 54
-0.29779 0.0287 54
Factor O 0.71122 <. 0001 54
0.67810 <. 0001 54
-0.47364 0.0003 54
-0.41849 0.0016 54
-0.09476 0.4955 54
-0.52887 <. 0001 54
-0.48153 0.0002 54
-0.16997 0.2192 54
Score A 0.69329 <. 0001 54
0.65831 <. 0001 54
-0.36406 0.0068 54
-0.35724 0.0080 54
-0.09952 0.4740 54
-0.43292 0.0011 54
-0.53761 <. 0001 54
-0.17530 0.2048 54
Score B 0.67247 <. 0001 54
0.66112 <. 0001 54
-0.37169 0.0057 54
-0.39126 0.0034 54
-0.00956 0.9453 54
-0.45664 0.0005 54
-0.51344 <. 0001 54
-0.14324 0.3015 54
Total Anxiety Score
0.74031 <. 0001 54
0.71592 <. 0001 54
-0.39940 0.0028 54
-0.40715 0.0022 54
-0.05636 0.6856 54
-0.48335 0.0002 54
-0.56947 <. 0001 54
-0.17181 0.2141 54
6.12 Experience of Work and Life Circumstances Questionnaire with the IPAT Anxiety Scale for all diplomas
Variable LOS OWS IWSOF IWSTC IWSPW IWSCM IWSSM IWSRF
Factor -Q3 0.60313 0.0001 35
0.66527 <. 0001 35
-0.12765 0.4649 35
-0.37799 0.0252 35
-0.15276 0.3810 35
-0.27491 0.1100 35
-0.42370 0.0112 35
-0.19130 0.2710 35
Factor Q4 0.53792 0.0009 35
0.48531 0.0031 35
-0.36290 0.0321 35
-0.23670 0.1710 35
-0.35005 0.0393 35
-0.20971 0.2266 35
-0.21656 0.1533 35
-0.36867 0.0293 35
Factor -C 0.21329 0.2186 35
0.33515 0.0491 35
0.02964 0.8658 35
-0.03798 0.8285 35
-0.07072 0.6864 35
0.08573 0.6244 35
-0.18981 0.2748 35
-0.23713 0.1702 35
Factor L 0.34758 0.0408 35
0.49856 0.0023 35
-0.23820 0.1682 35
-0.30072 0.0792 35
-0.17777 0.3069 35
-0.17233 0.3222 35
-0.50924 0.0018 35
-0.29850 0.0815 35
Factor O 0.56350 0.0004 35
0.61189 <. 0001 35
-0.27625 0.1082 35
-0.25170 0.1447 35
-0.32210 0.0592 35
-0.13728 0.4316 35
-0.35038 0.0391 35
-0.31145 0.0686 35
Score A 0.52859 0.0011 35
0.54355 0.0007 35
-0.26571 0.1229 35
-0.20018 0.2489 35
-0.30325 0.0766 35
-0.14297 0.4126 35
-0.34164 0.0446 35
-0.33269 0.0509 35
Score B 0.57422 0.0003 35
0.65947 <. 0001 35
-0.24039 0.1642 35
-0.33155 0.0517 35
-0.26166 0.1289 35
-0.18732 0.2812 35
-0.40085 0.0170 35
-0.34108 0.0449 35
Total Anxiety Score
0.59650 0.0002 35
0.65553 <. 0001 35
-0.27038 0.1162 35
-0.29558 0.0847 35
-0.30082 0.0791 35
-0.18089 0.2984 35
-0.40369 0.0162 35
-0.36302 0.0321 35
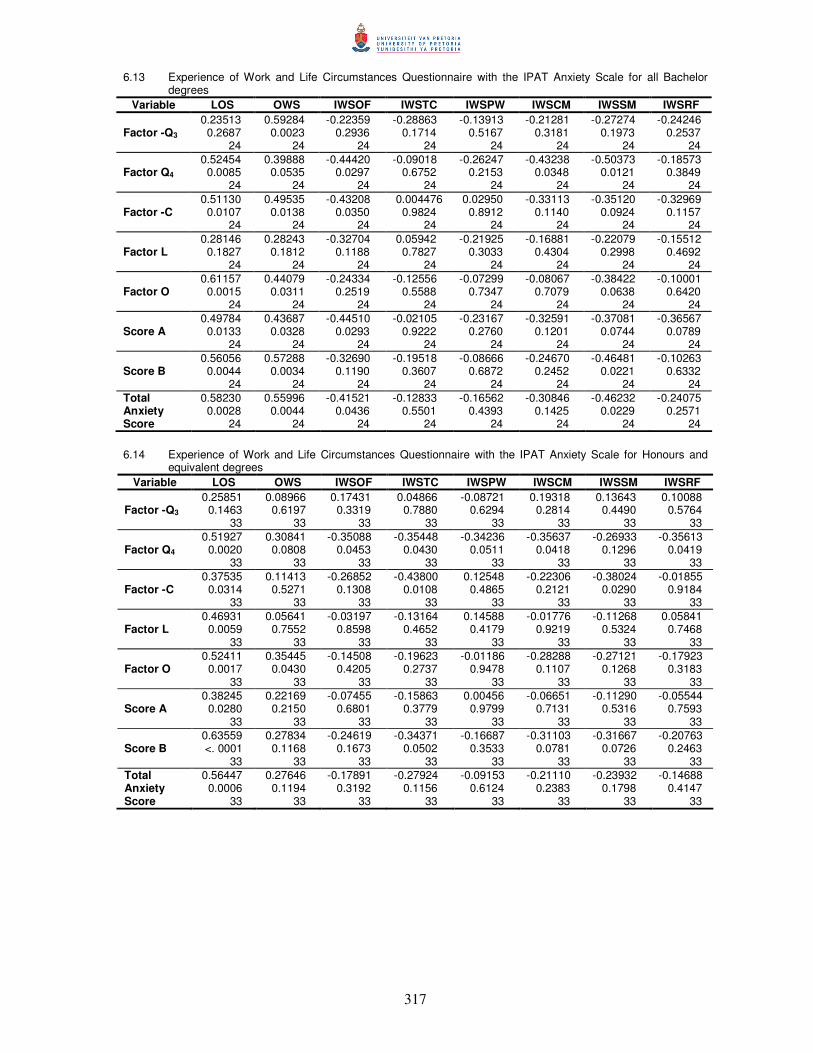
317
6.13 Experience of Work and Life Circumstances Questionnaire with the IPAT Anxiety Scale for all Bachelor degrees
Variable LOS OWS IWSOF IWSTC IWSPW IWSCM IWSSM IWSRF
Factor -Q3 0.23513 0.2687 24
0.59284 0.0023 24
-0.22359 0.2936 24
-0.28863 0.1714 24
-0.13913 0.5167 24
-0.21281 0.3181 24
-0.27274 0.1973 24
-0.24246 0.2537 24
Factor Q4 0.52454 0.0085 24
0.39888 0.0535 24
-0.44420 0.0297 24
-0.09018 0.6752 24
-0.26247 0.2153 24
-0.43238 0.0348 24
-0.50373 0.0121 24
-0.18573 0.3849 24
Factor -C 0.51130 0.0107 24
0.49535 0.0138 24
-0.43208 0.0350 24
0.004476 0.9824 24
0.02950 0.8912 24
-0.33113 0.1140 24
-0.35120 0.0924 24
-0.32969 0.1157 24
Factor L 0.28146 0.1827 24
0.28243 0.1812 24
-0.32704 0.1188 24
0.05942 0.7827 24
-0.21925 0.3033 24
-0.16881 0.4304 24
-0.22079 0.2998 24
-0.15512 0.4692 24
Factor O 0.61157 0.0015 24
0.44079 0.0311 24
-0.24334 0.2519 24
-0.12556 0.5588 24
-0.07299 0.7347 24
-0.08067 0.7079 24
-0.38422 0.0638 24
-0.10001 0.6420 24
Score A 0.49784 0.0133 24
0.43687 0.0328 24
-0.44510 0.0293 24
-0.02105 0.9222 24
-0.23167 0.2760 24
-0.32591 0.1201 24
-0.37081 0.0744 24
-0.36567 0.0789 24
Score B 0.56056 0.0044 24
0.57288 0.0034 24
-0.32690 0.1190 24
-0.19518 0.3607 24
-0.08666 0.6872 24
-0.24670 0.2452 24
-0.46481 0.0221 24
-0.10263 0.6332 24
Total Anxiety Score
0.58230 0.0028 24
0.55996 0.0044 24
-0.41521 0.0436 24
-0.12833 0.5501 24
-0.16562 0.4393 24
-0.30846 0.1425 24
-0.46232 0.0229 24
-0.24075 0.2571 24
6.14 Experience of Work and Life Circumstances Questionnaire with the IPAT Anxiety Scale for Honours and
equivalent degrees Variable LOS OWS IWSOF IWSTC IWSPW IWSCM IWSSM IWSRF
Factor -Q3 0.25851 0.1463 33
0.08966 0.6197 33
0.17431 0.3319 33
0.04866 0.7880 33
-0.08721 0.6294 33
0.19318 0.2814 33
0.13643 0.4490 33
0.10088 0.5764 33
Factor Q4 0.51927 0.0020 33
0.30841 0.0808 33
-0.35088 0.0453 33
-0.35448 0.0430 33
-0.34236 0.0511 33
-0.35637 0.0418 33
-0.26933 0.1296 33
-0.35613 0.0419 33
Factor -C 0.37535 0.0314 33
0.11413 0.5271 33
-0.26852 0.1308 33
-0.43800 0.0108 33
0.12548 0.4865 33
-0.22306 0.2121 33
-0.38024 0.0290 33
-0.01855 0.9184 33
Factor L 0.46931 0.0059 33
0.05641 0.7552 33
-0.03197 0.8598 33
-0.13164 0.4652 33
0.14588 0.4179 33
-0.01776 0.9219 33
-0.11268 0.5324 33
0.05841 0.7468 33
Factor O 0.52411 0.0017 33
0.35445 0.0430 33
-0.14508 0.4205 33
-0.19623 0.2737 33
-0.01186 0.9478 33
-0.28288 0.1107 33
-0.27121 0.1268 33
-0.17923 0.3183 33
Score A 0.38245 0.0280 33
0.22169 0.2150 33
-0.07455 0.6801 33
-0.15863 0.3779 33
0.00456 0.9799 33
-0.06651 0.7131 33
-0.11290 0.5316 33
-0.05544 0.7593 33
Score B 0.63559 <. 0001 33
0.27834 0.1168 33
-0.24619 0.1673 33
-0.34371 0.0502 33
-0.16687 0.3533 33
-0.31103 0.0781 33
-0.31667 0.0726 33
-0.20763 0.2463 33
Total Anxiety Score
0.56447 0.0006 33
0.27646 0.1194 33
-0.17891 0.3192 33
-0.27924 0.1156 33
-0.09153 0.6124 33
-0.21110 0.2383 33
-0.23932 0.1798 33
-0.14688 0.4147 33

318
6.15 Experience of Work and Life Circumstances Questionnaire with the IPAT Anxiety Scale for Masters and Doctoral degrees
Variable LOS OWS IWSOF IWSTC IWSPW IWSCM IWSSM IWSRF
Factor -Q3 0.37520 0.0031 60
0.25350 0.0507 60
-0.09153 0.4867 60
-0.11022 0.4018 60
0.02036 0.8773 60
-0.16633 0.2040 60
-0.22030 0.0908 60
0.10484 0.4253 60
Factor Q4 0.43381 0.0005 60
0.34008 0.0078 60
-0.25368 0.0505 60
-0.32749 0.0106 60
-0.15994 0.2222 60
-0.33927 0.0080 60
-0.27661 0.0324 60
-0.18255 0.1627 60
Factor -C 0.25976 0.0450 60
0.34566 0.0068 60
-0.27290 0.0349 60
-0.10810 0.4110 60
-0.14131 0.2815 60
-0.27288 0.0349 60
-0.05998 0.6490 60
-0.25549 0.0488 60
Factor L 0.16842 0.1983 60
0.15361 0.2413 60
-0.05005 0.7041 60
-0.09684 0.4617 60
-0.06585 0.6171 60
-0.12946 0.3242 60
-0.08706 0.5083 60
-0.00624 0.9623 60
Factor O 0.38570 0.0023 60
0.25276 0.0514 60
-0.05659 0.6676 60
-0.22174 0.0886 60
-0.17687 0.1764 60
-0.27430 0.0339 60
-0.19805 0.1293 60
-0.04058 0.7582 60
Score A 0.40632 0.0013 60
0.34104 0.0077 60
-0.17408 0.1834 60
-0.19799 0.1294 60
-0.12371 0.3463 60
-0.30991 0.0160 60
-0.22635 0.0820 60
-0.08854 0.5011 60
Score B 0.39542 0.0018 60
0.28971 0.0247 60
-0.15277 0.2439 60
-0.24108 0.0635 60
-0.13029 0.3211 60
-0.25931 0.0454 60
-0.20559 0.1151 60
-0.07216 0.5838 60
Total Anxiety Score
0.44747 0.0003 60
0.35205 0.0058 60
-0.18243 0.1630 60
-0.24504 0.0592 60
-0.14176 0.2799 60
-0.31770 0.0134 60
-0.24108 0.0635 60
-0.08969 0.4956 60
6.16 Experience of Work and Life Circumstances Questionnaire with the Beck Depression Inventory for Grade 12
or lower Variable LOS OWS IWSOF IWSTC IWSPW IWSCM IWSSM IWSRF
Depression 0.77312 <. 0001 54
0.67298 <. 0001 54
-0.46190 0.0004 54
-0.21842 0.1126 54
-0.09467 0.4959 54
-0.57101 <. 0001 54
-0.56965 <. 0001 54
-0.18496 0.1806 54
6.17 Experience of Work and Life Circumstances Questionnaire with the Beck Depression Inventory for all
Diplomas Variable LOS OWS IWSOF IWSTC IWSPW IWSCM IWSSM IWSRF
Depression 0.75734 <. 0001 34
0.77295 <. 0001 34
-0.29150 0.0944 34
-0.23036 0.1900 34
-0.24266 0.1667 34
-0.22090 0.2093 34
-0.45884 0.0063 34
-0.36081 0.0360 34
6.18 Experience of Work and Life Circumstances Questionnaire with the Beck Depression Inventory for all
Bachelors degrees Variable LOS OWS IWSOF IWSTC IWSPW IWSCM IWSSM IWSRF
Depression 0.43929 0.0317 24
0.52913 0.0078 24
-0.45152 0.0268 24
-0.25000 0.2387 24
-0.18291 0.3923 24
-0.33425 0.1104 24
-0.46270 0.0228 24
-0.47331 0.0195 24
6.19 Experience of Work and Life Circumstances Questionnaire with the Beck Depression Inventory for Honours
and equivalent degrees Variable LOS OWS IWSOF IWSTC IWSPW IWSCM IWSSM IWSRF
Depression 0.60602 0.0002 33
0.68953 <. 0001 33
-0.34255 0.0510 33
-0.48986 0.0038 33
-0.46691 0.0062 33
-0.49156 0.0037 33
-0.39208 0.0240 33
-0.50031 0.0030 33
6.20 Experience of Work and Life Circumstances Questionnaire with the Beck Depression Inventory for Masters
and Doctoral degrees Variable LOS OWS IWSOF IWSTC IWSPW IWSCM IWSSM IWSRF
Depression 0.61424 <. 0001 60
0.59120 <. 0001 60
-0.37275 0.0034 60
-0.35627 0.0052 60
-0.10730 0.4145 60
-0.42348 0.0007 60
-0.44585 0.0004 60
-0.22371 0.0858 60
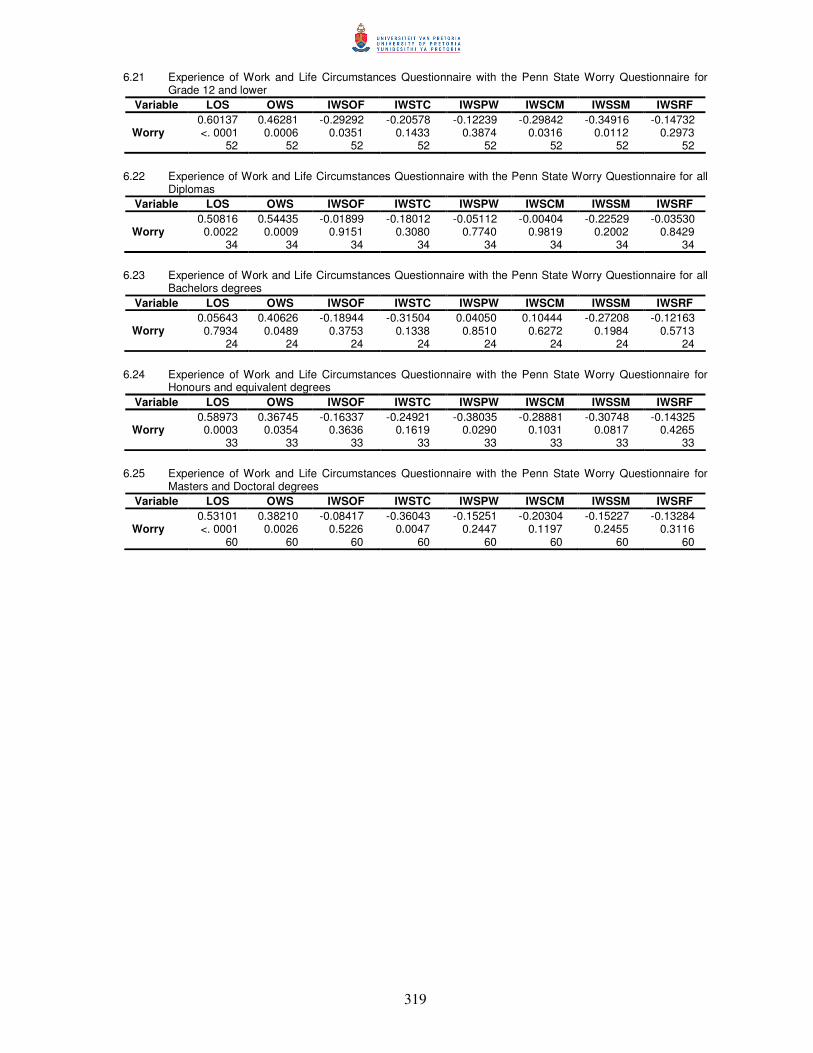
319
6.21 Experience of Work and Life Circumstances Questionnaire with the Penn State Worry Questionnaire for Grade 12 and lower
Variable LOS OWS IWSOF IWSTC IWSPW IWSCM IWSSM IWSRF
Worry 0.60137 <. 0001 52
0.46281 0.0006 52
-0.29292 0.0351 52
-0.20578 0.1433 52
-0.12239 0.3874 52
-0.29842 0.0316 52
-0.34916 0.0112 52
-0.14732 0.2973 52
6.22 Experience of Work and Life Circumstances Questionnaire with the Penn State Worry Questionnaire for all
Diplomas Variable LOS OWS IWSOF IWSTC IWSPW IWSCM IWSSM IWSRF
Worry 0.50816 0.0022 34
0.54435 0.0009 34
-0.01899 0.9151 34
-0.18012 0.3080 34
-0.05112 0.7740 34
-0.00404 0.9819 34
-0.22529 0.2002 34
-0.03530 0.8429 34
6.23 Experience of Work and Life Circumstances Questionnaire with the Penn State Worry Questionnaire for all
Bachelors degrees Variable LOS OWS IWSOF IWSTC IWSPW IWSCM IWSSM IWSRF
Worry 0.05643 0.7934 24
0.40626 0.0489 24
-0.18944 0.3753 24
-0.31504 0.1338 24
0.04050 0.8510 24
0.10444 0.6272 24
-0.27208 0.1984 24
-0.12163 0.5713 24
6.24 Experience of Work and Life Circumstances Questionnaire with the Penn State Worry Questionnaire for
Honours and equivalent degrees Variable LOS OWS IWSOF IWSTC IWSPW IWSCM IWSSM IWSRF
Worry 0.58973 0.0003 33
0.36745 0.0354 33
-0.16337 0.3636 33
-0.24921 0.1619 33
-0.38035 0.0290 33
-0.28881 0.1031 33
-0.30748 0.0817 33
-0.14325 0.4265 33
6.25 Experience of Work and Life Circumstances Questionnaire with the Penn State Worry Questionnaire for
Masters and Doctoral degrees Variable LOS OWS IWSOF IWSTC IWSPW IWSCM IWSSM IWSRF
Worry 0.53101 <. 0001 60
0.38210 0.0026 60
-0.08417 0.5226 60
-0.36043 0.0047 60
-0.15251 0.2447 60
-0.20304 0.1197 60
-0.15227 0.2455 60
-0.13284 0.3116 60

320
6.26 Experience of Work and Life Circumstances Questionnaire with the Social Problem-Solving Questionnaire-Revised for Grade 12 and lower
Variable LOS OWS IWSOF IWSTC IWSPW IWSCM IWSSM IWSRF Positive Problem Orientation
-0.46221 0.0004 54
-0.57220 <. 0001 54
0.07770 0.5766 54
0.38291 0.0043 54
0.15234 0.2715 54
0.18060 0.1913 54
0.37001 0.0059 54
-0.02713 0.8456 54
Negative Problem Orientation
0.69561 <. 0001 54
0.60062 <. 0001 54
-0.29214 0.0321 54
-0.26768 0.0504 54
-0.20196 0.1431 54
-0.35139 0.0092 54
-0.36690 0.0064 54
-0.10582 0.4463 54
Rational Problem Solving
-0.42028 0.0016 54
-0.52764 <. 0001 54
0.23357 0.0892 54
0.25649 0.0612 54
0.25203 0.0660 54
0.36211 0.0071 54
0.42282 0.0014 54
0.13684 0.3238 54
Problem Definition and Formulation
-0.44302 0.0008 54
-0.57497 <. 0001 54
0.25150 0.0666 54
0.29282 0.0317 54
0.25795 0.0597 54
0.42101 0.0015 54
0.44898 0.0007 54
0.16172 0.2427 54
Generation of Alternatives
-0.37951 0.0047 54
-0.43777 0.0009 54
0.13216 0.3408 54
0.21575 0.1171 54
0.20466 0.1377 54
0.24691 0.0719 54
0.33885 0.0122 54
0.04205 0.7627 54
Decision Making
-0.42240 0.0015 54
-0.48668 0.0002 54
0.32348 0.0170 54
0.32320 0.0171 54
0.23135 0.0923 54
0.42637 0.0013 54
0.48743 0.0002 54
0.17445 0.2071 54
Solution Implementation Verification
-0.27673 0.0428 54
-0.40661 0.0023 54
0.13900 0.3161 54
0.10063 0.4691 54
0.21548 0.1176 54
0.21690 0.1152 54
0.25669 0.0610 54
0.11489 0.4081 54
Impulsivity/ Carelessness Style
0.38712 0.0038 54
0.25154 0.0665 54
-0.13716 0.3226 54
-0.00206 0.9882 54
0.14912 0.2819 54
-0.21170 0.1244 54
-0.11469 0.4089 54
0.13684 0.3238 54
Avoidance Style
0.33763 0.0125 54
0.32263 0.0173 54
-0.15114 0.2753 54
-0.15822 0.2532 54
0.07128 0.6085 54
-0.13384 0.3346 54
-0.20094 0.1451 54
-0.06888 0.6207 54
Social Problem Solving
-0.61441 <. 0001 54
-0.61096 <. 0001 54
0.23454 0.0878 54
0.29090 0.0328 54
0.10748 0.4392 54
0.32861 0.0153 54
0.39637 0.0030 54
0.03812 0.7843 54
6.27 Experience of Work and Life Circumstances Questionnaire with the Social Problem-Solving Questionnaire-
Revised for all Diplomas Variable LOS OWS IWSOF IWSTC IWSPW IWSCM IWSSM IWSRF
Positive Problem Orientation
0.04004 0.8193 35
-0.14797 0.3963 35
0.01741 0.9209 35
0.07969 0.6491 35
-0.04584 0.7937 35
0.08337 0.6340 35
0.14172 0.4167 35
-0.11520 0.5099 35
Negative Problem Orientation
0.56470 0.0004 35
0.55205 0.0006 35
-0.16732 0.3367 35
-0.15950 0.3601 35
-0.20179 0.2451 35
-0.15336 0.3791 35
-0.13954 0.4240 35
-0.03652 0.8350 35
Rational Problem Solving
0.14702 0.3994 35
-0.01431 0.9350 35
0.05775 0.7417 35
0.14943 0.3916 35
-0.05661 0.7467 35
0.07618 0.6636 35
0.29890 0.0811 35
-0.01022 0.9535 35
Problem Definition and Formulation
0.13278 0.4470 35
-0.04549 0.7953 35
0.10215 0.5593 35
0.12184 0.4856 35
-0.02838 0.8714 35
0.07303 0.6767 35
0.34792 0.0406 35
0.00709 0.9678 35
Generation of Alternatives
0.17797 0.3064 35
0.03068 0.8611 35
-0.05065 0.7726 35
0.05335 0.7608 35
-0.17357 0.3187 35
0.01446 0.9343 35
0.18377 0.2906 35
-0.15400 0.3771 35
Decision Making
0.13905 0.4257 35
0.03405 0.8460 35
-0.05041 0.7736 35
0.15238 0.3822 35
-0.17611 0.3115 35
-0.01235 0.9439 35
0.22734 0.1891 35
0.04008 0.8192 35
Solution Implementation Verification
0.09918 0.5708 35
-0.06105 0.7275 35
0.18614 0.2843 35
0.21722 0.2100 35
0.13565 0.4372 35
0.18674 0.2828 35
0.33192 0.0514 35
0.06184 0.7242 35
Impulsivity/ Carelessness Style
0.24091 0.1633 35
0.39284 0.0196 35
0.06923 0.6927 35
0.00516 0.9765 35
0.12681 0.4679 35
0.08332 0.6342 35
-0.32515 0.0567 35
0.01202 0.9453 35
Avoidance Style
0.28115 0.1018 35
-0.44985 0.0067 35
-0.06677 0.7031 35
-0.05527 0.7525 35
-0.07731 0.6589 35
-0.09913 0.5710 35
-0.06140 0.7261 35
0.12931 0.4591 35
Social Problem Solving
-0.23898 0.1668 35
-0.43203 0.0096 35
0.08136 0.6422 35
0.14455 0.4074 35
0.01757 0.9202 35
0.10937 0.5317 35
0.28694 0.0947 35
-0.06263 0.7208 35
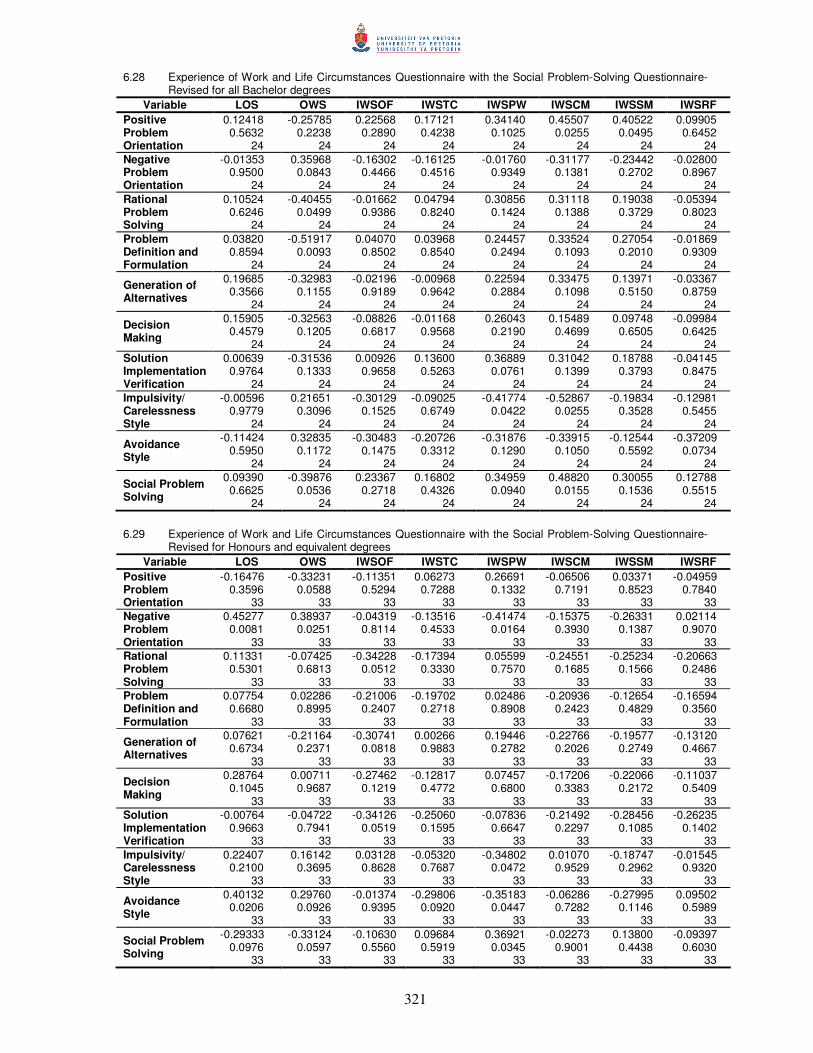
321
6.28 Experience of Work and Life Circumstances Questionnaire with the Social Problem-Solving Questionnaire-Revised for all Bachelor degrees
Variable LOS OWS IWSOF IWSTC IWSPW IWSCM IWSSM IWSRF Positive Problem Orientation
0.12418 0.5632 24
-0.25785 0.2238 24
0.22568 0.2890 24
0.17121 0.4238 24
0.34140 0.1025 24
0.45507 0.0255 24
0.40522 0.0495 24
0.09905 0.6452 24
Negative Problem Orientation
-0.01353 0.9500 24
0.35968 0.0843 24
-0.16302 0.4466 24
-0.16125 0.4516 24
-0.01760 0.9349 24
-0.31177 0.1381 24
-0.23442 0.2702 24
-0.02800 0.8967 24
Rational Problem Solving
0.10524 0.6246 24
-0.40455 0.0499 24
-0.01662 0.9386 24
0.04794 0.8240 24
0.30856 0.1424 24
0.31118 0.1388 24
0.19038 0.3729 24
-0.05394 0.8023 24
Problem Definition and Formulation
0.03820 0.8594 24
-0.51917 0.0093 24
0.04070 0.8502 24
0.03968 0.8540 24
0.24457 0.2494 24
0.33524 0.1093 24
0.27054 0.2010 24
-0.01869 0.9309 24
Generation of Alternatives
0.19685 0.3566 24
-0.32983 0.1155 24
-0.02196 0.9189 24
-0.00968 0.9642 24
0.22594 0.2884 24
0.33475 0.1098 24
0.13971 0.5150 24
-0.03367 0.8759 24
Decision Making
0.15905 0.4579 24
-0.32563 0.1205 24
-0.08826 0.6817 24
-0.01168 0.9568 24
0.26043 0.2190 24
0.15489 0.4699 24
0.09748 0.6505 24
-0.09984 0.6425 24
Solution Implementation Verification
0.00639 0.9764 24
-0.31536 0.1333 24
0.00926 0.9658 24
0.13600 0.5263 24
0.36889 0.0761 24
0.31042 0.1399 24
0.18788 0.3793 24
-0.04145 0.8475 24
Impulsivity/ Carelessness Style
-0.00596 0.9779 24
0.21651 0.3096 24
-0.30129 0.1525 24
-0.09025 0.6749 24
-0.41774 0.0422 24
-0.52867 0.0255 24
-0.19834 0.3528 24
-0.12981 0.5455 24
Avoidance Style
-0.11424 0.5950 24
0.32835 0.1172 24
-0.30483 0.1475 24
-0.20726 0.3312 24
-0.31876 0.1290 24
-0.33915 0.1050 24
-0.12544 0.5592 24
-0.37209 0.0734 24
Social Problem Solving
0.09390 0.6625 24
-0.39876 0.0536 24
0.23367 0.2718 24
0.16802 0.4326 24
0.34959 0.0940 24
0.48820 0.0155 24
0.30055 0.1536 24
0.12788 0.5515 24
6.29 Experience of Work and Life Circumstances Questionnaire with the Social Problem-Solving Questionnaire-
Revised for Honours and equivalent degrees Variable LOS OWS IWSOF IWSTC IWSPW IWSCM IWSSM IWSRF
Positive Problem Orientation
-0.16476 0.3596 33
-0.33231 0.0588 33
-0.11351 0.5294 33
0.06273 0.7288 33
0.26691 0.1332 33
-0.06506 0.7191 33
0.03371 0.8523 33
-0.04959 0.7840 33
Negative Problem Orientation
0.45277 0.0081 33
0.38937 0.0251 33
-0.04319 0.8114 33
-0.13516 0.4533 33
-0.41474 0.0164 33
-0.15375 0.3930 33
-0.26331 0.1387 33
0.02114 0.9070 33
Rational Problem Solving
0.11331 0.5301 33
-0.07425 0.6813 33
-0.34228 0.0512 33
-0.17394 0.3330 33
0.05599 0.7570 33
-0.24551 0.1685 33
-0.25234 0.1566 33
-0.20663 0.2486 33
Problem Definition and Formulation
0.07754 0.6680 33
0.02286 0.8995 33
-0.21006 0.2407 33
-0.19702 0.2718 33
0.02486 0.8908 33
-0.20936 0.2423 33
-0.12654 0.4829 33
-0.16594 0.3560 33
Generation of Alternatives
0.07621 0.6734 33
-0.21164 0.2371 33
-0.30741 0.0818 33
0.00266 0.9883 33
0.19446 0.2782 33
-0.22766 0.2026 33
-0.19577 0.2749 33
-0.13120 0.4667 33
Decision Making
0.28764 0.1045 33
0.00711 0.9687 33
-0.27462 0.1219 33
-0.12817 0.4772 33
0.07457 0.6800 33
-0.17206 0.3383 33
-0.22066 0.2172 33
-0.11037 0.5409 33
Solution Implementation Verification
-0.00764 0.9663 33
-0.04722 0.7941 33
-0.34126 0.0519 33
-0.25060 0.1595 33
-0.07836 0.6647 33
-0.21492 0.2297 33
-0.28456 0.1085 33
-0.26235 0.1402 33
Impulsivity/ Carelessness Style
0.22407 0.2100 33
0.16142 0.3695 33
0.03128 0.8628 33
-0.05320 0.7687 33
-0.34802 0.0472 33
0.01070 0.9529 33
-0.18747 0.2962 33
-0.01545 0.9320 33
Avoidance Style
0.40132 0.0206 33
0.29760 0.0926 33
-0.01374 0.9395 33
-0.29806 0.0920 33
-0.35183 0.0447 33
-0.06286 0.7282 33
-0.27995 0.1146 33
0.09502 0.5989 33
Social Problem Solving
-0.29333 0.0976 33
-0.33124 0.0597 33
-0.10630 0.5560 33
0.09684 0.5919 33
0.36921 0.0345 33
-0.02273 0.9001 33
0.13800 0.4438 33
-0.09397 0.6030 33
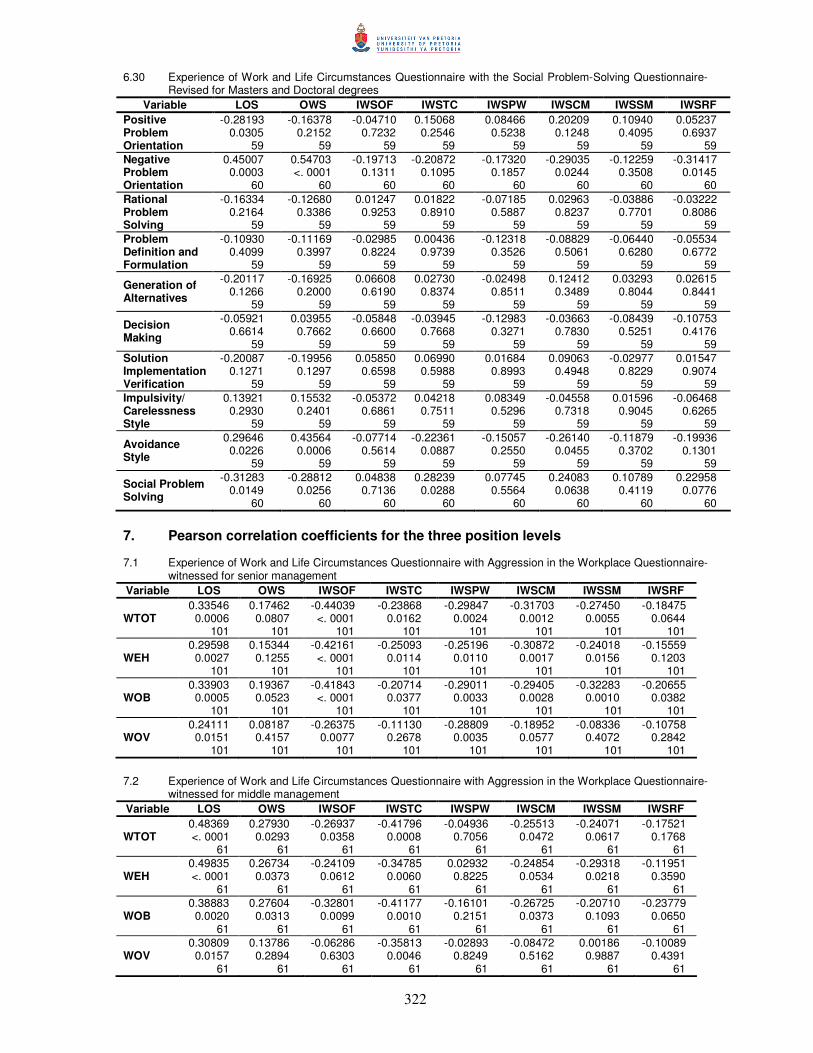
322
6.30 Experience of Work and Life Circumstances Questionnaire with the Social Problem-Solving Questionnaire-Revised for Masters and Doctoral degrees
Variable LOS OWS IWSOF IWSTC IWSPW IWSCM IWSSM IWSRF Positive Problem Orientation
-0.28193 0.0305 59
-0.16378 0.2152 59
-0.04710 0.7232 59
0.15068 0.2546 59
0.08466 0.5238 59
0.20209 0.1248 59
0.10940 0.4095 59
0.05237 0.6937 59
Negative Problem Orientation
0.45007 0.0003 60
0.54703 <. 0001 60
-0.19713 0.1311 60
-0.20872 0.1095 60
-0.17320 0.1857 60
-0.29035 0.0244 60
-0.12259 0.3508 60
-0.31417 0.0145 60
Rational Problem Solving
-0.16334 0.2164 59
-0.12680 0.3386 59
0.01247 0.9253 59
0.01822 0.8910 59
-0.07185 0.5887 59
0.02963 0.8237 59
-0.03886 0.7701 59
-0.03222 0.8086 59
Problem Definition and Formulation
-0.10930 0.4099 59
-0.11169 0.3997 59
-0.02985 0.8224 59
0.00436 0.9739 59
-0.12318 0.3526 59
-0.08829 0.5061 59
-0.06440 0.6280 59
-0.05534 0.6772 59
Generation of Alternatives
-0.20117 0.1266 59
-0.16925 0.2000 59
0.06608 0.6190 59
0.02730 0.8374 59
-0.02498 0.8511 59
0.12412 0.3489 59
0.03293 0.8044 59
0.02615 0.8441 59
Decision Making
-0.05921 0.6614 59
0.03955 0.7662 59
-0.05848 0.6600 59
-0.03945 0.7668 59
-0.12983 0.3271 59
-0.03663 0.7830 59
-0.08439 0.5251 59
-0.10753 0.4176 59
Solution Implementation Verification
-0.20087 0.1271 59
-0.19956 0.1297 59
0.05850 0.6598 59
0.06990 0.5988 59
0.01684 0.8993 59
0.09063 0.4948 59
-0.02977 0.8229 59
0.01547 0.9074 59
Impulsivity/ Carelessness Style
0.13921 0.2930 59
0.15532 0.2401 59
-0.05372 0.6861 59
0.04218 0.7511 59
0.08349 0.5296 59
-0.04558 0.7318 59
0.01596 0.9045 59
-0.06468 0.6265 59
Avoidance Style
0.29646 0.0226 59
0.43564 0.0006 59
-0.07714 0.5614 59
-0.22361 0.0887 59
-0.15057 0.2550 59
-0.26140 0.0455 59
-0.11879 0.3702 59
-0.19936 0.1301 59
Social Problem Solving
-0.31283 0.0149 60
-0.28812 0.0256 60
0.04838 0.7136 60
0.28239 0.0288 60
0.07745 0.5564 60
0.24083 0.0638 60
0.10789 0.4119 60
0.22958 0.0776 60
7. Pearson correlation coefficients for the three position levels 7.1 Experience of Work and Life Circumstances Questionnaire with Aggression in the Workplace Questionnaire-
witnessed for senior management Variable LOS OWS IWSOF IWSTC IWSPW IWSCM IWSSM IWSRF
WTOT 0.33546 0.0006 101
0.17462 0.0807 101
-0.44039 <. 0001 101
-0.23868 0.0162 101
-0.29847 0.0024 101
-0.31703 0.0012 101
-0.27450 0.0055 101
-0.18475 0.0644 101
WEH 0.29598 0.0027 101
0.15344 0.1255 101
-0.42161 <. 0001 101
-0.25093 0.0114 101
-0.25196 0.0110 101
-0.30872 0.0017 101
-0.24018 0.0156 101
-0.15559 0.1203 101
WOB 0.33903 0.0005 101
0.19367 0.0523 101
-0.41843 <. 0001 101
-0.20714 0.0377 101
-0.29011 0.0033 101
-0.29405 0.0028 101
-0.32283 0.0010 101
-0.20655 0.0382 101
WOV 0.24111 0.0151 101
0.08187 0.4157 101
-0.26375 0.0077 101
-0.11130 0.2678 101
-0.28809 0.0035 101
-0.18952 0.0577 101
-0.08336 0.4072 101
-0.10758 0.2842 101
7.2 Experience of Work and Life Circumstances Questionnaire with Aggression in the Workplace Questionnaire-
witnessed for middle management Variable LOS OWS IWSOF IWSTC IWSPW IWSCM IWSSM IWSRF
WTOT 0.48369 <. 0001 61
0.27930 0.0293 61
-0.26937 0.0358 61
-0.41796 0.0008 61
-0.04936 0.7056 61
-0.25513 0.0472 61
-0.24071 0.0617 61
-0.17521 0.1768 61
WEH 0.49835 <. 0001 61
0.26734 0.0373 61
-0.24109 0.0612 61
-0.34785 0.0060 61
0.02932 0.8225 61
-0.24854 0.0534 61
-0.29318 0.0218 61
-0.11951 0.3590 61
WOB 0.38883 0.0020 61
0.27604 0.0313 61
-0.32801 0.0099 61
-0.41177 0.0010 61
-0.16101 0.2151 61
-0.26725 0.0373 61
-0.20710 0.1093 61
-0.23779 0.0650 61
WOV 0.30809 0.0157 61
0.13786 0.2894 61
-0.06286 0.6303 61
-0.35813 0.0046 61
-0.02893 0.8249 61
-0.08472 0.5162 61
0.00186 0.9887 61
-0.10089 0.4391 61
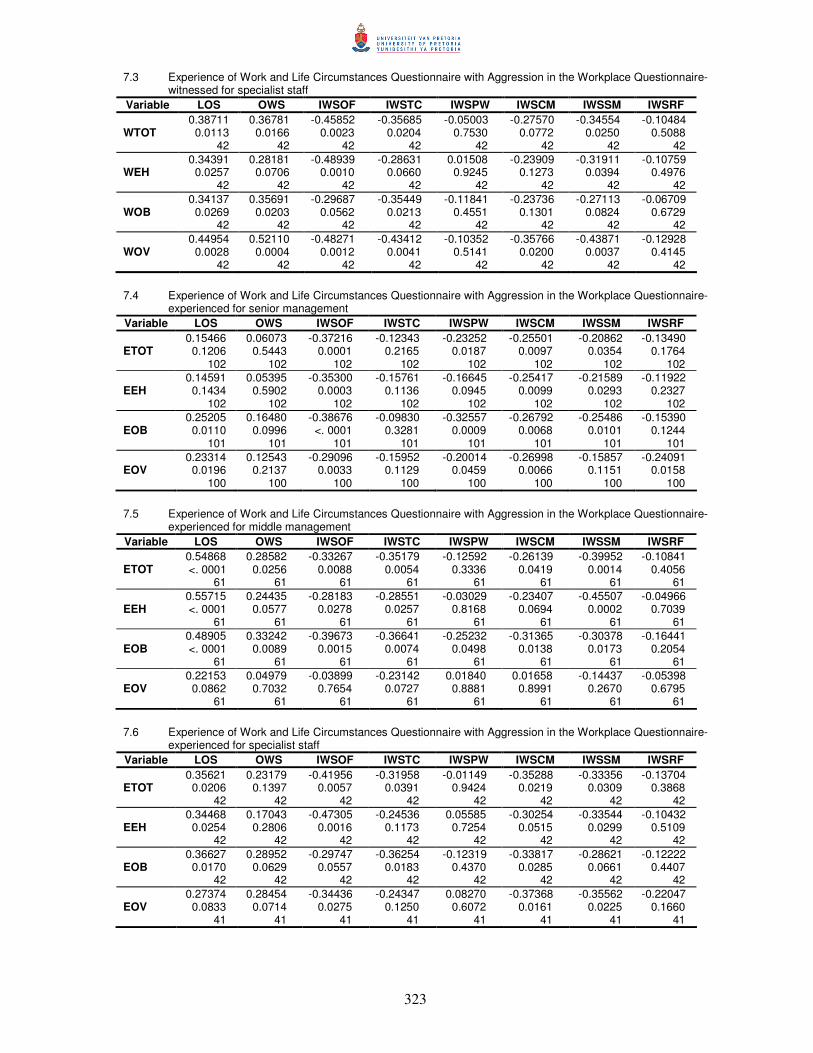
323
7.3 Experience of Work and Life Circumstances Questionnaire with Aggression in the Workplace Questionnaire-witnessed for specialist staff
Variable LOS OWS IWSOF IWSTC IWSPW IWSCM IWSSM IWSRF
WTOT 0.38711 0.0113 42
0.36781 0.0166 42
-0.45852 0.0023 42
-0.35685 0.0204 42
-0.05003 0.7530 42
-0.27570 0.0772 42
-0.34554 0.0250 42
-0.10484 0.5088 42
WEH 0.34391 0.0257 42
0.28181 0.0706 42
-0.48939 0.0010 42
-0.28631 0.0660 42
0.01508 0.9245 42
-0.23909 0.1273 42
-0.31911 0.0394 42
-0.10759 0.4976 42
WOB 0.34137 0.0269 42
0.35691 0.0203 42
-0.29687 0.0562 42
-0.35449 0.0213 42
-0.11841 0.4551 42
-0.23736 0.1301 42
-0.27113 0.0824 42
-0.06709 0.6729 42
WOV 0.44954 0.0028 42
0.52110 0.0004 42
-0.48271 0.0012 42
-0.43412 0.0041 42
-0.10352 0.5141 42
-0.35766 0.0200 42
-0.43871 0.0037 42
-0.12928 0.4145 42
7.4 Experience of Work and Life Circumstances Questionnaire with Aggression in the Workplace Questionnaire-
experienced for senior management Variable LOS OWS IWSOF IWSTC IWSPW IWSCM IWSSM IWSRF
ETOT 0.15466 0.1206 102
0.06073 0.5443 102
-0.37216 0.0001 102
-0.12343 0.2165 102
-0.23252 0.0187 102
-0.25501 0.0097 102
-0.20862 0.0354 102
-0.13490 0.1764 102
EEH 0.14591 0.1434 102
0.05395 0.5902 102
-0.35300 0.0003 102
-0.15761 0.1136 102
-0.16645 0.0945 102
-0.25417 0.0099 102
-0.21589 0.0293 102
-0.11922 0.2327 102
EOB 0.25205 0.0110 101
0.16480 0.0996 101
-0.38676 <. 0001 101
-0.09830 0.3281 101
-0.32557 0.0009 101
-0.26792 0.0068 101
-0.25486 0.0101 101
-0.15390 0.1244 101
EOV 0.23314 0.0196 100
0.12543 0.2137 100
-0.29096 0.0033 100
-0.15952 0.1129 100
-0.20014 0.0459 100
-0.26998 0.0066 100
-0.15857 0.1151 100
-0.24091 0.0158 100
7.5 Experience of Work and Life Circumstances Questionnaire with Aggression in the Workplace Questionnaire-
experienced for middle management Variable LOS OWS IWSOF IWSTC IWSPW IWSCM IWSSM IWSRF
ETOT 0.54868 <. 0001 61
0.28582 0.0256 61
-0.33267 0.0088 61
-0.35179 0.0054 61
-0.12592 0.3336 61
-0.26139 0.0419 61
-0.39952 0.0014 61
-0.10841 0.4056 61
EEH 0.55715 <. 0001 61
0.24435 0.0577 61
-0.28183 0.0278 61
-0.28551 0.0257 61
-0.03029 0.8168 61
-0.23407 0.0694 61
-0.45507 0.0002 61
-0.04966 0.7039 61
EOB 0.48905 <. 0001 61
0.33242 0.0089 61
-0.39673 0.0015 61
-0.36641 0.0074 61
-0.25232 0.0498 61
-0.31365 0.0138 61
-0.30378 0.0173 61
-0.16441 0.2054 61
EOV 0.22153 0.0862 61
0.04979 0.7032 61
-0.03899 0.7654 61
-0.23142 0.0727 61
0.01840 0.8881 61
0.01658 0.8991 61
-0.14437 0.2670 61
-0.05398 0.6795 61
7.6 Experience of Work and Life Circumstances Questionnaire with Aggression in the Workplace Questionnaire-
experienced for specialist staff Variable LOS OWS IWSOF IWSTC IWSPW IWSCM IWSSM IWSRF
ETOT 0.35621 0.0206 42
0.23179 0.1397 42
-0.41956 0.0057 42
-0.31958 0.0391 42
-0.01149 0.9424 42
-0.35288 0.0219 42
-0.33356 0.0309 42
-0.13704 0.3868 42
EEH 0.34468 0.0254 42
0.17043 0.2806 42
-0.47305 0.0016 42
-0.24536 0.1173 42
0.05585 0.7254 42
-0.30254 0.0515 42
-0.33544 0.0299 42
-0.10432 0.5109 42
EOB 0.36627 0.0170 42
0.28952 0.0629 42
-0.29747 0.0557 42
-0.36254 0.0183 42
-0.12319 0.4370 42
-0.33817 0.0285 42
-0.28621 0.0661 42
-0.12222 0.4407 42
EOV 0.27374 0.0833 41
0.28454 0.0714 41
-0.34436 0.0275 41
-0.24347 0.1250 41
0.08270 0.6072 41
-0.37368 0.0161 41
-0.35562 0.0225 41
-0.22047 0.1660 41
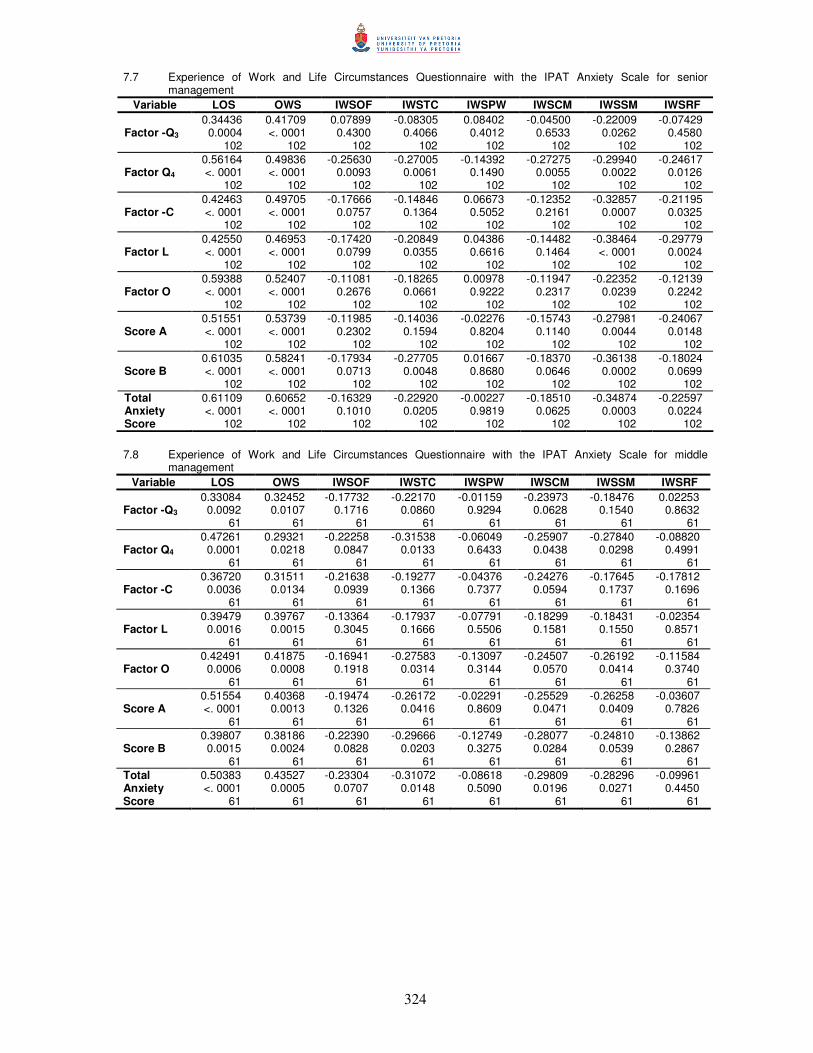
324
7.7 Experience of Work and Life Circumstances Questionnaire with the IPAT Anxiety Scale for senior management
Variable LOS OWS IWSOF IWSTC IWSPW IWSCM IWSSM IWSRF
Factor -Q3 0.34436 0.0004 102
0.41709 <. 0001 102
0.07899 0.4300 102
-0.08305 0.4066 102
0.08402 0.4012 102
-0.04500 0.6533 102
-0.22009 0.0262 102
-0.07429 0.4580 102
Factor Q4 0.56164 <. 0001 102
0.49836 <. 0001 102
-0.25630 0.0093 102
-0.27005 0.0061 102
-0.14392 0.1490 102
-0.27275 0.0055 102
-0.29940 0.0022 102
-0.24617 0.0126 102
Factor -C 0.42463 <. 0001 102
0.49705 <. 0001 102
-0.17666 0.0757 102
-0.14846 0.1364 102
0.06673 0.5052 102
-0.12352 0.2161 102
-0.32857 0.0007 102
-0.21195 0.0325 102
Factor L 0.42550 <. 0001 102
0.46953 <. 0001 102
-0.17420 0.0799 102
-0.20849 0.0355 102
0.04386 0.6616 102
-0.14482 0.1464 102
-0.38464 <. 0001 102
-0.29779 0.0024 102
Factor O 0.59388 <. 0001 102
0.52407 <. 0001 102
-0.11081 0.2676 102
-0.18265 0.0661 102
0.00978 0.9222 102
-0.11947 0.2317 102
-0.22352 0.0239 102
-0.12139 0.2242 102
Score A 0.51551 <. 0001 102
0.53739 <. 0001 102
-0.11985 0.2302 102
-0.14036 0.1594 102
-0.02276 0.8204 102
-0.15743 0.1140 102
-0.27981 0.0044 102
-0.24067 0.0148 102
Score B 0.61035 <. 0001 102
0.58241 <. 0001 102
-0.17934 0.0713 102
-0.27705 0.0048 102
0.01667 0.8680 102
-0.18370 0.0646 102
-0.36138 0.0002 102
-0.18024 0.0699 102
Total Anxiety Score
0.61109 <. 0001 102
0.60652 <. 0001 102
-0.16329 0.1010 102
-0.22920 0.0205 102
-0.00227 0.9819 102
-0.18510 0.0625 102
-0.34874 0.0003 102
-0.22597 0.0224 102
7.8 Experience of Work and Life Circumstances Questionnaire with the IPAT Anxiety Scale for middle
management Variable LOS OWS IWSOF IWSTC IWSPW IWSCM IWSSM IWSRF
Factor -Q3 0.33084 0.0092 61
0.32452 0.0107 61
-0.17732 0.1716 61
-0.22170 0.0860 61
-0.01159 0.9294 61
-0.23973 0.0628 61
-0.18476 0.1540 61
0.02253 0.8632 61
Factor Q4 0.47261 0.0001 61
0.29321 0.0218 61
-0.22258 0.0847 61
-0.31538 0.0133 61
-0.06049 0.6433 61
-0.25907 0.0438 61
-0.27840 0.0298 61
-0.08820 0.4991 61
Factor -C 0.36720 0.0036 61
0.31511 0.0134 61
-0.21638 0.0939 61
-0.19277 0.1366 61
-0.04376 0.7377 61
-0.24276 0.0594 61
-0.17645 0.1737 61
-0.17812 0.1696 61
Factor L 0.39479 0.0016 61
0.39767 0.0015 61
-0.13364 0.3045 61
-0.17937 0.1666 61
-0.07791 0.5506 61
-0.18299 0.1581 61
-0.18431 0.1550 61
-0.02354 0.8571 61
Factor O 0.42491 0.0006 61
0.41875 0.0008 61
-0.16941 0.1918 61
-0.27583 0.0314 61
-0.13097 0.3144 61
-0.24507 0.0570 61
-0.26192 0.0414 61
-0.11584 0.3740 61
Score A 0.51554 <. 0001 61
0.40368 0.0013 61
-0.19474 0.1326 61
-0.26172 0.0416 61
-0.02291 0.8609 61
-0.25529 0.0471 61
-0.26258 0.0409 61
-0.03607 0.7826 61
Score B 0.39807 0.0015 61
0.38186 0.0024 61
-0.22390 0.0828 61
-0.29666 0.0203 61
-0.12749 0.3275 61
-0.28077 0.0284 61
-0.24810 0.0539 61
-0.13862 0.2867 61
Total Anxiety Score
0.50383 <. 0001 61
0.43527 0.0005 61
-0.23304 0.0707 61
-0.31072 0.0148 61
-0.08618 0.5090 61
-0.29809 0.0196 61
-0.28296 0.0271 61
-0.09961 0.4450 61
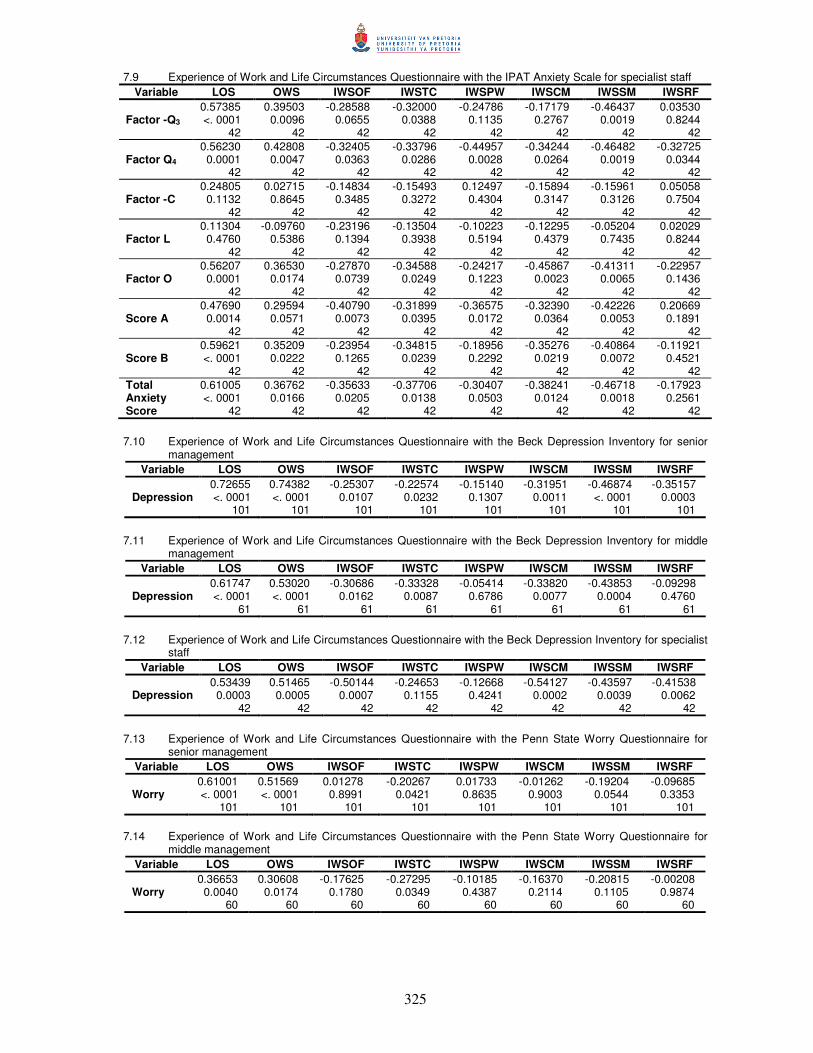
325
7.9 Experience of Work and Life Circumstances Questionnaire with the IPAT Anxiety Scale for specialist staff Variable LOS OWS IWSOF IWSTC IWSPW IWSCM IWSSM IWSRF
Factor -Q3 0.57385 <. 0001 42
0.39503 0.0096 42
-0.28588 0.0655 42
-0.32000 0.0388 42
-0.24786 0.1135 42
-0.17179 0.2767 42
-0.46437 0.0019 42
0.03530 0.8244 42
Factor Q4 0.56230 0.0001 42
0.42808 0.0047 42
-0.32405 0.0363 42
-0.33796 0.0286 42
-0.44957 0.0028 42
-0.34244 0.0264 42
-0.46482 0.0019 42
-0.32725 0.0344 42
Factor -C 0.24805 0.1132 42
0.02715 0.8645 42
-0.14834 0.3485 42
-0.15493 0.3272 42
0.12497 0.4304 42
-0.15894 0.3147 42
-0.15961 0.3126 42
0.05058 0.7504 42
Factor L 0.11304 0.4760 42
-0.09760 0.5386 42
-0.23196 0.1394 42
-0.13504 0.3938 42
-0.10223 0.5194 42
-0.12295 0.4379 42
-0.05204 0.7435 42
0.02029 0.8244 42
Factor O 0.56207 0.0001 42
0.36530 0.0174 42
-0.27870 0.0739 42
-0.34588 0.0249 42
-0.24217 0.1223 42
-0.45867 0.0023 42
-0.41311 0.0065 42
-0.22957 0.1436 42
Score A 0.47690 0.0014 42
0.29594 0.0571 42
-0.40790 0.0073 42
-0.31899 0.0395 42
-0.36575 0.0172 42
-0.32390 0.0364 42
-0.42226 0.0053 42
0.20669 0.1891 42
Score B 0.59621 <. 0001 42
0.35209 0.0222 42
-0.23954 0.1265 42
-0.34815 0.0239 42
-0.18956 0.2292 42
-0.35276 0.0219 42
-0.40864 0.0072 42
-0.11921 0.4521 42
Total Anxiety Score
0.61005 <. 0001 42
0.36762 0.0166 42
-0.35633 0.0205 42
-0.37706 0.0138 42
-0.30407 0.0503 42
-0.38241 0.0124 42
-0.46718 0.0018 42
-0.17923 0.2561 42
7.10 Experience of Work and Life Circumstances Questionnaire with the Beck Depression Inventory for senior
management Variable LOS OWS IWSOF IWSTC IWSPW IWSCM IWSSM IWSRF
Depression 0.72655 <. 0001 101
0.74382 <. 0001 101
-0.25307 0.0107 101
-0.22574 0.0232 101
-0.15140 0.1307 101
-0.31951 0.0011 101
-0.46874 <. 0001 101
-0.35157 0.0003 101
7.11 Experience of Work and Life Circumstances Questionnaire with the Beck Depression Inventory for middle
management Variable LOS OWS IWSOF IWSTC IWSPW IWSCM IWSSM IWSRF
Depression 0.61747 <. 0001 61
0.53020 <. 0001 61
-0.30686 0.0162 61
-0.33328 0.0087 61
-0.05414 0.6786 61
-0.33820 0.0077 61
-0.43853 0.0004 61
-0.09298 0.4760 61
7.12 Experience of Work and Life Circumstances Questionnaire with the Beck Depression Inventory for specialist
staff Variable LOS OWS IWSOF IWSTC IWSPW IWSCM IWSSM IWSRF
Depression 0.53439 0.0003 42
0.51465 0.0005 42
-0.50144 0.0007 42
-0.24653 0.1155 42
-0.12668 0.4241 42
-0.54127 0.0002 42
-0.43597 0.0039 42
-0.41538 0.0062 42
7.13 Experience of Work and Life Circumstances Questionnaire with the Penn State Worry Questionnaire for
senior management Variable LOS OWS IWSOF IWSTC IWSPW IWSCM IWSSM IWSRF
Worry 0.61001 <. 0001 101
0.51569 <. 0001 101
0.01278 0.8991 101
-0.20267 0.0421 101
0.01733 0.8635 101
-0.01262 0.9003 101
-0.19204 0.0544 101
-0.09685 0.3353 101
7.14 Experience of Work and Life Circumstances Questionnaire with the Penn State Worry Questionnaire for
middle management Variable LOS OWS IWSOF IWSTC IWSPW IWSCM IWSSM IWSRF
Worry 0.36653 0.0040 60
0.30608 0.0174 60
-0.17625 0.1780 60
-0.27295 0.0349 60
-0.10185 0.4387 60
-0.16370 0.2114 60
-0.20815 0.1105 60
-0.00208 0.9874 60
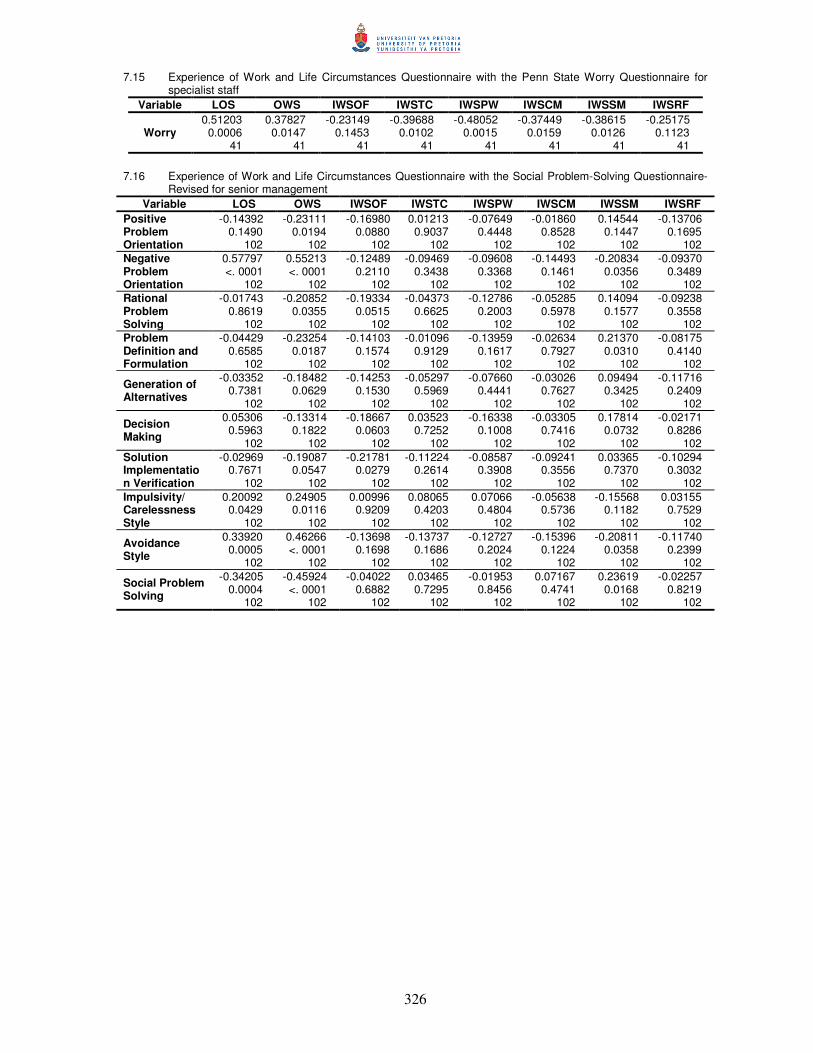
326
7.15 Experience of Work and Life Circumstances Questionnaire with the Penn State Worry Questionnaire for specialist staff
Variable LOS OWS IWSOF IWSTC IWSPW IWSCM IWSSM IWSRF
Worry 0.51203 0.0006 41
0.37827 0.0147 41
-0.23149 0.1453 41
-0.39688 0.0102 41
-0.48052 0.0015 41
-0.37449 0.0159 41
-0.38615 0.0126 41
-0.25175 0.1123 41
7.16 Experience of Work and Life Circumstances Questionnaire with the Social Problem-Solving Questionnaire-
Revised for senior management Variable LOS OWS IWSOF IWSTC IWSPW IWSCM IWSSM IWSRF
Positive Problem Orientation
-0.14392 0.1490 102
-0.23111 0.0194 102
-0.16980 0.0880 102
0.01213 0.9037 102
-0.07649 0.4448 102
-0.01860 0.8528 102
0.14544 0.1447 102
-0.13706 0.1695 102
Negative Problem Orientation
0.57797 <. 0001 102
0.55213 <. 0001 102
-0.12489 0.2110 102
-0.09469 0.3438 102
-0.09608 0.3368 102
-0.14493 0.1461 102
-0.20834 0.0356 102
-0.09370 0.3489 102
Rational Problem Solving
-0.01743 0.8619 102
-0.20852 0.0355 102
-0.19334 0.0515 102
-0.04373 0.6625 102
-0.12786 0.2003 102
-0.05285 0.5978 102
0.14094 0.1577 102
-0.09238 0.3558 102
Problem Definition and Formulation
-0.04429 0.6585 102
-0.23254 0.0187 102
-0.14103 0.1574 102
-0.01096 0.9129 102
-0.13959 0.1617 102
-0.02634 0.7927 102
0.21370 0.0310 102
-0.08175 0.4140 102
Generation of Alternatives
-0.03352 0.7381 102
-0.18482 0.0629 102
-0.14253 0.1530 102
-0.05297 0.5969 102
-0.07660 0.4441 102
-0.03026 0.7627 102
0.09494 0.3425 102
-0.11716 0.2409 102
Decision Making
0.05306 0.5963 102
-0.13314 0.1822 102
-0.18667 0.0603 102
0.03523 0.7252 102
-0.16338 0.1008 102
-0.03305 0.7416 102
0.17814 0.0732 102
-0.02171 0.8286 102
Solution Implementation Verification
-0.02969 0.7671 102
-0.19087 0.0547 102
-0.21781 0.0279 102
-0.11224 0.2614 102
-0.08587 0.3908 102
-0.09241 0.3556 102
0.03365 0.7370 102
-0.10294 0.3032 102
Impulsivity/ Carelessness Style
0.20092 0.0429 102
0.24905 0.0116 102
0.00996 0.9209 102
0.08065 0.4203 102
0.07066 0.4804 102
-0.05638 0.5736 102
-0.15568 0.1182 102
0.03155 0.7529 102
Avoidance Style
0.33920 0.0005 102
0.46266 <. 0001 102
-0.13698 0.1698 102
-0.13737 0.1686 102
-0.12727 0.2024 102
-0.15396 0.1224 102
-0.20811 0.0358 102
-0.11740 0.2399 102
Social Problem Solving
-0.34205 0.0004 102
-0.45924 <. 0001 102
-0.04022 0.6882 102
0.03465 0.7295 102
-0.01953 0.8456 102
0.07167 0.4741 102
0.23619 0.0168 102
-0.02257 0.8219 102
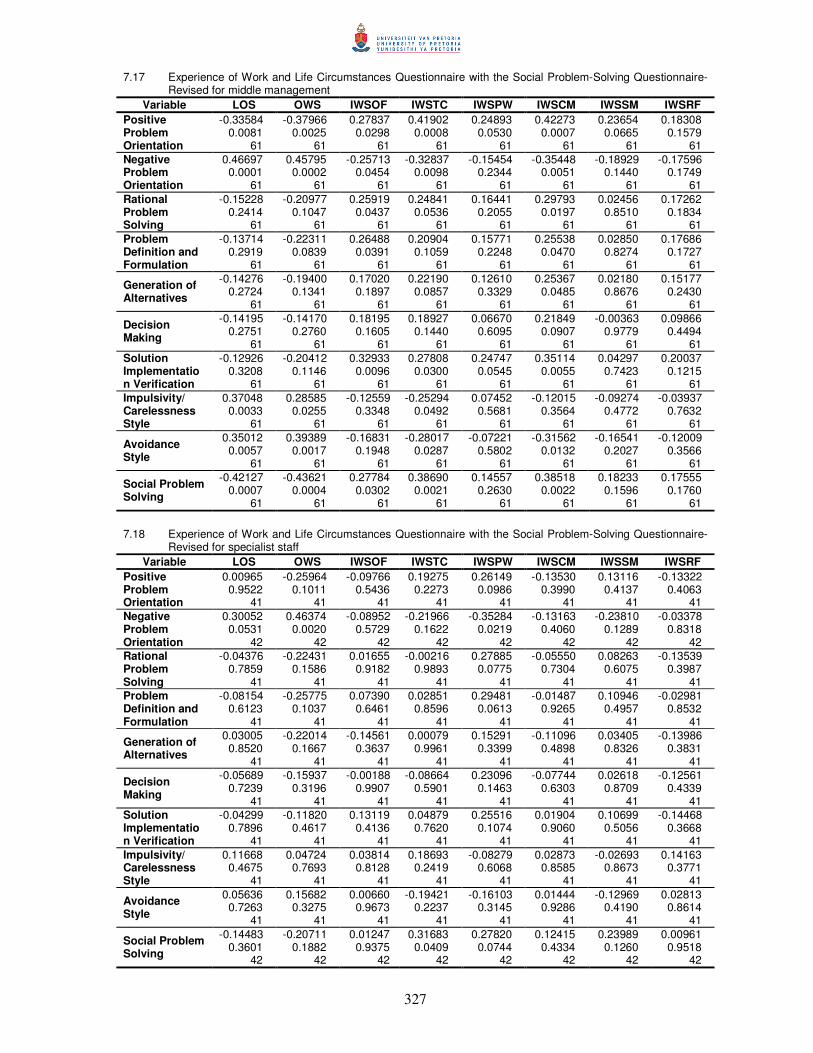
327
7.17 Experience of Work and Life Circumstances Questionnaire with the Social Problem-Solving Questionnaire-Revised for middle management
Variable LOS OWS IWSOF IWSTC IWSPW IWSCM IWSSM IWSRF Positive Problem Orientation
-0.33584 0.0081 61
-0.37966 0.0025 61
0.27837 0.0298 61
0.41902 0.0008 61
0.24893 0.0530 61
0.42273 0.0007 61
0.23654 0.0665 61
0.18308 0.1579 61
Negative Problem Orientation
0.46697 0.0001 61
0.45795 0.0002 61
-0.25713 0.0454 61
-0.32837 0.0098 61
-0.15454 0.2344 61
-0.35448 0.0051 61
-0.18929 0.1440 61
-0.17596 0.1749 61
Rational Problem Solving
-0.15228 0.2414 61
-0.20977 0.1047 61
0.25919 0.0437 61
0.24841 0.0536 61
0.16441 0.2055 61
0.29793 0.0197 61
0.02456 0.8510 61
0.17262 0.1834 61
Problem Definition and Formulation
-0.13714 0.2919 61
-0.22311 0.0839 61
0.26488 0.0391 61
0.20904 0.1059 61
0.15771 0.2248 61
0.25538 0.0470 61
0.02850 0.8274 61
0.17686 0.1727 61
Generation of Alternatives
-0.14276 0.2724 61
-0.19400 0.1341 61
0.17020 0.1897 61
0.22190 0.0857 61
0.12610 0.3329 61
0.25367 0.0485 61
0.02180 0.8676 61
0.15177 0.2430 61
Decision Making
-0.14195 0.2751 61
-0.14170 0.2760 61
0.18195 0.1605 61
0.18927 0.1440 61
0.06670 0.6095 61
0.21849 0.0907 61
-0.00363 0.9779 61
0.09866 0.4494 61
Solution Implementation Verification
-0.12926 0.3208 61
-0.20412 0.1146 61
0.32933 0.0096 61
0.27808 0.0300 61
0.24747 0.0545 61
0.35114 0.0055 61
0.04297 0.7423 61
0.20037 0.1215 61
Impulsivity/ Carelessness Style
0.37048 0.0033 61
0.28585 0.0255 61
-0.12559 0.3348 61
-0.25294 0.0492 61
0.07452 0.5681 61
-0.12015 0.3564 61
-0.09274 0.4772 61
-0.03937 0.7632 61
Avoidance Style
0.35012 0.0057 61
0.39389 0.0017 61
-0.16831 0.1948 61
-0.28017 0.0287 61
-0.07221 0.5802 61
-0.31562 0.0132 61
-0.16541 0.2027 61
-0.12009 0.3566 61
Social Problem Solving
-0.42127 0.0007 61
-0.43621 0.0004 61
0.27784 0.0302 61
0.38690 0.0021 61
0.14557 0.2630 61
0.38518 0.0022 61
0.18233 0.1596 61
0.17555 0.1760 61
7.18 Experience of Work and Life Circumstances Questionnaire with the Social Problem-Solving Questionnaire-
Revised for specialist staff Variable LOS OWS IWSOF IWSTC IWSPW IWSCM IWSSM IWSRF
Positive Problem Orientation
0.00965 0.9522 41
-0.25964 0.1011 41
-0.09766 0.5436 41
0.19275 0.2273 41
0.26149 0.0986 41
-0.13530 0.3990 41
0.13116 0.4137 41
-0.13322 0.4063 41
Negative Problem Orientation
0.30052 0.0531 42
0.46374 0.0020 42
-0.08952 0.5729 42
-0.21966 0.1622 42
-0.35284 0.0219 42
-0.13163 0.4060 42
-0.23810 0.1289 42
-0.03378 0.8318 42
Rational Problem Solving
-0.04376 0.7859 41
-0.22431 0.1586 41
0.01655 0.9182 41
-0.00216 0.9893 41
0.27885 0.0775 41
-0.05550 0.7304 41
0.08263 0.6075 41
-0.13539 0.3987 41
Problem Definition and Formulation
-0.08154 0.6123 41
-0.25775 0.1037 41
0.07390 0.6461 41
0.02851 0.8596 41
0.29481 0.0613 41
-0.01487 0.9265 41
0.10946 0.4957 41
-0.02981 0.8532 41
Generation of Alternatives
0.03005 0.8520 41
-0.22014 0.1667 41
-0.14561 0.3637 41
0.00079 0.9961 41
0.15291 0.3399 41
-0.11096 0.4898 41
0.03405 0.8326 41
-0.13986 0.3831 41
Decision Making
-0.05689 0.7239 41
-0.15937 0.3196 41
-0.00188 0.9907 41
-0.08664 0.5901 41
0.23096 0.1463 41
-0.07744 0.6303 41
0.02618 0.8709 41
-0.12561 0.4339 41
Solution Implementation Verification
-0.04299 0.7896 41
-0.11820 0.4617 41
0.13119 0.4136 41
0.04879 0.7620 41
0.25516 0.1074 41
0.01904 0.9060 41
0.10699 0.5056 41
-0.14468 0.3668 41
Impulsivity/ Carelessness Style
0.11668 0.4675 41
0.04724 0.7693 41
0.03814 0.8128 41
0.18693 0.2419 41
-0.08279 0.6068 41
0.02873 0.8585 41
-0.02693 0.8673 41
0.14163 0.3771 41
Avoidance Style
0.05636 0.7263 41
0.15682 0.3275 41
0.00660 0.9673 41
-0.19421 0.2237 41
-0.16103 0.3145 41
0.01444 0.9286 41
-0.12969 0.4190 41
0.02813 0.8614 41
Social Problem Solving
-0.14483 0.3601 42
-0.20711 0.1882 42
0.01247 0.9375 42
0.31683 0.0409 42
0.27820 0.0744 42
0.12415 0.4334 42
0.23989 0.1260 42
0.00961 0.9518 42

328