stress testing the czech household sector using microdata · households, of which 1,010 were...
TRANSCRIPT
IFC-National Bank of Belgium Workshop on "Data needs and Statistics compilation for macroprudential analysis"
Brussels, Belgium, 18-19 May 2017
Stress testing the Czech household sector using microdata - practical applications in the policy-making
process1 Simona Malovaná, Michal Hlaváček and Kamil Galuščák,
Czech National Bank
1 This paper was prepared for the meeting. The views expressed are those of the authors and do not necessarily reflect the views of the BIS, the IFC or the central banks and other institutions represented at the meeting.
Stress Testing the Czech Household Sector Using Microdata 1
Stress Testing the Czech Household Sector Using Microdata1
Practical Applications in the Policy-Making Process
Simona Malovaná,2 Michal Hlaváček3 and Kamil Galuščák4
Abstract
We present a set of practical applications of the household sector stress testing approach used at the Czech National Bank. The CNB has been conducting stress tests of households once a year since 2011. The test results are published in its Financial Stability Reports. The aim is to test households’ ability to repay their loans in the event of extremely adverse economic developments. Besides this, the household stress test has so far been used for two other purposes: (i) to construct a simple reverse stress test and explore the sensitivity of Czech households to a rise in loan interest rates and a decline in income, and (ii) to provide some supportive evidence for the calibration of debt service-to-income limits.
Keywords: financial surplus, household indebtedness, microdata, stress testing, DSTI calibration
JEL classification: D12, D31, E17
1 We thank participants at the IFC-National Bank of Belgium Workshop in Brussels for helpful
comments. This paper does not necessarily reflect the views of the Czech National Bank.
2 Czech National Bank and Charles University Prague, [email protected]
3 Czech National Bank and Charles University Prague, [email protected]
4 Czech National Bank, [email protected]

2 Stress Testing the Czech Household Sector Using Microdata
1. Introduction
Household stress tests currently form an important complement to the standard macro stress tests, as they shed more light on the structure of the credit risks of the household sector. Unlike the standard top-down macro stress test,5 which only uses semi-structured data on the main banks’ credit portfolios, the household stress tests use micro data on individual households. Firstly, this allows us to analyse specific types of households (e.g. low-income households, young households with children) in order to fine-tune the quantification of household credit risk and the reaction of the household sector to macroeconomic shocks. It also allows us to discuss the social impacts of rising household indebtedness. Secondly, the micro nature of the household stress tests could open up further space for analysis of the feedback or second-round effects of macroeconomic shocks when the worsened financial situation of households in turn negatively influences the macro-economy and financial sector performance. These feedback effects could further improve the quality of the standard macro stress tests. Thirdly, the household stress tests could be important for calibrating the limits of macroprudential tools related to household indebtedness, especially tools pertaining to mortgage loans (LTV, LTI and DSTI ratios).6
In this article, we present the Czech National Bank’s approach to household stress testing. Our results highlight the benefits of using micro-level datasets in the analysis of the incidence of household distress, as shocks have more pronounced effects among lower-income households. We also discuss the existing data gaps relating to household stress tests and suggest some solutions to them.
This article is structured as follows. After this introduction, we briefly present a review of literature relevant to the Czech case, with a special emphasis on existing data sources. In section 3, we describe the methodology of our stress testing approach, mainly considering labour market and interest rate shocks. The interpretation of the stress testing results, including a discussion of what debt burden is already excessive and simple reverse stress tests, follows in section 4. In section 5, we discuss the existing data gaps and suggest some further improvements to the stress testing setup. Section 6 then concludes.
2. Literature Review
The majority of the household stress tests applied by central banks (e.g. Galuščák et al, 2016, Albacete and Fessler, 2010, Johansson and Persson, 2006, Herrala and Kauko, 2007; see Table 1) use Household Budget Survey data. This data source offers relatively detailed micro data on households’ income and expenditures and socio-economic characteristics, information on debt type and repayment size
5 For the results of the macroeconomic stress test in the Czech Republic, see the CNB’s Financial
Stability Reports. For the methodology, see Geršl et al. (2012).
6 For the setting of these ratios, see Recommendation on the management of risks associated with the provision of retail loans secured by residential property from the Official Information of the Czech National Bank of 13 June 2017.

Stress Testing the Czech Household Sector Using Microdata 3
for various types of loans, and information on housing type. These are mainly flow data and there is no information on the total stock of household indebtedness that needs to be estimated. This fact limits the types of analysis available. All the stress tests are based on some form of financial surplus calculated for each household as its net monthly income minus its monthly instalments and essential monthly expenditures. Distress is usually defined as a situation where the financial surplus is negative.
This surplus is usually used to simulate the probability of default (PD) and (if information on debt and collateral value is available) the loss given default (LGD) for each indebted household. Some studies (e.g. Messner and Zavadil, 2015) also use this surplus to simulate the incidence of debt.
Household stress tests in selected countries Table 1
Country Source Data
source No. of HH covered
Stress scenarios
U IR ER HP
Czech Republic Galuščák et al. (2016) HBS 2,900 Y Y N N
Poland Zajączkowski (2008) HBS 35,000 Y Y Y N
Austria Albacete and Fessler (2010); Albacete et al. (2014)
HFCS, SILC 2,380 Y Y Y Y
Lithuania Central Bank of Lithuania (2015)
Extended HBS N/A Y Y N Y
Australia Bilston and Rodgers (2013); Bilston et al. (2015)
Own survey
9,180 Y Y N Y
Croatia Sugawara Zalduendo (2011) HBS 3,108 Y Y Y N
Finland Herrala and Kauko (2007) HBS 11,000 Y Y N N
Note: U stands for unemployment, IR for interest rate, ER for exchange rate, HP for house price, HBS for Household Budget Survey, HSHW for Household Survey on Housing Wealth and HFCS for Household Finance and Consumption Survey.
The majority of the studies mentioned in Table 1 include an assessment of the impacts of unemployment shocks, shocks to household income, shocks to interest rates, shocks to essential expenditure, price shocks and combinations thereof. However, the financial surplus-based methodology only addresses shocks to income and debt repayment and does not usually take into account the volume of household debt and the value of households’ assets. It is therefore relatively complicated to assess the impact of house price shocks and/or to interpret the impact of shocks on the standard LTV, LTI and DSTI measures. Central banks have therefore searched for alternative data sources to the HBS. In the Eurozone, the Household Finance and Consumption Survey (HFCS) project has helped to collect relevant data in many countries and given rise to numerous studies using this data source. For example, Messner and Zavadil (2015) analyse the impact of household indebtedness on household net wealth using Slovak data from the first wave of the HFCS. They use a three-step instrumental-variable approach, first modelling the incidence of debt, then predicting the value of the debt and finally estimating the net wealth of a household. Surprisingly, they find that income has no impact on household indebtedness in Slovakia. They also find a number of socio-economic and demographic factors influencing households’ debt. They then find two effects

4 Stress Testing the Czech Household Sector Using Microdata
of household indebtedness on household net wealth – a highly negative effect of non-mortgage debt and a neutral effect of mortgage debt.
Similarly, Albacete and Lindner (2013) refine the Austrian central bank’s approach to household stress tests by incorporating new information from the HFCS, as they assess the debt burden of each household, simulate the DSTI ratio and estimate the LTV ratio. With the help of these ratios they identify potentially vulnerable households and search for the determinants of this vulnerability and potential risk channels.
Ampudia et al. (2014) do a similar exercise and propose a framework for stress-testing individual household balance sheets based on the HFCS data for the whole Eurozone. They put forward a metric of household distress which is constructed by combining the data on income, expenditure, assets, debt and collateral. This metric takes into consideration the household’s liquidity and solvency situation. The authors use it to calculate credit risk indicators such as PD, exposure at default (EAD) and LGD and their distributions. The indicators are then shocked by hypothetical adverse macroeconomic scenarios comprising interest rate, employment and house price shocks. The authors also demonstrate how the framework could potentially be used for macroprudential purposes, for example, for the calibration of optimal LTV ratio caps.
Other studies using HFCS data include Costa and Farinha (2012) for Portugal, Adam and Tzamourani (2015) for Germany and D’Alessio and Iezzi (2015) for Italy, among many others (for a complete list see ECB, 2016). As for countries not participating in the HFCS, an interesting approach is used in Bierut et al. (2015), where the authors use micro data to assess the effects of the Polish regulation of LTV/LTI.
3. Methodology and Data
The CNB’s household stress tests use the Household Budget Survey (HBS) as their main data source. The other data sources include publicly available macro-indicators and the Statistics on Income and Living Conditions (SILC). The HBS contains household-level data. This means that our methodology is microeconomic in nature, although it does allow us to make conclusions for the entire sector. However, we are limited by the data availability. In particular, the dataset does not contain household balance sheet data. The test is based on a sample of 2,929 households, of which 1,010 were servicing some sort of loan in 2015. Table 2 presents the average characteristics of households with and without debt. These numbers reveal that households with debt have a larger net monthly income, higher essential expenditure and a bigger financial surplus.
In what follows, we describe the methodology for stress testing the household sector using the available microdata. The methodology is based to a large extent on Galuščák, Hlaváč and Jakubík (2016). We therefore refer the reader to their paper for other details.

Stress Testing the Czech Household Sector Using Microdata 5
Average characteristics of households with and without debt
(average for 2015) Table 2
Indicator Households
With debt Without debt
Net income (CZK/month) 37,164 27,781
Instalments – all loans (CZK/month) 5,771 0
Instalments – mortgage (CZK/month) 7,236 0
DSTI – household with mortgage (%) 17.5 0
DSTI – household with other loan (%) 10.1 0
DSTI – household with mortgage and other loan (%) 18.8 0
Essential expenditure (CZK/month) 14,000 11,966
Financial surplus (CZK/month) 17,393 15,814
With loan (share in %) 34.5 0
With mortgage (share in %) 21.1 0
No. of households in HBS 1,010 1,919
Note: Financial surplus = Net income – Instalments (all loans) – Essential expenditure
Source: HBS 2015
Identification of Distressed Households
We define financial surplus (FS) as
𝐹𝐹𝐹𝐹 = 𝑁𝑁𝑁𝑁 − 𝑁𝑁𝑁𝑁𝐹𝐹𝐼𝐼 − 𝐸𝐸𝐸𝐸 (1)
where NI is household net monthly income, INST is monthly instalments and EE is monthly expenditure on essential goods (food, energy, health, rent). We identify a household as distressed if its financial surplus is negative.
In our simulations we consider several types of shocks affecting the financial surplus. Shocks to unemployment change net household income (NI), as work income is replaced by unemployment benefit or other social income. Interest rate shocks affect instalments (INST). We could potentially simulate shocks to consumer prices and the exchange rate (see Galuščák, Hlaváč and Jakubík, 2016), but these shocks are not essential for the applications presented in this paper.
Labour Market and Unemployment Shock
Previous studies (Johansson and Persson, 2006; Albacete and Fessler, 2010) consider an unemployment shock hitting employed persons. We extend their approach to account for transitions from employment to unemployment and also from unemployment to employment. We assume that individuals who are not active on the labour market remain inactive over the time period considered. Owing to data availability, we model the impact of the unemployment shock scenario on household heads and their spouses.
The key building block in the unemployment shock scenario is the probability that an individual is unemployed:

6 Stress Testing the Czech Household Sector Using Microdata
𝑃𝑃𝑃𝑃𝑃𝑃𝑃𝑃(𝑢𝑢𝑖𝑖 = 1|𝑥𝑥𝑖𝑖) = ∅(𝛼𝛼 + 𝛽𝛽𝑥𝑥𝑖𝑖) (2)
where 𝑢𝑢𝑖𝑖 indicates an unemployed person and 𝑥𝑥𝑖𝑖 is a vector of socio-economic characteristics. ∅(. ) is the cumulative density function of the standard normal distribution. We use coefficient estimates to predict the probability of being unemployed for household heads and spouses.
Albacete and Fessler (2010) simulate the increased unemployment rate in the unemployment shock scenario by increasing the constant 𝛼𝛼 in (2) until the aggregate rate of unemployment reaches the required level. Given the data availability, our estimation is based on pooled cross-section datasets. In this way, the individual’s unobserved heterogeneity is neglected, leading to biased coefficient estimates. This raises the predicted probability of transitions between labour market states, particularly from unemployment to employment. Hence, we increase the constant term differently for unemployed and employed persons. Specifically, we increase the constant term for unemployed individuals until their average transition rate to unemployment matches the observed transition rate.7 For employed individuals, we increase the constant term until the aggregate unemployment rate reaches the targeted value.
If an employed individual becomes unemployed, we assume his or her previous work income is replaced by unemployment benefit and that the income of other household members and other social income are unchanged. The amount of unemployment benefit is determined according to the eligibility rules. Unemployment benefit is collected depending on the individual’s age. In the remaining period after the eligibility for unemployment benefit expires, we assume that net household income is increased to the level of the subsistence minimum amount if it is lower.8
While we simulate the non-work income of persons losing their job using the eligibility criteria, we have to determine the wage of non-workers upon finding a job. We predict the entry wage using the Heckman (1979) selection model. We estimate the wage equation:
log (𝑤𝑤𝑖𝑖) = 𝛾𝛾𝑥𝑥𝑖𝑖 + 𝑢𝑢1𝑖𝑖 (3)
where 𝑤𝑤𝑖𝑖 is the monthly net wage, 𝑥𝑥𝑖𝑖 are observed characteristics and 𝑢𝑢1𝑖𝑖~𝑁𝑁(0,𝜎𝜎). The wage 𝑤𝑤𝑖𝑖 is observed if
𝛿𝛿𝑥𝑥𝑖𝑖 + 𝑢𝑢2𝑖𝑖 > 0 (4)
where 𝑢𝑢2𝑖𝑖~𝑁𝑁(0,1) and 𝑐𝑐𝑃𝑃𝑃𝑃𝑃𝑃(𝑢𝑢1,𝑢𝑢2) = 𝜌𝜌. We estimate the wage and selection equations jointly by maximum likelihood. The identification of the model relies on nonlinearity in the selection equation. The predicted log of the wage is transformed into a level (the technique is described in Cameron and Trivedi, 2009).
The set of explanatory variables 𝑥𝑥𝑖𝑖 in our Heckman selection model in (3) and (4) is the same as in the unemployment model in (2). Hence, we determine the probability of being unemployed as unity minus the predicted value from the selection equation. Applying the unemployment shock scenario, we assign to each
7 Unemployment to unemployment gross flows are largely insensitive to the business cycle. 8 We thus simulate net income under a hypothetical change in labour market status. For a
detailed description of the Czech tax and benefit system and microsimulations, see Galuščák and Pavel (2012).

Stress Testing the Czech Household Sector Using Microdata 7
adult person in our sample a probability of being unemployed which is consistent with the targeted unemployment rate. For every possible combination of the employment and unemployment statuses of the household heads and spouses we compute the net household income and the financial surplus. The level of distress is calculated for each household as the weighted average of these binary outcomes.9
Interest Rate Shock
When applying the interest rate shock, we are limited by data availability. To be able to apply the interest rate shock properly we would need to know the maturities of, and interest rates on, each household’s debt. This information, however, is not available in the HBS. Therefore, we have to approximate these statistics using aggregate CNB data.
4. Practical Applications for Policy Purposes
The CNB has been conducting stress tests of households once a year since 2011. The test results are published in its Financial Stability Reports. The aim is to test households’ ability to repay their loans in the event of extremely adverse economic developments. These stress tests therefore focus mainly on the risk arising from financially distressed households, whose potential debt repayment difficulties transform into credit risk of the financial sector. The household stress test consists of several steps, which are described in Figure 1.
The CNB’s household stress testing framework Figure 1
9 Our approach is equivalent to the Monte Carlo simulation used in Johansson and Persson
(2006) and Albacete and Fessler (2010).

8 Stress Testing the Czech Household Sector Using Microdata
At the time of publication of the Financial Stability Report in June each year, the HBS had a lag of almost a year and a half, so for the stress tests in 2017 we use the HBS data for the end of 2015. Therefore, we need to consider changes in household distress that occurred between the end of 2015 and the end of 2016, to which the impacts of the scenarios for 2017 relate. To do so, we use publicly available macroeconomic data; for all households, prices of essential goods are increased by their rate of inflation, while interest rates on the individual loan types and the unemployment rate are changed according to the actual situation. The data ageing procedure is described in detail in Hlaváč et al. (2013; section 4).
The household stress tests are based on alternative macroeconomic scenarios. The scenarios are designed using the CNB’s official prediction model. Adverse scenarios are constructed based on the identification of risks to the Czech economy in the near future. To compare the stress outcome with the most probable outcome, the stress tests use a Baseline Scenario, i.e. the current official macroeconomic prediction of the CNB. Both the Adverse Scenario and the Baseline Scenario serve as a starting point for many other stress tests conducted by the CNB and published in its Financial Stability Reports, e.g. macro stress tests of the solvency and liquidity of domestic banks, macro stress tests of the pension management companies sector and the review and evaluation of sovereign exposure concentration risk. In the household stress test, the Adverse Scenario was recently amplified by an increase in loan interest rates (Amplified Adverse Scenario; see CNB, 2017). The main reason is a growing amount of new mortgage loans provided by banks at historically low interest rates, which increases the sensitivity of households to a potential rise in loan interest rates not accompanied by growth in their income.
Key variables in the individual scenarios of the household stress tests
(end of period) Table 3
Indicator 2016 Baseline
Scenario 2017
Amplified Adverse
Scenario 2017
Unemployment rate (%) 3.8 3.6 5.5
Nominal wage growth (y-o-y, %) 4.7 5.4 -7.3
Inflation (y-o-y, %) 1.4 2.6 -0.6
Interest rate on mortgage loans (%) 2.7 2.7 5.7
Interest rate on consumer loans (%) 12.2 12.2 15.2
Interest rate on other loans (%) 3.8 3.8 6.8
Share of refixed mortgage loans (%) 40 40 40
Source: CNB
Note: The 40% refixation rate corresponds approximately to the percentage of mortgage loans with a residual fixation period of up to and including one year.
The Amplified Adverse Scenario assumes that loan interest rates rise by 3 pp with a 40% mortgage refixation rate. The 40% refixation rate corresponds to the percentage of mortgages with a residual fixation period of up to and including one year. Table 3 presents the macroeconomic scenarios for the stress tests of the household sector. Both the Baseline Scenario and the Amplified Adverse Scenario correspond to the scenarios from the bank stress tests for 2017 (CNB, 2017). In the
Stress Testing the Czech Household Sector Using Microdata 9
case of realisation of the Adverse Scenario and Baseline Scenario, the results are obtained by calculating the cumulative changes in the variables under study for the entire period from the end of 2015 to the end of 2017 in one step. The results for 2016 are thus not used as an input for the subsequent simulation.
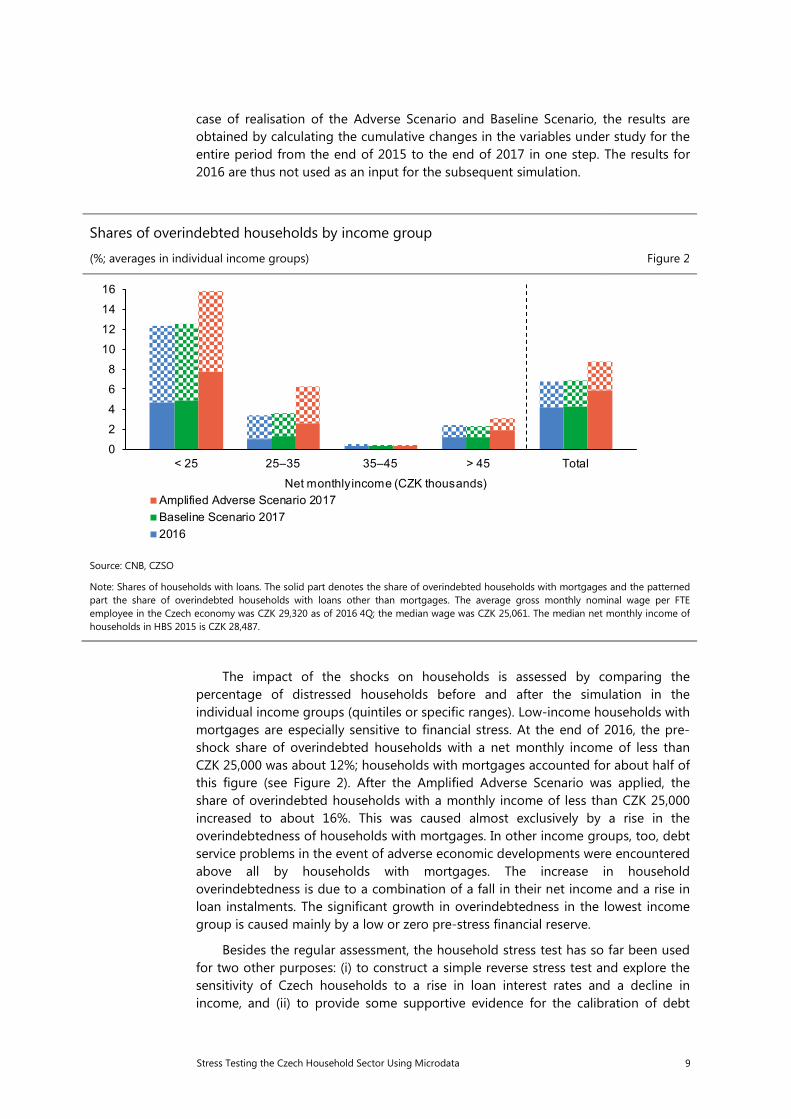
Shares of overindebted households by income group
(%; averages in individual income groups) Figure 2
Source: CNB, CZSO
Note: Shares of households with loans. The solid part denotes the share of overindebted households with mortgages and the patterned part the share of overindebted households with loans other than mortgages. The average gross monthly nominal wage per FTE employee in the Czech economy was CZK 29,320 as of 2016 4Q; the median wage was CZK 25,061. The median net monthly income of households in HBS 2015 is CZK 28,487.
The impact of the shocks on households is assessed by comparing the percentage of distressed households before and after the simulation in the individual income groups (quintiles or specific ranges). Low-income households with mortgages are especially sensitive to financial stress. At the end of 2016, the pre-shock share of overindebted households with a net monthly income of less than CZK 25,000 was about 12%; households with mortgages accounted for about half of this figure (see Figure 2). After the Amplified Adverse Scenario was applied, the share of overindebted households with a monthly income of less than CZK 25,000 increased to about 16%. This was caused almost exclusively by a rise in the overindebtedness of households with mortgages. In other income groups, too, debt service problems in the event of adverse economic developments were encountered above all by households with mortgages. The increase in household overindebtedness is due to a combination of a fall in their net income and a rise in loan instalments. The significant growth in overindebtedness in the lowest income group is caused mainly by a low or zero pre-stress financial reserve.
Besides the regular assessment, the household stress test has so far been used for two other purposes: (i) to construct a simple reverse stress test and explore the sensitivity of Czech households to a rise in loan interest rates and a decline in income, and (ii) to provide some supportive evidence for the calibration of debt
0
2
4
6
8
10
12
14
16
< 25 25–35 35–45 > 45 Total
Net monthly income (CZK thousands)Amplified Adverse Scenario 2017Baseline Scenario 20172016

10 Stress Testing the Czech Household Sector Using Microdata
service-to-income (DSTI) limits. In the following we describe these two practical applications.
What level of debt burden is already excessive?
In its Financial Stability Reports, the CNB regularly assesses the ability of debt-burdened households to repay their obligations in the event of extremely adverse economic developments. These analyses focus among other things on the impact of the simulated stress on households’ DSTI ratio. Previously, however, the analyses did not examine what debt burden can be considered excessive, or at what DSTI level Czech households become extremely sensitive to financial stress. For this reason, the stress test has been extended to include an analysis of the DSTI distribution of overindebted households. DSTI is defined as the monthly mortgage payment divided by the net disposable income of the household.
The results reveal that the share of overindebted households with a DSTI ratio of over 40% is relatively high even before the stress scenario is applied (see Figure 3, panel a). Their sensitivity to the simulated stress is significantly higher than that of households with lower DSTI ratios, regardless of their net monthly income (see Figure 3, panel b). Loans provided to borrowers with a DSTI ratio of over 40% can therefore be regarded as highly risky. This conclusion is in line with the analyses of other central banks and was used in the update of the Recommendation on the management of risks associated with the provision of retail loans.
Shares of overindebted households by DSTI ratio and income group
(%; averages in individual groups) Figure 3
(a) Baseline Scenario (b) Amplified Adverse Scenario
Source: CNB, CZSO
Note: Shares of households with loans. The individual curves divide households into income groups according to the net monthly income of the entire household in CZK thousands.
0
10
20
30
40
50
60
<10 10–20 20–30 30–40 >40DSTI (%)
<25 25–35 35–45 >45
0
10
20
30
40
50
60
<10 10–20 20–30 30–40 >40DSTI (%)
<25 25–35 35–45 >45

Stress Testing the Czech Household Sector Using Microdata 11
Sensitivity of Czech Households to a Rise in Interest Rates and a Decline in Income: Simple Reverse Stress Tests
An assessment of the impact of a rise in interest rates is important for both monetary policy and financial stability. Monetary policy analyses focus mainly on estimating the effect of a change in interest rates on aggregate expenditure, while financial stability analyses focus rather on estimating the impact on growth in credit risk. However, the two types of impacts cannot be assessed separately. A decrease in aggregate expenditure due to a rise in interest rates can have an adverse effect on the financial sector, which, in turn, will pass through to the real economy and subsequently the monetary policy stance. Presented below is a sensitivity analysis of a rise in loan interest rates coupled with a change in the net income of households with mortgage loans. The analysis has the character of a reverse stress test. This test explores how interest rates and the net income of borrowers would have to change, ceteris paribus, for their debt service to increase to a level considered excessive. The debt burden is measured by means of the DSTI ratio. As concluded in the previous subsection households with a DSTI exceeding 40% are considered to be highly sensitive to financial stress.
The speed of pass-through of an increase in rates to instalments depends, among other things, on the interest rate fixation period. Existing mortgage loans with floating rates or residual fixation periods of up to one year accounted for around 24% and mortgages with fixation periods of over one year and up to five years for another 57% at the end of 2015. Gradual refixation of 80% of the current portfolio over five years is thus considered.
Figure 4 shows the combinations of the total change in net income and the increase in loan interest rates which would lead, under the given assumptions, to a rise in the median DSTI to 40% at the five-year horizon. Some of these combinations are less likely, but they clearly illustrate the size of the shocks that would lead to the said DSTI being reached. If, for example, we consider the highly adverse scenario of a sizeable contraction in economic activity where income falls by 20% on average over five years (consistent with a decline of around 4.5% a year) due to growth in unemployment, rates on mortgage loans would have to go up by around 11 pp for the median DSTI of borrowers to reach 40%. However, this scenario is highly implausible, illustrating the current resilience of Czech household sector as a whole to an income and interest rate shock.

12 Stress Testing the Czech Household Sector Using Microdata
Reverse stress test: interest rate and income shock combinations over a five-year horizon
(x-axis: %, y-axis: pp) Figure 4
Source: SILC, HBS 2015, CNB calculation
Note: The curves depict the combinations of changes in income and loan interest rates over a horizon of 1–5 years compared to the initial level which lead to a linear rise in the median DSTI ratio from its current level to a stress level of 40%. If, for example, we consider a 20% decrease in income over five years so that the median DSTI ratio rises to 40%, this shock would have to be accompanied by a gradual increase in rates by a total of around 11 pp (red curve).
The following analysis is based on a more moderate assumption of an increase in loan interest rates of 5 pp over three years (see Figure 5). Middle income groups cut back consumption expenditure the most in response to a rise in rates. In the case of net borrowers, a rise in loan rates results in an increase in debt servicing costs. This may be negatively reflected in their net disposable income and consumption expenditure. The analysis reveals that a rise in rates would have the greatest impact on the net disposable income of low-income households. The same does not apply to the change in consumption expenditure, where households in the lowest and highest income groups react the least to growth in instalments. In the case of high-income households, the explanation is simple – consumption expenditure accounts for around 65% of their net income. Even if their loan instalments increase, these households have a sufficient financial surplus and do not have to reduce their consumption significantly. In the case of low-income households, consumption expenditure accounts for around 90% of their net income, and most of it is essential expenditure, which cannot be reduced significantly.
02468
101214161820
-30 -25 -20 -15 -10 -5 0 5
Cha
nge
in r
ate
Change in net income
1st year (DSTI=20.8%) 2nd year (DSTI=25.6%) 3rd year (DSTI=30.4%)
4th year (DSTI=35.2%) 5th year (DSTI=40%)

Stress Testing the Czech Household Sector Using Microdata 13
Change in the net income and consumption of households with a mortgage loan in response to a rise in loan interest rates of 5 pp
(%) Figure 5
Source: SILC, HBS 2015, CNB calculation
Note: The distribution into income groups (quintiles) is performed on the basis of the net income of all households.
5. Data Gaps
The approach to household stress testing described above is subject to several limitations and imperfections influenced mainly by the nature of the data used. In this section, we will discuss these limitations and solutions to them, and then we will discuss a possible extension of the underlying database to include other data sources.
The first problem with the household-level datasets is that they are only available with a significant delay.10 Hence, it is necessary to rely on ageing the micro information in the datasets and to match it with up-to-date macroeconomic data, mainly the inflation rate, household loan rates and the unemployment rate.
A second complication arises from the fact that the underlying data only cover loan repayments and do not include information on the total stock of indebtedness. Therefore, the level of indebtedness can only be estimated. An increase in the accuracy of this estimate can be obtained thanks to newly available micro-data on mortgage-market characteristics within the SILC (monthly mortgage payment, initial
10 The Household Budget Survey (HBS) data are available annually with a delay of approximately eight
months. Data from the Eurozone Household Finance and Consumption Survey (HFCS) project are only available once every three years with a delay of around two years.
-7
-6
-5
-4
-3
-2
-1
0
0–20% 20–40% 40–60% 60–80% 80–100% TotalIncome groups
Change in consumption expenditureChange in net disposable income

14 Stress Testing the Czech Household Sector Using Microdata
principal, maturity and year of negotiation) and thanks to data from the LTV/LTI survey performed by the CNB since 2015, which covers newly granted loans. Unfortunately, the data do not include information on default probabilities. We therefore have to proxy household debt repayment problems by the financial surplus of households after the shocks.
Thirdly, the HBS data do not include information on the value of the underlying property purchased using the mortgage loan. This makes it complicated to calculate the standard LTV measure (which is also subject to regulation by the CNB). The HBS data therefore have to be linked to some other housing prices. To do so, it is possible to follow Brůha et al. (2013), who combine (i) information from the HBS on housing type, the locality in which the household lives/owns property, the period of construction, equipment, floor area, the level of depreciation etc., and (ii) semi-structural data on property transaction prices published by the Czech Statistical Office, which are broken down by region, property type, municipality size and the extent of property depreciation. Thus, for each household the “shadow” value of the property it owns can be computed and used in further analysis. Another, more advanced technique for calculating shadow prices is to combine the HBS data on the property with the micro database of individual property transactions that is the source for the calculation of the (sub)aggregated property price indexes.11 This estimation of the shadow value of the property should be much more precise than the simple method applied by Brůha et al. (2013).
With more precise information on the size of the loan, its interest rate and the value of the property, the household stress test methodology could be significantly extended, as it would be possible to calculate and stress the main debt-related indicators such as LTI, DSTI and LTV. Also, the incorporation of property prices allows one to study the effect of a shock to property prices (in addition to the current interest rate, unemployment and price shocks). The extended household stress tests could also be used to calibrate the limits for the LTV/LTI/DSTI regulations and to evaluate the effects of those regulations.
To sum up, household stress testing requires us to combine the primary data from the Household Budget Survey with numerous other data sources. The current stress testing approach already uses data from the labour statistics, macroeconomic data, data from the SILC database and others. The extended approach would require the use of new data from the SILC database on the volume of loans and data on residential property prices (preferably micro data on individual transactions). The quality of the household stress tests could be significantly improved if there were an integrated database available combining information on household income and expenditures with information on households’ encumbrance by loans together with more precise data on the value of households’ immovable property. Such a database could be obtained from the ad hoc central bank survey of banks, similar to the semi-annual surveys on new loans conducted by the CNB. International projects such as the HFCS12 and the ECB’s Anacredit project13 also hold
11 The Czech Statistical Offices uses data from property transfer tax returns; alternatively, it would be
possible to use data from the Czech Cadastre.
12 https://www.ecb.europa.eu/pub/economic-research/research-networks/html/researcher_hfcn.en.html
13 https://www.ecb.europa.eu/stats/money_credit_banking/anacredit/html/index.en.html

Stress Testing the Czech Household Sector Using Microdata 15
promise in this respect. However, from the point of view of operational household stress tests they also have some drawbacks. For the HFCS data, these include a substantial publication lag together with only three-year frequency. Anacredit currently stresses the development of databases on corporate loans, whereas household data are not expected to be included in the Czech part of the project until later phases. Therefore, integration of different data from combined data sources is still necessary from the central bank perspective.
6. Concluding Remarks
This paper presented a methodology and a set of practical applications of the household sector stress testing approach used at the Czech National Bank. This framework allows us to simulate the effects of labour market, interest rate and consumer price shocks, which have a negative effect on indebted households, reducing their available financial surplus (net household income minus loan instalments and essential living costs). These factors lead to a rise in the percentage of distressed households, i.e. households with a negative financial surplus.
The CNB has been conducting stress tests of households once a year since 2011. The test results are published in its Financial Stability Reports. The main aim is to test households’ ability to repay their loans in the event of extremely adverse economic developments. Besides this, the household stress test has so far been used for two other purposes: (i) to construct a simple reverse stress test and explore the sensitivity of Czech households to a rise in loan interest rates and a decline in income, and (ii) to provide some supportive evidence for the calibration of debt service-to-income limits. The results reveal that loans provided to borrowers with a DSTI ratio of over 40% can be regarded as highly risky, as their sensitivity to the simulated stress is significant. This conclusion is in line with the analyses of other central banks and was used in the update of the Czech National Bank’s Recommendation on the management of risks associated with the provision of retail loans.
The approach to household stress testing is, however, subject to several limitations, connected especially with limited data availability. International projects such as the Household Finance and Consumption Survey and the ECB’s Anacredit project (if extended in the Czech Republic to cover the household sector) may hold some promise with respect to improving this area in the future.
References
Adam, K and P Tzamourani (2015): “Distributional consequences of asset price inflation in the euro area,” Discussion Paper, no 27, Deutsche Bundesbank. Albacete, N, J Eidenberger, G Krenn, P Lindner and M Sigmund (2014): “Risk-bearing capacity of households – linking micro-level data to the macroprudential toolkit”, Financial Stability Report, no 27, Österreichische Nationalbank, June.

16 Stress Testing the Czech Household Sector Using Microdata
Albacete, N. and P. Fessler (2010): “Stress Testing Austrian Households,” Financial Stability Report, no 19, Österreichische Nationalbank, June. Albacete, N and P Lindner (2013): “Household vulnerability in Austria – a microeconomic analysis based on the household finance and consumption survey,” Financial Stability Report, no 25, Österreichische Nationalbank, June. Ampudia, M, H Van Vlokhoven and D Żochowski (2014): “Financial fragility of euro area households,” Working Paper, no 1737, European Central Bank. Bierut, B, T Chmielewski, A Głogowski, A Stopczyński and S Zajączkowski (2015): “Implementing loan-to-value and debt-to-income ratios: Learning from country experiences. The case of Poland,” NBP Working Paper, no 212. Bilston, T, R Johnson and M Read (2015): “Stress testing the Australian household sector using the HILDA survey,” Research Discussion Paper, no 2015-1. Bilston, T and D Rodgers (2013): “A model for stress testing household lending in Australia,” Australia Central Bank Bulletin, December 2013. Brůha, J, M Hlaváček and L Komárek (2013): “Impacts of property prices on the financial condition of households,” Thematic Article, Financial Stability Report 2012/2013, Czech National Bank. Cameron, A C and P K Trivedi (2009): “Microeconometrics using Stata,” StataCorp. Central Bank of Lithuania (2015): “Stress testing of households,” https://www.lb.lt/stress_testing_of_households. Czech National Bank (2017): Financial Stability Report 2016/2017. Czech National Bank (2017): “Recommendation on the management of risks associated with the provision of retail loans secured by residential property,” 13 June 2017. Costa, S and L Farinha (2012): “Households’ indebtedness: A microeconomic analysis based on the results of the Household Financial and Consumption Survey,” Financial Stability Report 2012, Banco de Portugal, May. D’Alessio, G and S Iezzi (2015): “Over-indebtedness in Italy: How widespread and persistent is it?” Paper presented at the conference The Bank of Italy’s Analysis of Household Finances, Rome, 3–4 December 2015. European Central Bank (2016): “Bibliography of the Household Finance and Consumption Survey,” 18 April 2016. Galuščák, K, P Hlaváč and P Jakubík (2016): “Household resilience to adverse macroeconomic shocks: Evidence from Czech microdata,” International Review of Applied Economics 30(3), pp 377–402.
Stress Testing the Czech Household Sector Using Microdata 17
Galuščák, K and J Pavel (2012): “Taxes and benefits: Work incentive effects of policies,” Czech Journal of Economics and Finance 62(1), pp 27–43. Geršl, A, P Jakubík, T Konečný and J Seidler (2012): “Dynamic stress testing: The framework for testing banking sector resilience used by the Czech National Bank,” CNB Working Paper, no 11/2012. Heckman, J J (1979): “Sample selection bias as a specification error,” Econometrica 47(1), pp 153–161. Herrala, R and K Kauko (2007): “Household loan loss risk in Finland – estimations and simulations with micro data,” Bank of Finland Research Discussion Papers, no 5/2007. Hlaváč P, P Jakubík and K Galuščák (2013): “Household stress tests using microdata,” Thematic Article, Financial Stability Report 2012/2013, Czech National Bank. Johansson, M and M Persson (2006): “Swedish households’ indebtedness and ability to pay – a household level study,” Penning – Ochvalutapolitik 3/2006, pp 24–41. Messner, T and T Zavadil (2015): “Are indebted households poorer? Evidence from Slovakia,” National Bank of Slovakia Working Paper, no 2/2015, March 2015. Sugawara, N and J Zalduendo (2011): “Stress-testing Croatian households with debt-implications for financial stability,” Policy Research Working Paper, no 5906, World Bank. Zajączkowski, S (2008): “Household sector stress tests on the basis of micro data,” presentation at National Bank of Romania Seminar, 18–19 September 2008, https://www.imf.org/external/np/mcm/financialstability/fsconfrom.htm.

IFC-National Bank of Belgium Workshop on "Data needs and Statistics compilation for macroprudential analysis"
Brussels, Belgium, 18-19 May 2017
Stress testing the private household sector using microdata1
Kamil Galuscak, Czech National Bank
1 This presentation was prepared for the meeting. The views expressed are those of the author and do not necessarily reflect the views of the BIS, the IFC or the central banks and other institutions represented at the meeting.

Data Needs and Statistics Compilation for Macroprudential Analysis
Stress Testing the Private Household Sector Using Microdata
Kamil Galuščák
IFC – NBB workshop
Brussels, 18-19 May 2017
Disclaimer: The views expressed are those of the author and do not necessarily
reflect the views of the Czech National Bank

2
Outline
• Introduction
• Methodology
• Data
• Results
• Impact of shocks
• International comparison
• CNB stress tests
• Planned extension of CNB stress tests
• Conclusions

3
Introduction
• Important to monitor and assess risks among households caused by accumulation of debts
• Analysis is limited to available datasets
• We consider effects of shocks to unemployment, interest rates and prices of essential expenditure on households’ ability to service their debts
• We extend the approach of Johansson and Persson(2006) and Albacete and Fessler (2010)
• We illustrate the use of our methodology for CNB stress testing
• Alternative way of calculating households’ probability of default in CNB’s credit risk model

4
Methodology - Overview
• We define financial surplus
FS = NI – INST - EE
where NI is net household income, INST is monthly
instalments, EE is monthly expenditure on essential
costs
• A household is distressed if FS < 0
• We consider shocks caused by changes in unemployment rate, interest rate and prices
• Czech Household Budget Survey datasets
• No information on assets and liabilities
• Data ageing applied

5
Methodology – Unemployment rate shock
• Consider transitions between E and U
• Probability of being unemployed:���� �� = 1 �� = ∅(� + ���)
• Increase the constant α until the unemployment rate meets the target
• Estimate the unemployment probit model using pooled cross sections
• Neglecting unobserved heterogeneity increases predicted flows, particularly from U to E
• Eligibility rules are used to simulate the net household income while unemployed (Galuscak and Pavel, 2012)
• Entry wage is predicted using a Heckman selection model

6
Methodology – Unemployment rate shock
• Calculate the FS for every possible combination of E and U within a household
• The level of distress is the average of these binary variables weighted by their probability of occurrence
• The approach is equivalent to Monte Carlo simulations

7
Methodology – Unemployment rate shock
• Both models are estimated for household heads and spouses using Czech Household Budget Survey data
• We consider shocks of the size of 1 to 3 standard deviations
• Probability is 15.9, 2.3 and 0.1% respectively
• Big shocks are extremely rare
8
Methodology – Interest rate shock
• Information on instalments by type of loan (housing, consumer, other loans)
• Interest rates are approximated, residual principal is estimated
• Short-term shock (one year): 51.1% of housing and other loans recalculated, consumer loans not affected
• Long-term shock: instalments in all loan types are renegotiated

9
Methodology – Price shock
• Consider prices in groups typical for essential costs (food, energy, health, rent)
• Assume price and income elasticities from Dybczaket al. (2010)
• Consider the statutory subsistence minimum amount as an alternative definition of essential living costs

10
Data
• Czech Household Budget Survey (about 3,000 households in each year)
• Survey of Income and Living Conditions as a complementary source of information
• Explanatory variables
• Dummies for HH head, gender, education, spouse’s education, spouse’s labour market status
• Age
• Dummies for children (also interacted with gender), persons younger than 31 and older than 55
• Net income of other household members, the amount of instalments
• Dummies for region, ownership of durables (car, PC)
11
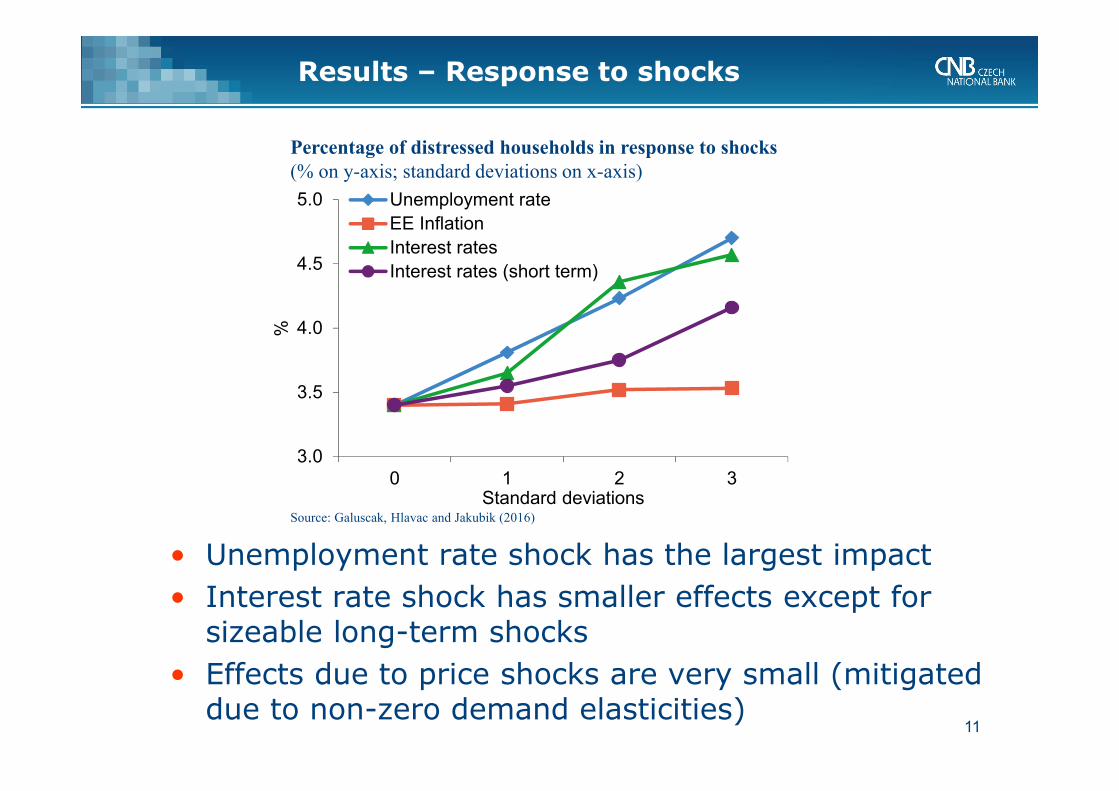
Results – Response to shocks
• Unemployment rate shock has the largest impact
• Interest rate shock has smaller effects except for sizeable long-term shocks
• Effects due to price shocks are very small (mitigated due to non-zero demand elasticities)
3.0
3.5
4.0
4.5
5.0
0 1 2 3
%
Standard deviations
Unemployment rate
EE Inflation
Interest rates
Interest rates (short term)
Percentage of distressed households in response to shocks(% on y-axis; standard deviations on x-axis)
Source: Galuscak, Hlavac and Jakubik (2016)
12
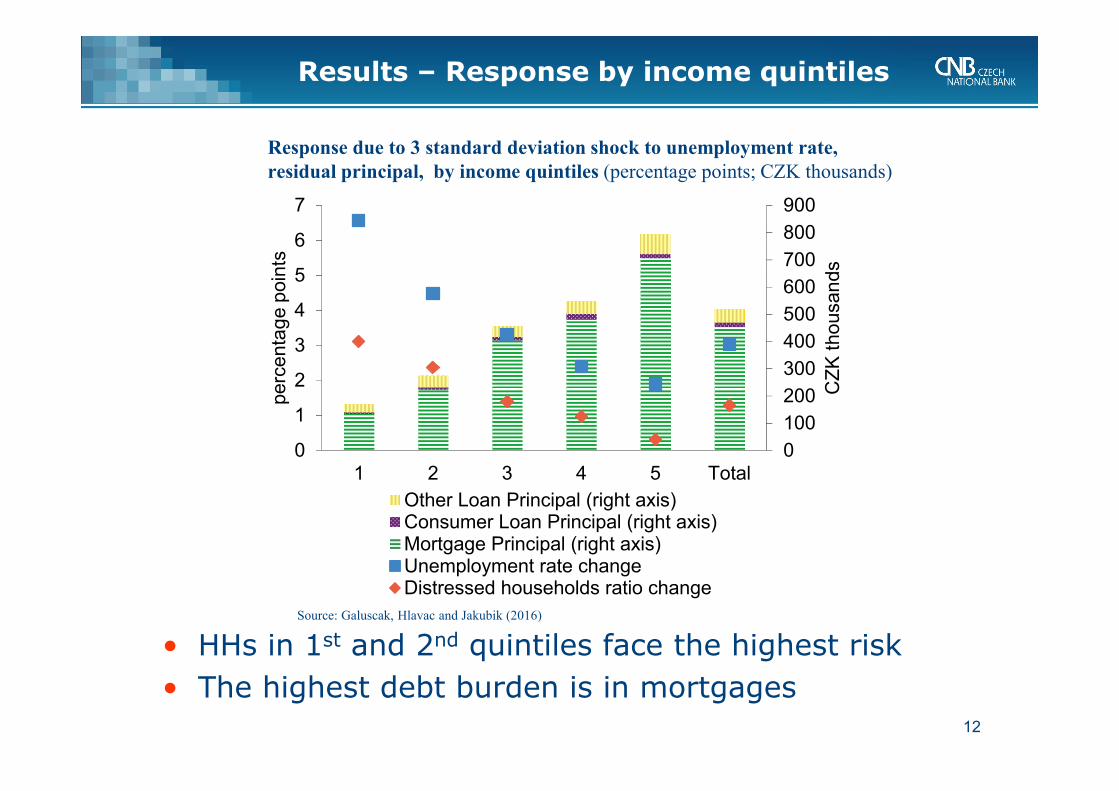
Results – Response by income quintiles
• HHs in 1st and 2nd quintiles face the highest risk
• The highest debt burden is in mortgages
Response due to 3 standard deviation shock to unemployment rate,residual principal, by income quintiles (percentage points; CZK thousands)
0
100
200
300
400
500
600
700
800
900
0
1
2
3
4
5
6
7
1 2 3 4 5 Total
CZ
K t
ho
usan
ds
perc
enta
ge p
oin
ts
Other Loan Principal (right axis)Consumer Loan Principal (right axis)Mortgage Principal (right axis)Unemployment rate changeDistressed households ratio change
Source: Galuscak, Hlavac and Jakubik (2016)

13
Results – Average financial surplus
• Long-term interest rate shock has the most pronounced impact on household budgets
Average financial surplus in response to shocks(thousands CZK/month on y-axis; standard deviations on x-axis)
16,200
16,300
16,400
16,500
16,600
16,700
16,800
16,900
17,000
0 1 2 3
CZ
K t
housands
standard deviations
Unemployment rate EE InflationInterest rates Interest rates (short term)
Source: Galuscak, Hlavac and Jakubik (2016)

14
Results – Combined shocks
• Effects of the unemployment rate shocks combined with short-term interest rate shock
• The share of distressed households increases by up to 5.5 percentage points
Percentage of distressed households in response to combined shocks(shocks of the size of standard deviations; zero shocks are the end of 2012)
0 1 2 3
0 3.4 3.6 3.8 4.2
1 3.8 4.0 4.2 4.6
2 4.2 4.4 4.6 5.0
3 4.7 4.8 5.1 5.5
Interest rate shockUnemployment
shock
Source: Galuscak, Hlavac and Jakubik (2016)

15
Results – International comparison
• The impact due to unemployment rate shock is much larger than in Sweden and Austria
• We include spouses (higher labour market flows)
Impact of unemployment rate shock(increase in the incidence of distressed households in p.p.; shock size in p.p.)
Note: * Johansson and Persson (2006); ** Albacete and Fessler (2010)Source: Galuscak, Hlavac and Jakubik (2016)
1 2 3
Czech Republic 8.8 17.6 26.5
Sweden* 3.2 4.8 6.3
Austria** 1.1 1.1 2.2

16
Results – International comparison
• Interest rate shocks have similar effects as in Austria, higher than in Sweden
Impact of interest rate shock (long-term effects in parentheses)(increase in the incidence of distressed households in p.p.; shock size in p.p.)
Note: * Johansson and Persson (2006); ** Albacete and Fessler (2010)Source: Galuscak, Hlavac and Jakubik (2016)
1 2 3
Czech Republic 5.9 (8.8) 14.7 (38.2) 29.4 (47.1)
Sweden* 1.6 (4.8) 4.8 (12.7) 6.3 (15.9)
Austria** 6.5 (9.8) 20.7 (29.3) 30.4 (41.3)

17
Results – CNB stress tests
Sensitivity of the DSTI ratio of households with a mortgage loan by income group(DSTI ratio in %)
Source: CNB Financial Stability Report 2015/2016(SILC, HBS, CNB calculation)
0
10
20
30
40
50
0–20% 20–40% 40–60% 60–80% 80–100% Total
Income groups
Post-shock DSTI – interest rate shock
Post-shock DSTI – income shock
Original DSTI
18
Planned extension of CNB stress tests
• A new test to account for mortgages
• Use of additional data from SILC, CNB’s LTV/LTI survey of new loans (since 2015), data on property prices from the Czech Statistical Office
• Housing prices shock will be newly integrated and its impact on LTV, LTI and DSTI studied (in combination with other shocks)
• Contribution of individual households to the overall impact of the shocks will be weighted with respect to the loan value

19
Conclusions
• Using available micro datasets, we identify financially distressed households
• We consider shocks to unemployment, interest rates and prices of essential expenditures
• We extend the previous approach by allowing for both E->U and U->E transitions
• Thanks to data availability, we consider HH heads as well as spouses

20
Conclusions
• The highest impact is due to unemployment rate shock
• The impact on financial surplus is the most pronounced for the interest rate shock
• Effects of price shocks are very small
• We compare our results with Austria and Sweden
• We illustrate the use of our methodology in CNB stress tests, will be extended to account for mortgages
• We are limited to available datasets
• New studies use HFCS data: Messner and Zavadil (2015) for SK, Albacete and Lindner (2013) for AT, Ampudia et al. (2014) for the euro area, etc.
