stress triggering in thrust and subduction earthquakes and ... · we calculate that during a...
TRANSCRIPT

Stress triggering in thrust and subduction earthquakes and stress
interaction between the southern San Andreas
and nearby thrust and strike-slip faults
Jian LinDepartment of Geology and Geophysics, Woods Hole Oceanographic Institution, Woods Hole, Massachusetts, USA
Ross S. SteinU.S. Geological Survey, Menlo Park, California, USA
Received 30 May 2003; revised 24 October 2003; accepted 20 November 2003; published 3 February 2004.
[1] We argue that key features of thrust earthquake triggering, inhibition, and clusteringcan be explained by Coulomb stress changes, which we illustrate by a suite ofrepresentative models and by detailed examples. Whereas slip on surface-cutting thrustfaults drops the stress in most of the adjacent crust, slip on blind thrust faults increases thestress on some nearby zones, particularly above the source fault. Blind thrusts can thustrigger slip on secondary faults at shallow depth and typically produce broadly distributedaftershocks. Short thrust ruptures are particularly efficient at triggering earthquakes ofsimilar size on adjacent thrust faults. We calculate that during a progressive thrustsequence in central California the 1983 Mw = 6.7 Coalinga earthquake brought thesubsequent 1983Mw = 6.0 Nunez and 1985Mw = 6.0 Kettleman Hills ruptures 10 bars and1 bar closer to Coulomb failure. The idealized stress change calculations also reconcile thedistribution of seismicity accompanying large subduction events, in agreement withfindings of prior investigations. Subduction zone ruptures are calculated to promotenormal faulting events in the outer rise and to promote thrust-faulting events on theperiphery of the seismic rupture and its downdip extension. These features are evident inaftershocks of the 1957 Mw = 9.1 Aleutian and other large subduction earthquakes. Wefurther examine stress changes on the rupture surface imparted by the 1960 Mw = 9.5 and1995 Mw = 8.1 Chile earthquakes, for which detailed slip models are available. CalculatedCoulomb stress increases of 2–20 bars correspond closely to sites of aftershocks andpostseismic slip, whereas aftershocks are absent where the stress drops by more than10 bars. We also argue that slip on major strike-slip systems modulates the stress actingon nearby thrust and strike-slip faults. We calculate that the 1857 Mw = 7.9 Fort Tejonearthquake on the San Andreas fault and subsequent interseismic slip brought theCoalinga fault �1 bar closer to failure but inhibited failure elsewhere on the Coast Rangesthrust faults. The 1857 earthquake also promoted failure on the White Wolf reverse faultby 8 bars, which ruptured in the 1952 Mw = 7.3 Kern County shock but inhibited slip onthe left-lateral Garlock fault, which has not ruptured since 1857. We thus contend thatstress transfer exerts a control on the seismicity of thrust faults across a broad spectrum ofspatial and temporal scales. INDEX TERMS: 7209 Seismology: Earthquake dynamics and mechanics;
7230 Seismology: Seismicity and seismotectonics; 7223 Seismology: Seismic hazard assessment and
prediction; 8164 Tectonophysics: Stresses—crust and lithosphere; 8123 Tectonophysics: Dynamics,
seismotectonics; KEYWORDS: earthquake triggering, thrust and subduction earthquakes, stress transfer, fault
interaction, blind thrust, San Andreas Fault
Citation: Lin, J., and R. S. Stein (2004), Stress triggering in thrust and subduction earthquakes and stress interaction between the
southern San Andreas and nearby thrust and strike-slip faults, J. Geophys. Res., 109, B02303, doi:10.1029/2003JB002607.
1. Introduction
[2] During the past decade, the phenomenon of staticstress transfer has been explored to understand earthquake
interaction. Most studies have focused on earthquakes onstrike-slip faults, such as the San Andreas, North Anatolian,and eastern California shear zone; or on normal faults inwestern Turkey, Greece, Italy, and the U.S. basin and rangeprovince (see reviews by Harris [1998], Stein [1999], Kingand Cocco [2000], and Stein [2003]). One advantage ofstudying strike-slip earthquakes is that the pattern of stress
JOURNAL OF GEOPHYSICAL RESEARCH, VOL. 109, B02303, doi:10.1029/2003JB002607, 2004
Copyright 2004 by the American Geophysical Union.0148-0227/04/2003JB002607$09.00
B02303 1 of 19

transfer does not vary greatly with depth, so one can useaftershocks to test the predicted distribution of off-faultstress changes despite their large depth uncertainties. Con-versely, the majority of thrust events occur in subductionzones offshore, where seismic and geodetic coverage isoften poor.[3] Despite these limitations, thrust faults are a tantalizing
target of study: Thrust earthquakes have been responsiblefor most of the 20th century’s seismic fatalities and financiallosses, and thrust faults pose a major hazard to urban centersin California, the Pacific Northwest, Central and SouthAmerica, Japan, India, Iran, and Taiwan. Unlike strike-slipsystems, thrust faults are often ‘‘blind,’’ meaning that thefault does not reach the Earth’s surface, which profoundlyalters the stress transfer. Previous investigations of conti-nental thrust events [Stein et al., 1994; Harris et al., 1995;Deng and Sykes, 1997; Hardebeck et al., 1998; Wang andChen, 2001; Wang et al., 2003] and subduction earthquakes[Dmowska et al., 1988; Taylor et al., 1996, 1998; Parsons,2002] pointed to the important role of stress interaction.However, the common features of stress transfer in thrustsystems are still poorly understood. Progress in understand-ing of this process should improve our ability to forecastearthquake hazards.[4] Here we explore how thrust events interact, cluster,
propagate, and inhibit each other. We first present a suite ofidealized models illustrating the key features of Coulombstress transfer associated with blind and surface cuttingthrust faults. We then show how these models capture muchof the observed aftershock distributions of continental thrustand subduction events, and can rationalize several propa-gating earthquake sequences. Finally, we explore how thrust
and strike-slip faults are influenced by the stresses trans-mitted by a nearby major transform system, focusing oninteraction between the San Andreas fault and the CoastRanges faults. Although time-dependent stress transferassociated with viscous flow is important [Pollitz andSacks, 1997; Freed and Lin, 1998; Casarotti and Piersanti,2003], here we will focus on elastic processes that dominatecoseismic stress changes. Where necessary we also usesimplified dislocation models to examine interseismic stressaccumulation.
2. Idealized Models of Stress Transfer
2.1. Surface-Cutting Faults Versus Blind Thrust Faults
[5] The degree of blindness of thrust faults varies over abroad spectrum (Figure 1), as surveyed by Lettis et al.[1997]. For blind thrusts with normalized depth of burial<1, such as the 1971 Mw = 6.7 San Fernando earthquake,the pattern of Coulomb stress is strongly influenced by thestress-free ground surface. The Coulomb stress change isdefined as �CFF = �t + m�s, where �t is the change inshear stress ( positive in the slip direction), �s is the changein normal stress ( positive when the fault is unclamped), andm is the apparent friction coefficient after accounting for thepore fluid pressure effect, which is sometimes representedas m0 [King et al., 1994]. A thrust fault that cuts the entirebrittle-elastic layer of the crust relieves stress over a broadarea in its cross-sectional area, inhibiting failure on nearbythrust faults (Figure 2a). In contrast, blind thrust faultsincrease the stress toward failure in a much larger percent-age area of their immediate vicinity, including the overlyingcrust (Figure 2b). Blind thrusts can thus trigger relatively
Figure 1. Depth of burial as a function of fault length/width (L/W ) ratio for some well-studied thrustfaults. Burial depth is normalized by the vertical extent of the fault, as shown in the inset. Largesubduction earthquakes tend to locate in the upper right; moderate size continental thrust faults tend tolocate to the left. Sources are 1, Barrientos and Ward [1990]; 2, Lay et al. [1989]; 3, Ihmle and Ruegg[1997]; 4,Wang [2000]; 5 and 6, Stein et al. [1994]; 7, 8, and 12, Stein and Ekstrom [1992]; 9, Ekstrom etal. [1992]; 10, Lin and Stein [1989]; 11, Hauksson [1994]; 13, Seeber et al. [1998].
B02303 LIN AND STEIN: STRESS TRIGGERING AND FAULT INTERACTION
2 of 19
B02303

abundant off-fault seismicity, including aftershocks or sub-sequent main shocks.[6] The stress imparted by a blind thrust earthquake to the
overlying crust is often relieved by secondary surface faults(Figure 2c). Secondary surface faulting is evident in the1994 Mw = 6.7 Northridge earthquake [Stein et al., 1994],and rootless secondary thrust faults are imaged in the coresof anticlines (upwarped strata) above the 1983 Coalinga and1985 Kettleman Hills thrust events [Stein and Ekstrom,1992]. However, existing bedding planes within sedimen-tary strata may significantly inhibit upward propagation of athrust fault, and thus influence stress transfer [Roering et al.,1997]. Stress that promotes reverse faulting is also trans-ferred along the strike, beyond the ends of the rupture(Figures 2d–2f; see Figure 1 inset for terminology). Thecalculated off-fault stress increases exhibit a broad cross incross section, and so aftershocks beyond the fault endsshould also be widely dispersed, rather than aligned with theearthquake rupture plane.[7] The diffuse pattern of aftershocks for blind thrust
main shocks is evident in numerous well-documentedexamples, such as the 1983 Coalinga and 1985 KettlemanHills [Stein and Ekstrom, 1992], 1987 Mw = 6.0 WhittierNarrows [Shearer, 1997], and 1994 Northridge [Hardebecket al., 1998] earthquakes. The Whittier Narrows earthquake,
for example, is so deeply buried that there is no influence ofthe ground surface, and its aftershock distribution is highlycompact (Figure 3). Although aftershocks close to therupture plane are probably triggered by stress concentrationsarising from discontinuities along the fault surface that arenot represented by our smooth slip models, the off-faultshocks appear to lie in regions that sustained a Coulombstress increase (Figures 3a and 3b), or were unclamped(Figure 3c).[8] The correspondence between the off-fault aftershocks
and the calculated unclamping for the Whittier Narrowsearthquake (Figure 3c) suggests that aftershocks of thrustfaults are sensitive to normal stress changes. Thus theapparent friction coefficient m in the Coulomb stress equa-tion would appear to be high for thrust faults, perhaps about0.8. This inference has also been made for other thrusts andfor strike-slip faults with little cumulative slip, perhapsbecause youthful fault surfaces are rough [Parsons et al.,1999; Toda and Stein, 2003]. In contrast, evidence favorslow friction for strike-slip faults with significant cumulativeslip, such as the San Andreas, for which m < 0.4 [Zoback etal., 1987; Harris et al., 1995; Parsons et al., 1999; Todaand Stein, 2002]. Subduction zones likely have intermediatefriction because of large cumulative slip and the likelihoodof high pore pressure. So here we will use m = 0.8 for
Figure 2. Cross sections (left) through the center and (right) beyond the end of the fault of a 45�-dipping thrust source fault. Optimally oriented receiver thrust planes are shown in areas of increasedCoulomb stress. Both the 1971 San Fernando and 1994 Northridge faults dip about 45�. (a) The surface-cutting thrust (Mw = 7.0) drops the stress in the upper crust, (b) whereas a blind thrust (Mw = 6.8)increases the stress over much of the upper crust, despite its smaller magnitude. Near-surface regions ofstress increase are sometimes relieved by secondary surface faulting, as occurred in the Northridge shock.(c) Stress changes caused by blind and surface fault slip. (d–f ) Beyond the ends of the faults the stressdistribution is relatively insensitive to whether the thrust is surface-cutting or blind, where the along-strike projection of faults is dotted.
B02303 LIN AND STEIN: STRESS TRIGGERING AND FAULT INTERACTION
3 of 19
B02303

continental thrusts, but m = 0.4 for subduction zones, majorstrike-slip faults, and schematic examples.[9] There are several ways to calculate the Coulomb
stress imparted by an earthquake, and we will use two inthis study. The Coulomb stress can be resolved on toparticular planes in a specified rake direction, known as‘‘receiver faults.’’ We use such specified-fault calculationswhen the geometry and rake of the receiver fault is known,such as in a sequence of large thrust earthquakes. Whenexamining the correspondence between the earthquakestress change and small aftershocks, however, the faultson which most aftershocks occur are unknown. In such
cases, we calculate the stress changes on optimally orientedfaults. In other words, at every point in space, the plane onwhich the Coulomb stress change is most positive is found[King et al., 1994]. Figure legends of all figures that showstress calculations detail which type of calculation is made.
2.2. Interaction on Short Versus Long Thrust Faults
[10] When thrust earthquakes grow to M � 7 they oftenbecome longer along strike than they are wide in thedowndip direction, because their downdip extent is limitedby the finite depth of the brittle-elastic crust. In such cases,the stress transferred beyond the along-strike ends remainssimilar to that of short faults (Figure 4a), but the regions ofstress decrease located perpendicular to the fault strike growbroader along strike (Figure 4b). Figures 4 and 5 display thesame cases in map view and cross section, respectively.[11] It has often been noted that, unlike strike-slip events,
great subduction earthquake sequences more rarely propa-gate along strike [Ruff and Tichelaar, 1996]. The ability of athrust earthquake to promote failure on an adjacent patch ofsimilar size is strongly influenced by its length/width (L/W)ratio. For a square fault with 2 m of slip, about 70% of theadjacent patch experiences a stress increase of 1 bar or more(Figure 6a). For a fault of the same slip but with L/W � 6,only 15% of the adjacent patch sustains a 1-bar stressincrease (Figure 6b). The Middle America subduction zonetends to rupture in M < 7.4 earthquakes with L/W � 1,whereas the Aleutian and Chilean subduction zones morecommonly rupture in M � 8 earthquakes with L/W > 3.Thus short continental thrust faults and M < 7.4 subductionshocks should be more efficient at triggering subsequentearthquakes of similar size along strike than great subduc-tion zone earthquakes.[12] The ability of a subduction event to inhibit thrust
faulting inland of the trench is similarly influenced by theL/W ratio. The zone of Coulomb stress decrease, known asthe ‘‘stress shadow,’’ is several times larger for the L/W =6 case (Figure 6b) than for the L/W = 1 case (Figure 6a)because such areas of stress decrease grow broader alongthe strike of the rupture as L/W increases. Thus short thrustruptures are efficient in triggering other thrust events ofsimilar size along the strike of the rupture plane, while long
Figure 3. Stress change caused by the 1 October 1987Mw = 6.0 Whittier Narrows earthquake. (a) Map view ofmaximum stress change for depth range of 10.0–14.4 km,with seismicity (1 October 1987 to 31 December 1994, M �1.0, horizontal error <0.5 km) from Shearer [1997] for thesame depth range. The source fault model, shown by theblack inscribed line, has tapered thrust slip on a 4.5 �4.5 km fault with strike 270�, dip 25�, and rake 90�,following Lin and Stein [1989]; receiver faults are assumedto have the same parameters. (b) Coulomb stress change incross section cutting the center of the fault. The resultingstress component is shown in the top left-hand corner.(c) Normal stress change. Unclamping is positive. Therewere no earthquakes recorded during 1975–1987 at theminimum catalog magnitude of M � 0.8 [Richards-Dingerand Shearer, 2000], and so the aftershock pattern is morelikely a response to the stress changes imparted by the mainshock than a continuation of the background seismicity.
B02303 LIN AND STEIN: STRESS TRIGGERING AND FAULT INTERACTION
4 of 19
B02303

ruptures are efficient in inhibiting thrust faults in a largeregion perpendicular to the rupture plane.
3. Stress Transfer in a Continental BlindThrust Sequence
[13] The central California Coast Ranges suffered a south-east propagating sequence of blind thrust earthquakes thatincludes the 1982 Mw = 5.8 New Idria, 1983 Mw = 6.7Coalinga, 1983 Mw = 6.0 Nunez, and 1985 Mw = 6.0Kettleman Hills earthquakes. The main shocks were sepa-rated by 8, 2, and 25 months, respectively. In keeping withmost studies, we treat the events as occurring on westdipping thrust faults, although it should be noted thatDickinson [2002] argues that the shocks most likely struckon east dipping reverse faults. Although stress transferred bythe New Idria to the Coalinga shock is negligible (Figure 7a),
the stress imparted by the Coalinga event to the Nunezrupture plane is large (Figure 8), suggesting that the Coal-inga shock promoted the Nunez earthquake. The Coulombstress increase at the base of the Nunez fault is about 4–10 bars (Figures 8a and 8b), and is unclamped by 20 bars,because of its proximity to the Coalinga source (Figure 8d).[14] Aftershocks of the New Idria and Coalinga events
are concentrated in regions of calculated Coulomb stressincrease (Figures 7a and 7b), although this is less true forthe Kettleman Hills aftershocks (Figure 7c). In cross sec-tion, the distributed pattern of Coalinga aftershocks in theepicentral area (Figure 9b) and at the future epicenter of theKettleman Hills shock (Figure 9c) is also in rough accordwith the calculated Coulomb stress change. The absence ofsuch correlations between background seismicity and thesubsequent earthquake stress changes (Figures 7d–7f andFigures 9d–9f ) furnishes additional support that after-
Figure 4. Stress transferred by (a) short versus (b) long blind thrust source faults dipping 30�. Stress issampled on a horizontal plane bisecting the fault. To illustrate which type of receiver fault is most likelyto be promoted, stress is calculated on optimally oriented receiver faults; in other words, at every pointthe plane on which the Coulombs stress change is most positive is shown. The stress increases beyond theends of the long and short source fault are about the same, but the zone of stress decrease perpendicular tothe strike of the source fault is much broader along strike for the long fault. While thrust faulting ispromoted beyond the ends of a thrust fault rupture, the region over which strike-slip faulting is enhancedextends over a much larger area.
B02303 LIN AND STEIN: STRESS TRIGGERING AND FAULT INTERACTION
5 of 19
B02303

shocks are the product of the coseismic stress changes, ratherthan being a continuation of the background seismicity.
4. Stress Transfer in Subduction Events
[15] The most robust features of subduction seismicity arethe occurrence of thrust aftershocks on the periphery of theseismic rupture and along its downdip extension, and theoccurrence of normal faulting aftershocks in the outer rise,seaward of the trench (Figure 10a). Normal faulting eventsare abundant in the outer rise during the decades after themain shock, whereas thrust events in the outer rise are onlyseen in the decades before the next main shock (Figure 10b)[Lay et al., 1989]. To explain these observations, we firstinvestigate the stresses transferred by a great subductionearthquake to surrounding faults, and then examine thedistribution of stress on the rupture surface for two well-determined earthquakes.[16] To interpret the aftershock patterns seen in subduc-
tion zones, we calculate the stress that large main shocksimpart to the surrounding crust. Normal faulting is promotedin the upper lithosphere and inhibited downdip of therupture in the Wadati-Benioff zone (Figure 11a). In contrast,thrust faulting is promoted in the Wadati-Benioff zone, butis inhibited in the upper lithosphere except in a narrowregion in the back arc, above the lower edge of the sourcefault (Figure 11b). The outer rise is the product of tensionalstresses caused by the bending of the oceanic lithosphere[Hanks, 1971], whereas thrust earthquakes accommodatingsubduction delineate the Wadati-Benioff zone [Ruff andTichelaar, 1996]. The net effect of these stress changes istherefore to promote normal-faulting events in the outer riseand thrust events in the Wadati-Benioff zone (Figure 11c);in some cases, the subduction event also triggers thrusting
in the back arc. Static stress transfer can thus explain theclassic results of Lay et al. [1989], including the increase inouter rise normal faulting following major subduction earth-quakes (Figure 10b). Using a two-dimensional viscoelasticmodel, Taylor et al. [1996] first reached similar conclusionsfor the outer rise interactions, and we confirm their inter-pretation. Taylor et al. [1998] used a three-dimensionalelastic model to investigate strike-slip faulting in the backarc triggered by subduction events.
5. Aftershock Triggering by Great SubductionEarthquakes
[17] Close inspection of earthquake triggering in subduc-tion zones requires detailed models of the distribution ofcoseismic slip. Barrientos and Ward [1990] developed avariable slip model for the world’s largest recorded earth-quake, the 1960Mw = 9.5 Chile event, by inverting geodeticand coastal uplift observations. We used their slip model tocalculate the Coulomb stress changes on the rupture planeand in its immediate vicinity (Figure 12a). The modelreveals large stress concentrations on and off the fault.When resolved on the rupture plane, 75% of the aftershocksoccur where the stress change is positive (Figure 12a). TwoM � 7 shocks that struck in 1974–1975 also lie in regionsof calculated stress increase. The few well-located after-shocks that lie beneath the rupture plane also occur in wherethe stress increased (Figure 12b). Aftershocks extend fartherfrom the north end of the rupture zone than they do from thesouth end, an observation also consistent with the off-faultstress increases.[18] Although considerably smaller, aftershocks of the
1995 Mw = 8.1 Antofagasta, Chile, earthquake are muchbetter located, permitting a stronger test of stress triggering.
Figure 5. Cross-sectional areas across the midpoint of a thrust fault, showing stresses imparted by a30�-dipping blind thrust source fault on nearby (a, b) reverse and (c, d) strike-slip receiver faults. Thepattern of stress change on strike-slip receiver faults differs markedly for long (Figure 5c) and short(Figure 5d) source faults. Strike-slip faulting is also enhanced above a blind thrust fault (Figure 5d).These cross sections can be compared with the map view for the same cases in Figure 4.
B02303 LIN AND STEIN: STRESS TRIGGERING AND FAULT INTERACTION
6 of 19
B02303

Klotz et al. [1999] inverted GPS data for a variable slipmodel for the 1995 shock, M. Chlieh et al. (Crustaldeformation and fault slip during the seismic cycle in thenorth Chile subduction zone, from GPS and InSAR obser-vations, submitted to Geophysical Journal International,2003, hereinafter referred to as Chlieh et al., submittedmanuscript, 2003) inverted GPS and InSAR geodetic datafor the first 3 years of postseismic slip, and Husen et al.[2000] relocated 1995 aftershocks using local earthquaketomography from a 90-day land and ocean bottomseismometer deployment. We calculate the coseismic Cou-lomb stress change on the fault surface, and compare thisto the principal aftershocks and site of postseismic slip(Figure 12c). Four out of the six largest shocks (red stars),and 82% of the well-relocated aftershocks (circles) lie inareas brought closer to Coulomb failure by the coseismicslip. Aftershocks extend farthest from the north end of the
rupture, where the off-fault stress changes are greatest. Inaddition, the postseismic slip lies on the downward portionof the subduction interface at a locality where the Coulombstress was most increased by the coseismic slip (Figure 12c).In cross section, some 80% of the aftershocks are located inareas of increased Coulomb stresses, especially downdip ofthe fault zone (Figure 12d). For neither the 1960 nor the1995 events is the background seismicity well enoughlocated to permit a comparison of pre-main shock andpost-main shock seismicity, as we did for the Californiathrust faults.
6. Stress Transferred by the San Andreas toNearby Thrust and Strike-Slip Faults
[19] The stress changes caused by a strike-slip earthquakeare most commonly calculated for strike-slip receiver faults
Figure 6. Triggering of a thrust earthquake on an adjacent patch (shaded) of similar size along strike.The source and receiver faults both dip 30�; 2 m of linearly tapered slip, as indicated by the nestedrectangles, is imposed on both the short and long source faults. (a) For a square source (L/W = 1),equivalent to Mw = 6.5 with a mean stress drop of 60 bars. A 1-bar stress increase occurs over 70% of theadjacent patch. (b) For a long source (L/W = 6), equivalent toMw = 7.0 with a mean stress strop of 47 bars.Only 15% of the adjacent patch experiences a 1-bar stress increase. In both Figures 6a and 6b, thedowndip width, W, of the source fault controls the along-strike extent of the 1-bar stress increase area inthe adjacent fault patch. (c) Cross section showing fault geometry.
B02303 LIN AND STEIN: STRESS TRIGGERING AND FAULT INTERACTION
7 of 19
B02303
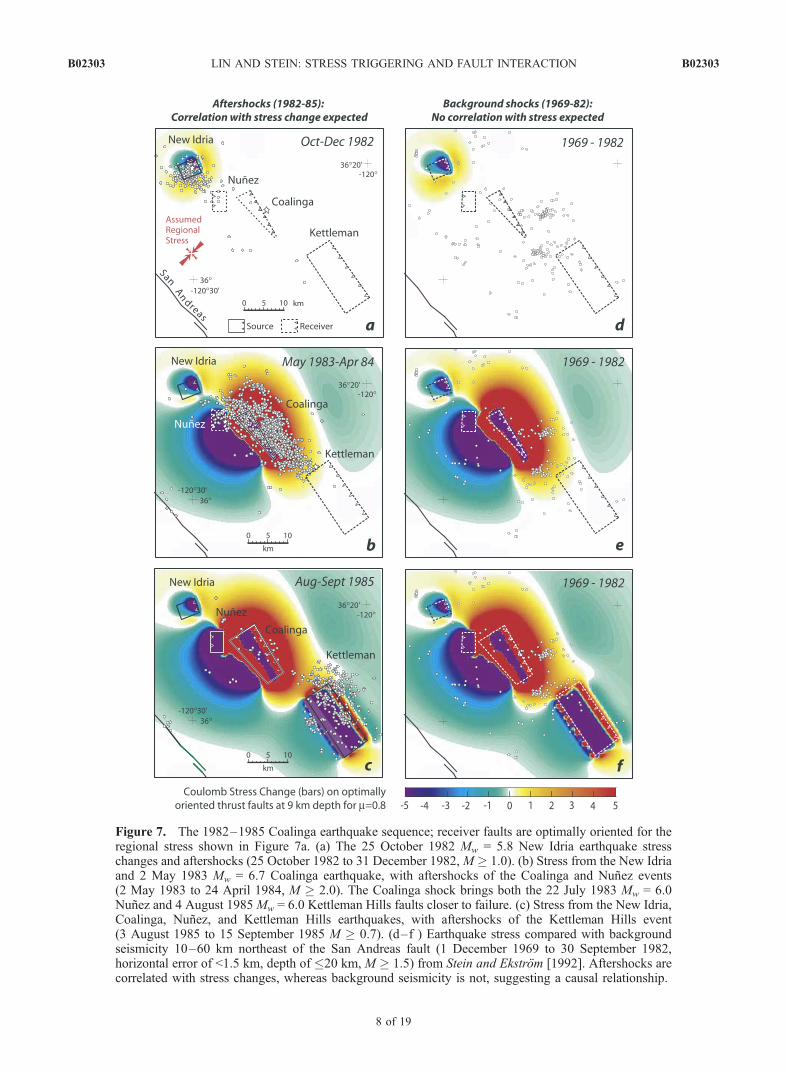
Figure 7. The 1982–1985 Coalinga earthquake sequence; receiver faults are optimally oriented for theregional stress shown in Figure 7a. (a) The 25 October 1982 Mw = 5.8 New Idria earthquake stresschanges and aftershocks (25 October 1982 to 31 December 1982,M � 1.0). (b) Stress from the New Idriaand 2 May 1983 Mw = 6.7 Coalinga earthquake, with aftershocks of the Coalinga and Nunez events(2 May 1983 to 24 April 1984, M � 2.0). The Coalinga shock brings both the 22 July 1983 Mw = 6.0Nunez and 4 August 1985Mw = 6.0 Kettleman Hills faults closer to failure. (c) Stress from the New Idria,Coalinga, Nunez, and Kettleman Hills earthquakes, with aftershocks of the Kettleman Hills event(3 August 1985 to 15 September 1985 M � 0.7). (d–f ) Earthquake stress compared with backgroundseismicity 10–60 km northeast of the San Andreas fault (1 December 1969 to 30 September 1982,horizontal error of <1.5 km, depth of �20 km, M � 1.5) from Stein and Ekstrom [1992]. Aftershocks arecorrelated with stress changes, whereas background seismicity is not, suggesting a causal relationship.
B02303 LIN AND STEIN: STRESS TRIGGERING AND FAULT INTERACTION
8 of 19
B02303

that are parallel to the main rupture [e.g., King et al., 1994](Figure 13a). However, if the receiver faults are not parallelto the main rupture or are thrust planes, the resulting stresspatterns are quite different (Figures 13b–13d). These casesare idealizations of the pattern of stress transfer from thegreat 1857 Mw = 7.9 Fort Tejon earthquake to existingnearby thrust and strike-slip faults, including the Coalinga
thrust belt (Figure 13b), the White Wolf reverse fault(Figure 13c), and the Garlock strike-slip system (Figure 13d).
6.1. Stress Transferred to the Coalinga Thrust Belt
[20] The 1982–1985 Coalinga sequence slipped only asmall portion of a chain of blind thrust faults that runsparallel to the San Andreas fault (Figure 14a). These faultsaccommodate several mm/yr of shortening perpendicular tothe strike of the San Andreas [Bennett et al., 1999]. Whyhave the thrust faults in only a relatively confined regionruptured during the past century? We calculate that thesethrust faults were uniquely stressed both by the 1857 Mw =7.9 Fort Tejon earthquake (Figure 14b), and by the succeed-ing 125 years of interseismic stress accumulation(Figure 14c). The New Idria and Coalinga faults werebrought �0.25 bars closer to Coulomb failure by the 1857earthquake (Figure 15a); this pattern can be compared to thesimpler case shown in Figure 13b. We note that a 12 April1885 Mw �6.5 earthquake struck somewhere near Coalinga28 years after the Fort Tejon event [Toppozada et al., 1981].The intensity V isoseismal for the 1885 shock is located 5–25 km north of the 1983 Coalinga event [Stein and Ekstrom,1992], and so a thrust earthquake may have occurred in theregion brought closest to failure by the 1857 event.[21] Because the San Andreas creeps northwest of Park-
field (Figure 14c), interseismic stress that promotes thrustfaulting continuously builds east of Parkfield in the vicinityof the Coalinga and Kettleman Hills ruptures (Figure 15b).During the 125 years after 1857, we calculate that the stressincreased by 1.5 bars at Coalinga, but became stronglynegative to the southeast (Figure 15b). We note that ourinterseismic stress accumulation is likely oversimplified,and could be an underestimate if postseismic stressing wereaccelerated by viscoelastic relaxation [Pollitz and Sacks,1992].[22] The addition of the seismic and interseismic stress
thus favors thrust faulting near Coalinga (Figure 15c). Incontrast, at the average Holocene San Andreas slipping rate,the long-term stress transferred to the thrust belt by the SanAndreas in one average earthquake cycle shows no stressconcentration near Coalinga (Figure 15d). This is becausethe long-term stresses are principally caused by the faultbend, whereas the short-term concentration in stress iscollectively caused by the bend, the 1857 slip distribution,
Figure 8. Stress changes caused by the 1982 Mw = 5.8New Idria and 1983 Mw = 6.7 Coalinga source faultsresolved onto the plane of the subsequent 1983 Mw = 6.0Nunez rupture (receiver fault, strike 0�, dip 65�, rake 109�).(a) Map view of Coulomb stress changes at 9 km depth.Coalinga parameters are from Ekstrom et al. [1992]; Nunezparameters are from Eaton [1990]. (b) Coulomb stresschanges, (c) shear stress changes, and (d) unclamping incross section resolved on the Nunez rupture plane. Theresultant stress components are shown graphically in the topright-hand corner in Figures 8c–8d). The Nunez surfacerupture was first seen 40 days after the Coalinga mainshock, at the time of a shallow M = 5.3 shock on the Nunezfault; the largest Mw = 6.0 shock occurred 41 days later[Rymer et al., 1990].
B02303 LIN AND STEIN: STRESS TRIGGERING AND FAULT INTERACTION
9 of 19
B02303

and the absence of a full cycle of interseismic stressaccumulation during 1857–1983.
6.2. Stress Transferred to the White Wolf Thrust Fault
[23] The 1952 Mw = 7.3 Kern County shock, whichruptured the White Wolf reverse fault at the southern end
of the Coast Ranges fold belt (Figure 14a), also appears tohave been promoted by the 1857 earthquake, as previouslyreported by Harris and Simpson [1996] and Deng andSykes [1997]. We calculate that the 1857 earthquakeincreased the stress at the epicentral end of the WhiteWolf fault by 8 bars (Figure 16a). This pattern can be
Figure 9. Stress changes caused by the 1983 Mw = 6.7 Coalinga and Mw = 6.0 Nunez ruptures. TheCoalinga source includes postseismic slip that occurred before the 1985 Mw = 6.0 Kettleman Hillsrupture. (a) Map view at 9 km depth with Coalinga aftershocks (2 May 1983 to 4 April 1984, M � 2.0),showing a correspondence with stress changes, including a 1-bar stress increase at the future KettlemanHills epicenter. (b) Coulomb stress changes along profile B-B0, together with aftershocks along an 8-km-wide band. Note stress scale difference. (c) Coulomb stress changes along profile C-C0 within 5 km of thefuture Kettleman Hills epicenter, together with aftershocks along an 8-km-wide band. Stress is impartedby the Coalinga earthquake, resolved onto the future Kettleman Hills rupture plane (strike 142�, dip 12�,rake 109�, from Ekstrom et al. [1992]). (d–f ) Background seismicity (1 December 1969 to 30 September1982), as in Figure 7, showing no such correlations with the future coseismic stress changes.
B02303 LIN AND STEIN: STRESS TRIGGERING AND FAULT INTERACTION
10 of 19
B02303

Figure 10. Subduction seismicity. (a) Cross sections through subduction rupture zones [from Lay et al.,1989]. The approximate rupture surface, hypocenter (star), and aftershocks are shown, along with theposition of the trench. Aftershock magnitude is proportional to symbol size. Earthquake legend is in thebottom left-hand panel. Oceanward of the trench, the normal events are dominant; thrust events are morecommon on the downdip portion of the subduction interface. (b) Changes in outer rise seismicityfollowing great subduction earthquakes from Lay et al. [1989], based on the data of Christensen and Ruff[1988]. Normal-faulting events become abundant after subduction earthquakes (left); thrust eventsbecome less common after the main shock (right). In Figure 10b, seismicity is located on the vertical axisat the magnitude of the associated main shock. Circle size is proportional to the magnitude of theaftershock or pre-main shock event, and the timescale is nonlinear. For example, outer rise tensionalaftershocks of the 22 May 1960 Mw = 9.5 Chile event are evident 2–27 years after the main shock with4 � M � 7 (left); no outer rise thrust events are seen before or after the 1960 Chile shock (right).
B02303 LIN AND STEIN: STRESS TRIGGERING AND FAULT INTERACTION
11 of 19
B02303

compared with the idealization in Figure 13c, although thelatter lacks the big bend that further concentrates stress atthe White Wolf location (Figure 16a). The White Wolffault is also optimally positioned to be stressed by long-term San Andreas slip (Figure 16b); we calculate thatstress grows on the White Wolf fault at a rate of 1.5 barsper century due to long-term San Andreas slip. The
interevent time of large earthquakes on the White Wolffault is about 1000–2000 years [Stein and Thatcher,1981], and so San Andreas slip brings the White Wolffault 15–30 bars closer to failure every White Wolfearthquake cycle, which is about equal to the earthquakestress drop for the White Wolf event. The particular slipdistribution in 1857 added another 8 bars or 25–50% to
Figure 11. Stress change and seismicity associated with a great subduction earthquake. (a) Coulombstress imparted to normal receiver faults, with plate tectonic features labeled. Note stress increase in theouter rise, where normal faults are abundant. (b) Coulomb stress imparted to thrust receiver faults dipping55�, which reflects the overall subduction slab dip beneath the rupture plane of the 1957 Mw = 9.1Aleutian earthquake. Note stress increase on the downdip portion of the subduction interface.(c) Composite showing stress imparted to existing faults. Because of permanent tension in the outer risecaused by bending, normal faults predominate in the upper 35 km seaward of the trench. Because ofsubduction, thrust faults predominate in Wadati-Benioff Zone. Where normal faults are dominant,stresses from Figure 11a are shown; where thrust faults are dominant, stresses from Figure 11b areshown. The stresses are superimposed on aftershocks of the 9 March 1957 Mw = 9.1 Aleutian earthquake(M0 = 5 � 1029 dyn cm, dip 28�), showing a good correspondence with the model.
B02303 LIN AND STEIN: STRESS TRIGGERING AND FAULT INTERACTION
12 of 19
B02303

Figure 12. Calculated stress changes for two great Chilean subduction earthquakes. (a) Coulomb stresschanges associated with the 22 May 1960 Mw = 9.5 Chile earthquake, using the variable slip planarmodel of Barrientos and Ward [1990], which assumes a uniform rake equal to the plate convergencevector on a 20�-dipping plane, smoothed to 50 � 50 km patches. Stress changes are superimposed onaftershocks from Cifuentes [1989] (International Seismological Centre and International SeismologicalService catalogs, 21 May 1961 to 31 December 1983, M � 5.8). Small red stars are 18 August 1974Ms = 7.1 and 10 May 1975 Ms = 7.8 shocks, and large black stars are the main 1960 subevents. About75% of the aftershocks lie in regions of calculated Coulomb stress increase. Stress is calculated ondipping planes encompassing the rupture surface and projected onto ground surface. Because thiscalculation is on the rupture surface, shear stress changes dominate. (b) Cross section of stress changesalong W-E in (a), with corresponding aftershocks along the profile from Cifuentes [1989] (red circles)and Kadinsky-Cade [1985] (black circles). (c) Coulomb stress changes associated with the 30 July 1995Mw = 8.1 Antofagasta, Chile, earthquake, based on the variable slip model of Klotz et al. [1999],smoothed to 25 � 25 km patches (the model of Ihmle and Ruegg [1997] yielded similar patterns of stresschanges with minor differences in detail). Large white and gray stars show the NEIC epicenter and theHarvard centroid moment tensor (CMT), respectively, while small circles show 1995 aftershocks locatedby tomographic inversion by Husen et al. [2000] from a 90-day seismometer deployment. Mw � 6.0aftershocks during the first 3.3 years following the main shock are shown as red stars. The site ofpostseismic slip inferred from geodetic observations by Chlieh et al. (submitted manuscript, 2003) isshown as the dotted contour. Stress is calculated on dipping planes encompassing the rupture surface andprojected onto ground surface. (d) Cross section of stress changes with 1995 aftershocks from Husen etal. [2000].
B02303 LIN AND STEIN: STRESS TRIGGERING AND FAULT INTERACTION
13 of 19
B02303

Figure 13. Schematic Mw = 7.9 rupture on a vertical right-lateral fault to illustrate stress transferred toreceiver faults of various geometries and rakes. The rupture is 250 km long and 15 km deep, with 7.5 mof uniform slip extending over the central 150 km, tapering linearly to zero 50 km from each end; M0 =7.2 � 1027 dyn cm. Stress is sampled at 7.5 km depth. In Figures 13a–13d, examples of such a receiverfault are shown at one location, but the stress changes are plotted for such receiver faults at all locations.The main rupture resembles that of the 1857 Mw = 7.9 Fort Tejon earthquake except for the lack of theSan Andreas big bend and variable 1857 slip. Calculated stress changes (a) for right-lateral receiverplanes parallel to the main rupture (strike 0�, dip 90�, rake 180�) [e.g., King et al., 1994]; (b) for thrustreceiver faults parallel to the source quake (strike 0�, dip 20�, rake 90�), as an idealized representation forthe Coalinga thrust belt; (c) for thrust receiver faults perpendicular to the main rupture (strike 90�, dip45�, rake 90�), as an idealized representation for the White Wolf reverse fault; and (d) for left-lateralreceiver faults (strike 109�, dip 90�, rake 0�), as an idealized representation for the Garlock strike-slipsystem. We use m = 0.4 in Figures 13a and 13d for strike-slip receiver faults with significant cumulativeslip and m = 0.8 in Figures 13b and 13c for thrust faults that may be sensitive to changes in normal stress.
B02303 LIN AND STEIN: STRESS TRIGGERING AND FAULT INTERACTION
14 of 19
B02303

this amount, perhaps hastening the occurrence of the KernCounty earthquake.
6.3. Stress Transferred to the Garlock Strike-Slip Fault
[24] If San Andreas slip indeed promoted failure on theWhite Wolf thrust fault, why has the Garlock fault, just30 km to the south, also not ruptured since 1857? We findthat the 1857 Fort Tejon earthquake and long-term San
Andreas stressing yield a very different fate for the left-lateral Garlock fault than for the White Wolf thrust system.The 1857 earthquake inhibited failure on the left-lateralGarlock fault by 1–4 bars (Figure 16c; the idealized case isshown in Figure 13d), while long-term slip on the SanAndreas promotes failure only on the central Garlock faultby a modest �0.3 bars/century (Figure 16d). The stressdecrease associated with the 1857 event may explain whythe current strain accumulation rate on the central Garlockfault measured by GPS and trilateration is near zero [Milleret al., 2001; Savage et al., 2001], despite a Holocene slip of5–7 mm/yr [McGill and Sieh, 1993]: The 1857 earthquakemay have retarded the accumulation of stress on the Garlockfault during the past 150 years (Figure 16c). Two prehis-torical events are documented on the Garlock fault duringthe preceding 400 years, the last of which ruptured some-time during 1490–1810 [McGill and Rockwell, 1998;Dawson et al., 2003]. The Garlock slip rate may itself becontrolled by the left-lateral stress imparted by the long-term San Andreas slip, since they are both highest along thecentral Garlock fault (Figure 16d). No paleoseismic evi-dence for large earthquakes on the westernmost Garlock hasyet been found.
7. Conclusions
[25] Many of the outstanding observations of thrustseismicity are readily explained by the static Coulomb stresschanges. These include the tendency of moderate-sizedthrust events to progress along strike, distributed aftershockzones and abundant secondary faulting associated withblind thrust ruptures, the prevalence of outer rise normalfaulting events following subduction earthquakes, and after-shocks that ring the site of subduction slip. We usedpublished source models and aftershock catalogs for a halfdozen thrust earthquakes to calculate the Coulomb stressimparted to the surrounding crust. We calculated that thrustseismicity is promoted by stress increases of 1–25 bars, andis inhibited by stress decreases of the same amount. Thestress changes imparted by thrust faults are typically higherthan that for normal and strike-slip faults, an attribute seenfrom the smallest (Mw = 6.0 Whittier Narrows) to largest(Mw = 9.5 Chile) events examined.[26] In addition to providing further support for the
Coulomb hypothesis, the calculations have implicationsfor the seismic behavior of these faults in the future. Inparticular, we regard it as unlikely that the 1982–1985Coalinga thrust sequence will progress farther south toKettleman Middle or South Dome (Figure 14a) becausethe accumulated stress there since 1857 is calculated toinhibit such thrust faulting (Figure 15). Similarly, despite itsHolocene slip rate of 5–7 mm/yr, large earthquakes on theGarlock fault were inhibited by the 1857 Fort Tejon eventand so are unlikely to occur until another large San Andreasearthquake redistributes the stress on the Garlock. In Chile,both the 1960 and 1995 subduction events increased theCoulomb stress north of the rupture more than to the south(Figure 12), and so subsequent events are less likely tooccur to the south.[27] Whereas numerous authors have suggested that after-
shocks of subduction earthquakes cluster around theperiphery of the coseismic slip, we have offered a rigorous
Figure 14. Southern California fault system and SanAndreas slip model. (a) Active faults and folds withearthquake sources shown by their dates. Quaternary foldsare surrogates for blind thrust faults [Stein and Yeats, 1989;Lettis et al., 1997] (P, Parkfield; WC, Wallace Creek; TP,Tejon Pass; LP, Lake Palmdale; CC, Cajon Creek; Ket.Mid., Kettleman Middle Dome; Ket. So., Kettleman SouthDome). Blind thrust faults extend parallel to the SanAndreas fault nearly as far south as the White Wolf reversefault. (b) The 9 January 1857 Fort Tejon Mw = 7.9earthquake slip model from Sieh [1978], as modified bysubsequent work [Weldon and Sieh, 1985; Salyards et al.,1992; Grant and Sieh, 1993; Grant and Donnellan, 1994].(c) Interseismic stressing model for the period between the1857 Fort Tejon and 1983 Coalinga events, in which theSan Andreas fault slips at the long-term rate everywhereexcept in the 1857 rupture zone. The assumed depth of 1857faulting is based on the current lower depth of seismicityfrom Hill et al. [1990], as shown in Figure 14c. Slip inFigures 14b and 14c is right lateral.
B02303 LIN AND STEIN: STRESS TRIGGERING AND FAULT INTERACTION
15 of 19
B02303

Figure 15. Stress imparted to the Coalinga thrust belt by the San Andreas fault. (a) Coseismic stresstransferred by the 1857 Mw = 7.9 Fort Tejon earthquake, resolved onto the Coalinga rupture plane (strike150�, dip 15�, rake 90�), using the model shown in Figure 14b. The New Idria and Coalinga thrusts arebrought closer to failure, whereas the thrust belt immediately to the southeast (Ket. Middle and Ket.South) is inhibited from failure. (b) Interseismic stress accumulation during 1857–1983 using the modelshown in Figure 14c. (c) Net stress transferred since 1857, by addition of Figures 15a and 15b. Noteconcentration of stress in the Coalinga-Kettleman region and a marked decrease to the southeast. (d) Noincrease in stress near Coalinga in the calculated long-term stress transferred to the thrust belt by the SanAndreas in one average earthquake cycle, assuming Holocene average slipping rate on the San Andreas[Petersen and Wesnousky, 1994; Murray et al., 2001; Grant and Lettis, 2002].
B02303 LIN AND STEIN: STRESS TRIGGERING AND FAULT INTERACTION
16 of 19
B02303

exploration of this association for two well-determinedevents. Aftershocks concentrate where the stress increasesby more than about 2 bars, and are all but absent where thestress is calculated to have dropped by more than 10 bars.[28] Perhaps our most intriguing finding is the proposed
interaction between the San Andreas and associated thrustfaults. Harris and Simpson [1996] argued that the 1857Mw = 7.9 Fort Tejon earthquake promoted failure of the1952 Kern County predominantly thrust event by �2 bars;Deng and Sykes [1997] argued that the 1857 event andsubsequent interseismic stressing promoted failure of the1885 Mw �6.5 shock near Coalinga by �0.5 bars, the 1952Mw = 7.3 Kern Country quake by �10 bars, and the 1983Mw = 6.7 Coalinga event by �0.5 bar. We believe that ourportrayal of the coseismic, interseismic, and long-termstress transfer makes it easier to understand the nature of
these interactions. For the Coalinga thrust, it becomesapparent from Figure 15 that the 1857–1983 interseismicstressing most promotes failure; the 1857 event is far lessimportant. For the White Wolf fault, the opposite is true(Figure 16).[29] Together with previous investigations, this study
furnishes evidence for stress triggering of earthquakes.The phenomenon is apparent on spatial scales of 2–200 km, and timescales of hours to centuries. We thereforebelieve that building stress transfer into seismic hazardassessment must become a principal objective of earthquakeinteraction studies.
[30] Acknowledgments. We thank Shinji Toda for inspiration, SerkanBozkurt for technical prowess, and Greg Anderson, Ruth Harris, MicheleCooke, Steven Jaume, and Cliff Thurber for perceptive reviews. All
Figure 16. Coulomb stress at a depth of 10 km transferred to the White Wolf thrust and Garlock left-lateral faults by the San Andreas fault. (left) Stress imparted by the 1857 Mw = 7.9 Fort Tejon earthquake;(right) stress due to the long-term San Andreas slip. (a) The 1857 earthquake promoted 8 bars of stressincrease at the 20-km hypocentral depth of the 1952 Kern County earthquake. Stress changes are resolvedon receiver faults with the 21 July 1952 Mw = 7.3 Kern County earthquake parameters of Bawden [2001]for the southwest segment (strike 51�, dip 75�, rake 25�). We use m = 0.8, since this is a reverse fault with<4 km of cumulative slip. (b) The White Wolf fault calculated to be stressed at a rate of 1.5 bars/century,assuming Holocene average slipping rate on the San Andreas [Petersen and Wesnousky, 1994; Murray etal., 2001; Grant and Lettis, 2002]. (c) The 1857 earthquake inhibiting failure on the left-lateral Garlockfault by 1–4 bars. Stress changes are resolved on receiver faults with the average Garlock geometry(strike 55�, dip 90�, rake 0�) following Savage et al. [2001]. For the Garlock, we use m = 0.4 because it isstrike slip with 64 km of total offset [Miller et al., 2001]; paleoseismic dates are shown [McGill and Sieh,1993; Dawson et al., 2003]. (d) Failure promoted by the long-term San Andreas slip only on the centralGarlock, at a modest rate <0.3 bars/century. Perhaps for this reason, the central Garlock fault attains itshighest Holocene slip rate [McGill, 1998].
B02303 LIN AND STEIN: STRESS TRIGGERING AND FAULT INTERACTION
17 of 19
B02303

calculations were performed using Coulomb 2.5, which can be downloadedwith user’s guide and tutorial files from http://quake.usgs.gov/�ross. J. L.was supported by the National Science Foundation through grant NSF-EAR0003888; R. S. gratefully acknowledges funding from Swiss Re.Woods Hole Oceanographic Institution contribution 10944.
ReferencesBarrientos, S. E., and S. N. Ward (1990), The 1960 Chile earthquake:Inversion for slip distribution from surface deformation, Geophys.J. Int., 103, 589–598.
Bawden, G. (2001), Source parameters for the 1952 Kern County earth-quake, California: A joint inversion of leveling and triangulation obser-vations, J. Geophys. Res., 106, 771–785.
Bennett, R. A., J. L. Davis, and B. P. Wernicke (1999), Present-day patternof Cordilleran deformation in the western United States, Geology, 27,371–374.
Casarotti, E., and A. Piersanti (2003), Postseismic stress diffusion in Chileand south Peru, Earth Planet. Sci. Lett., 206, 325–333.
Christensen, D. H., and L. J. Ruff (1988), Seismic coupling and outer riseearthquakes, J. Geophys. Res., 93, 13,421–13,444.
Cifuentes, I. L. (1989), The 1960 Chilean earthquakes, J. Geophys. Res.,94, 665–680.
Dawson, T. E., S. F. McGill, and T. K. Rockwell (2003), Irregular recur-rence of paleoearthquakes along the central Garlock fault near El PasoPeaks, California, J. Geophys. Res., 108(B7), 2356, doi:10.1029/2001JB001744.
Deng, J., and L. R. Sykes (1997), Evolution of the stress field in southernCalifornia and triggering of moderate-size earthquakes: A 200-year per-spective, J. Geophys. Res., 102, 9859–9886.
Dickinson, W. R. (2002), Reappraisal of hypothetical Franciscan thrustwedging at Coalinga: Implications for tectonic relations along the GreatValley flank of the California Coast Ranges, Tectonics, 21(5), 1039,doi:10.1029/2001TC001315.
Dmowska, R., J. Rice, L. Lovison, and D. Josell (1988), Stress transfer andseismic phenomena in coupled subduction zones during the earthquakecycle, J. Geophys. Res., 93, 7869–7884.
Eaton, J. P. (1990), The earthquake and its aftershocks from May 2 throughSeptember 30, 1983, in The Coalinga, California, Earthquake of May 2,1983, edited by M. J. Rymer and W. L. Ellsworth, U.S. Geol. Surv. Prof.Pap. 1487, 113–170.
Ekstrom, G., R. S. Stein, J. P. Eaton, and D. Eberhart-Phillips (1992),Seismicity and geometry of a 110-km long blind thrust fault, 1, The1985 Kettleman Hills, California, earthquake, J. Geophys. Res., 97,4843–4864.
Freed, A. M., and J. Lin (1998), Time-dependent changes in failure stressfollowing thrust earthquakes, J. Geophys. Res., 103, 24,393–24,409.
Grant, L. B., and A. Donnellan (1994), 1855 and 1991 surveys of the SanAndreas Fault: Implications for fault mechanics, Bull. Seismol. Soc. Am.,84, 241–246.
Grant, L. B., and W. R. Lettis (2002), Introduction to the special issue onpaleoseismology of the San Andreas Fault system, Bull. Seismol. Soc.Am., 92, 2551–2554.
Grant, L. B., and K. E. Sieh (1993), Stratigraphic evidence for seven metersof dextral slip on the San Andreas fault during the 1857 earthquake in theCarrizo Plain, Bull. Seismol. Soc. Am., 83, 619–635.
Hanks, T. C. (1971), The Kuril Trench-Hokkaido Rise system: Large shal-low earthquakes and simple models of deformation, Geophys. J. R.Astron. Soc., 23, 173–189.
Hardebeck, J. L., J. J. Nazareth, and E. Hauksson (1998), The static stresschange triggering model: Constraints from two southern California after-shocks sequences, J. Geophys. Res., 103, 24,427–24,437.
Harris, R. A. (1998), Introduction to special section: Stress triggers, stressshadows, and implications for seismic hazard, J. Geophys. Res., 103,24,347–24,358.
Harris, R. A., and R. W. Simpson (1996), In the shadow of 1857—Theeffect of the great Ft. Tejon earthquake on subsequent earthquakes insouthern California, Geophys. Res. Lett., 23, 229–232.
Harris, R. A., R. W. Simpson, and P. A. Reasenberg (1995), Influence ofstatic stress changes on earthquake locations in southern California,Nature, 375, 221–224.
Hauksson, E. (1994), The 1991 Sierra Madre earthquake sequence in south-ern California: Seismological and tectonic analysis, Bull. Seismol. Soc.Am., 84, 1058–1074.
Hill, D. P., J. P. Eaton, and L. M. Jones (1990), Seismicity, 1980–1986, inThe San Andreas Fault System, California, edited by R. E. Wallace, U.S.Geol. Surv. Prof. Pap., 1515, 115–151.
Husen, S., E. Kissling, and E. R. Flueh (2000), Local earthquake tomogra-phy of shallow subduction in north Chile: A combined onshore and off-shore study, J. Geophys. Res., 105, 28,183–28,198.
Ihmle, P. F., and J.-C. Ruegg (1997), Source tomography by simulatedannealing using broad-band surface waves and geodetic data: Applicationto the Mw = 8.1 Chile 1995 event, Phys. Earth Planet. Inter., 131, 146–158.
Kadinsky-Cade, K. (1985), Seismotectonics of the Chile Margin and the1977 Caucete earthquake of western Argentina, Ph.D. thesis, CornellUniv., Ithaca, N. Y.
King, G. C. P., and M. Cocco (2000), Fault interaction by elastic stresschanges: New clues from earthquake sequences, Adv. Geophys., 44, 1–36.
King, G. C. P., R. S. Stein, and J. Lin (1994), Static stress changes and thetriggering of earthquakes, Bull. Seismol. Soc. Am., 84, 935–953.
Klotz, J., et al. (1999), GPS-derived deformation of the central Andesincluding the 1995 Antofagasta Mw = 8.0 earthquake, Pure Appl. Geo-phys., 154, 709–730.
Lay, T., L. Astiz, H. Kanamori, and D. H. Christensen (1989), Temporalvariation of large intraplate earthquakes in coupled subduction zones,Phys. Earth Planet. Inter., 54, 258–312.
Lettis, W. R., D. L. Wells, and J. N. Baldwin (1997), Empirical observationsregarding reverse earthquakes, blind thrust faults, and Quaternary defor-mation: Are blind thrust faults truly blind?, Bull. Seismol. Soc. Am., 87,1171–1198.
Lin, J., and R. S. Stein (1989), Coseismic folding, earthquake recurrence,and the 1987 source mechanism at Whittier Narrows, Los Angeles Basin,California, J. Geophys. Res., 94, 9614–9632.
McGill, S. F. (1998), Summary of neotectonic slip-rate studies of the Gar-lock and Owl Lake fault zones, San Bernardino County Mus. Assoc. Q.,45, 88–90.
McGill, S., and T. Rockwell (1998), Ages of late Holocene earthquakes onthe central Garlock fault near El Paso Peaks, California, J. Geophys. Res.,103, 7265–7279.
McGill, S., and K. Sieh (1993), Holocene slip rate of the central Garlockfault in the southeastern Searles Valley, California, J. Geophys. Res., 98,14,217–14,231.
Miller, M. M., D. J. Johnson, T. H. Dixon, and R. K. Dokka (2001),Refined kinematics of the Eastern California shear zone from GPSobservations, 1993–1998, J. Geophys. Res., 106, 2245–2263.
Murray, J. R., P. Segall, and P. Cervelli (2001), Inversion of GPS data forspatially variable slip-rate on the San Andreas Fault near Parkfield, CA,Geophys. Res. Lett., 28, 359–362.
Parsons, T. (2002), Global Omori law decay of triggered earthquakes: Largeaftershocks outside the classical aftershock zone, J. Geophys. Res.,107(B9), 2199, doi:10.1029/2001JB000646.
Parsons, T., R. S. Stein, R. W. Simpson, and P. A. Reasenberg (1999),Stress sensitivity of fault seismicity: A comparison between limited-offsetoblique and major strike-slip faults, J. Geophys. Res., 104, 20,183–20,202.
Petersen, M. D., and S. G. Wesnousky (1994), Fault slip rates and earth-quake histories for active faults in southern California, Bull. Seismol. Soc.Am., 85, 1608–1649.
Pollitz, F. F., and I. S. Sacks (1992), Modeling of postseismic relaxationfollowing the great 1857 earthquake, southern California, Bull. Seismol.Soc. Am., 82, 454–480.
Pollitz, F. F., and I. S. Sacks (1997), The 1995 Kobe, Japan, earthquake: Along-delayed aftershock of the offshore 1944 Tonankai and 1946 Nan-kaido earthquakes, Bull. Seismol. Soc. Am., 87, 1–10.
Richards-Dinger, K. B., and P. M. Shearer (2000), Earthquake locations insouthern California obtained using source-specific station terms, J. Geo-phys. Res., 105, 10,939–10,960.
Roering, J. J., M. L. Cooke, and D. D. Pollard (1997), Why blind thrustfaults don’t propagate to the earth’s surface: Numerical modeling ofcoseismic deformation associated with thrust-related anticlines, J. Geo-phys. Res., 102, 11,901–11,912.
Ruff, L., and B. W. Tichelaar (1996), What controls the seismogenic plateinterface in subduction zones?, in Subduction Top to Bottom, Geophys.Monogr. Ser., vol. 96, edited by G. E. Bebout et al., pp. 105–111, AGU,Washington, D. C.
Rymer, M. J., K. J. Kendrick, J. J. Lienkaemper, and M. M. Clark (1990),The Nunez fault and its surface rupture during the Coalinga earthquakesequence, in The Coalinga, California, Earthquake of May 2, 1983,edited by M. J. Rymer and W. L. Ellsworth, U.S. Geol. Surv. Prof.Pap., 1487, 299–318.
Salyards, S. L., K. E. Sieh, and J. L. Kirschvink (1992), Paleomagneticmeasurement of nonbrittle noseismic deformation across the San AndreasFault at Pallett Creek, J. Geophy. Res., 97, 12,457–12,470.
Savage, J. C., W. Gan, and J. L. Svarc (2001), Strain accumulation androtation in the eastern California shear zone, J. Geophys. Res., 106,21,995–22,007.
Seeber, L., J. G. Armbruster, W.-Y. Kim, N. Barstow, and C. Scharnberger(1998), The 1994 Cacoosing Valley earthquakes near Reading Pennsyl-
B02303 LIN AND STEIN: STRESS TRIGGERING AND FAULT INTERACTION
18 of 19
B02303

vania: A shallow rupture triggered by quarry unloading, J. Geophys. Res.,103, 24,505–24,521.
Shearer, P. M. (1997), Improving local earthquake locations using the L1norm and waveform cross correlation: Application to the Whittier Nar-rows, California, aftershock sequence, J. Geophys. Res., 102, 8269–8283.
Sieh, K. E. (1978), Slip along the San Andreas fault associated with thegreat 1957 earthquake, Bull. Seismol. Soc. Am., 68, 1421–1448.
Stein, R. S. (1999), The role of stress transfer in earthquake occurrence,Nature, 402, 605–609.
Stein, R. S. (2003), Earthquake conversations, Sci. Am, 288(1), 72–79.Stein, R. S., and G. E. Ekstrom (1992), Seismicity and geometry of a110-km long blind thrust fault: 2. Synthesis of the 1982–1985 Californiaearthquake sequence, J. Geophys. Res., 97, 4865–4883.
Stein, R. S., and W. Thatcher (1981), Seismic and aseismic deformationassociated with the 1952 Kern County, California, earthquake and therelationship to the Quaternary history of the White Wolf fault, J. Geo-phys. Res., 86, 4913–4928.
Stein, R. S., and R. S. Yeats (1989), Hidden earthquakes, Sci. Am, 260, 48–57.
Stein, R. S., G. C. P. King, and J. Lin (1994), Stress triggering of the 1994M = 6.7 Northridge, California, earthquake by its predecessors, Science,265, 1432–1435.
Taylor, M. A. J., G. Zheng, J. R. Rice, W. D. Stuart, and R. Dmowska(1996), Cyclic stressing and seismicity at strongly coupled subductionzones, J. Geophys. Res., 101, 8363–8381.
Taylor, M. A. J., R. Dmowska, and J. R. Rice (1998), Upper plate stressingand seismicity in the subduction earthquake cycle, J. Geophys. Res., 103,24,523–24,542.
Toda, S., and R. S. Stein (2002), Response of the San Andreas fault to the1983 Coalinga-Nunez earthquakes: An application of interaction-based
probabilities for Parkfield, J. Geophys. Res., 107(B6), 2126, doi:10.1029/2001JB000172.
Toda, S., and R. S. Stein (2003), Toggling of seismicity by the 1997Kagoshima earthquake couplet: A demonstration of time-dependentstress transfer, J. Geophys. Res., 108(B12), 2527, doi:10.1029/2003JB002527.
Toppozada, T. R., C. R. Real, and D. L. Parke (1981), Preparation ofisoseismal maps and summaries of reported effects for pre-1900 Califor-nia earthquakes, Calif. Div. Mines Geol. Open File Rep., 81-11 SAC, 1–182.
Wang, J. C., C. F. Shieh, and T. M. Chang (2003), Static stress changes as atriggering mechanism of a shallow earthquake: Case study of the 1999Chi-Chi (Taiwan) earthquake, Phys. Earth Planet. Inter., 135, 17–25.
Wang, W. H. (2000), Static stress transfer and aftershock triggering by the1999 Chi-Chi earthquake in Taiwan, Terr. Atmos. Ocean. Sci., 11, 631–642.
Wang, W. H., and C. H. Chen (2001), Static stress transferred by the 1999Chi-Chi, Taiwan, earthquake: Effects on the stability of the surroundingfault systems and aftershock triggering with a 3D fault-slip model, Bull.Seismol. Soc. Am., 91, 1041–1052.
Weldon, R. J., II, and K. E. Sieh (1985), Holocene rate of slip and tentativerecurrence interval for large earthquakes on the San Andreas fault inCajon Pass, southern California, Geol. Soc. Am. Bull., 96, 793–812.
Zoback, M. D., et al. (1987), New evidence on the state of stress of the SanAndreas fault system, Science, 238, 1105–1111.
�����������������������J. Lin, Department of Geology and Geophysics, Woods Hole Ocean-
ographic Institution, Woods Hole, MA 02543, USA. ( [email protected])R. S. Stein, U.S. Geological Survey, Menlo Park, CA 94025, USA.
B02303 LIN AND STEIN: STRESS TRIGGERING AND FAULT INTERACTION
19 of 19
B02303