striving to sustain returns - oliver wyman
TRANSCRIPT

BluePaperM
.
Corporate & Investment Banks
Striving to Sustain ReturnsWholesale Banking’s impressive returns reflect a decade of repositioning in Markets and IBD
We think improved returns are sustainable. A constructive macro and policy environment is just one driver. To lift returns even higher, unlock the value of Transaction Banking with a shift to recurring fees, services-based business models, and enhanced disclosure.
conflict of tment
ither FCA
Morgan Stanley does and seeks to do business with companies covered in Morgan Stanley Research. As a result, investors should be aware that the firm may have a interest that could affect the objectivity of Morgan Stanley Research. Investors should consider Morgan Stanley Research as only a single factor in making their invesdecision.For analyst certification and other important disclosures, refer to the Disclosure Section, located at the end of this report.
Oliver Wyman is a global leader in management consulting. For more information, visit www.oliverwyman.com.Oliver Wyman is not authorized or regulated by the PRA or the FCA and is not providing investment advice. Oliver Wyman authors are not research analysts and are nenor FINRA registered. Oliver Wyman authors have only contributed their expertise on business strategy within the report. Oliver Wyman’s views are clearly delineated.The securities and valuation sections of this report are the work of Morgan Stanley only and not Oliver Wyman.For disclosures specifically pertaining to Oliver Wyman, please see the Disclosure Section located at the end of this report.
+= Analysts employed by non-U.S. affiliates are not registerecommunications with a subject company, public appearance
d with FINRA, may not be associated persons of the member and may not be subject to FINRA restrictions on s and trading securities held by a research analyst account.

Paper
BlueMOLIVER WYMAN
Ronan O’KellyPARTNER+44 20 7852 [email protected]
Mariya RosbergPARTNER+1 646 364 [email protected]
Dylan WalshPARTNER+1 646 364 [email protected]
James [email protected]+44 20 7852 7631
Nikunj KhuttiPRINCIPAL+1 646 364 [email protected]
Alex BeckerPRINCIPAL+1 646 364 [email protected]
Milli KarlstromENGAGEMENT MANAGER+44 20 7852 [email protected]
AuthorsMORGAN STANLEY
Betsy Graseck, CFA1
EQUITY ANALYST+1 212 761 [email protected]
Magdalena Stoklosa, CFA2
EQUITY ANALYST+44 20 7425 [email protected]
Nick Lord3
EQUITY ANALYST+65 6834 [email protected]
Ken Zerbe, CFA1
EQUITY ANALYST+1 212 761 [email protected]
Izabel Dobreva2
EQUITY ANALYST+44 20 7677 [email protected]
Giulia Miotto, CFA2
EQUITY ANALYST+44 20 7425 [email protected]
Ryan Kenny1
EQUITY ANALYST+1 212 761 [email protected]
Vishal Shah2
RESEARCH ASSOCIATE+44 20 7677 [email protected]
1 Morgan Stanley & Co. LLC2 Morgan Stanley & Co. International plc+3 Morgan Stanley Asia (Singapore) Pte.+
+ = Analysts employed by non-U.S. affiliates are not registered w
restrictions on communications with a subject company, publi
ith FINRA, may not be associated persons of the member and may not be subject to NASD/NYSE
c appearances and trading securities held by a research analyst account.
Paper
NASD/
BlueMMORGAN STANLEY CONTRIBUTORS
Fred Brennan2
RESEARCH ASSOCIATE
Brad Fitter, CPA1
RESEARCH ASSOCIATE
Tyler Gering1
RESEARCH ASSOCIATE
Manan Gosalia1
EQUITY ANALYST
Mia Nagasaka4
EQUITY ANALYST
Alvaro Serrano2
EQUITY ANALYST
Nida Siddiqi5
EQUITY ANALYST
Brian Wilczynski, CFA1
RESEARCH ASSOCIATE
1 Morgan Stanley & Co. LLC
2 Morgan Stanley & Co. International plc+
3 Morgan Stanley Asia (Singapore) Pte.+
4 Morgan Stanley MUFG Securities Co., Ltd+.
5 Morgan Stanley & Co International plc (DIFC Branch)+
OLIVER WYMAN CONTRIBUTORS
Jason Ekberg
PARTNER
Daniela Peterhoff
PARTNER
Chris Allchin
PARTNER
Patrick Hunt
PARTNER
Christian Edelmann
PARTNER
Elizabeth Costa
PARTNER
Tony Hayes
PARTNER
Robert Mau
PARTNER
Ross Hibberd
Ford Beazley
+ = Analysts employed by non-U.S. affiliates are not registered with FINRA, may not be associated persons of the member and may not be subject to
NYSE restrictions on communications with a subject company,
public appearances and trading securities held by a research analyst account.
Paper
BlueM Contents5 Executive Summary
8 Value Upside Across Wholesale Banking
13 Double Down on Transaction Banking
27 Value Growth in Restructured Markets and IBD
30 Scale and Innovation Drive Leaders and Laggards

M
Morgan Stanley Research
Wholesale banks are delivering high returns. A decade ochanges in the Markets and IBD businesses has led to mbalance sheet use and volatility capture, laying the grounresilient performance in the pandemic. We think impreturns are sustainable given a positive macro and policy e– a differentiated view as most investors have priced in ation of returns down to 10%. We see room to go even highehidden value through a shift in focus to Transaction Baparticularly the high growth payments segment. To unlefocus on recurring fees in the core business and shift towabased models. Act quickly to fend off disruption.
Sustainably higher returns for CIBs, but with a shiftTransaction Banking. Wholesale banking businesses deresilience in the pandemic, delivering the best year in a revenues up 7% YoY and return on equity (ROE) of 12%. Tof a diversified model were clear as Markets and IBD franby 26% last year, benefiting from structural changereduced dependency on balance sheet and asset prices.more than offset weaknesses in rate-sensitive businepolicy during the pandemic helped, 2020 returns are suour view. First, the macro backdrop is constructive Nominal GDP growth in 2021-22, and the expectation of ulatory environment after a decade of reform. Secondpush even higher by unlocking hidden value in TransactThe fundamentals of this business remain strong, deliverthe cycle ROE of 30-45%. Yet there has been a vast transto non-bank players in this space over the past 3 years, witspecialists like Adyen and Square gaining over >$1TN of mtalization as banks have lost >$1TN. Non-bank business msignificant advantages, but the structural differencewholesale businesses and other players do not warrantvaluation. Banks can narrow the value gap, and reassert tleading position in the midst of market disruption, by douon Transaction Banking.
CIB industry ROEs of ~12% in our central case. Withotility and policy boost of 2020, wholesale revenues willwe expect revenues to remain in range or above 2017-20all but our downside scenario, with a constructive macroutlook and upside potential in the Transaction BankinThe industry cost outlook is positive: discipline (especiapensation) across leading banks has stabilized theEuropean banks continue to lag leaders on profitability, b
Executive Su
BluePaper
5
f structural ore efficient dwork for a
roved 12%+ nvironment normaliza-r and unlocknking – andash growth,rds services-
in focus to monstrated decade with he benefits chises grew s that have These gains sses. While stainable in with 7-10% a stable reg-, banks can
ion Banking. ing through fer of value h payments arket capi-odels have s between this gulf in heir current bling down
ut the vola- decline. Yet 19 levels in
o and policy g business. lly on com-
cost base. ut most are
mmary midway through significant cost restructuring programs that will continue to bring industry cost ratios down. We estimate a range of through-the-cycle ROE of 8-13% across our three scenarios, with returns improved from the pre-pandemic range of 9-10% in all but our most pessimistic scenario. With this growth outlook in mind, we see value upside for CIBs.
Narrowing the valuation gulf with non-banks. Wholesale banking businesses get a lower multiple from investors than adjacent non-bank players, who enjoy average P/E multiples double or quadruple that of global banks. A large part of this valuation gap can be explained by how these firms are assessed – with non-banks valued for fast revenue growth while banks are valued for earnings and returns – and by the regulatory capital requirements that impact banks. Nevertheless, we think there are steps management teams can take to narrow the gap. Together these actions are equivalent to 15% or >$200BN of market capitalization for the largest banks:
l Better disclosure now on Transaction Banking. Investorshave not rewarded banks for the strong fundamentals of thisbusiness. Transaction Banking offers stable revenues, stickyclient relationships, a source of funding for the bank and a clearlink to the real economy. We think more transparency inreporting can drive average valuation uplifts of 8% (up to 20%for some Global banks).
l Actions to drive sustainable returns over the longer term.The market is missing the fundamental value and outlook forthe wholesale business model: we project sustainably higherindustry returns whereas current market valuations imply thatreturns will revert to pre-pandemic levels. Credible actionsthroughout the cycle to sustain 2020-level returns can driveaverage valuation uplift of 7%.
C-Suite strategies to sustain returns. We see at least four leversmanagement teams can pull to drive sustainable returns and narrowthe value gap:
l Maintain investment in scale while managing risks inMarkets and IBD. The last five years have reinforced the earn-ings power of first-tier Markets and IBD businesses, as themodel has shifted away from risk warehousing and towardsless capital-intensive activities. While there will always be riskin the business and exposure to losses from idiosyncraticevents, the dynamics of the business have changed consider-
M
6
ably as a result of post-Global Financial Crisis reformmate that a dollar of revenue now uses 21% less baland attracts 34% less VaR than 10 years ago. This stshift was evident in the strength of these businessesheightened volatility of 2020 – although banks alsofrom the extraordinary policy response to shore up kets. Yet we continue to see a valuation gap relativebanks in this space, driven primarily by the high levethese businesses must hold relative to their risk. Bansuccessfully emphasize to investors the value of neteffects, countercyclical revenues, and reduced exposasset prices should be able to escape the valuation tSustainable revenue upside will be driven by those tmaintain their investment in scale, while also efficiencating capital toward growth areas like electronic trvate markets, ESG and digital assets.
l Optimize Transaction Banking to recoup losses oThe sharp downturn in interest rates in 2020 led to of Net Interest Income on deposits, and effectively wgrowth from the prior three years with $12BN in losThese lost revenues can be recouped over the next cthrough optimization of the existing business – reorcommercial model toward recurring fee income, incrcipline in liability management and deposit pricing, astrengthening cross-selling. Management teams whoquickly will grow now while preserving an option oncant upside from a macro recovery when rates rise lcycle, when banks should see a 15-20bps increase inInterest Margin – equating to ~$4BN of revenues fobanks – for each 100bps increase in interest rates.
l Position to capture >$400BN from services-baseLeading banks are shifting from transactional to servmodels through the development of Banking as a Se(BaaS) offerings, business to consumer (B2C) and cobusiness (C2B) initiatives, and deep sector ecosystemlonger-term value creation plays address changing ctations and needs, adapt to the growing ecosystem oservice providers, and target the areas of greatest pagrowth. In many instances, such offerings target clierequire capabilities that are typically outside the TraBank perimeter – requiring banks to look beyond trawholesale models and manage across internal silos a
BluePaper
s. We esti-ance sheet ructural during the benefited credit mar- to non-l of capital ks that can work ure to rap. hat can tly allo-
ading, pri-
f 2020.a collapseiped out
t revenues.ycle
ienting theeasing dis-nd move the signifi-ater in the Netr global
d models.ices-basedrvicensumer tos. These
lient expec-f financialyments
nts andnsactionditionalnd/or
work with partner networks. The optimal participation strate-gies for individual banks will vary based on the starting point, but banks can either play for scale or focus on deep specializa-tion. Those who succeed can bolster the value of the wholesale model and defend against disintermediation over the next 5-10 years.
l Integrate embedded payments assets. The past decade hasseen substantial value creation in the payments ecosystem, butbanks have largely missed out on this growth to date. Non-bankpayments providers have benefited from exposure to highgrowth (and capital light) payments business, and high levels ofinvestment into capabilities necessary to serve client needs.But even as non-banks become more competitive, banks havevaluable payments assets that exist across the group: manybanks have legacy merchant services businesses and scale pay-ments processing factories, and most have extensive wholesaleand retail customer networks and rich customer data. But feware maximizing the shareholder value of these assets by man-aging across siloes. We argue that banks should “use or lose”these assets – by either better integrating to drive growth andscale or divesting.
No time to waste as competitive pressures build in Transaction Banking. Transaction Banking is attracting investments from a wide range of new entrants – including both banks and non-banks – who are gaining share with lower costs thanks to API-driven platforms built on the cloud. The payments space has a rich $1.4TN total addressable market (TAM) across wholesale and retail, of which non-banks have picked up ~20% market share in the last 3-5 years as plug-and-play FinTechs have entered across the value chain. In some cases, new entrants are complementing and enriching bank offerings – but the risk of disintermediation for banks is high, and non-bank activity has already contributed to a ~20% decline in banks’ fee margins over the last 4 years. These trends are poised to accelerate as the pace of digitization increases, spurred on by the Covid pandemic. Regulatory barriers are also falling, enabling non-banks to expand into areas pre-viously off-limits such as deposit-taking businesses. Central Bank Digital Currencies (CBDCs) risk further disintermediating banks, though adoption is still in the early stages, and the direction in which CBDCs will develop is far from clear. Banks that prioritize Transaction Banking now are best positioned to fend off these threats.
M
Morgan Stanley Research
Scale, geography, and innovation remain critical models. We continue to see scale and geography drivinadvantages. The profitability gap between first-tier US and European (>70% CIR) banks was again significanreflecting the benefits of scale and a more favourable mament for US banks. In Markets and IBD, the shift away frosive business models has increased the value of scaleprovision and client service. In Transaction Banking, tinterest rate environment exacerbates differenceEuropean and US players, and the high fixed cost of theture poses challenges for smaller banks. We estimate ROE gap of 6% pts between leaders and laggards over
BluePaper
7
to winning g significant (<60% CIR) t in 2020,
cro environ-m risk-inten- in liquidity he negative s between infrastruc-
a wholesale the cycle.
Nevertheless, we see opportunities for specialists and those that can innovate successfully across the wholesale landscape. In Markets and IBD, smaller players can manufacture scale through alternative strategies and by using open platforms to serve clients through part-nerships to deliver core technology, product and even customer dis-tribution. In Transaction Banking, smaller players that have begun to develop services-based offerings and/or outsource legacy tech-nology can still be competitive. Across all parts of the business, banks that can successfully allocate and monitor investment dollars – and shift the culture of the bank to support innovation and cross-busi-ness collaboration – will continue to have a significant advantage.

M
8
Exhibit 1:A significant valuation shift has taken place from banks t
Global banks
Non-bank payments firms
Non-bank capital markets firms
Financial services valuation change ($BN) Top 10 firms by market cap, 2017 vs 2020
Market cap. growth
2
-16%
121%
71%
~1,520 ~1,272
~749 ~1,654
~261 ~446
2017 VS. 2020
1. Consensus NTM PE ratios from 12/31/2017 and 12/31/2020. Source: Refinitiv DatasWyman analysis.
Wholesale banks look undervalued vs. non-bankquestioned how banks would weather the pandemic-indto the real economy, with the dual banking headwinds interest rates and rising credit costs. Wholesale bankswith their best year in a decade, delivering 7% growth Yomarkets businesses provided a counter-cyclical buffer agties more closely linked to the real economy, helped signcentral banks underwriting the credit market. Yetdropped 22% for the industry. Over the past 3 years, thgap between non-banking businesses adjacent to both Banking and Markets & IBD has widened. Market cap declined in CIB businesses while increasing 70-120% firms, which now enjoy average P/E multiples double othat of Global banks. While non-banks have significanadvantages built around capital light, agile business mooften valued for their faster revenue growth, in our view ences do not explain the full valuation gulf between banbanks. Investors have undervalued the resilience of the
Value UpsidWholesale B
BluePaper
o non-banksP/E ratio change
017 vs. 20201
13x 12x
27x 48x
24x 29x
tream, Oliver
s. Investors uced shock
of ultra-low responded Y as capital ainst activi-ificantly by
valuations e valuation
Transaction growth has in non-bank r quadruple t structural dels and are these differ-ks and non- diversified
e Across anking
CIB business model and potential for upside in a constructive macro and regulatory environment, the strong fundamentals and latent value of the Transaction Banking business, and the structural reforms and counter-cyclical benefits of the Markets and IBD busi-nesses over the last five years. We argue that banks can and should focus on transparency and growth to unlock latent value and narrow the valuation gap.
Exhibit 2:Transactional flows have been a growth engine of the wholesale banking business, offsetting the broader decline in CIB revenues from ’16-‘19
Revenue waterfall, $BN 2016–2020
94
18
88
45 4948
77 78 92
2
2016
135
529
179
136
4 6 1
161
101
2019
208
125
2020
524562
Transactional flows have been a steady source of revenue in the wholesale banking business
Transactional flows offset negative total CIB revenue decline on 2016–19 by ~55%
Markets2
IBD
Securities Services
Transaction Banking
Lending
1. Revenue volatility is the standard deviation of the revenue growth rates from 2010-2020. 2. Includes Macro, Credit and Equities. Source: Coalition proprietary data, Oliver Wyman analysis.
Diversified CIB business model is undervalued. Transactional flow businesses (Transaction Banking and Securities Services) were the engine of CIB growth over the years preceding the pandemic, off-setting ~55% of the decline in revenues from other parts of the CIB business between 2016 and 2019. However, there was a sharp reversal in 2020: transactional flow revenues plummeted with the steep decline in interest rates and economic activity, while Markets and IBD businesses benefited from the spike in market volatility, strong client demand for liquidity, financing and broad fiscal and monetary stimulus. Broad-based CIB business models have bene-fited from exposure to both sets of businesses over the past cycle.

M
Morgan Stanley Research
There is a disconnect between valuations of Transactibusinesses inside banks and outside banks. Transact(defined here as payments and cash management, and trhas strong fundamentals that compare favorably to othnesses, delivering through the cycle ROE of 30-45%. Talso delivers stable revenues and earnings given client stiis a critical source of reliable low-cost funding. Yet discloeconomic value and performance of this business is limitecaptured within the full perimeter of CIB or within broadebanking businesses – incorporating a significant draWholesale Lending balance sheet. This drives a “conglocount” for the business – contributing a lower perceptionTransaction Banking businesses within banks than for businesses outside of banks. Meanwhile, the past decasubstantial value creation in the broader payments driving up the valuation of adjacent businesses outside obanks. The market capitalization of the top 10 largest noments players are now worth ~$400M more than the toas the market values non-banks on revenue growth wbanks on earnings. This translates into non-banks genethat is ~35x higher than banks.
Investors have not recognized the extent of structuand resilience in Markets and IBD. Trading losses werein the pandemic-driven recession than they were in Financial Crisis, in part due to the structural shifts thatundertaken in the last decade. Markets and IBD busintransformed their business models, reducing their exposprices while investing in the capabilities and infrastructuto provide liquidity and financing (and generate steady rall market conditions. Yet investors are still valuing theseas primarily risk warehousing activities.
Growth upside is significant with expected resilienceThe valuation disconnect is particularly notable when the strong 2020 performance and positive growth outindustry. We estimate in our central case that returns wilably higher than the 2017-2019 average – and even at th
BluePaper
9
our projections, we expect returns to be within range of the pre-pan-demic period average. We have defined three scenarios for CIB reve-nues over the next 3 years (described at the end of this section), and in each of these Markets and IBD soften, while Wholesale Lending and Transaction Banking slowly recover from sharper drops in 2020, supported by the positive outlook for the real economy. At the same time, leading banks have undertaken the difficult work to restructure their cost bases, and others are in the midst of significant programs, supporting a positive outlook on costs.
Our central case projects CIB ROE of ~12% by 2023, which is 2-3% pts above the 2017-2019 average. We see three components to this:
l Markets and IBD revenue will rebalance after the large swingsseen through the peak of the pandemic driving a ~1-2% ptsdecline in ROE from the highs of 2020; however, favorablemacroeconomic conditions, cost restructuring and balancesheet discipline in these businesses will sustain revenues andreturns at higher levels than pre pandemic rates.
l Global banks will continue to release provisions built up duringthe initial economic shock of 2020, adding ~1% pt to ROE, withthe upside skewed towards US banks who were more aggres-sive than their European counterparts in provisioning early in2020.
l Leaders have an opportunity to outperform by doubling downon Transaction Banking, pulling multiple commercial levers tocapture recurring fee income and optimize the use of the bal-ance sheet. This will add 1% pt to ROE industry wide, with asizeable gap between the leaders and laggards.
In the medium to long term we see three bold plays on Transaction Banking through which a further >$400BN revenues and returns upside can be captured, with these also extending outside of the wholesale CIB perimeter and into other areas of the bank. By cap-turing this opportunity, banks can also make the case for higher valu-ation multiples as their earnings becoming increasingly geared to high growth, low capital, fee-based businesses.
on Banking ion Banking ade finance) er CIB busi-he business ckiness, and sure on the d, generally r corporate
g from the merate dis- of value for comparable de has seen ecosystem,
f Wholesale n-bank pay-p 10 banks, hile valuing rating a PE
ral reforms far smaller the Global
banks have esses have ure to asset re required evenues) in businesses
in returns. considering look for the l be sustain-e low end of
M
10
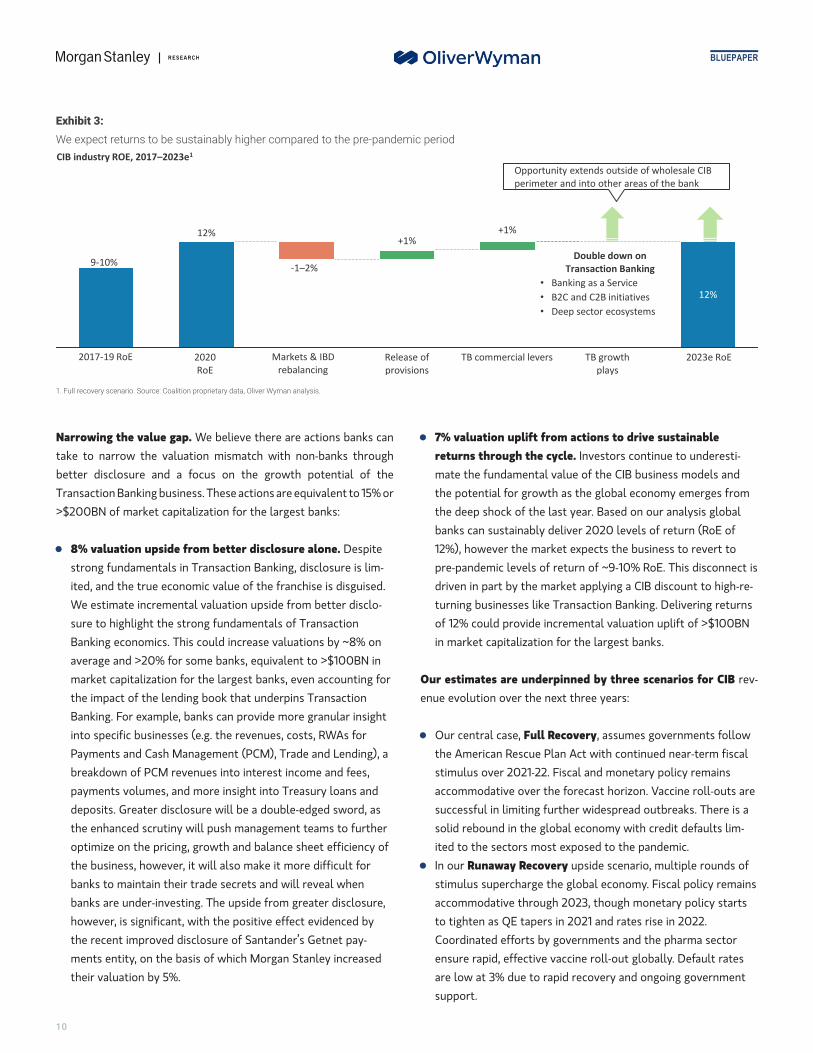
Narrowing the value gap. We believe there are actiontake to narrow the valuation mismatch with non-banbetter disclosure and a focus on the growth potenTransaction Banking business. These actions are equivale>$200BN of market capitalization for the largest banks
l 8% valuation upside from better disclosure alonestrong fundamentals in Transaction Banking, disclosited, and the true economic value of the franchise isWe estimate incremental valuation upside from bettsure to highlight the strong fundamentals of TransaBanking economics. This could increase valuations baverage and >20% for some banks, equivalent to >$market capitalization for the largest banks, even accthe impact of the lending book that underpins TransBanking. For example, banks can provide more granuinto specific businesses (e.g. the revenues, costs, RWPayments and Cash Management (PCM), Trade and breakdown of PCM revenues into interest income anpayments volumes, and more insight into Treasury ldeposits. Greater disclosure will be a double-edged the enhanced scrutiny will push management teamsoptimize on the pricing, growth and balance sheet ethe business, however, it will also make it more diffibanks to maintain their trade secrets and will revealbanks are under-investing. The upside from greater dhowever, is significant, with the positive effect evidethe recent improved disclosure of Santander’s Getnements entity, on the basis of which Morgan Stanley their valuation by 5%.
Exhibit 3:We expect returns to be sustainably higher compared to
12%
2017-19 RoE Markets & IBD
rebalancing
-1–2%
2020
RoE
9-10%
CIB industry ROE, 2017–2023e1
1. Full recovery scenario. Source: Coalition proprietary data, Oliver Wyman analysis.
BluePaper
s banks can ks through tial of the nt to 15% or :
. Despiteure is lim- disguised.er disclo-ctiony ~8% on100BN inounting foractionlar insightAs forLending), ad fees,
oans andsword, as to furtherfficiency ofcult for whenisclosure,
nced byt pay-
increased
the pre-pandemic period
Loser
s
Loser
s
12%
TB growth
plays
Release of
provisions
TB commercial levers 2023e RoE
+1%+1%
Double down on
Transaction Banking
Opportunity extends outside of wholesale CIB
perimeter and into other areas of the bank
• Banking as a Service
• B2C and C2B initiatives
• Deep sector ecosystems
l 7% valuation uplift from actions to drive sustainablereturns through the cycle. Investors continue to underesti-mate the fundamental value of the CIB business models andthe potential for growth as the global economy emerges fromthe deep shock of the last year. Based on our analysis globalbanks can sustainably deliver 2020 levels of return (RoE of12%), however the market expects the business to revert topre-pandemic levels of return of ~9-10% RoE. This disconnect isdriven in part by the market applying a CIB discount to high-re-turning businesses like Transaction Banking. Delivering returnsof 12% could provide incremental valuation uplift of >$100BNin market capitalization for the largest banks.
Our estimates are underpinned by three scenarios for CIB rev-enue evolution over the next three years:
l Our central case, Full Recovery, assumes governments followthe American Rescue Plan Act with continued near-term fiscalstimulus over 2021-22. Fiscal and monetary policy remainsaccommodative over the forecast horizon. Vaccine roll-outs aresuccessful in limiting further widespread outbreaks. There is asolid rebound in the global economy with credit defaults lim-ited to the sectors most exposed to the pandemic.
l In our Runaway Recovery upside scenario, multiple rounds ofstimulus supercharge the global economy. Fiscal policy remainsaccommodative through 2023, though monetary policy startsto tighten as QE tapers in 2021 and rates rise in 2022.Coordinated efforts by governments and the pharma sectorensure rapid, effective vaccine roll-out globally. Default ratesare low at 3% due to rapid recovery and ongoing governmentsupport.
M
Morgan Stanley Research
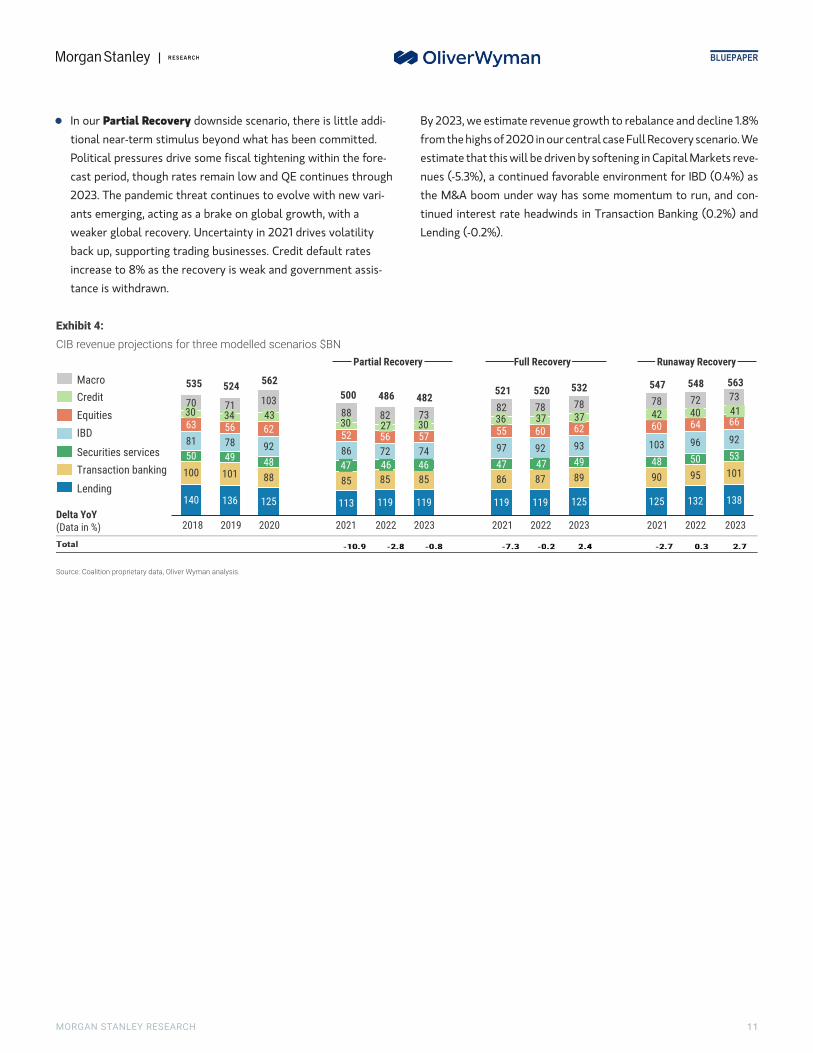
l In our Partial Recovery downside scenario, there is tional near-term stimulus beyond what has been comPolitical pressures drive some fiscal tightening withicast period, though rates remain low and QE continu2023. The pandemic threat continues to evolve withants emerging, acting as a brake on global growth, wweaker global recovery. Uncertainty in 2021 drives vback up, supporting trading businesses. Credit defauincrease to 8% as the recovery is weak and governmtance is withdrawn.
Exhibit 4:CIB revenue projections for three modelled scenarios $B
140 136 125
100 101 88
50 49 48
81 78 92
63 56 62
30 34 4370 71 103
2020
524562535
20192018Delta YoY (Data in %)
Macro
Lending
Credit
IBD
Equities
Securities services
Transaction banking
Source: Coalition proprietary data, Oliver Wyman analysis.
BluePaper
11
By 2023, we estimate revenue growth to rebalance and decline 1.8% from the highs of 2020 in our central case Full Recovery scenario. We estimate that this will be driven by softening in Capital Markets reve-nues (-5.3%), a continued favorable environment for IBD (0.4%) as the M&A boom under way has some momentum to run, and con-tinued interest rate headwinds in Transaction Banking (0.2%) and Lending (-0.2%).
little addi-mitted.
n the fore-es through new vari-ith aolatilitylt ratesent assis-
N
113 119 119 119 119 125 125 132 138
85 85 85 86 87 89 90 95 10147 49 48 50 5386 72 74 97 92 93 103 96 9252 56 5755 60 62 60 64 6630 27 3036 37
88 82 7382 78 78 78 72 73
42
47
482
46
2022 2022
46
2023 20222021
521
37
2023 2021
40
563
41
2023
500 486
2021
520 532 547 548
47
Partial Recovery Full Recovery Runaway Recovery

M
12
Exhibit 5:Scenario Descriptions
Partial Recovery
Policy
measures:
Near-term fiscal
stimulus
• All temporary measures from American Rescue
Plan Act expire with no additional fiscal stimulus,
European countries pause on meaningful
additional fiscal stimulus
Policy
measures:
Medium-term
fiscal policy
• Political pressures, debt sustainability and
inflationary concerns result in fiscal tightening in
2022
Policy
measures:
Monetary policy
• Accommodative monetary stimulus and QE
continues, rates stay near zero through 2023
Policy
measures:
Trade
• Geopolitical tensions escalate resulting
in increasing trade barriers
Pandemic
evolution
•
•
Variants continue to emerge which are resistant to
current vaccines
Pandemic hotspots continue to flare across globe
resulting in opening and closing of borders and
periodic lockdowns
Macro
environment
•
•
•
•
•
•
Weak global recovery
Global GDP increases to 4.7% in 2021,
with recoveries of 2-3% in Europe and US
US unemployment rate stays high at 7.5% in 2021,
with persistent unemployment at 6.9% in 2022
Falling global trade
Global indices down 10-20% in 2021
Volatility in 2021 due to pandemic and stimulus
uncertainty, but in 2022-23 is subdued by low
growth, low rates and ongoing QE
Yield curve
•
•
Yield curve flattens on expectations of weak
recovery
10y T rates at 1.35 by 4Q21
Credit
•
•
Default rates at 8% as recovery is weak and
government assistance is withdrawn
Credit spreads widen to 150 bps (IG), and 600 bps
(HY and Loans)
Source: Oliver Wyman analysis, Morgan Stanley Research.
BluePaper
Full Recovery Runaway Recovery
• US makes some measures of American Rescue
Plan Act permanent with some additional stimulus
measures passes in 2021‑22, moderate fiscal stimulus passed in European countries
• Many temporary measures from American Rescue
Plan Act are extended permanently and
administration passes a large infrastructure bill in
2021-22, with European countries also approving
large fiscal stimulus
• No tax increases or spending cuts as fiscal policy
remains accommodative
• Fiscal policy remains accommodative through
2023 driven by public pressure to support recovery
and drive to full employment
• Monetary policy remains loose with rates very low
through 2023, QE starts to taper off in 2022 amid
signs of recovery
• Growing inflationary pressures result in rates rises
in 2022 and withdrawal of QE in late 2021
• Geopolitical and trade tensions gradually
ease, with rapid thaw between US and Europe
• Geopolitical tensions significantly de-escalate
which results in widespread easing of trade
barriers (including US and China)
•
•
Vaccine rollout on schedule, herd
immunity reached in developed countries during
late summer
Isolated outbreaks in some developing countries
persist, but borders largely reopen, lockdowns are
absent from developed countries
•
•
•
New vaccines and increased distribution
accelerate efforts, herd immunity reached in
developed countries in spring/early summer
Coordinated effort by governments and
pharma sector ensure rapid rollout of vaccines in
developing countries
Borders and economies re-open and stay open
•
•
•
•
•
•
Solid rebound in global economy led by Asia
Global GDP increases by 6.4% in 2021; European
and US economies grow 4-7%
US unemployment rate drops to 5.1% in 2021, and
falls further to 3.9% in 2022
Trade flows gradually recover to pre-pandemic
levels
Global indices grow 2-5% in 2021
Volatility in 2021 and 2022 drives fiscal stimulus
and inflation concerns
•
•
•
•
•
•
Surging global economy as policy response and
pent up demand exceed expectations
Global GDP rises 8.1% in 2021; European and US
economies grow by 5-10%
US labor market rebounds with unemployment
dropping to 4.8% in 2021, and 3.5% in 2022
Sharp rebound in trade as economies re-open
Global indices rise 10-15% in 2021
Heightened volatility in 2021 and 2022 given
investor concerns over stimulus and inflation
•
•
Moderate steepening of the yield curve
10y T rates at 1.70 by 4Q21
•
•
Sharp steepening of the yield curve
10y T rates at 2.00 by 4Q21
•
•
Default rates at 6% as defaults are contained to
sectors most exposed to pandemic shock
Credit spreads are 100 bps (IG), 350 bps (HY) and
400 bps (Loans) on steady recovery
•
•
Default rates at 3% as rapid recovery and
continued government backstop results in few
defaults
Credit spreads narrow to 80 bps (IG), 300 bps (HY)
and 370 bps (Loans)
M
Morgan Stanley Research
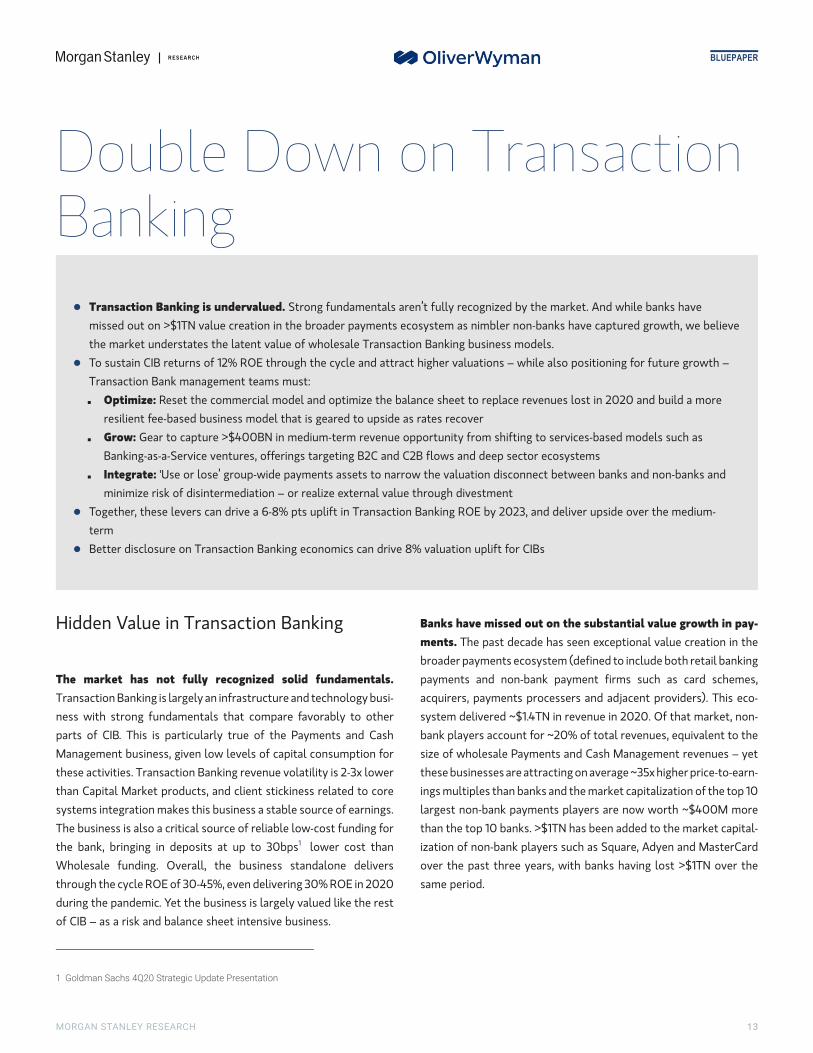
l Transaction Banking is undervalued. Strong fumissed out on >$1TN value creation in the broadthe market understates the latent value of whol
l To sustain CIB returns of 12% ROE through the cTransaction Bank management teams must:
Optimize: Reset the commercial model and oresilient fee-based business model that is geaGrow: Gear to capture >$400BN in medium-tBanking-as-a-Service ventures, offerings targeIntegrate: 'Use or lose’ group-wide paymentsminimize risk of disintermediation – or realize
l Together, these levers can drive a 6-8% pts uplifterm
l Better disclosure on Transaction Banking econom
Double DowBanking
Hidden Value in Transaction Bankin
The market has not fully recognized solid funTransaction Banking is largely an infrastructure and techness with strong fundamentals that compare favorabparts of CIB. This is particularly true of the PaymentManagement business, given low levels of capital consthese activities. Transaction Banking revenue volatility ithan Capital Market products, and client stickiness relasystems integration makes this business a stable sourceThe business is also a critical source of reliable low-costthe bank, bringing in deposits at up to 30bps1 loweWholesale funding. Overall, the business standalothrough the cycle ROE of 30-45%, even delivering 30% Rduring the pandemic. Yet the business is largely valued of CIB – as a risk and balance sheet intensive business.
1 Goldman Sachs 4Q20 Strategic Update Presentation
BluePaper
13
ndamentals aren’t fully recognized by the market. And while banks haveer payments ecosystem as nimbler non-banks have captured growth, we believeesale Transaction Banking business models.ycle and attract higher valuations – while also positioning for future growth –
ptimize the balance sheet to replace revenues lost in 2020 and build a more red to upside as rates recovererm revenue opportunity from shifting to services-based models such as ting B2C and C2B flows and deep sector ecosystems assets to narrow the valuation disconnect between banks and non-banks and external value through divestmentt in Transaction Banking ROE by 2023, and deliver upside over the medium-
ics can drive 8% valuation uplift for CIBs
n on Transaction
g
damentals. nology busi-ly to other s and Cash umption for s 2-3x lower ted to core
of earnings. funding for r cost than ne delivers OE in 2020
like the rest
Banks have missed out on the substantial value growth in pay-ments. The past decade has seen exceptional value creation in the broader payments ecosystem (defined to include both retail banking payments and non-bank payment firms such as card schemes, acquirers, payments processers and adjacent providers). This eco-system delivered ~$1.4TN in revenue in 2020. Of that market, non-bank players account for ~20% of total revenues, equivalent to the size of wholesale Payments and Cash Management revenues – yet these businesses are attracting on average ~35x higher price-to-earn-ings multiples than banks and the market capitalization of the top 10 largest non-bank payments players are now worth ~$400M more than the top 10 banks. >$1TN has been added to the market capital-ization of non-bank players such as Square, Adyen and MasterCard over the past three years, with banks having lost >$1TN over the same period.

M
14
Exhibit 6:Banks are the market share leaders in most PCM producnon-banks
Outlook:
Payments ecosystem market map – 2020 revenues, growth outloo
Modest pressure
Strong pressureModest growth
Strong growth
1. Transactional fees includes issuer and acquirer-based fees; 2. Account fees include tcategories based on latest data available. Revenues from card issuing business segmeon global banks. Source: Refinitiv Datastream, Coalition proprietary data, Oliver Wyman
But non-bank advantages are not insurmountable. Thdisconnect is only partially explained by the advantages business models – many of which are also availablNon-banks benefit from concentration in the high growe-commerce – a segment that has fueled payments growfited from changes in consumer and business behaviouemerged during the pandemic.
Exhibit 7:E-commerce is supercharging growth in payments. Thbeen accelerated by the pandemic with growth in retail sae-commerce in the US offsetting much of the decline inmerce volumes
10%
90%
11%
2018
89%86%
14%
2019 2020
81%
19%
3.7
20241
Rcs
3.2Rcs
3.33.0
US retail sales volumes, $TN
13% 20%
0% -12%
13%
4%
1. We assume total spending grows at 7% CAGR 2021-2022 and then at a normalized 42024. Source: eMarketer (Statista), Morgan Stanley Research estimate, Oliver Wyman a
BluePaper
ts across wholesale and retail but are comparatively less well positioned for growth vs.
12x 58x38x 27xAverage Consensus NTM P/Es4
k and P/E multiples
hose charged to account holders, including ACH, cheque processing and overdraft fees; 3. Includes full banking industry; for all other nts from payment networks have been allocated to Banks. 4. Consensus NTM P/E ratios from 12/31/2020 For banks, average based analysis, company annual reports and investor presentations.
is valuation of non-bank e to banks. th sector of th and bene-rs that have
is trend hasles driven by non-e-com-
etail non e-ommerceales volume
etail e-ommerceales volume
% CAGR in 2023-nalysis.
Non-bank payments providers are also benefiting from more agile approaches to meeting client needs. They are enabling acceptance of a broad set of payment types (from card, to account-to-account, to digital wallets) and providing a holistic view of the client. These players are often providing more than just payment acceptance as they are integrating their payments technology in their core business management software and developing additional value-added ser-vices to meet client needs, such as loyalty solutions and buy-now-pay-later lending offerings. While there will always be a valuation differential driven by the difference in capital consumption and regu-latory overhang between banks and non-banks, banks can and should attempt to narrow the valuation disconnect.

M
Morgan Stanley Research
Overview of non-bank payments Non-bank players in the Payments ecosystem inclurapid growth and increased market share of this se
Payment networks: These are companies that promerchants) to issuing banks (those that issued thethe two banks, supporting the authorization of thenetworks receive a network fee from merchant princlude Visa, MasterCard, UnionPay, and American
Merchant acquirers: These are the owners and maaccess to card and electronic payments by workingfees from merchants on each transaction and use a(interchange), processors, and networks. This grouacquisition), newer, fast growing players such as spayment processing capabilities thus becoming acrelationships with both merchants and consumers
Payment infrastructure and adjacent providers: rails and companies that provide services adjacentcooperatives and consortiums (e.g. SWIFT) as wellAdditionally, this category includes service provideservices (e.g. Transferwise, Remitly) and FX providCoupa, Basware, Tradeshift) that help facilitate soPayment Hubs providers (e.g. Kyribia, Ion); AccounHigh Radius, Bill.com); “Buy Now Pay Later” point Quantexa).
Optimize: To Recoup Lost Revenues2020
Banks should rebuild around a fee-based model. Thhas exposed underlying vulnerabilities in the Transactbusiness model, with $12BN revenues lost in 2020. TheTransaction Banking business model is highly geared toeffect ‘passive’ revenue streams driven largely by interesof growth in PCM revenues from 2016 to 2019 camInterest Income. While this was a boon for the whole Cover the past cycle, these gains were largely wiped out wiinterest rate declines of 2020.
BluePaper
15
playersde established incumbents and a wide range of FinTechs and consortia. The gment present both opportunities and challenges for Wholesale banks.
vide the network used to connect acquiring banks (i.e. those that support card to the customer). The payment network is responsible for connecting payment and the clearing and settlement of the transaction. These
ocessors and from card issuers on each transaction. Example networks Express.
nagers of the payments relationship with merchants who provide merchants with merchant processor partners to facilitate the transaction. They earn portion of the spread to facilitate the transaction by paying card issuers p includes traditional merchant acquirers (e.g. FIS post Worldpay
oftware providers (e.g. business management software) that have integrated quirers (e.g. Square, Shopify, Adyen), and end-to-end players who own (e.g. PayPal).
These are a wide variety of companies that include both electronic payment to payments. Electronic payment rails companies include traditional as newer companies that leverage distributed ledgers (e.g. Ripple). rs for payment adjacent areas, including Money Transfer / Remittance ers (e.g. MoneyCorp); pre-payment service or “source to pay” providers (e.g. urcing, procurement, and invoicing; Treasury Management Systems and ts Payable and Accounts Receivables automation providers (e.g. AvidXchange, of sale credit companies (e.g. Zilch); and fraud management companies (e.g.
of Exhibit 8:Transaction Banks can shift to more resilient recurring fee income to recover lost revenue from NIM compression
46
51
17
42
7
46
9
7
1616
2016 Fees
5
NII
7
51
17
9
78
2019
9
42
2020
274
85
+3% -13%
PASSIVE
ACTIVE
Global payments and cash management revenues, 2016-2020, $BN
~80% 2020 PCM revenue decline
driven by NII
1. Recurring fees include Liquidity and account management fees; 2. Transactional fees include Payments and receivables/collections and cards. Source: Coalition proprietary data, Oliver Wyman anal-ysis.
e pandemic ion Banking traditional what are in t rates: 75% e from Net IB industry
th the steep
M
16
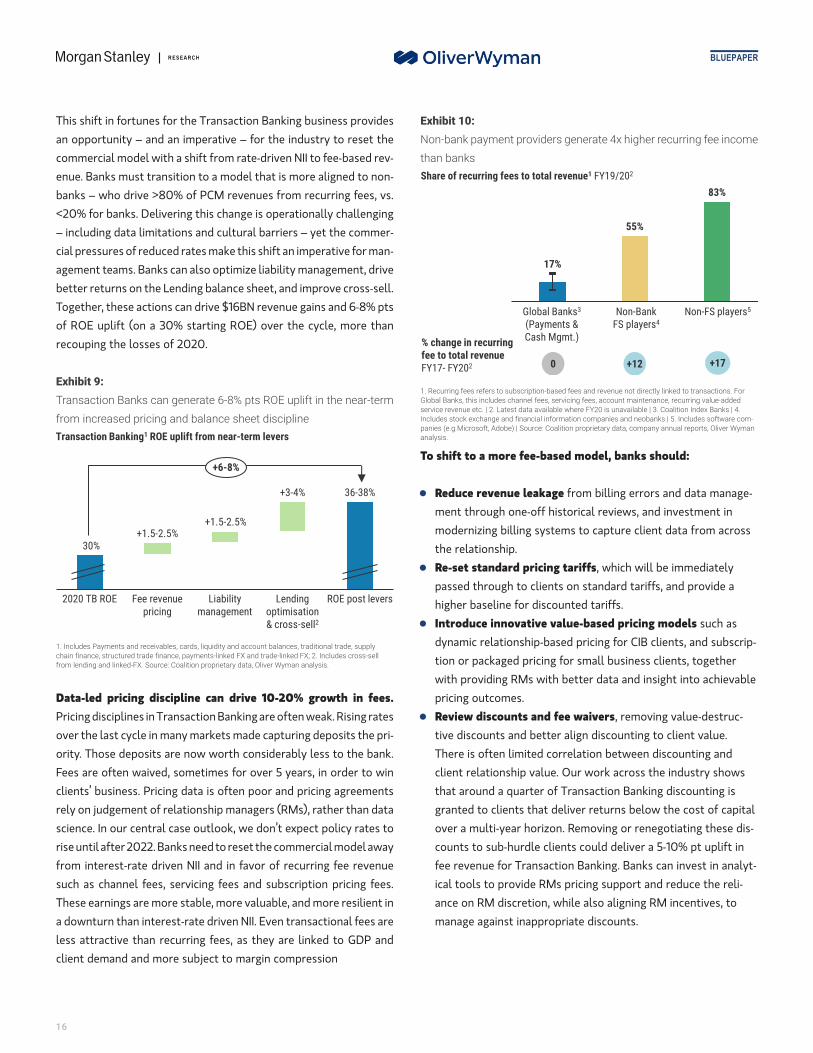
Exhibit 9:Transaction Banks can generate 6-8% pts ROE uplift in thfrom increased pricing and balance sheet disciplineTransaction Banking1 ROE uplift from near-term levers
2020 TB ROE
+1.5-2.5%
Fee revenue pricing
Liability management
Lending optimisation & cross-sell2
R
30%+1.5-2.5%
+3-4%
+6-8%
1. Includes Payments and receivables, cards, liquidity and account balances, traditionalchain finance, structured trade finance, payments-linked FX and trade-linked FX; 2. Inclufrom lending and linked-FX. Source: Coalition proprietary data, Oliver Wyman analysis.
This shift in fortunes for the Transaction Banking businean opportunity – and an imperative – for the industry commercial model with a shift from rate-driven NII to feenue. Banks must transition to a model that is more aligbanks – who drive >80% of PCM revenues from recurr<20% for banks. Delivering this change is operationally– including data limitations and cultural barriers – yet tcial pressures of reduced rates make this shift an imperatagement teams. Banks can also optimize liability managebetter returns on the Lending balance sheet, and improvTogether, these actions can drive $16BN revenue gains aof ROE uplift (on a 30% starting ROE) over the cyclerecouping the losses of 2020.
Data-led pricing discipline can drive 10-20% growPricing disciplines in Transaction Banking are often weak.over the last cycle in many markets made capturing depoority. Those deposits are now worth considerably less Fees are often waived, sometimes for over 5 years, in oclients’ business. Pricing data is often poor and pricing rely on judgement of relationship managers (RMs), rathscience. In our central case outlook, we don’t expect porise until after 2022. Banks need to reset the commercial from interest-rate driven NII and in favor of recurring such as channel fees, servicing fees and subscription pThese earnings are more stable, more valuable, and mora downturn than interest-rate driven NII. Even transactioless attractive than recurring fees, as they are linked client demand and more subject to margin compression
BluePaper
e near-term
OE post levers
36-38%
trade, supply des cross-sell
ss provides to reset the e-based rev-ned to non-ing fees, vs. challenging he commer-ive for man-ment, drivee cross-sell.nd 6-8% pts, more than
th in fees. Rising rates sits the pri-
to the bank. rder to win agreements er than data licy rates to model away fee revenue ricing fees.
e resilient in nal fees are
to GDP and
Exhibit 10:Non-bank payment providers generate 4x higher recurring fee income than banksShare of recurring fees to total revenue1 FY19/202
17%
55%
83%
Non-FS players5Non-Bank FS players4
Global Banks3
(Payments & Cash Mgmt.)
0 +17+12
% change in recurring fee to total revenueFY17- FY202
1. Recurring fees refers to subscription-based fees and revenue not directly linked to transactions. For Global Banks, this includes channel fees, servicing fees, account maintenance, recurring value-added service revenue etc. | 2. Latest data available where FY20 is unavailable | 3. Coalition Index Banks | 4. Includes stock exchange and financial information companies and neobanks | 5. Includes software com-panies (e.g Microsoft, Adobe) | Source: Coalition proprietary data, company annual reports, Oliver Wyman analysis.
To shift to a more fee-based model, banks should:
l Reduce revenue leakage from billing errors and data manage-ment through one-off historical reviews, and investment inmodernizing billing systems to capture client data from acrossthe relationship.
l Re-set standard pricing tariffs, which will be immediatelypassed through to clients on standard tariffs, and provide ahigher baseline for discounted tariffs.
l Introduce innovative value-based pricing models such asdynamic relationship-based pricing for CIB clients, and subscrip-tion or packaged pricing for small business clients, togetherwith providing RMs with better data and insight into achievablepricing outcomes.
l Review discounts and fee waivers, removing value-destruc-tive discounts and better align discounting to client value.There is often limited correlation between discounting andclient relationship value. Our work across the industry showsthat around a quarter of Transaction Banking discounting isgranted to clients that deliver returns below the cost of capitalover a multi-year horizon. Removing or renegotiating these dis-counts to sub-hurdle clients could deliver a 5-10% pt uplift infee revenue for Transaction Banking. Banks can invest in analyt-ical tools to provide RMs pricing support and reduce the reli-ance on RM discretion, while also aligning RM incentives, tomanage against inappropriate discounts.

M
Morgan Stanley Research
Exhibit 11:Optimizing the commercial model could deliver 10-20% gincome
~1-3%
+10-20% uplift
~3-5%
+10-20% uplift
~3-5%
~1-3%
~1-3%
~3-5%
+10-20% uplift
~1-3%
Fee revenue growth levers
Pricing innovation
Revenue leakage
Standard tariff review
Discounting
Fee revenue potential
Winning banks have been able to deliver >25% uplift in fee revenue fro
Source: Oliver Wyman analysis.
Improved liability management can optimize currenThe Transaction Bank sits at the heart of the core functioliability transformation. Low cost, sticky deposits are tandem with PCM and trade activities, and these are tfund the asset side of the balance sheet. Yet for many band liability management has become disconnected, anare often mis-priced; we see opportunities to extractmore dynamic and data-driven liability pricing:
l Modernize Funds Transfer Pricing (FTP). Group-leschemes that define the value of Transaction Bank dthe Group are often rigid, insufficiently granular, andsistently aligned to changing deposit values. This cantivize improper behaviors and muddle the value storTransaction Bank. As an example, 2020 saw increasein CIB TB deposits held by global banks – and while schemes compensated Transaction Banks for these dwe estimate that they resulted in an ROE drag of 20due to the low yield of non-lending assets in which tplaced. To modernize FTP processes and drive deposering behavior that is more aligned with bank fundinments, banks can use more granular segments whenliquidity and duration characteristics to better valueand deploy a more comprehensive set of liquidity coFTP calculations.
l Charge for negative rates. In Europe, interest ratesbeen negative for over five years. Despite this new nmany banks have been reluctant to charge clients foyielding deposits. We see this as a critical lever for inappropriate deposit gathering behavior and extractinand estimate that banks that do charge for negativegenerate an additional 50-100 basis points of ROE o
BluePaper
17
rowth in fee
~5-10%~5-10%~5-10%
m these levers
t footprint. n of a bank: gathered in hen used to anks, asset d liabilities
value from
vel FTPeposits to not con- incen-y for thes of >15%
FTPeposits,-30 bpshey wereit gath-g require- assigning depositsnstraints in
have nowormal,r negative-centivizingg value,
rates canverall.
l Optimize client level pricing. Finally, we see upside for banksthat optimize client level deposit pricing through increasedsophistication and granularity, reflecting an understanding ofclient-specific dynamics. Leading banks consider a client’s ratesensitivity, the expected stickiness and volatility of thedeposits, and the fully loaded deposit value when pricingdeposits. In geographies that have had higher rate environ-ments in recent years (e.g. the US, pockets of Asia), we haveobserved NII uplifts of 10-15% for banks that successfullyimplement data-driven deposit pricing enhancements. Yet, dataquality remains a current barrier to this tactic for many banks.
Strengthen discipline on credit extension and monetization. There is also optimization to be had on the asset side of the balance sheet. Traditionally, relationship lending – in the form of term loans or revolving credit facilities – has been seen as the entry ticket to access the valuable Transaction Banking wallet. Many corporates explicitly set Treasury policies to state that Transaction Banking and FX wallet can only be allocated to banks participating in their credit facility. Yet, for the CIB segment, standalone returns for vanilla lending are low, at 4% ROE on average. Given differences in product portfolios, data limitations, and process challenges around holding bankers accountable for credit decisions, many banks continue to lend too much for too little return. The disparities are significant: leading global banks deliver 2.5x the level of cross-sell on lending balance sheet as regional banks through a culture of cross-sell. If the laggards were to narrow the gap to peers – either by rationing lending balance sheet, or by more systematically driving cross-sell – they could add an average of 2-3% pts to Transaction Banking ROE.
Exhibit 12:Banks are still lending too much for too little – laggards have significant upside from better discipline2020 Payments and Cash Management cents revenue per $1 of vanilla loans balance sheet, average
0.9c1.1c
2.5c
Global banks with highly differentiated
propositions
Global banks winning with size
Average 1.5c
Largeregional banks
Source: Coalition proprietary data, company financial statements.
M
18
New payments structures are chaBanks need to keep their eye on the creation andhas been a growing wave of interest in the topic asbank clearing and settlement, and to pre-empt thestill in the early stages of adoption, most major ecstep-change in payment efficiency, convenience, finadvanced stages, such as Sweden and China who adigital currencies, for example, Facebook’s Diem, wcentral bank.
The creation of CBDCs poses a risk to the bankinlevels of disintermediation for incumbent banks. Tis the evolution of the distribution model for CBDdirect access to a centralized ledger. Alternatively,delegated to private actors (e.g. banks, payment sebanks:
l Deposits being placed directly with central bankbanks’ funding costs as low rate deposits becom
l In stress events companies may view CDBCs as athat of their banking partner, creating liquidity is
However, over time, the link between lending and Banking is weakening, creating opportunities for banks toselective in the deployment of credit. Transaction Bankinare increasingly being awarded by departments other th– for example by Sales, Marketing or Product Managecycles are moving away from request-for-propapproaches, to joint venturing and co-creation with quners. Switching costs are lower, making it easier foonboard new providers and diversify away from core leners. And some of the most attractive and fastest groprospects tend to have low financing requirements, ftechnology or platform businesses. Leading banks are areturns growth by proactively skewing their client portmost attractive sectors, and thereby reducing depelending.
Medium-term upside for those who act quickly. By rbusiness model to a more resilient fee-based one, bankquickly will be positioned for even more upside. As ratethe medium term, particularly in the US and Asia, we estiof 15-20bps in Net Interest Margin – equating to ~$4BN for global banks – for every 100bps increase in rates. Fucan be captured from the bold medium-term plays exppaper.
BluePaper
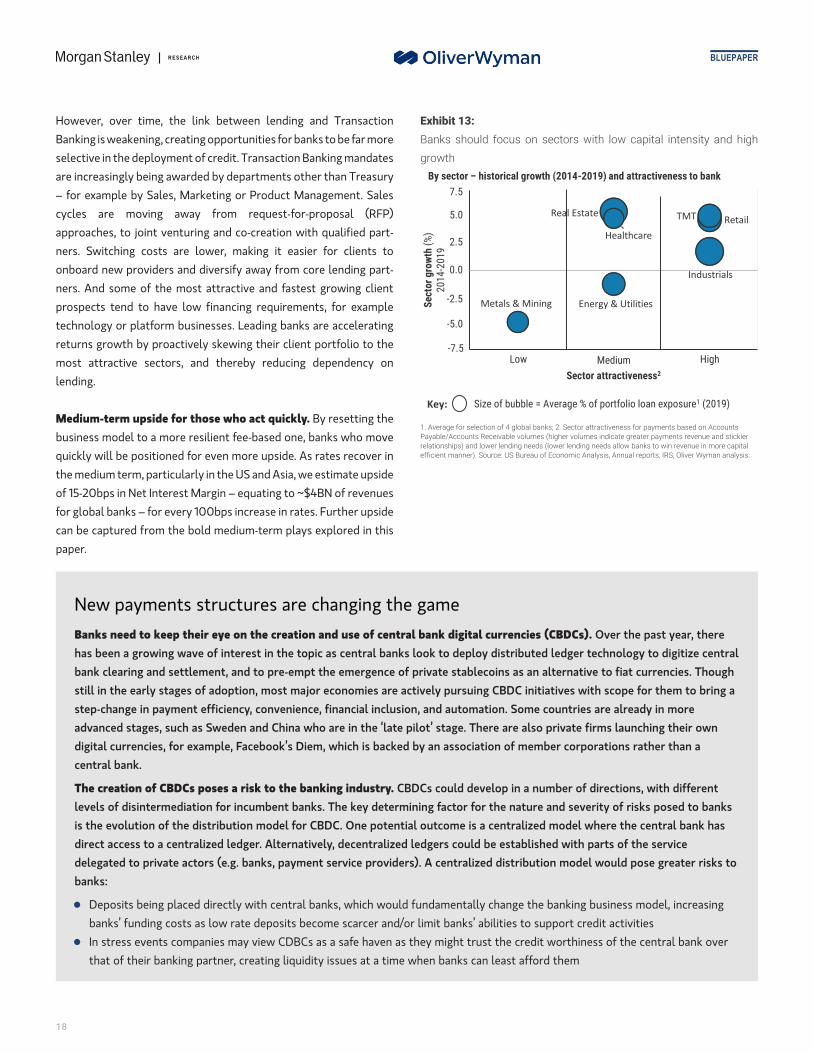
Exhibit 13:Banks should focus on sectors with low capital intensity and high growth
HighLow Medium
0.0
-5.0
-7.5
-2.5
2.5
5.0
7.5
Energy & Utilities
Healthcare
Real EstateRetailTMT
Industrials
Metals & Mining
Sector attractiveness2
Sec
tor
gro
wth
(%
)20
14-2
019
Key:
By sector – historical growth (2014-2019) and attractiveness to bank
Size of bubble = Average % of portfolio loan exposure1 (2019)
1. Average for selection of 4 global banks; 2. Sector attractiveness for payments based on Accounts Payable/Accounts Receivable volumes (higher volumes indicate greater payments revenue and stickier relationships) and lower lending needs (lower lending needs allow banks to win revenue in more capital efficient manner). Source: US Bureau of Economic Analysis, Annual reports, IRS, Oliver Wyman analysis.
nging the game use of central bank digital currencies (CBDCs). Over the past year, there central banks look to deploy distributed ledger technology to digitize central emergence of private stablecoins as an alternative to fiat currencies. Though onomies are actively pursuing CBDC initiatives with scope for them to bring a ancial inclusion, and automation. Some countries are already in more
re in the ‘late pilot’ stage. There are also private firms launching their own hich is backed by an association of member corporations rather than a
g industry. CBDCs could develop in a number of directions, with different he key determining factor for the nature and severity of risks posed to banks C. One potential outcome is a centralized model where the central bank has decentralized ledgers could be established with parts of the service rvice providers). A centralized distribution model would pose greater risks to
s, which would fundamentally change the banking business model, increasinge scarcer and/or limit banks’ abilities to support credit activities safe haven as they might trust the credit worthiness of the central bank oversues at a time when banks can least afford them
Transaction be far more g mandates an Treasury ment. Salesosal (RFP)alified part-r clients tonding part-wing clientor examplecceleratingfolio to thendency on
esetting the s who move s recover in mate upside of revenues rther upside lored in this
M
Morgan Stanley Research
However, we view a decentralized model as the mbanks to manage everything on their own accountmodel could have on the banking industry for execindustry than a centralized model, risks still exist,
l Instant settlement resulting in lower Net Interesl Central banks partnering with non-banks to deliv
What should banks do to prepare for the introdushould identify their preferred regulatory policies the amount of CBDC? should governments be reqwill central banks ensure that rates provided reflenegative rates in low interest rate environments? themselves to be trusted Central Bank partners acinterfaces, and merchant service capabilities.
Independent of the distribution model, by pursingprepared for a world where CBDCs are prevalent. targeting clients and sectors with greater AR and Ato be dependent on a bank’s full suite of capabilitiNII associated with a reduction in their deposit basabout their lending opportunities, banks can help
Grow: Target Bold Value Creation
Medium-term revenue opportunity of >$400BN fromservices-based model. Market structure change thlegacy business model, yet it also opens up an attracopportunity for those able to capture it. We see three bobanks can pursue to defend against disruption and cdeveloping Banking as a Service (BaaS) solutions, doublB2C and C2B opportunities, and building bank-led sectems. We estimate that banks can gain >$400BN in addnues by 2030 from these solutions, equivalent to the enwholesale Transaction Banking revenue pool today.
Disruption sets the scene for longer-term strategy. Fchanges in market structure are afoot, most notably tprevalence of central bank mandated real-time paymentledger technologies that are forcing the modernizationrails. Against this backdrop, clients are increasingly expglobal and real-time payment and liquidity managementdelivered in an intuitive and efficient way and embeddebusinesses. New competitors are bringing lower cost csolutions, integrated value-chain offerings, and digita
BluePaper
19
ost likely outcome in most geographies as it is very challenging for central . In addition, central banks are conscious of the adverse impacts a centralized ution and settlement. While this model has fewer risks to the banking including:
t Margins (NIM), lower transaction costs and feeser parts of the value chain, and thus facilitating loss of bank share
ction of CBDCs? In geographies where a centralized model is pursued, banks and advocate for them. Questions to consider are: should there be limits on uired to increase deposit insurance during a crisis to prevent a flight to CBDC? ct the lower credit risks associated with central banks, including the use of In geographies where a decentralized model is pursued, banks should position ross the value chain, including supporting customer due diligence, front-end
the recommendations detailed throughout this report, banks will be better Improving payment and cash management capabilities and solutions and P needs will help ensure stickier relationships as clients will be more likely
es. By increasing the share of fee revenue, banks are more resilient to a loss of e, and potential decreases in NIM from instant settlement. By being smarter ensure that a reduction in their liquidity base is less painful.
shifts to a reatens the tive growth ld plays that reate value: ing down on tor ecosys-itional reve-tire existing
undamental he growing s and digital of payment ecting 24/7 services, all d into their loud-based
l wallets to
market – prompting a wave of technology innovation from estab-lished players. There is increased dissatisfaction with bank solutions, and the barriers to switching banks are reducing. While ~85% of cor-porate treasurers feel that best in class products are critical to the banking relationship, less than half believe that banks are delivering these 2 .
These forces are driving changes in market structure that are breaking apart the legacy ‘vertically integrated’ model in which banks own the customer, product provision and processing layers. This legacy model is facilitated by a number of crucial advantages banks have historically held, including sticky client relationships, owner-ship of deposits and scale. But increasingly new entrants are dis-rupting this model. If banks fail to adapt, they risk partial disintermediation in which non-banks own the front to back pay-ments value chain for many of the highest return markets and seg-ments. While banks currently remain advantaged providers of much of the wholesale payments value chain, there is early evidence of the value chain breaking down in parts of the market already, as described in Asia: The canary in the coalmine for legacy Transaction Banking.
2 Source: CGI Transaction Banking Survey 2020

M
20
Driving forces of disruption, compl New entrants are gaining share. Today, the com
from incumbents. But new entrants like Goldmadriven platforms built on the cloud. Non-banks a(payments, reporting, transaction data services eyears, the non-banks in this space have pulled inwholesale and retail, now representing 20% of tset the backdrop for further potential disruption
l One of the barriers to entry for non-banks is given negative rates. While liquidity and deposTransaction Banking, this is beginning to fray at tregulators relax barriers to the deposits businessthemselves offer corporate clients cheaper alteris forcing corporate treasurers to look for more i
l FinTech disintermediation is poised to accelerwith FinTechs to launch payment solutions that the US, the FinTech Banking Charter and ILC (Indnon-banks to enter the deposit gathering businewe shouldn’t be surprised to see a broader set oon the ILC charter for many decades.
Based on these driving forces, we see three key scbanks to move quickly
l In our first scenario, Bank-Led Ecosystems prevacross the value chain of products and solutionsexamples of bank-led ecosystems play out, throu
l In our second scenario, non-bank players establisclients to plug into multiple ecosystems. Front-eback-end payment rails, but the value chain is brbased revenues and innovate value-added servicofferings that enable a more modular approach.
l In our third and most disruptive scenario, a Non-massive fee compression driven by lower cost paimpact on bank NII from a loss of float as the buin the core bank proposition of deposit-taking. Inthe front-to-bank payments value chain.
BluePaper
etition and market structurepetition for Wholesale bank Transaction Banking businesses comes mostly
n Sachs and challenger banks are gaining share with lower costs thanks to API-re picking up share as plug and play FinTechs on various sides of the equationtc) are moving in via partnerships or standalone offerings. Over the last 3-5 $290BN in revenues in the payments and cash management space acrosshe total. Technological market developments and evolving client expectations.deposits, which are already becoming less attractive in Europe and Japanit management are currently a barrier to entry to meaningful scale inhe edges given persistent negative rates in Europe and Japan and as bank in the US. With negative rates, Europe is in the eye of this storm as banks
natives to excess deposits which they have to charge for. This intensifying trendnnovative ways to manage liquidity.ate as regulatory barriers fall. Corporates can increasingly partner directlydistance banks from end customers. We see this happening already in Asia. Inustrial Loan Corporation) approval processes have picked up steam, enablingss. So far this has been limited to non-bank financial institutions like Square, butf non-banks apply – especially companies like Walmart, which has had its eye
enarios for how the market structure could evolve, underscoring the need for
ail as banks are able to upgrade front-end offerings and continue to dominate, maintaining client stickiness and pricing power. We are starting to seegh solutions launched for specific client segments by many global banks.h ownership of the client interface in a Disrupted Front-End model, enablingnd service providers still rely on banks for modular product solutions and theoken up and there is significant erosion to banks’ ability to drive recurring fee-es. Examples of this model are emerging through Banking-as-a-Service portal
Bank Revolution sees non-banks compete across the value chain, drivingyment rails, such as digital wallets. This scenario also contemplates a negative
lk of payments shifts to real-time and from non-bank players engaging directly Asia we see examples of this materializing already where non-banks capture

BluePaperM
Morgan Stanley Research 21
Exhibit 14:Banks that fail to adapt to changing market structure risk full disintermediation
Key:
TRADITIONAL MODEL 1. BANK-LED ECOSYSTEMS 2. DISRUPTED FRONT-END 3. NON-BANK REVOLUTION
Banks with front-end distribution and deliver end-to end client solutions
Upgraded front-end bank platforms, with integrated products and solutions (some 3rd party)
Banks disintermediated with non-banks capturing much
of distribution layer
Non-banks compete across value chain; banks provide product into
non-bank ecosystems
Client interface
Products and solutions
Processing and connectivity
Limited change in fee and net interest income value capture
and mix
Payment volume increase from new channels; value chain break-up puts downward pressure on fees and net interest income
High fee compression and net interest income
reduction as non-banks capture deposits
Potential future market structure scenarios in wholesale payments and cash management
Bank provided New entrants/structures
Source: Oliver Wyman analysis.
In practice we expect each of these scenarios to play out to different degrees in different sections of the market.
l Build Banking-as-a-Service (BaaS) solutions. New businessmodels are emerging that can supercharge growth forTransaction Banks. The wholesale BaaS market could representa $100-150BN opportunity by 2030. Banks can provideembedded financial products to third parties via APIs, andleverage existing assets: product capability, technology andoperations, balance sheet, and banking licenses. There are awide range of BaaS business models emerging acrossTransaction Banking and related products, ranging from fullend-to-end, white-labelled services, to selective ‘last mile’clearing connectivity.
Exhibit 15:Three bold growth plays can drive >$400BN in Total Addressable Market for the industry
250-300
25-50
BaaS solutionsBank-led ecosystems B2C/C2B solutions
100-150
2030 Total Addressable Market, $BN
% bank revenue
opportunity within
Wholesale CIB
business
Revenue opportunity will require bank-wide participation, not limited
to the wholesale CIB perimeter
Source: Oliver Wyman analysis.
Three bold plays to capture growth. But some banks are also uniquely positioned to capture a wave of growth in payments, drawing on their assets. They have large and loyal customer net-works that few FinTechs can replicate. They have banking licenses and connectivity to clearing systems. Some have scale infrastructure to process payments at low unit cost. These banks can deliver on three bold plays for value creation, capitalizing on new market struc-tures and client-led demand.

M
22
Exhibit 17:Banks can develop tailored B2C and C2B solutions to tac
Global payment flow and CAGR by segment
30
20C2C
B2B
C2B
B2C 65
12
Estimated global payment flows, 2019 US$ TN
Source: Oliver Wyman Analysis, IMF, Federal Reserve Bank, Statista (E-marketer).
Exhibit 16:We see four key archetypes of BaaS models, spanning a
Payments Trade Financing
Balance sheet/risk taking
Product
Channel
Technology
Operations
Clearing & settlement connectivity
Framing the BaaS archetypes set
Range of ser
Source: Oliver Wyman analysis.
Partners include smaller banks who increasingly struggthe fixed costs of the Transaction Banking business. Batotal of >$150BN on payments IT and operations, yet mabanks face cost-income ratios >90% and are struggling wof enabling new market infrastructure. We see a total revenue opportunity of $50BN in providing infrastructscale banks by 2030. New opportunities also exist embedded financial products (from lending to paymennon-bank platform businesses. B2B platforms are Gartner to represent 75% of B2B procurement by 2025, ingly are looking to enrich their offering by providingfinancial products, such as seller financing, embeddaccounts or supply chain finance. Platform businesses arpartner with banks and FinTechs to provide these capab
Across the range of opportunities, BaaS offers incumbenopportunity to access new customers at scale and in a co
BluePaper
kle the fastest growing pockets of payments flows
5%
7%
8%
6%
5
CAGR 19-22 Key drivers
Increase demand for P2P payments and rise of international money transfer fintech operators
Booming e-commerce industry, resilient to COVID disruptions and new payment methods (e.g. digital wallets, PayNow systems)
Rising disbursement and mass payout solutions; growth of the enabled gig economy
Driven by global e-commerce growth and emerging market SMEs’ expansion
Focus area
range of services and product offerings across businesses
FX
vices and product offerings across businesses
End-to-end offering Provision of full front-to-back services (channel, product, operations and execution)
Product as a serviceProvision of all services (including technology and operations) excluding channel
Infrastructure as a ServiceProvision of selected micro-services as a managed service(potentially enabled via API)
Execution onlyClients plugging into the bank’s “last mile” clearing connectivity
le to cover nks spend a ny regional ith the cost
outsourcing ure to sub-to provide
ts to FX) to forecast by and increas- embedded ed deposit e looking to ilities
way, and to add scale to existing platforms to lower unit costs in the core business. But the bar is high. Partners require modern, modular product offerings; direct API connectivity; fully digital customer experience; and the ability to stand up a new venture in months not years. Early movers include Goldman Sachs and Citi, who have part-nered with Stripe Treasury to provide embedded cash management services, and Standard Chartered, which has launched the Nexus BaaS platform.
l Double down on B2C and C2B opportunities. While the busi-ness-to-business (B2B) wholesale payments market that incum-bent Transaction Banks serve is the largest market in volumeterms, it is also the slowest growth market. Banks can targetsolutions that link corporates and end retail customers in orderto capture the growth in the fastest growing business-to-con-sumer (B2C) and consumer-to-business (C2B) payments flows.t banks the
st-effective

M
Morgan Stanley Research
While non-bank merchant services providers have builbeachheads here, there are opportunities for banks to bupropositions that serve these client needs and capture Examples of successful propositions include DBS, whicsolution to support real-time insurance claim settlementime payments, allowing insurance companies to improtomer experience, and reduce fraud and operational cobusiness models are also driving new opportunities, fmass disbursement solutions for gig economy businessethe B2C/C2B market represents a $250-300BN revenue for the industry by 2030. But banks will need to work harthis opportunity, as it is heavily competed by non-banwho can often build better propositions to meet end custfaster. For example, Stripe developed the driver payout cLyft, a US-based ridesharing platform. To win here, banksbuild low-cost and modular product capabilities, andirectly with customers to build propositions that worThey will also need to collaborate better across the orgbreak down siloes, build targeted propositions, and crotheir large retail and wholesale client networks.
l Deepen bank-led sector ecosystems. Coming out odemic, it is clear that sector is king. There have beenferences in credit quality between the worst hit sectas travel – and those that have accelerated their grothe crisis – such as e-commerce. The recovery will bpolarized as laggards struggle to restructure and rebdemand, and the fittest continue to thrive. Growth wportionately come from a few key sectors, such as teand healthcare. Banks should proactively shape theiportfolios to capture this growth and to leverage exstrengths in client franchise and footprint.
BluePaper
23
t significant ild targeted the growth. h has built a t using real-ve their cus-st. Platform or example s. Together
opportunity d to capture k specialists omer needs apability for will need to d innovate k for them. anization to ss-sell into
f the pan- stark dif-ors – suchwth duringe equallyoot clientill dispro-chnology
r clientisting
Successful sector ecosystems require banks to focus on high growth sectors where the bank is positioned to win, proactively targeting client selection and balance sheet towards the most attractive sectors. Banks can bring deep sector expertise by investing in intellectual capital, and organizing sales and cov-erage teams along sector lines. Finally, those that have suc-ceeded at developing sector ecosystem solutions do so together with customers. We see multiple examples of sector propositions in healthcare, such as the JP Morgan 2019 acquisi-tion of InstaMed to develop its payments services suite and push further into US healthcare payments. We see increased prevalence of successful sector propositions in Asia (see Asia: The canary in the coalmine for legacy Transaction Banking).
Based on the success of such models to date, we estimate a revenue opportunity for the industry of $25-50BN, as banks can grow revenues using these sector-led strategies at more than double the pace of the rest of the market, while also delivering compelling economics for the bank. Banks who deploy these deep sector propositions typically deliver signifi-cantly better economics than the rest of the business: 15-20% higher return on RWA; up to 40% higher deposit balances, and 20-30% lower customer churn rates. While the cost of devel-oping these ‘mass customisation’ solutions may be higher, thisis easily offset by the value of the deeper relationship.
Banks that can successfully implement these strategies will strengthen the client interface and benefit from further scale advan-tages in lowering unit cost. They also have the potential to grow valu-ation in the medium term: these business ventures are high-growth, fee-based and sticky, and will provide evidence to investors that Transaction Banking is a technology business and should be valued as such.

M
24
Asia: The canary in the coalmine fPockets of bank disintermediation are already ppayments value chain may seem far-fetched, we cathe service platform GoJek has released an e-wallewith e-wallet FinTech Ovo. These examples speak threat to incumbent banks – these trends are acce20203 , with increasing penetration into B2B paymdigitization, accelerated by the Covid pandemic anpresent, albeit less mature, on a global scale, and tare potentially just one big press release away.
By looking to Asia, not only can we see that the adapt. In fact, many of our proposed medium-termincludes:
l Sector-based solutions, such as Ping An’s creatiostrategy to better serve that sector, or Banksteeadded services, after starting as an online registefranchise Halcyon to launch HeveaConnect, a digmanufacturers with data and workflow capabilit
l BaaS propositions, such as Tencent’s distribution
Today, the question banks in Asia are asking is howcomparative advantages and leverage the rich dataclients. Banks across other markets need to be askmarket structure, and looking to Asia for inspiratio
3 Worldpay from FIS, 2021 Global Payments Report
Integrate: Use or Lose Embedded Payments Assets
Banks must prove they can be advantaged owners ofassets. Even as non-banks become more competitive,valuable payments assets across the group that can be baged. Many banks have legacy merchant services busscale payments processing factories, and most have extensale and retail customer networks and rich customer dare maximizing the shareholder value of these assets. Thmanaged in a siloed way, underinvested and uncompepared to the non-banks. Banks must now prove that theythe value of these assets and address perceived structtages of non-banks.
BluePaper
or legacy Transaction Bankinglaying out in Asia. While scenarios of non-banks owning the front to back n see evidence of this materializing in Asia already. For example, in Indonesia t service “Go-Pay”, and the e-commerce platform Tokopedia has partnered to the risk of non-banks encroaching on banking markets and the undeniable lerating, with 72% of e-commerce spend in China using digital wallet in ents. We only expect these trends to accelerate in Asia with the rise of hyper
d the associated growth in e-commerce. These same driving forces are he same types of threats to incumbent North American and European banks
threat is real, but we can also observe roadmaps and examples of how to business models discussed throughout this report originated in Asia. This
n of the healthcare software company Good Doctor as a component of itsl’s e-commerce proposition for steel in China that expanded to include value-r for buyers to sellers in 2013. DBS Bank partnered with natural rubberital marketplace for the rubber industry, connecting farmers, producers and tireies, which aims to increase price transparency and streamline processing. of financial service products
they can unlock the value of their local market expertise and their they sit on to generate insights and develop new growth propositions for ing what foundations they should be laying in preparation for a similar n.
embedded banks have etter lever-inesses and sive whole-
ata. But few ey are often titive com- can unlock ural advan-

M
Morgan Stanley Research
Exhibit 18:Banks can address perceived structural advantages of no
Source: Oliver Wyman analysis.
Banks must take a hard look at where they are uniquelyrelative to other banks, non-bank players, and client neeuate if they have the differentiated capabilities to competthat banks need to ‘use or lose’ their existing group-widassets to maximize shareholder value and deliver on ththat extend outside of the wholesale perimeter. That iseither need to better integrate their wholesale, retail anofferings and demonstrate shareholder value, or they shthese assets and realize a higher external valuation. To ‘ushould take a leaf out of the non-bank playbook and seektheir advantages wherever possible, whilst leveragingnetwork advantages of a bank:
l Invest in merchant acquiring capabilities to build outthe offering with value-added services, gearing it to growth e-commerce sectors
l Deliver commercial excellence in proposition developricing and execution to grow margin
l Better integrate disparate capabilities across wholesments, retail and merchant and manage these capabcross-business manner
l Leverage the salesforce to cross-sell merchant acquthe existing customer base
l Mine existing transactional data across retail and whbring rich insights to merchants and corporates to hgrow their businesses, target customers and reward
l Create targeted B2C/C2B propositions that bridge wand retail franchises
l Mirror FinTechs and define success based on long-tepotential as opposed to managing against in-year prgoals
BluePaper
25
n-banks
Structural gap Addressable
VS
positioned ds, and eval-e. We argue e payments e bold plays to say, they d merchant ould divest se it’, banks to replicate the unique
and enrichfaster
pment,
ale pay-ilities in a
iring into
olesale toelp them loyaltyholesale
rm growthofitability
l Explore opportunities to work together with other banks toreduce the risk of disintermediation by delivering differentiatedpropositions (for example, the European Payments Initiativewhich will provide cross-regional multi-channel payment rails)
For those unable to extract full value from the franchise, divestment of the merchant services business may deliver greater shareholder value, and allow the bank to partner with scale players with superior offerings. One example of a bank successfully divesting from compo-nents of its merchant services business is Fifth Third, which spun off its Merchant Acquiring business in 2009, selling 51% of a business valued at $2.4BN. The spun-off JV, Vantiv, was able to grow rapidly and significantly increase its valuation, with Fifth Third realizing a $1BN gain in 2017 through the sale of 3.7% of its stake in the business. In 2019, Vantiv was acquired by FIS at a valuation of $43BN, or 18x its valuation 10 years prior.

M
26
Exhibit 19:Management teams need to act now to recoup lost reven
• Grow fee revenue, with particular focus on higher quality recurring fees and data-driven pricing disciplines
• Dynamic and data-driven FTP and enhanced deposit pricing, including charging for negative yielding deposits
• Increase cross-sell of linked-FX
• Optimise the balance sheet, increasing cross-sell between lending and payments and cash management; ration the deployment of lower return vanilla lending
• Disclose more be aware that tgive rise to scron underperforof the business(e.g. lending)
• Double down oand C2B oppore-commerce/p/merchant servleveraging bancapabilities nothe wholesale p
Near-term
Management actions
Source: Oliver Wyman analysis.
BluePaper
ues in the short term and position themselves to defend against disruption
Scale players
• Play for scale, leveraging partnerships to enhance and deliver propositions:– Banking as a Service (BaaS) ventures– Deep sector integration
• Renew technology backbone to deliver low cost, streamlined infrastructure
Sub-scale players
• Focus on client interface and areas of strength, e.g. deep local knowledge/connectivity
• Choose specific sectors to specialize in without playing everywhere, and win business through superior propositions
• Partner to enhance and deliver propositions
• Outsource core parts of your infrastructure where you don’t have sufficientscale, or create differentiation
– buthis will utiny ming parts
n B2C tunities –latformsices –k-wide t limited to erimeter
Medium-long term
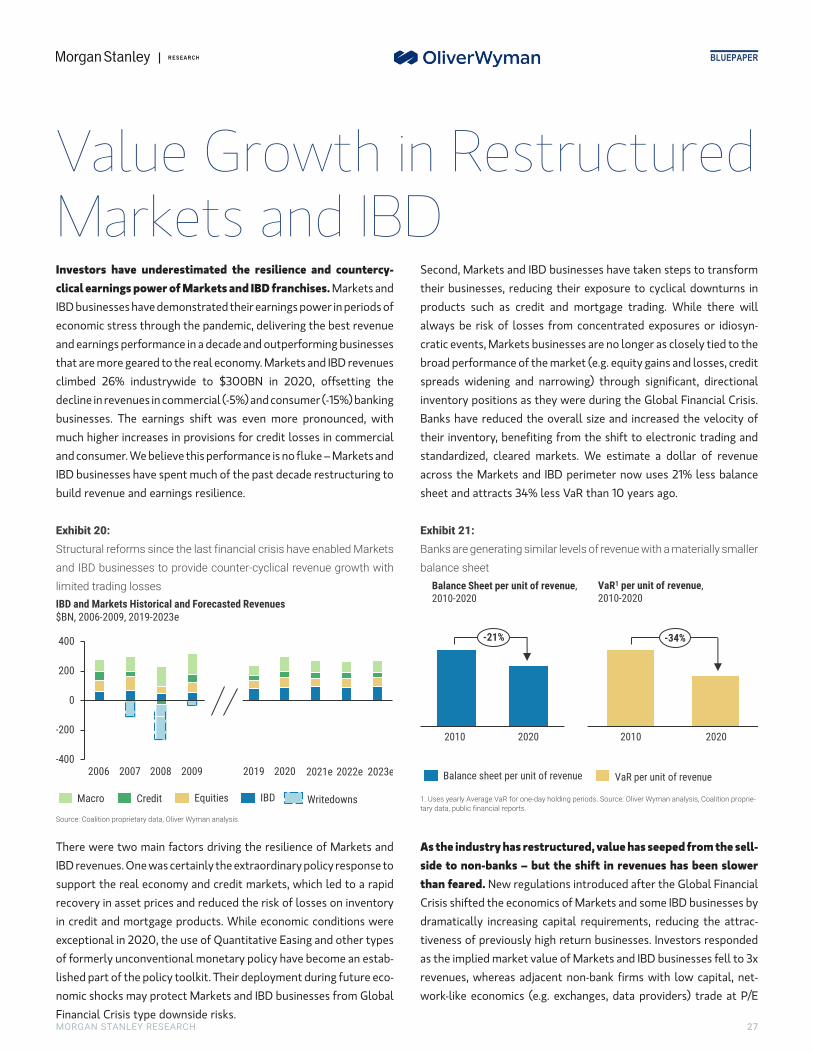
M
Morgan Stanley Research
Investors have underestimated the resilience and clical earnings power of Markets and IBD franchises. MIBD businesses have demonstrated their earnings power economic stress through the pandemic, delivering the band earnings performance in a decade and outperformingthat are more geared to the real economy. Markets and IBclimbed 26% industrywide to $300BN in 2020, offdecline in revenues in commercial (-5%) and consumer (-1businesses. The earnings shift was even more pronomuch higher increases in provisions for credit losses in and consumer. We believe this performance is no fluke – MIBD businesses have spent much of the past decade restbuild revenue and earnings resilience.
Exhibit 20:Structural reforms since the last financial crisis have enaband IBD businesses to provide counter-cyclical revenue limited trading losses
-400
-200
0
200
400
2006 20192007 2008 2009 2020 2021e
Macro WritedCredit Equities IBD
IBD and Markets Historical and Forecasted Revenues
$BN, 2006-2009, 2019-2023e
Source: Coalition proprietary data, Oliver Wyman analysis.
There were two main factors driving the resilience of MIBD revenues. One was certainly the extraordinary policysupport the real economy and credit markets, which lerecovery in asset prices and reduced the risk of losses oin credit and mortgage products. While economic condexceptional in 2020, the use of Quantitative Easing andof formerly unconventional monetary policy have becomlished part of the policy toolkit. Their deployment duringnomic shocks may protect Markets and IBD businesses Financial Crisis type downside risks.
Value GrowMarkets and
BluePaper
27
countercy-arkets and
in periods of est revenue businesses D revenues setting the 5%) banking unced, with commercial
arkets and ructuring to
led Markets growth with
2022e 2023e
owns
arkets and response to d to a rapid n inventory itions were
other types e an estab- future eco-
from Global
th in Restructured IBD
Exhibit 21:Banks are generating similar levels of revenue with a materially smaller balance sheet
2010 2020
-21%
2010 2020
-34%
VaR per unit of revenueBalance sheet per unit of revenue
Balance Sheet per unit of revenue, 2010-2020
VaR1 per unit of revenue, 2010-2020
1. Uses yearly Average VaR for one-day holding periods. Source: Oliver Wyman analysis, Coalition proprie-tary data, public financial reports.
Second, Markets and IBD businesses have taken steps to transform their businesses, reducing their exposure to cyclical downturns in products such as credit and mortgage trading. While there will always be risk of losses from concentrated exposures or idiosyn-cratic events, Markets businesses are no longer as closely tied to the broad performance of the market (e.g. equity gains and losses, credit spreads widening and narrowing) through significant, directional inventory positions as they were during the Global Financial Crisis. Banks have reduced the overall size and increased the velocity of their inventory, benefiting from the shift to electronic trading and standardized, cleared markets. We estimate a dollar of revenue across the Markets and IBD perimeter now uses 21% less balance sheet and attracts 34% less VaR than 10 years ago.
As the industry has restructured, value has seeped from the sell-side to non-banks – but the shift in revenues has been slower than feared. New regulations introduced after the Global Financial Crisis shifted the economics of Markets and some IBD businesses by dramatically increasing capital requirements, reducing the attrac-tiveness of previously high return businesses. Investors responded as the implied market value of Markets and IBD businesses fell to 3x revenues, whereas adjacent non-bank firms with low capital, net-work-like economics (e.g. exchanges, data providers) trade at P/E

BluePaperM
28
Exhibit 22:Value has migrated to exchanges and financial data companies but the actual structural loss of revenues beneath this has been lower than feared
2.6
18.9
7.1
Market Cap / Revenue multiples with global bank spread, $BN 2020
1. Market cap calculated as % of IBD & Markets revenue / total bank revenue multiplied by total bank market cap as of 3/10/2021.2. Revenue includes revenue streams from Market Infrastructure and Financial Services activities only. Market cap is calculated as % of total revenue from these streams in 2020. Source: Coalition proprietary data, Refinitiv Datastream, Public earnings reports and corporate financial information, Oliver Wyman proprietary data, Oliver Wyman Analysis.
ratios of 7-19x. The scale of this valuation shift may be unwarranted as the shift of revenues to capital light competitors has been slower and less extreme than feared – established businesses have restruc-tured to protect revenues and reduce capital intensity. To narrow the valuation gap Markets and IBD businesses will need to continue maintaining discipline in risk management and cost, while delivering a sustainably higher revenue performance compared to the pre pan-demic period.
Exhibit 23:Markets and IBD businesses will need to capitalize on structural shifts in client demand to thrive in the future
Des
crip
tion
Market size
• Investing in electronic trading platforms that offer edge and scale across asset classes
• Deep specialization in less liquid asset classeswith hybrid electronic and high touch capabilities
• Reassessment of the user interface (investing in client portals that create stickier relationships with investors with broad market access and value-added services)
• Expand early-stage coverage and product offering for corporates staying private longer
• Invest in platforms that can channel the wide range of financing options / solutions for private companies
• Establish new fund structures and other vehicles for individual investors to access expanding universe of private investments
• Invest in capital light services for private borrowers (transaction banking) or private markets investors (custody and fund admin)
• ESG: Financing the transition to a low carbon economy and underwriting a spectrum of green labelled products for investors
• Digital Assets: trading and servicing new asset classes (e.g. crypto) and trading and servicing existing asset classes more efficiently
• Outsourcing: commercializing existing capabilities, infrastructure, and data
1 2 3
>$50 BN >$25 BN N/A
Electronic trading Private Markets Emerging opportunities
Opportunities in Markets and IBD
Source: Oliver Wyman analysis, Morgan Stanley Research.
The winners are those best able to pivot towards the emerging drivers of value in the industry. Right now the biggest shifts have been towards electronic trading and private markets, and the leading players have already made big strides to pivot their models to these areas. Together these opportunities will account for over $75BN in revenues for the sell side. The battle is now on to carve out roles around the new drivers of value that will drive growth over the next 5 years – in particular around ESG and the Green transition, and around digital assets.
Value driver 1: Electronic trading. The sell-side has been under siege as non-bank liquidity providers, trading venues and market data providers take a bigger slice of the pie. 2020 saw a big acceleration in this trend, in credit products in particular. Yet 2020 also revealed the value in risk intermediation. The leading sell-side firms have invested to defend and adapt their model and we estimate the sell-side opportunity is >$50BN in revenue driven by electronic facilita-tion. The opportunity continues to evolve, as products once considered too illiquid to trade electronically move gradually toward more electronic execution. Corporate credit is the most recent example, with the rapid proliferation of algorithmic auto-pricing tools and portfolio trading over the past 2-3 years. Banks investing in cross-asset electronic trading infrastructure, building hybrid voice-electronic in less liquid asset classes, and developing innovative models for client service/access will have the edge.

M
Morgan Stanley Research
Value driver 2: Private markets. The rise of private mthreat to some traditional investment banking business opportunity for dealers able to pivot into this trend. We eopportunity is >$25BN for Markets and IBD Opportunities include early-stage coverage, investing capabilities/solutions for private companies, new fund stinvestors to access private investments, and capital ligsuch as Transaction Banking and custody and fund adinvestors in private companies. Successful banks will capvalue of IB capabilities and leverage groupwide client rand capabilities, such as in asset and wealth manageme
Value driver 3: Emerging growth markets. Leading badeveloping strategies now to best position themselves fthat will define the medium to long term. These includ
l ESG: mobilizing innovative financing structures to futransition technologies and ecosystems (e.g. EVs, hyunderwriting a spectrum of green labelled productstors, developing carbon trading and risk managementies, connecting clients more efficiently to green supand advising and supporting clients in transition
l Digital Assets: trading and servicing new asset classecrypto) and trading and servicing existing asset classefficiently
l Outsourcing: commercializing existing capabilities, inture, and data, either through digital research offerinon proprietary insights or broader outsourcing and wling capabilities in electronic trading, asset pricing, riment, etc.
Taken together this points to a constructive revenuWe expect revenues to normalize from 2020 over 202remain 10-11% above their pre-pandemic levels in our Fuand Runaway Recovery scenarios. In the Full Recovery scnues will remain elevated as global economies rebalacombination of fiscal stimulus and asset repricing generfor advisory, financing, intermediation, and risk manageRunaway Recovery scenario multiple rounds of fiscal stimcharge the economy, sustaining momentum in the IPO/SThe sharp and sustained rebound in the global economtinued government backstop also sustain elevated earninthough volatility normalizes quickly impacting flow bouter years. Our Partial Recovery scenario sees policy mahard on fiscal and monetary levers – resulting in a low vlow economic activity environment that is challenging fonesses like Macro and Equities, but limits downside risk
BluePaper
29
Exhibit 24:Historical and Forecasted Markets and IBD revenues, $BN 2010-2023eHistorical and Forecasted Markets and IBD Revenues, $BN 2010-2023e
2015
300
2012
266
2010 2011
256
20192016
269
2013 20212014 2017 2018
239
2020
299
2022 2023
266280 272 268 262 250 244
270
CreditAvg. 2010-2015
Avg. 2016-2019
Avg. 2020-2023
Macro Equities
IBD
Source: Coalition proprietary data, Oliver Wyman analysis
arkets is a - but also an stimate the businesses. in financing ructures for ht services
ministration ture the full elationships nt.
nks are also or the shifts e:
nd keydrogen), for inves-t capabili-ply chains,
s (e.g.es more
frastruc-gs focusedhite-label-
sk manage-
e outlook. 1-23 but to ll Recovery enario reve-nce and the ate demand ment. In the ulus super-PAC boom. y and con-
gs in Credit, usinesses in kers pulling olatility but r flow busi-.
Exhibit 25:Introduction of the stress capital buffer in 2020 required more capital to be held against markets and IBD focused banks
10.812.4
10.3
13.4
Investment Banking focusedGlobal Universal
-5%
+8%
2019
2020
CET1 Capital Requirements, % 2019-2020
Avg. 2020 SCB requirements 2.8% 6.1%
Source: FRB, Oliver Wyman analysis.
Supervisors continue to demand more capital from these busi-nesses. US regulators have raised capital requirements in 2020 through the introduction of the Stress Capital Buffer. Banks that are Markets focused had average SCB requirements of 6.1% vs 2.8% for more diversified universals. While the SCB only applies in the US, it is indicative of the upwards pressure on capital requirements for Market and IBD businesses. By 2022 the Basel Committee on Banking Supervision is anticipated to have finalized the Fundamental Review of the Trading Book proposals, which will further raise market risk related capital requirements in the trading books of some banks. While trading businesses will always come with a degree of volatility, some banks may conclude that the level of capitalisation is now excessive relative to the risk exposure of these businesses. That in turn poses questions for these banks on how they effectively allocate capital internally across divisions to maximize group returns.

M
30
Exhibit 26:Leaders and laggards RoE, 2023e
9-10%
12%
2020 RoE2017-2019 RoE
1
2023
Historical and forecasted wholesale banking RoE by economic sce2017-2023e
Forecast RoE with Leaders and Laggards spread1
Source: Coalition proprietary data, Oliver Wyman analysis.
With ROEs above hurdle rate, scale and capacity to inkey differentiators. 2020 demonstrated that banks achieve high returns, with average returns across wholes12%, above 2017-2019 levels of 9-10%. In our Full Recovewe anticipate banks achieving returns on average of 12% all banks will achieve these above-hurdle returns howewholesale banks we see cost-income ratios ranging fro>70% for first-tier US banks and European banks, respeis due in part to the scale benefits that US banks have aup, and in part to the favourable macro conditions in ththe prolonged low interest rate environment in Europelenges are even more stark in Transaction Banking, abelow. Given these factors, we estimate an ROE gapbetween leaders and laggards over the cycle.
Scale and InLeaders and
BluePaper
2%
e RoE
nario,
Exhibit 27:Larger global banks continue to enjoy material scale advantages
CIR: ~90%CIR: ~55%CIR: ~45%
Large Bank($5BN)
US regional($2BN)
European regional($0.5BN)
Cash management cost-income – illustrative bank types
5.0
2.0
0.0
1.0
4.0
3.0
Cas
h m
anag
emen
t re
ven
ue
($B
N)
SteppedFixed Variable RevenuesCosts
Note: Fixed costs comprising of technology costs; Stepped costs based on coverage, sales and direct costs; Variable costs based on Operations costs. Source: Coalition proprietary data, Oliver Wyman anal-ysis.
novate are are able to ale banks at ry scenario,
in 2023. Not ver. Across m <60% to ctively. Thislready builte US versus. Scale chal-s described of 6% pts
novation Drive Laggards
Differentiators are particularly critical in the key battleground of Transaction Banking. Within the Transaction Banking business many regional players are struggling to cover the fixed cost base. Large global banks – particularly US and Asian players – enjoy signifi-cant advantages in terms of scale, commercial model and gearing to faster growth sectors of the market. US regionals enjoy sticky middle market client relationships, while the European regionals are most exposed. The range in cost-income ratios in Transaction Banking is significant, with many smaller banks and regional players at >90%, vs. global banks at <50%.

M
Morgan Stanley Research
Exhibit 28:Banks’ fee margins have trended down recently as e-comshifted volumes away from higher margin channels
100 96 93 88
40
80
0
20
120
60
100
Fee revenue$BN
2016 2017 2018 2019
Fee Margins (2016 margin level = 100) Fee
Global Full View1 Wholesale Bank Payments and Cash Managememargins (Fee revenue / Payment Volumes2), $BN, 2016 to 2020
1. All corporates with > $10MM turnover. 2. Payment volumes are calculated as the totaPayments Messages, CHIPS, CHAPS, BACS, UK Faster Payments, and Fedwire Funds SSource: Coalition proprietary data, SWIFT, BIS, FRB, The Clearing House, Bank of EnglanOliver Wyman analysis.
As fee margins continue to trend downwards and new mtures create ‘winner takes all’ outcomes, smaller playincreasingly disadvantaged. The cost of upgrading techproduct capabilities to meet new market standards – ISO20022 or domestic real-time payment schemes – matively expensive for some.
Yet we see opportunities for specialists. Across all parsale, specialists who can go deep on particular sectors can still deliver high return models:
l In the Markets and IBD business the top 6-8 banks hdepth of liquidity provision and breadth of capabilitiasset classes to outperform on industry ROE. Mid-silengers must focus on manufacturing scale in speciaclasses or through serving clients on open platformsnerships.
Banks’ Payments and Cash Management fee margins hasteadily over time due to a number of factors, includingdriven by competitive pressure and a shift in the product lower fee products. This trend accelerated notably in 20rapid growth in e-commerce driving payments mix awaymargin channels (like cheques), and increasing the volumargin micro-payments.
BluePaper
31
l In Transaction Banking smaller banks will need to think aboutbuilding group-wide payments hubs across retail, commercialand wholesale to maximize scale; outsourcing operations andtechnology services to lower cost providers; and focusing onareas of real strength, such as local market expertise andsector depth.
Innovation is the wedge. Looking ahead, winners will be determined by those that have invested in capabilities to successfully position for the medium to long-term structural shifts including BaaS business models, roll-out of central bank digital currencies and other digital assets, financing the transition to less carbon-intensive economies, and commercializing existing capabilities, infrastructure, and data. As banks pivot to follow these new structural shifts they will need to ensure their investments in innovation and change are efficient and effective. We estimate that 50% of change spend is wasted, in large part due to a lack of upfront planning, poor transparency, insufficient management buy-in, and tooth-less governance. To be successful in an environment that requires change, a disciplined approach to change management is often the difference between winners and losers.
If CIBs are to drive a re-rating by investors they will need to prove that there are sustainable revenue gains in previously underperforming Markets and IBD businesses and that they can achieve commercial excellence in Transaction Banking, deliver on ambitious growth plans, and improve disclosure. First tier banks will need to continue to drive home advantages of scale if they are to narrow the valuation gap with non-bank competitors. For the rest, tight discipline on costs and a focus on core strengths will be the clearest path to success.
merce has
77
Fee margin Index
2020
revenue
nt Fee
l of SWIFTNet FINervice volumes. | d CHAPS, Pay.UK,
arket struc-ers will be nology and
for example y be prohibi-
ts of whole-or activities
ave thees acrosszed chal-lized asset via part-
ve declined fee waivers mix towards 20 with the from higher me of lower

BluePaperM
32
Disclosure SectionThe information and opinions in Morgan Stanley Research were prepared or are disseminated by Morgan Stanley Europe S.E., regulated by Bundesanstalt
fuer Finanzdienstleistungsaufsicht (BaFin) and/or Morgan Stanley & Co. International plc, authorized by the Prudential Regulatory Authority and regulated by
the Financial Conduct Authority and the Prudential Regulatory Authority. Morgan Stanley & Co. International plc disseminates in the UK research that it has
prepared, and approves solely for the purposes of section 21 of the Financial Services and Markets Act 2000, research which has been prepared by any of its
affiliates. As used in this disclosure section, Morgan Stanley includes RMB Morgan Stanley Proprietary Limited, Morgan Stanley Europe S.E., Morgan
Stanley & Co International plc and its affiliates.
For important disclosures, stock price charts and equity rating histories regarding companies that are the subject of this report, please see the Morgan
Stanley Research Disclosure Website at www.morganstanley.com/researchdisclosures, or contact your investment representative or Morgan Stanley
Research at 1585 Broadway, (Attention: Research Management), New York, NY, 10036 USA.
For valuation methodology and risks associated with any recommendation, rating or price target referenced in this research report, please contact the Client
Support Team as follows: US/Canada +1 800 303-2495; Hong Kong +852 2848-5999; Latin America +1 718 754-5444 (U.S.); London +44 (0)20-7425-8169;
Singapore +65 6834-6860; Sydney +61 (0)2-9770-1505; Tokyo +81 (0)3-6836-9000. Alternatively you may contact your investment representative or Morgan
Stanley Research at 1585 Broadway, (Attention: Research Management), New York, NY 10036 USA.
Analyst CertificationThe following analysts hereby certify that their views about the companies and their securities discussed in this report are accurately expressed and that they
have not received and will not receive direct or indirect compensation in exchange for expressing specific recommendations or views in this report: Izabel
Dobreva; Manan Gosalia; Betsy L. Graseck, CFA; Nida Iqbal; Ryan Kenny; Nick Lord; Giulia Aurora Miotto, CFA; Mia Nagasaka; Alvaro Serrano; Magdalena L
Stoklosa, CFA; Ken A Zerbe, CFA.
Unless otherwise stated, the individuals listed on the cover page of this report are research analysts.
Global Research Conflict Management PolicyMorgan Stanley Research has been published in accordance with our conflict management policy, which is available at
www.morganstanley.com/institutional/research/conflictpolicies. A Portuguese version of the policy can be found at www.morganstanley.com.br
Important Regulatory Disclosures on Subject CompaniesThe equity research analysts or strategists principally responsible for the preparation of Morgan Stanley Research have received compensation based upon
various factors, including quality of research, investor client feedback, stock picking, competitive factors, firm revenues and overall investment banking
revenues. Equity Research analysts' or strategists' compensation is not linked to investment banking or capital markets transactions performed by Morgan
Stanley or the profitability or revenues of particular trading desks.
Morgan Stanley and its affiliates do business that relates to companies/instruments covered in Morgan Stanley Research, including market making, providing
liquidity, fund management, commercial banking, extension of credit, investment services and investment banking. Morgan Stanley sells to and buys from
customers the securities/instruments of companies covered in Morgan Stanley Research on a principal basis. Morgan Stanley may have a position in the debt
of the Company or instruments discussed in this report. Morgan Stanley trades or may trade as principal in the debt securities (or in related derivatives) that
are the subject of the debt research report.
Certain disclosures listed above are also for compliance with applicable regulations in non-US jurisdictions.
STOCK RATINGSMorgan Stanley uses a relative rating system using terms such as Overweight, Equal-weight, Not-Rated or Underweight (see definitions below). Morgan
Stanley does not assign ratings of Buy, Hold or Sell to the stocks we cover. Overweight, Equal-weight, Not-Rated and Underweight are not the equivalent of
buy, hold and sell. Investors should carefully read the definitions of all ratings used in Morgan Stanley Research. In addition, since Morgan Stanley Research
contains more complete information concerning the analyst's views, investors should carefully read Morgan Stanley Research, in its entirety, and not infer the
contents from the rating alone. In any case, ratings (or research) should not be used or relied upon as investment advice. An investor's decision to buy or sell a
stock should depend on individual circumstances (such as the investor's existing holdings) and other considerations.
Global Stock Ratings Distribution(as of March 31, 2021)
The Stock Ratings described below apply to Morgan Stanley's Fundamental Equity Research and do not apply to Debt Research produced by the Firm.
For disclosure purposes only (in accordance with FINRA requirements), we include the category headings of Buy, Hold, and Sell alongside our ratings of
Overweight, Equal-weight, Not-Rated and Underweight. Morgan Stanley does not assign ratings of Buy, Hold or Sell to the stocks we cover. Overweight,
Equal-weight, Not-Rated and Underweight are not the equivalent of buy, hold, and sell but represent recommended relative weightings (see definitions below).
To satisfy regulatory requirements, we correspond Overweight, our most positive stock rating, with a buy recommendation; we correspond Equal-weight and
Not-Rated to hold and Underweight to sell recommendations, respectively.

BluePaperM
Morgan Stanley Research 33
Data include common stock and ADRs currently assigned ratings. Investment Banking Clients are companies from whom Morgan Stanley received investment
banking compensation in the last 12 months. Due to rounding off of decimals, the percentages provided in the "% of total" column may not add up to exactly
100 percent.
Analyst Stock RatingsOverweight (O). The stock's total return is expected to exceed the average total return of the analyst's industry (or industry team's) coverage universe, on a
risk-adjusted basis, over the next 12-18 months.
Equal-weight (E). The stock's total return is expected to be in line with the average total return of the analyst's industry (or industry team's) coverage universe,
on a risk-adjusted basis, over the next 12-18 months.
Not-Rated (NR). Currently the analyst does not have adequate conviction about the stock's total return relative to the average total return of the analyst's
industry (or industry team's) coverage universe, on a risk-adjusted basis, over the next 12-18 months.
Underweight (U). The stock's total return is expected to be below the average total return of the analyst's industry (or industry team's) coverage universe, on a
risk-adjusted basis, over the next 12-18 months.
Unless otherwise specified, the time frame for price targets included in Morgan Stanley Research is 12 to 18 months.
Analyst Industry ViewsAttractive (A): The analyst expects the performance of his or her industry coverage universe over the next 12-18 months to be attractive vs. the relevant broad
market benchmark, as indicated below.
In-Line (I): The analyst expects the performance of his or her industry coverage universe over the next 12-18 months to be in line with the relevant broad market
benchmark, as indicated below.
Cautious (C): The analyst views the performance of his or her industry coverage universe over the next 12-18 months with caution vs. the relevant broad market
benchmark, as indicated below.
Benchmarks for each region are as follows: North America - S&P 500; Latin America - relevant MSCI country index or MSCI Latin America Index; Europe -
MSCI Europe; Japan - TOPIX; Asia - relevant MSCI country index or MSCI sub-regional index or MSCI AC Asia Pacific ex Japan Index.
Important Disclosures for Morgan Stanley Smith Barney LLC & E*TRADE Securities LLC CustomersImportant disclosures regarding the relationship between the companies that are the subject of Morgan Stanley Research and Morgan Stanley Smith Barney
LLC or Morgan Stanley or any of their affiliates, are available on the Morgan Stanley Wealth Management disclosure website at
www.morganstanley.com/online/researchdisclosures. For Morgan Stanley specific disclosures, you may refer to
www.morganstanley.com/researchdisclosures.
Each Morgan Stanley research report is reviewed and approved on behalf of Morgan Stanley Smith Barney LLC and E*TRADE Securities LLC. This review and
approval is conducted by the same person who reviews the research report on behalf of Morgan Stanley. This could create a conflict of interest.
Other Important DisclosuresMorgan Stanley Research policy is to update research reports as and when the Research Analyst and Research Management deem appropriate, based on
developments with the issuer, the sector, or the market that may have a material impact on the research views or opinions stated therein. In addition, certain
Research publications are intended to be updated on a regular periodic basis (weekly/monthly/quarterly/annual) and will ordinarily be updated with that
frequency, unless the Research Analyst and Research Management determine that a different publication schedule is appropriate based on current conditions.
Morgan Stanley is not acting as a municipal advisor and the opinions or views contained herein are not intended to be, and do not constitute, advice within the
meaning of Section 975 of the Dodd-Frank Wall Street Reform and Consumer Protection Act.

BluePaperM
34
Morgan Stanley produces an equity research product called a "Tactical Idea." Views contained in a "Tactical Idea" on a particular stock may be contrary to the
recommendations or views expressed in research on the same stock. This may be the result of differing time horizons, methodologies, market events, or other
factors. For all research available on a particular stock, please contact your sales representative or go to Matrix at http://www.morganstanley.com/matrix.
Morgan Stanley Research is provided to our clients through our proprietary research portal on Matrix and also distributed electronically by Morgan Stanley to
clients. Certain, but not all, Morgan Stanley Research products are also made available to clients through third-party vendors or redistributed to clients
through
alternate electronic means as a convenience. For access to all available Morgan Stanley Research, please contact your sales representative or go to Matrix at
http://www.morganstanley.com/matrix.
Any access and/or use of Morgan Stanley Research is subject to Morgan Stanley's Terms of Use (http://www.morganstanley.com/terms.html). By accessing
and/or using Morgan Stanley Research, you are indicating that you have read and agree to be bound by our Terms of Use
(http://www.morganstanley.com/terms.html). In addition you consent to Morgan Stanley processing your personal data and using cookies in accordance with
our Privacy Policy and our Global Cookies Policy (http://www.morganstanley.com/privacy_pledge.html), including for the purposes of setting your preferences
and to collect readership data so that we can deliver better and more personalized service and products to you. To find out more information about how
Morgan
Stanley processes personal data, how we use cookies and how to reject cookies see our Privacy Policy and our Global Cookies Policy
(http://www.morganstanley.com/privacy_pledge.html).
If you do not agree to our Terms of Use and/or if you do not wish to provide your consent to Morgan Stanley processing your personal data or using cookies
please do not access our research.
Morgan Stanley Research does not provide individually tailored investment advice. Morgan Stanley Research has been prepared without regard to the
circumstances and objectives of those who receive it. Morgan Stanley recommends that investors independently evaluate particular investments and
strategies, and encourages investors to seek the advice of a financial adviser. The appropriateness of an investment or strategy will depend on an investor's
circumstances and objectives. The securities, instruments, or strategies discussed in Morgan Stanley Research may not be suitable for all investors, and
certain investors may not be eligible to purchase or participate in some or all of them. Morgan Stanley Research is not an offer to buy or sell or the solicitation
of an offer to buy or sell any security/instrument or to participate in any particular trading strategy. The value of and income from your investments may vary
because of changes in interest rates, foreign exchange rates, default rates, prepayment rates, securities/instruments prices, market indexes, operational or
financial conditions of companies or other factors. There may be time limitations on the exercise of options or other rights in securities/instruments
transactions. Past performance is not necessarily a guide to future performance. Estimates of future performance are based on assumptions that may not be
realized. If provided, and unless otherwise stated, the closing price on the cover page is that of the primary exchange for the subject company's
securities/instruments.
The fixed income research analysts, strategists or economists principally responsible for the preparation of Morgan Stanley Research have received
compensation based upon various factors, including quality, accuracy and value of research, firm profitability or revenues (which include fixed income trading
and capital markets profitability or revenues), client feedback and competitive factors. Fixed Income Research analysts', strategists' or economists'
compensation is not linked to investment banking or capital markets transactions performed by Morgan Stanley or the profitability or revenues of particular
trading desks.
The "Important Regulatory Disclosures on Subject Companies" section in Morgan Stanley Research lists all companies mentioned where Morgan Stanley
owns 1% or more of a class of common equity securities of the companies. For all other companies mentioned in Morgan Stanley Research, Morgan Stanley
may have an investment of less than 1% in securities/instruments or derivatives of securities/instruments of companies and may trade them in ways different
from those discussed in Morgan Stanley Research. Employees of Morgan Stanley not involved in the preparation of Morgan Stanley Research may have
investments in securities/instruments or derivatives of securities/instruments of companies mentioned and may trade them in ways different from those
discussed in Morgan Stanley Research. Derivatives may be issued by Morgan Stanley or associated persons.
With the exception of information regarding Morgan Stanley, Morgan Stanley Research is based on public information. Morgan Stanley makes every effort to
use reliable, comprehensive information, but we make no representation that it is accurate or complete. We have no obligation to tell you when opinions or
information in Morgan Stanley Research change apart from when we intend to discontinue equity research coverage of a subject company. Facts and views
presented in Morgan Stanley Research have not been reviewed by, and may not reflect information known to, professionals in other Morgan Stanley business
areas, including investment banking personnel.
Morgan Stanley Research personnel may participate in company events such as site visits and are generally prohibited from accepting payment by the
company of associated expenses unless pre-approved by authorized members of Research management.
Morgan Stanley may make investment decisions that are inconsistent with the recommendations or views in this report.

BluePaperM
Morgan Stanley Research 35
To our readers based in Taiwan or trading in Taiwan securities/instruments: Information on securities/instruments that trade in Taiwan is distributed by Morgan
Stanley Taiwan Limited ("MSTL"). Such information is for your reference only. The reader should independently evaluate the investment risks and is solely
responsible for their investment decisions. Morgan Stanley Research may not be distributed to the public media or quoted or used by the public media without
the express written consent of Morgan Stanley. Any non-customer reader within the scope of Article 7-1 of the Taiwan Stock Exchange Recommendation
Regulations accessing and/or receiving Morgan Stanley Research is not permitted to provide Morgan Stanley Research to any third party (including but not
limited to related parties, affiliated companies and any other third parties) or engage in any activities regarding Morgan Stanley Research which may create or
give the appearance of creating a conflict of interest. Information on securities/instruments that do not trade in Taiwan is for informational purposes only and is
not to be construed as a recommendation or a solicitation to trade in such securities/instruments. MSTL may not execute transactions for clients in these
securities/instruments.
Morgan Stanley is not incorporated under PRC law and the research in relation to this report is conducted outside the PRC. Morgan Stanley Research does
not constitute an offer to sell or the solicitation of an offer to buy any securities in the PRC. PRC investors shall have the relevant qualifications to invest in
such securities and shall be responsible for obtaining all relevant approvals, licenses, verifications and/or registrations from the relevant governmental
authorities themselves. Neither this report nor any part of it is intended as, or shall constitute, provision of any consultancy or advisory service of securities
investment as defined under PRC law. Such information is provided for your reference only.
Morgan Stanley Research is disseminated in Brazil by Morgan Stanley C.T.V.M. S.A. located at Av. Brigadeiro Faria Lima, 3600, 6th floor, São Paulo - SP,
Brazil; and is regulated by the Comissão de Valores Mobiliários; in Mexico by Morgan Stanley México, Casa de Bolsa, S.A. de C.V which is regulated by
Comision Nacional Bancaria y de Valores. Paseo de los Tamarindos 90, Torre 1, Col. Bosques de las Lomas Floor 29, 05120 Mexico City; in Japan by
Morgan Stanley MUFG Securities Co., Ltd. and, for Commodities related research reports only, Morgan Stanley Capital Group Japan Co., Ltd; in Hong Kong
by Morgan Stanley Asia Limited (which accepts responsibility for its contents) and by Morgan Stanley Asia International Limited, Hong Kong Branch; in
Singapore by Morgan Stanley Asia (Singapore) Pte. (Registration number 199206298Z) and/or Morgan Stanley Asia (Singapore) Securities Pte Ltd
(Registration number 200008434H), regulated by the Monetary Authority of Singapore (which accepts legal responsibility for its contents and should be
contacted with respect to any matters arising from, or in connection with, Morgan Stanley Research) and by Morgan Stanley Asia International Limited,
Singapore Branch (Registration number T11FC0207F); in Australia to "wholesale clients" within the meaning of the Australian Corporations Act by Morgan
Stanley Australia Limited A.B.N. 67 003 734 576, holder of Australian financial services license No. 233742, which accepts responsibility for its contents; in
Australia to "wholesale clients" and "retail clients" within the meaning of the Australian Corporations Act by Morgan Stanley Wealth Management Australia
Pty Ltd (A.B.N. 19 009 145 555, holder of Australian financial services license No. 240813, which accepts responsibility for its contents; in Korea by Morgan
Stanley & Co International plc, Seoul Branch; in India by Morgan Stanley India Company Private Limited; in Indonesia by PT. Morgan Stanley Sekuritas
Indonesia; in Canada by Morgan Stanley Canada Limited, which has approved of and takes responsibility for its contents in Canada; in Germany and the
European Economic Area where required by Morgan Stanley Europe S.E., authorised and regulated by Bundesanstalt fuer Finanzdienstleistungsaufsicht
(BaFin) under the reference number 149169; in the US by Morgan Stanley & Co. LLC, which accepts responsibility for its contents. Morgan Stanley & Co.
International plc, authorized by the Prudential Regulatory Authority and regulated by the Financial Conduct Authority and the Prudential Regulatory Authority,
disseminates in the UK research that it has prepared, and approves solely for the purposes of section 21 of the Financial Services and Markets Act 2000,
research which has been prepared by any of its affiliates. RMB Morgan Stanley Proprietary Limited is a member of the JSE Limited and A2X (Pty) Ltd. RMB
Morgan Stanley Proprietary Limited is a joint venture owned equally by Morgan Stanley International Holdings Inc. and RMB Investment Advisory (Proprietary)
Limited, which is wholly owned by FirstRand Limited. The information in Morgan Stanley Research is being disseminated by Morgan Stanley Saudi Arabia,
regulated by the Capital Market Authority in the Kingdom of Saudi Arabia , and is directed at Sophisticated investors only.
Morgan Stanley Hong Kong Securities Limited is the liquidity provider/market maker for securities of HSBC listed on the Stock Exchange of Hong Kong
Limited. An updated list can be found on HKEx website: http://www.hkex.com.hk.
The information in Morgan Stanley Research is being communicated by Morgan Stanley & Co. International plc (DIFC Branch), regulated by the Dubai
Financial Services Authority (the DFSA), and is directed at Professional Clients only, as defined by the DFSA. The financial products or financial services to
which this research relates will only be made available to a customer who we are satisfied meets the regulatory criteria to be a Professional Client.
The information in Morgan Stanley Research is being communicated by Morgan Stanley & Co. International plc (QFC Branch), regulated by the Qatar
Financial Centre Regulatory Authority (the QFCRA), and is directed at business customers and market counterparties only and is not intended for Retail
Customers as defined by the QFCRA.
As required by the Capital Markets Board of Turkey, investment information, comments and recommendations stated here, are not within the scope of
investment advisory activity. Investment advisory service is provided exclusively to persons based on their risk and income preferences by the authorized firms.
Comments and recommendations stated here are general in nature. These opinions may not fit to your financial status, risk and return preferences. For this
reason, to make an investment decision by relying solely to this information stated here may not bring about outcomes that fit your expectations.

BluePaperM
36
The trademarks and service marks contained in Morgan Stanley Research are the property of their respective owners. Third-party data providers make no
warranties or representations relating to the accuracy, completeness, or timeliness of the data they provide and shall not have liability for any damages
relating
to such data. The Global Industry Classification Standard (GICS) was developed by and is the exclusive property of MSCI and S&P.
Morgan Stanley Research, or any portion thereof may not be reprinted, sold or redistributed without the written consent of Morgan Stanley.
Indicators and trackers referenced in Morgan Stanley Research may not be used as, or treated as, a benchmark under Regulation EU 2016/1011, or any other
similar framework.
Important Disclosures from Oliver Wyman
Copyright © 2021 Oliver Wyman. All rights reserved. This report may not be reproduced or redistributed, in whole or in part, without the written permission of
Oliver Wyman and Oliver Wyman accepts no liability whatsoever for the actions of third parties in this respect.
This report is not a substitute for tailored professional advice on how a specific financial institution should execute its strategy. This report is not investment
advice and should not be relied on for such advice or as a substitute for consultation with professional accountants, tax, legal or financial advisers. Oliver
Wyman has made every effort to use reliable, up-to-date and comprehensive information and analysis, but all information is provided without warranty of any
kind, express or implied. Oliver Wyman disclaims any responsibility to update the information or conclusions in this report.
Oliver Wyman accepts no liability for any loss arising from any action taken or refrained from as a result of information contained in this report or any reports
or sources of information referred to herein, or for any consequential, special or similar damages even if advised of the possibility of such damages.
This report may not be sold without the written consent of Oliver Wyman.
The Oliver Wyman employees that contributed to this report are neither FCA nor FINRA registered. Oliver Wyman is not authorised or regulated by the
Financial Conduct Authority or the Prudential Regulatory Authority. As a consultancy firm it may have business relationships with companies mentioned in this
report and as such may receive fees for executing this business.
Please refer to www.oliverwyman.com for further details.

© Morgan Stanley 2021
The Americas
1585 Broadway
New York, NY 10036-8293
United States
Tel: +1 (1) 212 761 4000
Europe
20 Bank Street, Canary Wharf
London E14 4AD
United Kingdom
Tel: +44 (0) 20 7 425 8000
Japan
1-9-7 Otemachi, Chiyoda-ku
Tokyo 100-8104
Japan
Tel: +81 (0) 3 6836 5000
Asia/Pacific
1 Austin Road West
Kowloon
Hong Kong
Tel: +852 2848 5200
EMEA Americas Asia Pacific
55 Baker Street 1166 Avenue of the Americas 8 Marina View
London 29th Floor #09-07 Asia Square
W1U 8EW New York, NY 10036 Tower 1 018960
United Kingdom United States Singapore
Tel: +44 20 7333 8333 Tel: +1 212 345 8000 Tel: +65 6510 9700