structural and chemical attributes of soil inorganic
TRANSCRIPT

Journal of Agricultural Science; Vol. 11, No. 1; 2019 ISSN 1916-9752 E-ISSN 1916-9760
Published by Canadian Center of Science and Education
527
Structural and Chemical Attributes of Soil Inorganic Fractions for Environmental Characterization in the Brazilian Semiarid Region Thais Cristina de Souza Lopes1, Jeane Cruz Portela1, Stefeson Bezerra de Melo1, Thamirys Duarte Ávila1,
Francisco Wellington Andrade da Silva1, Joseane Dunga da Costa1 & Aldi Nestor de Souza Júnior2 1 Universidade Federal Rural do Semi-Árido, Mossoró, Brazil 2 Instituto Federal do Maranhão, Grajaú, Brazil
Correspondence: Jeane Cruz Portela, Universidade Federal Rural do Semi-Árido, Av. Francisco Mota, 572, Bairro Costa e Silva, CEP: 59.625-900, Mossoró, RN, Brazil. Tel: 55-840-996-933-669. E-mail: [email protected]
Received: September 11, 2018 Accepted: November 3, 2018 Online Published: December 15, 2018
doi:10.5539/jas.v11n1p527 URL: https://doi.org/10.5539/jas.v11n1p527
Abstract
Soil structure affects plant growth factors in agroecosystems. The relationships of these factors with soil texture and chemical attributes are important to differentiate environments. The objective of this work was to evaluate the relationship of soil structural attributes with physical and chemical attributes of different soils to differentiate environments, using multivariate statistics. The research was carried out in the Terra da Esperança Settlement Project, in Governador Dix-Sept Rosado, RN, semiarid region of Brazil. Ten soil profiles were evaluated: Haplustepts in a conventional area (1CA); Haplustepts in a collective area with (2CA); Haplustepts in an agroecological area with native forest (3AGRO); Eutrustox in a native forest (4NF); Calciustolls in a conventional area of pasture (5CAP); Haplustepts in a native forest (6NF); Haplustepts in an native forest (7NF); Usticfluvents in a permanent conservation area with Licania rigida (8PPA); Haplustepts in a native forest (9MN); and Haplustepts in a collective area with Spondias spp. (10SP). Ten soil samples were collected and analyzed by horizons in volumetric rings and in soil blocks (aggregate analysis), with three replications. Structural, physical, and chemical attributes were evaluated. The data were subjected to multivariate statistical analysis, using correlation matrix, cluster analysis, and factorial analysis considering the factors as principal components. According to the factorial analysis, Factor 1 (F1) and Factor 2 (F2)—F1 consisting of clay, Ca2+, Na+, sum of bases, and base saturation (V), and F2 consisting of cation exchange capacity (CEC), total organic carbon, macroporosity, particle density, K+, and microporosity—were essential to differentiate the environments. The cluster analysis formed four groups. The structural groups showed greater similarity, denoting the relationship between source material and land use, followed by the chemical groups P, K+, CEC, Ca2+, V, and pH for the Calciustolls; the structural weighted mean diameter, geometric mean diameter, soil aggregates larger than 2 mm, plasticity index, and plasticity limit for the Eutrustox; and the physical and chemical attributes EC, Na+, Silt, macroporosity, total calculated porosity, aluminum saturation, total sand, volumetric moisture, Mg2+ and particle density for the Haplustepts and the Usticfluvents. The clay fraction presented correlation with chemical attributes (F1) for the distinction of soil classes and land uses. The soil classes presented eutrophic character (V ≥ 50%) as a function of the Na+ and Ca2+ contents, including the Eutrustox (4NF), despite its lower contents when compared to the other soil classes. This is a local peculiarity due to the climatic pattern of the Brazilian semiarid region.
Keywords: caatinga, multivariate analysis, aeration
1. Introduction
The Brazilian semiarid region is a diverse environment regarding geological formation, relief, and vegetation and presents local peculiarities and landscapes. This directly affects the pedology and soil morphology of this region, generating classes of soils characterized by spatial and temporal variability of morphological, physical, chemical, and mineralogical attributes (Carvalho, 2017). Most part of these soils are pedogenetically characterized as poorly developed, presenting physical limitations for development of plants; however, these soils present, in general, good fertility due to their lithology and the climatic pattern of the region, combined with other factors, and soil formation processes.

jas.ccsenet.org Journal of Agricultural Science Vol. 11, No. 1; 2019
528
However, despite the soil attributes in this region, concise information of the natural resources and their potentialities and limitations, considering intrinsic characteristics, the environment, and local people is needed for a conscious use of these resources; this can subsidize the implementation of activities, considering the potential of the local physical environment, and land uses to meet production purposes, and ensure soil conservation (Lepesh, 2015).
The structural arrangement of the soil particles can be modified by human actions. It is connected to plant growth, which affects porous space, flows of air, water, and heat to plant roots, nutrient supply, development of the root system, and soil mechanical resistance to penetration, which are important factors for to the development of agricultural crops (Machado & Mielniczuk, 2009).
Thus, characterizing the structural and chemical attributes of the soil and their correlations is necessary to subsidize decision making to improve and maintain the soil productive capacity, considering its potentialities and limitations.
According to Castilho (2017), multivariate analysis has been used successfully in studies involving soil attributes to identify and distinguish environments and know the most sensitive attributes for their distinguishing, considering simultaneously several characteristics, and correlations between them.
In this context, the objective of this work was to evaluate the relationship of soil structural attributes with physical and chemical attributes of different soils to differentiate environments in the Terra da Esperança Settlement Project, in the western mesoregion of the state of Rio Grande do Norte, Brazil, using multivariate analysis.
2. Materials and Methods
The research was developed in the Terra da Esperança Settlement Project, in the municipality of Governador Dix Sept Rosado (05°27′32″ S and 37°31′15.6″ W), which is in the Chapada do Apodi microregion, western mesoregion of the state of Rio Grande do Norte, semiarid region of Brazil. The climate of the region is hot semiarid (BSw’h), according to the Köpper classification, with annual average precipitation of 712 mm from February to May (Alvares et al., 2013). The native vegetation of the region is hyper-xerophilic Caatinga.
This study considered different preserved agroecosystems (reference areas), agricultural areas, and different soil classes and horizons. Ten soil profiles were evaluated: Haplustepts in a conventional area (1CA) (05°29′13.0″ S; 37°24′33.1″ W); Haplustepts in a collective area (2CA) (05°30′17.6″ S; 37°27′01.3″ W); Haplustepts in an agroecological area with native forest (3AGRO) (05°30′22.9″ S; 37°27′06.8″ W); Eutrustox in a native forest (4NF) (05°29′42.7″ S; 37°28′30.3″ W); Calciustolls in a conventional area of pasture (5CAP) (05°32′21.18″ S; 37°26′01.2″ W); Haplustepts in a native forest (6NF) (05°32′24.0″ S; 37°25′59.4″ W); Haplustepts in an native forest (7NF) (05°28′40.7″ S; 37°26′16.3″ W); Usticfluvents in a permanent conservation area with Licania rigida (8PPA) (05°29′45.5″ S; 37°27′50.6″ W); Haplustepts in a native forest (9NF) (05°28′54.7″ S 37°24′52.7″ W); and Haplustepts in a collective area with Spondias spp. (10SP) (05°29′50.9″ S; 37°27′14.8″ W).
The environments were characterized by sampling deformed and undisturbed soil samples in different horizons. They were placed in plastic bags and analyzed in the Laboratory of Soil, Water, and Plant Analyses of the Center for Agrarian Sciences of the Federal Rural University of the Semi-arid Region (LASAP-CCA-UFERSA), following the methodology proposed by Teixeira et al. (2017).
The variables evaluated were related to: inorganic fractions—texture (silt, sand, and clay), and particle density (Dp); consistency limits—liquidity limit (LL), plasticity limit (PL), and plasticity index (PI); soil structural attributes—density, macroporosity, microporosity, total porosity (TP), and volumetric moisture; and aggregate stability—weighted mean diameter (WMD), and geometric mean diameter (GMD). The chemical attributes evaluated were: electrical conductivity (EC), pH in water, total organic carbon (TOC), phosphorus (P), potassium (K+), calcium (Ca2+), magnesium (Mg2+), cation exchange capacity (CEC), base saturation (V) and aluminum saturation (m).
The granulometry was obtained by the pipette method using chemical dispersant (sodium hexametaphosphate) and distilled water in 20 g of the air-dried fine earth, with slow mechanical agitation (Wagner 50 rpm) for 16 hours. The sand fraction (2 to 0.05 mm) was quantified by sieving, clay (< 0.002 mm) by sedimentation, and silt (0.05 to 0.002 mm) by the difference between the total sand and clay fractions. Particle density analysis was carried out using the volumetric flask method described by Kiehl (1979), oven-dried fine earth at 105 °C, and ethyl alcohol. The soil consistency tests were evaluated based on LL, with the use of the Casagrande device.
PL was evaluated with four replications, using a representative sample of the central part of the shear of the soil in the metallic sphere of the equipment from the determination of the liquidity limit, which formed a compressed
jas.ccsenet.org Journal of Agricultural Science Vol. 11, No. 1; 2019
529
sphere on a glass plate, resulting in a cylindrical rod of 3.0 to 4.0 mm in diameter without breaking or flowing. PI was evaluated by the difference between LL and PL. Gravimetric moisture was evaluated in the plasticity condition for the soil rods.
Undisturbed samples were collected using Uhland type device, and rings with height of 0.05 m and diameter of 0.05 m. Ten samples were collected per horizon in the soil profiles. Soil density, macroporosity, microporosity, and total porosity were evaluated. Soil density was evaluated using a volumetric ring with known volume, as described by Forsythe (1975), with averages represented by the quotient between the soil solid particle weight and the total volume of the soil, and expressed in kg dm-3.
Macroporosity, microporosity, and total porosity were evaluated using undeformed samples in volumetric rings; they were saturated for 48 hours and weighed (total porosity). The tension table method was used, according to Kiehl (1979), considering 6 kPa stress (microporosity), with the total soil porosity (Pt) evaluated by measuring the soil moisture saturation according to equation: Pt = [(Msat – Ms)/VT] × 100, wherein MSat is the saturated soil weight; Ms is the dried soil weight; and VT is the sample volume. Microporosity was evaluated by the water volume retained in the soil for the h value equal to 60 cm of water (pore radius of approximately 25 μm). Soil macroporosity was evaluated by the difference between total porosity and microporosity.
Soil blocks from the horizons of each soil class were sampled and sieved in 4.0 mm and 2.0 mm mesh sieves, preserving the aggregate structure for the study of the aggregates, using units of weakness. The wet sieve method, with mesh sieves of 4.76, 2.00, 1.00, 0.50, and 0.25 mm and a vertical oscillation device with 42 oscillations per minute, was used according to Kemper and Rosenau (1986). The soil aggregates were separated by shaking in water, and the samples were dried in an oven at 105 °C; the sand fraction was discarded, and the aggregate size distribution, percentage of aggregation, and stable aggregates in water, weighted mean diameter (WMD), and geometric mean diameter (GMD) were evaluated.
Deformed samples were used for the chemical analyses. The attributes evaluated were pH in water, electrical conductivity (EC) in water, TOC by digestion of organic matter, and macronutrients—exchangeable calcium (Ca2+) and exchangeable magnesium (Mg2+) using potassium chloride as extractant, and phosphorus (P), sodium (Na+) and potassium (K+) using Mehlich 1. Subsequently, the cation exchange capacity (CEC) and base saturation (V) were evaluated and interpreted according to the Manual of Recommendations for Use of Correctives and Fertilizers of Minas Gerais (Ribeiro & Guimarães, 1999).
The structure attributes of the deformed samples were evaluated with four replications; they were subjected to statistical analysis, using multivariate analysis to identify the more sensitive attributes for differentiating the environments, considering the different land uses, using the Statistica 7.0 program (Stansoft, 2004).
The analytical results from the correlation matrix and multivariate analysis were based on cluster analysis (CA), factorial analysis (FA) and principal component analysis (PCA). The CA was represented by a dendrogram of the distance matrix, using the Euclidean distance to measure similarity, and the Ward’s method to connect the cases. The importance of each variable in the CA for differentiating the environments was measured as a function of its smaller distance from the reference axis, x or y, and the axis that contains the largest value of accumulated variance that explains most of the causes of variance (Sá Paye et al., 2012).
The established connecting distance in the dendrogram from the cluster analysis was 12, which formed four large groups of soils (Figure 1). The FA showed the contribution of each variable to each factor; the factors were defined by differentiating the attributes of the environments. The environments were distinguished using six diagrams of the principal components (Factors 1 and 2, Factors 3 and 4, and Factors 5 and 6) considering physical and chemical attributes. These data were used to create two-dimensional diagrams to distinguish areas and vector projection diagrams to identify sensitive soil attributes for differentiating the environments (Hair et al., 2009).
3. Results and Discussion
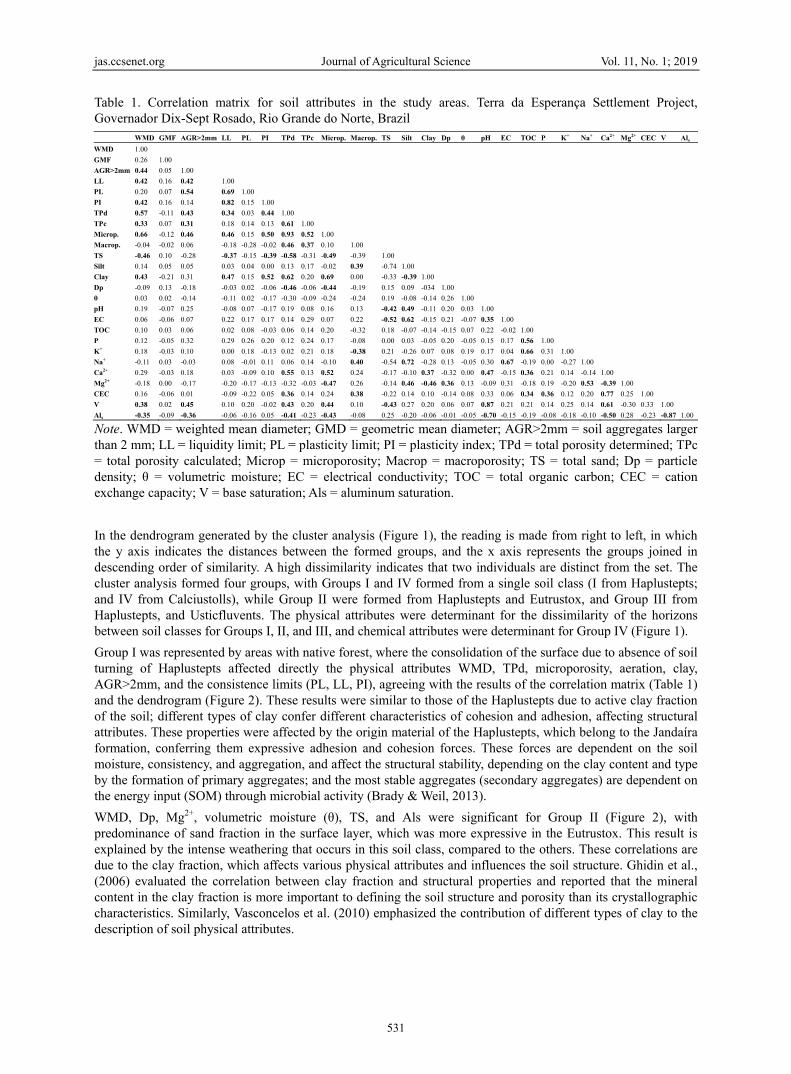
Significant correlations were found mainly between the weighted mean diameter (WMD), characteristics of soil aggregates larger than 2 mm (AGR>2mm), liquidity limit (LL), plasticity index (PI), total porosity determined (TPd), total porosity calculated (PTc), microporosity, total sand (TS), clay, base saturation (V), and aluminum saturation (Als) (Table 1).
The pH of the samples presented significant correlations with electrical conductivity (EC), Ca2+, V, and Als. These correlations are explained by the soil classes, geological formation of the study region, and pedogenetic processes. Thus, the high correlations between pH and EC, Ca2+, and V denoted the effect of these variables on the high alkalinity levels found, especially in the Calciustolls. EC represents the amount of soluble salts in the

jas.ccsenet.org Journal of Agricultural Science Vol. 11, No. 1; 2019
530
exchange complex and is direct proportional to the number of ions; high amount of exchangeable bases increases soil alkalinity, which hinders the development of crops (Ribeiro et al., 2007).
Ca2+ was significant due to the local lithology. According to Angelim et al. (2006), the Chapada do Apodi region is in the Jandaíra geological formation, constituted basically of limestone, which is rich in carbonate rocks that provide high amounts of calcium and magnesium that contribute to the soil alkalinity. Mota et al. (2008) characterized soils of the Chapada do Apodi and found effects of its lithology on the pH, denoting that soils from limestones have neutral to alkaline pH because of their high carbonate contents, which affects exchangeable bases, as also observed by Marinho et al. (2016).
The pH and Als presented correlation because aluminum is soluble in a wide pH range; Als represents the proportion of soluble aluminum to exchangeable bases and aluminum in the CEC of the soil. These variables are inversely proportional, with a lowest critical pH value of 5.5 for Al3+ becoming more soluble, generating loss of exchangeable bases and silica by leaching, predominating the pH generated by the Al3+ and H+Al released from the rocks to the soil solution (Perin et al., 2010) due to the latolization process, typical in Eutrustox soils.
TOC showed significant correlations with P, K+, Ca2+, and CEC, contributing to differentiate Group IV (Table 1, and Figure 1), characterized by the Calciustolls. These correlations are explained by the contribution of TOC to these nutrients. Moreover, K+ is not metabolized by plants but incorporated into the plant biomass, forming connections with organic complexes of easy reversibility and, consequently, rapid release rate by plant residues (Perin et al., 2010).
The high correlation between P and SOM is due to the cycling of this nutrient in the soil by microbial activity due to the plant energy support, in the labile and non-labile forms, especially in surface horizons, with accentuated effect in areas of native forest due to constant deposition of plant residues (Turrion et al., 2010). The contribution of TOC to P release is more significant in weathered soils in tropical regions, where 1:1 clay minerals of low colloidal activity present high adsorption force, favoring complexation of organic and inorganic forms of P in the soil matrix, making this element little labile, resulting in low fertility (Machado et al., 2012). Thus, organic P affects the availability of this element in the soil. Pereira et al. (2011) evaluated light SOM and remaining P for agriculture purposes and found increased light SOM content in areas under no-tillage system with cover plants, and reduced adsorption of P because of the adsorbed SOM, or blocked adsorption sites that occur on the surface of clays with low colloidal activity. Leite et al. (2017) reported the contribution of SOM to labile organic P in the soil; the maintenance of plant cover on the area of cultivation (unburned sugarcane plants) generated higher organic P contents and other forms of P (total P, available P, inorganic P, and P in humic substances) when compared to the areas with burned sugarcane plants.
jas.ccsenet.org Journal of Agricultural Science Vol. 11, No. 1; 2019
531
Table 1. Correlation matrix for soil attributes in the study areas. Terra da Esperança Settlement Project, Governador Dix-Sept Rosado, Rio Grande do Norte, Brazil WMD GMF AGR>2mm LL PL PI TPd TPc Microp. Macrop. TS Silt Clay Dp θ pH EC TOC P K+ Na+ Ca2+ Mg2+ CEC V Als
WMD 1.00
GMF 0.26 1.00
AGR>2mm 0.44 0.05 1.00
LL 0.42 0.16 0.42 1.00
PL 0.20 0.07 0.54 0.69 1.00
PI 0.42 0.16 0.14 0.82 0.15 1.00
TPd 0.57 -0.11 0.43 0.34 0.03 0.44 1.00
TPc 0.33 0.07 0.31 0.18 0.14 0.13 0.61 1.00
Microp. 0.66 -0.12 0.46 0.46 0.15 0.50 0.93 0.52 1.00
Macrop. -0.04 -0.02 0.06 -0.18 -0.28 -0.02 0.46 0.37 0.10 1.00
TS -0.46 0.10 -0.28 -0.37 -0.15 -0.39 -0.58 -0.31 -0.49 -0.39 1.00
Silt 0.14 0.05 0.05 0.03 0.04 0.00 0.13 0.17 -0.02 0.39 -0.74 1.00
Clay 0.43 -0.21 0.31 0.47 0.15 0.52 0.62 0.20 0.69 0.00 -0.33 -0.39 1.00
Dp -0.09 0.13 -0.18 -0.03 0.02 -0.06 -0.46 -0.06 -0.44 -0.19 0.15 0.09 -034 1.00
θ 0.03 0.02 -0.14 -0.11 0.02 -0.17 -0.30 -0.09 -0.24 -0.24 0.19 -0.08 -0.14 0.26 1.00
pH 0.19 -0.07 0.25 -0.08 0.07 -0.17 0.19 0.08 0.16 0.13 -0.42 0.49 -0.11 0.20 0.03 1.00
EC 0.06 -0.06 0.07 0.22 0.17 0.17 0.14 0.29 0.07 0.22 -0.52 0.62 -0.15 0.21 -0.07 0.35 1.00
TOC 0.10 0.03 0.06 0.02 0.08 -0.03 0.06 0.14 0.20 -0.32 0.18 -0.07 -0.14 -0.15 0.07 0.22 -0.02 1.00
P 0.12 -0.05 0.32 0.29 0.26 0.20 0.12 0.24 0.17 -0.08 0.00 0.03 -0.05 0.20 -0.05 0.15 0.17 0.56 1.00
K+ 0.18 -0.03 0.10 0.00 0.18 -0.13 0.02 0.21 0.18 -0.38 0.21 -0.26 0.07 0.08 0.19 0.17 0.04 0.66 0.31 1.00
Na+ -0.11 0.03 -0.03 0.08 -0.01 0.11 0.06 0.14 -0.10 0.40 -0.54 0.72 -0.28 0.13 -0.05 0.30 0.67 -0.19 0.00 -0.27 1.00
Ca2+ 0.29 -0.03 0.18 0.03 -0.09 0.10 0.55 0.13 0.52 0.24 -0.17 -0.10 0.37 -0.32 0.00 0.47 -0.15 0.36 0.21 0.14 -0.14 1.00
Mg2+ -0.18 0.00 -0.17 -0.20 -0.17 -0.13 -0.32 -0.03 -0.47 0.26 -0.14 0.46 -0.46 0.36 0.13 -0.09 0.31 -0.18 0.19 -0.20 0.53 -0.39 1.00
CEC 0.16 -0.06 0.01 -0.09 -0.22 0.05 0.36 0.14 0.24 0.38 -0.22 0.14 0.10 -0.14 0.08 0.33 0.06 0.34 0.36 0.12 0.20 0.77 0.25 1.00
V 0.38 0.02 0.45 0.10 0.20 -0.02 0.43 0.20 0.44 0.10 -0.43 0.27 0.20 0.06 0.07 0.87 0.21 0.21 0.14 0.25 0.14 0.61 -0.30 0.33 1.00
Als -0.35 -0.09 -0.36 -0.06 -0.16 0.05 -0.41 -0.23 -0.43 -0.08 0.25 -0.20 -0.06 -0.01 -0.05 -0.70 -0.15 -0.19 -0.08 -0.18 -0.10 -0.50 0.28 -0.23 -0.87 1.00
Note. WMD = weighted mean diameter; GMD = geometric mean diameter; AGR>2mm = soil aggregates larger than 2 mm; LL = liquidity limit; PL = plasticity limit; PI = plasticity index; TPd = total porosity determined; TPc = total porosity calculated; Microp = microporosity; Macrop = macroporosity; TS = total sand; Dp = particle density; θ = volumetric moisture; EC = electrical conductivity; TOC = total organic carbon; CEC = cation exchange capacity; V = base saturation; Als = aluminum saturation.
In the dendrogram generated by the cluster analysis (Figure 1), the reading is made from right to left, in which the y axis indicates the distances between the formed groups, and the x axis represents the groups joined in descending order of similarity. A high dissimilarity indicates that two individuals are distinct from the set. The cluster analysis formed four groups, with Groups I and IV formed from a single soil class (I from Haplustepts; and IV from Calciustolls), while Group II were formed from Haplustepts and Eutrustox, and Group III from Haplustepts, and Usticfluvents. The physical attributes were determinant for the dissimilarity of the horizons between soil classes for Groups I, II, and III, and chemical attributes were determinant for Group IV (Figure 1).
Group I was represented by areas with native forest, where the consolidation of the surface due to absence of soil turning of Haplustepts affected directly the physical attributes WMD, TPd, microporosity, aeration, clay, AGR>2mm, and the consistence limits (PL, LL, PI), agreeing with the results of the correlation matrix (Table 1) and the dendrogram (Figure 2). These results were similar to those of the Haplustepts due to active clay fraction of the soil; different types of clay confer different characteristics of cohesion and adhesion, affecting structural attributes. These properties were affected by the origin material of the Haplustepts, which belong to the Jandaíra formation, conferring them expressive adhesion and cohesion forces. These forces are dependent on the soil moisture, consistency, and aggregation, and affect the structural stability, depending on the clay content and type by the formation of primary aggregates; and the most stable aggregates (secondary aggregates) are dependent on the energy input (SOM) through microbial activity (Brady & Weil, 2013).
WMD, Dp, Mg2+, volumetric moisture (θ), TS, and Als were significant for Group II (Figure 2), with predominance of sand fraction in the surface layer, which was more expressive in the Eutrustox. This result is explained by the intense weathering that occurs in this soil class, compared to the others. These correlations are due to the clay fraction, which affects various physical attributes and influences the soil structure. Ghidin et al., (2006) evaluated the correlation between clay fraction and structural properties and reported that the mineral content in the clay fraction is more important to defining the soil structure and porosity than its crystallographic characteristics. Similarly, Vasconcelos et al. (2010) emphasized the contribution of different types of clay to the description of soil physical attributes.

jas.ccsenet.
The attribuindicates ycontents; t
Group IV correlationThis indiccharacteris
Table 2 sh(F1) to Faestimatingenvironmeenvironme
org
Figure
utes TPc, Macyoung, not wethe increased E
was differenn matrix (Tablecates young, stics and locati
Figure
hows the factoactor (F6), w
g the influenceents, especiallyents, which is
e 1. Dendrogra
crop, Silt, Na+,eathered, eutropEC indicated a
ntiated from the 1 and Figurelittle weathereion in the land
e 2. Euclidean
ors extracted frwhich explaine
e of expressivy clay, Na+, Caa consequenc
Journal of A
am of the dista
, and EC werephic (sum of bhigh content o
he others by 2), the chemiced soils, with
dscape (lower l
distance betwe
from the 27 vaed approximatve variables, a2+, sum of bae of the factor
Agricultural Sci
532
ance matrix by
e significant fobases ≥ 50%) of soluble salts
encompassingcal attributes ph physical limlevels).
een variables w
ariables studiedtely 80% of twith positive
ases (SB) and Vrs and pedoge
ience
the linkage-ba
or Group III, essoils, with ma
s (Figure 1).
g only the CapH, V, Ca2+, T,mitations rega
within the soil
d, with accumthe total varia
factorial loadV. These attribnic processes
ased clustering
specially for thasked fertility
alciustolls, and TOC, K+, and
arding drainag
groups formed
mulated proporance of the reds for the difbutes varied bthat are strong
Vol. 11, No. 1;
g
he Usticfluvenbecause of its
d according tod P were signifge due to intr
d
rtion from Facesults. F1 allofferentiation oetween classesgly affected b
2019
nts. It s Na+
o the ficant. rinsic
ctor 1 owed f the s and y the
jas.ccsenet.org Journal of Agricultural Science Vol. 11, No. 1; 2019
533
climatic pattern of the semiarid region in the Northeast region of Brazil and the soil location in the landscape. Factorial analysis showed that most of the variance (F1 = 26.72%) were due to interrelations between inorganic fractions (especially clay fraction) and chemical attributes (Tables 1 and 2, and Figures 1 and 2). Similarly, Souza et al. (2018) reported clay, total sand, Ca2+, Mg2+, OM, and SB as the variables that contributed the most to discriminate environments.
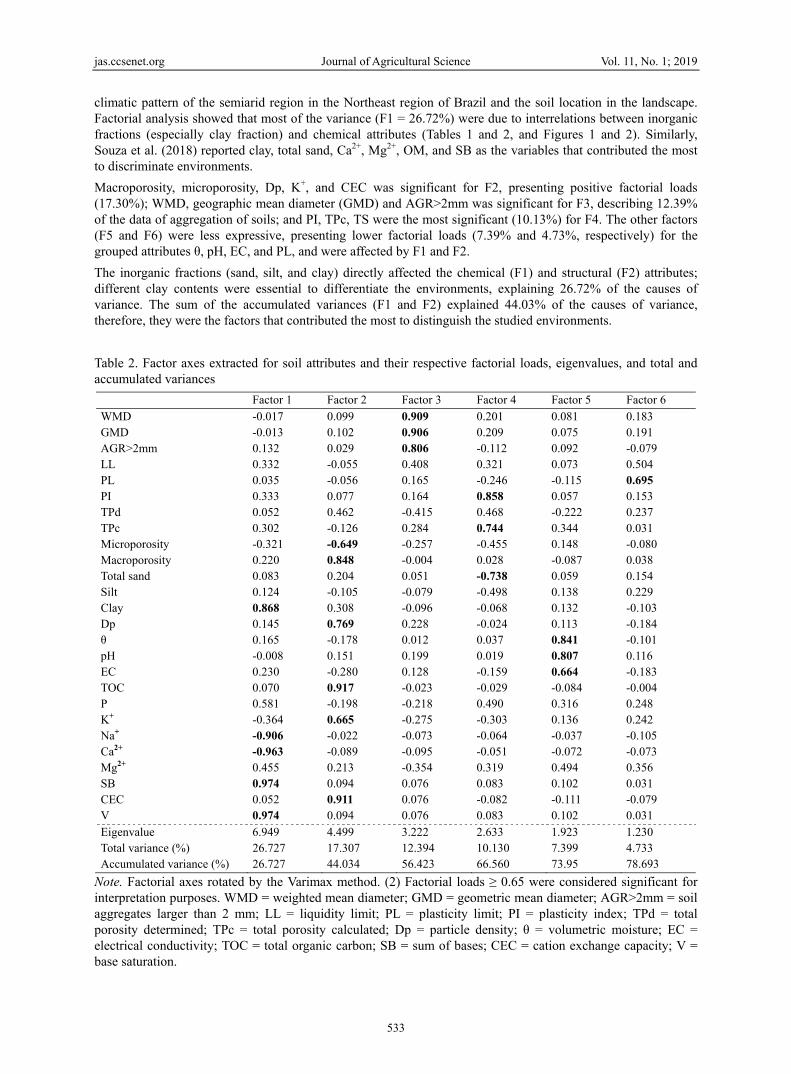
Macroporosity, microporosity, Dp, K+, and CEC was significant for F2, presenting positive factorial loads (17.30%); WMD, geographic mean diameter (GMD) and AGR>2mm was significant for F3, describing 12.39% of the data of aggregation of soils; and PI, TPc, TS were the most significant (10.13%) for F4. The other factors (F5 and F6) were less expressive, presenting lower factorial loads (7.39% and 4.73%, respectively) for the grouped attributes θ, pH, EC, and PL, and were affected by F1 and F2.
The inorganic fractions (sand, silt, and clay) directly affected the chemical (F1) and structural (F2) attributes; different clay contents were essential to differentiate the environments, explaining 26.72% of the causes of variance. The sum of the accumulated variances (F1 and F2) explained 44.03% of the causes of variance, therefore, they were the factors that contributed the most to distinguish the studied environments.
Table 2. Factor axes extracted for soil attributes and their respective factorial loads, eigenvalues, and total and accumulated variances
Factor 1 Factor 2 Factor 3 Factor 4 Factor 5 Factor 6
WMD -0.017 0.099 0.909 0.201 0.081 0.183 GMD -0.013 0.102 0.906 0.209 0.075 0.191 AGR>2mm 0.132 0.029 0.806 -0.112 0.092 -0.079 LL 0.332 -0.055 0.408 0.321 0.073 0.504 PL 0.035 -0.056 0.165 -0.246 -0.115 0.695 PI 0.333 0.077 0.164 0.858 0.057 0.153 TPd 0.052 0.462 -0.415 0.468 -0.222 0.237 TPc 0.302 -0.126 0.284 0.744 0.344 0.031 Microporosity -0.321 -0.649 -0.257 -0.455 0.148 -0.080 Macroporosity 0.220 0.848 -0.004 0.028 -0.087 0.038 Total sand 0.083 0.204 0.051 -0.738 0.059 0.154 Silt 0.124 -0.105 -0.079 -0.498 0.138 0.229 Clay 0.868 0.308 -0.096 -0.068 0.132 -0.103 Dp 0.145 0.769 0.228 -0.024 0.113 -0.184 θ 0.165 -0.178 0.012 0.037 0.841 -0.101 pH -0.008 0.151 0.199 0.019 0.807 0.116 EC 0.230 -0.280 0.128 -0.159 0.664 -0.183 TOC 0.070 0.917 -0.023 -0.029 -0.084 -0.004 P 0.581 -0.198 -0.218 0.490 0.316 0.248 K+ -0.364 0.665 -0.275 -0.303 0.136 0.242 Na+ -0.906 -0.022 -0.073 -0.064 -0.037 -0.105 Ca2+ -0.963 -0.089 -0.095 -0.051 -0.072 -0.073 Mg2+ 0.455 0.213 -0.354 0.319 0.494 0.356 SB 0.974 0.094 0.076 0.083 0.102 0.031 CEC 0.052 0.911 0.076 -0.082 -0.111 -0.079 V 0.974 0.094 0.076 0.083 0.102 0.031
Eigenvalue 6.949 4.499 3.222 2.633 1.923 1.230 Total variance (%) 26.727 17.307 12.394 10.130 7.399 4.733 Accumulated variance (%) 26.727 44.034 56.423 66.560 73.95 78.693
Note. Factorial axes rotated by the Varimax method. (2) Factorial loads ≥ 0.65 were considered significant for interpretation purposes. WMD = weighted mean diameter; GMD = geometric mean diameter; AGR>2mm = soil aggregates larger than 2 mm; LL = liquidity limit; PL = plasticity limit; PI = plasticity index; TPd = total porosity determined; TPc = total porosity calculated; Dp = particle density; θ = volumetric moisture; EC = electrical conductivity; TOC = total organic carbon; SB = sum of bases; CEC = cation exchange capacity; V = base saturation.

jas.ccsenet.
In the corrof the diffethe environ
The vectorcorrelationcorrelationMg2+, V, W
The variabGMD, AGand Ca2+ cincluding region—lo(1997) repdeterminesgiving theweathering
A cluster microporo3AGRO (aweathered
Regardingpositively 5CAP (CaTherefore,material, a
Figure 3
The distrib(Figure 4BAGR>2mmdifferentlysoil erodibdifferent e
org
relation circle ferent soils prenments, denoti
rs in the correln. Similarly, thns. Three groupWMD, GMD, A
bles Na+ and CGR>2mm, pH, contents, in ththe Eutrustox
ow precipitatioported that vas their eutrophm a specific cg.
was formed osity, and θ, hiagroecological
d soils.
g the principal with the profi
alciustolls) wa, the characterand location in
A
3. Distribution
bution of the vB) show the sem were correla
y as cementingbility (Brady &nvironments b
(Figure 3A), isented variabiing the interrel
lation circle rephe location of mps of variablesAGR>2mm, pH
Ca2+ showed oEC, θ, PI), ind
he Eutrustox (Fx (Profile 4). on and high evariability in phic or dystropcharacter accor
(Figure 3B) ighlighting thel area) and 6N
component anles 1CA, 2CAas different frrization of thi
n the landscape
A
of the variablerepresenti
variables in theeparations betwated with the ag agents, with & Weil, 2013).by the proporti
Journal of A
inorganic fractlity in texture,lations of each
presented by Cmicroporosity s were formed H, EC, θ, and P
opposite sign adicating high cFigure 3 B). TThis is a loc
vaporation ratephysical, chemphic character rding to the cl
around the axe profiles 3AG
NF (native fore
nalysis (PCA), A, 3AGRO, 6N
om the othersis environmen
e (low level).
es in the circleing the correlat
e circle of corrween the enviaggregation, siclay of colloi
The most signons of inorgan
Agricultural Sci
534
tions were not , showing predh site (Figure 3
Ca2+ and Mg2+,in the oppositbecause of thePI.
and position inconcentrationsThe soil classecal peculiarity,e, which delaymical, and mi
depending onlimatic pattern
xis F1, correlGRO and 6NF
st), with emph
the TPd, Dp, NF, 7NF, 8PPA,
s regarding thnt was affecte
e of correlationtion between F
relations (Figuironments. In ince these soilsidal activity hnificant variab
nic fractions (s
ience
concentrated dominance of v3).
, TOC and T, ate quadrant to me interrelations
n the graph (Ps of these variaes presented a, due to the c
ys leaching proineralogical chn the factors an of the region
lating positive(Haplustepts)
hasis on the sil
macroporosity, 9MN, and 10hese attributesed by the soil
ns (A) and distrFactors 1 and 2
ure 4A) and diF3, the structus have differenaving greater
bles in F4 wereand, silt, and c
closely, thus, tvariables that m
and PTc and PTmacroporositys of clay, SB, V
Tc, Ptd, LL, Iables, and con
a eutrophic chaclimatic patterocess of exchaharacteristics and processes n, which influe
ely the variab; and EC, andlt fraction, ind
y, TOC, and CE0SP (Haplusteps, especially cl intrinsic cha
B
ribution of the2 (B)
istribution of thural variables nt clay contentstability of age PI, TS, and Pclay) of each s
Vol. 11, No. 1;
the studied promore discrimin
Td indicated ay indicates negV, PTc, Ptd, LL
P, Mg2+, V, Wnsequently, lowaracter (V ≥ 5rn of the sem
angeable basesof Eutrustox of soil forma
ences the chem
bles P, Mg2+, d silt in the prodicating young
EC were correpts); and the prchemical attribaracteristics, so
e clouds of poin
he clouds of pWMD, GMDts and types, aggregates, reduPTc, characterite.
2019
ofiles nated
high gative L; PI,
WMD, w Na+ 50%), miarid
. Ker soils
ation, mical
clay, ofiles , low
elated rofile butes. ource
nts
points , and
acting ucing rizing

jas.ccsenet.
Figure 4
The most variance. Tthe EutrusdiscriminaCalciustoll
Figure 5
4. Conclus
The physic(GMD), so(θ), and plorganic cafor the dimacroporo
org
A
4. Distribution
discriminant vThe soil pH wstox (4NF) inant for F6 forls (5CAP) (Fig
A
5. Distribution
sions
cal attributes coil aggregates lasticity limit (arbon (TOC), Kifferentiation oosity, Dp, EC,
A
of the variablerepresenti
variables for Fwas discriminann the Bw horir the Eutrustogure 5).
A
of the variablerepresenti
clay, particle dsmaller than
(PL), and the cK+, cation exchof the soil clTOC, K+, and
Journal of A
es in the circleing the correlat
F5 and F6 wernt for Factor 5izon, by its i
ox (4NF) in t
es in the circleing the correlat
density (Dp), w2 mm (AGR>chemical attribhange capacitylasses and lanCEC were the
Agricultural Sci
535
e of correlationtion between F
re θ, pH, EC, 5 for the Hapluincreased claythe BA horizo
e of correlationtion between F
weighted mea>2mm), plasticbutes Na+, Ca2
y (CEC), pH, and uses. Howe most sensitiv
ience
ns (A) and distrFactors 3 and 4
and PL, whicustepts (6NF) iy fraction in ton; and EC w
ns (A) and distrFactors 5 and 6
an diameter (Wcity index (PI)2+, sum of baseand electrical c
wever, clay, Nve variables.
B
ribution of the4 (B)
ch explained 1in the A horizothe diagnostic
was discrimina
B
ribution of the6 (B)
WMD), geomet, total sand, v
es (SB), base sconductivity (Ea+, Ca2+, SB,
Vol. 11, No. 1;
e clouds of poin
12.12% of the on; θ discriminc horizon; PL ant for F6 fo
e clouds of poin
tric mean diamolumetric moi
saturation (V), EC) were indic V, microporo
2019
nts
total nated
was r the
nts
meter isture total
cators osity,
jas.ccsenet.org Journal of Agricultural Science Vol. 11, No. 1; 2019
536
The chemical attributes P, K+, CEC, Ca2+, V, and pH were the most sensitives for the differentiation of the Calciustolls, whereas the physical attributes WMD, GMD, AGR>2mm, PI, and PL distinguished the Eutrustox, and the physicochemical attributes EC, Na+, silt, macroporosity, PTc, aluminum saturation, total sand, θ, Mg2+, and Dp distinguished the Haplustepts and the Usticfluvents.
The clay fraction presented interrelation with the chemical attributes (Factor 1), distinguishing the soil classes and land uses depending on their origin material, and local peculiarities.
The soils classes evaluated presented a eutrophic character (V ≥ 50%), including the Eutrustox, especially due to the Na+ and Ca2+, despite its lower contents when compared to the other soil classes, which denotes a local peculiarity because of the climatic pattern of the semi-arid region.
Acknowledgements
To the Coordination for the Improvement of Higher Education Personnel—CAPES—for the financial support.
References
Alvares, C. A., Stape, J. L., Sentelhas, P. C., de Moraes, G., Leonardo, J., & Sparovek, G. (2013). Köppen’s climate classification map for Brazil. Meteorologische Zeitschrift, 711-728. https://doi.org/10.1127/0941- 2948/2013/0507
Angelim, L. A. A., Angelim, V. C., & Nesi, J. R. (2006). Programa Geologia do Brasil-PLGB. Projeto Geologia e Recursos Minerais do Estado do Rio Grande do Norte. Mapa Geológico do Estado do Rio Grande do Norte. Escala. Recife: CPRM/FAPERN.
Brady, N. C., & Weil, R. R. (2013). Elementos da natureza e propriedades dos solos. Bookman Editora.
Carvalho, A. E. M., Lima, L. A., de Sousa Oliveira, L., & Costa, M. C. G. (2017). Diagnóstico do uso e conservação do solo em região de reforma agrária no semiárido. Revista Verde de Agroecologia e Desenvolvimento Sustentável, 568-573. https://doi.org/10.18378/rvads.v12i3.4870
Castilho, K. B., Cortez, J. W., Olszevski, N., Salviano, A. M., & Trindade, M. H. (2017). Análise multivariada da qualidade química de um Latossolo sob sistemas de manejo do solo. Agrarian, 10(36), 162-169. https://doi.org/10.30612/agrarian.v10i36.4179
Forsythe, W. (1975). Manual de laboratorio: Física de suelos (No. IICA-LME 25). IICA, San José (Costa Rica).
Hair, J. F., Black, W. C., Babin, B. J., Anderson, R. E., & Tatham, R. L. (2009). Análise multivariada de dados. Bookman Editora.
Ghidin, A. A., Melo, V. D. F., Costa Lima, V., & Jonasson Costa Lima, J. M. (2006). Toposseqüências de latossolos originados de rochas basálticas no Paraná. I-Mineralogia da fração argila. Revista Brasileira de Ciência do Solo, 30(2). https://doi.org/10.1590/S0100-06832006000200011
Kemper, W.D. and Rosenau, R.C. (1986). Aggregate Stability and Size Distribution. Methods of Soil Analysis, Part 1. Physical and Mineralogical Methods (2nd ed.). Agronomy Monograph (Vol. 9, pp. 425-442).
Ker, J. C. (1997). Latossolos do Brasil: Uma Revisão. Geonomos, 5, 17-40. https://doi.org/10.18285/geono mos.v5i1.187
Kiehl, E. J. (1979). Manual de edafologia: Relações solo-planta (p. 262). São Paulo: Ceres.
Leite, J. N. F., Cruz, M. C. P. D., Ferreira, M. E., Andrioli, I., & Braos, L. B. (2016). Organic and inorganic P forms in soil as affected by cover crops and nitrogen fertilization. Pesquisa Agropecuária Brasileira, 51(11), 1880-1889.
Lepsch, I. F., Espindola, C. R., Vischi Filho, O. J., & Hernani, L. C. (2015). Manual para levantamento utilitário e classificação de terras no sistema de capacidade de uso. Campinas: SBCS.
Machado Vezzani, F., & Mielniczuk, J. (2009). Uma visão sobre qualidade do solo. Revista Brasileira de Ciência do Solo, 33(4). https://doi.org/10.1590/S0100-06832009000400001
Machado, V. J., & de Souza, C. H. E. (2012). Disponibilidade de fósforo em solos com diferentes texturas após aplicação de doses crescentes de fosfato monoamônico de liberação lenta. Bioscience Journal, 28(1).
Marinho, A. C. C. S., Portela, J. C., Silva, E. F., Dias, N. S., Sousa Júnior, F. S., Silva, A. C., Silva, J. F. (2016). Organic matter and physicochemical attributes of a Cambisol under different agricultural uses in a semi-arid region of Brazil. Australian Journal of Crop Science, 10, 32-41.
jas.ccsenet.org Journal of Agricultural Science Vol. 11, No. 1; 2019
537
Mota, A. J. C., Nonato de Assis Júnior, R., Amaro Filho, J., & Libardi, P. L. (2008). Algumas propriedades físicas e hídricas de três solos na chapada do Apodi, RN, cultivados com melão. Revista Brasileira de Ciência do Solo, 32(1). https://doi.org/10.1590/S0100-06832008000100006
Pereira, M. G., Loss, A., Beutler, S. J., & Torres, J. L. R. (2011). Carbono, matéria orgânica leve e fósforo remanescente em diferentes sistemas de manejo do solo. Pesquisa Agropecuária Brasileira, 45(5), 508-514. https://doi.org/10.1590/S0100-204X2010000500010
Perin, A., Silva Santos, R. H., Urquiaga Caballero, S. S., Marinho Guerra, J. G., & Gusmão, L. A. (2010). Acúmulo e liberação de P, K, Ca e Mg em crotalária e milheto solteiros e consorciados. Revista Ceres, 57(2). https://doi.org/10.1590/S0034-737X2010000200020
Ribeiro, A. C., & Guimarães, P. T. G. (1999). Recomendações para o uso de corretivos e fertilizantes em Minas Gerais (5a aproximação). Comissão de Fertilidade do Solo do Estado de Minas Gerais.
Ribeiro, K. D., Menezes, S. M., de Freitas, M. D. G. B., & Sampaio, F. D. M. T. (2007). Propriedades físicas do solo, influenciadas pela distribuição de poros, de seis classes de solos da região de Lavras-MG. Ciência e Agrotecnologia, 31(4), 1167-1175. https://doi.org/10.1590/S1413-70542007000400033
Sá Paye, H., Vargas de Mello, J. W., & Bezerra de Melo, S. (2012). Métodos de análise multivariada no estabelecimento de valores de referência de qualidade para elementos-traço em solos. Revista Brasileira de Ciência do Solo, 36(3). https://doi.org/10.1590/S0100-06832012000300033
Souza, H. S., Tsukamoto Filho, A. D. A., de Souza, É. C., Arriel, D. A. A., & Medeiros, R. A. (2018). Análise multivariada de atributos químicos e físicos do solo em sistema agroflorestal com teca. Scientia Agraria, 19(1), 87-93.
StatSoft. (2004). Statistica Version 7.0. Retrieved from http://www.statsoft.com
Teixeira, P. C., Donagemma G. K., Wenceslau, A. F., & Teixeira, G. (2017). Manual de Métodos de Análise de Solo (3rd ed., p. 573). Rio de Janeiro: Embrapa Solos.
Turrión, M. B., López, O., Lafuente, F., Mulas, R., Ruipérez, C., & Puyo, A. (2007). Soil phosphorus forms as quality indicators of soils under different vegetation covers. Science of the Total Environment, 378(1-2), 195-198. https://doi.org/10.1016/j.scitotenv.2007.01.037
Vasconcelos, R. D., Cantalice, J. R. B., Silva, A. J. N. D., Oliveira, V. D., & Silva, Y. J. A. B. (2010). Limites de consistência e propriedades químicas de um Latossolo amarelo distrocoeso sob aplicação de diferentes resíduos da cana-de-açúcar. Revista Brasileira de Ciência do Solo, 34(3), 639-648. https://doi.org/10.1590/ S0100-06832010000300005
Copyrights
Copyright for this article is retained by the author(s), with first publication rights granted to the journal.
This is an open-access article distributed under the terms and conditions of the Creative Commons Attribution license (http://creativecommons.org/licenses/by/4.0/).