structural behavior of gfrp pultruded profiles reinforced ... · structural behavior of gfrp...
TRANSCRIPT
Francisco Nunes, Instituto Superior Técnico, Lisboa 2012
Page 1 of 16
Structural behavior of GFRP pultruded profiles reinforced with CFRP sheets
Experimental characterization and numerical modeling
Francisco Felício Nunes
Abstract: In the last decades, GFRP (Glass Fiber Reinforced Polymer) pultruded profiles have been a growing segment of the construction industry, particularly in bridge deck construction. Despite all their advantages, the diversity of raw materi-als used to produce FRP pultruded parts leads to a high difficulty in establishing codes or guidelines for design. In this dis-sertation, the structural behavior of a prototype of GFRP hybrid pultruded profiles reinforced with CFRP (Carbon Fiber Rein-forced Polymer) sheets on its flanges was studied. The mechanical properties of the material were obtained from coupon testing; specimens were extracted from the web and flanges of the profile. In a further stage, four short columns subjected to axial compression and one beam subjected to 4-point bending (and laterally braced) were tested. The structural behav-ior for serviceability and ultimate limit states of each type of structural element were analyzed, with particular attention being given to the ultimate limit state of local buckling. Along with the experimental characterization, the numerical mod-eling of the structural elements tested was developed using the ABAQUS software. Preliminary finite element method models (FEM) were developed using the mechanical properties obtained from coupon testing. Those models were calibrat-ed based on the experimental structural element behavior and parametric studies were subsequently conducted.
Keywords: GFRP, CFRP, Local buckling, Pultruded profiles, Experimental tests, Numeric modeling.
1. INTRODUCTION
A composite material is defined as a combination of two
different materials, gathering in itself the best characteris-
tics of each one. Nowadays, the most used composite ma-
terial in construction industry is reinforced concrete; gath-
ering the best qualities of steel (tensile strength) and con-
crete (compressive strength) [1]. In this dissertation, the
structural behavior of FRP (Fiber Reinforced Polymer) pul-
truded profiles was studied.
Over the last decades, costs related to structural mainte-
nance and reinforcement have been rising considerably.
Moreover, there has been an even greater demand for
faster construction [2]. Both these factors contributed to a
significant boost of lighter and more durable materials. The
FRP pultruded profiles are showing to be a competitive
alternative in some niches of construction industry.
The FRP pultruded profiles are composite materials usually
composed by glass fibers (GFRP) or carbon fibers (CFRP)
embedded in a vinyl-ester or polyester matrix. The main
advantages of its use are related to its high strength, re-
duced weight, electromagnetic transparency, durability
and resistance to corrosive agents [3].
Despite all their referred advantages, the use of FRP pul-
truded profiles is still hindered by some limitations related
to production costs, deformability, buckling sensitivity,
connection technology, and the lack of design codes.
2. FOCUS AND DEVELOPED WORK
The main goal of the present dissertation is the study of
the structural behavior of hybrid GFRP and CFRP pultruded
profiles. All work and investigation presented was carried
out to help the establishment of consensual design ap-
proaches. Also, the developed work contributed to the
characterization of a prototype hybrid FRP pultruded pro-
file produced by ALTO Perfis Pultrudidos Lda.
The present research may be divided in four different
chronological stages:
(i) Material mechanical characterization;
(ii) Initial numerical FE models of the experimental tests;
(iii) Experimental test of four short columns subjected to
axial compression and one beam subjected to 4-point
bending;
(iv) Calibration of the initial numerical models according to
the experimental results.

Francisco Nunes, Instituto Superior Técnico, Lisboa 2012
Page 2 of 16
These stages are grouped in two main chapters: experi-
mental characterization and numerical modeling.
The geometrical properties reported by the manufacturer
are presented in Figure 1.
Figure 1. Geometrical properties of the studied profile
The nominal thickness of the CFRP sheet is 1,5 mm. Since
the studied profile had a heterogeneous cross-section it
was necessary to determine the effective shear area by
analytical calculation (1606 mm2). The reported fiber vol-
ume of the pultruded profile was 60 ± 10%.
3. MECHANICAL CHARACTERIZATION
In order to obtain the mechanical properties of the studied
material, such as strengths and elastic moduli, tests were
carried out on specimens cut from the web and flanges of
the studied profile. Specimens were cut and tested accord-
ing to the ISO or ASTM standard test methods presented in
Table 1. In the following sections some notes for each me-
chanical test are presented.
Table 1. Standard test methods used in mechanical characteriza-tion
Test Standard
Bending EN ISO 14125 [4]
Interlaminar shear ASTM D 2344/D 2344M-00 [5]
Compression ASTM D 695-02 [6]
Tension ISO 527-4 [7]
In-plane Shear ISO 527-5 [8]
3.1. BENDING TEST
Three-point bending tests (EN ISO 14125) were conducted
on specimens with nominal dimensions of 300x15x10 mm,
in order to determine the longitudinal elastic modulus in
bending (Ef), the flexural strength (σfu) and the strain at
failure (εfu) in the longitudinal direction. The tested span
was 200 mm. The failure mode occurred with tensile failure
of the lower face fibers as shown in Figure 2. Eight speci-
mens of each part (web or flanges) were tested. Four of the
flange specimens were tested with the CFRP sheet on the
upper face (CFRPsup) and the remaining were tested with
the CFRP sheet on the lower face (CFRPinf). During the test
of the CFRPsup specimens, the delamination of the CFRP
sheet was observed for an elongation of 0,62%.
3.2. INTERLAMINAR SHEAR TEST
Interlaminar shear tests (ASTM D 2344/D 2344M-00) were
conducted on specimens with nominal dimensions of
60x15x10 mm applying a concentrated load at the center
of a 39 mm span, in order to determine the interlaminar
shear strength (Fsbs
). The failure mode occurred with inter-
laminar failure as shown in Figure 3. Four of the flange
specimens were tested with the CFRP sheet on the upper
face (CFRPsup) and the remaining were tested with the CFRP
sheet on the lower face (CFRPinf).
3.3. COMPRESSIVE TEST
Compressive tests (ASTM D 695-02) were conducted on
specimens with nominal dimensions of 40x12,7x10 mm in
the longitudinal direction and 30x12,7x10 mm in the trans-
verse direction, in order to determine the elastic modulus
in compression (Ec), the compressive strength (σcu) and the
strain at failure (εcu) for both directions. The failure mode
occurred with material crushing and delamination as
shown in Figure 4. The delamination of the CFRP sheet was
observed for ε ≈ 0,005.
3.4. TENSILE TEST
Tensile tests (ISO 527-4) were conducted on specimens
with nominal dimensions of 300x25x10 mm, in order to
determine the elastic modulus in tension (Et), the tensile
strength (σtu) and the Poisson’s ratio (νxy) in the longitudi-
nal direction. The distance between the claws was 150 mm.
The failure mode occurred with tensile failure of the fiber
reinforcement as shown in Figure 5.
3.5. IN-PLANE SHEAR TEST
In-plane shear tests (10° off-axis) were conducted on spec-
imens with 250x25x10 mm, in order to determine the
shear modulus (G) and the in-plane shear strength (τu). The
distance between the claws was 150 mm. The failure mode
occurred with shear failure as shown in Figure 6. All the
properties obtained in the mechanical characterization are
presented in Tables 2 and 3.
Area: 3879 mm2
Perimeter: 756 mm Inertia: Ix = 23526073 mm4
Iy = 1669597 mm4
Bending moduli: Wx = 235261 mm3
Wy = 33392 mm3
Linear mass: 7,18 kg/m Thickness (t): 10 mm Flange width (bf): 100 mm Web height (hw): 180 mm
hw
bf
t

Francisco Nunes, Instituto Superior Técnico, Lisboa 2012
Page 3 of 16
Figure 2. Bending test failure
Figure 3. Interlaminar shear test failure
Figure 4. Compressive test failure
Figure 5. Tensile test failure
Figure 6. In-plane shear failure
Table 2. Summary of results for web specimens
Mechanical property / Test and direction
Bending Compression Tension
Longitudinal Longitudinal Transverse Longitudinal
σu (MPa) 484,8 ± 11,2 495,1 ± 53,7 130,1 ± 11,67 396,6 ± 27,6
E (GPa) 22,16 ± 1,57 26,16 ± 1,29 9,35 ± 0,61 32,81 ± 1,48
εu (% m/m) 2,82 ± 0,23 2,51 ± 0,09 1,90 ± 0,20 -
F
sbs (MPa) 31,33 ± 2,50
τu (MPa) 30,59 ± 0,94
νxy 0,266
G (GPa) 3,73 ± 0,16
Table 3. Summary of results for flange specimens
Mechanical property / Test and direction
Longitudinal bending Compression Tension
CFRPsup CFRPinf Longitudinal Transverse Longitudinal
σu (MPa) 422,1 ± 25,0 620,4 ± 37,2 485,0 ± 23,6 92,3 ± 10,7 412,7 ± 16,1
E (GPa) 44,24 ± 7,70 48,13 ± 4,35 25,74 ± 2,66 10,15 ± 1,62 55,17 ± 3,11
εu (% m/m) 2,30 ± 0,30 1,50 ± 0,14 2,25 ± 0,17 1,52 ± 0,24 -
F
sbs (MPa) 31,70 ± 2,29
4. SERVICEABILITY LIMIT STATES
4.1. AXIAL DEFLECTION
The use of the uniaxial bar theory is recommended by both
the Structural Plastics Design Manual [9] and the Eurocomp
Design Code and Handbook [10] to determine the deflec-
tion of pultruded compression members.
The axial shortening (ΔL) of a column under axial compres-
sion can be determined using the following equation,
(1)
where P is the applied load, L is the column length, EL is the
longitudinal elastic modulus and A is the cross-section area.
4.2. TRANSVERSE DEFLECTION
The use of the Timoshenko beam theory is recommended
by both the Structural Plastics Design Manual [9] and the
Eurocomp Design Code and Handbook [10] of pultruded
axial members.
The deflection (δ) of a simply supported beam can be de-
termined using the following equations,
( )
(
( )
( )
)
(
)
(2)
( )
(( )
( )
( )
)
(( )
)
(3)
Francisco Nunes, Instituto Superior Técnico, Lisboa 2012
Page 4 of 16
where z is the distance to the beam end, P is the total ap-
plied load, L is the beam span, L0 is the distance between
load points, EI is the flexural rigidity and KGA is the shear
rigidity.
5. ULTIMATE LIMIT STATE OF LOCAL BUCKLING
FRP pultruded profiles are particularly susceptible to local
buckling under transverse loads due to the low in-plane
moduli and the slenderness of the plate elements (web and
flanges)[4]. Such phenomenon occurs both on columns or
beams with a thin-walled cross section. Numerous experi-
mental or numerical studies on the local buckling of FRP
plate elements were carried out in recent years (Bank et al.
[11], Mottram [12], Turvey and Zhang [13]). The typical
failure mode of this ultimate limit state is the separation of
the flange from the web [3]. An approximate method to
determine the local buckling critical stress (σcr,Local) has been
proposed by Kòllar [14]. For a wall that is simply supported
and free at its edges under uniform compressive stress, the
following equation may be used,
( )
( ) [ (
)
] (4)
where tp is the plate thickness, bp is the plate width, DL is
the flexural rigidity in the longitudinal direction, a is the
half-wave length and DS is the shear rigidity.
For a wall that is simply supported along both edges under
uniform compressive stress, the following equation may be
used,
( )
(√ ) (5)
where DT is the flexural rigidity in the transverse direction
and DLT is the coupling flexural rigidity.
For a wall that is simply supported along both edges under
linearly varying compressive stress, the following equation
may be used,
( )
( √ ) (6)
The consideration of a free/simply supported flange is
known to be an overly conservative assumption. To take
into account the elastic restriction of web-flange junction,
the following equation may be used,
( ) ( √
) (7)
The shear modulus (GLT) is not often reported by manufac-
turers. In these cases, an approximate method proposed by
the Structural Plastics Design Manual [9] may be used. The
local buckling critical stress is given by the equation,
( ) [(
)
√ ( )
] (8)
6. SHORT-COLUMNS FULL-SCALE EXPERIMENTAL TEST
6.1. OBJECTIVES AND PROCEDURE
To analyze the structural behavior of the pultruded profiles
studied, four short-columns were tested under axial com-
pression. The critical load (Pcr), the ultimate load (Pu), the
maximum axial shortening (ΔLmax) and the longitudinal
elastic modulus under compression (E) were obtained.
Experimental results were then compared to analytic val-
ues.
The columns were tested with 60 cm nominal free length.
At each end of the column, the profile was embedded in a
30x20x3 cm3 epoxy resin plate. This procedure was con-
ducted to guarantee that the end sections were rotational-
ly restrained and had no relative displacements.
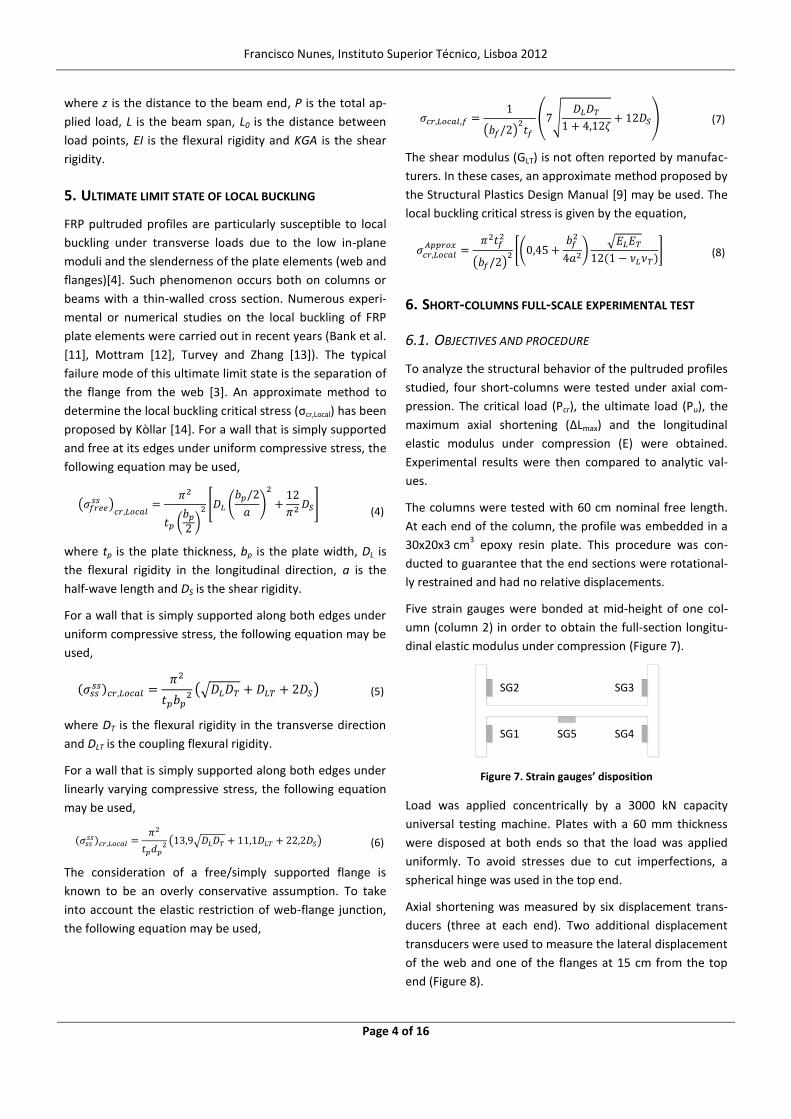
Five strain gauges were bonded at mid-height of one col-
umn (column 2) in order to obtain the full-section longitu-
dinal elastic modulus under compression (Figure 7).
Figure 7. Strain gauges’ disposition
Load was applied concentrically by a 3000 kN capacity
universal testing machine. Plates with a 60 mm thickness
were disposed at both ends so that the load was applied
uniformly. To avoid stresses due to cut imperfections, a
spherical hinge was used in the top end.
Axial shortening was measured by six displacement trans-
ducers (three at each end). Two additional displacement
transducers were used to measure the lateral displacement
of the web and one of the flanges at 15 cm from the top
end (Figure 8).
SG1
SG2
SG5
SG3
SG4

Francisco Nunes, Instituto Superior Técnico, Lisboa 2012
Page 5 of 16
Figure 8. (a) Axial shortening transducers and (b) lateral deflec-tion tranducers
During each test, the strains, displacements and the ap-
plied load were recorded at a frequency of 1 Hz by a com-
puter-controlled data-logger system. The test schematic
representation is presented in Figure 9.
Figure 9. Short-column test schematic representation
6.2. ANALYSIS OF RESULTS
A significant adjustment phase was registered on the load-
displacement curve of each column testing. The corrected
load-displacement curves are presented in Figure 10.
The ultimate load (Fu) and maximum axial shortening
(ΔLmax) of each short-column test are presented in Table 4.
Figure 10. Load against axial shortening
Table 4. Ultimate load and maximum axial shortening
Column Fu (kN) ΔLmax (mm)
1 644,35 5,07
2 587,87 4,14
3 706,90 4,65
4 666,41 4,24
Average 651,41 4,53
Stand. Dev. 49,65 0,43
Variation 7,62% 9,39%
Despite the reduced variation percentages on both param-
eters, two different types of buckling were observed. Col-
umns 1, 2 and 4 buckled with two half-waves along their
length. Column 3 buckled with one half-wave along its
length. Both buckling modes are shown in Figure 11.
Figure 11. Buckling modes with (a) two and (b) one half-waves
Failure occurred with the separation of one or both flanges
from the web, followed by delamination of both CFRP
sheets (Figure 12).
Figure 12. Failure mode with tearing of flanges from the web
The measured lateral displacements on each test are pre-
sented in Figures 13, 14, 15 and 16. The web displacement
is shown in blue and the flange displacement is shown in
red.
a)b)
Spherical hinge
Load cell
Top plate
Bottom plate
Short-column
0
100
200
300
400
500
600
700
800
0,0 1,0 2,0 3,0 4,0 5,0 6,0
F (k
N)
ΔL (mm)
Col1
Col2
Col3
Col4
a) b)

Francisco Nunes, Instituto Superior Técnico, Lisboa 2012
Page 6 of 16
Figure 13. Lateral displace-
ment on column 1
Figure 14. Lateral displace-
ment on column 2
Figure 15. Lateral displace-
ment on column 3
Figure 16. Lateral displace-
ment on column 4
Figure 14 shows a linear evolution of the lateral web dis-
placement which is a consequence of eccentrically applied
load resultant from cut imperfections. Figure 15 shows no
significant displacements because the measured section
was near an inflection point of the buckling mode.
Critical loads were determined using an approximate
method. The critical load was defined as the intersection of
the load axis and a trend line of the final phase of the load
against lateral displacement for each test (Figure 17).
Figure 17. Critical load determination
The measured displacements of column 3 are near an in-
flection point of the buckling mode, therefore it was not
possible to determine the critical load of the referred col-
umn. The remaining critical loads are presented in Table 5.
Table 5. Local buckling critical loads
Column Fcr (kN) Fu/Fcr
1 616,5 1,045
2 535,8 1,097
4 635,5 1,059
Average 595,9 1,067
Stand. Dev. 52,9 0,027
Variation 8,88% 2,52%
Column 2 was subjected to combined bending and axial
compression. To determine the longitudinal elastic modu-
lus (E), bending and compressive strains had to be consid-
ered separately (Figure 18). The section curvature (χ) was
determined and it is presented in Figure 19.
Figure 18. Influence of axial compression and bending in the section strain
Figure 19. Load against curvature on column 2
The longitudinal elastic modulus (E) was defined as the
slope of the following equation,
( ) (9)
where σ is the longitudinal stress at the bending neutral
axis, F is the applied load, A is the cross-section area, εmax is
the maximum section strain and z is the distance from the
bending neutral axis to the flange border (z = 0,05 m).
Figure 20 shows the trend line of equation (9) between 25
and 50 MPa.
0
100
200
300
400
500
600
700
-2 0 2 4 6
F (k
N)
δ (mm)
0
100
200
300
400
500
600
700
-5 0 5 10
F (k
N)
δ (mm)
0
100
200
300
400
500
600
700
800
-2 -1 0 1 2
F (k
N)
δ (mm)
0
100
200
300
400
500
600
700
-4 -2 0 2
F (k
N)
δ (mm)
Fcr
y = m.x + Fcr
= +
εmin
εmax
-Δε/2εave
Δε/2
0
100
200
300
400
500
600
700
0 0,01 0,02 0,03 0,04
F (k
N)
χ (rad)

Francisco Nunes, Instituto Superior Técnico, Lisboa 2012
Page 7 of 16
Figure 20. Stress against strain on column 2
The determined longitudinal elastic modulus under com-
pression was 41,15 GPa.
6.3. DISCUSSION AND CONCLUDING REMARKS
The experimental local buckling critical stress was com-
pared to the analytical values obtained using equations (4),
(7) and (8). The experimental local buckling critical stress
(σf,cr,Local) was obtained using the following equation,
( ) (10)
where Pcr,Local is the critical load, Ef is the flanges longitudi-
nal elastic modulus, Af is the flanges area, Ew is the web
longitudinal elastic modulus and Aw is the web area.
Critical stresses of the columns 1, 2 and 4 are presented in
Table 6.
Table 6. Local buckling critical stress
Column σf,cr,Local (MPa)
1 200,8
2 174,5
4 207,0
Using Kòllar’s equation which considers a free/simply sup-
ported flange, a local buckling critical stress of 223,3 MPa is
obtained.
Using Kòllar’s equation which considers the web-flange
junction elastic restriction, a local buckling critical stress of
184,0 MPa is obtained.
Using the Structural Plastics Design Manual approximate
method equation, a local buckling critical stress of
389,3 MPa is obtained.
The equation which gave a better approximation was equa-
tion (7), considering the elastic restriction of the web-
flange junction, with an average percent error of 8,9%.
Using the obtained longitudinal elastic modulus under
compression (E = 41,15 GPa) on equation (1), the axial
shortening is 4,05 mm. The percent error between the
analytical and the experimental axial shortening was
11,94%.
7. BEAM FULL-SCALE EXPERIMENTAL TEST
7.1. OBJECTIVES AND PROCEDURE
To analyze the structural behavior of the pultruded profile
studied, a simply supported beam under four-point bend-
ing was tested. The ultimate load (Pu), the maximum trans-
verse deflection (δmax) and the full-section elastic moduli (E
and G) were determined and experimental results were
then compared to analytical values.
Two types of tests were carried out:
Serviceability behavior – several load/unload tests
were carried out in order to obtain the elastic
moduli (E and G) under bending;
Ultimate behavior – study of the ultimate load as
well as the failure mode.
The test span (L) was 4,0 m. The distance between load
points (L0) varied from 1,0 to 2,0 m for the elastic moduli
determination stage. The distance between load points for
the ultimate load determination stage was 1,40 m (approx-
imately L/3). An auxiliary steel beam was used to distribute
the applied load. The total beam length was 4,40 m.
Nine strain gauges were bonded at mid-span of the beam
in order to obtain the full-section longitudinal elastic
modulus (E) under bending (Figure 21).
Figure 21. Strain gauges’ disposition
y = 41153x - 3,3218R² = 0,9994
0
20
40
60
80
100
120
140
160
0 0,001 0,002 0,003 0,004 0,005 0,006
σ(M
Pa)
ε (m/m)
SG1 SG2 SG3
SG4SG9
SG5SG8
SG6SG7

Francisco Nunes, Instituto Superior Técnico, Lisboa 2012
Page 8 of 16
The load was applied by a 600 kN capacity hydraulic jack
and measured with a load cell with 100 kN capacity. Lateral
bracing was required to avoid lateral-torsional buckling.
The braced sections are shown in Figure 22.
Figure 22. Lateral bracing on the beam test (measures in cm)
Transverse deflection was measured by three displace-
ment transducers placed under the mid-span section and
two other sections distanced from the mid-span by 0,70 m.
Two additional displacement transducers were used to
measure section displacements due to buckling.
During each test, strains, displacements and applied load
were recorded at a frequency of 10 Hz by a computer-
controlled data-logger system. The test schematic repre-
sentation is presented in Figure 23.
Figure 23. Short-column test schematic representation
7.2. ELASTIC MODULI DETERMINATION
Having measured the transverse displacements it is possi-
ble to determine the full-section elastic moduli using the
Timoshenko beam theory. Equations (2) and (3) may be re-
arranged in the following equations,
( )
(
( )
( )
)
(11)
( )
( )
(
( )
)
(12)
A scatter was made with the measured P-δ(z) values. With
the scatter trend line, the values of
(slope) and
(ver-
tical axis intercept) can be obtained. The scatter and the
respective trend line are presented in Figure 24.
Figure 24. Elastic moduli determination scatter
The elastic moduli (E and G) were then determined and are
presented in Table 7.
Table 7. Elastic moduli determination
1/EI (kN-1
m-2
) EI (kNm2) E (GPa)
8,37x10⁻⁴
1194,74 50,78
1/KGA (kN-1
) KGA (kN) G (GPa) 1,587x10
-4 6301,29 3,92
7.3. ANALYSIS OF RESULTS
The load-displacement curves are shown in Figure 1 (d1 is
the mid-span displacement; d2 and d3 are the displace-
ments under the load application points). Delamination of
the upper flange CFRP sheet occurred for an applied load
of 29,82 kN.
Figure 25. Load against transverse deflection
With a trend line of the load-displacement curve before the
CFRP sheet delamination it was possible to obtain the ap-
parent longitudinal modulus (Ea = 47,13 GPa) and the shear
deformability influence (9,94%).
A significant stiffness loss was verified after the delamina-
tion (about 31%). The global transverse deflection before
failure is shown in Figure 26.
Braced section Braced interval
38 30 52 56 48 56 52 30 38
Hydraulic jack
Load cell Auxiliary beamPinned end
Rolled end
Concrete blocks
Pultruded hybrid beam
y = 8,370E-04x + 1,587E-04
0,0013
0,0014
0,0015
0,0016
0,0017
0,0018
1,4 1,5 1,6 1,7 1,8 1,9
(kN
-1)
(m2)

Francisco Nunes, Instituto Superior Técnico, Lisboa 2012
Page 9 of 16
Figure 26. Global transverse deflection on the brink of collapse
Failure occurred with web-flange separation as it usually
occurs in local buckling phenomena. However, the lateral
bracing system was considered inadequate since two steel
props were laterally pulled when failure occurred. A com-
bined global and local buckling mode may have occurred
due to lack of lateral bracing rigidity.
The ultimate load was 50,41 kN, with a maximum deflec-
tion of 56,81 mm.
The lateral web displacement (blue) and the difference
between displacements at the upper flange borders (red)
are shown in Figure 27. Both measured displacements are
consistent with lateral-torsional buckling (Figure 28). The
load-curvature curve is shown in Figure 29.
Figure 27. Beam section displace-ments
Figure 28. Local (green) and global (red) buckling
Figure 29. Load against curvature
7.4. DISCUSSION AND CONCLUDING REMARKS
The experimental local buckling critical stress was com-
pared to the analytical values obtained using equations (4),
(7) and (8). Due to the global buckling phenomenon and
the impossibility to apply the Southwell plot, the analytical
local buckling stresses were compared with the ultimate
compressive stress on the upper flange (σu = 144,0 MPa).
Using Kòllar’s equation which considers a free/simply sup-
ported flange, a local buckling critical stress of 140,2 MPa is
obtained.
Using Kòllar’s equation which considers the web-flange
junction elastic restriction, a local buckling critical stress of
195,7 MPa is obtained.
Using the Structural Plastics Design Manual approximate
method equation, a local buckling critical stress of
208,5 MPa is obtained.
The equation which gave a better approximation was equa-
tion (4), considering a free/simply supported flange with a
percent error of 3,4%. However, this equation is often
considered to be over conservative.
A maximum deflection of 52,2 mm is obtained using the
Timoshenko beam theory with the elastic moduli deter-
mined in 7.2. The percentage error between experimental
and analytical deflection was 8,1% but since this value does
not consider the CFRP sheet delamination it is, naturally, a
lower bound of the experimental value.
8. SHORT-COLUMN FE NUMERICAL MODELING
8.1. PRELIMINARY FE MODEL
FE models of the tested columns were developed using the
ABAQUS program [15]. Shell elements with four nodes
were used. Material was considered to be composite, lam-
inate and elastic. Properties determined in the mechanical
characterization were used in this stage. A 23-node section
as shown in Figure 30 was used. The column length was
considered to be 60 cm.
0
10
20
30
40
50
60
-2 0 2 4 6 8
F (k
N)
δ (mm)
d,alma
Δd,banzo
0
5
10
15
20
25
30
35
0 1 2 3 4
M (
kNm
)
χ (rad x10-8)

Francisco Nunes, Instituto Superior Técnico, Lisboa 2012
Page 10 of 16
Figure 30. Profile section of the FE models (in mm)
The Tsai-Hill failure criterion was used. This failure criterion
considers the interaction between material strengths and is
given by the following equation,
(13)
where σ11 is the longitudinal stress, σ22 is the transverse
stress, σ12 is the shear stress, X is the longitudinal strength,
Y is the transverse strength and S is the shear strength. The
Tsai-Hill criterion indicates the first failure point of the
structural element but not the collapse.
A linear buckling analysis was performed in order to obtain
the critical load (Pcr), the number of half-waves (nhw) and
the half-wave length (Lhw) of the first three buckling modes.
Results are shown in Table 8.
Table 8. Buckling analysis results
Buckling mode Pcr (kN) Lhw (cm) nhw
1st
763,49 20,0 2
2nd
809,78 20,3 1
3rd
1102,11 14,0 3
The comparison between numerical and experimental
critical loads leads to a difference of 128 kN (17%). With
these results it is necessary to calibrate the model with the
results presented on the full-scale short-column testing.
A non-linear analysis was then carried out in order to ob-
tain load-displacement data until initial failure occurs. For
an initial imperfection according to the first buckling mode
(2 half-waves – 2HW), an initial failure load (Pif) of 789,34
kN and an axial shortening of 2,82 mm were determined.
The load-displacement curve and the deformed shape at
the initial failure are shown in Figures 31 and 32.
Figure 31. Load against displacement
Figure 32. (a) Perspective and (b) front view of the de-formed shape at initial failure (scaled 8x)
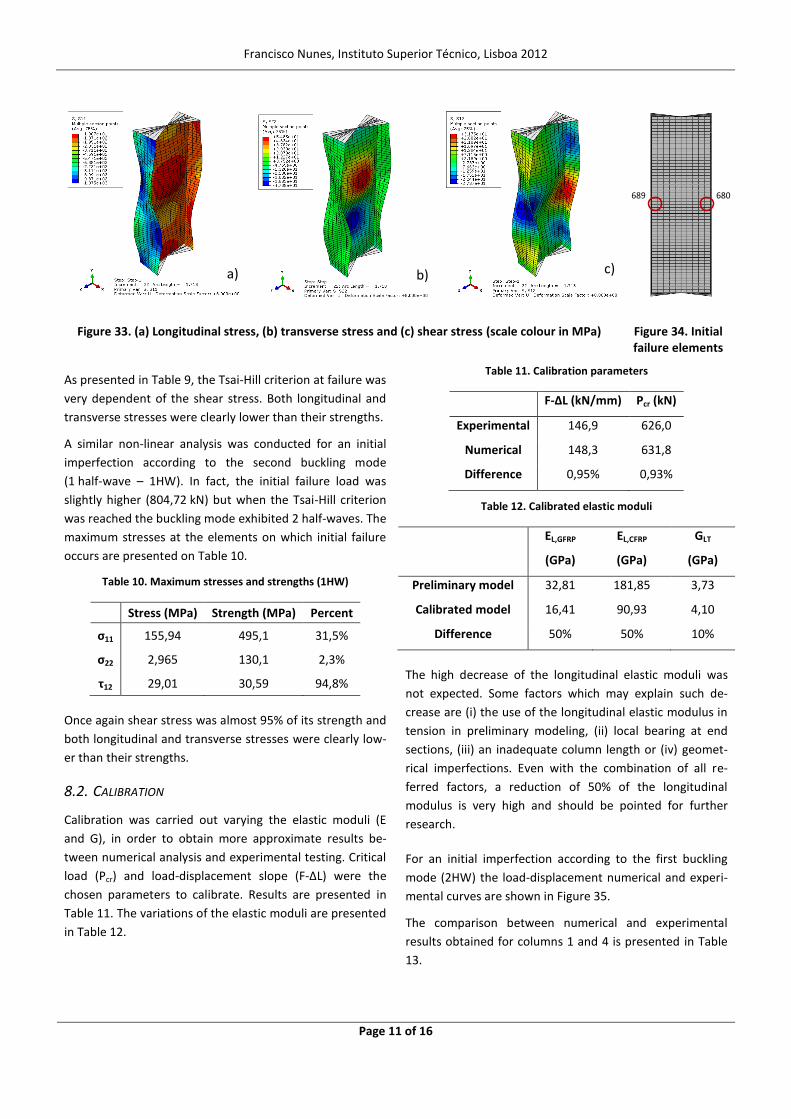
The stresses (σ11, σ22 and τ12) at initial failure are shown in
Figure 33. The elements on which initial failure occurs are
shown in Figure 34.
The maximum stresses at the elements on which initial
failure occurs are presented in Table 9.
Table 9. Maximum stresses and strengths (2HW)
Stress (MPa) Strength (MPa) Percent
σ11 154,1 495,1 31,1%
σ22 0,991 130,1 0,8%
τ12 29,12 30,59 95,2%
16,6
100,0
20
,0
19
0,0
0
200
400
600
800
1000
1200
0 1 2 3 4 5
F (k
N)
ΔL (mm)
Initial failure
a) b)
Francisco Nunes, Instituto Superior Técnico, Lisboa 2012
Page 11 of 16
Figure 33. (a) Longitudinal stress, (b) transverse stress and (c) shear stress (scale colour in MPa) Figure 34. Initial failure elements
As presented in Table 9, the Tsai-Hill criterion at failure was
very dependent of the shear stress. Both longitudinal and
transverse stresses were clearly lower than their strengths.
A similar non-linear analysis was conducted for an initial
imperfection according to the second buckling mode
(1 half-wave – 1HW). In fact, the initial failure load was
slightly higher (804,72 kN) but when the Tsai-Hill criterion
was reached the buckling mode exhibited 2 half-waves. The
maximum stresses at the elements on which initial failure
occurs are presented on Table 10.
Table 10. Maximum stresses and strengths (1HW)
Stress (MPa) Strength (MPa) Percent
σ11 155,94 495,1 31,5%
σ22 2,965 130,1 2,3%
τ12 29,01 30,59 94,8%
Once again shear stress was almost 95% of its strength and
both longitudinal and transverse stresses were clearly low-
er than their strengths.
8.2. CALIBRATION
Calibration was carried out varying the elastic moduli (E
and G), in order to obtain more approximate results be-
tween numerical analysis and experimental testing. Critical
load (Pcr) and load-displacement slope (F-ΔL) were the
chosen parameters to calibrate. Results are presented in
Table 11. The variations of the elastic moduli are presented
in Table 12.
Table 11. Calibration parameters
F-ΔL (kN/mm) Pcr (kN)
Experimental 146,9 626,0
Numerical 148,3 631,8
Difference 0,95% 0,93%
Table 12. Calibrated elastic moduli
EL,GFRP
(GPa)
EL,CFRP
(GPa)
GLT
(GPa)
Preliminary model 32,81 181,85 3,73
Calibrated model 16,41 90,93 4,10
Difference 50% 50% 10%
The high decrease of the longitudinal elastic moduli was
not expected. Some factors which may explain such de-
crease are (i) the use of the longitudinal elastic modulus in
tension in preliminary modeling, (ii) local bearing at end
sections, (iii) an inadequate column length or (iv) geomet-
rical imperfections. Even with the combination of all re-
ferred factors, a reduction of 50% of the longitudinal
modulus is very high and should be pointed for further
research.
For an initial imperfection according to the first buckling
mode (2HW) the load-displacement numerical and experi-
mental curves are shown in Figure 35.
The comparison between numerical and experimental
results obtained for columns 1 and 4 is presented in Table
13.
a) b) c)
680689

Francisco Nunes, Instituto Superior Técnico, Lisboa 2012
Page 12 of 16
Figure 35. Load against axial shortening (experimental versus numerical results)
Table 13. Comparison between calibrated model numerical and experimental results (2HW)
Pu; Pif (kN) ΔLmax; ΔLmax,num (mm)
Numerical 655,52 4,49
Column 1 644,35 5,07
Perc. Diff. 1,70% 12,92%
Column 4 666,54 4,24
Perc. Diff. 1,68% 5,57%
Both the initial failure load and the maximum numerical
axial shortening are in between columns 1 and 4 experi-
mental results with reduced percentage differences. The
web and flange lateral displacements comparison is pre-
sented on Figure 36.
Figure 36. Web and flanges lateral displacements (experimental versus numerical results)
Once again, at initial failure, the shear stress was very close
to its strength (98,3%) and both longitudinal and transverse
stresses were clearly lower than their strengths (25,5% and
0,4% respectively).
A similar analysis was conducted for an initial imperfection
according to the second buckling mode (1HW). The exper-
imental versus numerical results comparison is presented
on Table 14.
Table 14. Comparison between calibrated model numerical and experimental results (1HW)
Pu / Pif (kN) ΔLmax / ΔLmax,num (mm)
Numerical 695,33 4,74
Column 3 706,90 4,65
Perc. Diff. 1,66% 1,90%
The column deformed shape at initial failure is shown on
Figure 37. The finite elements on which the Tsai-Hill criteri-
on was first reached were the 528 and the 519 (Figure 38).
Figure 37. Deformed shape at initial failure
Figure 38. Initial failure ele-ments
Shear stress was once again determinant reaching 98,5% of
its strength at initial failure.
8.3. PARAMETRIC STUDIES
In this section, the influence of the profile shape and length
on the local buckling critical load is discussed. Parametric
studies were conducted varying the column length be-
tween 60 and 300 cm for a narrow flange (NF) shaped pro-
file (200x100x10 mm) and between 60 and 600 cm for a
wide flange (WF) shaped profile (200x200x10 mm). Results
are shown in Figures 39 and 40.
Figure 39. Local and global buckling curves (NF-profile)
0
100
200
300
400
500
600
700
800
0 1 2 3 4 5 6
F (k
N)
ΔL (mm)
Col1
Col4
Num
0
100
200
300
400
500
600
700
-6 -4 -2 0 2 4 6
F (k
N)
δ (mm)
d,f,col1
d,w,col4
d,f,col4
d,w,num
d,f,num
519528
0
100
200
300
400
500
600
700
0 100 200 300 400
F cr(k
N)
L (cm)
Local
Global

Francisco Nunes, Instituto Superior Técnico, Lisboa 2012
Page 13 of 16
Figure 40. Local and global buckling curves (WF-profile)
For the NF-profile the “critical” length was about 120 cm.
For the WF-profile the “critical” length was about 450 cm.
Local buckling critical load was higher on the NF-profile
(about 600 kN) than on the WF-profile (about 400 kN).
With the presented analysis and having the critical load as
the only criterion to choose a profile shape, the NF-profile
is recommended for columns with lengths up to 150 cm.
For superior lengths the WF-profile is recommended (Fig-
ure 41).
Figure 41. Comparison between NF-profile and WF-profile criti-cal loads
9. BEAM FE NUMERICAL MODELING
9.1. PRELIMINARY FE MODEL
The profile section and failure criterion used in 8.1 were
also used in this section. The beam dimensions as well as
the load points and the laterally braced nodes are shown in
Figure 42.
A linear buckling analysis was performed in order to obtain
the critical load (Pcr), the number of half-waves (nhw) and
the half-wave length (Lhw) of the first three buckling modes.
Results are presented in Table 15.
Table 15. Buckling analysis results
Buckling mode Pcr (kN) Lhw (cm) nhw
1st
124,87 27,4 8
2nd
125,31 20,2 9
3rd
129,48 20,3 10
It is not possible to compare numerical and experimental
results since (i) the upper flange CFRP sheet delaminated
and (ii) a lateral-torsional buckling mode occurred. Numeri-
cal and experimental results comparison will only be pre-
sented for the calibrated FE model.
A non-linear analysis was carried out in order to obtain
load-displacement data until initial failure occurs. For an
initial imperfection according to the first buckling mode
(8HW), an initial failure load of 115,89 kN and mid-span
transverse deflection of 117,8 mm were determined. The
load-displacement curve and the deformed shape at the
initial failure load are shown in Figures 43 and 44.
Figure 43. Load against displacement
Figure 42. Beam dimensions, load points and laterally braced points
0
100
200
300
400
500
600
0 200 400 600 800
F cr(k
N)
L (cm)
Local
Global
NF-profile
WF-profile
0
20
40
60
80
100
120
140
160
180
0 50 100 150 200
F (k
N)
ΔL (mm)
d,mid-span
Initial failure
20,0 120,0 56,0 48,0 56,0 120,0 20,0
132,0136,0132,0
Francisco Nunes, Instituto Superior Técnico, Lisboa 2012
Page 14 of 16
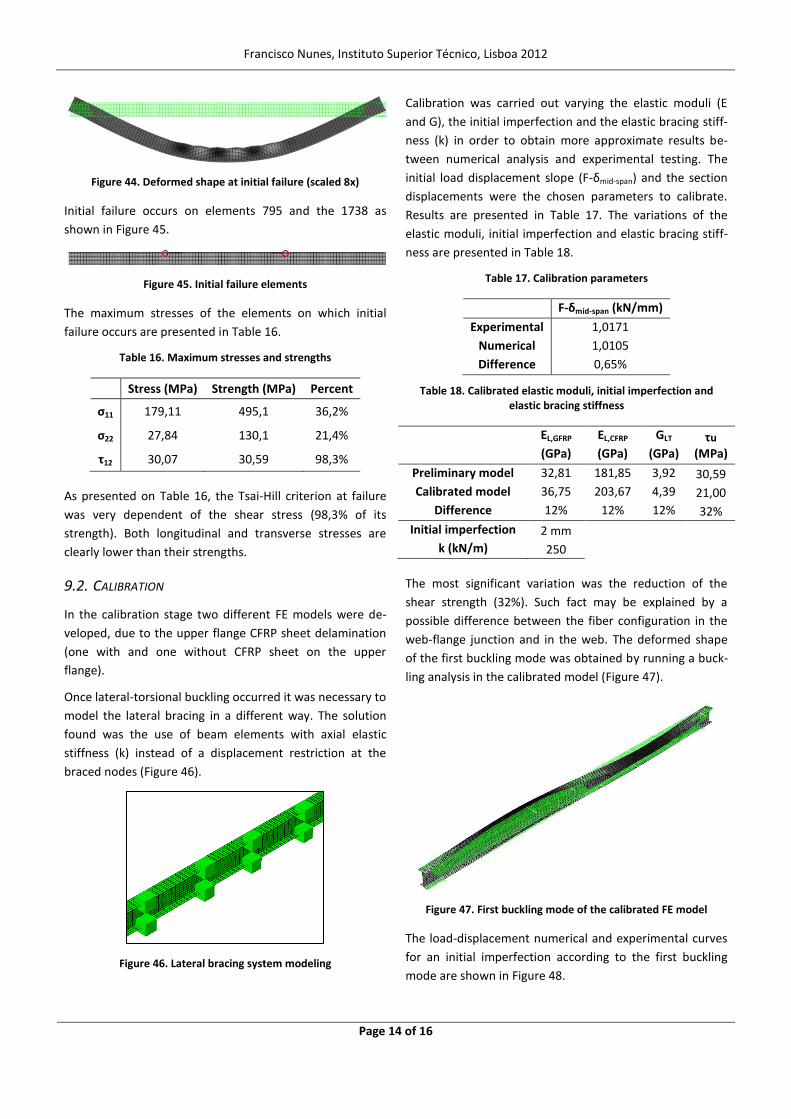
Figure 44. Deformed shape at initial failure (scaled 8x)
Initial failure occurs on elements 795 and the 1738 as
shown in Figure 45.
Figure 45. Initial failure elements
The maximum stresses of the elements on which initial
failure occurs are presented in Table 16.
Table 16. Maximum stresses and strengths
Stress (MPa) Strength (MPa) Percent
σ11 179,11 495,1 36,2%
σ22 27,84 130,1 21,4%
τ12 30,07 30,59 98,3%
As presented on Table 16, the Tsai-Hill criterion at failure
was very dependent of the shear stress (98,3% of its
strength). Both longitudinal and transverse stresses are
clearly lower than their strengths.
9.2. CALIBRATION
In the calibration stage two different FE models were de-
veloped, due to the upper flange CFRP sheet delamination
(one with and one without CFRP sheet on the upper
flange).
Once lateral-torsional buckling occurred it was necessary to
model the lateral bracing in a different way. The solution
found was the use of beam elements with axial elastic
stiffness (k) instead of a displacement restriction at the
braced nodes (Figure 46).
Figure 46. Lateral bracing system modeling
Calibration was carried out varying the elastic moduli (E
and G), the initial imperfection and the elastic bracing stiff-
ness (k) in order to obtain more approximate results be-
tween numerical analysis and experimental testing. The
initial load displacement slope (F-δmid-span) and the section
displacements were the chosen parameters to calibrate.
Results are presented in Table 17. The variations of the
elastic moduli, initial imperfection and elastic bracing stiff-
ness are presented in Table 18.
Table 17. Calibration parameters
F-δmid-span (kN/mm)
Experimental 1,0171
Numerical 1,0105
Difference 0,65%
Table 18. Calibrated elastic moduli, initial imperfection and elastic bracing stiffness
EL,GFRP
(GPa)
EL,CFRP
(GPa)
GLT
(GPa) τu
(MPa)
Preliminary model 32,81 181,85 3,92 30,59
Calibrated model 36,75 203,67 4,39 21,00
Difference 12% 12% 12% 32%
Initial imperfection 2 mm
k (kN/m) 250
The most significant variation was the reduction of the
shear strength (32%). Such fact may be explained by a
possible difference between the fiber configuration in the
web-flange junction and in the web. The deformed shape
of the first buckling mode was obtained by running a buck-
ling analysis in the calibrated model (Figure 47).
Figure 47. First buckling mode of the calibrated FE model
The load-displacement numerical and experimental curves
for an initial imperfection according to the first buckling
mode are shown in Figure 48.

Francisco Nunes, Instituto Superior Técnico, Lisboa 2012
Page 15 of 16
Figure 48. Load against mid-span transverse deflection (experi-mental versus numerical)
The comparison between numerical and experimental
results is presented in Table 19.
Table 19. Comparison between calibrated model numerical and experimental results
Pu / Pif
(kN)
δmid-span,max / δmidspan,max,num
(mm)
Numerical 52,01 60,45
Ensaio 50,29 56,81
Perc. Diff. 3,30% 6,02%
Both the initial failure load and the maximum transverse
deflection have had reduced percentage differences. The
web and flange displacements comparison is presented in
Figure 49.
Figure 49. Web and flanges displacements (experimental versus numerical results)
The finite elements on which the Tsai-Hill criterion was first
reached were 1186 and the 1324. They are located near
the inflection point of the beam’s deformed configuration
(Figure 50).
Figure 50. Initial elements failure
Shear stress was once again determinant reaching 98,2% of
its strength.
9.3. SHAPE INFLUENCE
In this section, the influence of the profile shape on both
the local buckling critical load and the initial failure load
was studied.
Delamination occurred in the material characterization
stage for a strain of 0,62% and in the full-scale beam test
for a strain of 0,154%.
Since delamination was not expected in the full-scale beam
test, four different models were developed, two for a NF-
profile (with and without considering delamination) and
two others for a WF-profile (also with and without consid-
ering delamination). Results of this parametric study are
presented in Table 20.
Table 20. Parametric study results
Profile Delaminated Without delamination
Pcr (kN) Pif (kN) Pcr (kN) Pif (kN)
NF 104,92 58,00 138,59 58,72
WF 51,94 53,64 78,24 62,63
As expected, critical buckling loads were considerably low-
er for the WF-profile (between 49% and 57% of the NF-
profile critical load) due to the higher flange slenderness
ratio (width to thickness).
The initial failure loads have had a low variation (6,3%) due
to the strong dependency of the shear strength (which is
the same in all models).
10. FINDINGS AND CONCLUSIONS
In this dissertation the structural behavior of a hybrid pul-
truded profile was studied. For this purpose experimental
tests were carried out and FE models were developed. The
following main conclusions are drawn from this study:
1. The determination of strengths and elastic moduli took
place in the mechanical characterization stage. All values
were in agreement with the values provided by the biblio-
graphic references.
0
10
20
30
40
50
60
0 10 20 30 40 50 60 70
F (k
N)
δmid-span (mm)
Num
Exp
0
10
20
30
40
50
60
-6 -4 -2 0 2 4 6 8
F (k
N)
δw (mm)
Exp,w
Exp,f
Num,w
Num,f
Francisco Nunes, Instituto Superior Técnico, Lisboa 2012
Page 16 of 16
2. For serviceability limit states, both structural elements
(columns and beam) may be analyzed with simple models
using the uniaxial bar theory and the Timoshenko beam
theory.
3. For the short-column testing, equation (7) gave a better
approximation to the experimental local buckling critical
stress, with an average percent error of 8,9%. This equa-
tion developed by Kòllar considers the elastic restriction of
the web-flange junction.
4. The four-point bending beam test may be repeated with
an adequate lateral bracing to avoid lateral-torsional buck-
ling.
5. In the short-column numerical calibration, the high de-
crease of the elastic moduli may be pointed for further
research.
6. The performed parametric studies confirmed the higher
sensitivity to local buckling of WF-profiles.
7. The interaction between the CFRP sheets and the GFRP
reinforcement may be highlighted for further investigation
and other flange hybridization patterns may be studied.
8. Global buckling as well as long-term deflection may be
subjects of further research.
REFERENCES
[1] P.M.V. Teixeira, Análise e Dimensionamento de Perfis Pul-
trudidos de GFRP, MsC Thesis in Civil Engineering, Instituto
Superior Técnico, UTL, 2010.
[2] J.R. Correia, Glass fibre reinforced polymer (GFRP) pultruded
profiles. structural behaviour of GFRP-concrete hybrid beams,
MSc Dissertation in Construction, Instituto Superior Técnico,
UTL, 2004 (in Portuguese).
[3] L.C. Bank, Composites for construction: Structural design with
FRP materials. Wiley, Hoboken, N.J, 2006.
[4] CEN, EN ISO 14125 Fibre-reinforced plastic composites –
Determination of flexural properties, Brussels, 1998.
[5] ASTM D2344/D 2344M-00 Standard Test for Short-Beam
Strength of polymer Matrix Composite Materials and their
Laminates, West Conshohocken, PA, 2006.
[6] ASTM D 695-02 Standard Test Method foir Compressive
Properties of Ridid Plastics, West Conshohocken, PA, 2006.
[7] CEN, ISO 527-4 Determination of tensile properties – Part 4:
Test conditions for isotropic and orthotropic fibre-reinforced
plastic composites, Brussels, 1997.
[8] CEN, ISO 527-5 Determination of tensile properties – Part 5:
Test conditions for unidirectional fibre-reinforced plastic
composites, Brussels, 1997.
[9] ASCE, Structural Plastics Design Manual, No. 63, 2002.
[10] J.L. Clarke, Eurocomp Design Code and Handbook, E&FN
Spon, 1996.
[11] L.C. Bank, M. Nadipelli e T.R. Gentry, Local Buckling and
Failure of Pultruded fiber-Reinforced Plascti Beams, Journal
of Engineering Materials and Technology, Vol. 116, No. 2, pp.
233-238, 1994.
[12] J.T. Mottram, Determination of critical load for flange buck-
ling in concentrically loaded pultruded columns, Composites:
Part B, Vol. 35, No. 1, pp. 33-47, 2004.
[13] G.J. Turvey e Y. Zhang, A computational and experimental
analysis of the buckling, postbuckling and initial failure of
pultruded GRP columns, Computers and Structures, Vol. 84,
No. 22-23, pp. 1527-1537, 2006.
[14] L.P. Kollár, Local buckling of fiber reinforced plastic composite
structural members with open and closed cross sections,
Journal of Composites for Construction, Vol.129, No.11, pp.
1503-1513, 2003.
[15] Simulia, Abaqus Standard: User’s Manual, Versão 6.5, 2004.