structural change and demand for skills in … · structural change and demand for skills in the...
TRANSCRIPT

STRUCTURAL CHANGE AND DEMAND
FOR SKILLS IN THE AUSTRALIAN
ECONOMY
A thesis submitted for the degree of Doctor of Philosophy
The University of Canberra
by
Ross Kelly
JUNE 2010

i
This thesis is the copyright © of Ross Kelly 2010.
ii
ABSTRACT
This thesis examines the effect that structural change and, in particular, information and
communication technologies (ICT) have had on skill demand, with the focus being on the
structure of skills in the economy and the way skills are defined and measured. A novel
approach to skill measurement is developed and used to determine the average skill level for
four skill dimensions: cognitive, education, interactive and motor skills. Shift-share analysis
covering between-industry and within-industry changes is undertaken for the period 1991 to
2006 using Census data. This is complemented by regression analysis to examine the
determinants of within-industry skill change. The thesis examines both the causes of change
and the distribution of change. That is, how skill changes have been distributed in terms of
industry, occupation, location and gender.
The main finding supports the central hypothesis of this thesis. That is, that there have been
significant changes to the composition of skills in the economy and that these changes were
substantially, but not solely, a result of technological change. Regression analyses were
undertaken for the various skill dimensions – cognitive, education, interactive and motor –
and provided further support to a vast body of international literature that ICT have been a
critical driver of skill change.

iii
Certificate of Authorship of Thesis
Except where clearly acknowledged in footnotes, quotations and the bibliography, I certify that I am
the sole author of the thesis submitted today entitled –
STRUCTURAL CHANGE AND DEMAND FOR SKILLS IN THE AUSTRALIAN ECONOMY
I further certify that to the best of my knowledge the thesis contains no material previously published
or written by another person except where due reference is made in the text of the thesis.
The material in the thesis has not been the basis of an award of any other degree or diploma except
where due reference is made in the text of the thesis.
The thesis complies with University requirements for a thesis as set out in Gold Book
Part 7: Examination of Higher Degree by Research Theses Policy, Schedule Two (S2).
Signature of Candidate
..........................................................................
Signature of chair of the supervisory panel
Date: ……………………………..

iv
ACKNOWLEDGEMENTS
I would like to express my gratitude to my supervisor, Professor Phil Lewis, for his excellent
supervision, encouragement, generosity and friendship. I am also indebted to Carrie, Hannah,
Jesse, Ruby and my parents for their enduring support, understanding and patience.
This thesis has benefited from professional editorial assistance for ‘Completeness and
Consistency’ adopted from the Australian Standards for Editing Practice (ASEP) in
accordance with the University Research Committee of the University of Canberra. I would
like to thank Lulu Turner from the University of Canberra for undertaking this task.

v
LIST OF ACRONYMS AND ABBREVIATIONS
ABS Australian Bureau of Statistics
ACCC Australian Consumer and Competition Commission
ACT Australian Capital Territory
ANZSCO Australian and New Zealand Standard Classification of Occupations
ANZSIC Australian and New Zealand Standard Industrial Classification
AQF Australian Qualifications Framework
ASCO Australian Standard Classification of Occupations
ASIC Australian Standard Industrial Classification
ATM Automatic Teller Machines
ATS Australian Traineeship System
B2B Business-to-Business
BIE Bounded Influence Estimates
BLMR Bureau of Labour Market Research
CBA Commonwealth Bank of Australia
CCLO Classification and Classified List of Occupations
CGT Capital Gains Tax
CPS Current Population Surveys
CR Concentration Ratio
DBCDE Department of Broadband, Communications and the Digital Economy
DCITA Department of Communications, Information Technology and the Arts
DIST Department of Industry, Science and Technology
DIW Deutsches Institut für Wirtschaftsforschung (German Institute for
Economic Research)
DOT Dictionary of Occupational Titles
vi
DVD Digital Video Disk
EDI Electronic Data Interchange Devices
EFTPOS Electronic Funds Transfer Point of Sale
EU European Union
FaHCSIA Department of Families, Housing, Community Services and Indigenous
Affairs
FWA Fair Work Australia
GDP Gross Domestic Product
GNP Gross National Product
GPS Global Positioning Systems
GSOEP German Socio-Economic Panel
GST Goods and Services Tax
GVA Gross Value Added
HECS Higher Education Contribution Scheme
HILDA Household, Income and Labour Dynamics in Australia
Kbs Kilobits per second
ICT Information and Communication Technology
IT Information Technology
ILO International Labor Organisation
IP Internet Protocol
IRC Industrial Relations Commission
ISCO International Standard Classification of Occupations
LTU Long-Term Unemployment
MIAESR Melbourne Institute of Applied Economic and Social Research
MIP-S Mannheim Innovation Panel in the Service Sector (survey)

vii
Mbs Megabits per second
NCVER National Centre for Vocational Education Research
NOIE National Office of the Information Economy
NSW New South Wales
NT Northern Territory
OBEC Oxford Business & Economics Conference
OECD Organisation for Economic Co-operation and Development
PC Productivity Commission
QLD Queensland
RBA Reserve Bank of Australia
R&D Research and Development
RULC Real Unit Labour Costs
SA South Australia
SBTC Skill-Biased Technological Change
SPIRT Strategic Partnerships with Industry- Research and Training Scheme
ST Stolper-Samuelson Theorem
TAFE Technical and Further Education
TAS Tasmania
TCFL Textile, Clothing, Footwear and Leather
TFP Total Factor Productivity
UK United Kingdom
US United States (of America)
USDOL United States Department of Labor
USO Universal Service Obligation
VET Vocational Education and Training

viii
VoIP Voice over Internet Protocol
WA Western Australia
WRA Workplace Relations Act (1996)
ix
CONTENTS
Abstract ii
Certificate of Authorship of Thesis iii
Acknowledgements iv
List of Acronyms and Abbreviations v
List of Tables xiii
List of Figures xv
1 INTRODUCTION 1
1.1 Change in the Australian Labour Market 2
1.2 Skills in the Australian Economy 3
1.3 Influence of ICT on Skill Change in Australia 4
1.4 Overview of Thesis 4
2 INFORMATION AND COMMUNICATION TECHNOLOGIES (ICT) AND THE
ECONOMY 7
2.1 Introduction 7
2.2 Growth of the Internet 8
2.2.1 Increase in Internet speeds 9
2.3 Household Access to the Internet 10
2.3.1 Current access levels in Australia 14 2.3.2 International comparison of broadband access 21
2.4 The Economics of eCommerce 22
2.4.1 eCommerce defined 22 2.4.2 Consumer behaviour 24 2.4.3 Contestability of markets 25 2.4.4 Market segmentation and consumer surplus 26 2.4.5 Transaction costs 27 2.4.6 Business-to-business (B2B) transactions 31
2.5 Growth of eCommerce 32
2.5.1 Growth of eCommerce in Australia 34
2.6 Summary 37
3 EMPLOYERS’ EARLY EXPECTATIONS OF IMPACTS FROM ICT 39
3.1 Survey of Firms 39
3.2 Potential Changes from ICT and eCommerce 40
3.3 Changing Skills Composition and Training Needs of the Workforce 41
3.4 Information Technology Staff, Quality and Supply 43
3.5 Impact of eCommerce on the Organisation 43
3.6 Does eCommerce Pose a Threat? 46
3.6.1 eCommerce poses no threat 46 3.6.2 Poses a threat to core business 46 3.6.3 eCommerce is a threat if not adopted 47
3.7 Summary 48
4 BUSINESS USE OF TECHNOLOGY 50
4.1 Overview 50
x
4.2 Computers in the Workplace, Network Access and Internet Usage 51
4.3 Application of the Internet by Businesses 53
4.4 Business Investment in ICT 57
4.5 ICT Capital Stock 58
4.6 Examples of Investment in ICT by Firms 62
4.7 Summary 65
5 THE AUSTRALIAN LABOUR MARKET 66
5.1 Overview 66
5.2 Microeconomic Reform 68
5.2.1 Impact of microeconomic reform on the labour market 70
5.3 Industrial Relations 71
5.3.1 Unions, industrial relations and wage setting 73 5.3.2 Labour market flexibility, productivity & structural adjustment 74
5.4 Productivity 76
5.4.1 Productivity growth 77 5.4.2 Real Unit Labour Cost 79
5.5 Education & Training 81
5.5.1 Human capital & the economy 81 5.5.2 High school retention 81 5.5.3 Vocational education and training (VET) 83 5.5.4 Apprentices 84 5.5.5 Higher education 87
5.6 Labour Force Participation, Employment and Unemployment 88
5.6.1 Labour force participation 88 5.6.2 Full-time and part-time employment 89 5.6.3 Disadvantaged groups 91 5.6.4 Long-term unemployment, mature-age unemployment 94
5.7 Employment Growth in the Australian Economy 95
5.7.1 Overview 95 5.7.2 Employment by industry 96 5.7.3 Employment by occupation 101
5.8 Summary 104
6 SKILL BIASED TECHNOLOGICAL CHANGE 106
6.1 Overview 106
6.2 Skill Biased Technological Change (SBTC) Hypothesis 108
6.3 Evidence of SBTC 113
6.3.1 Firm level studies 114 6.3.2 Industry cross-section approaches 121 6.3.3 Cross country studies 126 6.3.4 Australian Studies 131
6.4 Critique of SBTC 141
6.4.1 Critique of ICT linkages to skill change 141 6.4.2 Organisational and institutional change 143 6.4.3 Trade hypothesis and the structure of trade 146
6.5 Summary 150
7 MEASUREMENT OF TECHNOLOGY AND SKILLS 155
7.1 Measurement of Technology 155
7.2 Measurement of Skills 156
7.2.1 Defining skill 156
xi
7.2.2 Definitions and measures used in SBTC studies 157
7.3 US Department of Labor’s Dictionary of Occupational Titles (DOT) 162
7.4 Applying the DOT skill ratings to the ASCO 164
7.4.1 Australian Standard Classification of Occupations 164 7.4.2 Rating skills 166
7.5 Skill change equations 169
7.5.1 Interpretation of skill change measures 172
7.6 Summary 173
8 CHANGES IN SKILL DEMAND 175
8.1 Occupational Skill Rankings 175
8.1.1 Occupational skill shares 178
8.2 Industry Skill Structure 182
8.3 Skill Change 185
8.3.1 Full-time and part-time employment status 185
8.4 Shift-Share Analysis 188
8.4.1 Changes over time 188 8.4.2 Within- and between-industry effects 189 8.4.3 Industry structure of skill change 191
8.5 Distribution of skill change 195
8.5.1 Region 195 8.5.2 Gender 198
8.6 Summary of findings 201
8.6.1 Summary of industry changes 201
9 DETERMINANTS OF SKILL CHANGE IN AUSTRALIA 204
9.1 Model of Skill Change 204
9.2 Variables 205
9.2.1 Dependent variables 205 9.2.2 Independent variables 206
9.3 Results 209
9.4 Summary 216
10 CONCLUSION 219
10.1 Main findings 220
10.1.1 Diffusion of ICT 220 10.1.2 The Australian labour market 222 10.1.3 Previous research into Australian skill change 223 10.1.4 Skill definition and measurement 223 10.1.5 Shift-share analysis 224 10.1.6 Determinants of skill change 225
10.2 Implications 225
10.2.1 Further ICT development – how much left to go? 225 10.2.2 Groups at risk 226 10.2.3 Gender earnings differentials 227
10.3 Policy Response 228
10.3.1 Labour market flexibility 228 10.3.2 Training market responsiveness 229
10.4 Future Research 231
10.4.1 Investment in education and returns to skill 231 10.4.2 Gender 231 10.4.3 Jobs and regions at risk 232

xii
10.5 Conclusion 232
11 REFERENCES 233
12 APPENDIX A 252
13 APPENDIX B 255
14 APPENDIX C 259
xiii
LIST OF TABLES
Table 2-1 World Internet Usage and Population by Region, June 2009 ............................................................................. 8
Table 2-2 Internet Access Statistics for Australia, 1998 to 2007-08 ................................................................................ 15
Table 2-3 Computer and Internet Access by Household Equivalised Income, Australia, 2007-08 .................................. 16
Table 2-4 Impact of Income on Computer and Internet Access Rates, Australia, 2007-08 .............................................. 17
Table 2-5 Annual Equivalised Income, Australia, 2007-08, ($A, current prices) ............................................................. 20
Table 2-6 Income Elasticity of Demand for Selected Household ICT, Australia, 2007-08 .............................................. 21
Table 2-7 Information Product Versioning Enabled by the Internet ................................................................................. 27
Table 2-8 Customers Accessing Banking Services by Medium, Canada, 1999 to 2006, Per Cent ................................... 33
Table 2-9 Share of Banking Transactions by Access Medium, Canada, 1999 to 2006, Per Cent ..................................... 34
Table 2-10 Number of Banks and Credit Unions Offering On-Line Services .................................................................... 34
Table 4-1 Business Use of Selected Technologies in Australia, 1994-2001, Per Cent ..................................................... 52
Table 4-2 Business Use of PCs and the Internet, by Employment Size, 1998 .................................................................. 54
Table 4-3 Business Use of Selected Technologies, by Employment Size, 2007–08 ........................................................ 54
Table 4-4 Selected Internet Activities, by Employment Size, 2007–08, Per Cent ............................................................ 56
Table 4-5 Extent of IT Use in Business Processes, by Size, Australia, 2005-6, Per Cent of Businesses .......................... 57
Table 4-6 Change in Net Information Technology Capital Stock, Australia, 1990 to 2008, ($m) .................................... 59
Table 4-7 Growth of Information Technology Net Capital Stock, Selected Items by Industry, Per Cent ........................ 60
Table 5-1 Annual Growth of Gross Value Added (GVA) Per Hour Worked, Australia, 1996 to 2006, Per Cent ............ 79
Table 5-2 Graduate Completions in VET, 2000 to 2009, Australia, Persons, 000s .......................................................... 84
Table 5-3 Percentage of Working-Age Population with Bachelor Degree or Above, 1991 to 2006, Australia ................ 88
Table 5-4 Employment Growth by Industry, Australia, 1991-2006 ................................................................................. 97
Table 5-5 Employment Growth by Occupation, Australia, 1996-2006 .......................................................................... 101
Table 6-1 Harrod, Hicks and Solow Technological Change ........................................................................................... 109
Table 6-2 ASCO Second Edition Major Groups and Skill Level ................................................................................... 135
Table 7-1 Four-Way Skill Grouping by Occupation ...................................................................................................... 159
Table 7-2 Scale of Complexity for Skill Categories ....................................................................................................... 164
Table 7-3 ASCO 2nd Edition Structure ........................................................................................................................... 165
Table 7-4 ASCO Task Descriptor - Medical Laboratory Technician ............................................................................. 169
Table 8-1 Average Skill Rating by Skill Dimension and Occupation, 2006 ................................................................... 176
Table 8-2 Correlation Between Skill Dimensions at ASCO Major Group Level, 2006 ................................................. 177
Table 8-3 Skill Rating by Dimension and Employment Status, Australia, 1991 to 2006 ............................................... 178
Table 8-4 Change in Occupation Cognitive Skill Shares, 1991-2006, Australia, Per Cent ............................................ 180
Table 8-5 Mean Skill Levels by ANZSIC Industry Division (1 Digit level), 2006 ........................................................ 183
Table 8-6 Change in Mean Skill Levels, 1991 to 2006, Per Cent ................................................................................... 185
Table 8-7 Contributions to Mean Skill Levels by Census Sub-Period, Per Cent ............................................................ 189
Table 8-8 Between and Within-Industry Effects, 1991 to 2006, Change in Mean Skill Level ....................................... 189
Table 8-9 Between and Within-Industry Effects, 1991 to 2006, Percentage Change in Mean Skill Level ..................... 190
Table 8-10 Mean Skill Level by Region and Skill Dimension, 2006 ............................................................................... 196
Table 8-11 Mean Skill Level by State/Territory and Skill Dimension, 2006 ................................................................... 197
Table 8-12 Change in the Mean Skill Level by State/Territory and Skill Dimension, 1996 to 2006, Per Cent ................ 197
xiv
Table 8-13 Mean Skill by Dimension and Gender, Australia, 2006 ................................................................................. 198
Table 8-14 Change in Mean Skill Levels by Dimension and Gender, Australia, 1996 to 2006, Per Cent ........................ 199
Table 8-15 Occupational Growth by Gender, Australia, 1996 to 2006, Per Cent ............................................................. 200
Table 9-1 Determinants of Skill Change, Australia, 1991 – 2001 .................................................................................. 212
Table 9-2 Standardised Coefficients for Skill Change Models ....................................................................................... 213
Table A- 1 Scale of Complexity and Coding Frame for Cognitive Skills ........................................................................ 252
Table A- 2 Scale of Complexity and Coding Frame For Interactive Skills ...................................................................... 253
Table A- 3 Scale of Complexity and Coding Frame For Motor Skills ............................................................................. 254
Table B- 1 Average Skill Rating by Skill Dimension and Occupation, 1991 to 2006 ...................................................... 255
Table B- 2 Change in Occupation Education Skill Shares, 1991 -2006, Australia ........................................................... 256
Table B- 3 Change in Occupation Interactive Skill Shares, 1991 -2006, Australia .......................................................... 257
Table B- 4 Change in Occupation Motor Skill Shares, 1991 -2006, Australia ................................................................. 258
Table C- 1 Descriptive Statistics for Regression Variables .............................................................................................. 259
Table C- 2 Ramsey RESET Test ...................................................................................................................................... 260
Table C- 3 Breusch-Pagan / Cook-Weisberg Test ............................................................................................................ 261
Table C- 4 Cameron and Trivedi's decomposition of IM-Test ......................................................................................... 262
Table C- 5 DFFITS Weights Used for Bounded Influence Estimates .............................................................................. 263
Table C- 6 IT Professional Occupations for ITPROF Variable ........................................................................................ 265
xv
LIST OF FIGURES
Figure 2-1 Distribution of Equivalised Disposable Household Income, 2007-08 .............................................................. 18
Figure 2-2 Internet Income Earned by Businesses, Australia, 2000-01 to 2005-06, $Bn (Current Dollars) ..................... 36
Figure 4-1 Orders for Goods and Services via the Internet ............................................................................................... 55
Figure 4-2 Change in Net Information Technology Capital Stock, Australia, 1990 to 2008 ($m) .................................... 58
Figure 5-1 Trade Union Membership Share of Total Labour Force, 1990 to 2008, Australia, Per Cent ........................... 72
Figure 5-2 Working Days Lost Due to Industrial Disputes (Per 1000 Employees), 1970–2000 ........................................ 76
Figure 5-3 Multi-Factor Productivity Index, Australia, 1985-2009, (Jun-08=100) ............................................................ 77
Figure 5-4 Real Unit Labour Costs Index, Australia, 1985-2009, (Mar-07=100) ............................................................. 80
Figure 5-5 Apparent Retention Rates, 1990 to 1997, Australia, Per Cent .......................................................................... 82
Figure 5-6 Apparent Retention Rates, 1993 to 2008, Australia, Per Cent .......................................................................... 83
Figure 5-7 Metal and Vehicle Apprentices in Training, 1967–2006, Australia ................................................................. 85
Figure 5-8 Electrical Apprentices in Training, 1967 to 2006, Australia ............................................................................ 85
Figure 5-9 Building Apprentices in Training, 1967 to 2006, Australia.............................................................................. 86
Figure 5-10 Printing Apprentices in Training, 1967 to 2006, Australia ............................................................................... 86
Figure 5-11 Labour Force Participation Rates by Gender, Australia, 1990-2009, Per Cent ............................................... 89
Figure 5-12 Part-Time Share of Total Employment by Gender, 15-19 Year Olds, 1978-2009, Per Cent ........................... 90
Figure 5-13 Unemployment Rate, 15 to 19-Year Olds, Australia, 1990 to 2009, Per Cent ................................................ 93
Figure 5-14 LTU to Total Unemployment Ratio, Australia, 1986-2009, Per Cent ............................................................. 95
Figure 5-15 Employment by ANZSIC 1 Digit Industry, 1984-2008, Australia, 000s, Quarterly Observations ................... 99
Figure 5-16 Employment by Occupation, 1996-2006, 000s, Quarterly Observations ....................................................... 102
Figure 6-1 Technical Change in Response to Changes in Factor Prices .......................................................................... 111
Figure 6-2 Harrod Neutral Technological Change and SBTC ......................................................................................... 112
Figure 8-1 Source of Change by Industry, Cognitive Skills, 2001-2006 ......................................................................... 193
Figure 8-2 Source of Change by Industry, Education Skills, 2001-2006 ......................................................................... 193
Figure 8-3 Source of Change by Industry, Interactive Skills, 2001-2006 ........................................................................ 194
Figure 8-4 Source of Change by Industry, Motor Skills, 2001-2006 ............................................................................... 194
1
1 INTRODUCTION
The primary objective of this thesis is to gauge the extent to which the structural and
technological change that has occurred in Australia since 1991, in particular, the widespread
integration of information and communication technologies (ICT), has influenced the demand
for skills.
Structural adjustment, particularly when brought about by changes in technology, will affect
people differently, depending on the market sector they are in, their location, skills and age.
Indeed, all sections of society are affected in some way by innovation and, in the vast
majority of cases, it is for the better. In some instances, though, people will be not be able to
access the benefits brought about by new innovations, or they will be disadvantaged in some
way by new developments and economic reforms. People displaced by economic change
draw cold comfort from the fact that productivity improvements are good for the economy.
In Australia there are institutional constraints and other features, such as minimum wages or
geographic isolation, that prevent labour markets from clearing rapidly and smoothly in the
face of structural adjustments. This brings into question whether there is a role for labour
market policies and, if so, what form these should take.
One of the most notable technological developments over the last three decades has been the
rapid advancement in computerisation and its role in production. In the last two decades it has
also become highly visible in the workplace and the home as the price of personal computers
has fallen dramatically (in terms of computing power) and the sophistication and usability of
computers has improved. The spread and improvement of computers has facilitated (and in
large part been motivated by) rapid developments in information, graphical and statistical

2
applications. This has profoundly altered the social and workplace environment. It is difficult
to imagine how people could successfully integrate into the labour market without some
exposure to the tools of the information age – computers and the Internet – other than for low-
skill, manual entry-level jobs.
In the workplace the computer has extended its reach to the point where it would be unusual
to enter any workplace where the computer was not a vital part of the production process and
some, or even most, of the workforce would be using one. This is particularly the case for the
service sector of the economy, which has also grown to become the dominant sector of the
economy, accounting for around 70 per cent of gross domestic product (GDP) in 2010.
1.1 Change in the Australian Labour Market
The Australian labour market has experienced dramatic changes since the early 1980s. Some
of the changes have been institutional, or systemic, in nature, such as the Prices and Incomes
Accord between the union movement and the Labor Government of the Hawke-Keating era
spanning 1983 to 1992 (Norris, Kelly and Giles 2005; Lewis and Spiers 1990). During this
time an accord between the union movement and the government resulted in an extended
period of wage restraint that resulted in a large decrease in the real wages received by workers
across Australia (Lewis and Spiers 1990). The impact on employment, not surprisingly, was
large, with unemployment falling from a recessionary high of 10.3 per cent to 5.7 per cent
between 1983 and 1989 (ABS 2009a).
Other major changes to impact on the labour market include the continued push to liberalise
the Australian economy. Examples include tariff reductions in the manufacturing sector,
privatisation of the Commonwealth Bank and Commonwealth Serum Laboratories, foreign
banks being issued licences to operate in Australia and the floating of the Australian currency.

3
Other major reforms include the privatisation of utilities owned and run by State and Territory
governments, incentivised through Commonwealth Grant payments to the States for meeting
agreed milestones (Borland 2001). The Industrial Relations Commission (IRC) in 1991 also
promoted employers and unions to bargain over pay and conditions at the enterprise level and
this was later reinforced under the Industrial Relations Reform Act 1993 (Lansbury, Wailes
and Yazbeck 2007).
As Australia changed governments, from Labor to the Liberal-National Party Coalition in
1996, there was a continuation of the reform agenda, with the national telecommunications
carrier, Telstra, being gradually privatised. The Reserve Bank of Australia (RBA) was also
formally given independence, enabling it to set interest rates without direct interference from
the government (Lewis et al. 2006). The Coalition Government also introduced a new labour
relations framework that reduced the power of centralised wage fixing (Lansbury, Wailes and
Yazbeck 2007).
Taken together, these changes have contributed to dramatic improvements in total factor
productivity for the economy (Productivity Commission 2006). While this has, in large part,
been facilitated through increased labour market flexibility, the broader microeconomic
reforms have also imposed the need for greater flexibility in the labour market.
1.2 Skills in the Australian Economy
The typical notion of skills is embedded in occupational composition and qualification levels.
One of the more dramatic changes for the Australian labour market has been the massive
increase in the number of students completing secondary schooling and progressing to
university. This was another plank of the Hawke-Keating Labor Government and numbers
peaked with the recession in 1990-1992. As Lewis and Koshy (1999) point out, some of the
4
increase was actually due to hidden unemployment among youths.
The continued decline of manufacturing has brought with it a decline in the various blue-
collar trades that have traditionally been the mainstay of the industry. The substantial rise in
the financial and business services sector, likewise, has seen the number of business
professionals increase dramatically.
1.3 Influence of ICT on Skill Change in Australia
A feature of advanced economies around the world, including Australia, has been the
dramatic rise in the use of ICT. Studies for Germany, the United States (US), United
Kingdom (UK), the European Union (EU) and Australia have shown some connection
between skill demand and ICT (see Autor, Levy and Murnane 2003; Berman, Bound and
Machin 1998; Bresnahan, Brynjolfsson and Hitt 2002; Corvers and Marikull 2007; Pappas
1998; Spitz 2003; Howell and Wolff 1990; Wolff 1995). The timing of the studies for
Australia and the skill measurement methods have precluded much of the development and
change that has occurred since the development of the Internet and have spanned periods that
are heavily nuanced by the deep recession of the 1990s.
1.4 Overview of Thesis
In this thesis the effect that information and communication technologies have had on skill
demand are examined, with the focus being on the structure of skills in the economy and the
way skills are defined and measured. The analysis draws on changes observed in the
occupational and industry structure since 1991. Although the focus of the thesis is on the
scope and nature of changes that have taken place and their likely causes, it is also concerned
with the burden of change; that is, in broad terms, the distribution across various dimensions
of society and the economy, such as location, occupation, income, gender and industry is

5
examined.
The remainder of the thesis is set out as follows. Chapter 2 examines the growth of
information and communication technologies in the economy. In particular it explores the
expectations of researchers in the field in the 1990s as the Internet started to emerge as a
significant commercial development with the potential to reshape transactions between agents
and the organisation of firms.
The results of a survey of firms undertaken in 2001 are presented in Chapter 3. The survey
focused on changes to business and customer interaction, and expected impacts on skills and
training. Chapter 4 provides an examination of the latest trends in business use of, and
investment in, ICT.
Chapter 5 examines the features of the Australian labour market and observed changes in key
aggregates, institutional features, and changes to occupational and industry structure. A
discussion of the drivers of change over the last 25 years is provided. In particular,
microeconomic reforms, the overhaul of industrial relations and the literature examining the
impact on labour productivity are examined.
Chapter 6 presents the literature on skill-biased technological change (SBTC) in the broader
context of structural change. The chapter concludes with a critique of the SBTC hypothesis,
including alternative explanations for the observed changes in the skill structure of advanced
economies, such as trade and organisational change.
Issues of skill measurement are examined in Chapter 7 and a shift-share model for measuring
skill change in the Australian economy is outlined.
6
The results of the shift-share analysis are presented and discussed in Chapter 8. Chapter 9
presents the estimation of a model showing the determinants of intra-industry skill change.
Chapter 10 presents the conclusions, major findings and policy implications of the thesis. The
chapter concludes with an overview of avenues for further research.
This thesis embodies all of the previously published work by the author and expands on this
through more thorough and extensive exploration of the subject matter. It builds on previously
published material by the author by estimating the determinants of skill change for motor,
interactive and education skills, whereas previous work was limited to the measurement of
cognitive skills. The thesis also provides an expanded discussion of policy implications and
future research directions.
7
2 INFORMATION AND COMMUNICATION
TECHNOLOGIES (ICT) AND THE ECONOMY
2.1 Introduction
The Australian economy, like most advanced and developing economies around the
world, has witnessed a massive growth in ICT since the early 1990s in many forms.
Examples include interfaces for electronic data interchange devices (EDI), such as
Electronic Funds Transfer Point of Sale (EFTPOS), Automatic Teller Machines
(ATM), microelectronic scanning devices and global positioning systems (GPS). The
scanning of products being in supermarkets rather than manually keying the prices
has increased the speed of processing customers at checkout counters. ATMs have
substantially reduced the number of face-to-face transactions in banks and GPS has
revolutionised the fishing and agriculture industries as well as transport and logistics.
The latter improves ‘just-in-time’ manufacturing, driving down inventory levels,
reducing costs and improving efficiency. In addition, the spread of computers has
increased to a point where they could now be considered to be pervasive technology.
Moreover, the introduction of the Internet and its increasing speed, quality and the
applications it now supports, is having a radical effect on the economy and ultimately
the skill structure.
In this chapter the main focus is on outlining some of the key developments and
supporting evidence of their diffusion in the economy.

8
2.2 Growth of the Internet
Perhaps the most telling indication of the rapid rise of the Internet is the relatively
short period of time it took to reach 50 million people in the United States (US).
Radio took 38 years, television 13 years and cable television 10 years; the Internet
only took 5 years (Rayport and Jaworski 2001). In 1997 only 32 per cent of the
largest 500 companies in the US1 had any kind of Internet presence. In 1998 that
figure had grown to 82 per cent (Chief Executive 1999, p.8).
Table 2-1 World Internet Usage and Population by Region, June 2009
World Regions Population
( 2009 Est.)
millions
Internet Users
Dec. 31, 2000
millions
Internet Users
2009
Penetration
(% Population)
Users
Growth
2000-2009
Users
% of
Table
Africa 991 4.5 65.9 6.7 % 1,359.9 % 3.9 %
Asia 3,808 114.3 704.2 18.5 % 516.1 % 42.2 %
Europe 804 105.1 402.4 50.1 % 282.9 % 24.2 %
Middle East 203 3.3 48.0 23.7 % 1,360.2 % 2.9 %
North America 341 108.1 251.7 73.9 % 132.9 % 15.1 %
Latin America/Caribbean 587 18.1 175.8 30.0 % 873.1 % 10.5 %
Oceania / Australia 35 7.6 20.8 60.1 % 173.4 % 1.2 %
WORLD TOTAL 6,769 360.0 1,668.8 24.7 % 362.3 % 100.0 %
Notes:
i. Internet Usage and World Population Statistics are estimates for June 30, 2009.
ii. Demographic (Population) numbers are based on data from the US Census Bureau .
iii. Internet usage information comes from data published by Nielsen On-line, by the
International Telecommunications Union, by GfK, local Regulators and other reliable
sources.
iv. This information has been reproduced from www.internetworldstats.com.
1 Ranked by gross revenue adjusted for excise taxes collected (i.e. these are the ‘US Fortune 500’ companies).

9
By June 2009 the estimated number of people connected to the Internet was 1.7
billion, or 24.7 per cent of the world’s population. In the United States the percentage
of the population with connection to the Internet was 74 per cent, for Australia 60 per
cent and Europe 50 per cent (Internet World Stats n.d.).2
2.2.1 Increase in Internet speeds
The growth of the Internet has been accompanied by increases in download speeds
for Internet traffic as consumers switch from dial-up Internet connections to
broadband Internet connections. A commonly used definition of broadband is a
download speed for data of 144 kilobits per second (Kbs) or greater (Stordahl and
Elnegaard 2007). This represents around a 15 fold or greater increase in data
transmission speeds compared to the superseded dial-up speeds and obviously
increases the appeal and usefulness of the Internet as it expands the number of
applications that it can be used for. In 2007 there were around 43 per cent of Western
European households with a broadband connection to the Internet, this was forecast to
grow to 60 per cent by 2010 (Stordahl and Elnegaard, 2007).
In September 2009 the Australian Government announced a commitment to spend up
to $43bn over an eight-year period to roll out an Australia-wide broadband network,
predominantly fibre-optic cable to individual premises, but with wireless broadband
to cover approximately 10 per cent of households and locations where a fibre-optic
roll-out is not feasible, thus giving effective 100 per cent coverage for Australia and
removing any remaining technical barriers for businesses and consumers to connect
2 Internet World Stats have sourced the information from AC Nielsen.
10
to broadband Internet (Department of Broadband, Communications and the Digital
Economy (DBCDE), 2009).
The introduction of fibre-optic will allow for speeds up to 100 megabits per second
(Mbs), far in excess of the 144 Kbs currently used to define broadband transmission
speeds. Even in areas where wireless will be used the expected speeds are 12 Mbs.
This will in most cases provide substantial increases in data transmission speeds,
enabling real-time carrier grade video, data and voice to be delivered on-line (and
television transmission and movies to be screened) (DBCDE 2009).
2.3 Household Access to the Internet
Early studies of the Internet focused on the issue of who had access, which in turn
defined who could benefit from the expanding array of goods and services available
on-line.
Madden and Savage (2000) using data from a web based survey of Australian Internet
users found a positive relationship between income and Internet usage and that the
probability of greater usage is inversely related to age (see also Soete and Weel
1998). Other studies pointed to education and using a computer at work as being
important indicators of the likelihood of Internet adoption (see, for example,
Goolsbee and Klenow 1999; Greenstein 1998).
A study using 2002-03 European Social Survey data by Demoussis and
11
Giannakopoulos (2006) examines the ‘digital-divide’ for EU countries.3 The main
findings are that income is positively related to Internet usage for people with access
to the Internet. The cost of access and level of education are also positively related.
Importantly, there appears to be structural differences between northern and southern
EU countries. That is, for the same values of the determinants of usage, the rate of
usage was lower in southern Europe4 (Demoussis and Giannakopoulos 2006).
More recent studies (Devins, Darlow and Webber 2008) undertook a study of
households in the UK and their access in terms of participation in eCommerce, such
as on-line banking and shopping and find that women, ethnic minorities, and people
living in less affluent areas utilise these services to a much lower extent, even when
income is controlled for. Women were also considerably less likely to access
information that would enhance or support their social and economic inclusion.
Kelly and Lewis (2001)5 estimated a model of demand for Internet connection using
data for Western Australian households of the following form:
3 The countries in question include Austria, Belgium, Denmark, Spain, Finland, France, UK, Greece, Ireland,
Italy, Luxemburg, Netherlands, Portugal, and Sweden.
4 This was determined by examining differences in the coefficients between estimates for the northern and
southern countries within the EU sample.
5 The work published in Kelly and Lewis (2001) was undertaken as an integral part of this thesis. The research
was undertaken as part of an Australian Research Council funded Strategic Partnerships with Industry- Research
and Training Scheme (SPIRT).
i
k
jijii uyExp 1
10
12
where:
Expi is the percentage of households with an Internet connection;
yi is the average household income;
Zji are a set of variables measuring characteristic j in area i;
0, 1, and j are parameters;
ui is an error term, assumed to be independently identically normally distributed with
constant variance.
The dependent variable was Percentage of Households in a Census collection district6
connected to the Internet, while the Z vector included age, non-English speaking
background, percentage of people in a collection district attending university,
percentage attending a technical and further education college (TAFE) and a dummy
denoting region of state.
The key finding of the Kelly Lewis (2001) study was that income, location, age and
education all significantly affected Internet adoption. Poorer neighbourhoods and
certain regions had significantly lower connection rates.
Universal service is an important theme in US government communications policy
and in the past was reflected in telephone networks being extended into rural and low
6 A collection district until 2006 was the base or smallest unit for capturing household information, equating to
approximately 250 households. Note in the 2006 Census that the ABS moved to a different methodology that now
allows for much finer detail for spatial units (ABS 2006a).
13
income areas (Greenstein, 1998). This has also heavily influenced Australian decision
making and was a major issue in the privatisation debate on the national carrier,
Telstra, in the 1990s (see, for example, Doherty and Gratten 2000, Gratten 2000,
Lewis 2000).
Telstra, as the National Universal Service Provider, is responsible for meeting
Universal Service Obligations (USO) under the Telecommunications Act 1997. They
are required to ensure that standard telephone services are reasonably accessible to all
people in Australia on an equitable basis, regardless of where they reside. Their
obligations are to provide voice grade standard telephone services throughout
Australia. Their charter also includes the pursuit of international best practice in the
telecommunications industry, including compliance with relevant industry
performance standards (DCITA 2000).
Recent developments in the national broadband arena (see DCBDE, 2009) will
completely change the USO landscape, as ‘voice over Internet’ (VoIP)7 technologies
will enable cheap and accessible telephone services everywhere.
In the early phases of Internet uptake, issues of access were critical; from both a
social equity perspective and the economics of market penetration facing firms. The
principle factors limiting the use of eCommerce markets in the early phase of
diffusion were physical roll out of the Internet, the question of a means of secure
payment, trust, consumer protection, and the ability of consumers to access the
7 VoIP is a general term for delivery of voice communications over Internet Protocol (IP) networks such as the
Internet.

14
Internet (OECD 1998a; Kelly and Lewis 2001).
Since 2000 however, computer prices, network coverage, download speeds have all
improved dramatically, public access is widely available at very low cost through
Internet cafes and booths within shopping malls. It would now be the exception,
rather than the norm, for households not to have acceptable levels of access. The final
roll out of the fibre optic broadband network in Australia over the next decade will
confine access largely to an issue of choice.
2.3.1 Current access levels in Australia
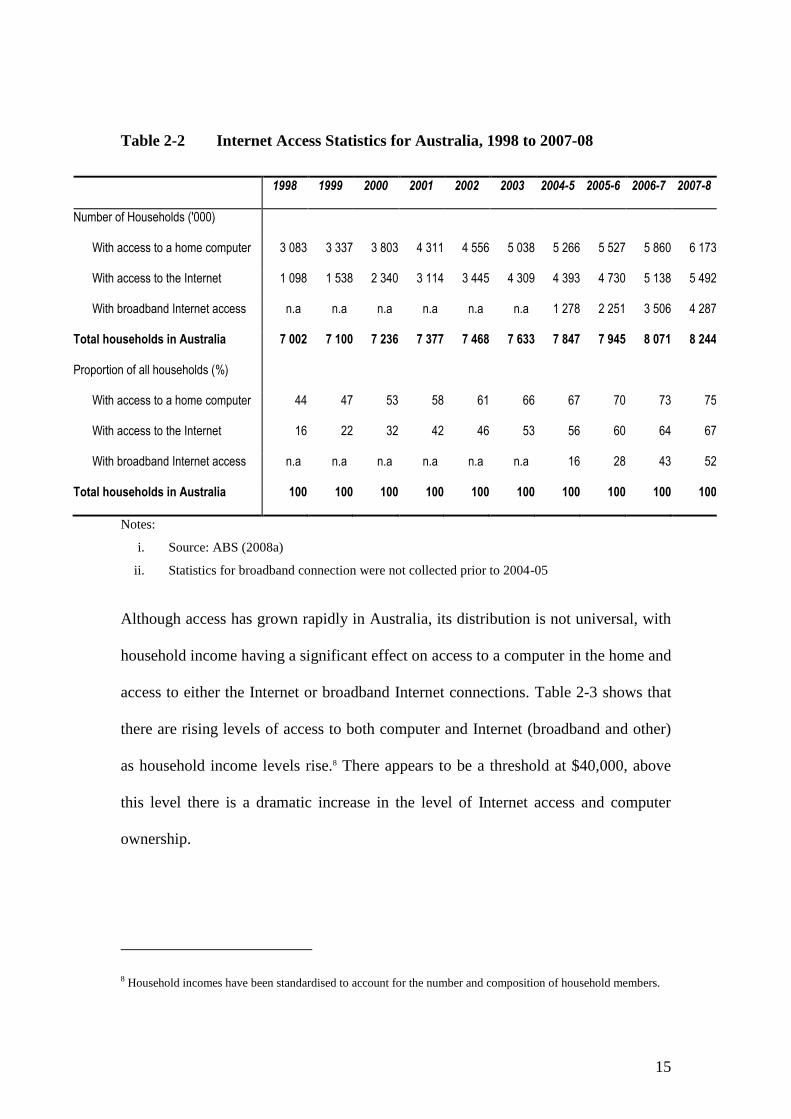
As shown in Table 2-2 there has been a substantial increase between 1998 and 2007-
08 in the number of households with access to a computer, more than doubling over
that period with around 75 per cent of all households in 2007-08 having access to a
computer. Over the same period the number of households with a computer grew by
100 per cent, or 8 per cent per year. Internet access grew by 19.6 per cent per year,
while for the three years that broadband access statistics are available the growth rate
was 49.7 per cent per year. The number of households has been growing at 1.8 per
cent per year. The growth rates for households’ Internet access, in Australia and
especially broadband access, are very large and demonstrate how pervasive it has
become.
15
Table 2-2 Internet Access Statistics for Australia, 1998 to 2007-08
1998 1999 2000 2001 2002 2003 2004-5 2005-6 2006-7 2007-8
Number of Households ('000)
With access to a home computer 3 083 3 337 3 803 4 311 4 556 5 038 5 266 5 527 5 860 6 173
With access to the Internet 1 098 1 538 2 340 3 114 3 445 4 309 4 393 4 730 5 138 5 492
With broadband Internet access n.a n.a n.a n.a n.a n.a 1 278 2 251 3 506 4 287
Total households in Australia 7 002 7 100 7 236 7 377 7 468 7 633 7 847 7 945 8 071 8 244
Proportion of all households (%)
With access to a home computer 44 47 53 58 61 66 67 70 73 75
With access to the Internet 16 22 32 42 46 53 56 60 64 67
With broadband Internet access n.a n.a n.a n.a n.a n.a 16 28 43 52
Total households in Australia 100 100 100 100 100 100 100 100 100 100
Notes:
i. Source: ABS (2008a)
ii. Statistics for broadband connection were not collected prior to 2004-05
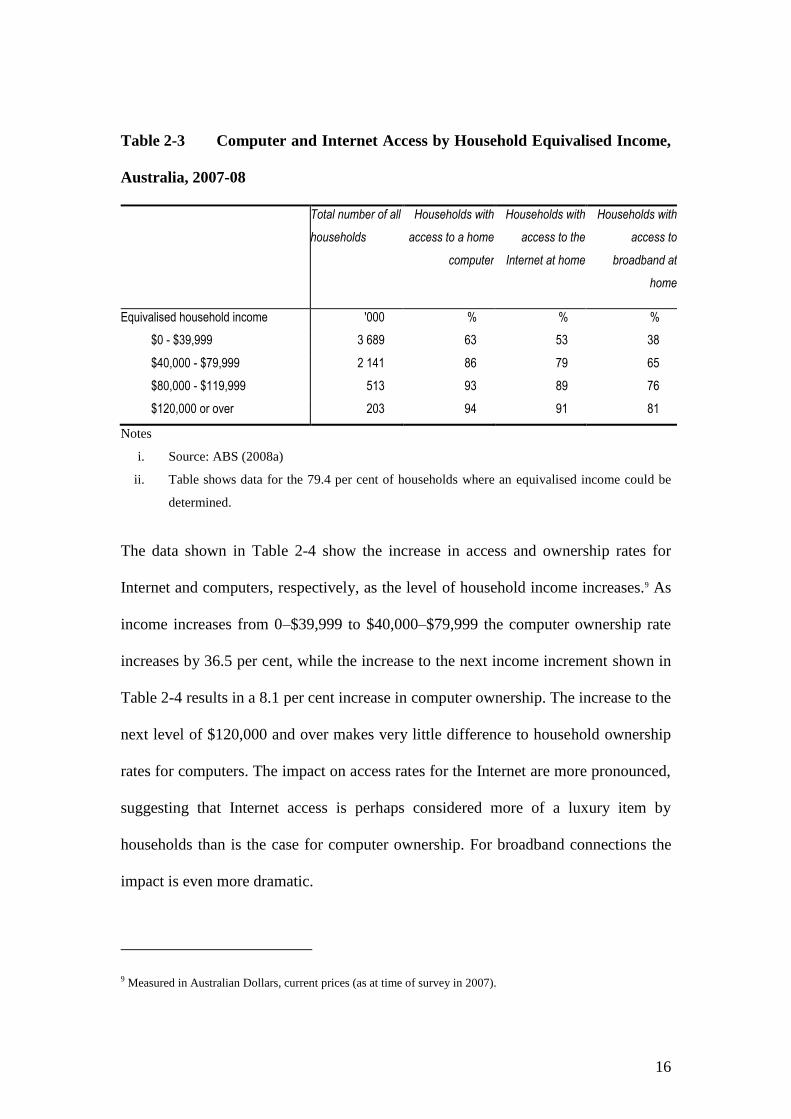
Although access has grown rapidly in Australia, its distribution is not universal, with
household income having a significant effect on access to a computer in the home and
access to either the Internet or broadband Internet connections. Table 2-3 shows that
there are rising levels of access to both computer and Internet (broadband and other)
as household income levels rise.8 There appears to be a threshold at $40,000, above
this level there is a dramatic increase in the level of Internet access and computer
ownership.
8 Household incomes have been standardised to account for the number and composition of household members.
16
Table 2-3 Computer and Internet Access by Household Equivalised Income,
Australia, 2007-08
Total number of all
households
Households with
access to a home
computer
Households with
access to the
Internet at home
Households with
access to
broadband at
home
Equivalised household income '000 % % %
$0 - $39,999 3 689 63 53 38
$40,000 - $79,999 2 141 86 79 65
$80,000 - $119,999 513 93 89 76
$120,000 or over 203 94 91 81
Notes
i. Source: ABS (2008a)
ii. Table shows data for the 79.4 per cent of households where an equivalised income could be
determined.
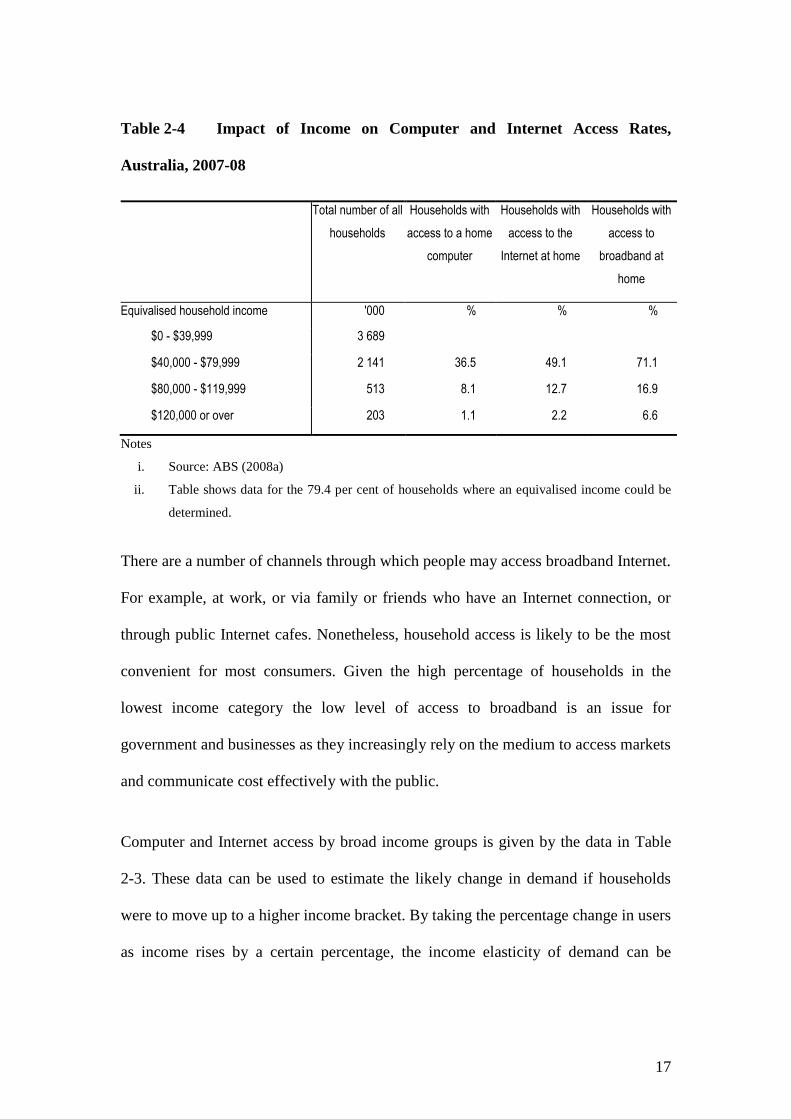
The data shown in Table 2-4 show the increase in access and ownership rates for
Internet and computers, respectively, as the level of household income increases.9 As
income increases from 0–$39,999 to $40,000–$79,999 the computer ownership rate
increases by 36.5 per cent, while the increase to the next income increment shown in
Table 2-4 results in a 8.1 per cent increase in computer ownership. The increase to the
next level of $120,000 and over makes very little difference to household ownership
rates for computers. The impact on access rates for the Internet are more pronounced,
suggesting that Internet access is perhaps considered more of a luxury item by
households than is the case for computer ownership. For broadband connections the
impact is even more dramatic.
9 Measured in Australian Dollars, current prices (as at time of survey in 2007).
17
Table 2-4 Impact of Income on Computer and Internet Access Rates,
Australia, 2007-08
Total number of all
households
Households with
access to a home
computer
Households with
access to the
Internet at home
Households with
access to
broadband at
home
Equivalised household income '000 % % %
$0 - $39,999 3 689
$40,000 - $79,999 2 141 36.5 49.1
71.1
$80,000 - $119,999 513 8.1 12.7
16.9
$120,000 or over 203 1.1 2.2 6.6
Notes
i. Source: ABS (2008a)
ii. Table shows data for the 79.4 per cent of households where an equivalised income could be
determined.
There are a number of channels through which people may access broadband Internet.
For example, at work, or via family or friends who have an Internet connection, or
through public Internet cafes. Nonetheless, household access is likely to be the most
convenient for most consumers. Given the high percentage of households in the
lowest income category the low level of access to broadband is an issue for
government and businesses as they increasingly rely on the medium to access markets
and communicate cost effectively with the public.
Computer and Internet access by broad income groups is given by the data in Table
2-3. These data can be used to estimate the likely change in demand if households
were to move up to a higher income bracket. By taking the percentage change in users
as income rises by a certain percentage, the income elasticity of demand can be
18
estimated.
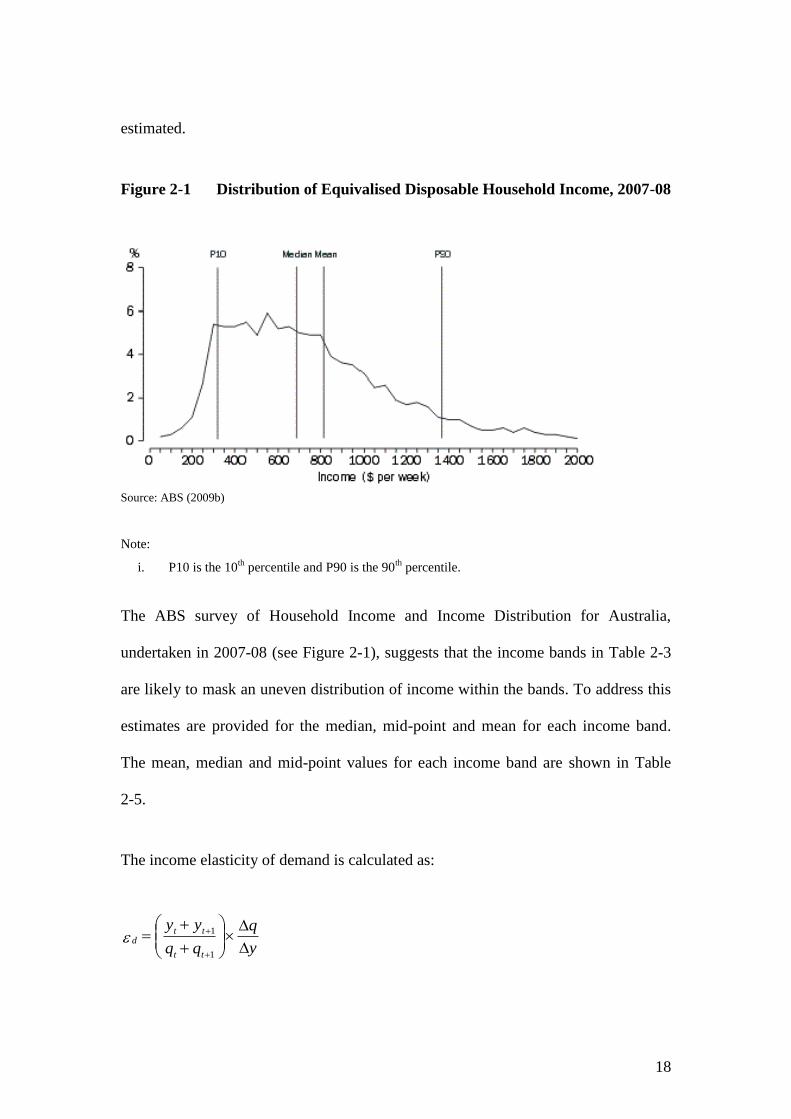
Figure 2-1 Distribution of Equivalised Disposable Household Income, 2007-08
Source: ABS (2009b)
Note:
i. P10 is the 10th
percentile and P90 is the 90th
percentile.
The ABS survey of Household Income and Income Distribution for Australia,
undertaken in 2007-08 (see Figure 2-1), suggests that the income bands in Table 2-3
are likely to mask an uneven distribution of income within the bands. To address this
estimates are provided for the median, mid-point and mean for each income band.
The mean, median and mid-point values for each income band are shown in Table
2-5.
The income elasticity of demand is calculated as:
y
q
yy
tt
ttd
1
1

19
Where:
yt is the initial equivalised income band of the household
yt+1 is the next increment of the equivalised income band of the household
Δy is yt+1 - yt , i.e. the change in equivalised household income
qt is the initial number of households with access to a PC/Internet/broadband
qt+1 is the next increment of households with access to a PC/Internet/broadband
Δq is qt+1 - qt , i.e. the change in demand for PCs/Internet/broadband
εd is the estimate of the income elasticity of demand
The quotient in the brackets is the ratio of income for each successive income band
and associated quantities demanded. The change expression on the right hand side is
calculated for midpoints, means and medians as described above and indicated in
Table 2-6.
Table 2-5 shows the approximate median and mean and mid-point values for yt and
yt+1 for each of the first three income categories shown in Table 2-3. The last category
covers income ranges that are top coded in the published income data and so a value
of $140,000 has been assumed. The calculated elasticity is very low at any value
above $120,000, so little is lost from the loss of precision.
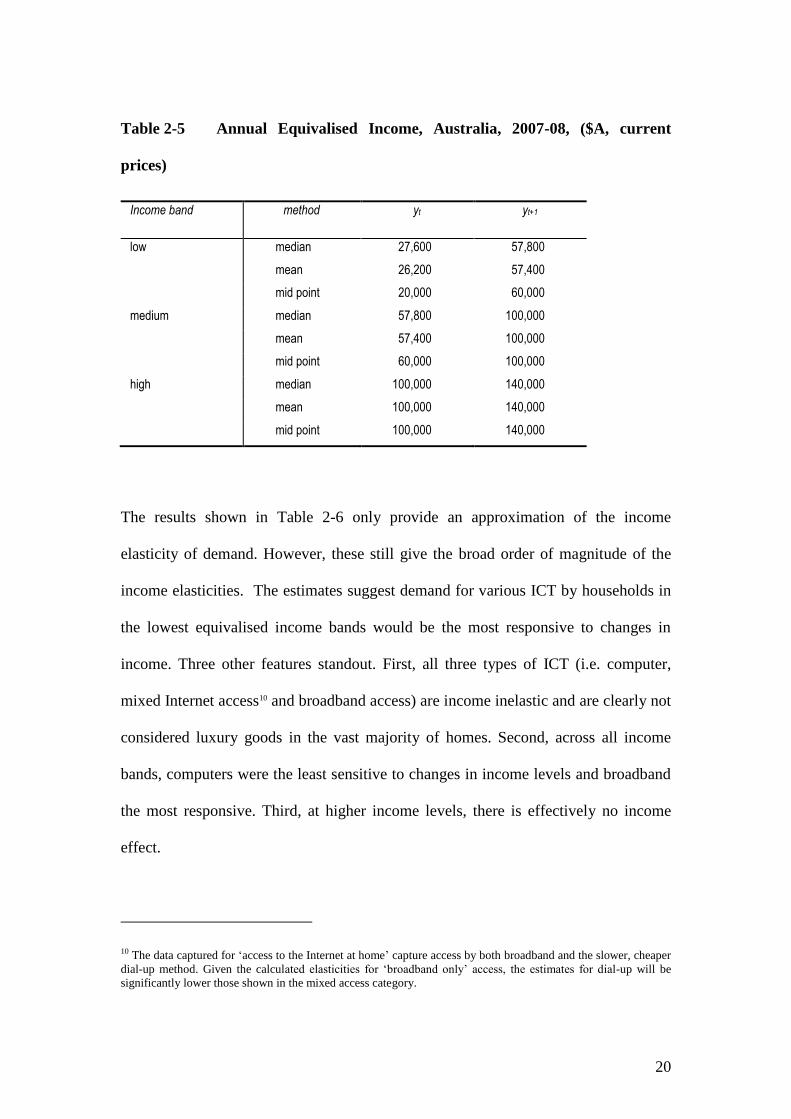
20
Table 2-5 Annual Equivalised Income, Australia, 2007-08, ($A, current
prices)
Income band method yt yt+1
low median 27,600 57,800
mean 26,200 57,400
mid point 20,000 60,000
medium median 57,800 100,000
mean 57,400 100,000
mid point 60,000 100,000
high median 100,000 140,000
mean 100,000 140,000
mid point 100,000 140,000
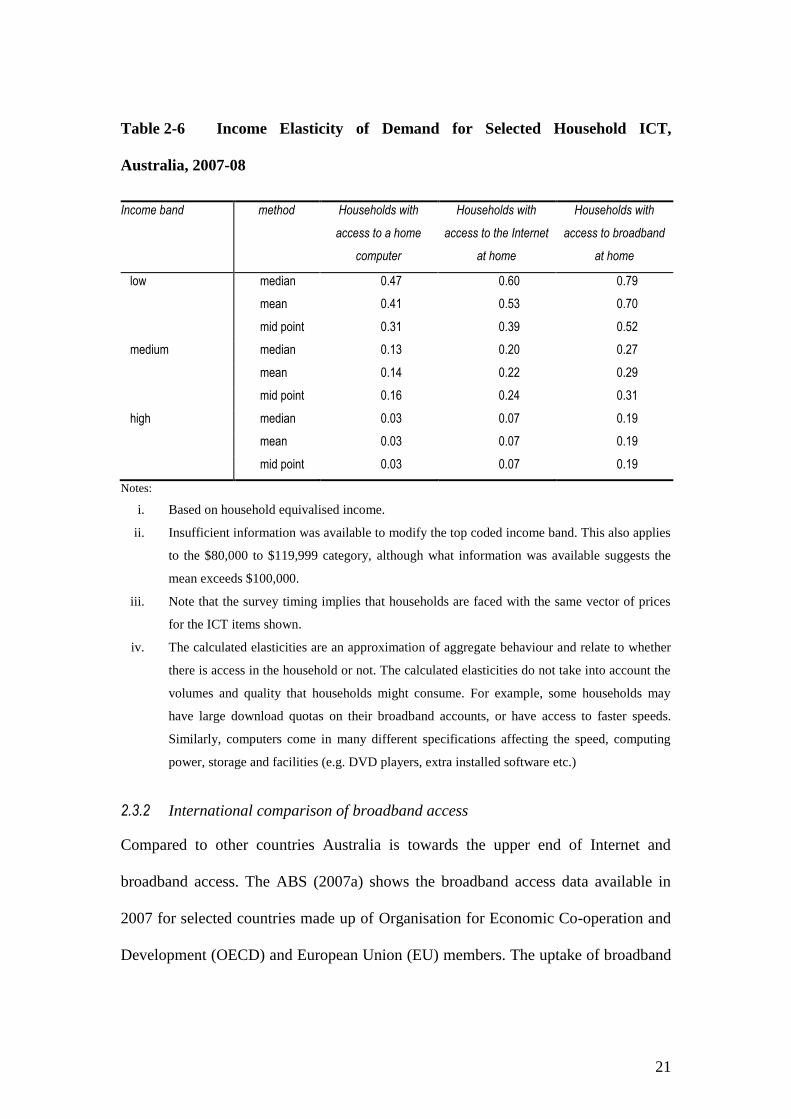
The results shown in Table 2-6 only provide an approximation of the income
elasticity of demand. However, these still give the broad order of magnitude of the
income elasticities. The estimates suggest demand for various ICT by households in
the lowest equivalised income bands would be the most responsive to changes in
income. Three other features standout. First, all three types of ICT (i.e. computer,
mixed Internet access10 and broadband access) are income inelastic and are clearly not
considered luxury goods in the vast majority of homes. Second, across all income
bands, computers were the least sensitive to changes in income levels and broadband
the most responsive. Third, at higher income levels, there is effectively no income
effect.
10 The data captured for ‘access to the Internet at home’ capture access by both broadband and the slower, cheaper
dial-up method. Given the calculated elasticities for ‘broadband only’ access, the estimates for dial-up will be
significantly lower those shown in the mixed access category.
21
Table 2-6 Income Elasticity of Demand for Selected Household ICT,
Australia, 2007-08
Income band method Households with
access to a home
computer
Households with
access to the Internet
at home
Households with
access to broadband
at home
low median 0.47 0.60 0.79
mean 0.41 0.53 0.70
mid point 0.31 0.39 0.52
medium median 0.13 0.20 0.27
mean 0.14 0.22 0.29
mid point 0.16 0.24 0.31
high median 0.03 0.07 0.19
mean 0.03 0.07 0.19
mid point 0.03 0.07 0.19
Notes:
i. Based on household equivalised income.
ii. Insufficient information was available to modify the top coded income band. This also applies
to the $80,000 to $119,999 category, although what information was available suggests the
mean exceeds $100,000.
iii. Note that the survey timing implies that households are faced with the same vector of prices
for the ICT items shown.
iv. The calculated elasticities are an approximation of aggregate behaviour and relate to whether
there is access in the household or not. The calculated elasticities do not take into account the
volumes and quality that households might consume. For example, some households may
have large download quotas on their broadband accounts, or have access to faster speeds.
Similarly, computers come in many different specifications affecting the speed, computing
power, storage and facilities (e.g. DVD players, extra installed software etc.)
2.3.2 International comparison of broadband access
Compared to other countries Australia is towards the upper end of Internet and
broadband access. The ABS (2007a) shows the broadband access data available in
2007 for selected countries made up of Organisation for Economic Co-operation and
Development (OECD) and European Union (EU) members. The uptake of broadband

22
Internet connections varies widely, ranging from Korea with 94 per cent to under 2
per cent for Turkey. The number of Australian households with broadband access at
home was around 52 per cent, compared to the EU average of just over 43 per cent.
Australian access levels were very similar in 2007 to Switzerland, the US and
Germany. The northern European economies, such as Denmark, the Netherlands,
Sweden and Belgium tended to be much higher. Eastern and Southern EU economies,
such as the Czech and Slovak Republics, Greece, Italy and Turkey tended to be at the
lower end of access rates.
2.4 The Economics of eCommerce
The Internet and eCommerce has been widely lauded as a medium that has changed
and will continue to change the face of the economy. It has provided a new medium
through which businesses, consumers and government interact with each other. It has
also provided new ways to organise, to produce and to sell. However, for this to have
happened there must have been a compelling economic reason. As Shapiro and
Varian (1999) point out, the technologies may have changed, but the economics has
not.
2.4.1 eCommerce defined
The term eCommerce essentially means using ICT to support business activities.
Currently, there are a number of descriptions of eCommerce. Some examples are
transactions conducted over the telephone and fax machine, electronic payment and
money transfer systems, electronic data interchange and the Internet (DIST 1998).
The OECD (1998a) defined eCommerce as:
23
business occurring over networks which use non-proprietary protocols that are
established by an open standard setting process such as the Internet. (p.1)
A contemporary textbook definition describes it as follows:
Technology-mediated exchanges between parties (individuals, organisations, or
both) as well as the electronically based intra- or inter-organisational activities that
facilitate such exchanges. (Rayport and Jaworski, 2001, p.3)
There are also alternative terms like ‘eBusiness’, ‘Internet business’ and ‘Internet
commerce’. The term ‘business’ can also be extended broadly to include both
networked activity between, and within, economic units like firms, households and
government agencies (Shapiro and Varian 1999).
In the Australia’s Digital Economy: Future Directions Final Report a slightly broader
definition encompasses the eCommerce definitions provided above within the rubric
of the ‘digital economy’ (Department of Broadband, Communications and the Digital
Economy (DBCDE) 2009, p.2):
The Australian Government defines the digital economy to be:
‘The global network of economic and social activities that are enabled by information
and communications technologies, such as the Internet, mobile and sensor networks.’
The latest definition of eCommerce provided by the OECD (2006) is as follows:
An Internet transaction is the sale or purchase of goods or services, whether between
businesses, households, individuals, governments, and other public or private
organisations, conducted over the Internet. The goods and services are ordered over
the Internet, but the payment and the ultimate delivery of the good or service may be
conducted on or off-line. (p. 14)11
11 Note that this definition includes orders received or placed on any Internet application used in automated
transactions such as Web pages, Extranets and other applications that run over the Internet, such as EDI over the
Internet, Minitel over the Internet, or over any other Web enabled application regardless of how the Web is
accessed (e.g. through a mobile or a TV set etc.). The definition excludes orders received or placed by telephone,
facsimile, or conventional e-mail. This is the ‘narrow’ definition of eCommerce used by the ABS for its surveys
on business use of ICT (see ABS 2009c).
24
All of the definitions outlined above encompass the types of developments that
appear to be driving substantial changes in the structure of the economy in terms of
outputs, consumption patterns, production technology and skills over the last two
decades, and especially over the last five to ten years.
2.4.2 Consumer behaviour
Koivumäki et al. (2002) use theoretical consumer behaviour models to demonstrate
the conditions under which Internet based purchasing and consumption will prevail
over traditional forms. They break down the process of purchasing into time spent on
shopping and the emotional experience related to shopping.
Koivumäki et al. (2002) argue that the Internet is primarily an information and
communication tool, regardless of the goods being traded. Therefore, an information
intensive approach will perform best. On-line sites must provide both a wide variety
of information and the means to interact with it.
The potential changes in consumer behaviour in response to on-line shopping
outlined by Koivumäki et al. (2002) are:
part of the consumer basket is bought on-line, but underlying preferences do
not change (i.e. the shape of the consumer’s indifference curve is unaffected).
These items typically will be highly homogenous between the shopping
mediums, such as music downloads or groceries;
The consumption bundle changes due to a change in a constraint, such as time
or money. This could be due to the prices of on-line goods becoming cheaper,
25
or because on-line shopping may provide more time for leisure related
commodities.
Finally, the switch to on-line goods may change both the effective constraints
on consumption as well as the underlying preference structure in response to a
wider array of consumption possibilities opened up by the Internet.
In summary, it is the ‘full cost of goods’ that takes into account the consumer’s time
allocation, prices, attributes and money income as well as tastes and preferences, that
determines the decision between purchasing goods on-line or in physical stores. The
Internet and complementary technologies including search engines like Google™
lends itself to minimising the time cost of consumption by streamlining search costs.
Given that the purchases can take place in the comfort of the home or at work, the
experiential nature of purchasing may also be altered. Finally, if the economics is
compelling, and the goods and services are available, then the expectation is that
there will be a rise in on-line sales. As shown in subsequent sections, this is borne out
by the evidence.
2.4.3 Contestability of markets
One mechanism that has enabled the growth of Internet based business and
businesses12 is that it promotes competition through low sunk costs. Low sunk costs
reduce the consequences of failure and therefore barriers to entry are also lowered. It
12 Some firms utilise the Internet to conduct business for some or all of its products and services. This may be just
one of the many channels through which they make sales; banks and newspapers fall into this category. However,
there will also be businesses that only operate within an on-line environment. Examples include on-line auction
sites such as ‘eBay’, or Amazon books.
26
potentially reduces the cost of exit and the ‘break even’ constraint as well (see
Schwartz 1986), giving rise to so-called ‘hit and run’ entry into markets. This has also
been assisted by the reduction in scale required to compete with existing firms (Goel
and Hseih 2002).
2.4.4 Market segmentation and consumer surplus
Shapiro and Varian (1999) describe the concept of ‘versioning’ to explain how the
consumer surplus can be captured for different market segments for various
information goods – goods that can be turned into a digital or electronic form, such as
text, music, and software. One of the characteristics of these goods is that they have
high fixed costs, or, to put it another way, the cost of the first copy produced is very
high. The marginal cost of such goods is very low. Versioning provides the means by
which variants of the underlying product can be sold to a wider audience to help
cover the initial copy or fixed costs. It allows different pricing to each segment of the
market depending on whether they have a high or low value for the product, and
everything in between.
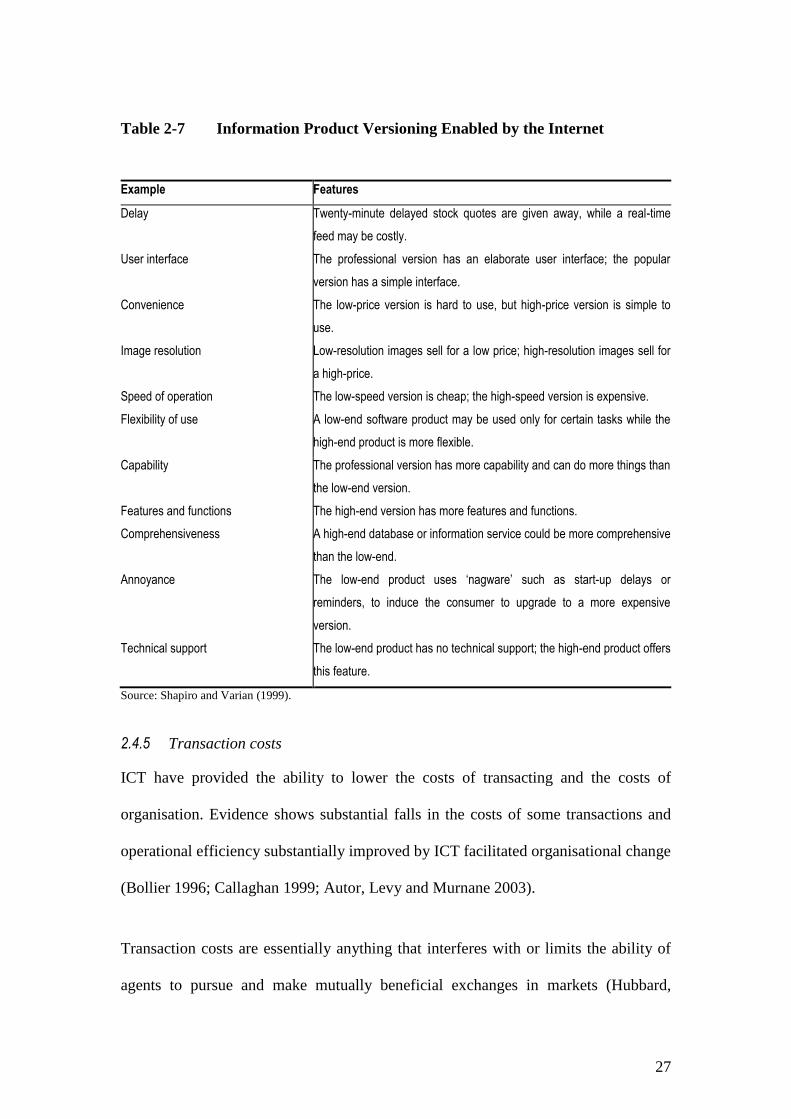
Shapiro and Varian (1999) argue that although versioning is a common strategy for
conventional information goods, such as when movies come out in theatres at a high
price per view and are then released six months later in home video, the flexibility of
digital media has enabled new forms of versioning. Examples of versioning are
shown in Table 2-7.
27
Table 2-7 Information Product Versioning Enabled by the Internet
Example Features
Delay Twenty-minute delayed stock quotes are given away, while a real-time
feed may be costly.
User interface The professional version has an elaborate user interface; the popular
version has a simple interface.
Convenience The low-price version is hard to use, but high-price version is simple to
use.
Image resolution Low-resolution images sell for a low price; high-resolution images sell for
a high-price.
Speed of operation The low-speed version is cheap; the high-speed version is expensive.
Flexibility of use A low-end software product may be used only for certain tasks while the
high-end product is more flexible.
Capability The professional version has more capability and can do more things than
the low-end version.
Features and functions The high-end version has more features and functions.
Comprehensiveness A high-end database or information service could be more comprehensive
than the low-end.
Annoyance The low-end product uses ‘nagware’ such as start-up delays or
reminders, to induce the consumer to upgrade to a more expensive
version.
Technical support The low-end product has no technical support; the high-end product offers
this feature.
Source: Shapiro and Varian (1999).
2.4.5 Transaction costs
ICT have provided the ability to lower the costs of transacting and the costs of
organisation. Evidence shows substantial falls in the costs of some transactions and
operational efficiency substantially improved by ICT facilitated organisational change
(Bollier 1996; Callaghan 1999; Autor, Levy and Murnane 2003).
Transaction costs are essentially anything that interferes with or limits the ability of
agents to pursue and make mutually beneficial exchanges in markets (Hubbard,
28
Garnett, Lewis and O’Brien 2009). Organisational costs are anything that inhibits the
ability of agents to consciously coordinate their activity to achieve some understood
object within a single economic entity, that is, a particular firm, household or
government agency.
Bollier (1996) provides some of the earliest estimates of the cost of a transaction
undertaken through different mediums. For example, it has been estimated for the US
computer software industry that seller transaction costs were $US15 for face-to-face
transactions, $US5 for telephone transactions, and between $US0.20 and 0.50 cents
for Internet transactions. A set of Australian estimates for 1998 puts the transaction
costs for a sales representative visit at $A300, a customer initiated face-to-face
transaction at $A25 to $A30, a telephone transaction at $A4 to $A8, and an Internet
transaction at less than 25 cents (Callaghan 1999, p30). These estimates put the cost
of eCommerce transactions for sellers at something in the order of 3 to 6 per cent of
the cost of telephone transactions and 1 per cent or less for face-to-face transactions.
One transaction cost related hypothesis refers to the reduction of the cost of economic
activities in remote areas using information technologies, thereby reducing the need
for urban agglomeration.13 A study by de Blasio (2008) examined data on Italian
households' usage of the Internet, eCommerce, and e-banking to test this theory and
concluded that the Internet did not reduce the role of distance. The main findings
were that geographically remote consumers were discouraged from purchasing goods
on-line because they could not look at goods before they purchased them. Where the
13 Also known as the ‘global–village hypothesis’, ‘Internet/cities’ and ‘death of distance’ (de Blasio, 2008, p.341).
29
goods were amenable to download, such as music, books, and tickets to events, use of
the on-line purchasing was higher than for metropolitan users. Surprisingly, electronic
banking was not related to geographic factors, the reason being that non-urban
customers gave more importance to personal interaction than urban clients, in part
because they were more likely to have taken out a loan.14
Only 15 per cent of the households in the sample used by de Blasio (2008) indicated
they bought goods and services over the Internet in the year of the survey. Moreover,
only 5 per cent of the households surveyed had used Internet banking. One reason for
the low usage of Internet banking might be due to the full suite of financial services
not being available on the Web. With the only means of accessing a comprehensive
range of services through direct access to a physical bank branch, consumers will be
less inclined to use Internet banking services.
It should be noted that the de Blasio (2008) study was based on 2002 survey data for
Italy. The relative maturity and sophistication of the products, services and
information on-line, ease of making an on-line transaction, data download speeds and
security for on-line transactions have all advanced significantly since 2002. The same
study undertaken in 2009 may yield different results. For example, developments in
Australia have demonstrated a significant expansion of the capability of Internet
banking. In February 2009 the Commonwealth Bank of Australia (CBA) introduced
their ‘First On-line’ service. They claim to have made transactions effectively ‘real-
time’, with full approval of home loan ‘top-ups’ reducing from 14-22 days to 15
14 The inference is that they have ‘preference’ for personal interaction because of previous complex transactions
(i.e. taking out a loan) requiring face-to-face interaction (see de Blasio 2008).
30
minutes (DBCDE, 2009).
There has been a switch in emphasis by CBA in the purpose of the Internet banking
service they provide. When first established in the late 1990s it was intended to
provide a third node of access, a complement to telephone banking and ATMs for the
more routine transactions. The latest transformation is intended to provide fully
linked access across all consumer accounts with one point of access ‘full self-
service’, thus avoiding the need to go into a branch or contact a call centre (DBCDE,
2009).
Another area that has seen substantial falls in transaction costs is stock market
transactions, especially for individual trading. A cross-sectional study of US
households by Bogan (2008) found a 7 per cent increase in the probability of owning
stock in retirement-age households. Between 1992 and 2004 the participation rate in
stock ownership increased from 31.2 per cent among US households to 34.7 per cent,
due mostly to the advent of on-line trading. Bogan (2008) reports data for a large US
stock market broker with 8 million actively trading clients in 2002. Prior to 1992
none of the trades made by clients were made on-line, by 2002 80 per cent of their
clients’ trades were made on-line. The cost of on-line trades was up to 79 per cent
lower than broker-assisted trades, the differentials being much higher for low volume
trading.15 A Swedish study of on-line trading through an Internet discount brokerage
firm showed that small investors tended to perform much worse than the overall
market, by around 8.5 per cent per year, half of which was due to trading costs. The
15 Data cited in Bogan (2008) are for October 2000 and include E*Trade, Ameritrade, Schwab, Datek and CSFB
Direct.
31
inference is that this is due to excessive trading among small stockholders (Anderson
2007). Despite low transaction fees, the increased volume of trades relative to gains
and losses per trade has had an adverse impact on returns.
In 2002 National Office of the Information Economy (NOIE) undertook a review of
the Commonwealth Government’s ‘e-government’ programs delivering on-line
services (NOIE 2003). The study considered the economic, financial and social
benefit/cost ratio for 38 e-government programs. The study found that of the 24
programs where a net financial benefit was expected the observed aggregate
benefit/cost ratio was 92.5 per cent. For the remaining programs the ratio was 61 per
cent. It was estimated that the benefits to the users of these services was $1.1 billion
dollars in 2002 (NOIE 2003)16.
2.4.6 Business-to-business (B2B) transactions
Productivity gains from B2B electronic commerce may be realised through cost
efficiencies from automation of transactions; competition provided by new market
intermediaries, consolidation of demand and supply through organised exchanges,
and improved vertical integration within firms (Lucking-Reiley and Spulber 2001).
The core innovation provided by the Internet is its role as an information and
communication tool, regardless of the goods being traded (Koivumäki et al. 2002). It
is through the separation of physical and information flows connected with each
transaction that the Internet provides an alternative way to trade goods and services,
16 Current dollar estimates.
32
with the transaction cost ultimately determining the choice of selling medium
(Garicano and Kaplan 2001).
Coordination costs are ‘...those `related to the need to determine prices and other
details of the transaction, to make the existence and location of potential buyers and
sellers known to one another, and to bring the buyers and sellers together to transact’
(Garicano and Kaplan 2001, p.463). Improved coordination costs can lower
transaction costs.
Garicano and Kaplan (2001) analysed the transaction costs of the wholesale used car
market in the US, which records around 9 million vehicle sales per year (as of 1999)
at an average value of just under $US14,000. They found that the costs of
coordinating sales and processing the final transactions were reduced by 80 per cent,
or the equivalent of 5 per cent of the car value.
Given price advantages of these magnitudes at the onset of the ‘on-line revolution’,
the massive growth in uptake that has been observed for business and consumers is
uncontroversial and predictable.
2.5 Growth of eCommerce
In 1991 there were fewer than 3 million Internet users worldwide. By 1999 this had
swelled to 250 million, with around a quarter making on-line purchases valued at
around $US110 billion (Coppel 2000). The OECD (1998a) forecast eCommerce sales
among OECD countries would jump from $US26 billion in 1996-97 to $US1,000
billion by 2003-05. The projected rises were expected to account for up to 15 per cent
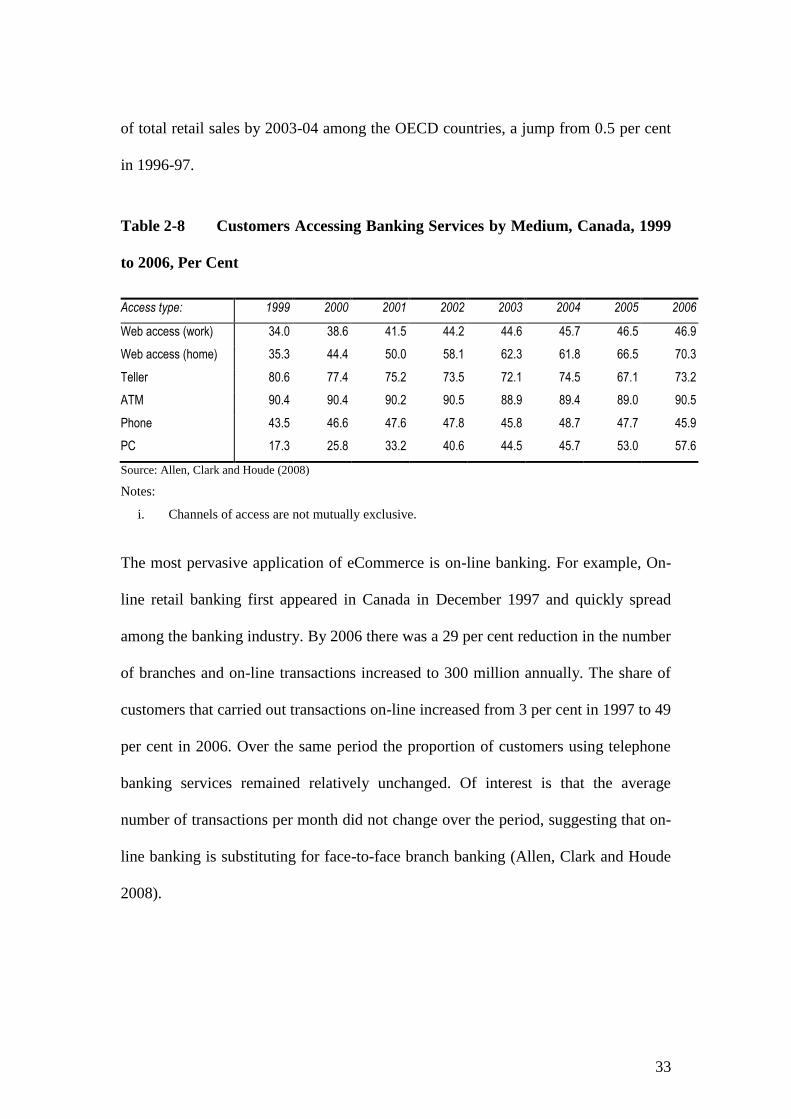
33
of total retail sales by 2003-04 among the OECD countries, a jump from 0.5 per cent
in 1996-97.
Table 2-8 Customers Accessing Banking Services by Medium, Canada, 1999
to 2006, Per Cent
Access type: 1999 2000 2001 2002 2003 2004 2005 2006
Web access (work) 34.0 38.6 41.5 44.2 44.6 45.7 46.5 46.9
Web access (home) 35.3 44.4 50.0 58.1 62.3 61.8 66.5 70.3
Teller 80.6 77.4 75.2 73.5 72.1 74.5 67.1 73.2
ATM 90.4 90.4 90.2 90.5 88.9 89.4 89.0 90.5
Phone 43.5 46.6 47.6 47.8 45.8 48.7 47.7 45.9
PC 17.3 25.8 33.2 40.6 44.5 45.7 53.0 57.6
Source: Allen, Clark and Houde (2008)
Notes:
i. Channels of access are not mutually exclusive.
The most pervasive application of eCommerce is on-line banking. For example, On-
line retail banking first appeared in Canada in December 1997 and quickly spread
among the banking industry. By 2006 there was a 29 per cent reduction in the number
of branches and on-line transactions increased to 300 million annually. The share of
customers that carried out transactions on-line increased from 3 per cent in 1997 to 49
per cent in 2006. Over the same period the proportion of customers using telephone
banking services remained relatively unchanged. Of interest is that the average
number of transactions per month did not change over the period, suggesting that on-
line banking is substituting for face-to-face branch banking (Allen, Clark and Houde
2008).
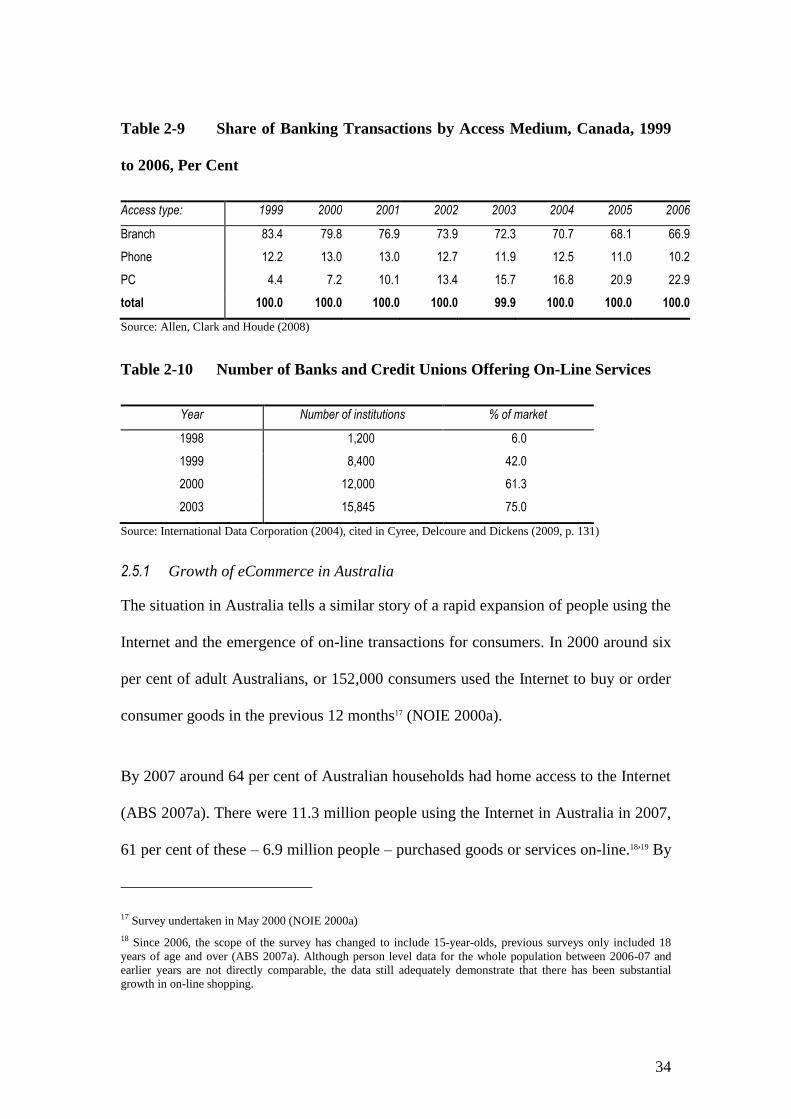
34
Table 2-9 Share of Banking Transactions by Access Medium, Canada, 1999
to 2006, Per Cent
Access type: 1999 2000 2001 2002 2003 2004 2005 2006
Branch 83.4 79.8 76.9 73.9 72.3 70.7 68.1 66.9
Phone 12.2 13.0 13.0 12.7 11.9 12.5 11.0 10.2
PC 4.4 7.2 10.1 13.4 15.7 16.8 20.9 22.9
total 100.0 100.0 100.0 100.0 99.9 100.0 100.0 100.0
Source: Allen, Clark and Houde (2008)
Table 2-10 Number of Banks and Credit Unions Offering On-Line Services
Year Number of institutions % of market
1998 1,200 6.0
1999 8,400 42.0
2000 12,000 61.3
2003 15,845 75.0
Source: International Data Corporation (2004), cited in Cyree, Delcoure and Dickens (2009, p. 131)
2.5.1 Growth of eCommerce in Australia
The situation in Australia tells a similar story of a rapid expansion of people using the
Internet and the emergence of on-line transactions for consumers. In 2000 around six
per cent of adult Australians, or 152,000 consumers used the Internet to buy or order
consumer goods in the previous 12 months17 (NOIE 2000a).
By 2007 around 64 per cent of Australian households had home access to the Internet
(ABS 2007a). There were 11.3 million people using the Internet in Australia in 2007,
61 per cent of these – 6.9 million people – purchased goods or services on-line.18,19 By
17 Survey undertaken in May 2000 (NOIE 2000a)
18 Since 2006, the scope of the survey has changed to include 15-year-olds, previous surveys only included 18
years of age and over (ABS 2007a). Although person level data for the whole population between 2006-07 and
earlier years are not directly comparable, the data still adequately demonstrate that there has been substantial
growth in on-line shopping.
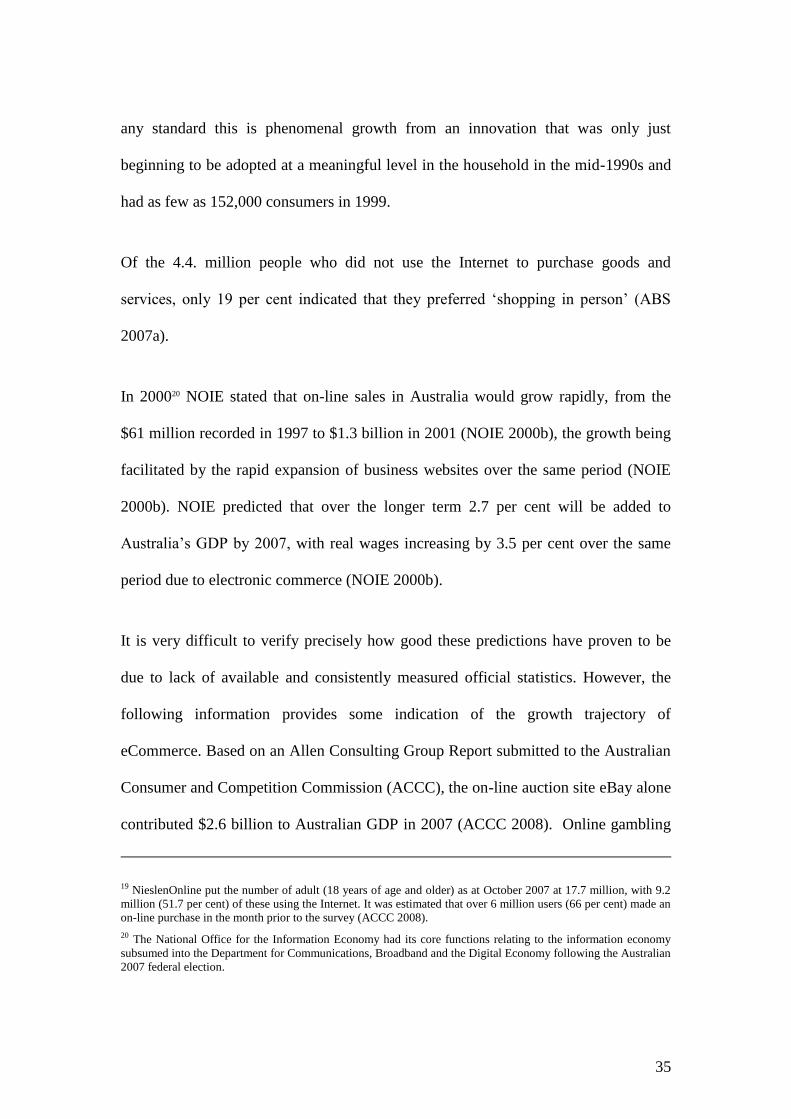
35
any standard this is phenomenal growth from an innovation that was only just
beginning to be adopted at a meaningful level in the household in the mid-1990s and
had as few as 152,000 consumers in 1999.
Of the 4.4. million people who did not use the Internet to purchase goods and
services, only 19 per cent indicated that they preferred ‘shopping in person’ (ABS
2007a).
In 200020 NOIE stated that on-line sales in Australia would grow rapidly, from the
$61 million recorded in 1997 to $1.3 billion in 2001 (NOIE 2000b), the growth being
facilitated by the rapid expansion of business websites over the same period (NOIE
2000b). NOIE predicted that over the longer term 2.7 per cent will be added to
Australia’s GDP by 2007, with real wages increasing by 3.5 per cent over the same
period due to electronic commerce (NOIE 2000b).
It is very difficult to verify precisely how good these predictions have proven to be
due to lack of available and consistently measured official statistics. However, the
following information provides some indication of the growth trajectory of
eCommerce. Based on an Allen Consulting Group Report submitted to the Australian
Consumer and Competition Commission (ACCC), the on-line auction site eBay alone
contributed $2.6 billion to Australian GDP in 2007 (ACCC 2008). Online gambling
19 NieslenOnline put the number of adult (18 years of age and older) as at October 2007 at 17.7 million, with 9.2
million (51.7 per cent) of these using the Internet. It was estimated that over 6 million users (66 per cent) made an
on-line purchase in the month prior to the survey (ACCC 2008).
20 The National Office for the Information Economy had its core functions relating to the information economy
subsumed into the Department for Communications, Broadband and the Digital Economy following the Australian
2007 federal election.
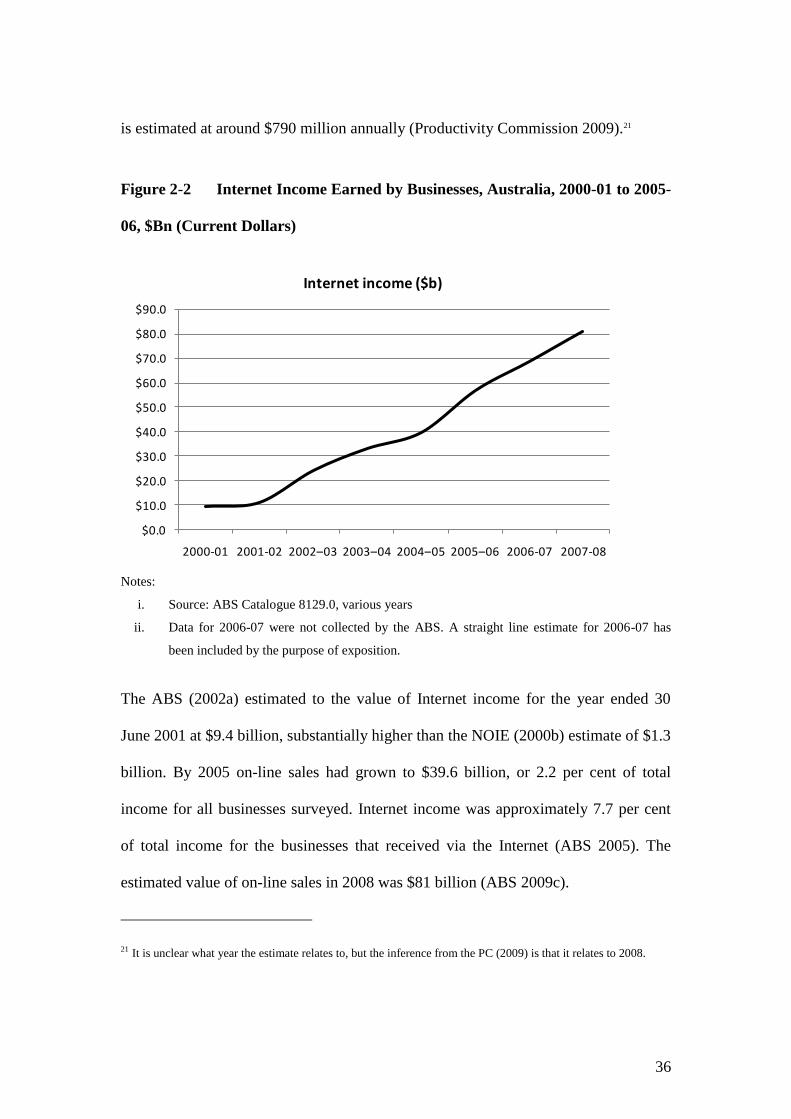
36
is estimated at around $790 million annually (Productivity Commission 2009).21
Figure 2-2 Internet Income Earned by Businesses, Australia, 2000-01 to 2005-
06, $Bn (Current Dollars)
Notes:
i. Source: ABS Catalogue 8129.0, various years
ii. Data for 2006-07 were not collected by the ABS. A straight line estimate for 2006-07 has
been included by the purpose of exposition.
The ABS (2002a) estimated to the value of Internet income for the year ended 30
June 2001 at $9.4 billion, substantially higher than the NOIE (2000b) estimate of $1.3
billion. By 2005 on-line sales had grown to $39.6 billion, or 2.2 per cent of total
income for all businesses surveyed. Internet income was approximately 7.7 per cent
of total income for the businesses that received via the Internet (ABS 2005). The
estimated value of on-line sales in 2008 was $81 billion (ABS 2009c).
21 It is unclear what year the estimate relates to, but the inference from the PC (2009) is that it relates to 2008.
$0.0
$10.0
$20.0
$30.0
$40.0
$50.0
$60.0
$70.0
$80.0
$90.0
2000-01 2001-02 2002–03 2003–04 2004–05 2005–06 2006-07 2007-08
Internet income ($b)
37
Using the experience of the US as a guide, in 2007 sales attributed to eCommerce for
the wholesaling sector was estimated to be 21.2 per cent of total sales. On-line sales
for the retail sector, assumed to be entirely from business to consumer, was 3.2 per
cent of total sales revenue, while for selected service industries the equivalent figure
was 1.6 per cent (US Census Bureau 2009). The growth from 2006 was in the order
of 15 to 22 per cent, suggesting the market has still not fully reached a saturation
point for penetration of eCommerce sales relative to traditional sales channels.
If Australia were to emulate the US experience, then continued and rapid growth is to
be expected for sales through on-line channels. The implications for the labour
market will be of great interest. The value adding and concomitant employment
profiles in the existing marketing chain could reasonably be expected to change
substantially.
2.6 Summary
There has been rapid and widespread diffusion of ICT across households and
businesses since its introduction in the early 1990s. Australia was second only to the
US in Internet usage by individuals in 2009, with 60 per cent of the population using
it, compared to 74 per cent of the US population. Only 50 per cent of the European
population used the Internet in 2009.
ICT have improved dramatically since their inception, particularly the Interent.
Download speeds increased by 15-fold between 1994 and 2007. Current federal
government policy is to extend network coverage to 100 per cent of Australian
households and increase speeds above the existing broadband speeds. In principle this

38
will broaden the capability, capacity and appeal of the Internet.
Despite high levels of household access there are still many households without
access to the Internet. Income, location, age and education all significantly affected
Internet adoption. Poorer neighbourhoods and certain regions have significantly lower
connection rates. For most households though, demand for broadband Internet
connection is income inelastic and clearly not considered a luxury good in the vast
majority of homes. This is significant for businesses as they look for commercial
opportunities to sell and communicate with consumers on-line.
The economics of eCommerce from both the consumer and producer perspectives
were outlined in this chapter, including evidence that there had been significant
improvements in convenience and costs for consumers and producers for some
transactions.
39
3 EMPLOYERS’ EARLY EXPECTATIONS OF
IMPACTS FROM ICT
3.1 Survey of Firms
In order to develop an understanding of employer expectations of the impact ICT
would have on skills and training, as part of this thesis a survey of employers was
undertaken in 2001.22 A total of 22 large employers were interviewed to obtain their
views on the expected impact of ICT on the workforce and their business. A wide
range of organisations from both the public and private sectors participated in the
case studies with total employment by the firms interviewed accounting for
approximately 70,000 people. The findings from these interviews have been grouped
into four broad areas:
changing skills composition;
quality and supply of information technology staff;
impact of eCommerce on organisations’ operations; and
threats posed by eCommerce
22 The survey was undertaken by the Centre for Labour Market Research as part of an Australian Research
Council funded Strategic Partnerships with Industry- Research and Training Scheme (SPIRT).
40
3.2 Potential Changes from ICT and eCommerce
The following channels were identified in the literature where ICT and eCommerce
would potentially change the internal make-up of organisations and firms:
new market opportunities;
increased staff productivity;
shorter product development times;
lower purchasing costs;
reduced inventory;
reduced costs for executing a sale;
cheaper product distribution; and
more effective and efficient customer support (OECD 1998a and US
Department of Commerce 1998)
Potential organisational changes identified by the OECD (1998b) included:
flatter hierarchies;
more horizontal inter-firm links for subcontracting, outsourcing and
collaboration;
better trained and more responsive employees;

41
more multi-skilling and job rotation, blurring differences among
traditional work activities; and
increase in small self-managing or autonomous work groups.
OECD (1998b) surveys show that the overall organisational flexibility associated
with the characteristics listed above have a positive impact on firm and establishment
performance, through, for example, higher labour productivity, increased sales and
reduced staff turnover.
3.3 Changing Skills Composition and Training Needs of the Workforce
In most cases the organisations interviewed for this study indicated that ICT were
unlikely to significantly change the core skills they require, or even that the
technology would reduce the overall size of their workforce. However, all of the
organisations interviewed confirmed that the skill composition of their workforce had
changed and would continue to change as they increased their utilisation of ICT and
eCommerce. The surveyed organisations reported that ICT accounted for
approximately 11 per cent of their total training expenditure. They also expected to
significantly increase their staff’s ICT skills over time, mostly acquired through in-
house training, including self-training.
Most organisations reported that they expected change to come from up-skilling their
existing workforce. That is, it would come about through evolving understanding of
ICT by all staff, not through changing the balance of employment between different
types of employees with different skill levels. Key areas in 2001 where change was
42
expected to take place included Internet, e-mail, word-processing and spreadsheet
applications.
Secretarial and document support activities were expected to decline in terms of
employment. Most staff, and especially management, who previously passed many
routine text and messaging tasks to support staff now have general ICT skills and
routinely do these tasks themselves.
There are a few specific instances where skills in organisations were changing
significantly as a result of the new technologies. For example, a large proportion of
transactions in supermarkets involved Electronic Funds Transfer Point of Sale
(EFTPOS) – a transaction that in the 1980s would have involved an additional
transaction with a bank teller to obtain funds. This is an interesting case where the
technology has required a simple change to the skill set in one industry, generally
removing the cognitive requirement for the transaction. However, its impact has
largely been reflected in another industry, namely banking. The number of bank
tellers has been slashed over the last three decades with the introduction of automatic
teller machines and EFTPOS (Norris, Kelly and Giles 2005).
Some of the surveyed firms indicated automation has routinised tasks like
stocktaking. In the past these tasks required relatively large numbers of low-skilled
labourers. Automation has both reduced the number of staff and changed the skills
required. What are now required are technical skills necessary to operate, service and
maintain the new systems: supporting the proposition that technology and skill are
complementary, while technology substitutes for unskilled labour.
43
3.4 Information Technology Staff, Quality and Supply
Many of the organisations interviewed expressed strong dissatisfaction with the
quality of IT staff available. A number of government agencies expressed concern at
being locked into given wage structures and unable to offer remuneration packages
equivalent to those available both privately and in some of the States. As a
consequence, the turnover of IT staff in government agencies was regarded as high
and, in general, the quality of those remaining considered low. In organisations, both
public and private, the response to the supply of quality IT personnel was to
outsource these functions. Large nation-wide firms were going through a process of
centralising their core IT functions to one location, usually in the State where their
headquarters were located. This option had become increasingly possible with the
development of more powerful and capable ICT. This enabled significant economies
of scale and better remuneration packages, which also helped to partially address the
quality issue.
3.5 Impact of eCommerce on the Organisation
All organisations reported that eCommerce had affected them in some way, although
there was a considerable spectrum of responses across different industries. The most
significant changes reported were by firms in the communications industry and the
banking and finance industry.
The general view was that movement towards eCommerce would accelerate, with
different organisations utilising ICT in their business processes in a number of
different ways. Most reported that conducting business on-line was of most benefit in
44
business-to-business dealings and in enhancing the internal operations of their
organisation. While many of the interviewed organisations had developed consumer
eCommerce sites, the utilisation rate at the time of interview was low.
Of the 22 organisations interviewed, only ten were using the Internet for customer
interaction. The functions that were most widely provided were receiving orders from
customers and on-line payment facilities.
A number of organisations reported a rapidly expanding use of ICT to support their
dealings with consumers over the telephone. The growth in the use of call centres
was seen as particularly significant. For example, using caller identification
techniques, customer name, address, account details and information on previous
enquiries and complaints enabled assessment of the value of the caller to be made
before the call was answered. This technique enabled optimal queuing of clients.
Other organisations, while not moving to call centres, recognised the potential of
telephone contact as an avenue for a significant flow of information, both to and from
customers, especially when combined with technology that allows for active data
entry and interchange.
Many of the interviewed firms reported the adoption of various eCommerce practices
to enhance their business-to-business dealings, especially for procurement purposes.
All the organisations that had taken up on-line procurement indicated significant cost
and efficiency improvements from doing so. The new ICT were also seen to be of
considerable value in fine-tuning supply chain management by opening up the lines
45
of communication between the original vendor and the final retail destination. This
had resulted in a reduction in the costs of storage, handling and wastage.
A total of 17 of the 22 surveyed organisations were using the Internet to buy goods
and services from other businesses. Purchasing information on-line and making
electronic payments were the areas in which the Internet was most frequently used for
interaction with other businesses.
Internal operations and communications were the areas in which new ICT were being
most extensively utilised. Particularly important in this regard was the increasing use
of Intranets. These systems generally provided information to staff on organisational
procedures and human resource functions.
In total 20 of the 22 organisations surveyed used an Intranet or the Internet for
internal operations. The most widely used functions were in distributing information
to staff and human resource management.
New or major revisions to websites were planned by 16 of the 22 organisations
studied. Only nine organisations reported no serious constraints to their ongoing web
development, while others identified a number of factors inhibiting website
development. These included available software, labour and capital cost, security
concerns and a lack of skills within the business. The planned website revisions were
not expected to affect staffing levels.
46
3.6 Does eCommerce Pose a Threat?
The organisations interviewed gave quite varied responses as to whether eCommerce
posed a threat. These responses fall into three general categories:
poses no threat;
poses a threat to their core business; and
is perceived to be a threat if not adopted.
3.6.1 eCommerce poses no threat
Organisations that had a large customer base and/or were supplying a product that
was not particularly adaptable to eCommerce sales did not perceive a threat. For this
class of firms the barriers to entry for eCommerce rivals often arise from the non-
tradeable nature of the products concerned or high transportation costs.
In some cases on-line sales were seen as possible; however, there was view that
customer preferences for seeing, handling or sampling products meant that the uptake
of on-line purchasing of these products would be relatively low. In this case the
barrier to entry by eCommerce rivals often has to do with the good being complex in
nature or being a so-called ‘experience’ good, rather than an inspection good.
Firms who did not view eCommerce as a threat also viewed it positively. The
common view was that it provided a way of improving their business processes,
increasing productivity, reducing costs and enhancing profitability. They did not see
eCommerce as a threat to their final sales.
3.6.2 Poses a threat to core business
The organisations that viewed eCommerce as a threat to their core business operated
47
in market segments where technological advances had the potential to provide easy
market entry by new competitors. One organisation saw the threat coming from ‘one
product busters’ – where a new small firm targets a single product from an extensive
range offered by incumbent firms.23 For this organisation eCommerce significantly
expanded the potential competition they faced from global suppliers. The latter are
regarded as being particularly attractive to the organisations’ large corporate
customers, particularly where the firm conducted a substantial amount of their
business in a variety of international locations.
The utilisation of technology, such as electronic funds transfers and video
conferencing, had made the use of an international supplier a stronger possibility. In
general it was felt that the new eCommerce competitors might take the more
profitable aspects of the company’s business and the ‘cream’ of their customers.
The case studies undertaken did not suggest major implications for industry structure.
In some industries it was thought that eCommerce would favour the entry of more
firms and increased competition. For others it was felt that eCommerce would
enhance the position of established players and may even lead to consolidation and
reduced competition.
3.6.3 eCommerce is a threat if not adopted
There was wide recognition across organisations and across industries that
eCommerce was more than a fad and that the way business was conducted and how
23 Note that this is another way of describing ‘hit and run’ entry (see Schwartz 1986).
48
organisations function would change. The general perception was that these changes
could lead to significant cost reductions and productivity advances. In short, there
was a recognition that the most important threat posed by eCommerce was not to
embrace the new technology. More generally, interviewed organisations indicated
that not taking up eCommerce would, over time, see them falling behind in terms of
productivity growth and gradually becoming uncompetitive.
A constraint to adoption of the technologies was absorbing the high initial costs of the
technology and determining the right time and technology in which to invest. Many
organisations reported that they were very reluctant to make the investment without a
sound business case. These organisations were in industries where eCommerce
appeared less likely to change core business activities and skills, such as the mining,
manufacturing and human services industries. For instance, one organisation saw the
reason for their relatively slow and low-level adoption of eCommerce as a result of
three related factors:
a lack of adoption by many of their customers;
the high cost of the technology meant that there needed to be significant
business benefits to justify the investment; and
they were waiting for the technology to be more appropriate and
affordable.
3.7 Summary
Surveys undertaken of major employers showed there was still uncertainty as late as
2001 as to whether customers would be fully engaged with the medium as a means to
purchase and interact. Nonetheless, the general view was that eCommerce would
49
mature and become an important facet of business. The data presented in Chapter 2
showed that the consumer market for personal computers, broadband Internet
connection, on-line purchasing and use of on-line services (e.g. on-line banking)
exploded over the last decade. The large-scale business investment in ICT and
eCommerce reported in Chapter 4 confirms that the expectations of firms’ established
in the survey were realised.
All organisations surveyed indicated that the skill composition of their workforce had
changed up to the time of survey and that their expectation was that it would continue
to change as they increased their utilisation of ICT and eCommerce. Interestingly,
firms indicated that the secretarial and document support activities in the firm would
decline in terms of employment. The evidence presented in Chapter 5 shows that this
was a well-established trend by 2001 and has continued to the present time. The
occupations that were affected are the Advanced Clerical and Service Workers; and
Elementary Clerical, Sales and Service Workers. Autor, Levy and Murnane (2003)
have argued that this was because these particular skills are easily automated due to
their routine nature.
50
4 BUSINESS USE OF TECHNOLOGY
4.1 Overview
As outlined in previous sections, it is clear that the Internet and eCommerce have
gained a foothold among consumers and continued to grow to levels where it is now
considered mainstream. Concerns expressed in the survey of businesses regarding
lack of adoption by customers would appear to have been assuaged by the level of
consumer acceptance of both the Internet and on-line purchasing.
It is apparent that in some applications eCommerce has changed the market place, for
example, on-line banking, EFTPOS and ATMs. The majority of households and
consumers have clearly embraced the opportunity to get connected to the Internet,
with a clear preference for the faster speeds of broadband as it became available (see
Table 2-2). On-line shopping opportunities are much broader than banking, accessing
government services, groceries, music, software, movies and many other items now
part of the mix. Indeed, the on-line auction sites such as eBay™
, with five million
users in 2007 (Jenkins 2007, ACCC 2008), have broadened the array of goods to
include ‘second-hand’ items of all descriptions.24
The adoption of on-line transactions, product-related research and accessing
government services could only occur if there was sufficient business investment in
ICT. Businesses have also embraced the Internet and put in place the systems and
infrastructure to enable eCommerce to expand the way it has. In addition, businesses
24 Note that sales on eBay and other auction sites are not restricted to used items.
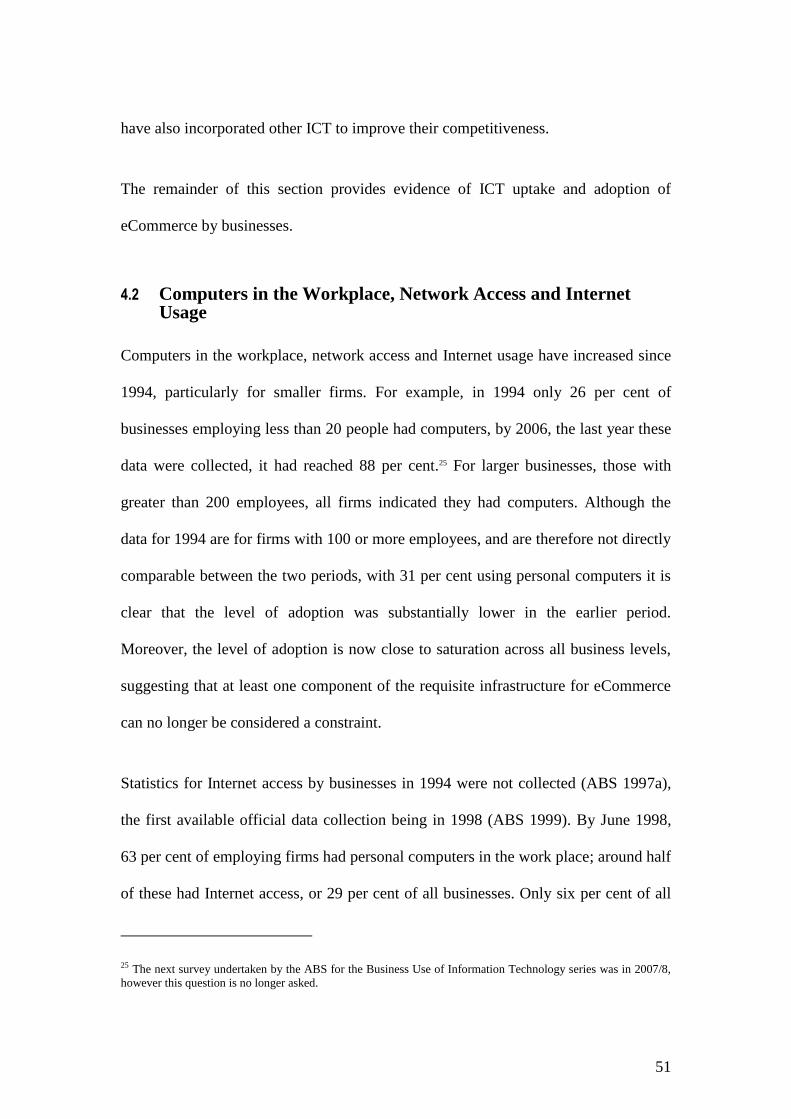
51
have also incorporated other ICT to improve their competitiveness.
The remainder of this section provides evidence of ICT uptake and adoption of
eCommerce by businesses.
4.2 Computers in the Workplace, Network Access and Internet Usage
Computers in the workplace, network access and Internet usage have increased since
1994, particularly for smaller firms. For example, in 1994 only 26 per cent of
businesses employing less than 20 people had computers, by 2006, the last year these
data were collected, it had reached 88 per cent.25 For larger businesses, those with
greater than 200 employees, all firms indicated they had computers. Although the
data for 1994 are for firms with 100 or more employees, and are therefore not directly
comparable between the two periods, with 31 per cent using personal computers it is
clear that the level of adoption was substantially lower in the earlier period.
Moreover, the level of adoption is now close to saturation across all business levels,
suggesting that at least one component of the requisite infrastructure for eCommerce
can no longer be considered a constraint.
Statistics for Internet access by businesses in 1994 were not collected (ABS 1997a),
the first available official data collection being in 1998 (ABS 1999). By June 1998,
63 per cent of employing firms had personal computers in the work place; around half
of these had Internet access, or 29 per cent of all businesses. Only six per cent of all
25 The next survey undertaken by the ABS for the Business Use of Information Technology series was in 2007/8,
however this question is no longer asked.
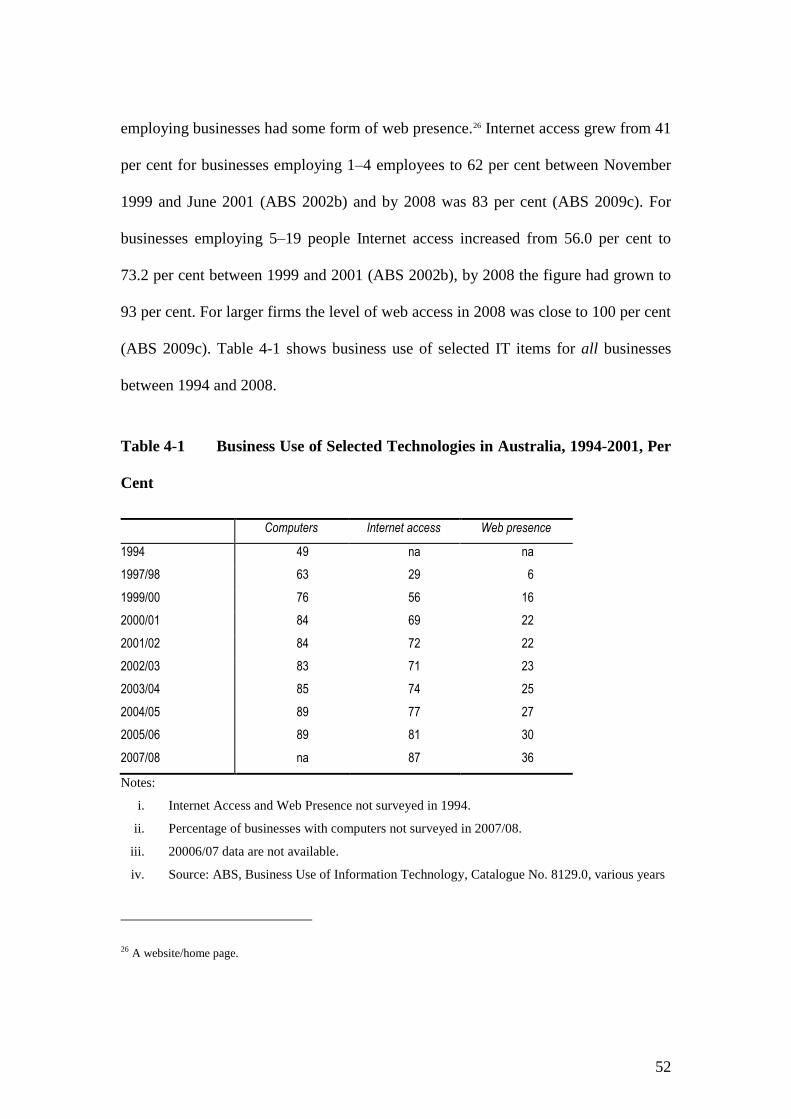
52
employing businesses had some form of web presence.26 Internet access grew from 41
per cent for businesses employing 1–4 employees to 62 per cent between November
1999 and June 2001 (ABS 2002b) and by 2008 was 83 per cent (ABS 2009c). For
businesses employing 5–19 people Internet access increased from 56.0 per cent to
73.2 per cent between 1999 and 2001 (ABS 2002b), by 2008 the figure had grown to
93 per cent. For larger firms the level of web access in 2008 was close to 100 per cent
(ABS 2009c). Table 4-1 shows business use of selected IT items for all businesses
between 1994 and 2008.
Table 4-1 Business Use of Selected Technologies in Australia, 1994-2001, Per
Cent
Computers Internet access Web presence
1994 49 na na
1997/98 63 29 6
1999/00 76 56 16
2000/01 84 69 22
2001/02 84 72 22
2002/03 83 71 23
2003/04 85 74 25
2004/05 89 77 27
2005/06 89 81 30
2007/08 na 87 36
Notes:
i. Internet Access and Web Presence not surveyed in 1994.
ii. Percentage of businesses with computers not surveyed in 2007/08.
iii. 20006/07 data are not available.
iv. Source: ABS, Business Use of Information Technology, Catalogue No. 8129.0, various years
26 A website/home page.
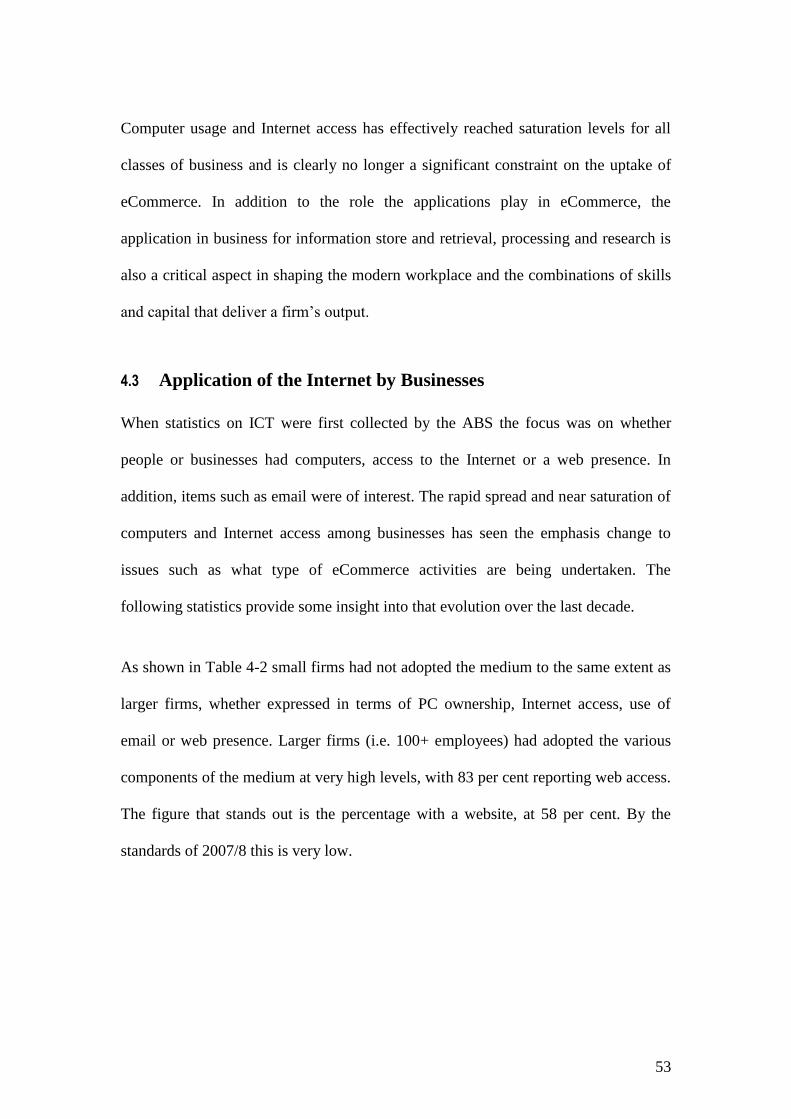
53
Computer usage and Internet access has effectively reached saturation levels for all
classes of business and is clearly no longer a significant constraint on the uptake of
eCommerce. In addition to the role the applications play in eCommerce, the
application in business for information store and retrieval, processing and research is
also a critical aspect in shaping the modern workplace and the combinations of skills
and capital that deliver a firm’s output.
4.3 Application of the Internet by Businesses
When statistics on ICT were first collected by the ABS the focus was on whether
people or businesses had computers, access to the Internet or a web presence. In
addition, items such as email were of interest. The rapid spread and near saturation of
computers and Internet access among businesses has seen the emphasis change to
issues such as what type of eCommerce activities are being undertaken. The
following statistics provide some insight into that evolution over the last decade.
As shown in Table 4-2 small firms had not adopted the medium to the same extent as
larger firms, whether expressed in terms of PC ownership, Internet access, use of
email or web presence. Larger firms (i.e. 100+ employees) had adopted the various
components of the medium at very high levels, with 83 per cent reporting web access.
The figure that stands out is the percentage with a website, at 58 per cent. By the
standards of 2007/8 this is very low.
54
Table 4-2 Business Use of PCs and the Internet, by Employment Size, 1998
PCs LAN/WAN Internet
access
access
Web
access
Website Number of
businesses
employees % % % % % % ’000
1–4 55 11 24 23 21 4 390
5–19 75 32 32 31 28 8 171
20–99 91 50 56 54 49 21 37
100 + 100 86 87 85 83 58 5
Total 63 20 29 28 25 6 603
Source: ABS (1999)
Table 4-3 Business Use of Selected Technologies, by Employment Size, 2007–
08
Businesses with: Businesses which:
Estimated number
of businesses
Internet access web presence placed orders via
the Internet or
web
received orders
via the Internet or
web
'000 % % % %
Employment size
0–4 persons 451 82.8 26.8 36.9 20.5
5–19 persons 197 92.3 48.3 50.5 28.6
20–199 persons 60 97.5 65.4 59.3 31.6
200 or more persons 3 99.3 95.8 70.7 28.6
Source: ABS (2009c)
As shown in Table 4-3, 26.8 per cent of micro-businesses (0–4 employees) had a web
presence, rising to 95.8 per cent for businesses with 200 or more employees. Also
shown in Table 4-3 are the percentage of businesses receiving or placing orders over
the Internet or web. There appears to be a clear and positive link between placing
orders over the Internet and firm size – 36.9 per cent of businesses employing 0–4
employees and 70.7 per cent for firms employing 200 or people. The percentage of
businesses that receive orders over the Internet is significantly lower, only 20.5 per
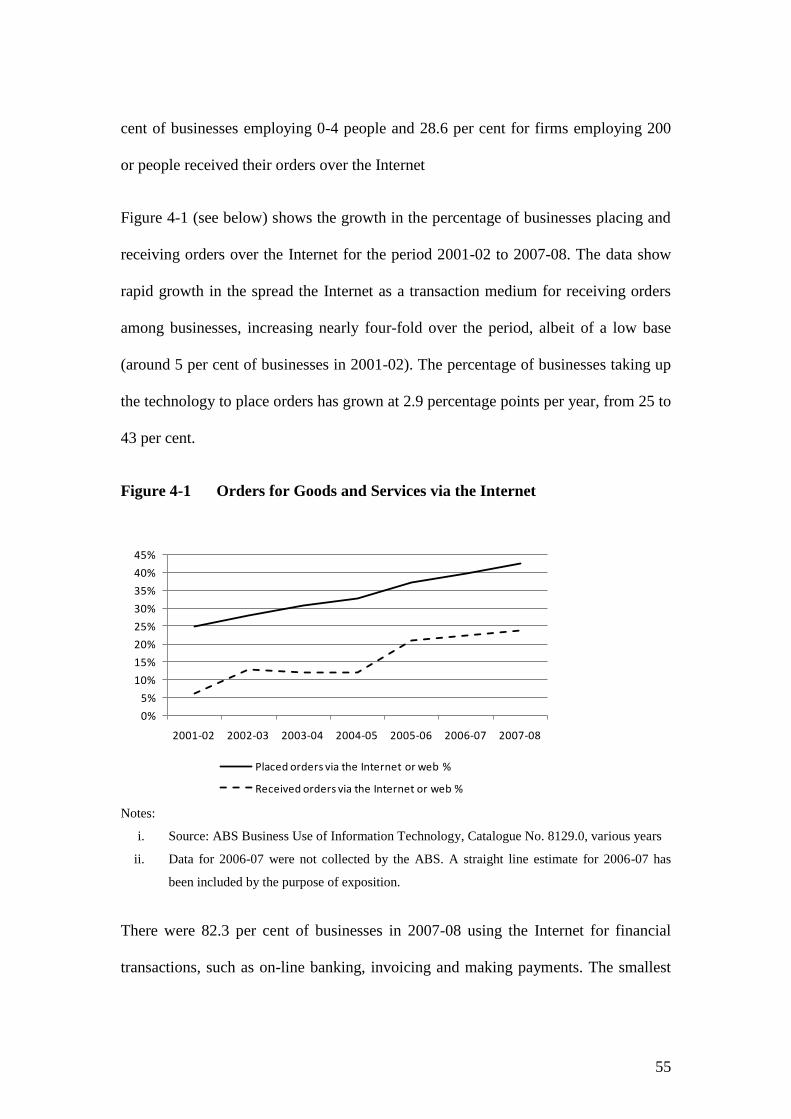
55
cent of businesses employing 0-4 people and 28.6 per cent for firms employing 200
or people received their orders over the Internet
Figure 4-1 (see below) shows the growth in the percentage of businesses placing and
receiving orders over the Internet for the period 2001-02 to 2007-08. The data show
rapid growth in the spread the Internet as a transaction medium for receiving orders
among businesses, increasing nearly four-fold over the period, albeit of a low base
(around 5 per cent of businesses in 2001-02). The percentage of businesses taking up
the technology to place orders has grown at 2.9 percentage points per year, from 25 to
43 per cent.
Figure 4-1 Orders for Goods and Services via the Internet
Notes:
i. Source: ABS Business Use of Information Technology, Catalogue No. 8129.0, various years
ii. Data for 2006-07 were not collected by the ABS. A straight line estimate for 2006-07 has
been included by the purpose of exposition.
There were 82.3 per cent of businesses in 2007-08 using the Internet for financial
transactions, such as on-line banking, invoicing and making payments. The smallest
0%
5%
10%
15%
20%
25%
30%
35%
40%
45%
2001-02 2002-03 2003-04 2004-05 2005-06 2006-07 2007-08
Placed orders via the Internet or web %
Received orders via the Internet or web %
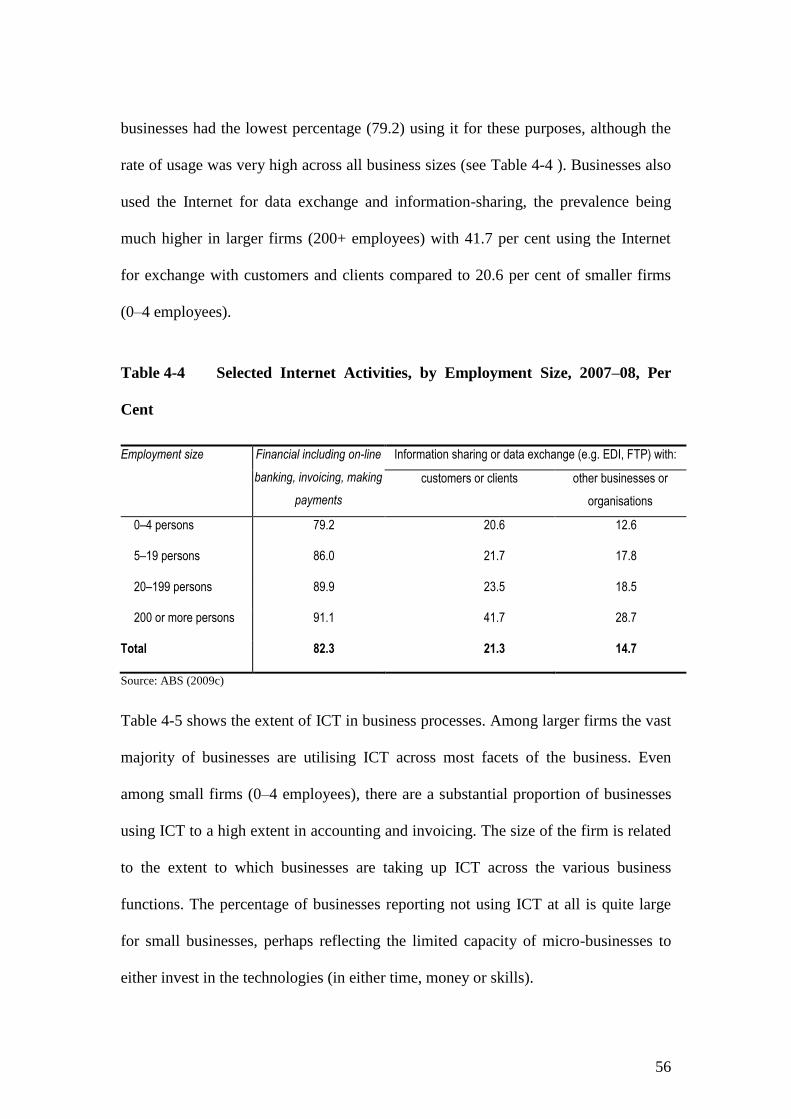
56
businesses had the lowest percentage (79.2) using it for these purposes, although the
rate of usage was very high across all business sizes (see Table 4-4 ). Businesses also
used the Internet for data exchange and information-sharing, the prevalence being
much higher in larger firms (200+ employees) with 41.7 per cent using the Internet
for exchange with customers and clients compared to 20.6 per cent of smaller firms
(0–4 employees).
Table 4-4 Selected Internet Activities, by Employment Size, 2007–08, Per
Cent
Employment size Financial including on-line
banking, invoicing, making
payments
Information sharing or data exchange (e.g. EDI, FTP) with:
customers or clients other businesses or
organisations
0–4 persons 79.2 20.6 12.6
5–19 persons 86.0 21.7 17.8
20–199 persons 89.9 23.5 18.5
200 or more persons 91.1 41.7 28.7
Total 82.3 21.3 14.7
Source: ABS (2009c)
Table 4-5 shows the extent of ICT in business processes. Among larger firms the vast
majority of businesses are utilising ICT across most facets of the business. Even
among small firms (0–4 employees), there are a substantial proportion of businesses
using ICT to a high extent in accounting and invoicing. The size of the firm is related
to the extent to which businesses are taking up ICT across the various business
functions. The percentage of businesses reporting not using ICT at all is quite large
for small businesses, perhaps reflecting the limited capacity of micro-businesses to
either invest in the technologies (in either time, money or skills).
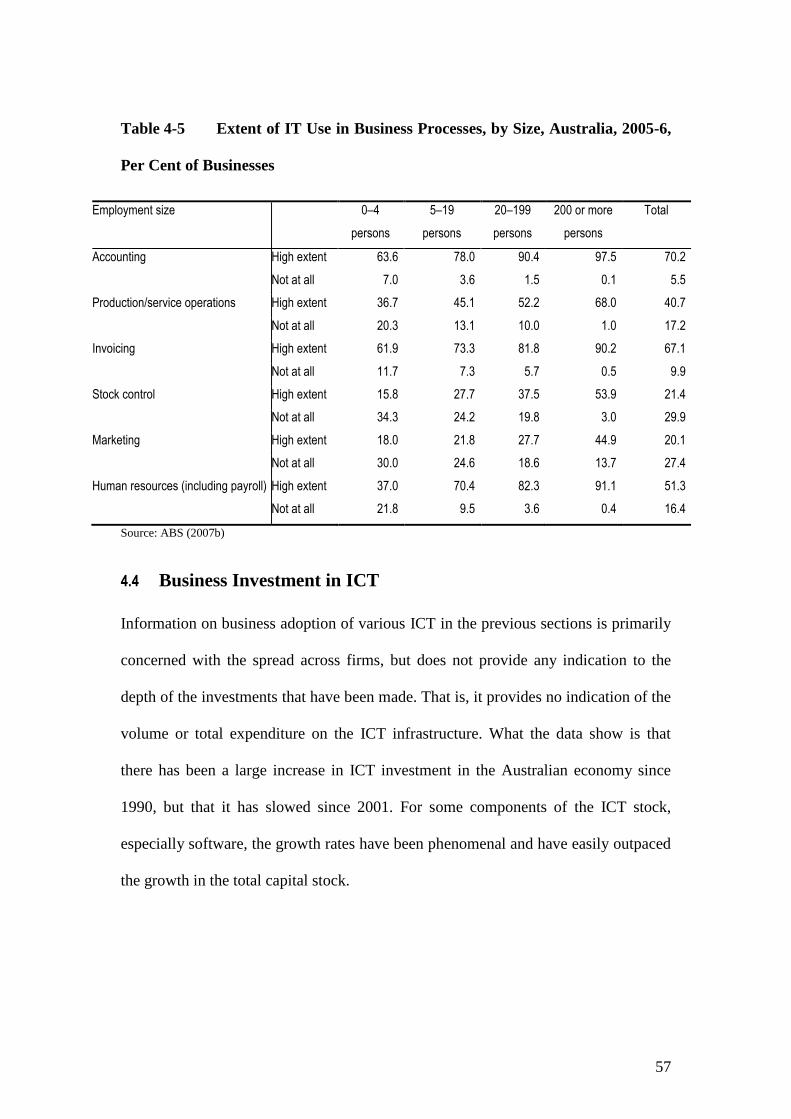
57
Table 4-5 Extent of IT Use in Business Processes, by Size, Australia, 2005-6,
Per Cent of Businesses
Employment size 0–4
persons
5–19
persons
20–199
persons
200 or more
persons
Total
Accounting High extent 63.6 78.0 90.4 97.5 70.2
Not at all 7.0 3.6 1.5 0.1 5.5
Production/service operations High extent 36.7 45.1 52.2 68.0 40.7
Not at all 20.3 13.1 10.0 1.0 17.2
Invoicing High extent 61.9 73.3 81.8 90.2 67.1
Not at all 11.7 7.3 5.7 0.5 9.9
Stock control High extent 15.8 27.7 37.5 53.9 21.4
Not at all 34.3 24.2 19.8 3.0 29.9
Marketing High extent 18.0 21.8 27.7 44.9 20.1
Not at all 30.0 24.6 18.6 13.7 27.4
Human resources (including payroll) High extent 37.0 70.4 82.3 91.1 51.3
Not at all 21.8 9.5 3.6 0.4 16.4
Source: ABS (2007b)
4.4 Business Investment in ICT
Information on business adoption of various ICT in the previous sections is primarily
concerned with the spread across firms, but does not provide any indication to the
depth of the investments that have been made. That is, it provides no indication of the
volume or total expenditure on the ICT infrastructure. What the data show is that
there has been a large increase in ICT investment in the Australian economy since
1990, but that it has slowed since 2001. For some components of the ICT stock,
especially software, the growth rates have been phenomenal and have easily outpaced
the growth in the total capital stock.
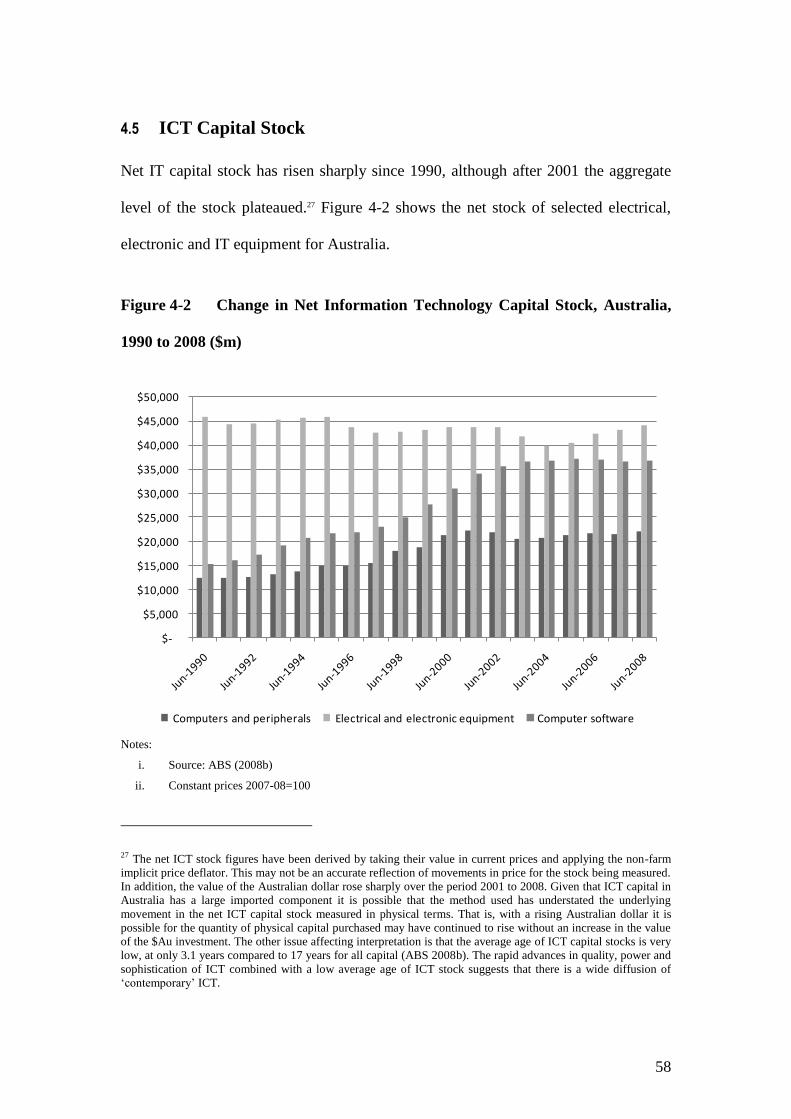
58
$-
$5,000
$10,000
$15,000
$20,000
$25,000
$30,000
$35,000
$40,000
$45,000
$50,000
Computers and peripherals Electrical and electronic equipment Computer software
4.5 ICT Capital Stock
Net IT capital stock has risen sharply since 1990, although after 2001 the aggregate
level of the stock plateaued.27 Figure 4-2 shows the net stock of selected electrical,
electronic and IT equipment for Australia.
Figure 4-2 Change in Net Information Technology Capital Stock, Australia,
1990 to 2008 ($m)
Notes:
i. Source: ABS (2008b)
ii. Constant prices 2007-08=100
27 The net ICT stock figures have been derived by taking their value in current prices and applying the non-farm
implicit price deflator. This may not be an accurate reflection of movements in price for the stock being measured.
In addition, the value of the Australian dollar rose sharply over the period 2001 to 2008. Given that ICT capital in
Australia has a large imported component it is possible that the method used has understated the underlying
movement in the net ICT capital stock measured in physical terms. That is, with a rising Australian dollar it is
possible for the quantity of physical capital purchased may have continued to rise without an increase in the value
of the $Au investment. The other issue affecting interpretation is that the average age of ICT capital stocks is very
low, at only 3.1 years compared to 17 years for all capital (ABS 2008b). The rapid advances in quality, power and
sophistication of ICT combined with a low average age of ICT stock suggests that there is a wide diffusion of
‘contemporary’ ICT.
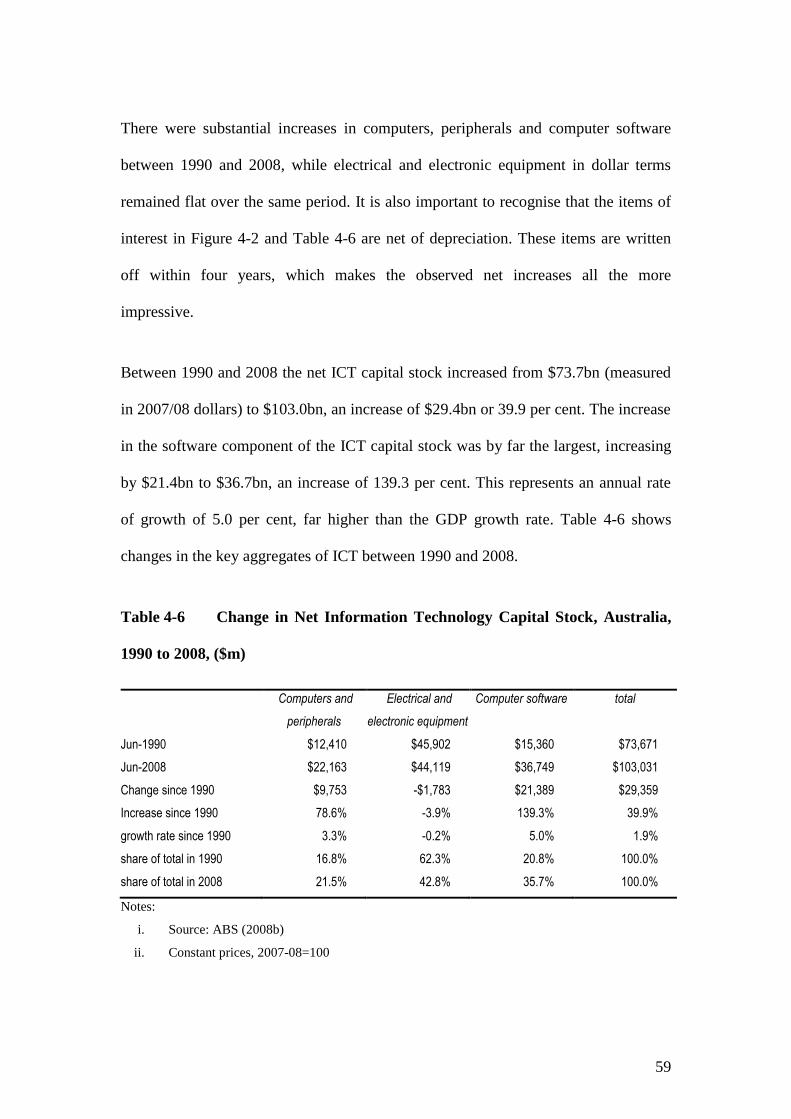
59
There were substantial increases in computers, peripherals and computer software
between 1990 and 2008, while electrical and electronic equipment in dollar terms
remained flat over the same period. It is also important to recognise that the items of
interest in Figure 4-2 and Table 4-6 are net of depreciation. These items are written
off within four years, which makes the observed net increases all the more
impressive.
Between 1990 and 2008 the net ICT capital stock increased from $73.7bn (measured
in 2007/08 dollars) to $103.0bn, an increase of $29.4bn or 39.9 per cent. The increase
in the software component of the ICT capital stock was by far the largest, increasing
by $21.4bn to $36.7bn, an increase of 139.3 per cent. This represents an annual rate
of growth of 5.0 per cent, far higher than the GDP growth rate. Table 4-6 shows
changes in the key aggregates of ICT between 1990 and 2008.
Table 4-6 Change in Net Information Technology Capital Stock, Australia,
1990 to 2008, ($m)
Computers and
peripherals
Electrical and
electronic equipment
Computer software total
Jun-1990 $12,410 $45,902 $15,360 $73,671
Jun-2008 $22,163 $44,119 $36,749 $103,031
Change since 1990 $9,753 -$1,783 $21,389 $29,359
Increase since 1990 78.6% -3.9% 139.3% 39.9%
growth rate since 1990 3.3% -0.2% 5.0% 1.9%
share of total in 1990 16.8% 62.3% 20.8% 100.0%
share of total in 2008 21.5% 42.8% 35.7% 100.0%
Notes:
i. Source: ABS (2008b)
ii. Constant prices, 2007-08=100
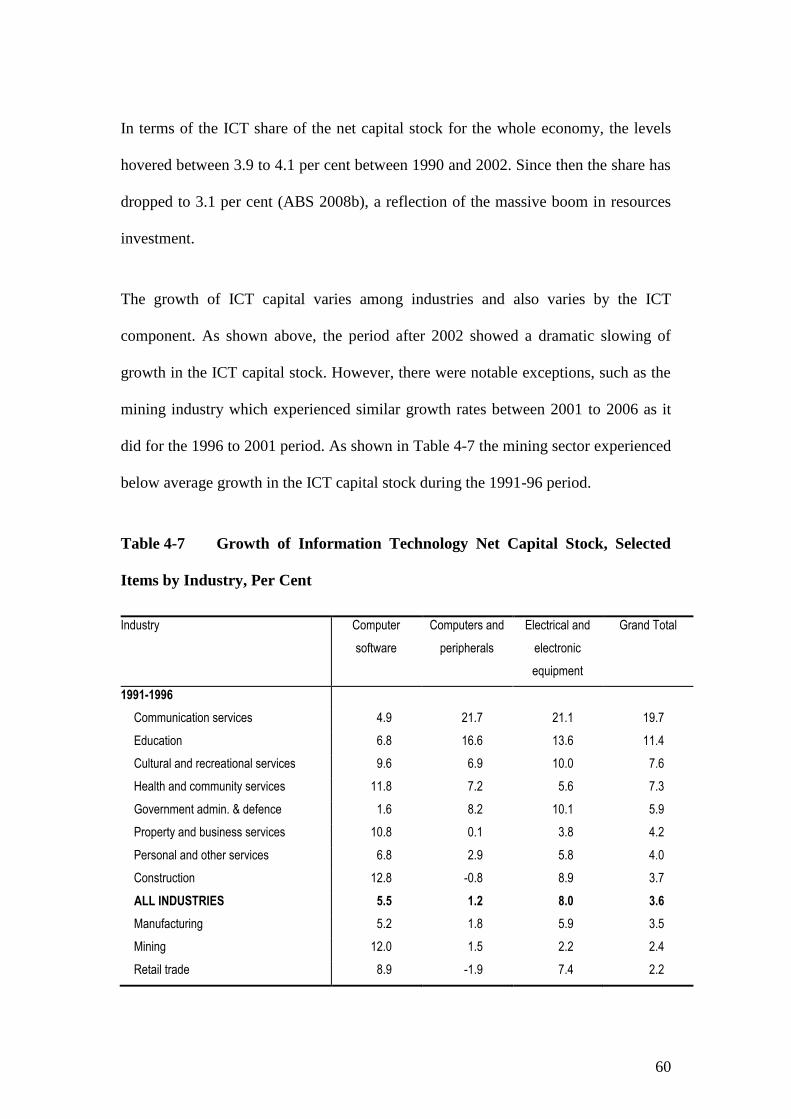
60
In terms of the ICT share of the net capital stock for the whole economy, the levels
hovered between 3.9 to 4.1 per cent between 1990 and 2002. Since then the share has
dropped to 3.1 per cent (ABS 2008b), a reflection of the massive boom in resources
investment.
The growth of ICT capital varies among industries and also varies by the ICT
component. As shown above, the period after 2002 showed a dramatic slowing of
growth in the ICT capital stock. However, there were notable exceptions, such as the
mining industry which experienced similar growth rates between 2001 to 2006 as it
did for the 1996 to 2001 period. As shown in Table 4-7 the mining sector experienced
below average growth in the ICT capital stock during the 1991-96 period.
Table 4-7 Growth of Information Technology Net Capital Stock, Selected
Items by Industry, Per Cent
Industry Computer
software
Computers and
peripherals
Electrical and
electronic
equipment
Grand Total
1991-1996
Communication services 4.9 21.7 21.1 19.7
Education 6.8 16.6 13.6 11.4
Cultural and recreational services 9.6 6.9 10.0 7.6
Health and community services 11.8 7.2 5.6 7.3
Government admin. & defence 1.6 8.2 10.1 5.9
Property and business services 10.8 0.1 3.8 4.2
Personal and other services 6.8 2.9 5.8 4.0
Construction 12.8 -0.8 8.9 3.7
ALL INDUSTRIES 5.5 1.2 8.0 3.6
Manufacturing 5.2 1.8 5.9 3.5
Mining 12.0 1.5 2.2 2.4
Retail trade 8.9 -1.9 7.4 2.2
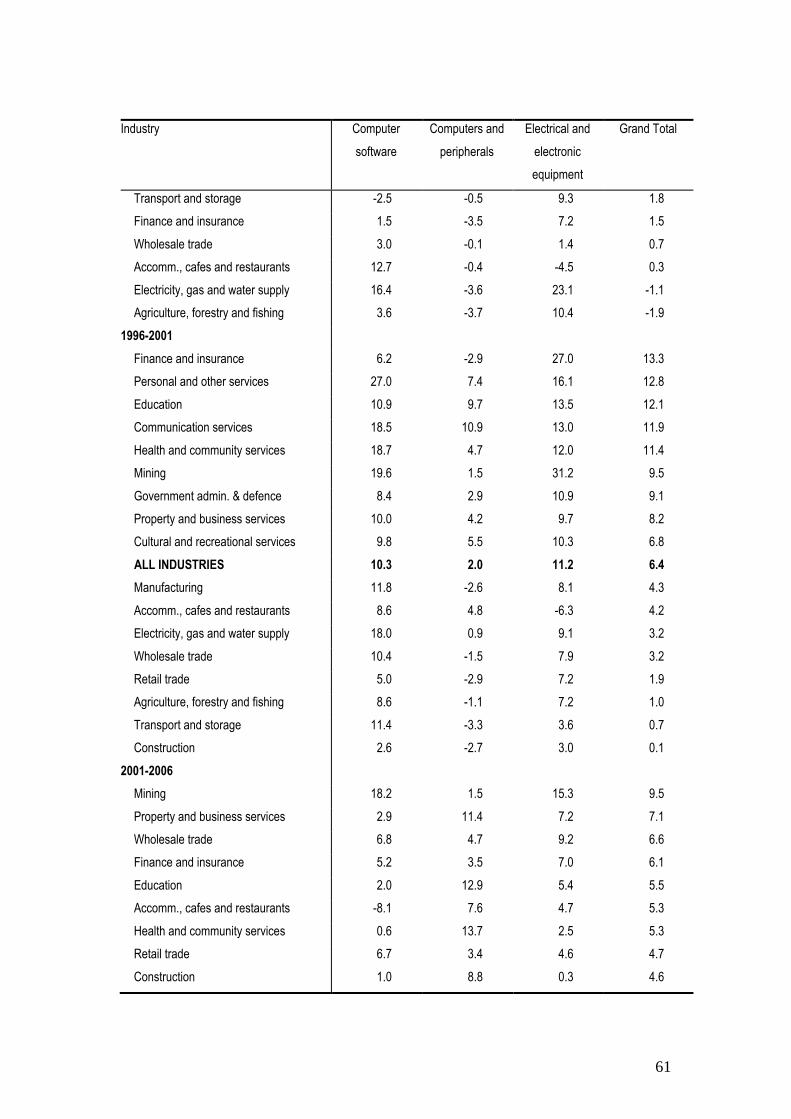
61
Industry Computer
software
Computers and
peripherals
Electrical and
electronic
equipment
Grand Total
Transport and storage -2.5 -0.5 9.3 1.8
Finance and insurance 1.5 -3.5 7.2 1.5
Wholesale trade 3.0 -0.1 1.4 0.7
Accomm., cafes and restaurants 12.7 -0.4 -4.5 0.3
Electricity, gas and water supply 16.4 -3.6 23.1 -1.1
Agriculture, forestry and fishing 3.6 -3.7 10.4 -1.9
1996-2001
Finance and insurance 6.2 -2.9 27.0 13.3
Personal and other services 27.0 7.4 16.1 12.8
Education 10.9 9.7 13.5 12.1
Communication services 18.5 10.9 13.0 11.9
Health and community services 18.7 4.7 12.0 11.4
Mining 19.6 1.5 31.2 9.5
Government admin. & defence 8.4 2.9 10.9 9.1
Property and business services 10.0 4.2 9.7 8.2
Cultural and recreational services 9.8 5.5 10.3 6.8
ALL INDUSTRIES 10.3 2.0 11.2 6.4
Manufacturing 11.8 -2.6 8.1 4.3
Accomm., cafes and restaurants 8.6 4.8 -6.3 4.2
Electricity, gas and water supply 18.0 0.9 9.1 3.2
Wholesale trade 10.4 -1.5 7.9 3.2
Retail trade 5.0 -2.9 7.2 1.9
Agriculture, forestry and fishing 8.6 -1.1 7.2 1.0
Transport and storage 11.4 -3.3 3.6 0.7
Construction 2.6 -2.7 3.0 0.1
2001-2006
Mining 18.2 1.5 15.3 9.5
Property and business services 2.9 11.4 7.2 7.1
Wholesale trade 6.8 4.7 9.2 6.6
Finance and insurance 5.2 3.5 7.0 6.1
Education 2.0 12.9 5.4 5.5
Accomm., cafes and restaurants -8.1 7.6 4.7 5.3
Health and community services 0.6 13.7 2.5 5.3
Retail trade 6.7 3.4 4.6 4.7
Construction 1.0 8.8 0.3 4.6
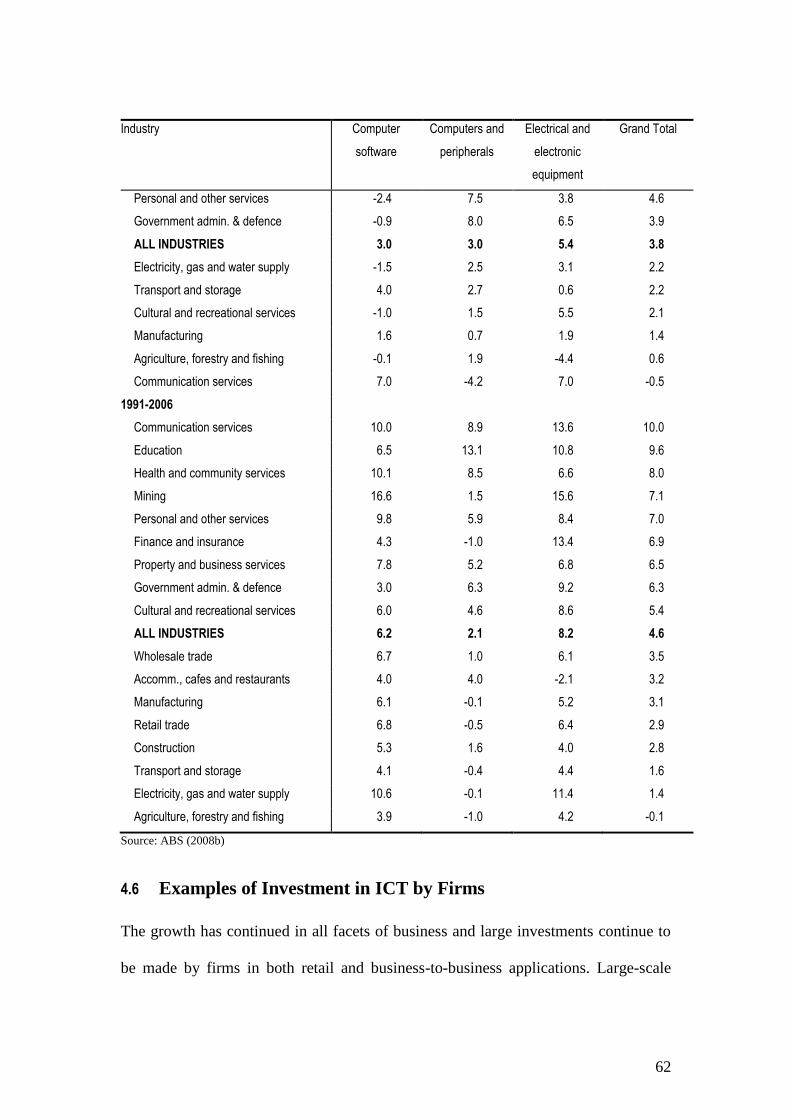
62
Industry Computer
software
Computers and
peripherals
Electrical and
electronic
equipment
Grand Total
Personal and other services -2.4 7.5 3.8 4.6
Government admin. & defence -0.9 8.0 6.5 3.9
ALL INDUSTRIES 3.0 3.0 5.4 3.8
Electricity, gas and water supply -1.5 2.5 3.1 2.2
Transport and storage 4.0 2.7 0.6 2.2
Cultural and recreational services -1.0 1.5 5.5 2.1
Manufacturing 1.6 0.7 1.9 1.4
Agriculture, forestry and fishing -0.1 1.9 -4.4 0.6
Communication services 7.0 -4.2 7.0 -0.5
1991-2006
Communication services 10.0 8.9 13.6 10.0
Education 6.5 13.1 10.8 9.6
Health and community services 10.1 8.5 6.6 8.0
Mining 16.6 1.5 15.6 7.1
Personal and other services 9.8 5.9 8.4 7.0
Finance and insurance 4.3 -1.0 13.4 6.9
Property and business services 7.8 5.2 6.8 6.5
Government admin. & defence 3.0 6.3 9.2 6.3
Cultural and recreational services 6.0 4.6 8.6 5.4
ALL INDUSTRIES 6.2 2.1 8.2 4.6
Wholesale trade 6.7 1.0 6.1 3.5
Accomm., cafes and restaurants 4.0 4.0 -2.1 3.2
Manufacturing 6.1 -0.1 5.2 3.1
Retail trade 6.8 -0.5 6.4 2.9
Construction 5.3 1.6 4.0 2.8
Transport and storage 4.1 -0.4 4.4 1.6
Electricity, gas and water supply 10.6 -0.1 11.4 1.4
Agriculture, forestry and fishing 3.9 -1.0 4.2 -0.1
Source: ABS (2008b)
4.6 Examples of Investment in ICT by Firms
The growth has continued in all facets of business and large investments continue to
be made by firms in both retail and business-to-business applications. Large-scale

63
examples include Rio Tinto’s push to automate its mining operations. Rio Tinto in
January 2008 announced it had been involved in a decade long project to automate its
iron ore mining operations in the Pilbara region of Western Australia (Rio Tinto
2008):
Key building blocks for automated mine-to-port iron ore operations are being
commissioned by Rio Tinto. These include:
mine operations in the Pilbara to be controlled 1,300 kilometres away at a new
centre in Perth;
driverless trains to carry iron ore on most of the 1,200 km of track;
driverless ‘intelligent’ truck fleet; and
remote control ‘intelligent’ drills.
The main components of the mine were being commissioned over 2008 and 2009.
The main feature of the automation is that it will be controlled from a Remote
Operations Centre in Perth, Western Australia with approximately 320 staff.
Australia’s largest retailer, Woolworths, has invested heavily in ICT since 2000 to
improve its supply chain management. It reduced its cost base by around $3.6 billion
in the six years to 2006. Its profitability relative to its major competitor, Cole, was in
the order of 20 per cent higher in 2006 (Mitchell 2006). Since 2006, the company has
continued to extract further benefits from its ITC investments on supply change

64
management, a further $1.3 billion in 2006-7, and it has announced plans to further
ramp up investment in 2009 to $374 million as part of $1 billion upgrade of the
existing supply chain management system (Woodhead 2008).
One of the more prominent applications of the Internet has been the development of
on-line banking. In 1999, around 8 per cent of Australian adults used the Internet for
the payment of bills or to transfer funds, compared to 73 per cent for Automatic
Telling Machines (ATM) and 73 per cent for Electronic Fund Transfers-Point Of Sale
(EFTPOS) (ABS 2000).
The DBCDE (2009) case studies report the Commonwealth Bank of Australia as
having 11 million customers; over 4 million of these use on-line services, 50 per cent
using them on a daily basis. The CBA report 60,000 new applications per month to
register for on-line banking services. The CBA report two major benefits as:
lower cost per transaction;
higher rates of accuracy; and
lower customer management costs (due to customer self-service on-line).
The interaction between government and the community is another area where the
Internet has transformed the economics of communication and service delivery, as
reported by the DBCDE (2009):
The Internet is now the most common way Australians last made contact with
government. Thirty-eight per cent of people used the Internet for their last contact with
government in 2008, which is double the number from 2004. In fact, more people would

65
prefer to use the Internet to contact government than by any other means. In addition,
those who used the Internet to contact the government reported a higher level of
satisfaction than those who used other means, such as postal services. The relationship
between Australia’s citizens and its Government is well suited to transition to the digital
economy. (p.11)
4.7 Summary
In 1994 when the Internet first started to roll out to the mass market in Australia it
was unclear what impact the new medium would have and how wide its reach would
ultimately be. However, the data presented in this chapter clearly show that the
Internet, PCs, ICT more generally and eCommerce is now used extensively across the
economy; by consumers, businesses and government.
Only at the lower income levels is there still scope for further growth in PC
ownership. Broadband Internet connections are rapidly increasing and are now being
used by the majority of Internet users. The Commonwealth Government is also
preparing to extend broadband access at much higher speeds than are currently
available across the entire country. The government has announced it will establish a
new company that will invest up to $43 billion over eight years to build and operate a
national broadband network delivering superfast broadband to Australian homes and
workplaces (DCBDE 2009). Finally, the type of investment and levels of capital
stock have varied substantially between industries. This is likely to have impacted on
the nature of skills in demand and the degree of substitution between capital and
labour, or more specifically, skill.

66
5 THE AUSTRALIAN LABOUR MARKET
5.1 Overview
In the previous chapter the substantial changes occurring in ICT investment by
businesses, the rise of eCommerce and the rapid uptake of the new technologies by
households were outlined. The expectation is that these developments, along with
other influences on labour demand, will have impacted to some extent on the labour
market, particularly in relation to skills. The purpose of this chapter is to examine the
structure of the Australian labour market and explore the key changes since the
1980s.28
The Australian labour market has changed dramatically since the 1980s. The changes
have occurred across a number of different aspects of the labour market, including the
profile of occupations within and across industries, investments in human capital,
labour force participation rates for women, increased casual employment, industrial
relations and regulation. There has been a substantial rise in the level of output and
employment in the economy and with it average real incomes, due in part to sustained
increases in productivity.
Despite the substantial growth in employment that has occurred, there are some
occupations and areas where there has been a significant dislocation and structural
shift in the economy. For example, of the nine major occupational groups,
28 Note that although the focus of the thesis is the post-1990 period, many of the major reforms affecting the
Australian economy, especially those affecting the labour market, took root in the 1980s. Therefore, a more
complete understanding of the microeconomic reform agenda and how it has impacted on the structure and
performance of labour through the 1990s and beyond is provided by examining the pre-1990 developments.

67
Administrative and Clerical Workers experienced a decline in total employment over
the last 20 years, the only occupational group to do so (ABS 2007c). This is quite
incredible given the average annual growth rate of GDP29 over the period was 3.2 per
cent (ABS 2009d) and total employment growth went from 7.9 million persons to
10.9 million persons between 1989 and 2009, an increase of three million people in
employment (ABS 2010a). What makes this result even more striking is that the
major shift in the economy was towards service sector employment, traditionally a
major employer of this occupational group. Clearly there must have been a major and
pervasive technological innovation for this to occur. As outlined in the last chapter,
ICT are the most likely driver.
The major structural change has been a shift in relative employment away from
agriculture and manufacturing industries and a continuation of the long-running
increase in service sector employment (ABS 2009e). On the industrial relations front,
union membership has fallen to historical lows. The remainder of this chapter
examines education and training, microeconomic reform, industrial relations,
productivity growth and the employment structure of the economy.
The key finding is that microeconomic reforms and the large-scale deployment and
deepening of ICT capital have had substantial effects on the growth rate of output for
the economy, through multifactor productivity and in particular labour productivity.30
Moreover, the employment structure, both in terms of industry and occupational
29 Gross domestic product - Expenditure based, GDP(E), Chain volume measure (ABS 2009e).
30 The ABS Labour productivity estimates are indexes of real GDP per unit of labour, typically per employee or
per hour worked. Multi-factor productivity estimates indexes of real GDP per combined unit of labour and capital
(ABS 2007d)
68
composition, has been significantly altered. This is likely to be reflected in the skills
utilised in the production of goods and services. The determinants of observed
changes in skill are tested more formally in Chapter 9.
5.2 Microeconomic Reform
Microeconomic reform refers to changes in government polices and institutional
features that affect the production and pricing behaviour of firms, industries,
individuals and households (Productivity Commission 1999). The rationale for
microeconomic reform is to improve allocative (Borland 2001; Simshauser 2005) and
technical efficiency (Karunaratne 2007) and, as a consequence, per capita income
(Adams, Dixon and Parmenter 1991).
Microeconomic reform in Australia had its origins in the 25 per cent cut to tariffs
introduced by the Whitlam Labor Government of the early 1970s (Borland 2001;
Karunaratne 2007) but the more substantial reform agenda is typically associated with
the post-1983 period when a substantial reform program was introduced by the
Hawke Labour Government and was sustained through a 20-year period covering
both Labor and Liberal Coalition governments (Borland 2001; Dollery and Wallis
2000).
The key reforms can be summarised as follows31:
De-regulation32, corporatisation33 and/or privatisation34 of the government
31 The reforms and examples outlined have been summarised from Borland (2001; see also Parham 2002).
69
business sector. Examples include;
o Private (partial) access to the telecommunications market in
competition with Telstra35;
o Sale of Commonwealth Serum Laboratories, The Commonwealth
Bank, Power generators and telecommunications;
Tariffs on imported goods have been drastically reduced;
o the average effective rate of assistance to manufacturing fell from 35
per cent in the 1960s to 5 per cent by the mid-1990s;
Regulatory barriers to entry in the banking market have been removed;
o Also included the removal of interest rate ceilings on home loans;
Reforms to agriculture include the removal of tariffs on some imported
products and removal of pricing controls;
Tax and welfare system reforms;
32 De-regulation reforms are directed at reducing or removing government intervention into the operations of the
market place that may be distorting market behaviour. The objective of this type of reform is to improve the
allocation of resources so that they go to their most efficient economic application (Lewis et al. 2006).
33 Corporatisation involves the setting of clear performance objectives for government business enterprises (GBE),
performance related pay systems and often pricing reform for outputs and services to ensure that the corporatised
entity responds to the same incentives and disciplines as the private sector (Lewis et al. 2006)
34 Privatisation involves the sale of a GBE to the private sector, either in part or in whole, with the objective of the
GBE responding more effectively to normal market signals and allocating its resources more efficiently (Lewis et
al. 2006).
35 At the time of publication of Borland’s publication (2001) this was restricted to the mobile telephone market,
but has since involved full privatisation of Telstra and third-party access to the Telstra network (O'Leary 2003).
70
o The Goods and Services Tax (GST) was introduced in 2000,
augmented by the removal of the distorting effects of wholesales sales
tax;
o Capital Gains Tax (CGT) was introduced in 1985;
o The company tax rate was significantly reduced;
o Mutual obligation requirements were placed on welfare recipients,
along with stricter eligibility requirements.
Labour market reforms, primarily through the overhaul of industrial relations
(see Section 5.3 for further details)
5.2.1 Impact of microeconomic reform on the labour market
The short run effects of microeconomic reform can operate through reductions in
employment, although modelling by Adams and Parmenter (1994) suggests that this
is only likely to occur where the reform is purely labour-saving and the economic
gains from the reform are distributed through increased wages.
Paul and Marks (2009), using data for the 1969 to 2000 period, found that the impact
of increased trade openness in the Australian manufacturing sector was labour saving.
Bloch and McDonald (2001) examined panel data for Australian manufacturing firms
for the period 1981-82 to 1992-93. Over this period the nominal rate of protection for
Australian manufacturing fell from 16 per cent to 7 per cent. The key finding was that
decreased trade restrictions resulted in significant labour productivity improvements
71
for firms operating in markets with high concentration ratios (CR)36. The research did
not untangle the extent to which the improvement was realised through labour
shedding, or increased output with the same workforce. Presumably, given the
increased import penetration, it was not realised through product prices. Note that a
study Borjas and Ramey (1995) identified the same effect for the US. Their argument
is that high CRs allowed for the capture of rents, and that these were shared with
workers in the form of higher wages. Import competition in high CR industries
eroded the economic rents and led to shedding of lower skill labour among domestic
firms. This explained around 23 per cent of the change in wage inequality. Borjas and
Ramey (1995) also identified the impact on high CR industries as the reason behind
the geographic distribution of wage inequality.
5.3 Industrial Relations
Industrial relations in Australia have undergone substantial reform over the last three
decades. The broad consensus is that labour markets are now considerably more
flexible in the determination of wages and conditions, both in terms of process and
outcomes (Lewis 1998; Peetz 2005; Wailes and Lansbury 1999; Wooden 2001).
Improvements in the ability for markets to adjust, i.e. increased flexibility, allows for
a more efficient allocation of resources.
The number of people in the labour force with union membership has fallen
dramatically over the period covering major reforms to industrial relations. In 1976
36 Concentration ratios provide an indicator of industry competitiveness. CRs measure the percentage of an
industry’s output that is produced by the largest firms (Lewis et al. 2006).
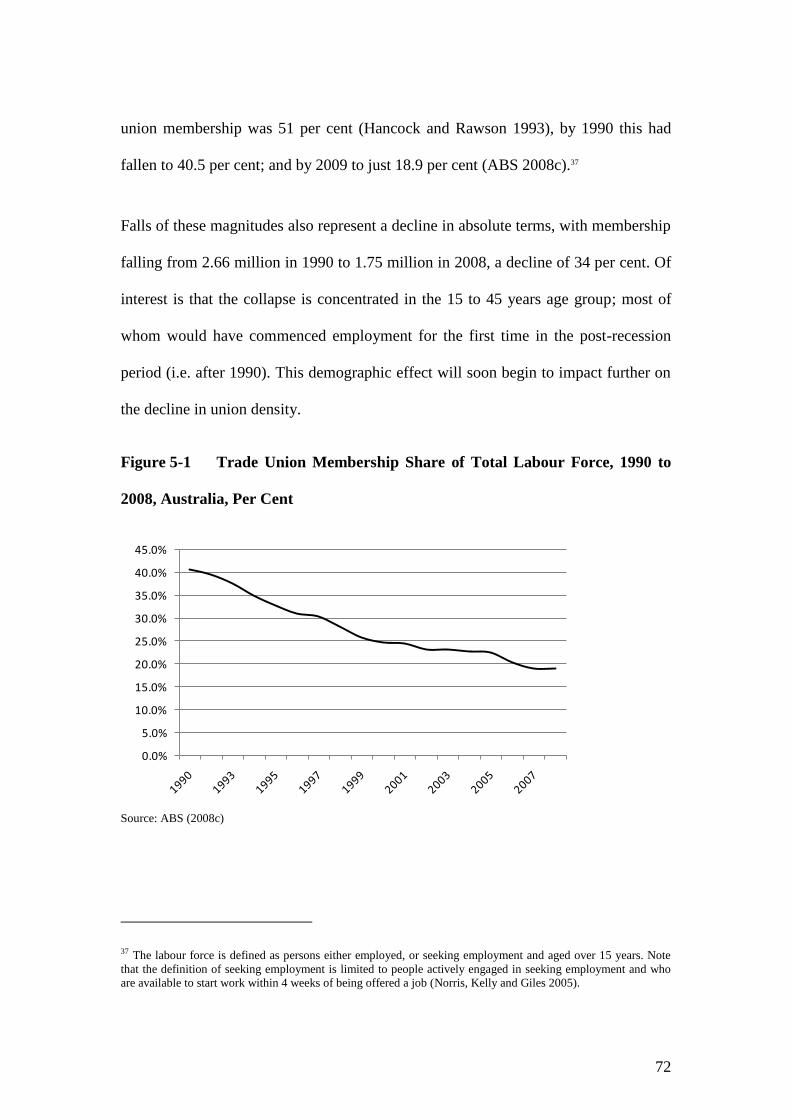
72
union membership was 51 per cent (Hancock and Rawson 1993), by 1990 this had
fallen to 40.5 per cent; and by 2009 to just 18.9 per cent (ABS 2008c).37
Falls of these magnitudes also represent a decline in absolute terms, with membership
falling from 2.66 million in 1990 to 1.75 million in 2008, a decline of 34 per cent. Of
interest is that the collapse is concentrated in the 15 to 45 years age group; most of
whom would have commenced employment for the first time in the post-recession
period (i.e. after 1990). This demographic effect will soon begin to impact further on
the decline in union density.
Figure 5-1 Trade Union Membership Share of Total Labour Force, 1990 to
2008, Australia, Per Cent
Source: ABS (2008c)
37 The labour force is defined as persons either employed, or seeking employment and aged over 15 years. Note
that the definition of seeking employment is limited to people actively engaged in seeking employment and who
are available to start work within 4 weeks of being offered a job (Norris, Kelly and Giles 2005).
0.0%
5.0%
10.0%
15.0%
20.0%
25.0%
30.0%
35.0%
40.0%
45.0%
73
5.3.1 Unions, industrial relations and wage setting
The Industrial Relations Commission38 (IRC) is the primary institution that governs,
or at least heavily influences, the operation of the Australian labour market. For many
decades the IRC and its predecessors played the central role in setting the market
price of labour and workplace entitlements (Lansbury, Wailes and Yazbeck 2007,
Wooden 2001).
There have been three distinct periods of institutional change in the industrial relation
arena. The first was the period covering the various wages and price accords between
the ACTU and the Hawke-Keating Labor governments of the 1980s. The key feature
of this period was the moderation of growth in wages of workers; the result of a wage
restraint by unions in exchange for increased government support through increased
transfer payments and improvements in other aspects of the ‘social wage’, such as
health expenditure and welfare services (Hancock and Rawson 1993; Lansbury,
Wailes and Yazbeck 2007; Wooden 2005). This fuelled rapid growth in employment
(Lewis 1998; Russell and Tease 1988) before the 1989-92 recession brought the
expansion in employment to an end and delivered an 11 per cent unemployment rate.
From 1988 to 1992, although still centrally arbitrated, there was a greater emphasis
on productivity based wage increases under the rubric of the ‘Structural Efficiency
Principle’ (Norris, Kelly and Giles 2005).
The third phase, starting under the Keating Government in 1993 and entrenched
38 Legislation passed in 2009 under the Rudd Labor Government has resulted in a number of industrial relations
functions, including those of the Commission, being rolled into a new agency called ‘Fair Work Australia’ (FWA
n.d.).

74
under the post-1996 Howard Liberal Government, saw a move away from centralised
bargaining with increased use of direct bargaining between employers and
employees, either on an individual or collective basis (Lansbury, Wailes and Yazbeck
2007).
5.3.2 Labour market flexibility, productivity & structural adjustment
Flexibility in the labour market is one of the key enablers of structural change and
productivity growth. The Productivity Commission argued that the industrial relations
reforms in Australia contributed to productivity improvements:
Important fundamental influences on productivity include reforms in industrial relations
arrangements, which increased workplace flexibility by reducing demarcations and
facilitating the introduction of split shifts. (Johnston et al. 2000: p.XX)
Laplagne, Glover and Fry (2005) found that the increased uptake of labour hire
workers39 resulted from increased workplace level bargaining and argued that:
The Workplace Relations Act 1996 [WRA], by providing for Certified Agreements to
be struck directly between employers and their employees, broadened the scope of
workplace bargaining in the economy, and is likely to have further encouraged the use
of labour hire employment. (p.17)
The benefits employers derive from labour hire workers include the ability to fill
temporary skill gaps due to staff turnover, ability to optimise employment levels and
reduction in ‘termination of employment’ risks (Laplagne, Glover and Fry 2005).
The introduction of the WRA in 1996 provided a natural experiment which Farmakis-
Gamboni and Prentice (2006) used to test its impact on total factor productivity
39 Labour hire workers are ‘Employees and (self-employed) contractors supplied by a labour hire agency to a
client firm. Also referred to as temps, on-hired workers and agency workers.’ (Laplagne, Glover and Fry 2005,
p.xi)
75
(TFP). Among their findings were that unionised plants40 in the manufacturing,
mining and construction industries experienced significant surges in TFP, growing at
nearly three times the rate of non-unionised plants, the implication being that that
non-unionised plants were already operating close to their efficient level.
Another indicator of the impact of industrial relations reforms can be seen in the
levels of industrial disputation. Over the period 1970 to 2000, days lost from
industrial disputes per 1,000 employees fell from levels around the 600-800 range to
around 60 (Wooden 2001) (see Figure 5-2). Disputation levels remained low until
2007. However, there has been some increase in disputation levels since then. In 2008
there were 190 working days lost per 1,000 employees (ABS 2009f).
Morris and Wilson (1994) examined the link between the incidence and duration of
strike activity over the period 1959 to 1991 and the influence of the Accord. They
found that the implementation of the Accord reduced both indicators. As can be seen
in Figure 5-2, during the period of reform following the end of the Accord, both
under the Keating Labor Government from 1993 onwards and the Howard Liberal
Coalition Government, which included the reforms introduced under the 1996
Workplace Relations Act, the level of disputation remained at historically low levels.
Between 2001 and 2007 working days lost per 1,000 employees remained at similar
levels (ABS 2006b; 2008c). The level of disputation has risen sharply since the
election of the Rudd Labor Government in November of 2007, however the reasons
40The sample of firms used in the study were small to medium-sized plants/sites.
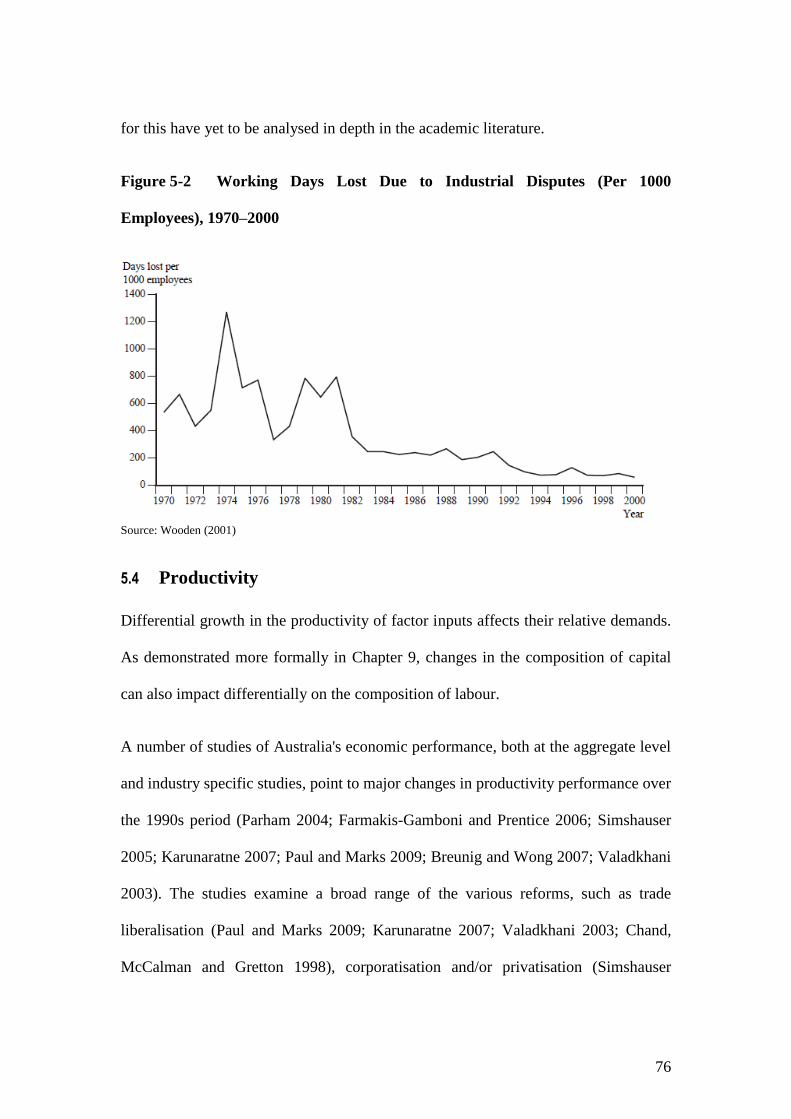
76
for this have yet to be analysed in depth in the academic literature.
Figure 5-2 Working Days Lost Due to Industrial Disputes (Per 1000
Employees), 1970–2000
Source: Wooden (2001)
5.4 Productivity
Differential growth in the productivity of factor inputs affects their relative demands.
As demonstrated more formally in Chapter 9, changes in the composition of capital
can also impact differentially on the composition of labour.
A number of studies of Australia's economic performance, both at the aggregate level
and industry specific studies, point to major changes in productivity performance over
the 1990s period (Parham 2004; Farmakis-Gamboni and Prentice 2006; Simshauser
2005; Karunaratne 2007; Paul and Marks 2009; Breunig and Wong 2007; Valadkhani
2003). The studies examine a broad range of the various reforms, such as trade
liberalisation (Paul and Marks 2009; Karunaratne 2007; Valadkhani 2003; Chand,
McCalman and Gretton 1998), corporatisation and/or privatisation (Simshauser
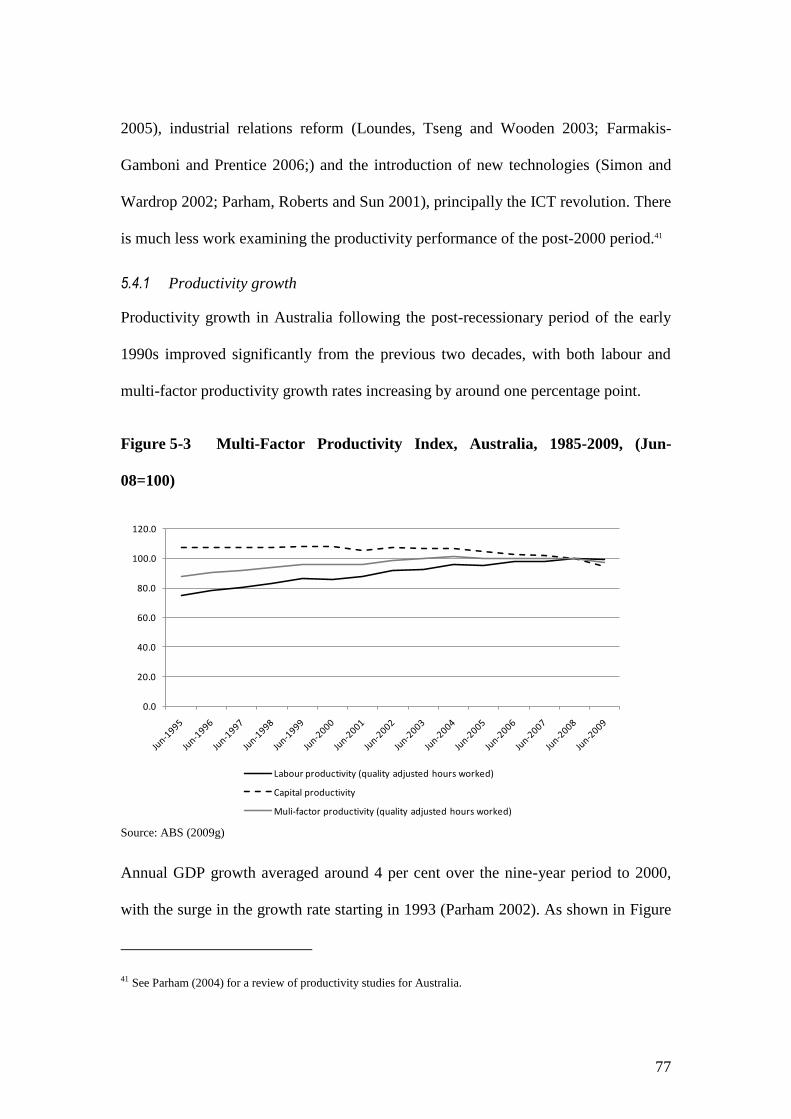
77
2005), industrial relations reform (Loundes, Tseng and Wooden 2003; Farmakis-
Gamboni and Prentice 2006;) and the introduction of new technologies (Simon and
Wardrop 2002; Parham, Roberts and Sun 2001), principally the ICT revolution. There
is much less work examining the productivity performance of the post-2000 period.41
5.4.1 Productivity growth
Productivity growth in Australia following the post-recessionary period of the early
1990s improved significantly from the previous two decades, with both labour and
multi-factor productivity growth rates increasing by around one percentage point.
Figure 5-3 Multi-Factor Productivity Index, Australia, 1985-2009, (Jun-
08=100)
Source: ABS (2009g)
Annual GDP growth averaged around 4 per cent over the nine-year period to 2000,
with the surge in the growth rate starting in 1993 (Parham 2002). As shown in Figure
41 See Parham (2004) for a review of productivity studies for Australia.
0.0
20.0
40.0
60.0
80.0
100.0
120.0
Labour productivity (quality adjusted hours worked)
Capital productivity
Muli-factor productivity (quality adjusted hours worked)
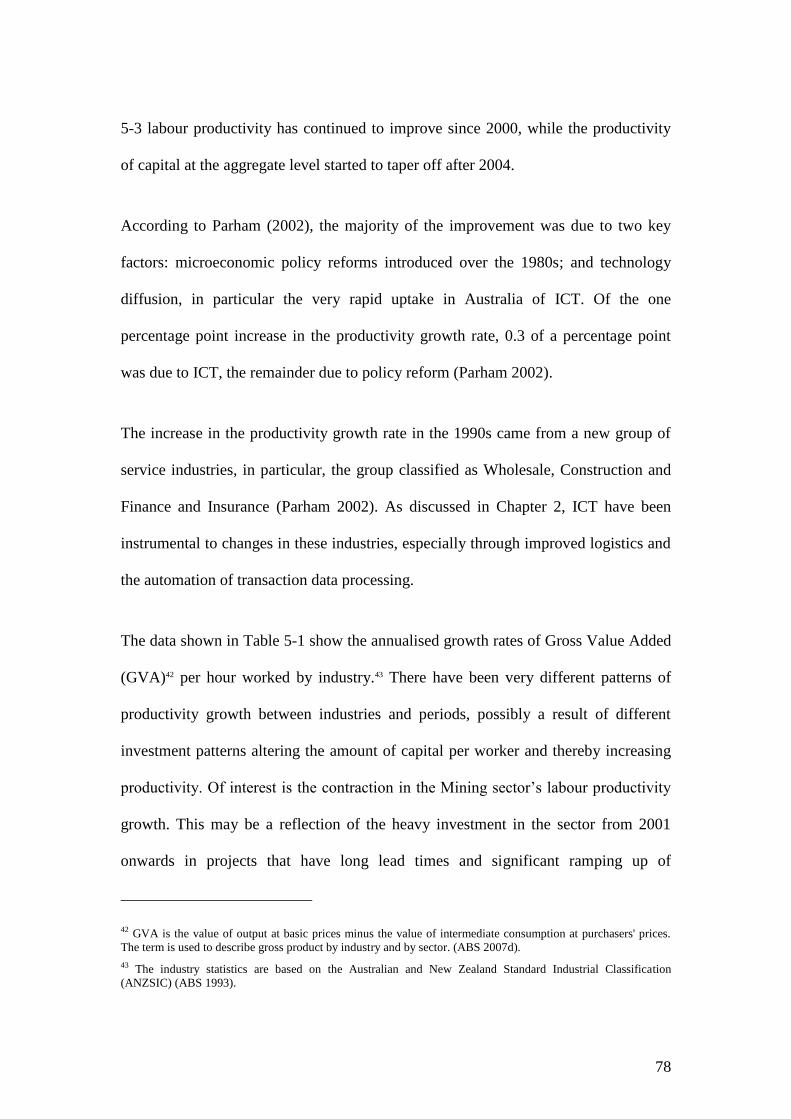
78
5-3 labour productivity has continued to improve since 2000, while the productivity
of capital at the aggregate level started to taper off after 2004.
According to Parham (2002), the majority of the improvement was due to two key
factors: microeconomic policy reforms introduced over the 1980s; and technology
diffusion, in particular the very rapid uptake in Australia of ICT. Of the one
percentage point increase in the productivity growth rate, 0.3 of a percentage point
was due to ICT, the remainder due to policy reform (Parham 2002).
The increase in the productivity growth rate in the 1990s came from a new group of
service industries, in particular, the group classified as Wholesale, Construction and
Finance and Insurance (Parham 2002). As discussed in Chapter 2, ICT have been
instrumental to changes in these industries, especially through improved logistics and
the automation of transaction data processing.
The data shown in Table 5-1 show the annualised growth rates of Gross Value Added
(GVA)42 per hour worked by industry.43 There have been very different patterns of
productivity growth between industries and periods, possibly a result of different
investment patterns altering the amount of capital per worker and thereby increasing
productivity. Of interest is the contraction in the Mining sector’s labour productivity
growth. This may be a reflection of the heavy investment in the sector from 2001
onwards in projects that have long lead times and significant ramping up of
42 GVA is the value of output at basic prices minus the value of intermediate consumption at purchasers' prices.
The term is used to describe gross product by industry and by sector. (ABS 2007d).
43 The industry statistics are based on the Australian and New Zealand Standard Industrial Classification
(ANZSIC) (ABS 1993).
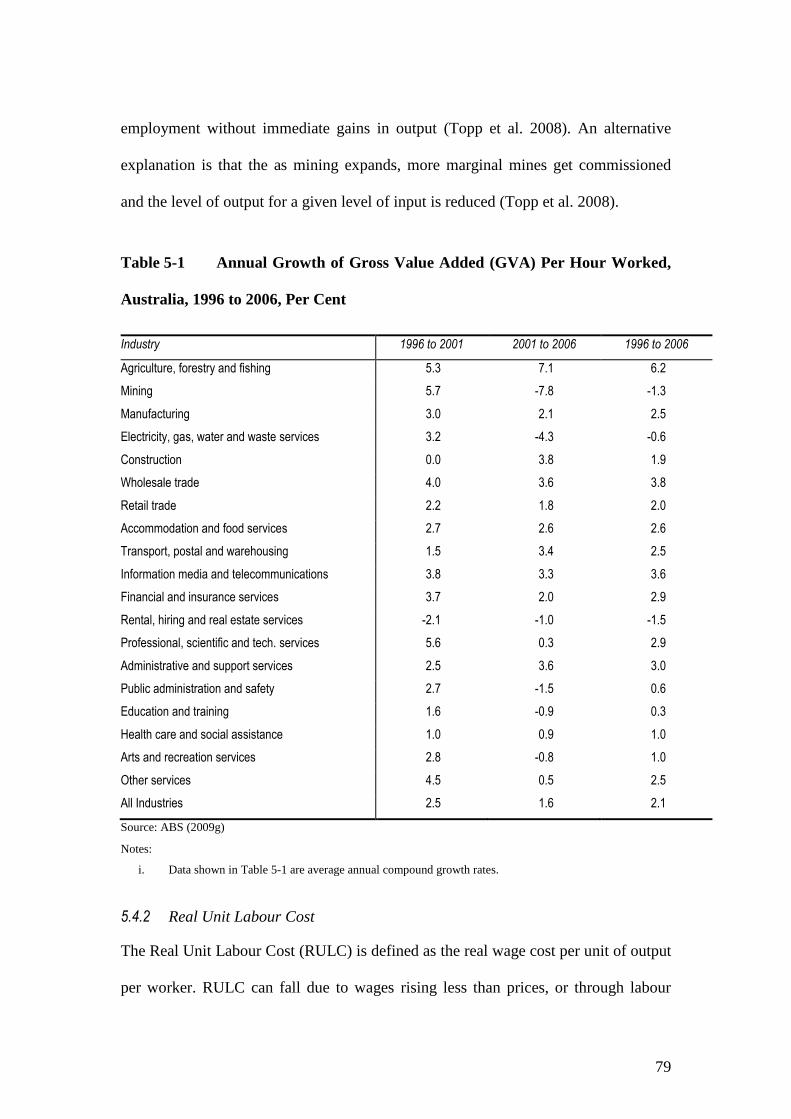
79
employment without immediate gains in output (Topp et al. 2008). An alternative
explanation is that the as mining expands, more marginal mines get commissioned
and the level of output for a given level of input is reduced (Topp et al. 2008).
Table 5-1 Annual Growth of Gross Value Added (GVA) Per Hour Worked,
Australia, 1996 to 2006, Per Cent
Industry 1996 to 2001 2001 to 2006 1996 to 2006
Agriculture, forestry and fishing 5.3 7.1 6.2
Mining 5.7 -7.8 -1.3
Manufacturing 3.0 2.1 2.5
Electricity, gas, water and waste services 3.2 -4.3 -0.6
Construction 0.0 3.8 1.9
Wholesale trade 4.0 3.6 3.8
Retail trade 2.2 1.8 2.0
Accommodation and food services 2.7 2.6 2.6
Transport, postal and warehousing 1.5 3.4 2.5
Information media and telecommunications 3.8 3.3 3.6
Financial and insurance services 3.7 2.0 2.9
Rental, hiring and real estate services -2.1 -1.0 -1.5
Professional, scientific and tech. services 5.6 0.3 2.9
Administrative and support services 2.5 3.6 3.0
Public administration and safety 2.7 -1.5 0.6
Education and training 1.6 -0.9 0.3
Health care and social assistance 1.0 0.9 1.0
Arts and recreation services 2.8 -0.8 1.0
Other services 4.5 0.5 2.5
All Industries 2.5 1.6 2.1
Source: ABS (2009g)
Notes:
i. Data shown in Table 5-1 are average annual compound growth rates.
5.4.2 Real Unit Labour Cost
The Real Unit Labour Cost (RULC) is defined as the real wage cost per unit of output
per worker. RULC can fall due to wages rising less than prices, or through labour
80
productivity rising faster than real wages.
Figure 5-4 Real Unit Labour Costs Index, Australia, 1985-2009, (Mar-
07=100)
Source: ABS (2010b)
Figure 5-4 shows RULC from 1985 to 2009. This period covers the major reforms of
the Prices and Incomes Accord (herein the ‘Accord’), the major microeconomic
reforms of the Hawke-Keating Labor governments and the Coalition Government,
and the surge in ICT that occurred from about the mid-1990s onwards. The period up
to 1989 shows the dramatic fall in RULC as a result of real wages fluctuating around
a relatively constant level under the Accord (Lewis and Spiers 1990) while the
nominal value of output continued to grow. The period covering approximately 1997
through to 2003 shows a period of falling RULC, which is primarily due to a
significant and sustained increase in the rate of output per worker, relative to real
wage growth.
90.0
95.0
100.0
105.0
110.0
115.0
120.0
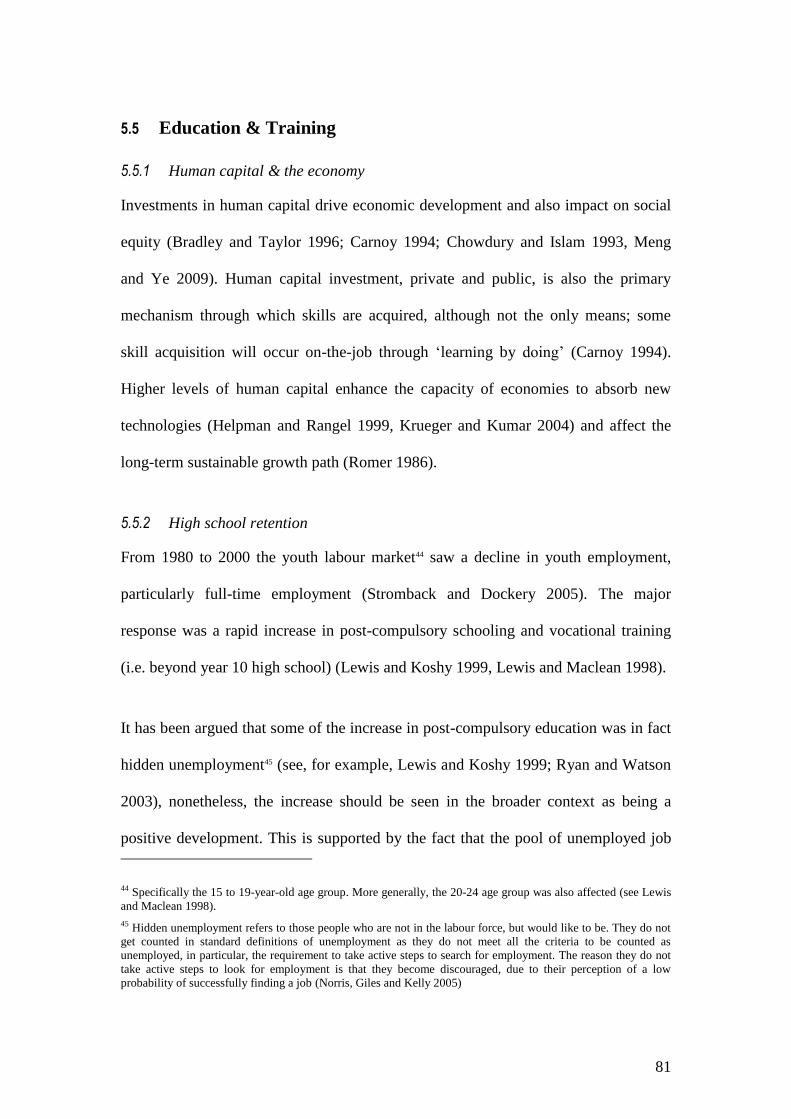
81
5.5 Education & Training
5.5.1 Human capital & the economy
Investments in human capital drive economic development and also impact on social
equity (Bradley and Taylor 1996; Carnoy 1994; Chowdury and Islam 1993, Meng
and Ye 2009). Human capital investment, private and public, is also the primary
mechanism through which skills are acquired, although not the only means; some
skill acquisition will occur on-the-job through ‘learning by doing’ (Carnoy 1994).
Higher levels of human capital enhance the capacity of economies to absorb new
technologies (Helpman and Rangel 1999, Krueger and Kumar 2004) and affect the
long-term sustainable growth path (Romer 1986).
5.5.2 High school retention
From 1980 to 2000 the youth labour market44 saw a decline in youth employment,
particularly full-time employment (Stromback and Dockery 2005). The major
response was a rapid increase in post-compulsory schooling and vocational training
(i.e. beyond year 10 high school) (Lewis and Koshy 1999, Lewis and Maclean 1998).
It has been argued that some of the increase in post-compulsory education was in fact
hidden unemployment45 (see, for example, Lewis and Koshy 1999; Ryan and Watson
2003), nonetheless, the increase should be seen in the broader context as being a
positive development. This is supported by the fact that the pool of unemployed job
44 Specifically the 15 to 19-year-old age group. More generally, the 20-24 age group was also affected (see Lewis
and Maclean 1998).
45 Hidden unemployment refers to those people who are not in the labour force, but would like to be. They do not
get counted in standard definitions of unemployment as they do not meet all the criteria to be counted as
unemployed, in particular, the requirement to take active steps to search for employment. The reason they do not
take active steps to look for employment is that they become discouraged, due to their perception of a low
probability of successfully finding a job (Norris, Giles and Kelly 2005)
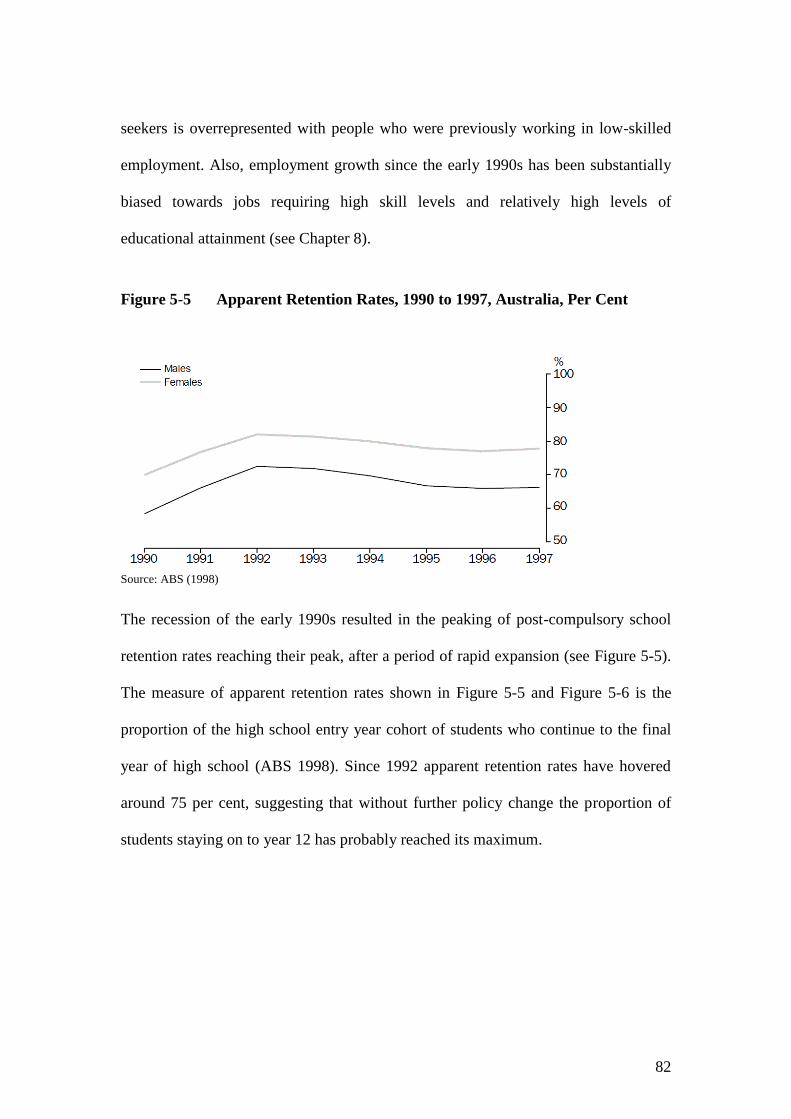
82
seekers is overrepresented with people who were previously working in low-skilled
employment. Also, employment growth since the early 1990s has been substantially
biased towards jobs requiring high skill levels and relatively high levels of
educational attainment (see Chapter 8).
Figure 5-5 Apparent Retention Rates, 1990 to 1997, Australia, Per Cent
Source: ABS (1998)
The recession of the early 1990s resulted in the peaking of post-compulsory school
retention rates reaching their peak, after a period of rapid expansion (see Figure 5-5).
The measure of apparent retention rates shown in Figure 5-5 and Figure 5-6 is the
proportion of the high school entry year cohort of students who continue to the final
year of high school (ABS 1998). Since 1992 apparent retention rates have hovered
around 75 per cent, suggesting that without further policy change the proportion of
students staying on to year 12 has probably reached its maximum.
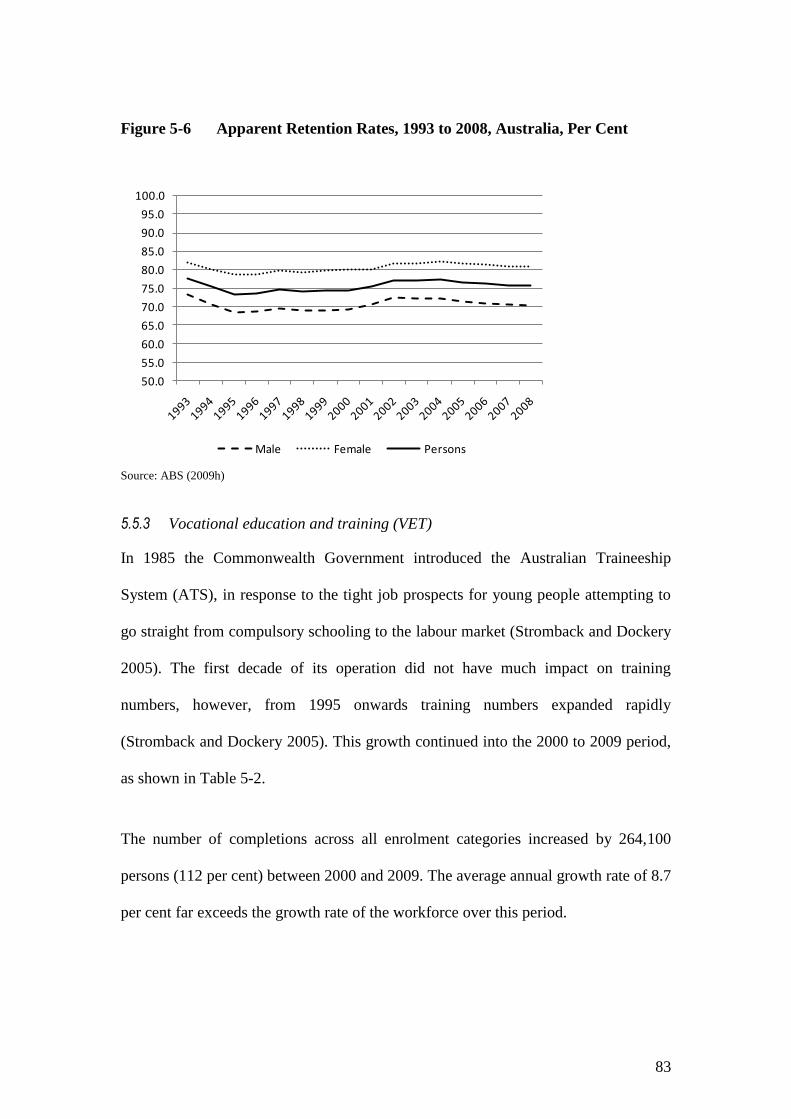
83
Figure 5-6 Apparent Retention Rates, 1993 to 2008, Australia, Per Cent
Source: ABS (2009h)
5.5.3 Vocational education and training (VET)
In 1985 the Commonwealth Government introduced the Australian Traineeship
System (ATS), in response to the tight job prospects for young people attempting to
go straight from compulsory schooling to the labour market (Stromback and Dockery
2005). The first decade of its operation did not have much impact on training
numbers, however, from 1995 onwards training numbers expanded rapidly
(Stromback and Dockery 2005). This growth continued into the 2000 to 2009 period,
as shown in Table 5-2.
The number of completions across all enrolment categories increased by 264,100
persons (112 per cent) between 2000 and 2009. The average annual growth rate of 8.7
per cent far exceeds the growth rate of the workforce over this period.
50.0
55.0
60.0
65.0
70.0
75.0
80.0
85.0
90.0
95.0
100.0
Male Female Persons
84
Table 5-2 Graduate Completions in VET, 2000 to 2009, Australia, Persons,
000s
2000 2001 2002 2003 2004 2005 2006 2007 2008 2009
Estimated graduate
population
235.8 239.3 244.7 246.9 239.4 425.4 464.5 478.1 469.7 499.9
Source: NCVER Student Outcomes Survey 200946
Cully (2008) argues that the training statistics need to interpreted with caution and
that they have risen due to government incentive payments that have effectively
operated as a wage subsidy. Moreover, Cully (2008) argues that the training
undertaken added little to the productivity of workers:
There is virtually no evidence that the possession of a vocational certificate leads to
higher wages in these occupations. By inference, this means that those who have
completed a traineeship qualification are no more productive than an unqualified
worker. (p.272)
5.5.4 Apprentices
Vocational education and training in traditional blue collar streams, such as building,
electrical and automotive trades, experienced a period of stagnation or decline relative
to total employment through the three decades to 2000. Consistent with the findings
of Kapuscinski (2004), there appears to be an observed variation around this trend
corresponding with the business cycle. Research has shown that there is a very large
cost borne by employers to take on apprentices (Dockery et al. 2001; Dockery and
Norris 1996). It has been argued that employers do this, despite the high costs, due to
altruistic motives (Dockery et al. 2001). However, the increasing competitiveness in
the Australian economy over time may explain the secular decline in the level of
46 The Student Outcomes Survey includes students who are awarded a qualification (graduates) and also those
who successfully complete part of a course and then leave the VET system (module completers). There were an
additional 133,300 module completers from 2000 to 2009 (NCVER 2009).
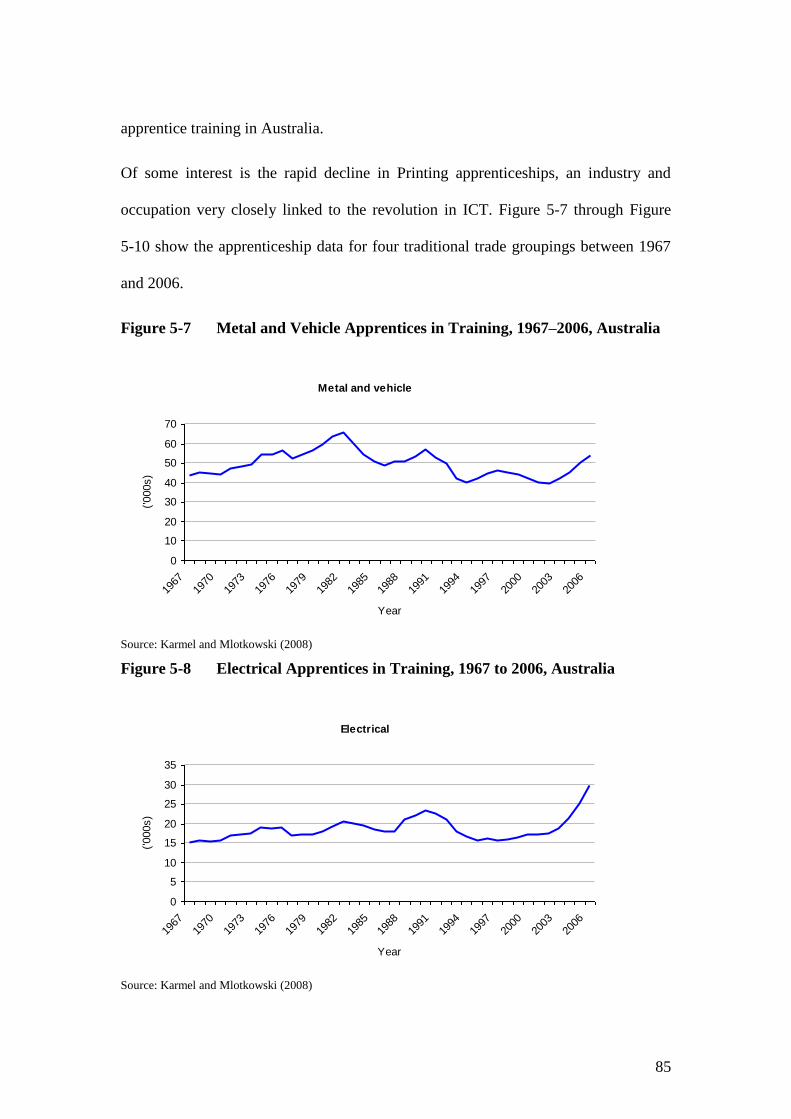
85
apprentice training in Australia.
Of some interest is the rapid decline in Printing apprenticeships, an industry and
occupation very closely linked to the revolution in ICT. Figure 5-7 through Figure
5-10 show the apprenticeship data for four traditional trade groupings between 1967
and 2006.
Figure 5-7 Metal and Vehicle Apprentices in Training, 1967–2006, Australia
Source: Karmel and Mlotkowski (2008)
Figure 5-8 Electrical Apprentices in Training, 1967 to 2006, Australia
Source: Karmel and Mlotkowski (2008)
Metal and vehicle
0
10
20
30
40
50
60
70
1967
1970
1973
1976
1979
1982
1985
1988
1991
1994
1997
2000
2003
2006
Year
('000s)
Electrical
0
5
10
15
20
25
30
35
1967
1970
1973
1976
1979
1982
1985
1988
1991
1994
1997
2000
2003
2006
Year
('000s)
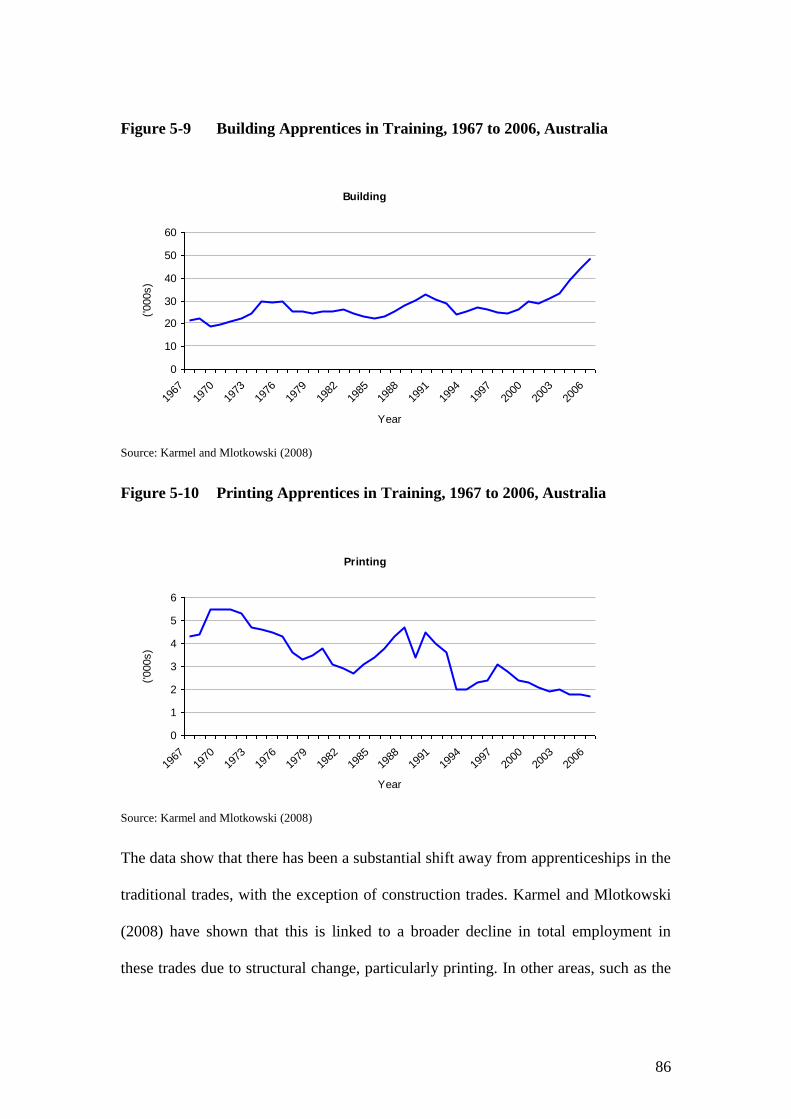
86
Figure 5-9 Building Apprentices in Training, 1967 to 2006, Australia
Source: Karmel and Mlotkowski (2008)
Figure 5-10 Printing Apprentices in Training, 1967 to 2006, Australia
Source: Karmel and Mlotkowski (2008)
The data show that there has been a substantial shift away from apprenticeships in the
traditional trades, with the exception of construction trades. Karmel and Mlotkowski
(2008) have shown that this is linked to a broader decline in total employment in
these trades due to structural change, particularly printing. In other areas, such as the
Building
0
10
20
30
40
50
60
1967
1970
1973
1976
1979
1982
1985
1988
1991
1994
1997
2000
2003
2006
Year
('000s)
Printing
0
1
2
3
4
5
6
1967
1970
1973
1976
1979
1982
1985
1988
1991
1994
1997
2000
2003
2006
Year
('000s)

87
food industry, apprenticeships are growing to meet the rapid rise in tourism and
hospitality, reflecting the broad trend towards a service economy. The decline in
apprenticeships in traditional trades reflects the broader trend of the changing skill
mix in the economy, with demand shifting away from motor skills and towards the
cognitive and interactive skill requirements of the ‘knowledge economy’. The most
recent increase in Building and Electrical trades is most likely a result of growth in
the Construction industry related to mining projects and population growth (Lewis
and Corliss 2010).
5.5.5 Higher education
A feature of the Australian economy over the last 20-30 years has been its rapid
transition to a service economy. Human capital development has enabled this to
happen (Lewis and Mahony 2006), with significant expansion of university places
since 1989. This was facilitated by the move away from fully funded higher education
places toward substantial private contributions to tuition under the Higher Education
Contribution Scheme (HECS) and similar fees assistance programs (Lewis and
Mahony 2006; Kenyon and Wooden 1996).
Other factors contributing to the expansion of enrolments include decreased
opportunity costs of study, due to reduced full-time employment opportunities,
(Lewis and Koshy 1999; Lewis and Mclean 1998) and increased relative returns to
education (Chia 1991; Lewis et al. 2006).
Between 1991 and 2006 the proportion of the working-age population that have a
bachelor degree or higher nearly doubled, increasing from 9.0 per cent in 2001 to
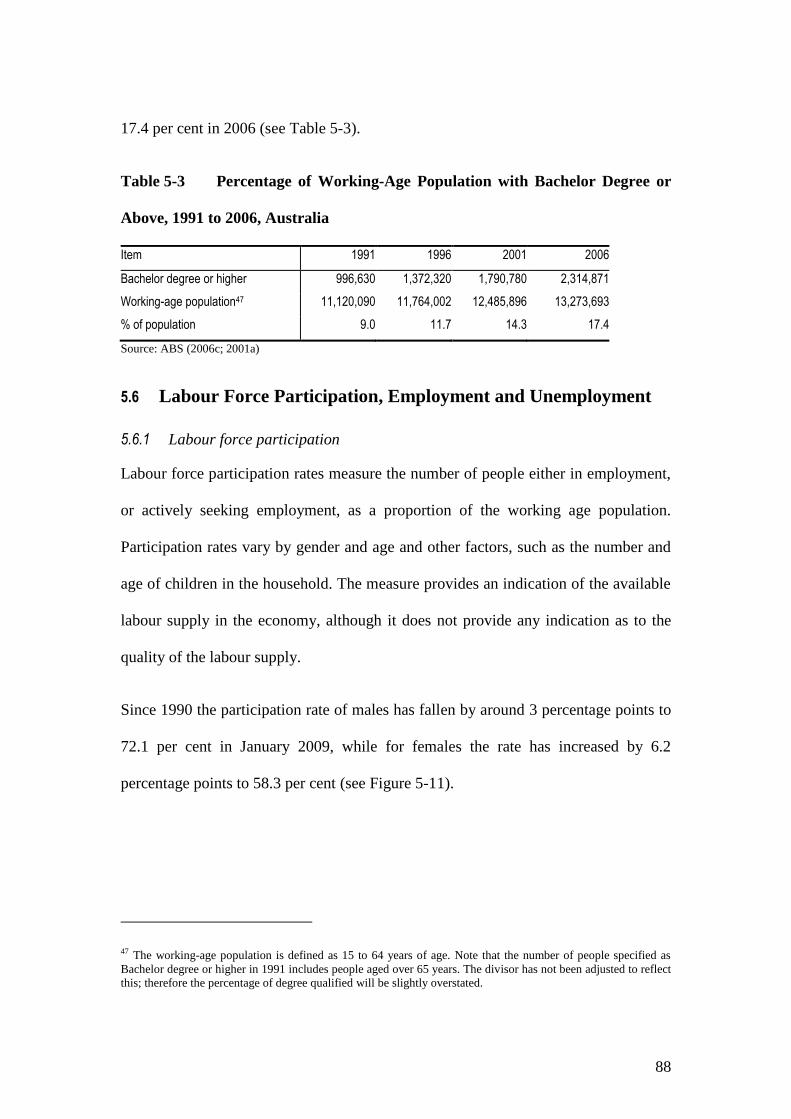
88
17.4 per cent in 2006 (see Table 5-3).
Table 5-3 Percentage of Working-Age Population with Bachelor Degree or
Above, 1991 to 2006, Australia
Item 1991 1996 2001 2006
Bachelor degree or higher 996,630 1,372,320 1,790,780 2,314,871
Working-age population47 11,120,090 11,764,002 12,485,896 13,273,693
% of population 9.0 11.7 14.3 17.4
Source: ABS (2006c; 2001a)
5.6 Labour Force Participation, Employment and Unemployment
5.6.1 Labour force participation
Labour force participation rates measure the number of people either in employment,
or actively seeking employment, as a proportion of the working age population.
Participation rates vary by gender and age and other factors, such as the number and
age of children in the household. The measure provides an indication of the available
labour supply in the economy, although it does not provide any indication as to the
quality of the labour supply.
Since 1990 the participation rate of males has fallen by around 3 percentage points to
72.1 per cent in January 2009, while for females the rate has increased by 6.2
percentage points to 58.3 per cent (see Figure 5-11).
47 The working-age population is defined as 15 to 64 years of age. Note that the number of people specified as
Bachelor degree or higher in 1991 includes people aged over 65 years. The divisor has not been adjusted to reflect
this; therefore the percentage of degree qualified will be slightly overstated.
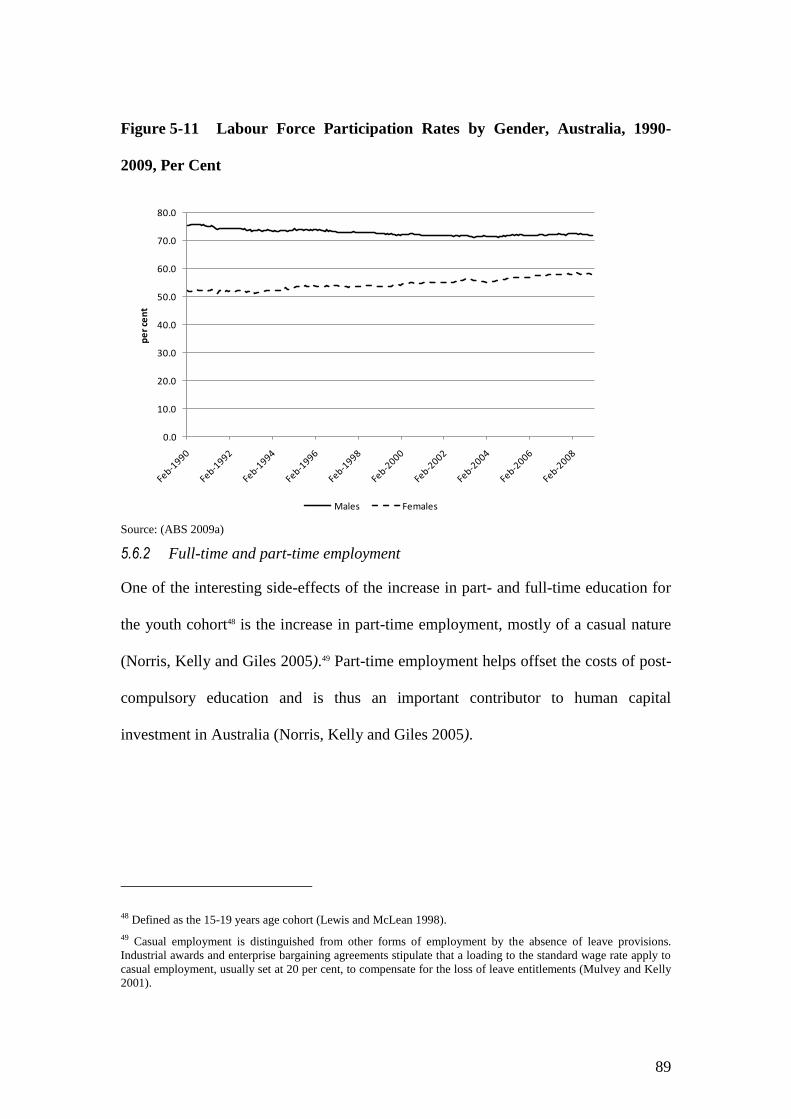
89
Figure 5-11 Labour Force Participation Rates by Gender, Australia, 1990-
2009, Per Cent
Source: (ABS 2009a)
5.6.2 Full-time and part-time employment
One of the interesting side-effects of the increase in part- and full-time education for
the youth cohort48 is the increase in part-time employment, mostly of a casual nature
(Norris, Kelly and Giles 2005).49 Part-time employment helps offset the costs of post-
compulsory education and is thus an important contributor to human capital
investment in Australia (Norris, Kelly and Giles 2005).
48 Defined as the 15-19 years age cohort (Lewis and McLean 1998).
49 Casual employment is distinguished from other forms of employment by the absence of leave provisions.
Industrial awards and enterprise bargaining agreements stipulate that a loading to the standard wage rate apply to
casual employment, usually set at 20 per cent, to compensate for the loss of leave entitlements (Mulvey and Kelly
2001).
0.0
10.0
20.0
30.0
40.0
50.0
60.0
70.0
80.0
pe
r ce
nt
Males Females
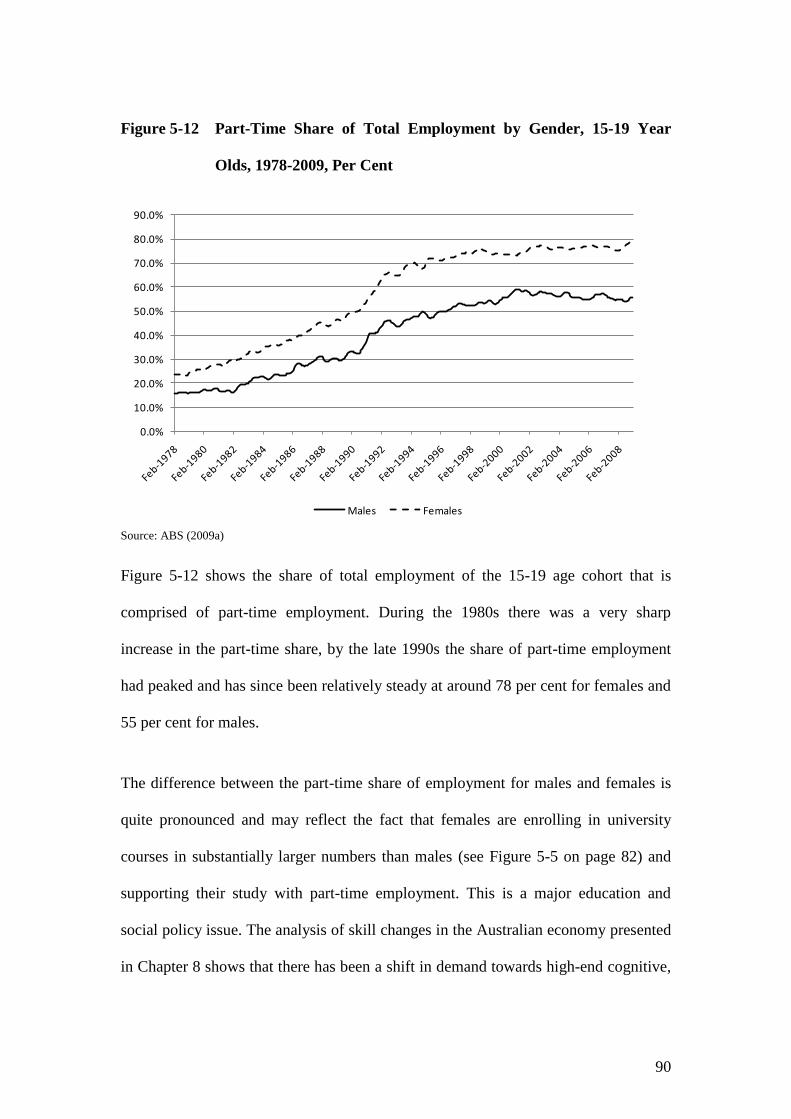
90
Figure 5-12 Part-Time Share of Total Employment by Gender, 15-19 Year
Olds, 1978-2009, Per Cent
Source: ABS (2009a)
Figure 5-12 shows the share of total employment of the 15-19 age cohort that is
comprised of part-time employment. During the 1980s there was a very sharp
increase in the part-time share, by the late 1990s the share of part-time employment
had peaked and has since been relatively steady at around 78 per cent for females and
55 per cent for males.
The difference between the part-time share of employment for males and females is
quite pronounced and may reflect the fact that females are enrolling in university
courses in substantially larger numbers than males (see Figure 5-5 on page 82) and
supporting their study with part-time employment. This is a major education and
social policy issue. The analysis of skill changes in the Australian economy presented
in Chapter 8 shows that there has been a shift in demand towards high-end cognitive,
0.0%
10.0%
20.0%
30.0%
40.0%
50.0%
60.0%
70.0%
80.0%
90.0%
Males Females
91
education and interactive skills since 1991, and that this demand has been largely
filled by females. The educational performance of males in high school and the
impact this might be having on career pathways needs further investigation.
The part-time share for the remainder of the workforce has followed a similar trend to
that for the 15-19 age cohort, although for adult males the growth in the part-
employment share has been even more pronounced. There has been a three-fold
increase in the part-time share of total male employment since 1978, for females it
doubled. Part-time employment as a share of total employment as of January 2009
was 15.1 per cent for males and 28.6 per cent for females.
5.6.3 Disadvantaged groups
Within the youth cohort there is a particular demographic that face poor employment
prospects and these are of particular concern. They are concentrated in disadvantaged
neighbourhoods and tend to come from families with poorer educational attainment.
The evidence shows that youth unemployment is not only affected by the individual
characteristics, but also by other factors.
Among the suggested non-personal factors contributing to unemployment are
neighbourhood demographics, such as high adult unemployment rates and high levels
of state housing, and intergenerational rigidities50 (see for example, Bradbury, Garde
and Vipond 1986; Gregory and Hunter 1995; Hunter 1995, 1996; Kelly And Lewis
50 Intergeneration al rigidities refer to the relationship between a parent’s status, such as unemployment, and their
child’s status. It may arise due to transmission of tastes, or constraints. For example, parents who have a low
distaste for unemployment may raise children with similar attitudes towards unemployment (O’Neill and
Sweetman, 1997).
92
2000, 2002; O’Neill and Sweetman 1997; O’Regan and Quigley 1998).
The two main explanations for the influence of neighbourhoods are spatial mismatch
and socioeconomic concentration. The spatial mismatch hypothesis looks at the
impact of job decentralisation and the constraints on housing choices of people who
have low socioeconomic status. This model suggests proximity to work affects
employment outcomes (Vipond 1984). The socioeconomic concentration explanation
suggests that concentration of people who are disadvantaged results in social isolation
which has a negative impact on labour market outcomes (O’Regan and Quigley
1998). The effect is felt on high school dropout rates and labour force participation
rates.
Several mechanisms are suggested as influencing labour market outcomes under the
socioeconomic concentration model alluded to above. Among these are the absence
of positive role models; lack of informal job networks; and disruptive influences. The
main contrast between the models is that the internal composition of neighbourhoods
matters more than external employment opportunities (O’Regan and Quigley, 1998).
Among the main work examining these issues in Australia are Gregory and Hunter
(1995), Hunter (1996) and Kelly and Lewis (2000, 2002), each finds supporting
evidence of neighbourhood effects on employment outcomes.
Kelly and Lewis (2000, 2002) found that the average unemployment rate for the 15 to
19-year-old cohort was not much different from the adult rate in well-off
neighbourhoods in 1996, while in poorer neighbourhoods the rate was in excess of 30
per cent.
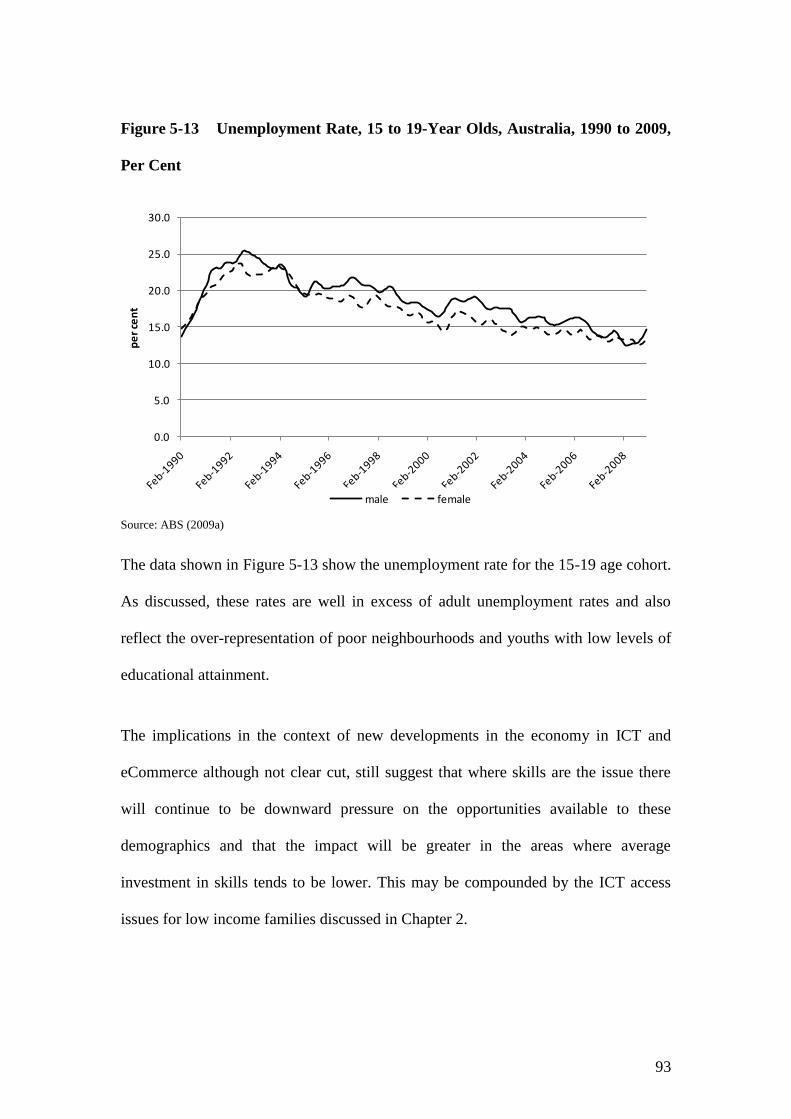
93
Figure 5-13 Unemployment Rate, 15 to 19-Year Olds, Australia, 1990 to 2009,
Per Cent
Source: ABS (2009a)
The data shown in Figure 5-13 show the unemployment rate for the 15-19 age cohort.
As discussed, these rates are well in excess of adult unemployment rates and also
reflect the over-representation of poor neighbourhoods and youths with low levels of
educational attainment.
The implications in the context of new developments in the economy in ICT and
eCommerce although not clear cut, still suggest that where skills are the issue there
will continue to be downward pressure on the opportunities available to these
demographics and that the impact will be greater in the areas where average
investment in skills tends to be lower. This may be compounded by the ICT access
issues for low income families discussed in Chapter 2.
0.0
5.0
10.0
15.0
20.0
25.0
30.0
pe
r ce
nt
male female
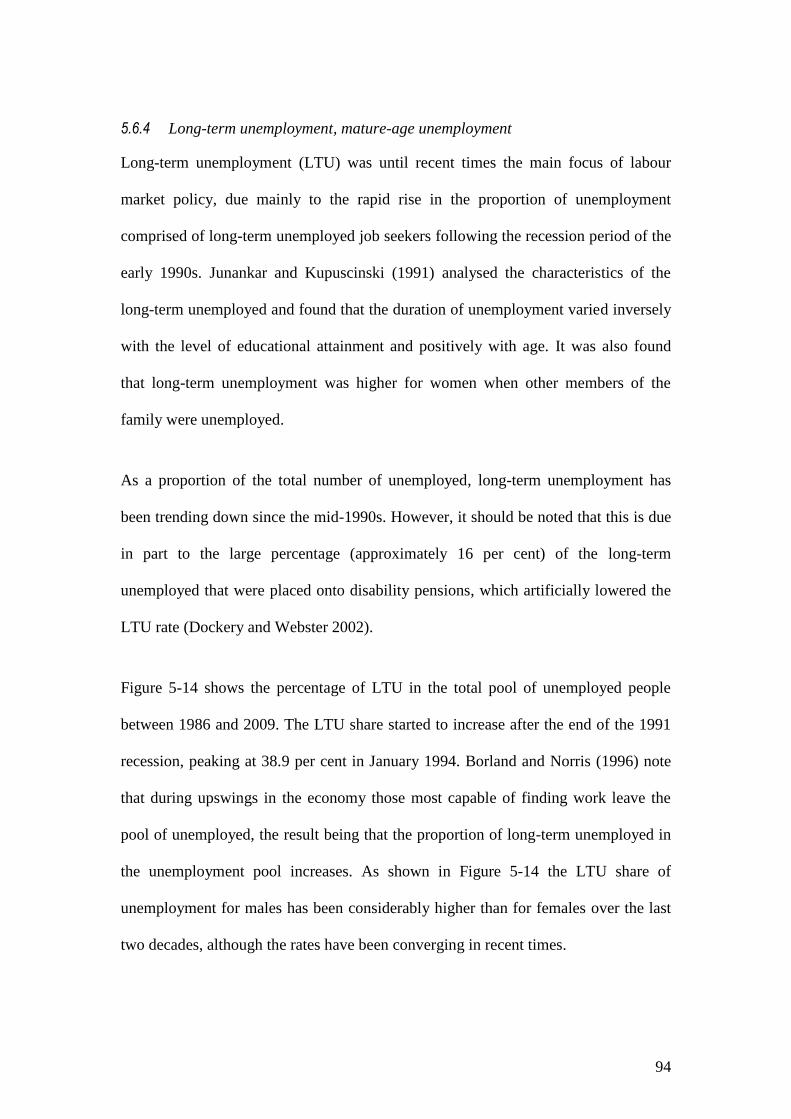
94
5.6.4 Long-term unemployment, mature-age unemployment
Long-term unemployment (LTU) was until recent times the main focus of labour
market policy, due mainly to the rapid rise in the proportion of unemployment
comprised of long-term unemployed job seekers following the recession period of the
early 1990s. Junankar and Kupuscinski (1991) analysed the characteristics of the
long-term unemployed and found that the duration of unemployment varied inversely
with the level of educational attainment and positively with age. It was also found
that long-term unemployment was higher for women when other members of the
family were unemployed.
As a proportion of the total number of unemployed, long-term unemployment has
been trending down since the mid-1990s. However, it should be noted that this is due
in part to the large percentage (approximately 16 per cent) of the long-term
unemployed that were placed onto disability pensions, which artificially lowered the
LTU rate (Dockery and Webster 2002).
Figure 5-14 shows the percentage of LTU in the total pool of unemployed people
between 1986 and 2009. The LTU share started to increase after the end of the 1991
recession, peaking at 38.9 per cent in January 1994. Borland and Norris (1996) note
that during upswings in the economy those most capable of finding work leave the
pool of unemployed, the result being that the proportion of long-term unemployed in
the unemployment pool increases. As shown in Figure 5-14 the LTU share of
unemployment for males has been considerably higher than for females over the last
two decades, although the rates have been converging in recent times.
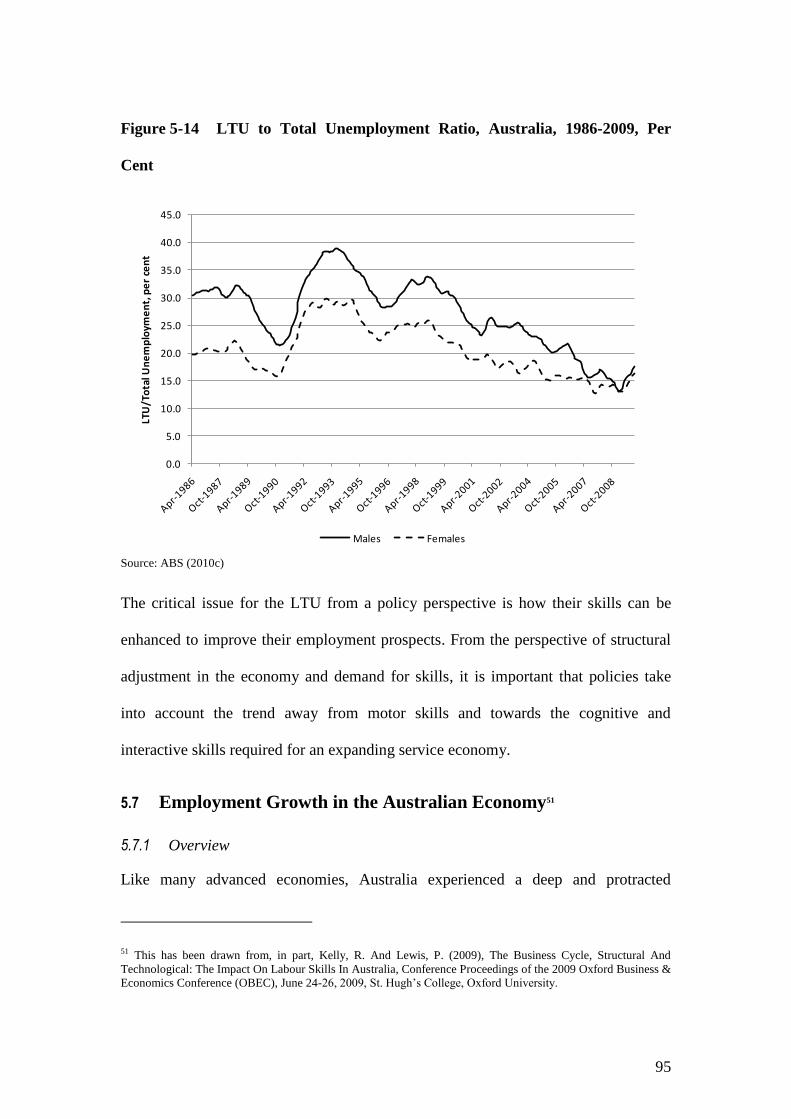
95
Figure 5-14 LTU to Total Unemployment Ratio, Australia, 1986-2009, Per
Cent
Source: ABS (2010c)
The critical issue for the LTU from a policy perspective is how their skills can be
enhanced to improve their employment prospects. From the perspective of structural
adjustment in the economy and demand for skills, it is important that policies take
into account the trend away from motor skills and towards the cognitive and
interactive skills required for an expanding service economy.
5.7 Employment Growth in the Australian Economy51
5.7.1 Overview
Like many advanced economies, Australia experienced a deep and protracted
51 This has been drawn from, in part, Kelly, R. And Lewis, P. (2009), The Business Cycle, Structural And
Technological: The Impact On Labour Skills In Australia, Conference Proceedings of the 2009 Oxford Business &
Economics Conference (OBEC), June 24-26, 2009, St. Hugh’s College, Oxford University.
0.0
5.0
10.0
15.0
20.0
25.0
30.0
35.0
40.0
45.0
LTU
/To
tal U
ne
mp
loym
en
t, p
er
cen
t
Males Females
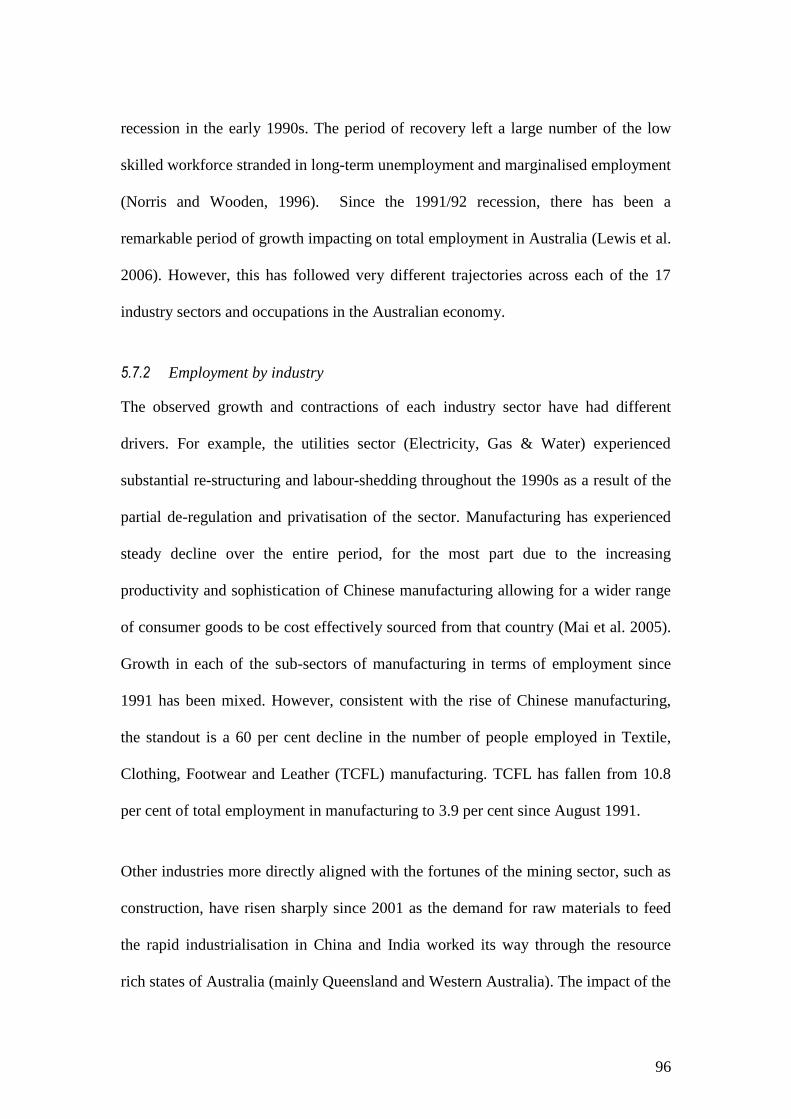
96
recession in the early 1990s. The period of recovery left a large number of the low
skilled workforce stranded in long-term unemployment and marginalised employment
(Norris and Wooden, 1996). Since the 1991/92 recession, there has been a
remarkable period of growth impacting on total employment in Australia (Lewis et al.
2006). However, this has followed very different trajectories across each of the 17
industry sectors and occupations in the Australian economy.
5.7.2 Employment by industry
The observed growth and contractions of each industry sector have had different
drivers. For example, the utilities sector (Electricity, Gas & Water) experienced
substantial re-structuring and labour-shedding throughout the 1990s as a result of the
partial de-regulation and privatisation of the sector. Manufacturing has experienced
steady decline over the entire period, for the most part due to the increasing
productivity and sophistication of Chinese manufacturing allowing for a wider range
of consumer goods to be cost effectively sourced from that country (Mai et al. 2005).
Growth in each of the sub-sectors of manufacturing in terms of employment since
1991 has been mixed. However, consistent with the rise of Chinese manufacturing,
the standout is a 60 per cent decline in the number of people employed in Textile,
Clothing, Footwear and Leather (TCFL) manufacturing. TCFL has fallen from 10.8
per cent of total employment in manufacturing to 3.9 per cent since August 1991.
Other industries more directly aligned with the fortunes of the mining sector, such as
construction, have risen sharply since 2001 as the demand for raw materials to feed
the rapid industrialisation in China and India worked its way through the resource
rich states of Australia (mainly Queensland and Western Australia). The impact of the
97
mining boom on the economies of the resource states was so pronounced that they
have been effectively running at over full employment (male unemployment fell
below 2 per cent in 2008 in Western Australia) and had to recruit heavily from
overseas to fill skill shortages.
Table 5-4 Employment Growth by Industry, Australia, 1991-2006
Industry Annual growth
rate %
Total change
%
Total Change (000s)
1. Agriculture, Forestry and Fishing -0.9 -12.8 -52.1
2. Mining 2.3 41.0 38.7
3. Manufacturing -0.2 -2.2 -24.2
4. Electricity, Gas and Water Supply -1.3 -18.2 -18.7
5. Construction 3.8 75.2 382.9
6. Wholesale Trade -0.2 -2.4 -11.7
7. Retail Trade 2.2 37.9 409.6
8. Accommodation, Cafes and Restaurants 2.4 42.0 141.8
9. Transport 1.3 21.2 81.3
10. Communication Services 1.6 27.1 38.1
11. Finance and Insurance 0.6 9.1 31.7
12. Property and Business Services 4.8 101.0 625.3
13. Government Admin and Defence 2.4 42.8 152.6
14. Education 1.7 29.5 160.0
15. Health and Community Services 2.9 52.6 367.2
16. Cultural and Recreational Services 3.3 63.3 101.9
17. Personal and Other Services 2.3 39.9 111.1
18. Total Industries 1.9 32.9 2,517.7
Source: ABS (2009e)
The evidence shows that the strong economic growth across Australia after 2000 lead
to pervasive skill shortages. A significant contribution to growth came from
population growth which fed into increased employment demand in the Construction
industry. To alleviate shortages in skills companies have relied heavily on skilled

98
migration into Australia (Lewis and Corliss 2010).
The overall growth in employment has been very different between industries over
the period in question (see Table 5-4) and the changes have occurred at different
stages for a range of industries (see Figure 5-15), suggesting different drivers are
influencing the structural changes taking place.
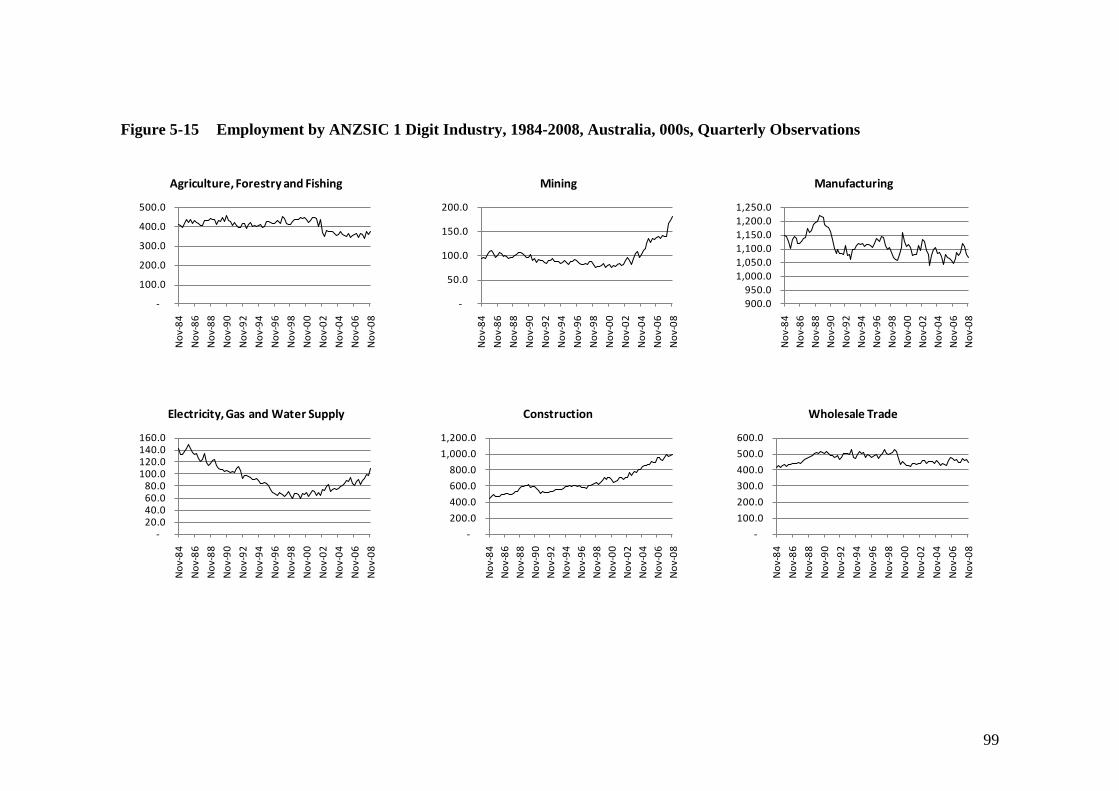
99
Figure 5-15 Employment by ANZSIC 1 Digit Industry, 1984-2008, Australia, 000s, Quarterly Observations
-
100.0
200.0
300.0
400.0
500.0
No
v-8
4
No
v-8
6
No
v-8
8
No
v-9
0
No
v-9
2
No
v-9
4
No
v-9
6
No
v-9
8
No
v-0
0
No
v-0
2
No
v-0
4
No
v-0
6
No
v-0
8
Agriculture, Forestry and Fishing
-
50.0
100.0
150.0
200.0
No
v-8
4
No
v-8
6
No
v-8
8
No
v-9
0
No
v-9
2
No
v-9
4
No
v-9
6
No
v-9
8
No
v-0
0
No
v-0
2
No
v-0
4
No
v-0
6
No
v-0
8
Mining
900.0
950.0
1,000.0
1,050.0
1,100.0
1,150.0
1,200.0
1,250.0
No
v-8
4
No
v-8
6
No
v-8
8
No
v-9
0
No
v-9
2
No
v-9
4
No
v-9
6
No
v-9
8
No
v-0
0
No
v-0
2
No
v-0
4
No
v-0
6
No
v-0
8
Manufacturing
-20.0 40.0 60.0 80.0
100.0 120.0 140.0 160.0
No
v-8
4
No
v-8
6
No
v-8
8
No
v-9
0
No
v-9
2
No
v-9
4
No
v-9
6
No
v-9
8
No
v-0
0
No
v-0
2
No
v-0
4
No
v-0
6
No
v-0
8
Electricity, Gas and Water Supply
-
200.0
400.0
600.0
800.0
1,000.0
1,200.0
No
v-8
4
No
v-8
6
No
v-8
8
No
v-9
0
No
v-9
2
No
v-9
4
No
v-9
6
No
v-9
8
No
v-0
0
No
v-0
2
No
v-0
4
No
v-0
6
No
v-0
8
Construction
-
100.0
200.0
300.0
400.0
500.0
600.0
No
v-8
4
No
v-8
6
No
v-8
8
No
v-9
0
No
v-9
2
No
v-9
4
No
v-9
6
No
v-9
8
No
v-0
0
No
v-0
2
No
v-0
4
No
v-0
6
No
v-0
8
Wholesale Trade
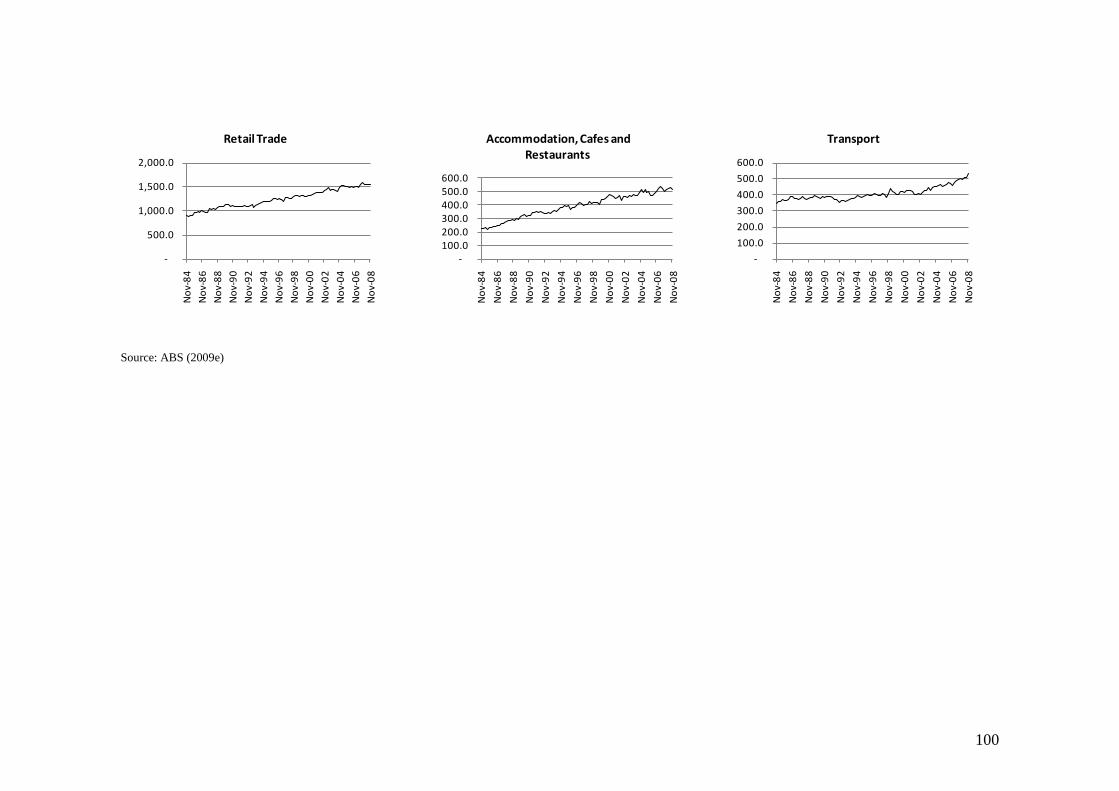
100
Source: ABS (2009e)
-
500.0
1,000.0
1,500.0
2,000.0
No
v-8
4
No
v-8
6
No
v-8
8
No
v-9
0
No
v-9
2
No
v-9
4
No
v-9
6
No
v-9
8
No
v-0
0
No
v-0
2
No
v-0
4
No
v-0
6
No
v-0
8
Retail Trade
-100.0 200.0 300.0 400.0 500.0 600.0
No
v-8
4
No
v-8
6
No
v-8
8
No
v-9
0
No
v-9
2
No
v-9
4
No
v-9
6
No
v-9
8
No
v-0
0
No
v-0
2
No
v-0
4
No
v-0
6
No
v-0
8
Accommodation, Cafes and Restaurants
-
100.0
200.0
300.0
400.0
500.0
600.0
No
v-8
4
No
v-8
6
No
v-8
8
No
v-9
0
No
v-9
2
No
v-9
4
No
v-9
6
No
v-9
8
No
v-0
0
No
v-0
2
No
v-0
4
No
v-0
6
No
v-0
8
Transport
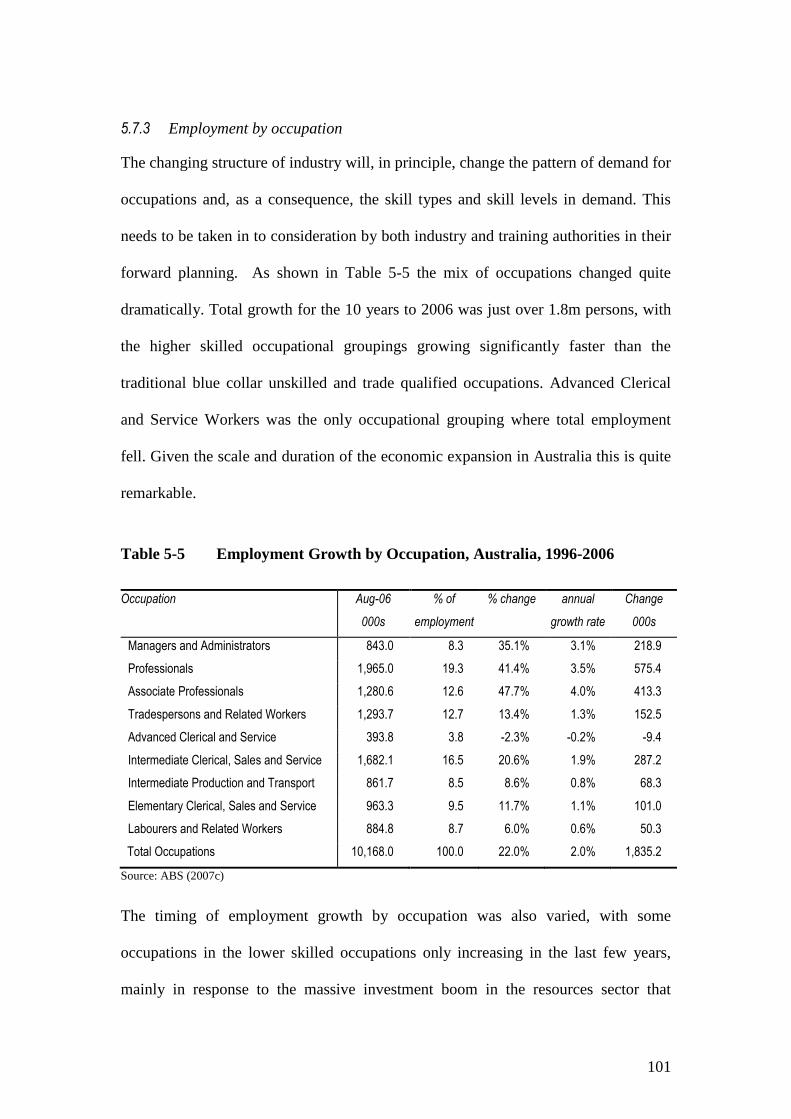
101
5.7.3 Employment by occupation
The changing structure of industry will, in principle, change the pattern of demand for
occupations and, as a consequence, the skill types and skill levels in demand. This
needs to be taken in to consideration by both industry and training authorities in their
forward planning. As shown in Table 5-5 the mix of occupations changed quite
dramatically. Total growth for the 10 years to 2006 was just over 1.8m persons, with
the higher skilled occupational groupings growing significantly faster than the
traditional blue collar unskilled and trade qualified occupations. Advanced Clerical
and Service Workers was the only occupational grouping where total employment
fell. Given the scale and duration of the economic expansion in Australia this is quite
remarkable.
Table 5-5 Employment Growth by Occupation, Australia, 1996-2006
Occupation Aug-06
000s
% of
employment
% change annual
growth rate
Change
000s
Managers and Administrators 843.0 8.3 35.1% 3.1% 218.9
Professionals 1,965.0 19.3 41.4% 3.5% 575.4
Associate Professionals 1,280.6 12.6 47.7% 4.0% 413.3
Tradespersons and Related Workers 1,293.7 12.7 13.4% 1.3% 152.5
Advanced Clerical and Service 393.8 3.8 -2.3% -0.2% -9.4
Intermediate Clerical, Sales and Service 1,682.1 16.5 20.6% 1.9% 287.2
Intermediate Production and Transport 861.7 8.5 8.6% 0.8% 68.3
Elementary Clerical, Sales and Service 963.3 9.5 11.7% 1.1% 101.0
Labourers and Related Workers 884.8 8.7 6.0% 0.6% 50.3
Total Occupations 10,168.0 100.0 22.0% 2.0% 1,835.2
Source: ABS (2007c)
The timing of employment growth by occupation was also varied, with some
occupations in the lower skilled occupations only increasing in the last few years,
mainly in response to the massive investment boom in the resources sector that
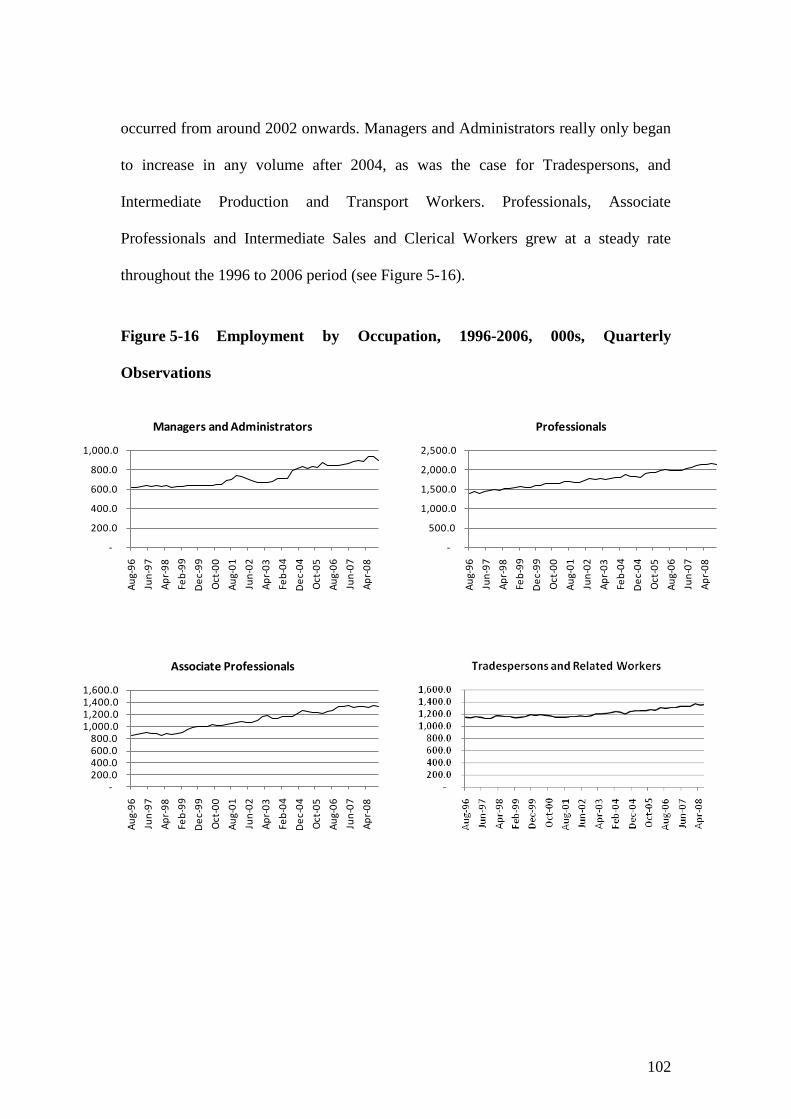
102
occurred from around 2002 onwards. Managers and Administrators really only began
to increase in any volume after 2004, as was the case for Tradespersons, and
Intermediate Production and Transport Workers. Professionals, Associate
Professionals and Intermediate Sales and Clerical Workers grew at a steady rate
throughout the 1996 to 2006 period (see Figure 5-16).
Figure 5-16 Employment by Occupation, 1996-2006, 000s, Quarterly
Observations
-
200.0
400.0
600.0
800.0
1,000.0
Au
g-9
6
Jun
-97
Ap
r-9
8
Feb
-99
De
c-9
9
Oct
-00
Au
g-0
1
Jun
-02
Ap
r-0
3
Feb
-04
De
c-0
4
Oct
-05
Au
g-0
6
Jun
-07
Ap
r-0
8
Managers and Administrators
-
500.0
1,000.0
1,500.0
2,000.0
2,500.0
Au
g-9
6
Jun
-97
Ap
r-9
8
Feb
-99
De
c-9
9
Oct
-00
Au
g-0
1
Jun
-02
Ap
r-0
3
Feb
-04
De
c-0
4
Oct
-05
Au
g-0
6
Jun
-07
Ap
r-0
8
Professionals
-200.0 400.0 600.0 800.0
1,000.0 1,200.0 1,400.0 1,600.0
Au
g-9
6
Jun
-97
Ap
r-9
8
Feb
-99
De
c-9
9
Oct
-00
Au
g-0
1
Jun
-02
Ap
r-0
3
Feb
-04
De
c-0
4
Oct
-05
Au
g-0
6
Jun
-07
Ap
r-0
8
Associate Professionals
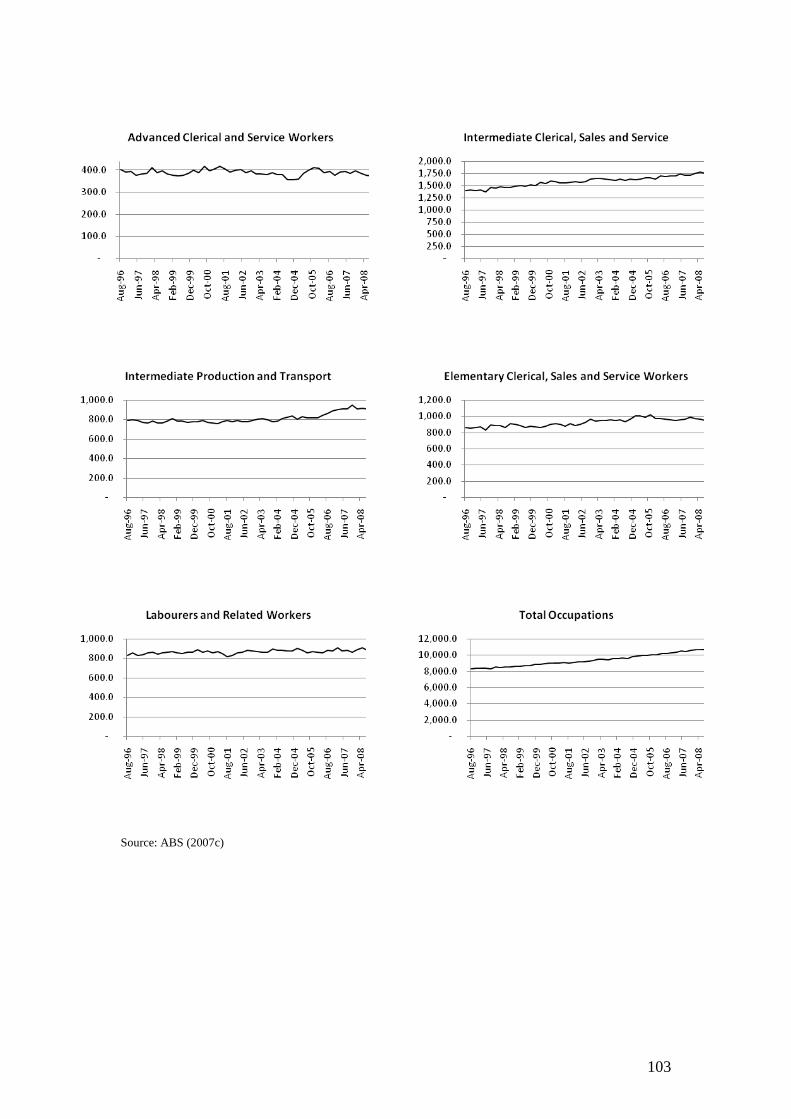
103
Source: ABS (2007c)
104
5.8 Summary
There has been a significant ‘upskilling’ for much of the available labour supply in
Australia over the last two decades. Highly skilled labour is not only more
productive, as evidenced by the higher rates of return to education, on average, for
degree qualified workers, but also increases the economy’s capacity to absorb new
technologies. It has been shown that the introduction of the latest technology
embedded in new capital generally increases output per worker, after initial
adjustment costs (Helpman and Rangel 1999).
It is not the main focus of this thesis, but nonetheless there remains a significant
question as to whether the enrolment patterns by stream and educational level have
been in response to available employment opportunities. Alternatively, it may be the
case that the education sector developed new programs and supplied new types of
skills to the market, thereby opening up new opportunities for employers in terms of
the technology they utilise. A measure of the efficiency of the education sector, as the
main supplier of skills to the economy, is the extent to which it delivers skills that
align with available employment opportunities (Howell and Wolff 1990). This helps
optimise the allocative, technical and dynamic efficiency of the economy.
The reform of industrial relations over the post-1983 period could be best
characterised as a shift from centralised and rigid wages and conditions' outcomes to
one of flexible and workplace specific outcomes. The evidence presented in this
chapter shows that there were improvements in total factor productivity associated
with reforms. Workplaces became more flexible, evidenced by a reduction in
demarcation disputes and the observed increases of labour-hire workers into
105
unionised sites. Union density collapsed, industrial disputation fell dramatically, and
real wages increased. At the same time, inflation stayed low and within a tight band,
while unemployment fell to historical lows (and employment rose substantially).
Changes that have occurred in the industry and occupational structure of employment
are not necessarily a direct result of the reforms in the industrial relations arena.
However, it is likely that the flexibility achieved and the accompanying reductions in
industrial action will have at the very least facilitated the structural changes that have
occurred.
The raft of microeconomic reform undertaken in Australia since the 1980s and into
1990s clearly had an effect on both labour and multifactor productivity. Industrial
disputation fell, workplaces became more flexible, tariff protections were reduced
substantially and the government stepped back from the direct production of market
sector goods and services by privatising or corporatising banks, airlines and utilities.
Real wages grew while at the same time RULC fell sharply and its corollary, GVA
per hour worked, increased. This flowed through to increased employment, as RULC
is inversely related to labour demand (Lewis and McDonald 2002). However, the
evidence shows that there was significant variation between industries and time
periods. It would be expected that the changes observed and the variations between
industry productivity growth, especially labour productivity and RULC, would be
reflected in the changing composition of employment.
106
6 SKILL BIASED TECHNOLOGICAL CHANGE
6.1 Overview
Over the last two decades there have been significant changes in the skill structure of
advanced economies. In particular, there has been a trend away from low skilled
employment and an increase in the relative demand for skilled workers. This has been
reflected in changing wage relativities in the US and UK, and over-representation of
low-skilled workers in unemployment in Western Europe (Berman Bound and
Machin 1998). Much of the literature analysing these changes focuses on the role
information and communication technologies (ICT) have played in these changes
(Ágenor and Aizenman 1996; Autor, Levy and Murnane 2003; Berman, Bound and
Machin 1998, Bresnahan Brynjolfson Hitt 2002; Card and DiNardo 2002; Corvers
and Marikull 2007; Spitz 2003; Howell and Wolff 1990; Wolff 1995).
Alternative arguments in the literature link changing skill demand to institutional
change (Blackburn, Bloom and Freeman 1991), organisational change (Caroli 2003;
Caroli 1999; Greenan 2003) or trade, typically in the form of international
outsourcing of part or all of the manufacturing process (Borjas and Ramey 1995;
Haskel and Slaughter 2001; Lawrence and Slaughter 1993; Topp et al. 2005). The
dynamics of the ‘trade’ related explanations revolve around the Stolper-Samuelson
theorem (ST). This issue is discussed in further detail at Section 6.3.1 and Section
6.4.3.
Invariably technology, especially ICT, still plays a facilitative role in the underlying
107
causes described in the organisation and trade related theories of skill restructuring.
Bresnahan, Brynjolfsson and Hitt (2002) have also identified complementarities
among each of these innovations with respect to skill demand (also a conclusion
drawn by Acemoglu (2002)), a relationship they summarise as follows:
Firms do not simply plug in computers or telecommunications equipment and achieve
service quality or efficiency gains. Instead they go through a process of organisational
redesign and make substantial changes to their product and service mix. This raises the
possibility that computers affect labor demand not only directly, as has been previously
studied, but indirectly through other firm-level changes. That is, IT is embedded in a
cluster of related innovations, notably organisational changes and product innovation.
These three complementary innovations—a) increased use of IT, b) changes in
organisation practices, and c) changes products and services—taken together are the
SBTC that calls for a higher-skilled labor mix. (pp. 340-41)
The general consensus that emerges from the economics literature is that ICT’
increasing spread and depth at the firm or industry level has played at least some role
in the observed increases in skilled employment. The link between low-skilled
employment and ICT is less clear cut. Trade related theories appear strongest when
considering the decline of production workers in advanced economies, although even
then there is some conjecture as to how strong the link is (Abrego and Edwards
2002). Nonetheless, Berman, Bound and Machin (1998) show that only 9 per cent of
the displacement of unskilled workers is explained by trade and that pervasive
technological change, such as ICT, are the source of the majority of the observed
changes.
Autor, Levy and Murnane (2003) point out that the substitution of repetitive
information-processing tasks that has occurred with the implementation of ICT marks
an important reversal from previous episodes of technological innovation, such as
experienced in the 19th
century when a rapid increase in demand for clerical tasks
108
accompanied the increase in high-technology capital (see also Goldin and Katz 1998).
This is because of the unique technological feature of ICT capital: it is amenable to
repetitive cognitive tasks; whereas previous technologies were only suited to
repetitive manual tasks (Spitz 2003).
In its broadest sense, technology determines the way factors of production are
combined to produce goods and services. Given that labour is heterogeneous,
particularly in relation to skill type and skill complexity, it is of particular interest
whether technological change has been driving observed changes in skill
requirements in the labour market.
6.2 Skill Biased Technological Change (SBTC) Hypothesis
Observed changes in the degree of wage inequality, particularly in the US, has
given rise to the Skill Biased Technological Change (SBTC) hypothesis. The
principle argument of SBTC is that technological change is not neutral to the
type of labour it affects. In particular, more highly skilled labour tends to be
positively affected by new technologies and low-skilled labour is adversely
affected.
The description of SBTC provided above can be represented in a simple
isoquant diagram. First, a useful distinction between technical change and
technological change is provided by Bosworth, Dawkins and Stromback
(1996). Technical change can be described as a move along an isoquant as
firms respond to changes in factor prices. That is, given a change in the prices
of factor inputs, firms will choose an alternative technically feasible mix in
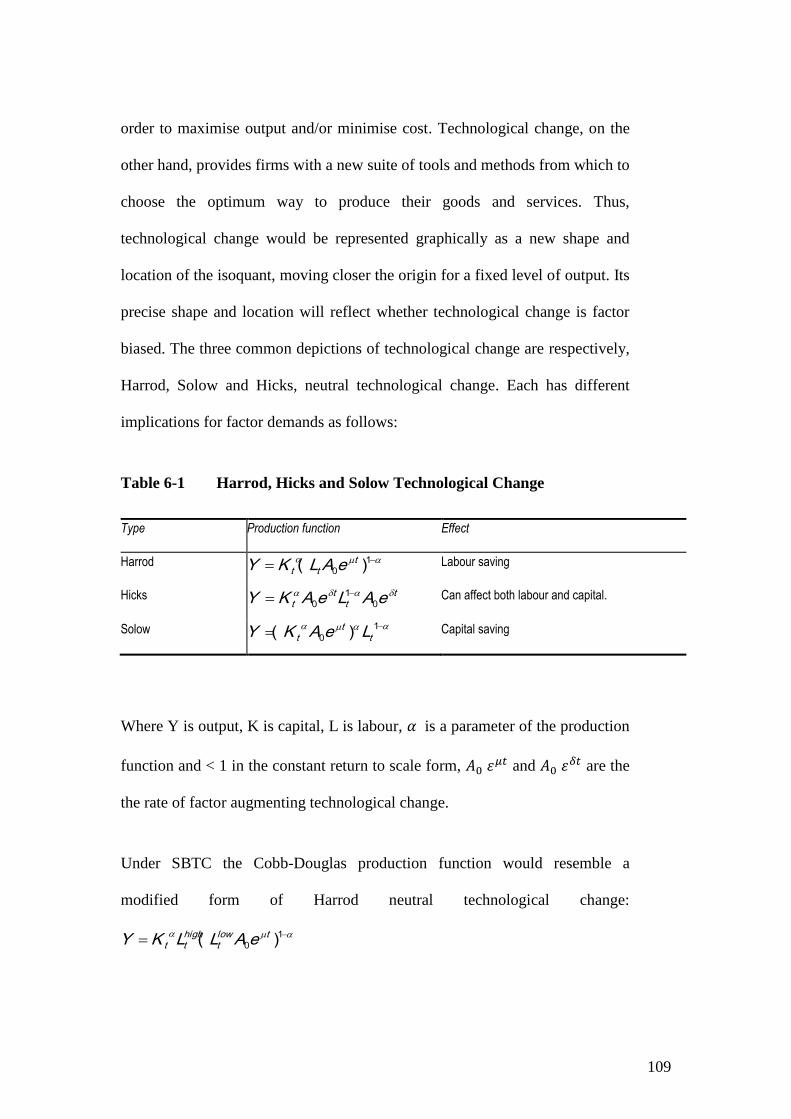
109
order to maximise output and/or minimise cost. Technological change, on the
other hand, provides firms with a new suite of tools and methods from which to
choose the optimum way to produce their goods and services. Thus,
technological change would be represented graphically as a new shape and
location of the isoquant, moving closer the origin for a fixed level of output. Its
precise shape and location will reflect whether technological change is factor
biased. The three common depictions of technological change are respectively,
Harrod, Solow and Hicks, neutral technological change. Each has different
implications for factor demands as follows:
Table 6-1 Harrod, Hicks and Solow Technological Change
Type Production function Effect
Harrod 1
0 )( ttt eALKY Labour saving
Hicks tt
tt eALeAKY
0
1
0
Can affect both labour and capital.
Solow
1
0 )( tt
t LeAKY Capital saving
Where Y is output, K is capital, L is labour, is a parameter of the production
function and < 1 in the constant return to scale form, and
are the
the rate of factor augmenting technological change.
Under SBTC the Cobb-Douglas production function would resemble a
modified form of Harrod neutral technological change:
1
0 )( tlowt
hightt eALLKY
110
Where:
Lt high is the input of high-skilled labour at time t
Lt low is the input of low-skilled labour at time t
Ktα is the input of capital at time t
is the rate of factor augmenting technological change
α is a parameter of the production function and < 1 in the constant return
to scale form.
In Figure 6-1 a production isoquant is shown for a firm employing two types of
labour: high-skill (LH ) and low-skill (LH). The impact of a change in the
relative wages between high-skill (wH) and low-skill (wL) labour is shown for
the case where capital inputs and prices are kept constant. The isoquant reflects
the fixed capital input and hence a fixed level of technology in the short-run
case. The downward sloping straight lines reflect the ratio of high and low-skill
wages (–wL/wH). The superscripts, 0,1 indicate two periods in time, the former
providing the starting position.
An increase in the relative price of a factor should lead to a reduction in its use
in production for a given level of output. This is shown as a move along the
isoquant in Figure 6-1. The high-skill labour cost increases relative to low-skill
labour, with the slope of the isocost line becoming flatter, shown as the dashed
line with a new slope of –wL0/wH
1. Given the fixed level of output and state of
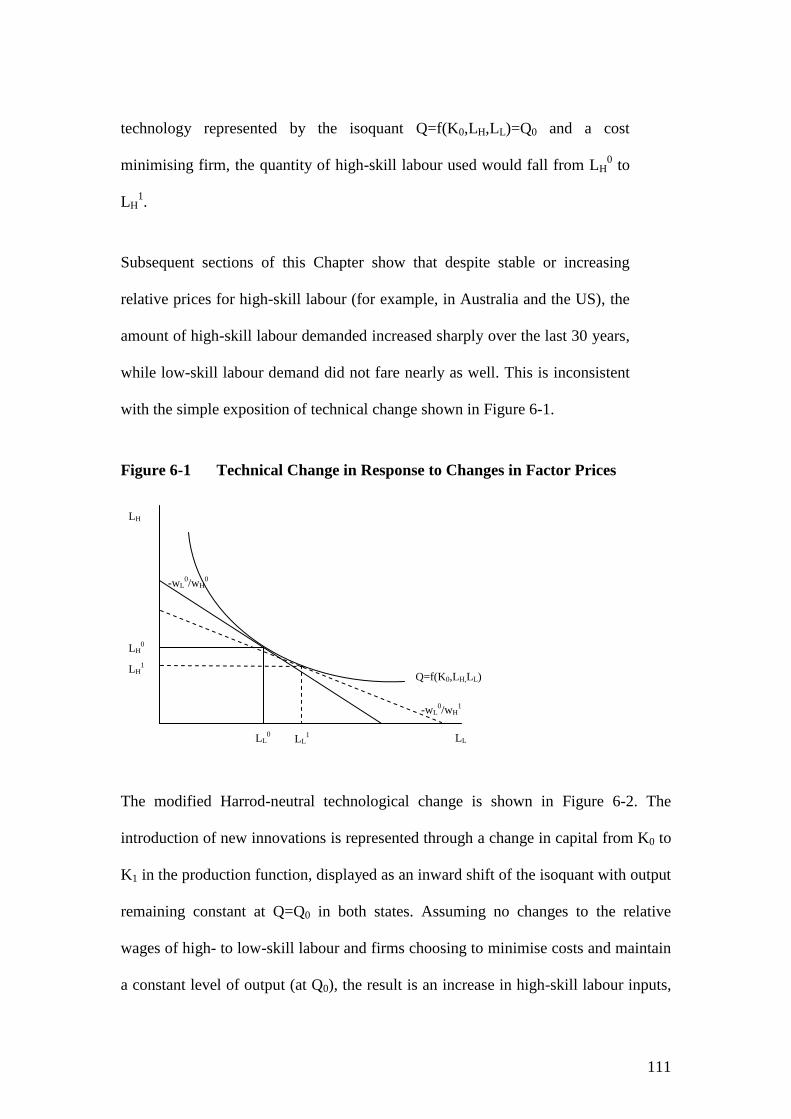
111
technology represented by the isoquant Q=f(K0,LH,LL)=Q0 and a cost
minimising firm, the quantity of high-skill labour used would fall from LH0 to
LH1.
Subsequent sections of this Chapter show that despite stable or increasing
relative prices for high-skill labour (for example, in Australia and the US), the
amount of high-skill labour demanded increased sharply over the last 30 years,
while low-skill labour demand did not fare nearly as well. This is inconsistent
with the simple exposition of technical change shown in Figure 6-1.
Figure 6-1 Technical Change in Response to Changes in Factor Prices
The modified Harrod-neutral technological change is shown in Figure 6-2. The
introduction of new innovations is represented through a change in capital from K0 to
K1 in the production function, displayed as an inward shift of the isoquant with output
remaining constant at Q=Q0 in both states. Assuming no changes to the relative
wages of high- to low-skill labour and firms choosing to minimise costs and maintain
a constant level of output (at Q0), the result is an increase in high-skill labour inputs,
LH
LL
Q=f(K0,LH,LL)
LH0
LH1
-wL0/wH
0
-wL0/wH
1
LL0
LL1
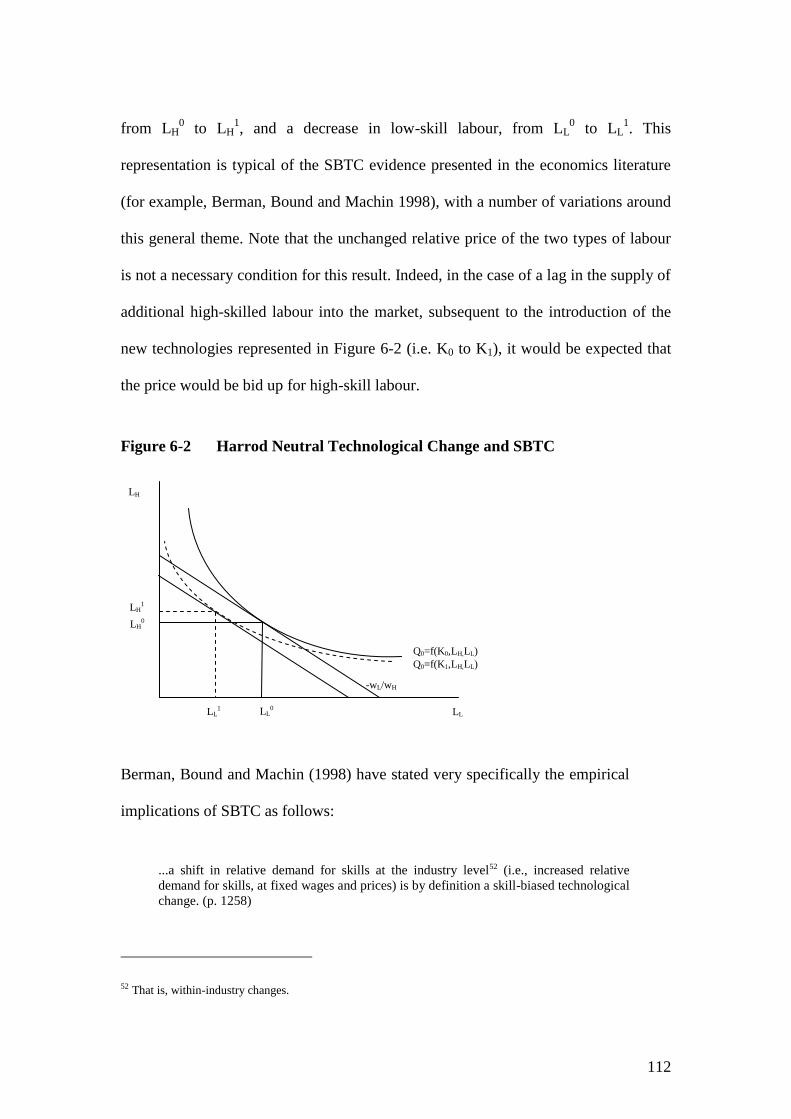
112
from LH0 to LH
1, and a decrease in low-skill labour, from LL
0 to LL
1. This
representation is typical of the SBTC evidence presented in the economics literature
(for example, Berman, Bound and Machin 1998), with a number of variations around
this general theme. Note that the unchanged relative price of the two types of labour
is not a necessary condition for this result. Indeed, in the case of a lag in the supply of
additional high-skilled labour into the market, subsequent to the introduction of the
new technologies represented in Figure 6-2 (i.e. K0 to K1), it would be expected that
the price would be bid up for high-skill labour.
Figure 6-2 Harrod Neutral Technological Change and SBTC
Berman, Bound and Machin (1998) have stated very specifically the empirical
implications of SBTC as follows:
...a shift in relative demand for skills at the industry level52 (i.e., increased relative
demand for skills, at fixed wages and prices) is by definition a skill-biased technological
change. (p. 1258)
52 That is, within-industry changes.
LH
LL
Q0=f(K0,LH,LL)
LL0
LH0
LL1
LH1
-wL/wH
Q0=f(K1,LH,LL)
113
This definition allows for a whole range of innovations to cause SBTC, whether they
be physical (hard) or organisational (soft) in nature (Bresnahan, Brynjolfsson and Hitt
2002). Indeed, the source is of little consequence in this definition since the outcome
(i.e. changed skill structure within industries) is ostensibly sufficient evidence of
SBTC.
A more narrow interpretation of the SBTC hypothesis focuses solely on ICT (see, for
example, Card and DiNardo 2002). Given that ICT have been the most pervasive and
visible innovation over the last two to three decades this emphasis might seem
appropriate, although not to the exclusion of the 'cluster of innovations' referred to by
Bresnahan, Brynjolfsson and Hitt (2002).
An extension of the SBTC hypothesis specifies the way that ICT impact on the
demand for labour by skill type. The proposition is that tasks that are repetitive and
easily routinised are more likely to be substituted than ‘complex and idiosyncratic’
tasks. Work that is cognitively demanding and that requires judgment or creativity, on
the other hand, is much more difficult to automate and computerise (Autor, Levy and
Murnane 2003; Bresnahan, Brynjolfsson and Hitt 2002; Spitz 2003) and less likely to
be substituted.
6.3 Evidence of SBTC
A number of studies have measured changes in the skill composition of employed
persons for Australia (see Borland and Wilkins 1996; Borland 1999; Cully 1999; De
Laine, Laplagne and Stone 2000; Kelly and Lewis 2003, 2009; Kelly 2007; Pappas
1998; Wooden 2000). There is also an expansive international literature on the issue
114
(for instance, Agenor and Aizeman 1996; Autor, Katz and Krueger 1998; Berman,
Bound and Griliches 1994; Berman, Bound and Machin 1998; Bresnahan,
Brynjolfsson and Hitt 2002; Bound and Johnson 1992; Chennells and Van Reenen
1997; Corvers and Marikull 2007; Greenan 2003; Goldin and Katz 1998; Katz and
Murphy 1992; Machin 1995; Maurin and Thesmar 2004; Spitz 2003; Howell and
Wolff 1990; Wolff 1995).
Most of these studies use educational attainment, employment experience or the type
of work undertaken, such as white and blue collar work,53 to proxy for skill.54 Notable
exceptions are Wolff (1995), Pappas (1998), Autor, Levy and Murnane (2003), Kelly
and Lewis (2003), Kelly (2007), Kelly and Lewis (2009) and Spitz (2003), and
Howell and Wolff (1990). These studies use occupational task descriptions compiled
by the US Department of Labour (USDOL) to obtain a measure of the complexity of
various skills used in different occupations. These are then combined with occupation
by industry employment matrices to obtain average skill measures for an industry.
Other variations exist, such as Colecchia and Papaconstantinou (1996) who
distinguish between high- and low-skill within a white-blue collar split of
occupations.
6.3.1 Firm level studies
A more specific approach to identify the nature of technology-labour interactions has
been to look at a cluster of developments in the workplace, the ‘demanding unit’ for
labour, and their impact on productivity (for example, Autor, Levy and Murnane
53 International literature more commonly refers to this as ‘production’ and ‘non-production’ employment.
54 A detailed discussion of the definition and measurement of skill is provided in Chapter 7.
115
2000; Bresnahan, Brynjolfsson and Hitt 2002; Caroli 2003; Gera and Masse 1996;
Wannell and Ali 2002). The outcome of this research has been to show that the
complementarity between skill and IT related technology depends to some extent on
the existence of other factors, such as high levels of human capital and
accommodating workplace organisation. There is also interdependence between
technological change, organisational change and changes in skill (Autor, Levy and
Murnane 2000; Autor, Levy and Murnane 2003; Bresnahan, Brynjolfsson and Hitt
2002; Greenan 2003; Caroli 2003), although the precise linkages are often difficult to
determine (Greenan 2003).
A number of studies have found complementarity between college-educated workers
and specific ICT applications at the firm level for the US. Autor, Levy and Murnane
(2000), for example, found that image processing technology installed during the
1990s in a major US bank directly substituted for data entry jobs, these typically
being filled by non-college educated labour. Jobs involving more discretion and
interdependence were also streamlined. Nonetheless, subsequently there was more
emphasis placed on the employment of college graduates relative to less educated
labour.
Bresnahan, Brynjolfsson and Hitt (2002) combine panel data from a survey of firms
for 1987 to 1994 to examine the complementarity between human capital, workplace
organisation and Information Technology (IT) capital. They argue that the decline in
IT prices should have lead to complementary investments in specific types of
workplace organisation, product and service innovations, and ultimately increases in
skill demand. Among the findings is that IT measures are correlated with policies in
116
individual firms to increase investment in human capital. Bresnahan, Brynjolfsson
and Hitt (2002) also estimated a production function with the log of value added as
the dependent variable.55 The explanatory variables included capital, labour and a
term capturing the three complementary inputs of interest – human capital, IT capital
and workplace organisation. The estimated model indicated that a firm that is high on
all three measures of IT capital, human capital and workplace organisation (defined
as two standard deviations above the mean) has very high predicted productivity—
approximately seven per cent above a firm that is at the mean on all three measures.
The findings also suggest that skill-biased organisational changes, induced by
technological change, may have had a much larger effect on skills than the direct
effects of technical change.
A common approach in the US literature on SBTC is the focus on wage relativities of
high- and low-skill workers (Howell and Wolff 1990), such as a study undertaken by
Katz and Murphy (1992). They analyse the movements in the relative wage of college
and non-college workers by industry for the period 1967 to 1987 for the US. Shift-
share analyses were undertaken to examine the relative contributions to changes in
demand for skill. The within-industry changes, as argued by Berman, Bound and
Machin (1998), indicate SBTC, while between-industry changes reflect some other
structural shift in the economy, typically increased competition from international
trade.
55 Value added was calculated as the total industry sales deflated by the associated industry deflator (or producer
cost price index where none was available), minus wages and deflated material costs (Bresnahan, Brynjolfsson
and Hitt 2002).
117
Within-sector shifts explained the majority of the relative increase in demand for
skilled workers in the Katz and Murphy (1992) study. Between-industry effects
increased (male) college educated workers by 30 per cent, relative to non-college
workers, between 1963 and 1987. The between-industry shifts decelerated in the
1980s sub-period, while the within-industry shifts accelerated over all periods. The
impact of increased trade was only important in the 1980s. The estimated elasticity of
substitution between college and non-college workers over the period was 1.4 per
cent. Katz and Murphy (1992) conclude that the shifts in relative demand for high-
skilled workers is most likely due to technological change.
Greenan (2003) utilises a survey of French firms undertaken in 1993, with two key
findings emerging from this work. First, the impact of organisational change on skill
structure in the firm was greater than the influence of increased use of technology,
including information technologies. The second piece of evidence was confirmation
of the link between organisational change and information technologies. This latter
point may provide some insight into 'how' information technologies are augmenting
the observed changes to occupational structures in many economies and is consistent
with the findings of other studies, such as Bresnahan, Brynjolfsson and Hitt (2002)
and Caroli (1999).
What remains unclear from the Greenan (2003) research is the extent to which it is a
reflection of: a) the French economy, institutional structures and management culture;
b) the specific period which the survey relates to (i.e. 1993 and changes occurring in
organisational structure in the previous five years); and c) whether the changes in
occupational structure could have occurred in isolation of the ICT and other
118
technological innovations that were introduced at that time. This issue applies more
generally to many of the SBTC-trade-organisation related studies. Indeed, many of
the US based studies analysing longer timeframes find support for both trade and ICT
related SBTC depending on which period is being referred to (such as Borjas and
Ramey 1995; Englehardt 2009; Katz and Murphy 1992).
Maurin and Thesmar (2004) used a large panel56 of French firms with greater than 20
employees covering the period 1984 to 1995 to examine the contribution of new
technologies to changes in skill demand. The new technologies examined were
personal computers and numerically controlled machines, with the survey data
providing specific information on individuals who used them.
The focus of their study was the role that the new technologies played in altering the
nature of activities assigned to workers. They argue that the reduction in the relative
costs of activities that are easiest to program and automate allowed for more labour to
be assigned to non-routine activities, especially the conception and marketing of new
products.57 These activities they found were biased toward higher-skilled labour.
Maurin and Thesmar’s (2004) contribution to the literature is novel in two ways.
First, their hypothesis is that rather than technology operating through modification of
the decision making process (such as Caroli 2003; Chennells and van Reenen 1997)58,
56 Approximately 10,000 firms accounting for total annual employment of 1.5m persons are included in the dataset
they use.
57 In this respect the study is closely aligned conceptually to Autor, Levy and Murnane (2003), the findings are
also consistent.
58 The argument is that technology does not directly affect the demand for skilled workers. Skilled workers are
assigned high technology equipment, primarily ICT, because they have greater ability and are more likely to
adapt. Thus, the decision of whether to implement or not is contingent on a high-skilled workforce.
119
it modifies the nature of activities assigned to workers. Second, they move beyond the
basic skill dichotomy of high-skill versus low-skill by categorising workers into five
categories of elementary activities. These are conception/development,
logistics/transportation, administration, production, and sales/marketing, with these
activities varying in the complexity and average skill level required.
Among the main findings are that the share of jobs linked to production-related
activities were reduced for both high- and low-skilled workers, while 'conception and
marketing of products' activities increased.59 The proportion of high-skilled experts
working on organising and supervising production processes declined. Over half of
the measured increase in the skill level can be explained by the increase in the share
of conception/development and sales/marketing activities. Maurin and Thesmar
(2004) estimated a labour demand model that shows that the relative productivity of
conception/development and sales/marketing activities within the group of skilled
workers increased significantly due to the diffusion of computers and computer-aided
technologies. New technologies not only reduced the demand for production workers
in manufacturing, but also reduced the demand for engineers doing routine design
work, due to new information technologies such as computer-aided design being
introduced. Vallas (1990) describes these trends as a sharpening divide between
‘…the labour of conception (or planning) and execution (doing). (p. 381)
Canadian studies have examined the recruitment patterns of high level ICT
implementers and found that new entrants tend to be more qualified than the existing
59 These activities are undertaken entirely by the occupations classified as high-skilled in the Maurin and Thesmar
(2004) skill dichotomy.
120
workforce in firms with the fastest growth rates for ICT implementation (Wannell and
Ali 2002; Gera and Masse 1996). Gera and Masse (1996) examine Canadian input-
output data for the period 1971 to 1991 to see if the employment structure moved
towards innovative industries60 and what factors were driving the changes. Like
Australia and many other advanced economies, the service sector experienced
substantial growth, while there was a relative decline in the primary, manufacturing
and construction sectors. Although there was an overall decline in manufacturing
employment, some industries within the manufacturing sector experienced rapid
growth, including computers and office equipment, aircraft manufacturing, rubber
and plastics and pharmaceuticals. Importantly, Gera and Masse (1996) found that
knowledge and technology intensive manufacturing industries experienced the
highest employment growth, while low-knowledge and low-technology
manufacturing firms actually shed jobs. As for US studies, they found that import
penetration adversely affected employment growth in low-knowledge, low-
technology, low-wage, low-skill, and labour-intensive manufacturing industries,
consistent with the Stolper-Samuelson61 explanation of factor usage.
Examination of Italian manufacturing firms by Bratti and Matteucci (2004) found that
R&D expenditure influenced the ratio of white-collar to blue-collar workers, with
some variation observed across ‘Pavitt’62 sectors. The key finding is that the
60 Which they have defined as knowledge-intensive, technology-intensive, science-based, skill-intensive or high-
wage industries.
61 Under the Stolper-Samuelson hypothesis, countries well endowed with unskilled labour will use that factor
relatively intensively.
62 Pavitt sectors are an industrial taxonomy (named after the originator of the concept, Professor Keith Pavitt) that
places firms within different sectors and according to the flow of knowledge between firms across these sectors.
They are comprised of Supplier Dominated (rely on sources of innovation external to the firm); Scale Intensive
(large scale manufacturers producing basic goods and consumer durables, innovation may be sourced internally or
121
innovations were labour saving, operating through the reduction of skilled workers.
They attribute this to the structure of Italian manufacturing being predominantly
comprised of small to medium sized firms with limited capacity to absorb skilled
labour. Of note is their finding of no ICT effect, with the exception of the ‘Science
Based’ Pavitt sector.
Kaiser (2000) undertook a study of the German business-related services sector63
using survey data from the 1997 Mannheim Innovation Panel in the Service Sector
(MIP-S) survey. The mean ratio of ICT investment to fixed investment for all firms in
the survey was 41.3 per cent with a median value of 27.9 per cent, indicating the
relative significance of ICT in capital investment. The main finding was that ICT
investment intensity64 was positively related to high-skill and medium-skill level
workers, but substituted for low-skilled workers. The estimated elasticity of demand
for high-skilled labour with respect to changes in the ICT investment intensity was
that for a one per cent change in the ICT investment intensity, there was a 5.7 per cent
increase in demand for high-skilled workers. For medium-skilled labour the elasticity
was 4.8 per cent. Low skilled labour declined by 1.5 per cent for every 1 per cent
increase in the investment intensity.
6.3.2 Industry cross-section approaches
One technique used in SBTC studies involves the use of derived skill indices from the
externally); Specialised Suppliers (smaller specialised firms producing technology for other firms); and Science
Based firms (these firms are generally closely align to cutting edge university research and own source research,
typically associated with electronics and pharmaceuticals) (Archibugi 2001).
63 Industries within this grouping include, for example, Transport and Storage, Real Estate, and Consultancy and
Advertising.
64 Defined in the Kaiser (2000) study as IT investment as a proportion of sales revenue for the firm.
122
‘task’ or ‘activity’ approach to skill measurement, with these being regressed on a
range of measures capturing, among other things, ICT uptake by industry. Studies of
this type have been undertaken for the US (Howell and Wolff 1990; Wolff 1995),
West Germany (Spitz 2003) and Australia (Pappas 1998; Kelly 2007; Kelly and
Lewis 2003, 2010).
Industry by occupation shift-share analyses based on the derived skill measures show
that a substantial proportion of the changes in mean industry skill levels are due to
changes in the occupational structure within industries. Typically this is interpreted as
a result of SBTC (Berman, Bound and Machin 1998; Pappas 1998; Corvers and
Marikull 2007; Spitz 2003; Wolff 1995; Howell and Wolff 1990), which Berman,
Bound and Machin (1998) argues actually defines SBTC. However, Borland (1999)
points out that these findings are likely to be sensitive to the level of industry
aggregation. Moreover, international trade can also cause within-industry changes to
skill composition through, for example, outsourcing of tasks requiring low-skill
content to offshore suppliers in countries with relatively abundant and cheap low-
skilled labour (Borland 1999; Colecchia and Papaconstantinou 1996).
Further evidence of SBTC has been provided by Autor, Levy and Murnane (2003).
Their approach also utilises information about occupational tasks to examine the
changing structure of occupations within industries. They also examine the changing
tasks within occupations (the ‘intensive margin’) based on revisions that took place to
123
the task descriptors in the US occupational classifications.65
The object of interest in the revisions for Autor, Levy and Murnane (2003) is the
change in routine and non-routine tasks undertaken within an occupation and how this
is reflected in the share of routine tasks in production for a given industry. They argue
that what computer capital does is carry out (i.e. substitutes for) manual and cognitive
tasks that ‘…can be accomplished by following explicit rules’ (i.e. routine tasks) and
‘…complements workers in carrying out problem-solving and complex tasks’ (non-
routine tasks) (Autor, Levy and Murnane 2003: p. 1280). Their basic hypothesis is
that industries with high shares of routine skills are more likely to have responded to
decreases in the price of computing power by decreasing the amount of routine tasks
undertaken by workers in the production process and increasing the share of non-
routine (labour) inputs.
Among the key findings of Autor, Levy and Murnane (2003) are that computerisation
substitutes for routine manual and cognitive tasks, while the labour input for non-
routine tasks is increased. This finding was consistent within industries, occupations
and education groups. The changing pattern of demand for performance of tasks
explained 60 per cent of the relative demand shift towards college educated graduates
in the US between 1970 and 1998, with task changes within nominally identical
occupations accounting for almost half of the change.
An approach used in a number of studies is to measure the influence of technology on
65 The Dictionary of Occupational Titles (DOT) provides information on the tasks normally undertaken in an
occupation. The 4th edition (1977) was revised in 1991. Autor, Levy and Murnane (2003) code changes to
occupational task content from the revision into routine and non-routine tasks.
124
an index of skill.66 One of the earlier contributions to this stream of research by
economists was provided by Howell and Wolff (1990). The skill index is recorded
separately for three specific skill dimensions: cognitive, interactive and motor skills.
The skill dimensions are drawn from the US Department of Labor’s Dictionary of
Occupational Titles (DOT)67 (see Section 7.3 for further detail) and are combined
with employment shares by occupation and industry to provide the mean value of the
index for each skill dimension at the industry or economy level. The study estimated
the contribution of TFP, capital vintage, computer-intensity, and the employment
share of scientists and engineers (as a proxy for technical and organisational change),
also controlling for relative factor prices, union density, establishment size and import
shares in production for the period 1970 to 1985. The skill dimensions are cognitive,
interactive and motor skills. Motor skills are essentially the ability to do physical
tasks. Cognitive skills relate to the possession of, and ability to create, knowledge.
Interactive skills refer to the ability to relate between managers and employees,
employees and employees, and employees and customers.68
The key findings from Howell and Wolff (1990) were that demand for cognitive and
motor skills is inversely related to capital intensity (i.e. K/L). Only for interactive
skills in the goods industries was there a complementarity. The technology variables,
66 Strictly speaking virtually all of the studies utilise an 'index' measure of skill in some form, usually a simple
ratio of two educational or occupational classes of worker, such as college to non-college educated workers, or
production and non-production workers. In the context used here 'skill index' relates to a much more sophisticated
development of competencies, attributes and complexities typically utilised in a given occupation. Moreover, these
have been evaluated across numerous examples of specific jobs and assigned scaled rankings (see USDOL n.d.).
The information utilised for these particular studies is sourced directly or indirectly from the US Dictionary of
Titles, such as Autor, Levy and Murnane (2003), Spitz (2003), Pappas (1998), Kelly (2007), Kelly and Lewis
(2003), Kelly and Lewis (2006), and Kelly and Lewis (2010).
67 Note, the fourth edition 1977 version was used. The DOT underwent further revision in 1991 (USDOL n.d.).
68 More detailed explanations of these skill dimensions and their construction are provided in Chapter 7.
125
such as capital vintage, computer intensity (measured as computer capital stock as a
proportion of industry output) and engineers to total labour ratio, were all statistically
significant and positive. Note that Howell and Wolff (1990) demonstrate that the
results were not simply an artefact of the contribution of engineers' skill levels to the
overall skill change measure, with the employment shares and growth being too low
to have directly accounted for the magnitude of recorded changes in industry average
skill levels. They conclude that technical and organisational change were
‘unambiguously linked’ to observed changes in cognitive skills. Declining union
density had no discernible impact on any of the three skill dimensions, whereas
increasing import penetration had substantial negative impacts. Cognitive and motor
skills increased most in industries with the lowest penetration ratios, while interactive
skills grew fastest in industries with high import penetration ratios.
Wolff (1995) examines the changing skill composition among industries due to
technological change, with skills being measured using the same skill indices
approach as Howell and Wolff (1990). Wolff (1995) analyses changes in skill levels
in the US between 1950 and 1990. The analysis involved 267 occupations in 64
industries.
A number of measures are used by Wolff to proxy for technological change, such as
investment in office and computer equipment and accounting machinery. The study
showed that changes to various dimensions of skill were strongly affected by
changing capital/labour (K/L) intensity, suggesting that embodied technology is a
significant causal factor. New investment in IT related equipment was also linked to
high growth in employment requiring high skill content, suggesting that there is
126
technology-skill complementarity. Computerisation and R&D intensity also had a
positive effect on the growth in higher-skilled occupations. Although the relationship
between computerisation and demand for more complex skills was not significant for
all industries, it was significant for goods (manufacturing) industries. Haskel (1996)
also found that the introduction of computers made a significant contribution to
increases in the skilled/unskilled employment ratio of the UK manufacturing sector.
Englehardt (2009) examined the impact of different types of ICT on the share of
production and non-production workers for the US over the period 1980 to 2000. The
key objective of the research was to identify the impact of software investment from
computer investment, arguing that the ‘...need to disaggregate measures of on-the-job
use of computers becomes greater as information technology improves because
software is what defines the skill bias of computer hardware.’ (p.147). Englehardt
(2009) found that computer and software investment contributed to skill biased
productivity gains in the 1990s, but not the 1980s. Among the findings were that the
software share of ICT investment led to an average annual increase in the non-
production wage of 0.47 per cent and a decrease in the production wage of 0.14 per
cent between 1990 and 2000. Foreign outsourcing (trade) did not have a significant
effect on wages during the 1990s, but did in the 1980s.
6.3.3 Cross country studies
There are a number of studies of SBTC that directly model and compare skill changes
between countries, industry sectors and occupations, with the notable contributions
coming from Berman, Bound and Machin (1998) for a selection of OECD countries,
and a recent contribution from Corvers and Marikull (2007) for the European Union
127
(EU).
Corvers and Marikull (2007) use shift-share analyses to decompose cross-country
differences in occupational structure into within-sector and between-sector effects
between 2000 and 2004 for 25 EU countries. Two measures of skill are tested: the
employment share of non-production occupations (high-skilled) vs production
occupations (low-skilled); and the employment share of high-skilled non-production
occupations compared to all other occupations. Two interesting contributions are
provided from this study: first, the analyses cover countries at different levels of
economic development due to the inclusion of the former communist countries of
Eastern Europe into the EU. Second, the study embraces a large number of countries
that operate within a single trading bloc which, in broad terms, operates under a
common set of institutional guidelines for commerce set by the EU.
Among the findings are that changes in the share of high-skilled non-production
workers were mostly driven by within-sector changes, which they suggest are
probably related to skill-biased technological change (as per the common
interpretation of within-industry effects, for example, Berman, Bound and Machin
1998; Bresnahan, Brynjolfsson and Hitt 2002; Howell and Wolff 1990; Pappas 1998;
Spitz 2003; Wolff 1995). Similar trends in the countries’ within-industry effects
support the 'catch-up' view of the new member countries’ skills demand.69 Only in
three out of 25 countries did shares of non-production or high-skilled non-production
69 Following the collapse of Eastern European governments in the late 1980s and early 1990s 10 countries were
admitted into the EU in 2004. All of these are considered ‘less-developed’ economies, eight were post-Soviet
states (Corvers and Marikull 2007).
128
workers decrease. The within-industry effect accounted for 24 per cent of the increase
for non-production workers as a whole. When the high-skill non-production
definition is used, the within-industry effect accounts for 71 per cent of the observed
change. Corvers and Marikull (2007) also present results for a static analysis based on
2004 data only. The shift-share analysis for the static component of the study uses the
mean skill values for the group of 25 EU countries, rather than the inter-temporal
mean for each country, as the basis for measuring variation in the skill index. This
approach enabled the study to determine whether countries lagged behind in average
skill levels as a result of industry structure or occupational mix. Corvers and Marikull
(2007) found that the industry structure, that is, between-industry effects, explained
most of the difference in mean skill levels between countries. The observed up-
skilling, especially in high-income EU members, was similar in the same industries
across countries. Corvers and Marikull (2007) suggest that this is a reflection of
technology diffusion across the EU.
Berman, Bound & Machin (1998) argue that the dramatic decline in demand for low-
skilled workers in developed countries in the 1980s was due to pervasive SBTC. That
is, there were new technologies that were widely accessible and implemented across
firms, industry sectors and (developed) countries. The pervasiveness is an important
consideration, since it is unlikely, given the prevailing levels of communication and
trade occurring in the 1970s and 1980s, that major productive technological changes
would take place in one country without rapid adoption by the same industries in
countries at the same technological level (Berman, Bound and Machin 1998). The
implication for the SBTC hypothesis is that SBTC should occur simultaneously
129
throughout the developed world.
Berman, Bound and Machin (1998) examine the shift in the relative demand for
production and non-production workers in manufacturing industries using a shift-
share analysis of between and within industry effects across the top ten advanced
economies of the OECD ranked by their Gross National Product (GNP) per capita for
1985 to test their hypothesis. Among their findings are that just three industries -
Electrical Machinery, Machinery (and Computers), and Printing and Publishing –
collectively accounted for 46 percent of the within-industry component (averaged
across countries) of the change in relative skill shares in the 1980s. They cite case
studies undertaken by the US Department of Labor that indicate that these industries
introduced significant skill-biased technologies during this period. In particular, the
innovations were in the automation of control and monitoring of production lines,
such as in the Printing and Publishing industry which shifted from manual to
automated typesetting.
In terms of the implications of pervasiveness, Berman, Bound and Machin (1998)
found that in most of the countries analysed, manufacturing employment declined
substantially, with falls around 9 per cent, as occurred in the US, being typical.
Moreover, the employment decline was particularly severe for the production (low-
skilled) workers in all sampled countries. In 7 out of 10 countries low-skill workers
also experienced a decline in their relative wage. Of interest is the fact that there is
greater wage flexibility in the US and UK than in the remaining top 10 OECD
economies included in their study, such as France and Germany. The impact of SBTC
on the US and UK was a sharp decrease in the relative wages of production workers,
130
while in the European countries with less flexible wages the outcome was higher
unemployment for low-skilled production workers.
Colecchia and Papaconstantinou (1996) examine evidence of skill change across the
OECD, noting that in the 1980s high-skill employment grew fastest, while low-skill
employment grew much more slowly or even declined in some countries. Colecchia
and Papaconstantinou (1996) regress the annual change in the high-skill white-collar
share of manufacturing employment on research and development (R&D) intensity,
the K/L ratio and the growth rate in patents for a cross-section of 22 manufacturing
industries drawn from five of the G7 OECD countries.70 The main findings are that
up-skilling was more rapid in industries with above average levels of research and
development expenditure and high growth rates for new patents. Another feature was
that industries already high in human capital intensity experienced the most rapid
accumulation of human capital in the 1980s.
Colecchia and Papaconstantinou (1996) also undertake a shift-share analysis of the
change in high-skill employment covering the early 1980s to the early 1990s period71
for the US, Canada, Japan, France, Italy, Australia and New Zealand separately for
Manufacturing industries and Market Services industries. Within-industry changes
accounted for 97 per cent of the Manufacturing sector skill change for Australia and
81 per cent for Market Services. Over all industries the share was 83 per cent,
compared to 78 per cent for the US, 86 per cent for Canada, 72 per cent for Japan, 58
70 The G7 group of countries comprise the US, France, Germany, the UK, Canada, Italy and Japan. Canada and
the UK were excluded from the study.
71 The periods used for each country varied. For the US, the period was 1983 to 1993; Canada and Italy were 1981
to 1991; Japan was 1980 to 1990; France was 1982 to 1990; Australia was 1986 to 1991; and New Zealand the
1976 to 1990 period was used.
131
per cent for France, 38 per cent for Italy and 80 per cent for New Zealand.
6.3.4 Australian Studies
Relatively few economics studies have examined the issue of SBTC in Australia
explicitly, although there is an expansive literature focussing on the over-supply of
low-skilled workers given prevailing wages. This is reflected in the over-
representation of low-skilled workers in unemployment, especially in long-term
unemployment (see, for example Athanasou, Pithers and Petoumenos 1995; Heath
and Swann, 1999; Junankar and Kapuscinski 1991; Le and Miller 1999; Lewis 2006)
and has both cyclical and structural elements to it (Wooden 2000). The focus of these
studies is, primarily, on the socio-demographic and human capital attributes of
individuals, rather than explicit structural changes in the economy, although some
studies, such as Heath and Swann (1999), model implicitly the influence of industry
decline through the inclusion of a variable for employers going out of business.72
A study by Song and Webster (2003) examined Beveridge Curves (i.e.
unemployment to vacancy relationship) for skilled and unskilled labour market
segments in for the Australian economy between 1986 and 1999. Private investment
was included to test the assumption that capital has a favourable influence on skilled
labour. The estimated coefficient for private investment was not statistically
significant. Although this does not rule out SBTC, it may have policy implications in
relation to SBTC and labour market adjustment. The findings of Song and Webster
(2003) demonstrated that there are two distinct Beveridge Curves for the labour
72 Note that this could also just reflect the typical churn in some industry sectors of small business start-ups and
subsequent failure.
132
market, one for high-skilled segments and one for the low-skilled, with these
segments functioning in different ways with respect to the matching of vacancies and
skills.
Dunlop and Sheehan (1998) note the rapid rise in employment in the ‘Person and
Knowledge Based Services’ sector, which recorded a growth rate of 3.6 per cent per
year between 1966 and 1993, compared to 0.7 per cent for goods producing
industries. This they note has also profoundly affected the occupational mix,
particularly the high skilled professional groupings. Employment for these groups
grew by four per cent per year between 1986-87 and 1995-96, with growth in other
occupations closer to one per cent per year (Dunlop and Sheehan 1998). Closer
examination of finer categories of occupations shows that many trade and labourer
occupations actually declined, as did stenographers and typists. Dunlop and Sheehan
(1998) summarise the changes in skills as a 'polarisation' into strong demand for high-
skilled professionals and those with good [inter]personal and selling skills, and weak
demand for most other occupation types. It should be noted that the period of analysis
that the Dunlop and Sheehan (1998) relates to pre-dates the rapid rise of the Internet
and other transformations affecting white-collar workers. There is some evidence,
such as Autor, Levy and Murnane (2003) and Spitz (2003), which suggests that some
white-collar occupations performing routine programmable tasks will have
experience of a weakening of labour demand. The expectation is that post-1996 data
for Australia will reflect this weakening in demand. This will be explored in greater
detail in Chapters 8 and 9.
The skill typology used for the analysis by Dunlop and Sheehan (1998) follows that
133
of Colecchia and Papaconstantinou (1996).73 Among the findings of Dunlop and
Sheehan (1998) relevant to this thesis are that there was no pronounced up-skilling in
white-collar occupations, but there was a significant de-skilling in the blue-collar
trades. The evidence provided is that the blue-collar low-skilled occupations
increased much more rapidly than blue-collar high-skilled employment, indeed, these
were the weakest performer 'by a large margin' among the four skill groupings for
Australia between 1986 and 1991. While there is no direct analysis of the
determinants of skill change provided by Dunlop and Sheehan (1998), the general
thrust of the paper is that there are underlying technological influences driving skill
demand.
This reasoning is supported by Sheehan and Tikhomirova (1998)74, in particular,
information technologies and their enabling role in the rise of the knowledge
economy. Sheehan and Tokhomirova (1998) argue that a raft of developments, such
as improved 'microchip' technology, fibre optics, digitisation technologies, open and
common ICT standards, improved software and the Internet have contributed to large
improvements in the generation and distribution of information, a core component of
the knowledge economy. Moreover, it is the pervasiveness of these technological
advances that sets them apart from previous episodes of technological change, which
were centred on specific products or industrial sectors. These changes have
contributed to a ‘…fundamental reshaping of manufacturing’, are ‘…providing the
foundation for both the globalisation of existing service industries and for the
73 That is, white-collar high-skilled; white-collar low-skilled; blue-collar high-skilled; and blue-collar low-skilled.
74 Note that Dunlop and Sheehan (1998) and Sheehan and Tokhomirova (1998) are drawn from a collection of
papers in the same publication covering the theme of the Global Knowledge Economy, with the latter a 'scene
setting' paper.
134
development of new service products’ and are ‘…contributing to fundamental change
in world labour markets’ (Sheehan and Tokhomirova 1998, p. 35). Taken together
with the rise in research and development and the knowledge intensity of traded
goods and services – enabled through increasing globalisation – the structure of
industry is changing and with it the pattern of labour demand.
Cully (1999) examines occupational data using the Australian Standard Classification
of Occupations (ASCO) Second Edition at the ‘Major Groups’ (i.e. 1 digit) level for
Australia covering the period 1993 to 1999. There is no discussion on causes of skill
change provided by Cully (1999), although the author indicates that in relation to
labour market outcomes for low-skilled workers the ‘…emerging consensus on
changing labour markets arising from globalisation and technological change’ (p.103)
is incorrect.
Cully (1999) argues that this is due to the focus on manufacturing industries and the
inappropriate definitions of high- and low-skilled workers based on non-production
and production workers respectively. Using the hierarchy of skill shown in Table 6-2,
Cully (1999) shows that skill categories I and V increased their relative shares of
employment at the expense of categories II to IV. Cully (1999) argued that the trend
was not one of worsening outcomes for low-skilled workers, as described by Berman,
Bound and Machin (1998), but one of increasing polarisation, where low-skilled
employment has also increased.
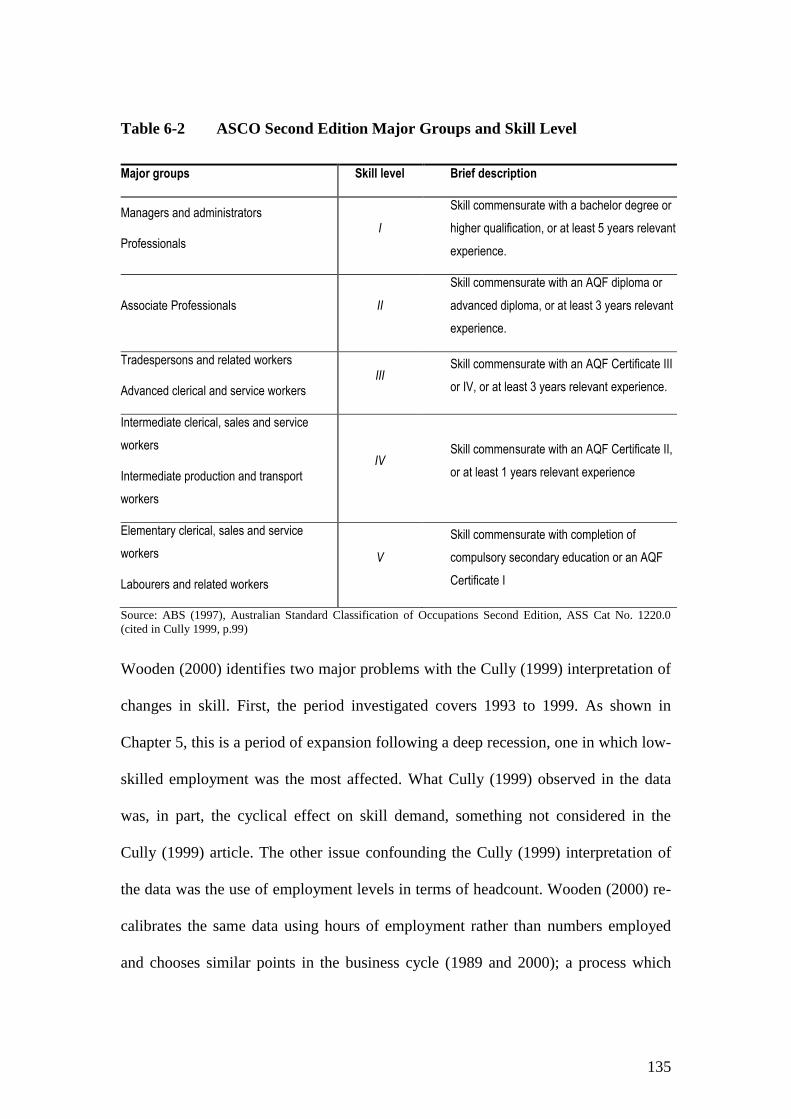
135
Table 6-2 ASCO Second Edition Major Groups and Skill Level
Major groups Skill level Brief description
Managers and administrators
Professionals I
Skill commensurate with a bachelor degree or
higher qualification, or at least 5 years relevant
experience.
Associate Professionals II
Skill commensurate with an AQF diploma or
advanced diploma, or at least 3 years relevant
experience.
Tradespersons and related workers
Advanced clerical and service workers III
Skill commensurate with an AQF Certificate III
or IV, or at least 3 years relevant experience.
Intermediate clerical, sales and service
workers
Intermediate production and transport
workers
IV Skill commensurate with an AQF Certificate II,
or at least 1 years relevant experience
Elementary clerical, sales and service
workers
Labourers and related workers
V
Skill commensurate with completion of
compulsory secondary education or an AQF
Certificate I
Source: ABS (1997), Australian Standard Classification of Occupations Second Edition, ASS Cat No. 1220.0
(cited in Cully 1999, p.99)
Wooden (2000) identifies two major problems with the Cully (1999) interpretation of
changes in skill. First, the period investigated covers 1993 to 1999. As shown in
Chapter 5, this is a period of expansion following a deep recession, one in which low-
skilled employment was the most affected. What Cully (1999) observed in the data
was, in part, the cyclical effect on skill demand, something not considered in the
Cully (1999) article. The other issue confounding the Cully (1999) interpretation of
the data was the use of employment levels in terms of headcount. Wooden (2000) re-
calibrates the same data using hours of employment rather than numbers employed
and chooses similar points in the business cycle (1989 and 2000); a process which
136
mitigates to some extent the influence of the recession. Once these modifications are
made, the sample data support the conclusions drawn in the SBTC literature in
relation to relative skill demands.
The results from Wooden (2000) are unequivocal, there has not been polarisation of
the workforce as far as skills are concerned and the changing employment shares are
biased towards the higher-skilled occupations. Indeed, 70 per cent of the increase in
total employed hours between 1989 and 2000 was for the Professional and Associate
Professional occupations, a result made even more dramatic when it is considered that
a considerable number of these are farm managers, a sector where there has been long
term declines in employment. Wooden reports that there was virtually no growth in
hours of employment over the same period in low-skill employment. Neither Wooden
(2000) nor Cully (1999) provide any formal assessment of the determinants of skill
change for Australia, with the respective papers being concerned with the
measurement of skill and changing occupational shares.
A more substantial work on SBTC by Pappas (1998) looks at the increases in
different skill dimensions for Australia between 1976 and 1995. The analysis of skills
provided by Pappas (1998) follows the methods employed by Howell and Wolff
(1990) and Wolff (1995), with the USDOL measures of motor, cognitive and
interactive skills assigned to the broadest (i.e. 1 digit) occupational definitions for
Australia (using ASCO 1st edition).75 The contribution of trade is also analysed.
The results reported by Pappas (1998) vary by period and skill dimension. From
75 Prior to 1986 the Classification and Classified List of Occupations (CCLO) are used.
137
1974-75 to 1983-84 cognitive skills increased by two per cent and interactive skills
by four per cent, while motor skills declined by two per cent. For the 1983-84 to
1992-93 period, cognitive increased by three per cent, interactive by nine per cent and
motor skills declined by seven per cent. A different source of data, taken from the
1981 and 1991 Census periods shows a four per cent increase in cognitive skills and
an 11 per cent increase in interactive skills, with motor skills falling by eight per cent
over this period. The similarity in the results provides some reassurance in the
method Pappas uses to determine industry and occupational distributions from the
Manufacturing Census76 and the ABS Labour Force survey77 for the 1974-74, 1983-84
and 1992-93 periods.
Around 73 per cent of the change in the mean cognitive skill level for the 1974-75 to
1983-84 period was a result of between-industry changes in employment shares, the
equivalent figures for interactive and motor skills are 92 and 105 per cent
respectively. While the result for motor skills may seem counterintuitive, what it
means is that there was a positive contribution of motor skills as a result of within-
industry changes in the occupational composition and a large negative contribution as
a result of between-industry effects. The interpretation (not noted by Pappas 1998) is
that there was a small amount (in aggregate) of up-skilling in relation to motor skills
within industries for this period, offset by a significant de-skilling as a result of the
changing composition of industries. The 1983-84 to 1992-93 period shows a shift in
the relative contributions of occupational distributions within-industries and changing
76 Various years of the Census were used. The ABS publication is Manufacturing Industry, Australia, Catalogue
No. 8221.0, Canberra
77 Various years of the survey were used. The ABS publication is Labour Force, Australia, Catalogue No. 6203.0,
Canberra
138
industrial composition. For cognitive skills within-industry effects accounted for 84
per cent of the measured change in mean skill levels. For interactive skills 73 per cent
of the change came from within-industry effects and 51 per cent for motor skills.
Note that the decline in the mean level of motor skills for the latter period resulted
from a deskilling effect from both occupation and industry composition effects.
Pappas (1998) also undertook an analysis of trade effects on skill change. This is
achieved by a decomposition of within- and between-industry effects into different
sectors of the economy: domestic consumption, exports and imports. The key
findings are that for inter-industry effects, shifts toward the domestic consumption
sector over the 1973-74 to 1992-93 period resulted in increases in cognitive and
interactive skills and the decline in motor skills. For within-industry effects, a large
proportion of the measured changes in mean skills for all dimensions also came from
domestic consumption. The trade sector only had a small effect, due to its relatively
small absolute share of employment. The conclusion drawn by Pappas (1998) is that
the results do not support the argument that international trade is driving the changes
in skill levels, a result Pappas notes is consistent with findings for the US and France
in the 1980s.
Pappas (1998) also explores the possibility that changes in the relative prices for
various skills (i.e. motor, cognitive and interactive skills) is the cause of changes in
the skill structure within Australia. Constructing indices of skill weighted earnings
between 1986 and 1991, Pappas (1998) shows that the changes over the period are
relatively minor. The conclusion drawn is that the evidence is inconsistent with the
notion that substitution effects between occupations with different skill intensities due
139
to relative price differences was the cause of changing skill structures.
To assess the possibility that technological change contributed to the changes in the
skill distribution, Pappas (1998) examined data from the ABS technology surveys of
the Australian manufacturing industry in 1988 and 1991.78 With the exception of
automated testing and inspection equipment, all other categories of advanced
technology in manufacturing expanded significantly over the 3 year period.79
Combined with a significant penetration of computers in industry by 1993-94, Pappas
argues that SBTC is the main cause of skill changes in Australia between 1976 and
1995, especially given the weak or inconsistent trends in trade and skill-price indices.
A model of skill change is tested by Pappas using Ordinary Least Squares based on a
sample of 12 manufacturing industries at the ASIC 2 digit level and also a larger non-
farm sample (n=14) from the ANZSIC classification at the Divisional (i.e. 1 digit)
level. The results generally supported the SBTC hypothesis and showed technology
proxies being complementary with interactive and cognitive skill. In particular,
growth in communications technology (manufacturing sample) and the capital-labour
ratio had a positive influence on skill change.
Aungles et al. (1993) use a shift-share approach to analyse changes in the
occupational structure in Australia using the four Census collections for the period
1971 to 1986. The decomposition methodology they use enables five effects to be
examined: occupational shares, industry structure, productivity growth, output growth
78 Various years of the Census were used. The ABS publication is Manufacturing Technology Statistics, Australia,
Catalogue No. 8123.0, Canberra
79 The measure was the proportion of businesses using a particular advanced manufacturing technology. The
categories that expanded are Design Engineering; Fabrication, Machining and Assembly; Automated Material
Handling; and Communications and Control (Pappas 1998).
140
(i.e. a scale effect), and an hours effect. The first two of these use the same approach
as Corvers and Marikull (2007) and Wolff (1995) and provide a within-industry and
between-industry effect on occupational change. Taken over the whole period there
was a 21.6 per cent increase in employment. In the absence of any productivity
changes and average hours of work being unchanged for occupations there would
have been a 43.3 per cent increase in employment. Productivity increases reduced this
by 26.5 percentage points, while the falling average hours of employment increased
demand for workers by 7.5 percentage points. The within-industry effect was
negative (reduced employment demand for a given occupation, on average) by one
percentage point, while between-industry effects reduced demand by 1.7 percentage
points.
A more meaningful analysis of the Aungles et al. (1993) results is provided from
breaking down the totals by occupational groupings at the ASCO 1 digit level. The
figures show a clear pattern of large and positive contributions from within-industry
effects for high-skill occupations, such as Professionals, Managers and
Administrators, Para-professionals and Tradespersons. Clerks, Salespersons and
Personal Services Workers, Machine Operators and Labourers all experienced
significant declines as a result of within-industry changes. Between-industry changes
had a positive effect on Professionals, Para-professionals and Clerks, but the change
was negative for all other occupational groups at the 1 digit level.
Aungles et al. (1993) examine the changing occupational composition by measuring
changes in an index based a ranking of educational levels, developed by the Bureau
of Labour Market Research in 1987. The index values are assigned to an occupation
141
in the same manner as described for Howell and Wolff (1990) and Kelly (2007).80
Ranking the 120 occupations measured in their study by the BLMR skill index and
grouping into deciles, Aungles et al. (1993) show a clear positive correlation between
employment growth and skill deciles, although the 2nd
and 3rd
deciles (i.e. low-skill
part of the distribution) appear to be slightly above the expected values. One of the
deficiencies of the index used is the single dimension of skill based on educational
attainment.
6.4 Critique of SBTC
Alternative explanations for the increase in the relative demand for skilled workers
relate primarily to organisation of the firm (Caroli 2003; Caroli 1999; Chennells and
Van Reenen 1997); international trade (Haskel and Slaughter 2001; Lawrence and
Slaughter 1993; Borjas and Ramey 1995) and institutional change, such as changes in
minimum wages and trade union decline (Acemoglu 2002; Caroli 2003; Howell
1996). There are also more direct criticisms of the SBTC hypothesis that relate
directly to the focus on ICT, specifically computers, and the timing of observed
changes (Card and DiNardo 2002).
6.4.1 Critique of ICT linkages to skill change
One strand of criticism of the SBTC hypothesis is more directly targeted at the role of
ICT, especially computers. As Card and DiNardo (2002) note, the general ‘consensus
in the inequality literature’ is that increases in the relative demand for higher educated
workers, particularly in the US, was the key driver of increasing wage inequality over
80 Further details are provided in Chapter 7 on the methodology used in Kelly (2007).
142
the last two decades and that this has been attributed to the ‘burst of new technology’
implemented over this period. The burst of new technology was, primarily, the large
scale diffusion of computers (Card and DiNardo, 2002). Card and DiNardo (2002)
argue that the ‘…SBTC hypothesis falls short as a uni-causal explanation for the
evolution of the US wage structure in the 1980s and 1990s.’ (p.735) The argument
that SBTC is not a ‘uni-causal’ explanation of changes in the US wage structure is
reasonable, although it should be noted that none of the papers reviewed for this
thesis make the claim that ICT provide a 'uni-causal' explanation for skill change.
However, the evidence in support of it as a major contributor to the skill changes and
related wage movements is overwhelming. There are also a number of shortcomings
in the Card and DiNardo (2002) critique of SBTC.
The arguments and the evidence presented by Card and DiNardo (2002) focus on two
narrowly defined ‘potential channels’ linking increased demand for skill to specific
subgroups of workers, which are as follows: first, that relative demand for groups
likely to use computers increased; second, relative demand for highly paid workers
has increased.
The narrow focus by Card and DiNardo (2002) on computer usage is problematic.
First, there is an implicit assumption that the complexity of computer use (and what
this entails for wage-skill premia), is uniform across the skill (more specifically, the
educational) profile. This seems highly unlikely. For example, the spread of
computers among low-skill secretarial applications or for workers in call centres is
qualitatively different to its application among architects, engineers, and systems
analysts. The work of Maurin and Thesmar (2004) also confirms this point.
143
A study by Borland, Hirschenberg and Lye (2004) using 1993 unit record data on
computer usage in Australia, found that the wage premium for computer usage
depends on the number of different computer competencies a worker has, such as
word processing, spreadsheets, data entry, programming and so forth, and the level of
skill for each of these competencies. The results also suggest that specific software
applications are associated with higher wages. These examples indicate how
occupational segmentation may have confounded interpretation of movements in
computer-use wage premia in aggregate analyses. The fact that a worker uses a
computer is less important than how much, how complex and the variety of
computing skills.
6.4.2 Organisational and institutional change
Institutional changes have been put forward as another channel contributing to wage
inequality. In this particular context institutional change is interpreted broadly; as put
by Acemoglu (2002), it covers ‘… the rules of the game in the labor market, patterns
of bargaining, as well as government labor market policy.’ (p.46)81 Foremost among
the arguments in this vein is that the decline in unionisation reduced the bargaining
power of low-skilled workers, which in turn lead to a decline in their relative wage
(Acemoglu 2002).
Blackburn, Bloom and Freeman (1991) used the March 1980 and March 1989 data
from the Current Population Survey (CPS) for the US to examine changes in earnings
inequality, controlling for race, gender and education levels. Among their findings
81 Howell (1996) describes the institutionalist explanation of wage setting as not only an outcome of supply and
demand, but also a result of bargaining power and social norms.
144
were that de-unionisation was the dominant factor explaining differentials in earnings
between high school graduates and high school drop-outs for white males, and
between college graduates and high school graduates for African-Americans.
Declines in the minimum wage were also an important contributor to the rising
inequality of female African-Americans high school drop-outs. Also of note in their
findings is that the occupational structure of employment did not contribute to
increasing wage inequality. The shifts between industry shares in employment on the
other hand did contribute to increasing wage inequality, but only moderately.
Although Blackburn, Bloom and Freeman (1991) did not provide any explanations as
to the underlying significance of to the occupation and industry effects, explanations
from other studies (such as Pappas 1998; Spitz 2003; Wolff 1995) suggest that trade
patterns may have played a role. However, it is not clear whether the causes are due
to international outsourcing by firms (see Section 6.4.3. for further explanation).
Howell (1996) argues that from the late 1970s onwards there was a fundamental shift
in the US to ‘laissez-faire public policies’, in response to a nation-wide productivity
slowdown, high inflation and growing trade competition. However, the US
experience was unique in that other developed nations experiencing similar economic
pressures did not dismantle public and private institutions designed to protect the
living standards of low-skilled workers. What distinguished the US experience was
the ‘... massive political and ideological shift in public opinion, management beliefs,
and government policy, which facilitated and actively encouraged an assault on the
wages of those with the least bargaining power – the low-skilled – by employers’.
(p.19) The types of changes and events that support this line of reasoning include
145
deregulation to increase competition in product markets such as transport and
telecommunications, which traditionally had been high-wage industries.
There was also a decline in anti-trust enforcement which encouraged mergers and
acquisitions, with subsequent restructuring of firms. On this point Howell (1996)
seems to have missed the implication for an intuitionalist argument, claiming that the
restructures were 'often at the expense of well-paid workers'. The re-structures should
have had a relatively larger effect on low-skilled employees to be consistent with the
evidence presented in numerous studies of relative wages and employment shares in
the US. Finally, Howell (1996) suggests that the highly publicised attack on air traffic
controllers by US president Ronald Reagan in 1981 contributed to the weakening of
both labour law and its enforcement, which ultimately lead to a 30 per cent decline in
the legal minimum wage. While it is true that Ronald Regan was president of the US
in 1981 and minimum wages fell, the link between the two is not adequately made by
Howell (1996) and, at best, could be described as 'tenuous'.
Acemoglu (2002) points out that the decline in the minimum wage in the US does not
explain the rise in wages observed for high-skilled workers earning above the median.
Also, the timing of declining unionisation is inconsistent with the observed wage
inequality in the US and does not hold true for other countries, such as Canada.
Chennells and Van Reenen (1997) point out that many of the studies that attribute the
growing wage dispersion to SBTC fail to take into account the endogeneity between
technical change and earnings. The causation, they argue, runs just as much in the
other direction, with pay rises increasing the likelihood that new technologies will be
146
implemented in the workplace. DiNardo and Pishke (1997), for example, argue that
higher wages and computers are given to workers that are already productive.
Similarly, Acemoglu (2002) argues that the 20th
century was characterised by SBTC
‘...because the rapid increase in the supply of skilled workers has induced the
development of skill-complementary technologies.’ (p.9).
Bresnahan, Brynjolfsson and Hitt (2002), on the other hand, refute the proposition
that there is a non-productivity causal link between IT use and high levels of human
capital at the firm level. However, they do support the notion there is interdependence
between workplace organisation, human capital and IT usage. Moreover, Bresnahan,
Brynjolfsson and Hitt (2002) argue that:
For the complementarities theory, it does not matter whether we think that ‘computers
cause skill’ or ‘skill causes computers:’ if they are complements, long-run changes in
the price of one cutting across all firms will affect the demand for both. Thus, the
complementarities theory can be investigated in either causal direction, depending on
which is more appropriate to ensure that it truly is complementarities that are being
measured, not some other force. (p.346)
6.4.3 Trade hypothesis and the structure of trade
Among the explanations as to what has caused the skill composition of the Australian
economy and other advanced economies to change over time is the changing pattern
of trade between countries. The Stolper-Samuelson Theorem (ST) provides the
framework for this particular stream of research into relative skill demand (Berman,
Bound and Machin 1998). Under ST, countries relatively well endowed with
unskilled labour will use that factor relatively intensively. Wages for the unskilled
labour in the developing country will rise, as do those of skilled labour (relative to
unskilled labour) in the country endowed with high-skilled labour (Appleyard and

147
Field 1992). Thus, the theory would suggest the increased trade with developing
countries brought about by liberalisation of world trade and, in the Australian context,
microeconomic reform, led to shifts away from labour intensive manufacturing
industries in industrialised countries. This occurred primarily in industries where the
skill-intensity of the goods traded is relatively low and had the effect of lowering the
relative demand for unskilled labour and increasing demand for high-skilled workers
in the developed country. In terms of wages for low-skilled workers, these were
depressed because of the outward shift of the effective low-skilled labour supply
curve (Acemoglu 2002; Borjas and Ramey 1995; Haskel and Slaughter 2001;
Lawrence and Slaughter 1993).
Englehardt (2009) highlights a number of studies that argue that international trade
could not have increased the relative wage of skilled labour because the prices of
skilled-labour-intensive goods did not rise. However, this is not really a valid
criticism. It is possible for prices to increase, fall or stay the same for skilled-labour-
intensive goods without affecting the profitability of the firm or the prices of their
output, even if they increase their demand for skilled labour to the extent that their
relative wage increases. Indeed, this is exactly the kind of finding that could be
expected. That is, given a complementarity between high-skilled labour and a specific
(or general) technology, there is a capital deepening that results in an increase in
productivity specific to high-skilled labour. This lowers the unit cost of the product to
the firm, the real unit labour cost of high-skilled labour and increases demand for the
contributing factor inputs (see Abrego and Edwards 2002).
148
Abrego and Edwards (2002) argue that the relaxation of the assumptions of the
Heckscher-Ohlin82 model can greatly undermine the Stolper-Samuelson conclusion.
They concluded that while increased trade with developing countries has probably
played some part in the widening wage inequalities in the UK and US, there is
considerable doubt over the size of the contribution. Also, the timing of observed
changes in the traded sector coincided with similar skill changes in the non-traded
sectors (see also Dupuy 2007).
Evidence for Australia also suggests that trade has had a relatively minor influence. A
study by Pappas (1998) using shift-share analysis showed that the contribution of
trade to changes in mean industry skill scores for Australia between 1976 and 1991
were very small, due in part to the fact that the share of employment in the trade
sector is relatively small. Other studies, reach the same conclusion for the US (such as
Ágenor and Aizenman 1996; Berman, Bound and Griliches 1994; Berman, Bound
and Machin 1998; Wolff 1995).
Geishecker and Gorg (2008) have examined the impact of international outsourcing
on skill demand for workers in the German manufacturing sector over the period
1991 to 2000, a period which saw international outsourcing in German manufacturing
grow substantially. Geishecker and Gorg (2008) make the observation that despite a
period of expansion in international outsourcing in German manufacturing, relative
earnings for low-skilled workers remained constant over the period being
82 Under the Heckscher-Ohlin theorem, a country exports those commodities that use relatively intensively the
factors that it has a relative abundance of and, conversely, imports commodities that use relatively intensively
those factors which are relatively scarce Appleyard and Field (1992).
149
investigated.83 This feature, in principle, casts doubt over the link between
outsourcing and relative wages.
However, Geishecker and Gorg (2008) argue that relative earnings can be affected by
a number of supply and demand factors that cancel each other out. To control for this
they adopt a different approach to the usual analyses by focusing on employee level
data. They use the German Socio-Economic Panel (GSOEP) (DIW n.d.), a large
household panel dataset, and incorporate the industry’s international outsourcing
activity as a shift parameter in a Mincerian wage model.84 The sample is restricted to
full-time male employees aged 18 to 65 years and utilises two skill definitions. Like
the skill index approach discussed in Section 6.3.2 and in detail in Chapter 7, one of
the skill measures used by Geishecker and Gorg (2008) is based on the GSOEP
respondents’ information on the qualification that their current job actually requires,
rather than their highest level of educational attainment. As explained by Geishecker
and Gorg (2008):
Applying this alternative skill grouping is an interesting extension, since it takes
account of the actually demanded qualification by employers as opposed to the supplied
qualification by employees. (p.254)
The results Geishecker and Gorg (2008) present are interpreted as the short-run
effects of international outsourcing on wages of individuals within industries. The
key findings are that for high-skilled workers, a one percentage point increase in the
83 It has been argued by Berman, Bound and Machin (1998) that this is a result of inflexible wages, essentially an
institutional feature of German labour markets. What results is increasing unemployment for displaced low-skilled
workers in response to SBTC, rather than changing wage relativities.
84 Typically, Mincerian based wage models include variables to capture experience, such as age and higher order
polynomials of age, educational attainment and a range of socio-demographic variables (see for example,
Bosworth, Dawkins and Stromback 1996; Dustmann and Pereira 2008).
150
outsourcing intensity85 results in a 2.6 per cent increase in wages. For low-skilled
workers, outsourcing results in a negative wage elasticity of 1.5 per cent.
Feenstra and Hanson 1999 found that international outsourcing86 in US manufacturing
industries for the period 1979 to 1990 explained 11 to 15 per cent of the decline in the
cost share of production labour (i.e. low-skilled labour). Morrison and Siegel (2001)
found that both trade and new technology contributed to the observed changes.
Borland (1999) points out that competitive pressures brought about by globalisation
may be driving technology adoption, which in turn drives the change in skill
composition. Thus trade can be seen as an intervening variable, or catalyst.
Technology, in this particular context, is still the root cause and observed changes in
the skill structure would still be consistent with the SBTC hypothesis.
6.5 Summary
This chapter provided an overview of the SBTC literature and some of the alternative
explanations and critiques of SBTC. The motivation for these studies was, for the
most part, the significant shift in the relative demand for skilled workers observed
between 1970 and 2000. The various shifts observed included increases in the relative
wage of skilled workers, absolute declines in real wages for low-skilled workers,
increased supply of skilled workers at the same time as their real and relative wages
were increasing, and over-representation of low-skilled workers in the pool of
85 Outsourcing intensity is defined as intermediate inputs in a given industry that are sourced from another country
as a proportion of total industry inputs (Geishecker and Gorg 2008).
86 Using a narrow measure that restricts the outsourcing definition to intermediate inputs sourced from the same
industry in another country.
151
unemployed. Very few are focussed on the impact of structural adjustment in terms of
worker 'displacement' and the accompanying policy implications. All of the
competing explanations for rising wage inequality relate to technological change in
some form, with perhaps the exception of the de-unionisation and minimum wage
arguments put by Blackburn, Bloom and Freeman (1991).
Among the explanations for these developments are increases in international trade,
technological change, with particular emphasis on the role of ICT in the majority of
studies, changes in modes of work organisation and changes in labour market
institutions, such as the lowering of the minimum wage and the weakening of trade
unions. The large majority of the literature reviewed present findings in favour of
SBTC, with ICT playing a major role directly and indirectly in the changing skill
structure. Despite the focus of the Card and DiNardo (2002) critique, none of the
papers reviewed for this thesis argue that ICT provide a uni-causal explanation for the
changing wage and skill structure.
The differences between the competing theories presented in the literature are a
question of emphasis on the root cause of change, or the degree of specificity in the
research design, or the timing of events. That is, it is to some extent an empirical
issue, with different theories providing a better fit to a given set of events in each
period. This is especially the case for the vast US literature on the subject. For
example, ICT were important, but trade still accounted for changing wage relativities
in the 1980s.
The interaction between organisation, ICT and product innovation was shown to have
152
lead to skill bias through changing the nature of activities assigned to workers. Trade
appears to have been a factor, though not a large one, in the 1970s and 1980s, but less
relevant in the 1990s. It has also been found to be a much smaller contributor to
change, in the US at least, than technological change.
Virtually all of the literature examined provided evidence of SBTC. There was little
or no evidence suggesting that increased demand for high-skilled workers was a
market response to changing relative prices for skill. That is, the evidence supports
the view that it is largely technological change driving changes in skill demand over
the longer term, not technical change. Indeed, it is difficult to imagine that changes in
skill demand, in favour of high-skilled workers, could persist over a 40 year period
simply because relative prices had changed. In most advanced economies there was a
massive increase in the supply of high-skill college educated workers, and yet the
demand kept rising and with it relative wages. This suggests an acceleration in
technological change is behind the observed changes.
It has been argued that a necessary condition for the SBTC hypothesis is that it be
simultaneously observed across developed countries, given a global trading regime
and 'like' industries. The literature examined in this chapter shows that there is
considerable supporting evidence for this hypothesis. Findings of SBTC have been
robust across countries, with France, Italy, Germany, Australia, Canada, the UK, the
US and a study of 25 EU economies all showing a significant skill bias.
There are a number of different approaches utilised to examine the skill composition
issue, including case studies, inter-firm comparisons, industry cross sections and
153
longitudinal panels and cross country studies. Firm level studies have examined large
panel datasets covering key firm characteristics, including proxies for organisational
change, trade and ICT investment. They have consistently found evidence of SBTC,
although not to the exclusion of trade. Nonetheless, trade is generally found to be a
relatively minor contributor. Case studies of single firms have examined specific
occupations and functions and their relationship with equipment. This approach
yielded unequivocal results – ICT substitute for routine tasks. Moreover, ICT have
enabled the automation of cognitive tasks, whereas historically it is manual tasks that
have been automated. This reflects the shift from the mechanical to electronic age and
also points towards the types of jobs that will be vulnerable to economic downturns in
the future as companies look for potential savings.
The impact of SBTC can be realised through a number of channels. One way is for
relative wages to fall for low-skill workers. In countries where wages tend to be
inflexible due to institutional settings, such as EU countries, SBTC has been reflected
in elevated unemployment levels for low-skill workers. This is a significant policy
issue for Australia, given it has moved back to stronger emphasis on centralised wage
fixing, and one that affects equity and efficiency.
To summarise, the evidence suggests that trade and technology, especially ICT, have
affected OECD economies over the last 30-40 years. Within-industry changes have
accounted for most of the change. Falls in the minimum wages do not appear to have
had much effect in the US and their timing and distribution across industries appear
to be inconsistent with the changes that have taken place. The evidence suggests
organisation within firms, ICT and high levels of human capital are complementary

154
and the presence of all three is a good predictor of increased high-skill employment.
Very little work focussing explicitly on SBTC has been undertaken for Australia,
although the few that have found in favour of SBTC. However, the evidence is
somewhat dated and excludes periods covering significant developments in ICT
investment in Australia.
155
7 MEASUREMENT OF TECHNOLOGY AND SKILLS
7.1 Measurement of Technology
There is no definitive or precise measure of technological change. Most commonly in
labour market models it is included as a time trend (Schettkat and Wagner 1990,
Lewis and Seltzer 1996; Lewis and McDonald 2002). According to Petit (1990) there
are two approaches to specifying technological change (as opposed to measuring it
through its effects or causes). One is to classify jobs according to their information
content, the other is to record changes by the spread of a set of equipment, such as
information technologies. Both have been used in SBTC studies, although the latter is
the most common.
Schettkat and Wagner (1990) use two indicators of technological progress. The first is
based on specific innovations, such as the introduction of computers. Another
approach to measuring technological progress is to use value indicators, for example,
research and development (R&D) expenditure, or the number of researchers involved
in R&D, although Geishecker and Gorg (2008) argue that R&D is a 'crude proxy'.
This approach can be further split into three categories, input, output, and throughput
of innovations. An example of the input approach would be to include expenditure on
R&D, or the number of employees engaged in R&D. Measures of throughput, such
as the number of innovations, are more applicable to case studies, although some
industry level studies, such as Colecchia and Papaconstantinou (1996), use growth in
patents as a proxy for technological change. The output measure relates to the
increase in market share achieved due to introduction of new products and, also, is
156
more relevant for case studies than for aggregate level studies. Ultimately, the level of
analysis (e.g. firm, industry, case study, or economy), the specific objectives of the
various studies and the availability of data have determined the approaches taken.
7.2 Measurement of Skills
7.2.1 Defining skill
The first issue that needs to be addressed when examining skill change is how to
define skill. There is, among sociologists, broad agreement that the term 'skill' refers
to ‘…the level, scope, and integration of mental, interpersonal, and manipulative
tasks required in a job’. Form (1987, p.32) Further distinction is required between a
job and an occupation. Cain and Treiman (1981) provide the distinction between a
'job' and an 'occupation' as follows: A job is a specific position within an
establishment, or the economic activities of an individual. It has specific duties and
responsibilities and involves the performance of a set of tasks in a particular setting.
Examples of a 'job' might include 'maths teacher' at Melbourne High School.
Occupations, on the other hand, are the aggregation of jobs that are grouped on the
basis of their content, such as some similarity in the tasks, duties, responsibilities and
conditions under which they are performed (Cain and Treiman 1981; ABS 1994).
The distinction between job and occupation is an important one, because when
analysing the literature on skill bias, or 'de-skilling', invariably it is referring to the
changing occupational structure of an industry or the economy, rather than analysing
changes in the physical content of specific jobs. This is at least true for economics
studies of skill change. Even where job content is reviewed, such as in the Autor,
Levy and Murnane (2003) study, it has involved a second hand review of changes in
157
dictionary definitions and measurements, rather than direct observation of what
workers do. One exception is a study by Autor, Levy and Murnane (2000) which
examines the routines of workers after the introduction of specific technologies in a
major US bank.
A review by Cain and Treiman (1981) suggests that using changes in the US
Department of Labor Dictionary of Titles (DOT) (USDOL n.d.) data may not be a
reliable approach to analysing changes in job content. This is due to collection and
sampling methodologies and also because of the way occupations were reviewed (in
relation to the USDOL DOT). For example, some 75 per cent87 to 81 per cent88 of
occupational titles in the DOT 4th
edition are verbatim replicates of the 3rd
edition.
Song and Webster (2003) define a person's skill as their ‘…dexterity, knowledge and
ability to undertake specific tasks.’ (p.342). Colecchia and Papaconstantinou (1996)
provide a more comprehensive description based on the definition developed by
Wolff (1996):
The term ‘skill’ refers to the qualifications needed to perform certain tasks in the labour
market. In the most general sense, it reflects the level of human capital in the labour
markets, and up-skilling can be seen as synonymous with human capital development. It
is a multi-dimensional concept, since most jobs require a multitude of skills for
adequate task performance, ranging from physical abilities like eye-hand coordination,
dexterity and strength, to cognitive skills (analytic and synthetic reasoning, numerical
and verbal abilities) and interpersonal (supervisory, leadership) skills. (p.8)
7.2.2 Definitions and measures used in SBTC studies
There have been a number of approaches used in SBTC studies to determine a
87 Estimate from Spenner (1979), cited in Cain and Treiman (1981, p.272).
88 Cain and Treiman (1981) estimate.
158
measure of skill, the most common being to use either a white-blue collar dichotomy
(i.e. production versus non-production worker), or the split between university
graduates and non-graduates. Measures of skill attainment typically favoured by
economists in studies of human capital rely on years or level of education and years
of experience. One problem with this approach is that the actual skill requirements of
jobs are not captured. The rapid growth in educational attainment that occurred up to
the 1990s may have as much to do with credentialism as skill attainment (Attewell
1990).
The production and non-production worker dichotomy used in many or most of the
aggregate level studies, as well as industry panel datasets used in firm level studies, is
also problematic. US studies, such as Lawrence and Slaughter's (1993) study of
international trade and the impact on skills, draw from the Annual Survey of
Manufactures (ASM) (see Abowd and Freeman 1991) which only distinguishes
between non-production and production workers. Lawrence and Slaughter (1993)
argue that this is a very limited approach and point out that defining a simple skilled-
unskilled dichotomy misclassifies too many workers. They provide the following
example to explain the limitations:
Consider these two workers: an experienced machine-tool technician with a bachelor's
degree in computer science who programs the computers driving these tools, and a
recent high school dropout who files reports and runs mail. If they both work for a
manufacturing firm, the nonproduction-production distinction will classify the
technician as unskilled and the office runner as skilled (pp. 209-10).
Using Australian data, Marshall and Stone (2000) define skilled workers as the

159
ASCO89 occupations covering Managers, Professionals and Associate Professionals.
This is essentially a white collar skilled classification. Song and Webster (2003)
extend this classification to include Tradespersons in their estimation of Beveridge
curves for the ‘skilled’ and ‘unskilled’ segments of the labour market. These two
approaches provide a good example of how difficult comparisons of studies on skill
can be, even though the difference in skill measurement between them turns on one
occupational group (i.e. Tradespersons). Aungles et al. (1993) use educational
attainment levels to create an index of skill in their decomposition analysis for the
Australia economy. While this is a more desirable approach, it still lacks the multi-
dimensional characteristics of skill provided in the definition by Wolff (1996) and
Cain and Treiman (1981).
Table 7-1 Four-Way Skill Grouping by Occupation
Skill group ISCO90-88 Occupations/Group
White-collar high-skilled (WCHS) Legislators, senior officials and managers (Group 1), Professionals
(Group 2), Technicians and associate professionals (Group 3)
White-collar low-skilled (WCLS) Clerks, service workers (Group 4), Shop & market sales workers
(Group 5)
Blue-collar high-skilled (BCHS) Skilled agricultural and fishery workers (Group 6), Craft & related
trade workers (Group 7)
Blue-collar low-skilled (BCLS) Plant & machine operators and assemblers (Group 8), Elementary
occupations (Group 9)
89 Australian Standard Classification of Occupations 2nd edition (ABS 1997b)
90 The Third Version of the International Standard Classification of Occupations (ISCO-88). It was adopted by the
Fourteenth International Conference of Labour Statisticians in 1987 (ILO 2010).
160
Further delineations are possible, such as the approach used by Colecchia and
Papaconstantinou (1996) (see Table 7-1) which splits white and blue collar
occupations into high- and low-skill groups. A limitation of this approach is that it
does not provide any insights as to the relativity of skill levels between, say, high-
skill blue collar and high-skill white collar workers.
None of these approaches adequately capture the notion of a continuum of skill, or
that there are different dimensions to skill. Neither do they capture experience, or
performance (Lawrence and Slaughter 1993). In a similar vein, Howell and Wolff
(1990) argue that much of the heterogeneity of skills required in the workplace is
unmeasured in the usual skilled-unskilled dichotomy. For some occupations there is
little direct relationship with skill requirements and in many cases it is simply used by
employers as a screening mechanism.
Berman, Bound and Griliches (1994) defend the education level approach between
high-skill and low-skill workers. They argue that there is an acceptable degree of
alignment between occupation and education. They contend that the tolerance is
therefore acceptable, since education is the most critical determinant of skill levels.
Acemoglu (2002) argues that skills and education are only imperfectly correlated.
Therefore, given that there are both skilled and unskilled workers within any given
education group, increases in returns to 'skills' will result in increasing 'within-group'
variation in wages.91
91 Note that the vast majority of the US literature relating to observed changes in skill structures is motivated by
observed changes in wage inequality, these studies are referred to by Card and DiNardo (2002) and Acemoglu
(2002) as the 'inequality literature'.
161
An alternative focuses on the skill attributes required of jobs, such as those as defined
in the US Department of Labour’s Dictionary of Titles (DOT). Despite the limitations
of using the DOT (discussed in previous section, also see Attewell 1990; Cain and
Treiman 1981; Spenner 1983), it provides a convenient basis for the analysis of skills
independent from productivity measures and knowledge of individuals or workplaces.
This approach has been used in studies for West Germany (Spitz 2003), the US
(Autor, Levy and Murnane 2003; Wolff 1995; Howell and Wolff 1990), Australia
(Kelly and Lewis 2003, 2006, 2010; Kelly 2007; Pappas 1998) and the EU (Corvers
and Marikull 2007).
The job ‘attributes’ or ‘tasks’ approach provides a score for each occupation based on
the complexity of skills typically required of a job. The underlying information for
these studies has been extracted from the USDOL DOT. For US based studies, the
skill scores for occupations defined in the DOT are closely aligned with US Census
collections, and so enable skill index scores to be readily determined.
Few Australian studies have utilised the DOT to develop skill indices, the only ones
appearing in the mainstream economics literature being Kelly and Lewis (2003, 2006,
2010), Kelly (2007), and Pappas (1998). The study by Pappas (1998) has taken
occupations from the DOT that appear to align with occupations at the ASCO (1st
Ed.)92 1 digit level for Australia93 and directly applied the assigned scores in the DOT
to derive the skill index for Australia.
92 ABS (1996a), Information Paper: Census of Population and Housing: Link Between First and Second Editions
of Australian Standard Classification of Occupations (ASCO), Catalogue 1232.0, Australian Bureau of Statistics,
Canberra
93 Prior to 1986 Pappas (1998) uses the Classification and Classified List of Occupations (CCLO) (ABS 1981).
162
The approach used in the studies by Kelly and Lewis (2003, 2006, 2009, 2010) and
Kelly (2007) have involved reviewing the occupational task descriptions from the
ASCO 2nd
Edition Dictionary (ABS 1997b) and assessing these against the USDOL
DOT coding framework for ranking of skills.94 Once the skill scores have been
assigned to occupations, they are then combined with employment data from the
Census of Population and Housing to provide the mean skill score for industries and
the economy as a whole.
7.3 US Department of Labor’s Dictionary of Occupational Titles (DOT)
The US Department of Labor released the first edition of the DOT in 1939 initially to
facilitate the classification and placement of job seekers. The DOT was updated four
times between 1949 and 1991 with only minor changes to its basic structure. The
Fourth [1977] Edition and Revised Fourth [1991] edition of the US Department of
Labor’s Dictionary of Occupational Titles (DOT) contain classifications and ratings
of skills for each of its measured skill dimensions. The DOT contains 28,801 job
titles, of which 12,099 are distinct occupations (Cain and Treiman 1981). The
classifications and skill ratings are based upon first-hand observations for 12,099
detailed occupations in the workplace by US Department of Labor examiners.
The classification uses 44 objective and subjective dimensions, including worker
functions; training times; aptitudes; temperaments; interests; physical demands and
working conditions (Cain and Treiman 1981). What sets them apart from other
94 Shown in Table 7-2. Detailed information provided in Table A- 1 to Table A- 3 at Appendix A.
.
163
occupational information, such as educational attainment, is that they index job
content rather than worker characteristics (Cain and Treiman 1981). Of the
dimensions listed above, the ‘worker functions’ dimension provides the basis for
estimation in this thesis. It has three separate categories: data, people and things. The
USDOL (n.d.) provides the following example of a particular worker functions code
in the DOT:
The Worker Functions code (382) may be found in any occupational group. It signifies
that the worker is ‘compiling’ (3) in relation to data; ‘taking instructions-helping’ (8) in
relation to people; and ‘operating- controlling’ (2) in relation to things. The Worker
Functions code indicates the broadest level of responsibility or judgment required in
relation to data, people, or things. It is assumed that, if the job requires it, the worker
can generally perform any higher numbered95 function listed in each of the three
categories. (USDOL n.d.)
In the DOT jobs are classified as requiring workers to function to some degree in
relation to data, people, and things. As per the application in Wolff (1995) and
Howell and Wolff (1990), these dimensions of skill are taken as relating to cognitive,
interactive and motor skills, respectively. The scale for each skill dimension is shown
in Table 7-2. The fourth category shown in Table 7-2, education, has been
constructed by assigning ranks to the ABS Australian Qualification Framework
(AQF) (ABS 2001b) levels contained in the Census of Population and Housing.
Those tasks that involve more complex responsibility and judgment are assigned
lower numbers for each category and the less complicated have higher numbers. For
example, for the data skill dimension ‘compiling’ would be considered a more
complex task than ‘copying’. The same applies for the other dimensions. Each
dimension is considered separately. The scale relates to an ordering of the complexity
95 Higher numbered functions indicate lower order, or less complex, skills (see Table 7-2).
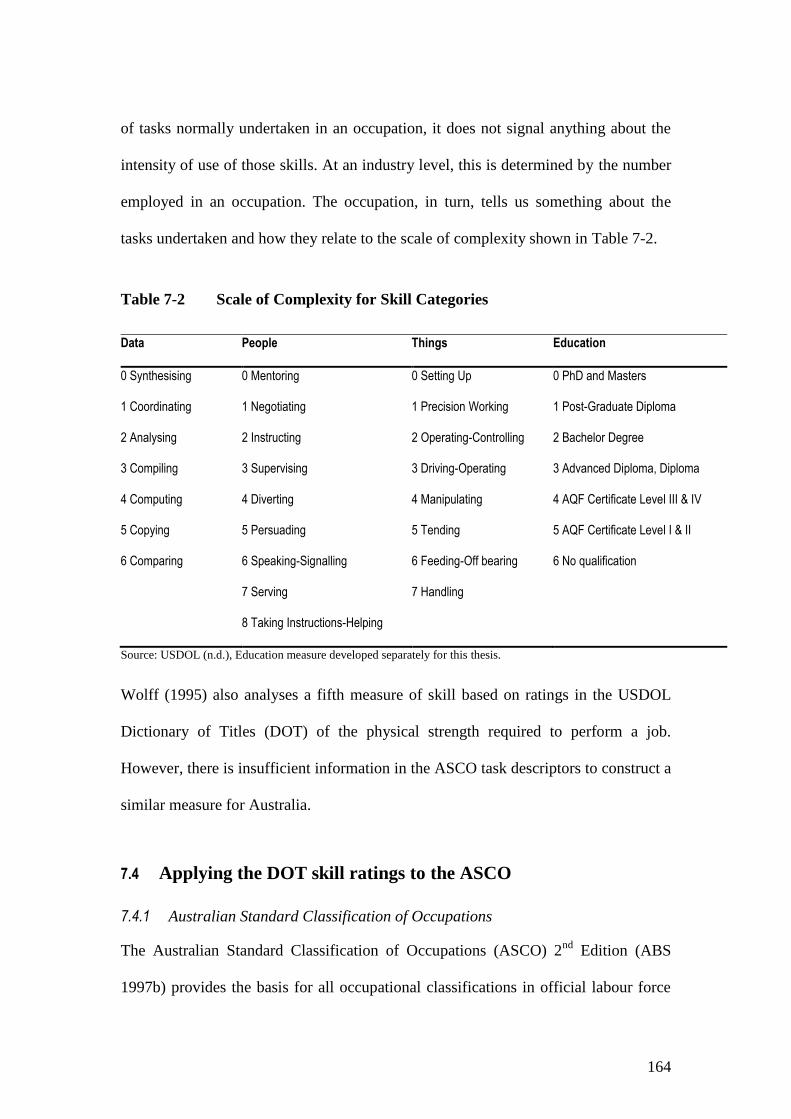
164
of tasks normally undertaken in an occupation, it does not signal anything about the
intensity of use of those skills. At an industry level, this is determined by the number
employed in an occupation. The occupation, in turn, tells us something about the
tasks undertaken and how they relate to the scale of complexity shown in Table 7-2.
Table 7-2 Scale of Complexity for Skill Categories
Data People Things Education
0 Synthesising 0 Mentoring 0 Setting Up 0 PhD and Masters
1 Coordinating 1 Negotiating 1 Precision Working 1 Post-Graduate Diploma
2 Analysing 2 Instructing 2 Operating-Controlling 2 Bachelor Degree
3 Compiling 3 Supervising 3 Driving-Operating 3 Advanced Diploma, Diploma
4 Computing 4 Diverting 4 Manipulating 4 AQF Certificate Level III & IV
5 Copying 5 Persuading 5 Tending 5 AQF Certificate Level I & II
6 Comparing 6 Speaking-Signalling 6 Feeding-Off bearing 6 No qualification
7 Serving 7 Handling
8 Taking Instructions-Helping
Source: USDOL (n.d.), Education measure developed separately for this thesis.
Wolff (1995) also analyses a fifth measure of skill based on ratings in the USDOL
Dictionary of Titles (DOT) of the physical strength required to perform a job.
However, there is insufficient information in the ASCO task descriptors to construct a
similar measure for Australia.
7.4 Applying the DOT skill ratings to the ASCO
7.4.1 Australian Standard Classification of Occupations
The Australian Standard Classification of Occupations (ASCO) 2nd
Edition (ABS
1997b) provides the basis for all occupational classifications in official labour force
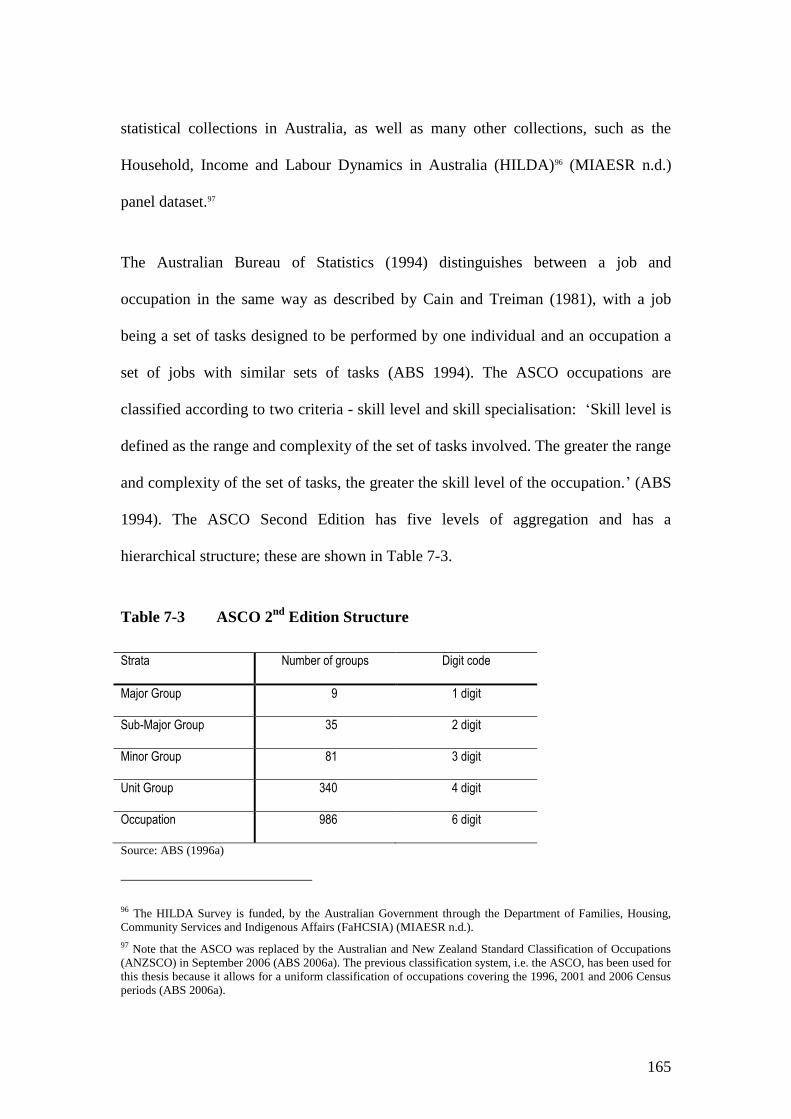
165
statistical collections in Australia, as well as many other collections, such as the
Household, Income and Labour Dynamics in Australia (HILDA)96 (MIAESR n.d.)
panel dataset.97
The Australian Bureau of Statistics (1994) distinguishes between a job and
occupation in the same way as described by Cain and Treiman (1981), with a job
being a set of tasks designed to be performed by one individual and an occupation a
set of jobs with similar sets of tasks (ABS 1994). The ASCO occupations are
classified according to two criteria - skill level and skill specialisation: ‘Skill level is
defined as the range and complexity of the set of tasks involved. The greater the range
and complexity of the set of tasks, the greater the skill level of the occupation.’ (ABS
1994). The ASCO Second Edition has five levels of aggregation and has a
hierarchical structure; these are shown in Table 7-3.
Table 7-3 ASCO 2nd
Edition Structure
Strata Number of groups Digit code
Major Group 9 1 digit
Sub-Major Group 35 2 digit
Minor Group 81 3 digit
Unit Group 340 4 digit
Occupation 986 6 digit
Source: ABS (1996a)
96 The HILDA Survey is funded, by the Australian Government through the Department of Families, Housing,
Community Services and Indigenous Affairs (FaHCSIA) (MIAESR n.d.).
97 Note that the ASCO was replaced by the Australian and New Zealand Standard Classification of Occupations
(ANZSCO) in September 2006 (ABS 2006a). The previous classification system, i.e. the ASCO, has been used for
this thesis because it allows for a uniform classification of occupations covering the 1996, 2001 and 2006 Census
periods (ABS 2006a).

166
7.4.2 Rating skills
Previous studies, such as Wolff (1995), Howell and Wolff (1990), Kelly (2007),
Kelly and Lewis (2003), and Pappas (1998), have also used the DOT to determine the
skill scores of an industry. For consistency, the nomenclature used in those studies to
relate to the various skill dimensions is employed here. Thus, the schema shown
above is applied as follows.
The ‘data’ category in Table 7-2 provides a measure of cognitive skills, the ‘people’
category aligns with interactive skills and the ‘things’ category provides an indicator
of motor skills. The education category used in this thesis comes from the education
requirement listed for each occupation in the ASCO 2nd
edition. The levels of
education, based on the Australian Qualifications Framework (AQF) (ABS 2001b),
were grouped into six levels, with a Master and Doctoral degree the highest and AQF
I & II98 the lowest formal skills. The measure is made complete by the addition of a
‘no qualification required’ level. All other measures were inverted, that is, the least
complex tasks were given the lowest score.
Occupational task descriptions contained in the Australian Standard Classification of
Occupations (ASCO) 2nd
edition have been reviewed for each of the 986 occupations
at the finest level of detail, i.e. the 6 digit level, and a score assigned for each of the
skill dimensions.
The most complex task undertaken in an occupation for each skill dimension, as
98 AQF I&II are the most basic of qualifications requiring a narrow range of elementary competencies, such as
demonstrating ‘… basic practical skills such as the use of relevant hand tools’. (AQF 2002). They may be acquired
through accredited training courses and/or recognition of prior learning (AQF 2002).
167
identified from the ASCO, provided the basis for applying the scores. This is
consistent with the assignment of skill scores within the DOT. The scale for all skill
categories from the process described above has been converted to a common scale of
0 to 10. The method of converting to a common scale is straightforward and does not
influence the results for a given skill dimension, as the relative position of a task
performed for an occupation retains its relative position in the scale for a ranking. The
purpose is to maintain a common scale across all skill dimensions.
The definitions for cognitive, interactive and motor skills are as follows:
DATA (Cognitive): Information, knowledge, and conceptions, related to data, people, or
things, obtained by observation, investigation, interpretation, visualisation, and mental
creation. Data are intangible and include numbers, words, symbols, ideas, concepts, and
oral verbalisation.’ (USDOL n.d.)
‘PEOPLE (Interactive): Human beings; also animals dealt with on an individual basis
as if they were human.’ (USDOL n.d)
‘THINGS (Motor): Inanimate objects as distinguished from human beings, substances or
materials; and machines, tools, equipment, work aids, and products. A thing is tangible
and has shape, form, and other physical characteristics.’ (USDOL n.d.)
The basic coding framework for cognitive, interactive and motor skills, extracted
from the US Department of Labor website99, is shown in Table A- 1 to Table A- 3 in
Appendix A.
In Table 7-4 the task descriptor for a Medical Laboratory Technician is shown to
provide a specific example of how the skill scores have been applied to occupational
task information. Taking all the information available, the most complex cognitive
task performed has been assessed as ‘undertakes or assists with analytical
99 United States Department of Labor: Office of Administrative Law Judges Law Library.
http://www.oalj.dol.gov/PUBLIC/DOT/REFERENCES/DOTAPPB.HTM, viewed 5/4/2010.
168
procedures’, ‘interprets the morphological features of peripheral blood smears in
consultation with medical scientists’, and ‘performs diagnostic tests’. Referring to
Table A- 1, the most highly ranked level of skill this relates to is ‘Analysing’ with a
rank of 2, the third ranked skill in terms of complexity.100 The attributes and actions
for this ranking are ‘Examining and evaluating data. Presenting alternative actions in
relation to the evaluation is frequently involved’. Note that many of the tasks
performed also align with lower ranks, but as per the compilation of the DOT
rankings, it is assumed that the lower order tasks can also be performed.
The same process is repeated for interactive skills, with the highest ranking task
assessed as ‘Supervising’ with a score of 3. The specific detail from the coding frame
used for this assessment is ‘may supervise laboratory staff’. The assessment for motor
skill is ‘Manipulating’ with a score of 4. The basis for this assessment was ‘uses
special devices to work’. Finally, the measure for education can also be extracted
from Table 7-4, with the minimum educational attainment cited as Diploma, which
from Table 7-2 is scored as 3.
100 The highest rank is 0. The process of inverting the scale and converting it from 0 to 10 would see the final
score of 6.7 assigned for the cognitive measure, computed as follows: 10-(10/6*2).
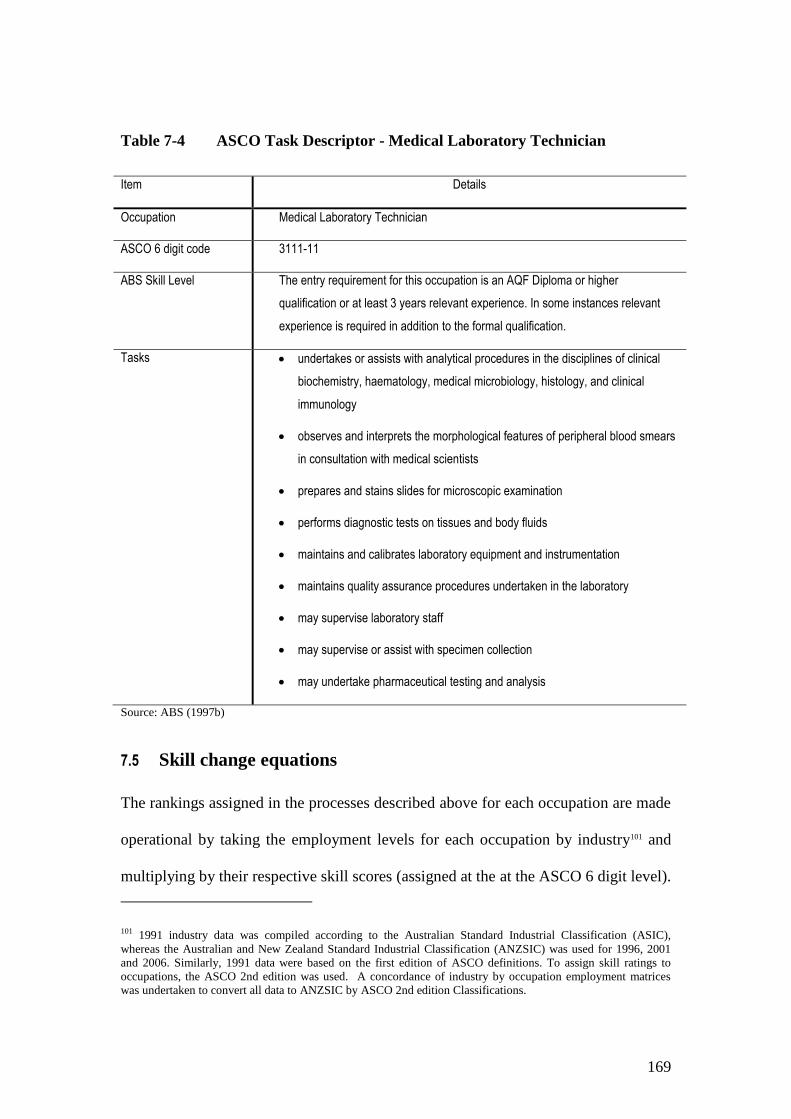
169
Table 7-4 ASCO Task Descriptor - Medical Laboratory Technician
Item Details
Occupation Medical Laboratory Technician
ASCO 6 digit code 3111-11
ABS Skill Level The entry requirement for this occupation is an AQF Diploma or higher
qualification or at least 3 years relevant experience. In some instances relevant
experience is required in addition to the formal qualification.
Tasks undertakes or assists with analytical procedures in the disciplines of clinical
biochemistry, haematology, medical microbiology, histology, and clinical
immunology
observes and interprets the morphological features of peripheral blood smears
in consultation with medical scientists
prepares and stains slides for microscopic examination
performs diagnostic tests on tissues and body fluids
maintains and calibrates laboratory equipment and instrumentation
maintains quality assurance procedures undertaken in the laboratory
may supervise laboratory staff
may supervise or assist with specimen collection
may undertake pharmaceutical testing and analysis
Source: ABS (1997b)
7.5 Skill change equations
The rankings assigned in the processes described above for each occupation are made
operational by taking the employment levels for each occupation by industry101 and
multiplying by their respective skill scores (assigned at the at the ASCO 6 digit level).
101 1991 industry data was compiled according to the Australian Standard Industrial Classification (ASIC),
whereas the Australian and New Zealand Standard Industrial Classification (ANZSIC) was used for 1996, 2001
and 2006. Similarly, 1991 data were based on the first edition of ASCO definitions. To assign skill ratings to
occupations, the ASCO 2nd edition was used. A concordance of industry by occupation employment matrices
was undertaken to convert all data to ANZSIC by ASCO 2nd edition Classifications.

170
Industry aggregation is at the Australian Standard Industrial Classification (ASIC)
Sub-Division (2 digit) level (ABS 1993). The following equations provide the mean
skill scores for the various occupational aggregations and industry. They also show
the decompositions used for the analyses in Chapter 8. The decomposition of industry
mean skill scores provided in this thesis cover four effects:
1. Within-industry: occupational effect: Captures the changing occupational
composition within industries. This is reflected in the mean skill scores within
an industry.
2. Between-industry effect: Captures the changing employment shares of
industry. Given industry occupational structures are different from one
another, and hence mean skill scores vary, any change in their overall share of
employment will contribute to overall skill demand in the economy, all else
being equal.
3. Within-industry: employment status effect:102 If the average skill levels
required for part-time employment differ from full-time employment and
there is a shift towards part-time employment, then the mean skill levels will
also be affected. As discussed in Chapter 5, there has been a massive switch to
part-time employment in the economy. This measure will provide some
insight into the extent to which this has been de-skilling. As for the switch
towards part-time effect, a shift away from full-time employment will lower
102 That is, the part-time/full-time status of employment. The ABS definition for part-time is less than 35 hours per
week in total across all jobs held.

171
the mean skill score. Note that the within-industry effect described above
excludes the contribution of the change in the part-time/full-time composition
of the workforce within an industry. The full impact of within-industry
changes are the aggregation of both 1 & 3.
Further detail on these effects are provided at Section 7.5.1.
The measure of mean skill levels in the economy is provided by:
urq
nmk
kmnkmn
urq
nmk
m OOsS,,
1,,
,,
1,,
(1)
k = (1, …q)
m = (1, …r)
n = (1,.....u)
where:
S is the mean cognitive skill score for the economy;
s is the skill score of an occupation and is constant across time;
O is the number of people employed in an occupation.
subscripts denote:

172
k industry;
m occupation;
n part-time or full-time employment status.
For the part-time workforce the decomposition is:
111111 knkmkknknkkmnknn hbhbahbaS (2)
For full-time:
222222 knkmkknknkkmnknn hbhbahbaS (3)
Where the occupation m share of industry k is:
r
m
mmkm OOb1
(4)
The industry k share of total employed in the economy is:
q
k
k
r
m
mk OOh11
(5)
the share of total employment for industry k worked by employees of status n is given
by:
r
m
mnkn OOa1
(6)
7.5.1 Interpretation of skill change measures
The net (combined) value of the first term on the right of equations (2) & (3) provides
173
the employment status effect component of within-industry changes. That is, it is the
impact of shifting the balance between part-time and full-time employment. Where
the mean skills of the part-time and full-time workforce differ, changes in their
relative shares of employment will affect mean skill levels. The second term on the
right captures the occupational composition effect component of within-industry
changes. Again, where occupations have different skill levels to one another, changes
in their shares of employment within an industry will change mean industry skill
levels. Finally, the last expression on the right of equations (2) & (3) provides the
between-industry effect. Industries that have relatively low skill levels that increase
their share of total employment will lower the economy-wide mean skill level.
The decompositions shown above have been undertaken for the sub-periods 1991 to
1996, 1996 to 2001 and 2001 to 2006, as well as the total change between 1991 and
2006. Equations (2) & (3) provide the data for the dependent variable in the skill
regressions shown in Chapter 9.
7.6 Summary
This chapter reviewed the methods commonly used in studies of skill change. It was
argued that simple high-low skill dichotomies based on production and non-
production workers (i.e. blue collar and white collar workers) are deficient.
Educational attainment, although a useful measure, has a number of shortcomings, the
most serious is that it is capturing the attributes of the worker, not the requirements of
the job. Both of these measures are also one dimensional. An alternative approach to
skill measurement was proposed, along with a scoring framework that can be applied

174
to Australian occupational data by combining it with occupational task information.
In the next chapter the mean skill scores are presented for the four skill dimensions
presented in this chapter. The results from the shift-share analysis are also presented.
175
8 CHANGES IN SKILL DEMAND
Chapters 6 and 7 examined the different ways of categorising workers according to
skill, the apparent limitations of the various approaches, the preferred approach to
skill measurement and the algorithm for the shift-share analyses used in this thesis.
As discussed in Chapter 6, the empirical implications of SBTC stated by Berman,
Bound and Machin (1998) are that within-industry changes in skill demand should be
observed. This chapter presents the results of the measures outlined in Chapter 7 and
to examine changes in the demand for skill in Australia between 1991 and 2006and
decompose these changes into within-industry, between-industry and full-time versus
part-time effects.
8.1 Occupational Skill Rankings
The ABS skill levels for the Australian Standard Classification of Occupations
(ASCO) 2nd
ed. Major Groups of occupations (i.e. 1 digit level) are shown alongside
the ratings for cognitive, education, interactive and motor skills in Table 8-1. It
should be noted that the different dimensions of skill are not intended to be directly
comparable, although it is feasible to estimate wage equations based on the influence
of these dimensions (see Lewis and Mahony 2006), which in turn may provide an
indicator of how the market would rank the various skill dimensions.
The ranking of skills for the most part follows the ordering of the occupations, with
Managers and Administrators at the top and Labourers and Related Workers at the
bottom. The notable exception is the motor skills dimension. For motor skills, the
Tradespersons category ranks highest, with Advanced Clerical and Service Workers
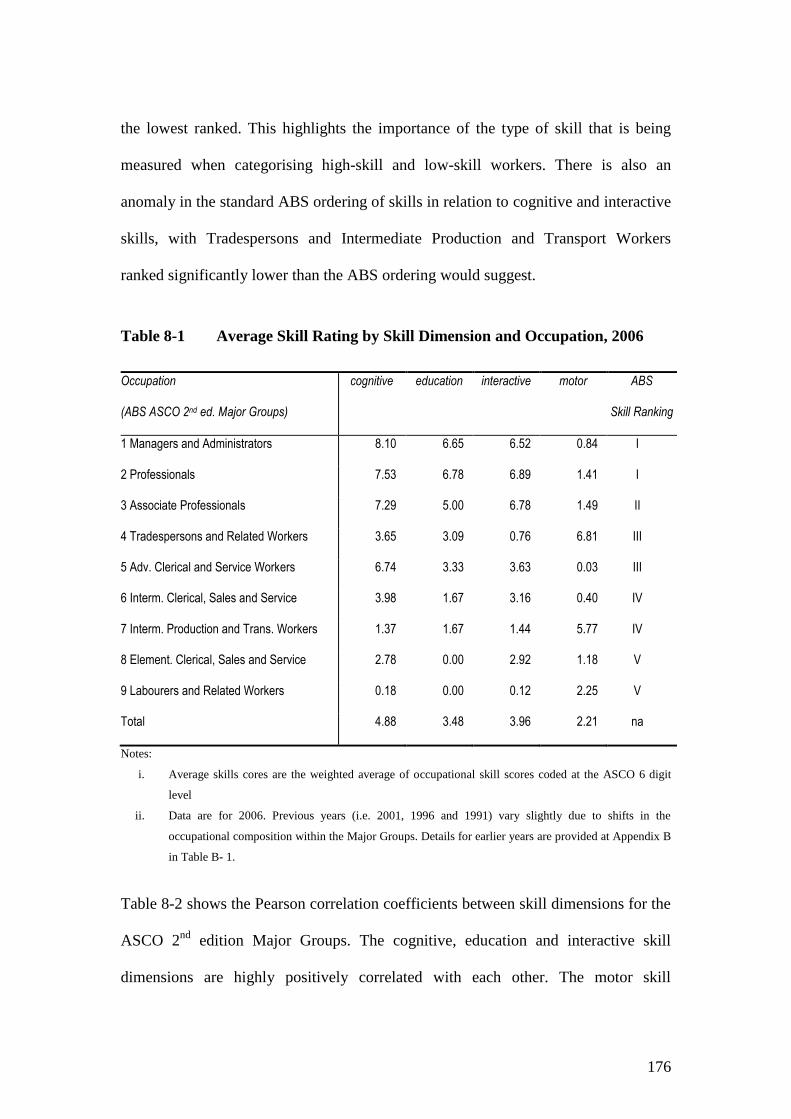
176
the lowest ranked. This highlights the importance of the type of skill that is being
measured when categorising high-skill and low-skill workers. There is also an
anomaly in the standard ABS ordering of skills in relation to cognitive and interactive
skills, with Tradespersons and Intermediate Production and Transport Workers
ranked significantly lower than the ABS ordering would suggest.
Table 8-1 Average Skill Rating by Skill Dimension and Occupation, 2006
Occupation
(ABS ASCO 2nd ed. Major Groups)
cognitive education interactive motor ABS
Skill Ranking
1 Managers and Administrators 8.10 6.65 6.52 0.84 I
2 Professionals 7.53 6.78 6.89 1.41 I
3 Associate Professionals 7.29 5.00 6.78 1.49 II
4 Tradespersons and Related Workers 3.65 3.09 0.76 6.81 III
5 Adv. Clerical and Service Workers 6.74 3.33 3.63 0.03 III
6 Interm. Clerical, Sales and Service 3.98 1.67 3.16 0.40 IV
7 Interm. Production and Trans. Workers 1.37 1.67 1.44 5.77 IV
8 Element. Clerical, Sales and Service 2.78 0.00 2.92 1.18 V
9 Labourers and Related Workers 0.18 0.00 0.12 2.25 V
Total 4.88 3.48 3.96 2.21 na
Notes:
i. Average skills cores are the weighted average of occupational skill scores coded at the ASCO 6 digit
level
ii. Data are for 2006. Previous years (i.e. 2001, 1996 and 1991) vary slightly due to shifts in the
occupational composition within the Major Groups. Details for earlier years are provided at Appendix B
in Table B- 1.
Table 8-2 shows the Pearson correlation coefficients between skill dimensions for the
ASCO 2nd
edition Major Groups. The cognitive, education and interactive skill
dimensions are highly positively correlated with each other. The motor skill
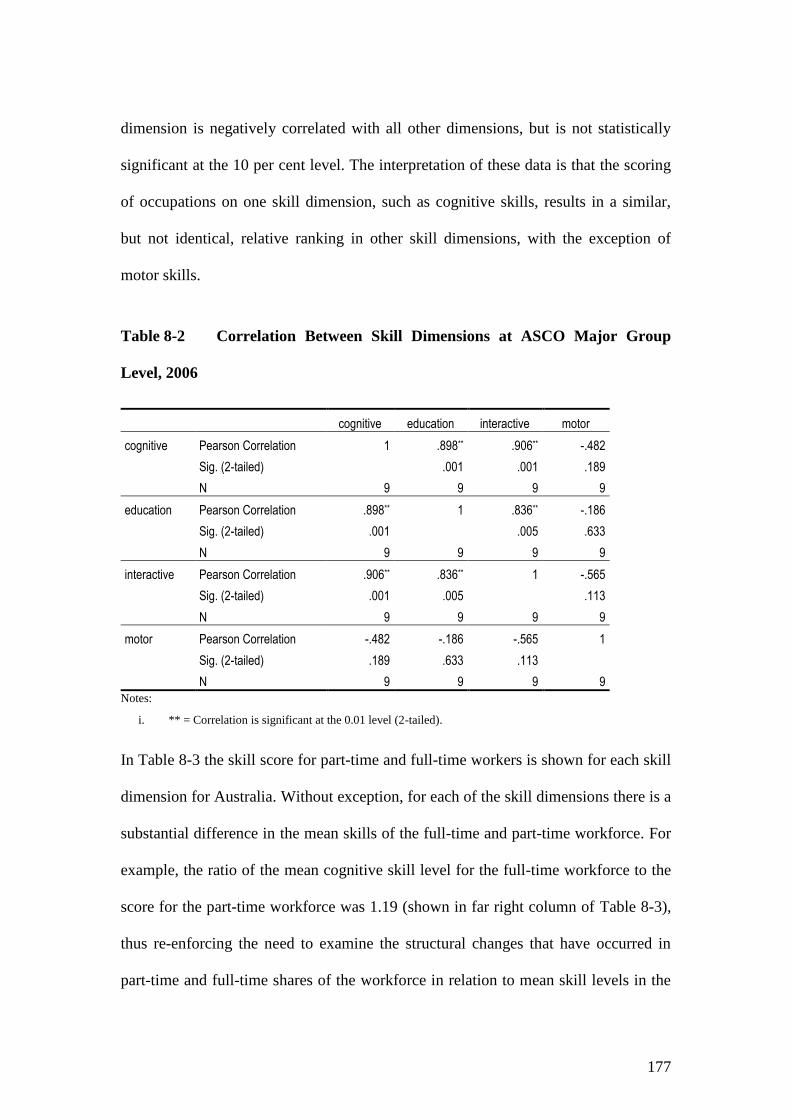
177
dimension is negatively correlated with all other dimensions, but is not statistically
significant at the 10 per cent level. The interpretation of these data is that the scoring
of occupations on one skill dimension, such as cognitive skills, results in a similar,
but not identical, relative ranking in other skill dimensions, with the exception of
motor skills.
Table 8-2 Correlation Between Skill Dimensions at ASCO Major Group
Level, 2006
cognitive education interactive motor
cognitive Pearson Correlation 1 .898** .906** -.482
Sig. (2-tailed) .001 .001 .189
N 9 9 9 9
education Pearson Correlation .898** 1 .836** -.186
Sig. (2-tailed) .001 .005 .633
N 9 9 9 9
interactive Pearson Correlation .906** .836** 1 -.565
Sig. (2-tailed) .001 .005 .113
N 9 9 9 9
motor Pearson Correlation -.482 -.186 -.565 1
Sig. (2-tailed) .189 .633 .113
N 9 9 9 9
Notes:
i. ** = Correlation is significant at the 0.01 level (2-tailed).
In Table 8-3 the skill score for part-time and full-time workers is shown for each skill
dimension for Australia. Without exception, for each of the skill dimensions there is a
substantial difference in the mean skills of the full-time and part-time workforce. For
example, the ratio of the mean cognitive skill level for the full-time workforce to the
score for the part-time workforce was 1.19 (shown in far right column of Table 8-3),
thus re-enforcing the need to examine the structural changes that have occurred in
part-time and full-time shares of the workforce in relation to mean skill levels in the
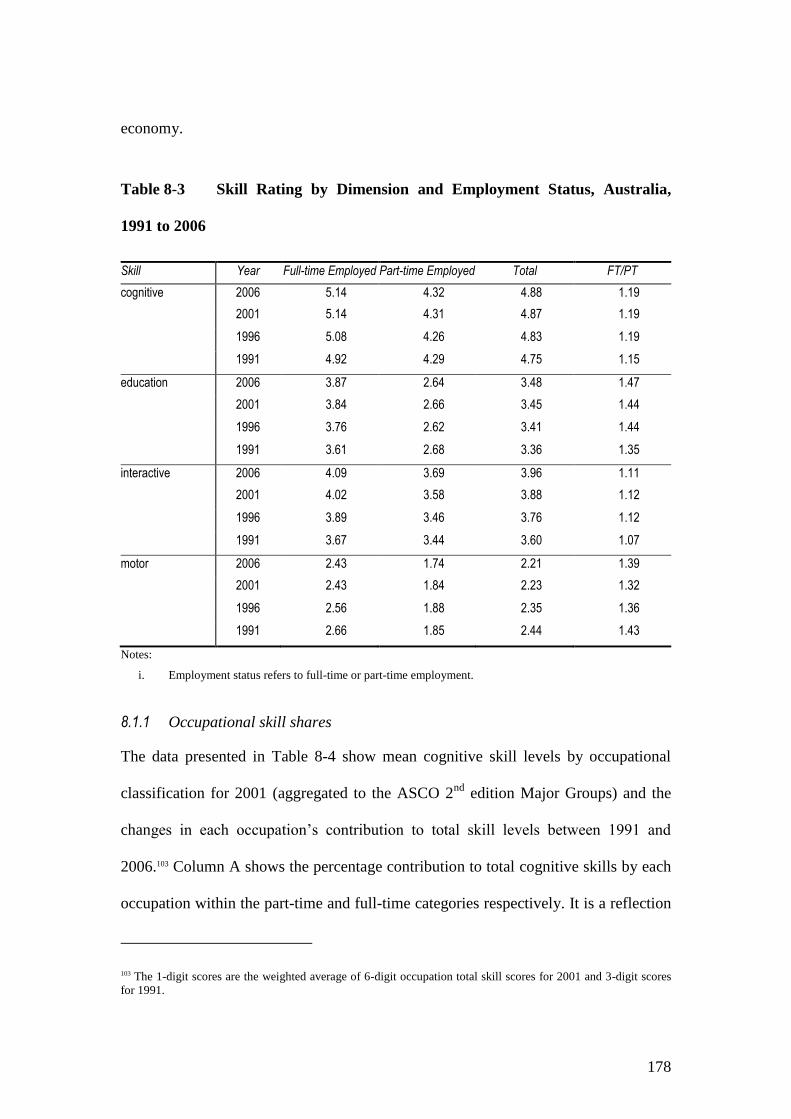
178
economy.
Table 8-3 Skill Rating by Dimension and Employment Status, Australia,
1991 to 2006
Skill Year Full-time Employed Part-time Employed Total FT/PT
cognitive 2006 5.14 4.32 4.88 1.19
2001 5.14 4.31 4.87 1.19
1996 5.08 4.26 4.83 1.19
1991 4.92 4.29 4.75 1.15
education 2006 3.87 2.64 3.48 1.47
2001 3.84 2.66 3.45 1.44
1996 3.76 2.62 3.41 1.44
1991 3.61 2.68 3.36 1.35
interactive 2006 4.09 3.69 3.96 1.11
2001 4.02 3.58 3.88 1.12
1996 3.89 3.46 3.76 1.12
1991 3.67 3.44 3.60 1.07
motor 2006 2.43 1.74 2.21 1.39
2001 2.43 1.84 2.23 1.32
1996 2.56 1.88 2.35 1.36
1991 2.66 1.85 2.44 1.43
Notes:
i. Employment status refers to full-time or part-time employment.
8.1.1 Occupational skill shares
The data presented in Table 8-4 show mean cognitive skill levels by occupational
classification for 2001 (aggregated to the ASCO 2nd
edition Major Groups) and the
changes in each occupation’s contribution to total skill levels between 1991 and
2006.103 Column A shows the percentage contribution to total cognitive skills by each
occupation within the part-time and full-time categories respectively. It is a reflection
103 The 1-digit scores are the weighted average of 6-digit occupation total skill scores for 2001 and 3-digit scores
for 1991.
179
of both the skill score for that occupation and their employment weight in terms of
total employment. For example, Professionals account for 30.8 per cent of the total
skill score of the part-time workforce for Australia. This result derives from the total
number employed in the Professionals occupational group (on a part-time basis)
multiplied by their skill score. Columns B to E show the changes in skill shares for
each occupational group for the various periods.
There are a number of noteworthy features in Table 8-4. First, skill changes were
greatest for full-time workers and for the occupational groupings expected to benefit
from technological change that supports higher skilled workers. That is, the bottom
half of the ASCO skill distribution experienced a decline in their cognitive skill share
for full-time workers. The effect was strongest for Advanced Clerical and Service
workers and Elementary Clerical, Sales and Service workers (also taking into account
their relative weight in total skills). Indeed, full-time Advanced Clerical and Service
workers decreased their share of total cognitive skills by nearly half between 1991
and 2006. Professionals and Associate Professionals, on the other hand, experienced a
strong increase in the share of total cognitive skills, increasing by 17.2 and 15.7 per
cent respectively. Managers and Administrators experienced a modest decline, a
reflection in part of the ongoing consolidation in the farming sector which has a large
share of its workforce that are owner-managers.
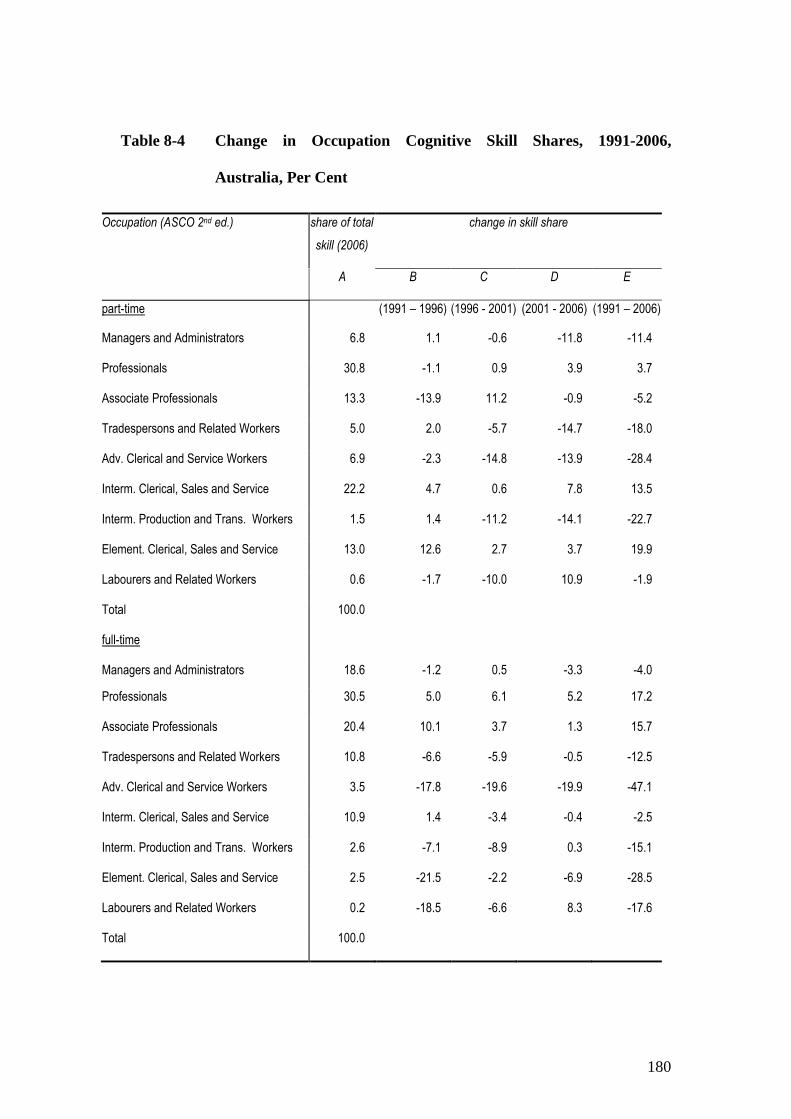
180
Table 8-4 Change in Occupation Cognitive Skill Shares, 1991-2006,
Australia, Per Cent
Occupation (ASCO 2nd ed.) share of total
skill (2006)
change in skill share
A B C D E
part-time (1991 – 1996) (1996 - 2001) (2001 - 2006) (1991 – 2006)
Managers and Administrators 6.8 1.1 -0.6 -11.8 -11.4
Professionals 30.8 -1.1 0.9 3.9 3.7
Associate Professionals 13.3 -13.9 11.2 -0.9 -5.2
Tradespersons and Related Workers 5.0 2.0 -5.7 -14.7 -18.0
Adv. Clerical and Service Workers 6.9 -2.3 -14.8 -13.9 -28.4
Interm. Clerical, Sales and Service 22.2 4.7 0.6 7.8 13.5
Interm. Production and Trans. Workers 1.5 1.4 -11.2 -14.1 -22.7
Element. Clerical, Sales and Service 13.0 12.6 2.7 3.7 19.9
Labourers and Related Workers 0.6 -1.7 -10.0 10.9 -1.9
Total 100.0
full-time
Managers and Administrators 18.6 -1.2 0.5 -3.3 -4.0
Professionals 30.5 5.0 6.1 5.2 17.2
Associate Professionals 20.4 10.1 3.7 1.3 15.7
Tradespersons and Related Workers 10.8 -6.6 -5.9 -0.5 -12.5
Adv. Clerical and Service Workers 3.5 -17.8 -19.6 -19.9 -47.1
Interm. Clerical, Sales and Service 10.9 1.4 -3.4 -0.4 -2.5
Interm. Production and Trans. Workers 2.6 -7.1 -8.9 0.3 -15.1
Element. Clerical, Sales and Service 2.5 -21.5 -2.2 -6.9 -28.5
Labourers and Related Workers 0.2 -18.5 -6.6 8.3 -17.6
Total 100.0
181
Elementary Clerical, Sales and Service workers experienced a substantial increase in
their share of total skill in the part-time workforce for the 1991 to 1996 period, as
would be expected in a period of recovery following recession, particularly in the
retail sector. At the same time they also experienced a major decline in their skill
share within the full-time workforce. The changes for this occupation were relatively
small in the 1996 to 2001 period, but experienced more rapid growth post-2001 as the
economy approached full employment levels.
Another striking feature of the data in Table 8-4 is that full-time Advanced Clerical
and Service workers experienced a sharp decline in their share of total skill in all
periods, whereas for part-time workers the decline was mainly in the post-1996
period. Given the record low levels of unemployment by 2006, 15 years of
uninterrupted economic growth and substantial growth in the total number of jobs, it
is of interest that this occupational group fared so poorly.
Finally, the changes in occupational skill shares appear to be consistent with the
notions of complementarity between ICT and cognitive skills and of substitutability
between ICT and routine cognitive skills. The higher order occupations such as
Professionals (characterised by non-routine cognitive tasks) increased their share of
employment for full-time, while less complex jobs, that could be characterised by
routine cognitive tasks, such as clerical work, fell quite sharply. Both of these effects
can be interpreted as consistent with skill-biased technological change. Particularly
telling is that the clerical occupations experienced substantial declines in their skill
share after 1996, coinciding with the rapid increase of ICT investment. Further detail
on the interactive, education and motor skill dimensions can be found at Appendix B.
182
8.2 Industry Skill Structure
The mean skill scores of an industry are determined by the occupational structure.
Industries that are predominantly concerned with industrial activities, such as
Construction, Transport and Storage, Manufacturing, Mining, Electricity, Gas and
Water, and the Agriculture, Forestry and Fishing industries will tend to score
relatively high on motor skills. Most service sector industries will generally score
high on cognitive skills, although some, such as the Retail industry, will be at the
lower end of the spectrum due to the large share of storefront workers, cashiers and so
forth, that have lower ratings for cognitive skills.
In Table 8-5 industries have been sorted according to their 2006 mean cognitive skill
score. The highest rating is for the Education industry, with a mean score of 7.17,
while Transport and Storage are at the other end of the scale with a mean score of
3.65. The mean cognitive skill score for the economy overall in 2006 was 4.88,
virtually unchanged from 4.87 in 2001. However, the relative ranking of industries
has not been stable over that time, a result of continuing occupation change within
some industries. Of note is the significant fall in the mean cognitive skill level for the
Electricity Gas and Water industry, falling by over 13 per cent between 2001 and
2006.
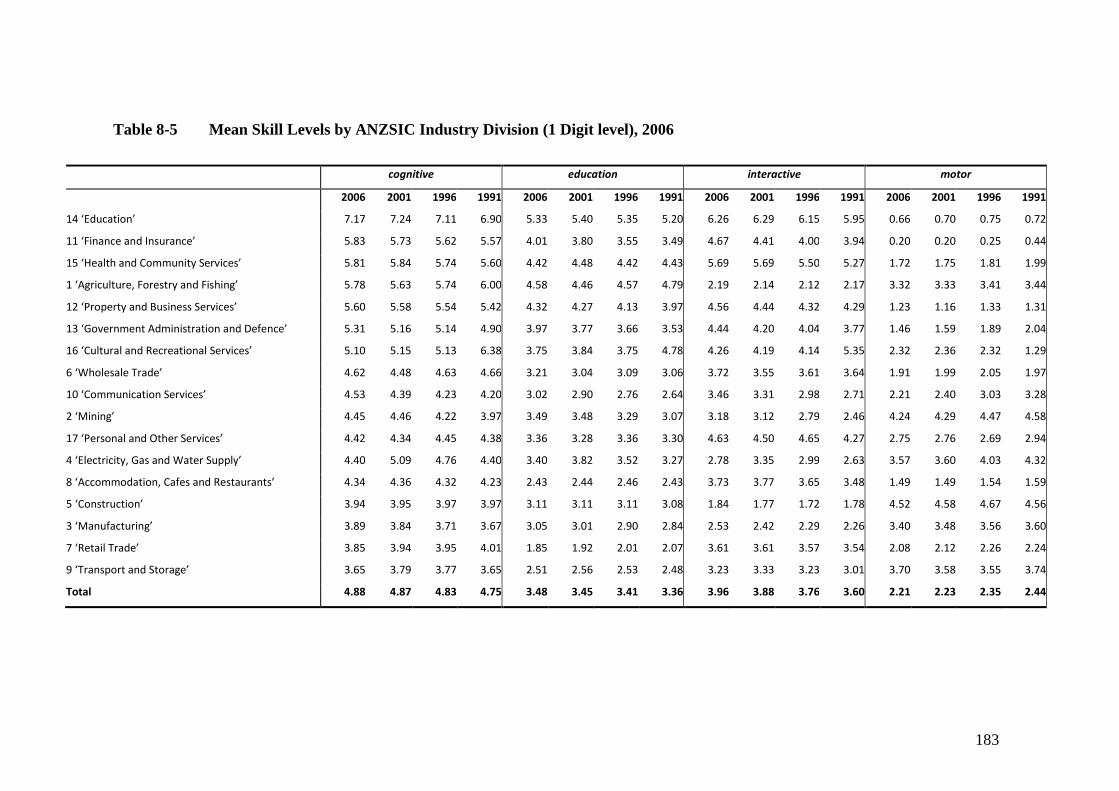
183
Table 8-5 Mean Skill Levels by ANZSIC Industry Division (1 Digit level), 2006
cognitive education interactive motor
2006 2001 1996 1991 2006 2001 1996 1991 2006 2001 1996 1991 2006 2001 1996 1991
14 ‘Education’ 7.17 7.24 7.11 6.90 5.33 5.40 5.35 5.20 6.26 6.29 6.15 5.95 0.66 0.70 0.75 0.72
11 ‘Finance and Insurance’ 5.83 5.73 5.62 5.57 4.01 3.80 3.55 3.49 4.67 4.41 4.00 3.94 0.20 0.20 0.25 0.44
15 ‘Health and Community Services’ 5.81 5.84 5.74 5.60 4.42 4.48 4.42 4.43 5.69 5.69 5.50 5.27 1.72 1.75 1.81 1.99
1 ‘Agriculture, Forestry and Fishing’ 5.78 5.63 5.74 6.00 4.58 4.46 4.57 4.79 2.19 2.14 2.12 2.17 3.32 3.33 3.41 3.44
12 ‘Property and Business Services’ 5.60 5.58 5.54 5.42 4.32 4.27 4.13 3.97 4.56 4.44 4.32 4.29 1.23 1.16 1.33 1.31
13 ‘Government Administration and Defence’ 5.31 5.16 5.14 4.90 3.97 3.77 3.66 3.53 4.44 4.20 4.04 3.77 1.46 1.59 1.89 2.04
16 ‘Cultural and Recreational Services’ 5.10 5.15 5.13 6.38 3.75 3.84 3.75 4.78 4.26 4.19 4.14 5.35 2.32 2.36 2.32 1.29
6 ‘Wholesale Trade’ 4.62 4.48 4.63 4.66 3.21 3.04 3.09 3.06 3.72 3.55 3.61 3.64 1.91 1.99 2.05 1.97
10 ‘Communication Services’ 4.53 4.39 4.23 4.20 3.02 2.90 2.76 2.64 3.46 3.31 2.98 2.71 2.21 2.40 3.03 3.28
2 ‘Mining’ 4.45 4.46 4.22 3.97 3.49 3.48 3.29 3.07 3.18 3.12 2.79 2.46 4.24 4.29 4.47 4.58
17 ‘Personal and Other Services’ 4.42 4.34 4.45 4.38 3.36 3.28 3.36 3.30 4.63 4.50 4.65 4.27 2.75 2.76 2.69 2.94
4 ‘Electricity, Gas and Water Supply’ 4.40 5.09 4.76 4.40 3.40 3.82 3.52 3.27 2.78 3.35 2.99 2.63 3.57 3.60 4.03 4.32
8 ‘Accommodation, Cafes and Restaurants’ 4.34 4.36 4.32 4.23 2.43 2.44 2.46 2.43 3.73 3.77 3.65 3.48 1.49 1.49 1.54 1.59
5 ‘Construction’ 3.94 3.95 3.97 3.97 3.11 3.11 3.11 3.08 1.84 1.77 1.72 1.78 4.52 4.58 4.67 4.56
3 ‘Manufacturing’ 3.89 3.84 3.71 3.67 3.05 3.01 2.90 2.84 2.53 2.42 2.29 2.26 3.40 3.48 3.56 3.60
7 ‘Retail Trade’ 3.85 3.94 3.95 4.01 1.85 1.92 2.01 2.07 3.61 3.61 3.57 3.54 2.08 2.12 2.26 2.24
9 ‘Transport and Storage’ 3.65 3.79 3.77 3.65 2.51 2.56 2.53 2.48 3.23 3.33 3.23 3.01 3.70 3.58 3.55 3.74
Total 4.88 4.87 4.83 4.75 3.48 3.45 3.41 3.36 3.96 3.88 3.76 3.60 2.21 2.23 2.35 2.44
184
There were 9 out of 17 industries that recorded declines in the mean cognitive skill
score between 2001 and 2006, compared to five industries between 1996 and 2001.
Four industries recorded a decline between 1991 and 1996. For motor skills 14 out of
17 industries recorded declines in mean skill levels for both the 2001 to 2006 period
and the 1996 to 2001 period, while 11 industries recorded declines between 1991 and
1996. Only six industries recorded declines in mean interactive skill levels between
2001 and 2006, two declined during the 1996 to 2001 period and three recorded
declines between the 1991 and 1996.
What appears to be occurring is a shift in emphasis towards higher-skilled
employment within industries and occupational groupings. Importantly, there is also a
shift away from occupations that have relatively high motor skill requirements. This
reflects the movements in industry employment shown in Table 5-4 and Table 5-5 in
Chapter 5. The main changes were declines in total employment for Manufacturing,
Electricity Gas and Water, Wholesale Trade and the Agriculture, Forestry and Fishing
industries for the 15 years to 2006. This is despite a period where the economy
experienced rapid and sustained growth over a 15 year period, particularly after 1993.
Offsetting these declines were large increases in service sector employment,
industries that will tend to have a greater emphasis on cognitive and interactive skills
and high levels of educational attainment. This is reflected in the growth rates for
three occupational groups. Between 1991 and 2006, employment of Managers and
Administrators; Professionals; and Associate Professionals grew by an average of 3.1,
3.5 and 4.0 per cent per year respectively. This compares to total employment
growing at just 2.0 per cent per year over the same period.
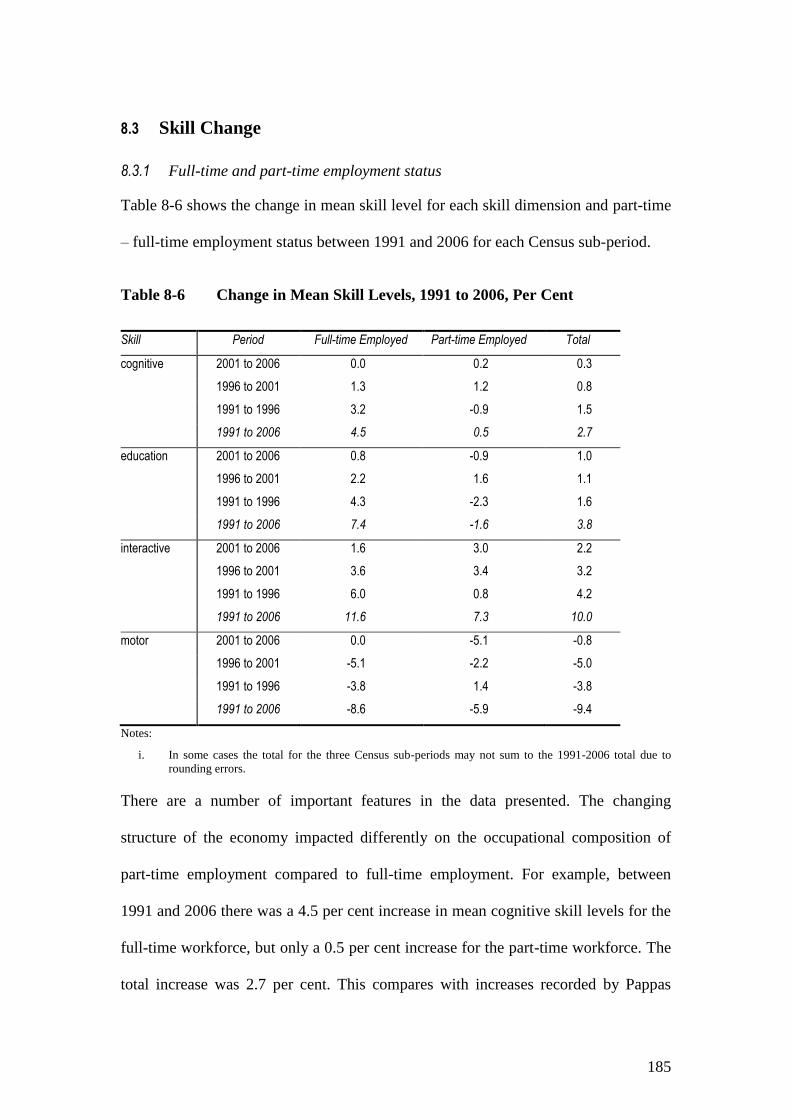
185
8.3 Skill Change
8.3.1 Full-time and part-time employment status
Table 8-6 shows the change in mean skill level for each skill dimension and part-time
– full-time employment status between 1991 and 2006 for each Census sub-period.
Table 8-6 Change in Mean Skill Levels, 1991 to 2006, Per Cent
Skill Period Full-time Employed Part-time Employed Total
cognitive 2001 to 2006 0.0 0.2 0.3
1996 to 2001 1.3 1.2 0.8
1991 to 1996 3.2 -0.9 1.5
1991 to 2006 4.5 0.5 2.7
education 2001 to 2006 0.8 -0.9 1.0
1996 to 2001 2.2 1.6 1.1
1991 to 1996 4.3 -2.3 1.6
1991 to 2006 7.4 -1.6 3.8
interactive 2001 to 2006 1.6 3.0 2.2
1996 to 2001 3.6 3.4 3.2
1991 to 1996 6.0 0.8 4.2
1991 to 2006 11.6 7.3 10.0
motor 2001 to 2006 0.0 -5.1 -0.8
1996 to 2001 -5.1 -2.2 -5.0
1991 to 1996 -3.8 1.4 -3.8
1991 to 2006 -8.6 -5.9 -9.4
Notes:
i. In some cases the total for the three Census sub-periods may not sum to the 1991-2006 total due to
rounding errors.
There are a number of important features in the data presented. The changing
structure of the economy impacted differently on the occupational composition of
part-time employment compared to full-time employment. For example, between
1991 and 2006 there was a 4.5 per cent increase in mean cognitive skill levels for the
full-time workforce, but only a 0.5 per cent increase for the part-time workforce. The
total increase was 2.7 per cent. This compares with increases recorded by Pappas
186
(1998) of 4 per cent between 1981 and 1991.
There was an increase of 7.4 per cent in the mean education level for the Australian
economy between 1991 and 2006. However, the changes differed between the part-
time and full-time workforce. For the part-time workforce the mean education level
actually decreased by 1.6 per cent over this period, suggesting a deskilling of the part-
time workforce in terms of educational requirements.
Interactive skills recorded the biggest percentage increase in mean skill levels, with
large gains for both the full-time and part-time workforce. Overall the mean
interactive skill level increased by 10.0 per cent between 1991 and 2006, with full-
time increasing by 11.6 per cent and part-time by 7.3 per cent. Interactive skills were
also the fastest growing skill dimension between 1981 and 1991 (Pappas 1998), with
an increase 11 per cent over the period.
Motor skills have the distinction of being the only skill dimension to fall over the 15
year period to 2006. Overall, the mean level of motor skills fell by 9.6 per cent,
falling by 8.6 per cent for the full-time workforce and 5.9 per cent for the part-time
workforce. This also highlights the fact that there was a switch to part-time
employment where motor skills are substantially lower on average than the full-time
workforce, hence there was a re-enforcing effect on the overall fall in mean skill
levels.104 The overall decline in motor skills is also part of a long-term decline that has
occurred at least since the early 1980s. Pappas (1998) reports motor skills falling by 8
104 Note a decline of 9.6 per cent overall for motor skills is higher than the individual decline in motor skills of 8.6
per cent and 5.9 per cent for full-time and part-time employment respectively. This is a result of an increasing
share of part-time workers in the workforce. The mean level of motor skills for part-time workers in 1991 was 1.85, compared to 2.66 for full-time workers.
187
per cent between 1981 and 1991. These changes are also consistent with the increased
flexibility in the labour market arising from the microeconomic reforms initiated
under the Hawke-Keating Labor Government and extended under the Howard
Liberal-National Coalition Government. As discussed in Chapter 5, Laplagne, Glover
and Fry (2005) found that the increased uptake of labour hire workers, typically
engaged on a part-time basis, resulted from increased workplace level bargaining,
arguing that this was the direct outcome of the flexibility introduced under the
Workplace Relations Act 1996.
Consistent with the experience in the US (see, for example, Berman, Bound and
Machin 1998; Bresnahan, Brynjolfsson and Hitt 2002; Englehardt 2009) and as found
by Pappas (1998) for Australia, changes recorded in mean skill levels for each skill
dimension vary between sub-periods. A similar pattern occurred for cognitive and
interactive skills, which show an increase in the mean skill level of the full-time
workforce and a decline for the part-time workforce for the 1991 to 1996 period. One
possible cause is a recovery of full-time employment, following a deep recession,
among higher-skilled knowledge workers, while recovery for manual trades was more
subdued and mainly in more tenuous part-time employment. Thus, a corresponding
increase was observed for motor skills for part-time. Growth in cognitive, interactive
and education mean skill levels continued through 1996 to 2001, although at a slower
pace for full-time employment. The 2001 to 2006 period is of interest since it saw
total employment levels rise to record levels and the unemployment rate drop to its
lowest level since the 1970s (see Chapter 5). Mean skill levels for cognitive skills
barely changed, with a 0.0 and 0.2 per cent change for the full-time and part-time
workforce respectively.
188
8.4 Shift-Share Analysis
8.4.1 Changes over time
Table 8-7 shows the percentage contribution of each period to the total skill change
between 1991 and 2006. With the exception of motor skills, most of the change in
mean skill levels occurred in the 1991 to 1996 period, which can be attributed to the
recovery in demand benefiting the upper end of the skill profile. For example,
between the 1991 and 1996 Census periods there was a 16.4 per cent increase in
employment levels for the economy as a whole. Professionals and Associate
Professionals increased by 23.1 and 21.6 per cent respectively, while Labourers and
Related Workers, with the lowest mean skill levels for cognitive, education and
interactive skills, only increased by 10.5 per cent over the five year period. Labourers
and Related Workers are generally considered to be ‘unskilled’, and the pool of long-
term unemployed is over-represented with people whose previous employment was in
this occupational group. Motor skills actually declined over the 15 year period to
2006, with 94.9 per cent of this occurring between 1991 and 2001. The falls for both
sub-periods were of a similar magnitude. Changes to mean levels of education were
essentially split into three equal contributions over the 15 year period, with the 2001-
2006 period being just under a third (30.1 per cent). For all other skill dimensions the
2001-2006 period saw less change in mean skill levels, ranging from an increase of
22.3 per cent for interactive skills to a 5.1 per cent decline for motor skills.
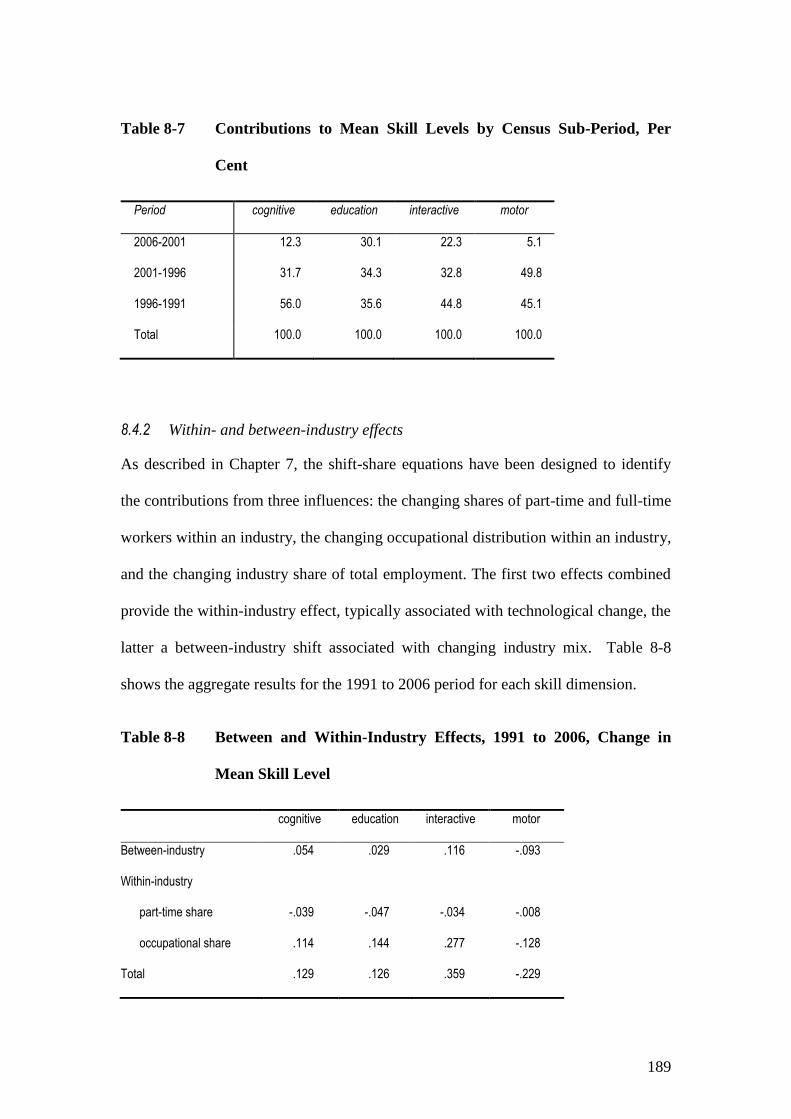
189
Table 8-7 Contributions to Mean Skill Levels by Census Sub-Period, Per
Cent
Period cognitive education interactive motor
2006-2001 12.3 30.1 22.3 5.1
2001-1996 31.7 34.3 32.8 49.8
1996-1991 56.0 35.6 44.8 45.1
Total 100.0 100.0 100.0 100.0
8.4.2 Within- and between-industry effects
As described in Chapter 7, the shift-share equations have been designed to identify
the contributions from three influences: the changing shares of part-time and full-time
workers within an industry, the changing occupational distribution within an industry,
and the changing industry share of total employment. The first two effects combined
provide the within-industry effect, typically associated with technological change, the
latter a between-industry shift associated with changing industry mix. Table 8-8
shows the aggregate results for the 1991 to 2006 period for each skill dimension.
Table 8-8 Between and Within-Industry Effects, 1991 to 2006, Change in
Mean Skill Level
cognitive education interactive motor
Between-industry .054 .029 .116 -.093
Within-industry
part-time share -.039 -.047 -.034 -.008
occupational share .114 .144 .277 -.128
Total .129 .126 .359 -.229
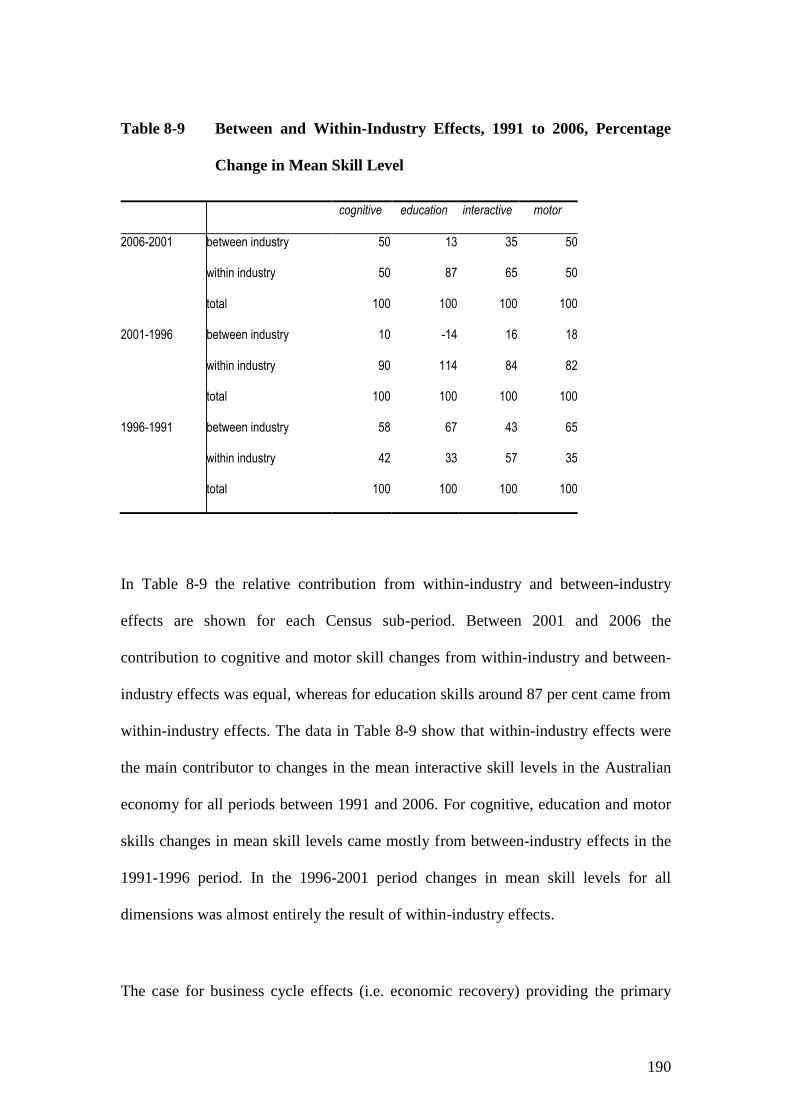
190
Table 8-9 Between and Within-Industry Effects, 1991 to 2006, Percentage
Change in Mean Skill Level
cognitive education interactive motor
2006-2001 between industry 50 13 35 50
within industry 50 87 65 50
total 100 100 100 100
2001-1996 between industry 10 -14 16 18
within industry 90 114 84 82
total 100 100 100 100
1996-1991 between industry 58 67 43 65
within industry 42 33 57 35
total 100 100 100 100
In Table 8-9 the relative contribution from within-industry and between-industry
effects are shown for each Census sub-period. Between 2001 and 2006 the
contribution to cognitive and motor skill changes from within-industry and between-
industry effects was equal, whereas for education skills around 87 per cent came from
within-industry effects. The data in Table 8-9 show that within-industry effects were
the main contributor to changes in the mean interactive skill levels in the Australian
economy for all periods between 1991 and 2006. For cognitive, education and motor
skills changes in mean skill levels came mostly from between-industry effects in the
1991-1996 period. In the 1996-2001 period changes in mean skill levels for all
dimensions was almost entirely the result of within-industry effects.
The case for business cycle effects (i.e. economic recovery) providing the primary
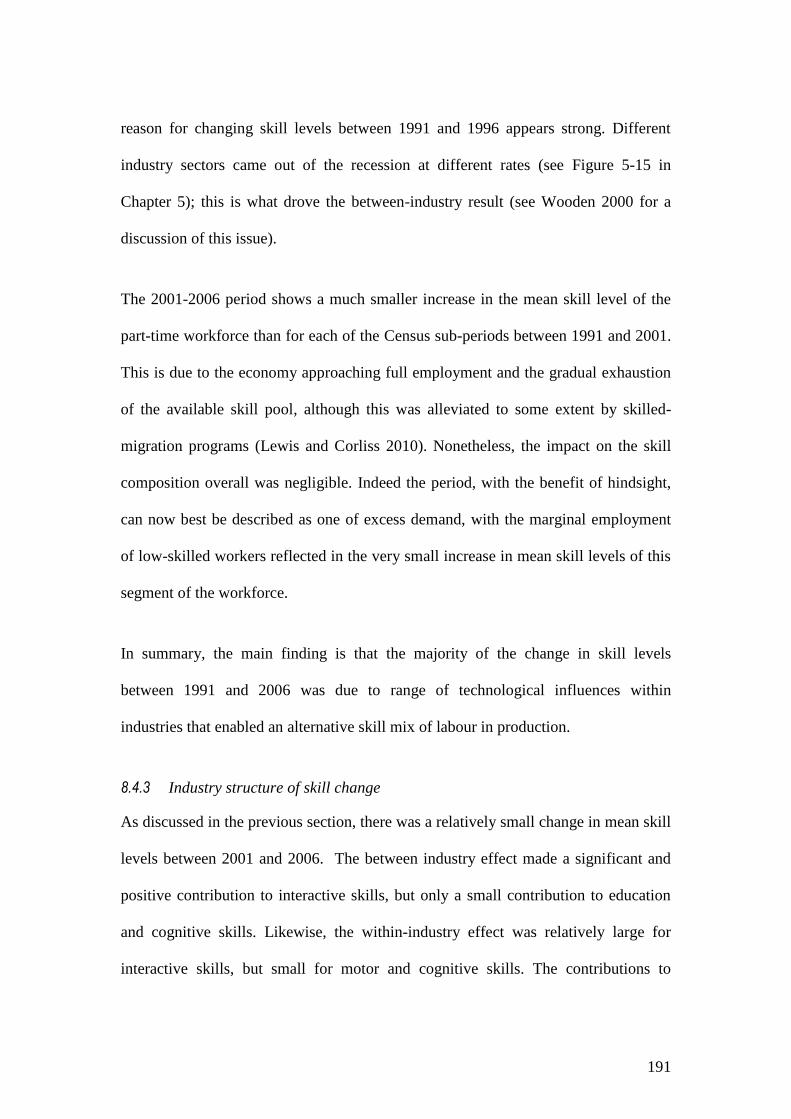
191
reason for changing skill levels between 1991 and 1996 appears strong. Different
industry sectors came out of the recession at different rates (see Figure 5-15 in
Chapter 5); this is what drove the between-industry result (see Wooden 2000 for a
discussion of this issue).
The 2001-2006 period shows a much smaller increase in the mean skill level of the
part-time workforce than for each of the Census sub-periods between 1991 and 2001.
This is due to the economy approaching full employment and the gradual exhaustion
of the available skill pool, although this was alleviated to some extent by skilled-
migration programs (Lewis and Corliss 2010). Nonetheless, the impact on the skill
composition overall was negligible. Indeed the period, with the benefit of hindsight,
can now best be described as one of excess demand, with the marginal employment
of low-skilled workers reflected in the very small increase in mean skill levels of this
segment of the workforce.
In summary, the main finding is that the majority of the change in skill levels
between 1991 and 2006 was due to range of technological influences within
industries that enabled an alternative skill mix of labour in production.
8.4.3 Industry structure of skill change
As discussed in the previous section, there was a relatively small change in mean skill
levels between 2001 and 2006. The between industry effect made a significant and
positive contribution to interactive skills, but only a small contribution to education
and cognitive skills. Likewise, the within-industry effect was relatively large for
interactive skills, but small for motor and cognitive skills. The contributions to
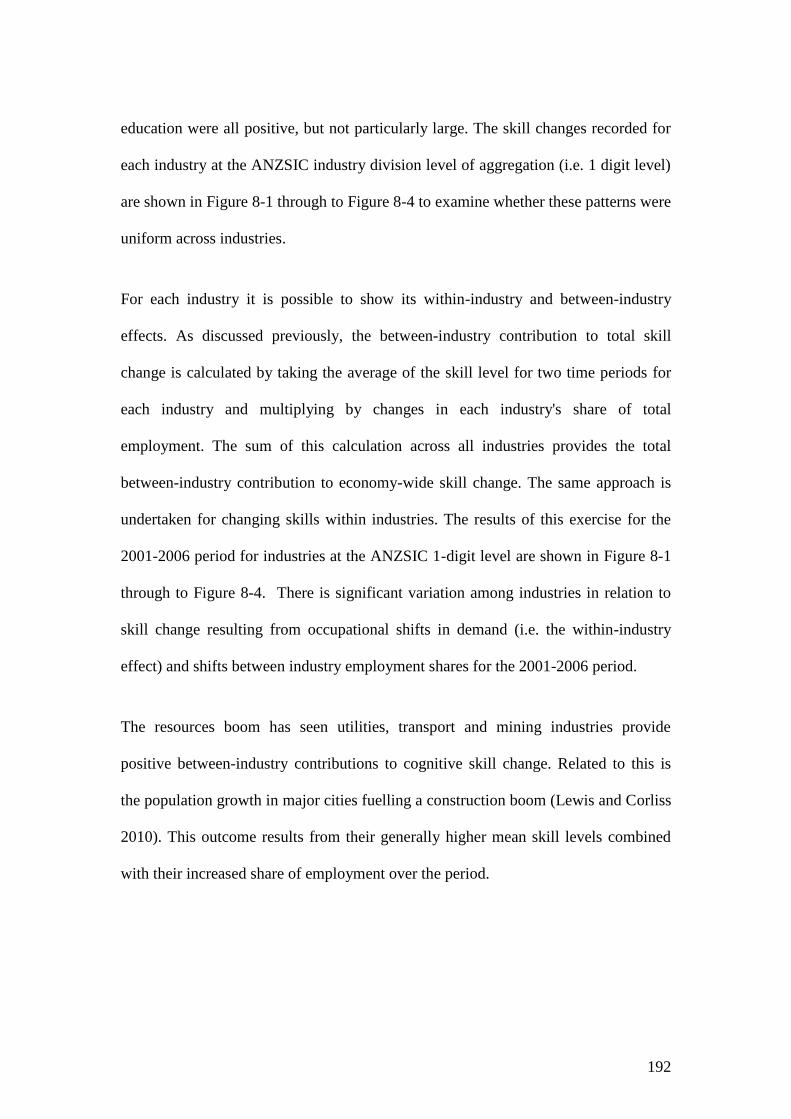
192
education were all positive, but not particularly large. The skill changes recorded for
each industry at the ANZSIC industry division level of aggregation (i.e. 1 digit level)
are shown in Figure 8-1 through to Figure 8-4 to examine whether these patterns were
uniform across industries.
For each industry it is possible to show its within-industry and between-industry
effects. As discussed previously, the between-industry contribution to total skill
change is calculated by taking the average of the skill level for two time periods for
each industry and multiplying by changes in each industry's share of total
employment. The sum of this calculation across all industries provides the total
between-industry contribution to economy-wide skill change. The same approach is
undertaken for changing skills within industries. The results of this exercise for the
2001-2006 period for industries at the ANZSIC 1-digit level are shown in Figure 8-1
through to Figure 8-4. There is significant variation among industries in relation to
skill change resulting from occupational shifts in demand (i.e. the within-industry
effect) and shifts between industry employment shares for the 2001-2006 period.
The resources boom has seen utilities, transport and mining industries provide
positive between-industry contributions to cognitive skill change. Related to this is
the population growth in major cities fuelling a construction boom (Lewis and Corliss
2010). This outcome results from their generally higher mean skill levels combined
with their increased share of employment over the period.
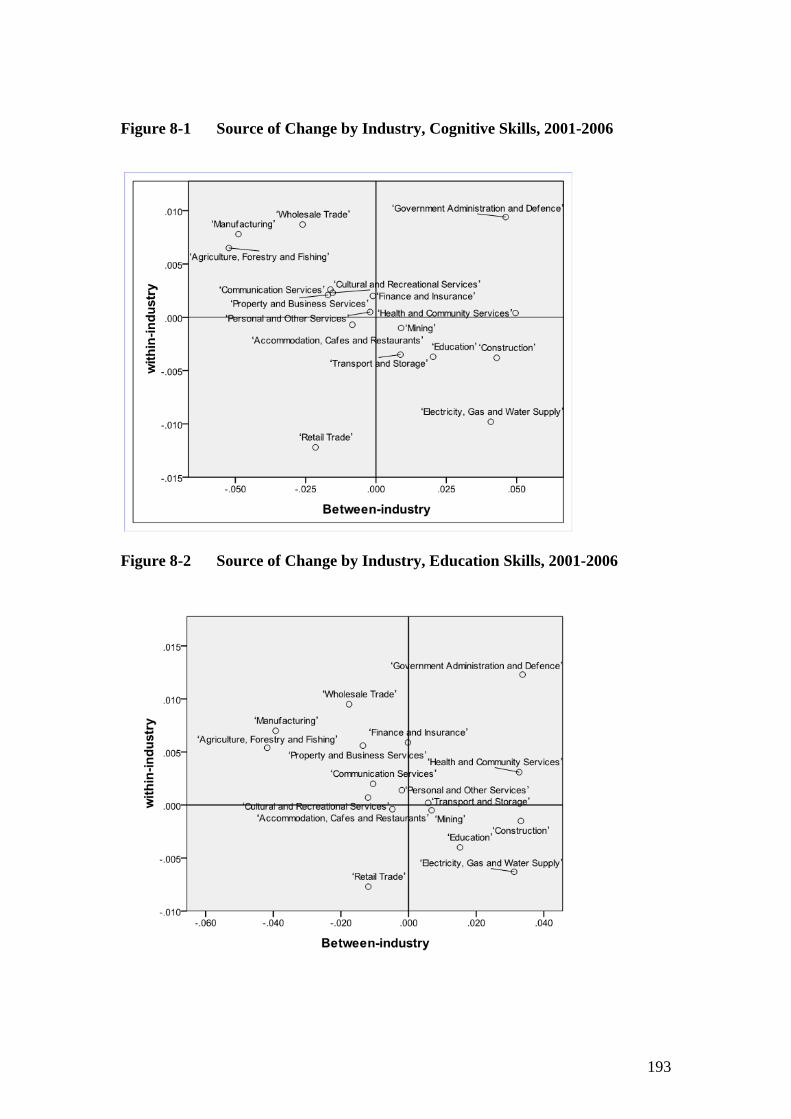
193
Figure 8-1 Source of Change by Industry, Cognitive Skills, 2001-2006
Figure 8-2 Source of Change by Industry, Education Skills, 2001-2006
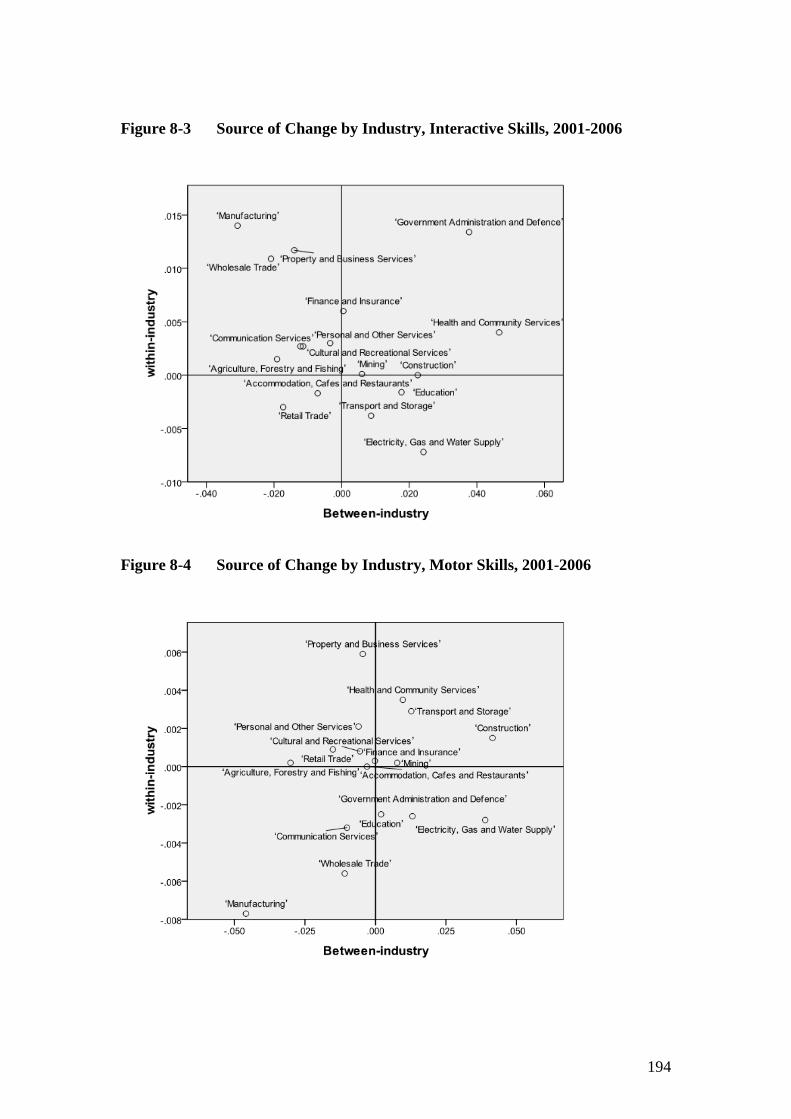
194
Figure 8-3 Source of Change by Industry, Interactive Skills, 2001-2006
Figure 8-4 Source of Change by Industry, Motor Skills, 2001-2006
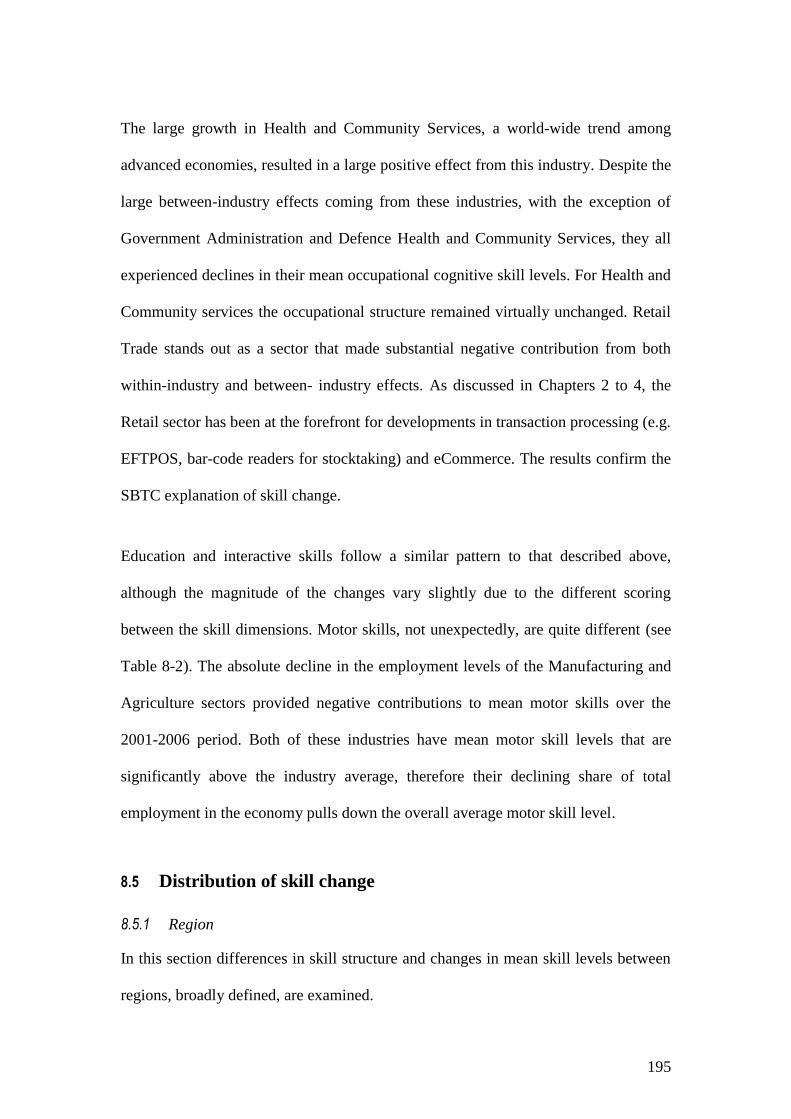
195
The large growth in Health and Community Services, a world-wide trend among
advanced economies, resulted in a large positive effect from this industry. Despite the
large between-industry effects coming from these industries, with the exception of
Government Administration and Defence Health and Community Services, they all
experienced declines in their mean occupational cognitive skill levels. For Health and
Community services the occupational structure remained virtually unchanged. Retail
Trade stands out as a sector that made substantial negative contribution from both
within-industry and between- industry effects. As discussed in Chapters 2 to 4, the
Retail sector has been at the forefront for developments in transaction processing (e.g.
EFTPOS, bar-code readers for stocktaking) and eCommerce. The results confirm the
SBTC explanation of skill change.
Education and interactive skills follow a similar pattern to that described above,
although the magnitude of the changes vary slightly due to the different scoring
between the skill dimensions. Motor skills, not unexpectedly, are quite different (see
Table 8-2). The absolute decline in the employment levels of the Manufacturing and
Agriculture sectors provided negative contributions to mean motor skills over the
2001-2006 period. Both of these industries have mean motor skill levels that are
significantly above the industry average, therefore their declining share of total
employment in the economy pulls down the overall average motor skill level.
8.5 Distribution of skill change
8.5.1 Region
In this section differences in skill structure and changes in mean skill levels between
regions, broadly defined, are examined.
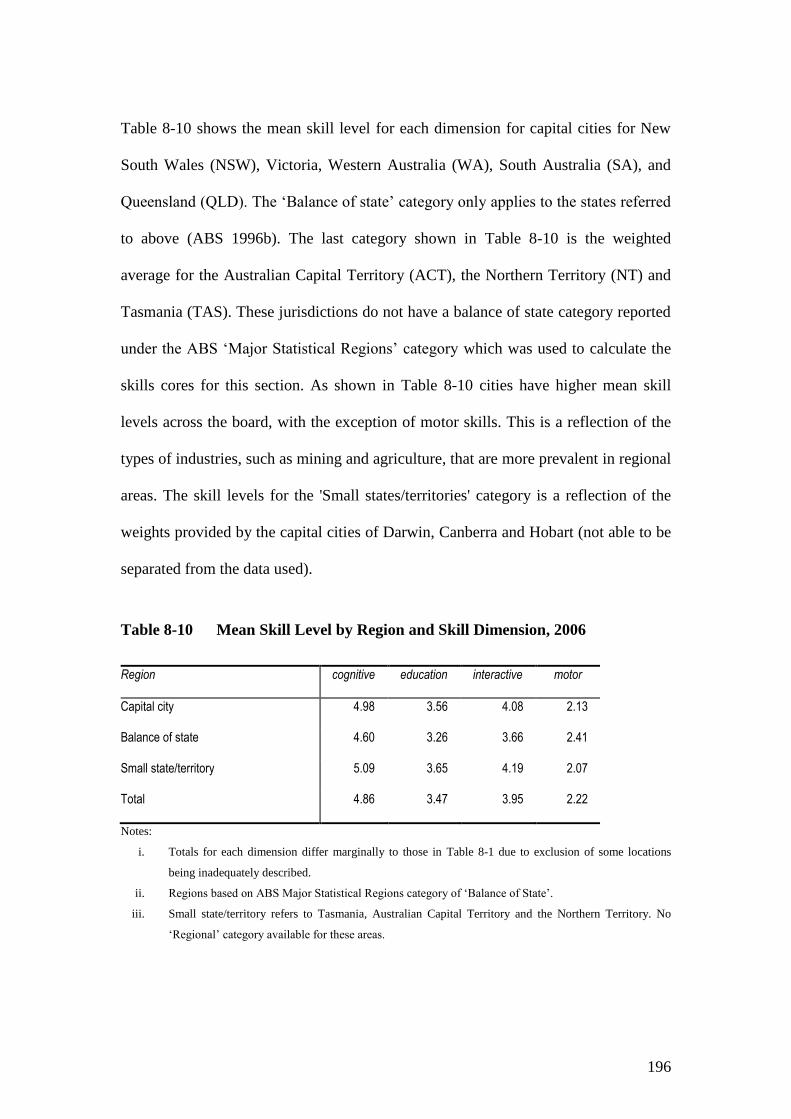
196
Table 8-10 shows the mean skill level for each dimension for capital cities for New
South Wales (NSW), Victoria, Western Australia (WA), South Australia (SA), and
Queensland (QLD). The ‘Balance of state’ category only applies to the states referred
to above (ABS 1996b). The last category shown in Table 8-10 is the weighted
average for the Australian Capital Territory (ACT), the Northern Territory (NT) and
Tasmania (TAS). These jurisdictions do not have a balance of state category reported
under the ABS ‘Major Statistical Regions’ category which was used to calculate the
skills cores for this section. As shown in Table 8-10 cities have higher mean skill
levels across the board, with the exception of motor skills. This is a reflection of the
types of industries, such as mining and agriculture, that are more prevalent in regional
areas. The skill levels for the 'Small states/territories' category is a reflection of the
weights provided by the capital cities of Darwin, Canberra and Hobart (not able to be
separated from the data used).
Table 8-10 Mean Skill Level by Region and Skill Dimension, 2006
Region cognitive education interactive motor
Capital city 4.98 3.56 4.08 2.13
Balance of state 4.60 3.26 3.66 2.41
Small state/territory 5.09 3.65 4.19 2.07
Total 4.86 3.47 3.95 2.22
Notes:
i. Totals for each dimension differ marginally to those in Table 8-1 due to exclusion of some locations
being inadequately described.
ii. Regions based on ABS Major Statistical Regions category of ‘Balance of State’.
iii. Small state/territory refers to Tasmania, Australian Capital Territory and the Northern Territory. No
‘Regional’ category available for these areas.
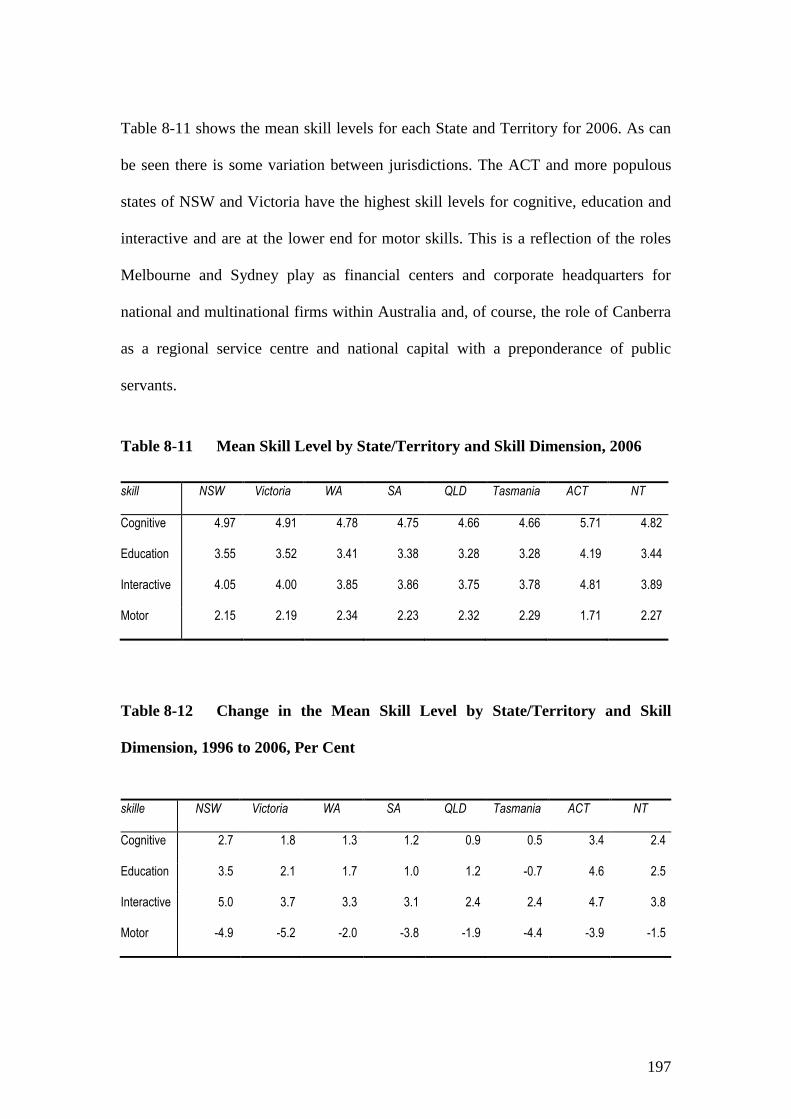
197
Table 8-11 shows the mean skill levels for each State and Territory for 2006. As can
be seen there is some variation between jurisdictions. The ACT and more populous
states of NSW and Victoria have the highest skill levels for cognitive, education and
interactive and are at the lower end for motor skills. This is a reflection of the roles
Melbourne and Sydney play as financial centers and corporate headquarters for
national and multinational firms within Australia and, of course, the role of Canberra
as a regional service centre and national capital with a preponderance of public
servants.
Table 8-11 Mean Skill Level by State/Territory and Skill Dimension, 2006
skill NSW Victoria WA SA QLD Tasmania ACT NT
Cognitive 4.97 4.91 4.78 4.75 4.66 4.66 5.71 4.82
Education 3.55 3.52 3.41 3.38 3.28 3.28 4.19 3.44
Interactive 4.05 4.00 3.85 3.86 3.75 3.78 4.81 3.89
Motor 2.15 2.19 2.34 2.23 2.32 2.29 1.71 2.27
Table 8-12 Change in the Mean Skill Level by State/Territory and Skill
Dimension, 1996 to 2006, Per Cent
skille NSW Victoria WA SA QLD Tasmania ACT NT
Cognitive 2.7 1.8 1.3 1.2 0.9 0.5 3.4 2.4
Education 3.5 2.1 1.7 1.0 1.2 -0.7 4.6 2.5
Interactive 5.0 3.7 3.3 3.1 2.4 2.4 4.7 3.8
Motor -4.9 -5.2 -2.0 -3.8 -1.9 -4.4 -3.9 -1.5
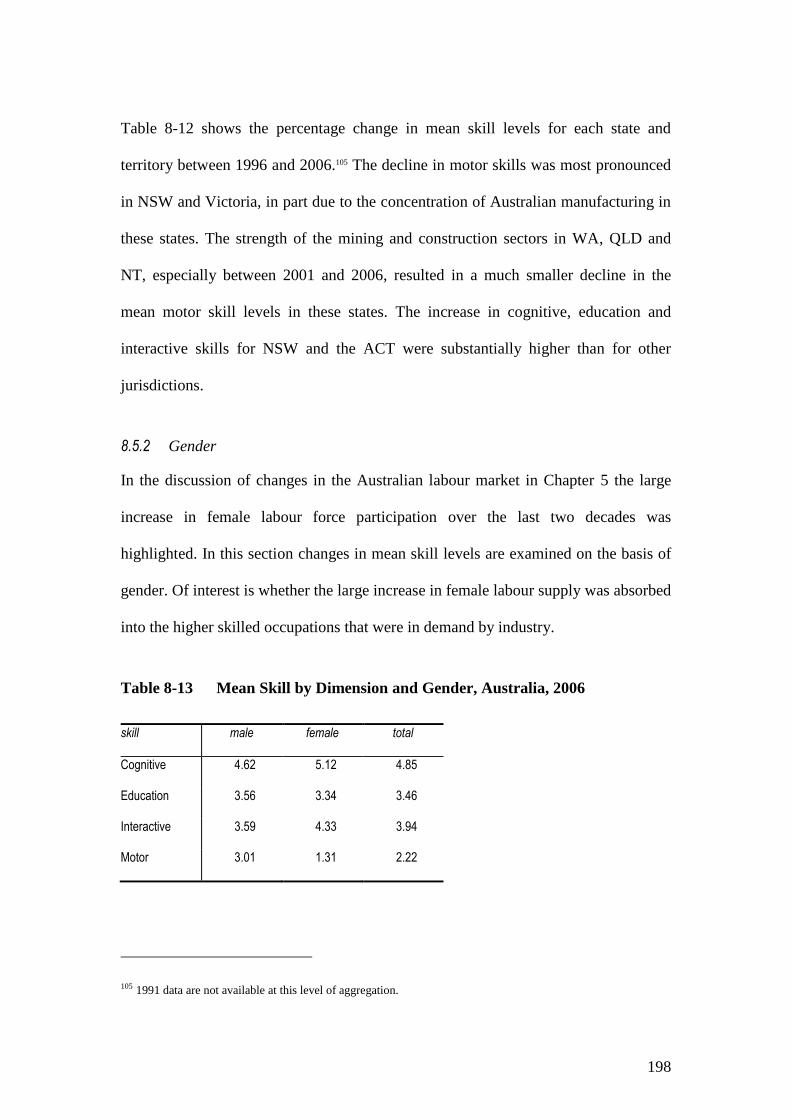
198
Table 8-12 shows the percentage change in mean skill levels for each state and
territory between 1996 and 2006.105 The decline in motor skills was most pronounced
in NSW and Victoria, in part due to the concentration of Australian manufacturing in
these states. The strength of the mining and construction sectors in WA, QLD and
NT, especially between 2001 and 2006, resulted in a much smaller decline in the
mean motor skill levels in these states. The increase in cognitive, education and
interactive skills for NSW and the ACT were substantially higher than for other
jurisdictions.
8.5.2 Gender
In the discussion of changes in the Australian labour market in Chapter 5 the large
increase in female labour force participation over the last two decades was
highlighted. In this section changes in mean skill levels are examined on the basis of
gender. Of interest is whether the large increase in female labour supply was absorbed
into the higher skilled occupations that were in demand by industry.
Table 8-13 Mean Skill by Dimension and Gender, Australia, 2006
skill male female total
Cognitive 4.62 5.12 4.85
Education 3.56 3.34 3.46
Interactive 3.59 4.33 3.94
Motor 3.01 1.31 2.22
105 1991 data are not available at this level of aggregation.
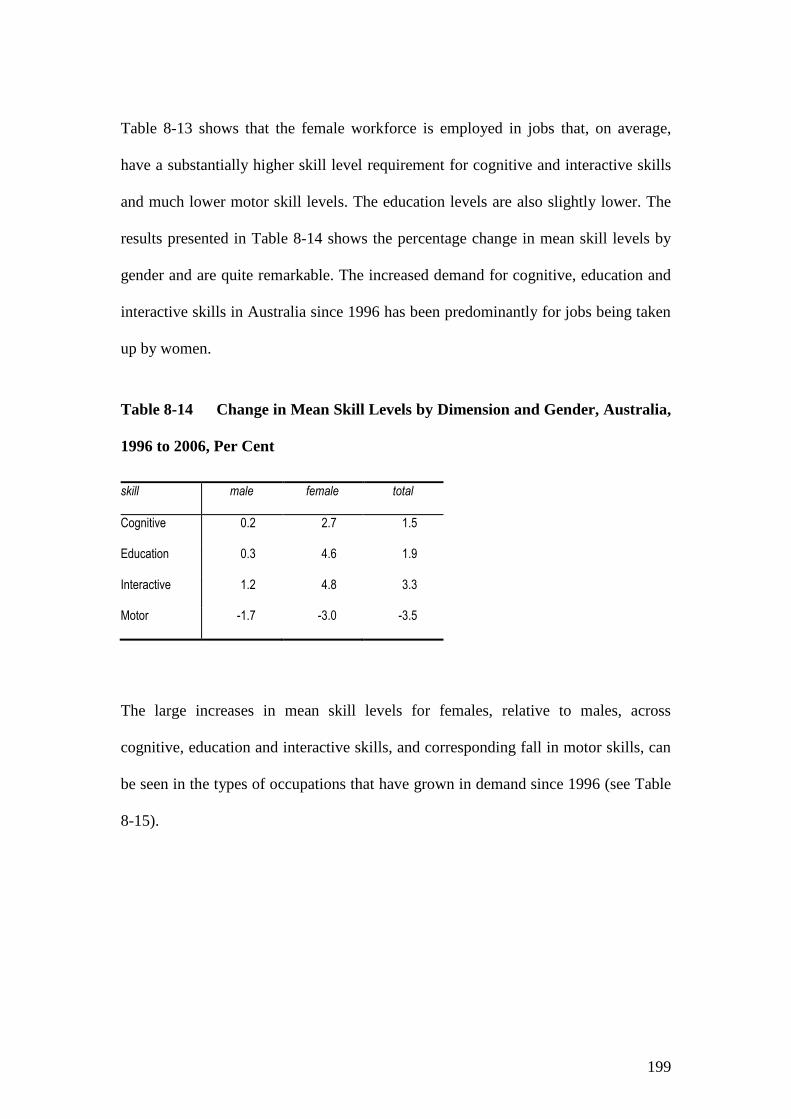
199
Table 8-13 shows that the female workforce is employed in jobs that, on average,
have a substantially higher skill level requirement for cognitive and interactive skills
and much lower motor skill levels. The education levels are also slightly lower. The
results presented in Table 8-14 shows the percentage change in mean skill levels by
gender and are quite remarkable. The increased demand for cognitive, education and
interactive skills in Australia since 1996 has been predominantly for jobs being taken
up by women.
Table 8-14 Change in Mean Skill Levels by Dimension and Gender, Australia,
1996 to 2006, Per Cent
skill male female total
Cognitive 0.2 2.7 1.5
Education 0.3 4.6 1.9
Interactive 1.2 4.8 3.3
Motor -1.7 -3.0 -3.5
The large increases in mean skill levels for females, relative to males, across
cognitive, education and interactive skills, and corresponding fall in motor skills, can
be seen in the types of occupations that have grown in demand since 1996 (see Table
8-15).
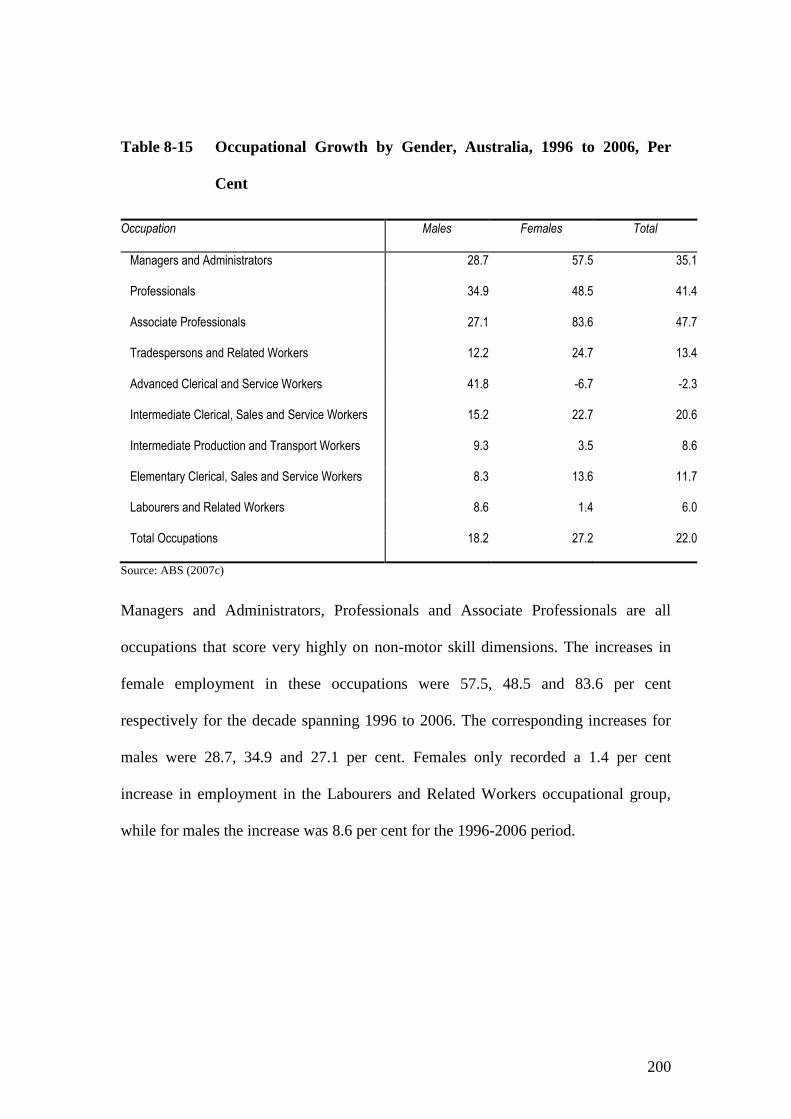
200
Table 8-15 Occupational Growth by Gender, Australia, 1996 to 2006, Per
Cent
Occupation Males Females Total
Managers and Administrators 28.7 57.5 35.1
Professionals 34.9 48.5 41.4
Associate Professionals 27.1 83.6 47.7
Tradespersons and Related Workers 12.2 24.7 13.4
Advanced Clerical and Service Workers 41.8 -6.7 -2.3
Intermediate Clerical, Sales and Service Workers 15.2 22.7 20.6
Intermediate Production and Transport Workers 9.3 3.5 8.6
Elementary Clerical, Sales and Service Workers 8.3 13.6 11.7
Labourers and Related Workers 8.6 1.4 6.0
Total Occupations 18.2 27.2 22.0
Source: ABS (2007c)
Managers and Administrators, Professionals and Associate Professionals are all
occupations that score very highly on non-motor skill dimensions. The increases in
female employment in these occupations were 57.5, 48.5 and 83.6 per cent
respectively for the decade spanning 1996 to 2006. The corresponding increases for
males were 28.7, 34.9 and 27.1 per cent. Females only recorded a 1.4 per cent
increase in employment in the Labourers and Related Workers occupational group,
while for males the increase was 8.6 per cent for the 1996-2006 period.
201
8.6 Summary of findings
8.6.1 Summary of industry changes
There have been very important changes in skill mix in the Australian economy.
While the post-recession period of 1991-1996 was characterised by skill changes
resulting from changes to the industry structure, in the 1996-2001 period
technological change was the dominant influence on skill change. Technological
change continues to be a key influence on the pattern of skill demand but recent
Australian experience was clearly also influenced by patterns of trade and industry
structure.
The extent of change in mean skill levels for all skill dimensions during the 2001-
2006 period was relatively small, contributing just 12.3 per cent to cognitive skills
and 5.1 per cent of the total decline in motor skills between 1991 and 2006. The
contribution of the 2001-2006 period to overall change between 1991 and 2006 for
education and interactive skills was 30.1 and 22.3 per cent respectively. However,
these figures mask the variability observed among the experience for specific
industries. A handful of industries experienced quite large change in the skill levels
over the 2001-2006 period, such as the Retail industry, which reduced it s share of
total employment and had a deskilling of its workforce structure. Manufacturing, on
the other hand, increased the mean skill level of its workforce, but reduced its share
of total employment in the economy.
In terms of the regional distribution of skills, NSW experienced the largest increase in
skill change, followed by Victoria and the ACT. The average skill levels of the
202
industries in which these states dominate are quite high across cognitive, education
and interactive skills. This is also reflected in the increase in the mean skill levels of
these states.
One of the most interesting feature of the data presented in this chapter are the results
for gender. The period analysed was restricted to 1996-2006 due to data availability.
Nonetheless, the key results that emerge are likely to hold for earlier periods given
the employment growth and occupational structure observed in Chapter 5 for females.
For interactive skills, the mean skill level for males increased by only 0.3 per cent,
while for females the increase was 4.8 per cent. This pattern was similar for the other
skill dimensions, with the exception of motor skills. Motor skills actually declined for
females and males, the decrease being much larger for females. The area of interest in
these results is the alignment between increased female participation in the labour
force with the higher skilled job openings. Equally important has been the ability of
females to align educational attainment with the higher-skilled employment
opportunities since 1991.
The key findings from this Chapter can be summarised as follows:
The ABS occupational skill structure is one dimensional and as a result does
not provide an appropriate ranking when the interest is for different skill
dimensions, such as motor skills.
The changes observed in mean skill levels for the period 1991 to 2006
occurred mostly between 1991 and 2001.
The 1991-1996 period was characterised by a combination of both within-
203
industry and between-industry effects, with uneven growth among industries
as they emerged from recession the likely cause of between-industry effects.
Change in mean skill levels for the 1996-2001 period was predominantly a
result of within-industry changes, with the cause most likely to be
technological change.
Increases in mean skill levels across all periods were offset by increases in
part-time employment, which tends to be lower skilled in composition than
full-time employment.
Average motor skills fell consistently across all time periods.
Interactive skills recorded the largest increases, consistent with the long
running structural change in the economy, towards a service economy and
away from agriculture and industrial sectors, such as manufacturing and also
due to the technological changes driving within-industry demand for these
skills.
The proximity to full-employment in the 2001-2006 period resulted in an
increase in full-time employment shares, this made a small positive
contribution to skill change for all skills.
For the 1996 to 2006 period, NSW, Victoria and the ACT recorded the largest
increases in mean skill levels for cognitive, education and interactive skills.
The increased demand for skill cognitive, education and interactive skills
between 1996 and 2006 was largely accounted for by female labour supply.
204
9 DETERMINANTS OF SKILL CHANGE IN
AUSTRALIA
In this chapter the relationship between ICT related technological change and changes
in mean skill levels of industry is tested. Due to data limitations, in particular the
level of disaggregation, the sample is restricted to 1991 to 2001.106 However, this does
not provide too big a constraint on the analysis provided in this chapter, as most of
the changes in mean skill levels for all skill dimensions occurred over the 1991-2001
period. For instance, as shown in Table 8-7 in Chapter 8, 87.7 per cent of the change
in mean cognitive skills between 1991 and 2006 occurred before 2001, for motor
skills 94.9 per cent of the change occurred in the 1991-2001 period.
9.1 Model of Skill Change
The relationship between ICT and the skill composition of the workforce is tested
empirically by estimating regression models of both the change in the mean skill level
of the full-time workforce and the change in the mean skill level of the part-time
workforce over the period 1991 to 2001 for cognitive, education, interactive and
motor skills. Industry-level data are used and cover a total of 40 Australian and New
Zealand Standard Industrial Classification (ANZSIC) industry sub-division levels
(i.e. 2 digit level). The selection of industries is based on the availability of data
across all variables used in the regressions. The list of industries is provided at
Appendix C in Table C- 5.
106 The Australian Bureau of Statistics (ABS) Business Operations and Industry Performance, Catalogue No.
8140.0, 2000–01 is not available after 2002-03.

205
The model of industry demand for skills estimated is:
Where:
Si is the percentage change in the mean skill level of industry i between 1991
and 2001
j is a vector of estimated parameters for the j variables
is a constant
X is a matrix of variables j for industry i
is the error term.
9.2 Variables
9.2.1 Dependent variables
The dependent variables used in the following analysis are measures of the
percentage change in mean skill level between 1991 and 2001, for the full-time and
part-time workforces respectively. These are tested separately for each skill
dimension: in total, eight separate models are estimated.
Each model is tested with the same set of independent variables. Descriptive statistics
are provided at Appendix C in Table C- 1.
iijjiS
206
9.2.2 Independent variables
IT/E: This variable measures the net ICT capital stock as of June 2001 per employed
person in an industry. The data is sourced from Table 98 of the National Accounts
(ABS 2004). Autor, Levy and Murnane (2003) and Spitz (2003) argue that ICT are
most suited to substituting for routine cognitive skills. The sign of this variable will
be influenced by the extent to which it complements with high cognitive skill
employment (normally associated with non-routine, idiosyncratic / analytic tasks) and
substitutes for routine tasks, and the relative weight of these skills in industry. It is
expected to complement interactive skills and also be positively correlated with the
cognitive and education skill dimension. There is no a priori expectation of the
relationship with motor skills.
IT/K: This variable measures the ratio of the net ICT capital stock to the net total
capital stock. The data have been sourced from Tables 86 and 98 of the National
Accounts (ABS 2004). Higher IT/K ratios would, like ICT per employee, be
associated with higher replacement of routine cognitive skills. Whether on balance
the substitution effect outweighs the expected positive relationship with higher order
cognitive skills is an empirical issue to be tested. The expected relationship with
interactive skills is less clear cut. Inclusion of both measures (i.e. IT/E and IT/K)
controls for the possibility that ICT can make up a relatively large share of capital,
but not necessarily be related closely to the level of ICT per employee. For example,
the communication services have a high IT/K ratio, but with a large number of
employees does not necessarily have a large IT/E ratio. The reverse is the case for the
oil and gas extraction industry.
207
ITPROF: This is the proportion of people that work specifically in IT related
occupations. The data have been obtained from the 2001 industry by occupation
employment matrices (Census of Population and Housing; occupations based on
ASCO 2nd
Edition 6-digit level) and are the same as used in Kelly and Lewis (2003).
The list of IT related occupations included in this variable are provided at Appendix
C in Table C- 6. Implementation of new technologies requires a workforce that can
assimilate the new technology and accommodate change. IT specialists facilitate the
absorption of new information technologies by other skilled staff. The expectation is
that this variable will be positively related to mean industry skill change for all skill
dimensions, with the exception of motor skills.
K/Y: This variable is the capital-output ratio for each industry. The data are from
ABS (2002c). The data for capital are based on industry total assets and output data is
gross value added. Wolff (1995) suggests that the inclusion of this variable controls
for continuing use of old technologies and production techniques that rely on large
scale operations with high shares of semi-skilled workers with specialised mechanical
skills.
UNION: This variable is the percentage of a given industry workforce that are union
members (i.e. ‘union density’). The data has been sourced from the ABS (2002d) and
are measured at the ANZSIC 2-digit level. Wolff (1995) argued that a strong union
presence retards the substitution of managerial and administrative workers for
operative workers. It is not clear what the strength of this substitution would be for
non-motor skills. It may also depend on the degree of unionisation among those
occupations with high scores in these skill dimensions (i.e. cognitive, education and
208
interactive). This suggests the expected sign of the variable is negative.
SERV: A dummy variable has been included for service industries to allow for
sectoral differences. In particular, the service industries are more likely to be
dominated by the types of substitutions between routine cognitive skills and ICT
discussed throughout this paper. The list of service sector industries have been
sourced from Lewis et al. (2006) and are provided at Appendix C in Table C- 5.
PT/T: This variable is the percentage of total hours of employment worked by part-
time employees within an industry. The shift-share analyses of Chapter 8 show that
mean industry skill scores fell due to increasing shares of part-time workers within
industries. It is expected that the estimated parameter will be negatively signed for the
part-time skill change models. For the model of full-time skill change there is no a
priori expectation as to the sign and significance of this variable.
SWK0196 and SWK9691: As shown in Figure 4-2, the net information technology
capital stock is reported as the sum of three components: computers and peripherals;
computer software; and electrical and electronic equipment. The items of interest
relate to computers, peripherals and software, and it is these components that have
been used to construct the variable used in the regressions. The data have been
sourced from the National Accounts (ABS 2008b). The measure is the sum of these
two components of the net IT stock (measured in constant prices 2000-2001 = 100),
with the ratio taken for 2001 to 1996 to capture industry differences in uptake over
the period. The same approach is taken for the earlier sub-period (i.e. 1991-96)
captured in the shift-share analyse. The inclusion of these two variables is to explore
209
the contrasting results from the shift-share analyses presented in Chapter 8 for the
pre- and post-1996 periods.
The independent variables are measured in levels as of 2000-2001, with the exception
of the computers, software and peripherals change variable which measures the
change for the sub-periods 1991-1996 and 1996-2001 (details provided below). Due
to data not being available for 1991 it has not been possible to use changes for all of
the independent variables. However, much of the deepening and broadening of IT
developments have occurred since the late 1980s and early 1990s, accelerating in the
mid-1990s with the introduction of the Internet. As such, levels and densities of
independent variables for 2001 are a reasonable proxy for the accumulation occurring
over the timeframe being analysed.
9.3 Results
As noted previously, eight models are estimated; one for change in the mean skills of
the part-time workforce and the other for the full-time equivalent for each skill
dimension. Due to the small sample available, the models are estimated using robust
ordinary least squares regression. In particular, the heteroscedasticity-consistent
covariance matrix, referred to by Mackinnon and White (1985) as ‘HC3’, was used to
provide robust estimates of the errors. Long and Ervin (2000) provide evidence
showing that for samples where N<250 the HC3 is appropriate and in very small
samples should be used routinely.
As could be expected from a cross section of this nature it was found that there were a
small number of extreme outliers affecting all models. The approach taken to correct
210
for this was to estimate the models using bounded influence estimates (BIE).107
It has been argued by Welsch (1980) (cited in Maddala 1992) that DFFITS is the best
method for detecting the influence of outliers. DFFITS provides a standardised
measure of the difference in the fitted value of the dependent variable, ‘y’, when the
observation is deleted. Outliers have not been removed from the estimation, rather,
their influence has been moderated. The following one-step bounded influence
estimator illustrated in Maddala (1992) has been adopted for the estimates shown in
Table 9-1 below:
2iii xywMin
Where is the coefficient to be estimated and the weights, wi , are provided by the
DFFITS residuals according to the following scheme:
if 34.0iDFFITS then 1iw
or
if 34.0iDFFITS then i
iDFFITS
w34.0
The weights, wi, are shown in Appendix C in Table C- 5.
Given the UNION and IT/E variables had very little explanatory power in initial
107 Note that the BIE is used to estimate all models. Estimates are generated using both standard t-tests under the
BIE model, as well as HC3.
211
estimates and their coefficients had extremely low t scores, these were dropped from
the final specification.
In the final specification for both the part-time and full-time skill change models the
highest condition index number 108 recorded for any of the models was less than 15,
suggesting that multi-collinearity was not a significant issue. The models for
cognitive, education and interactive skill change passed diagnostic tests for normality,
functional form and heteroscedasticity at usual levels of significance (i.e. = 0.05).
Results for all diagnostic tests, variable means and correlations are provided at
Appendix C in Table C- 2 to Table C- 4.
The results reported in Table 9-1 show both the standard p-values for the t-test of
parameter significance generated by the BIE estimates and those generated under the
robust ordinary least squares regression model (i.e. HC3 error estimation).
The standard errors for the ICT change variables for both sub-periods (i.e. SWK0196
and SWK9691) suggest their influence on skill change was not significantly different
from zero under the HC3 estimates for the full-time cognitive skill change model.
Finally, the F-test conducted for the null hypothesis that estimated parameters are
jointly equal to zero was rejected for all models excepting motor skills (full-time and
part-time, p-values of 0.200 and 0.299 respectively).
108 The condition indices are computed as the square roots of the ratios of the largest eigen-value to each
successive eigen-value.
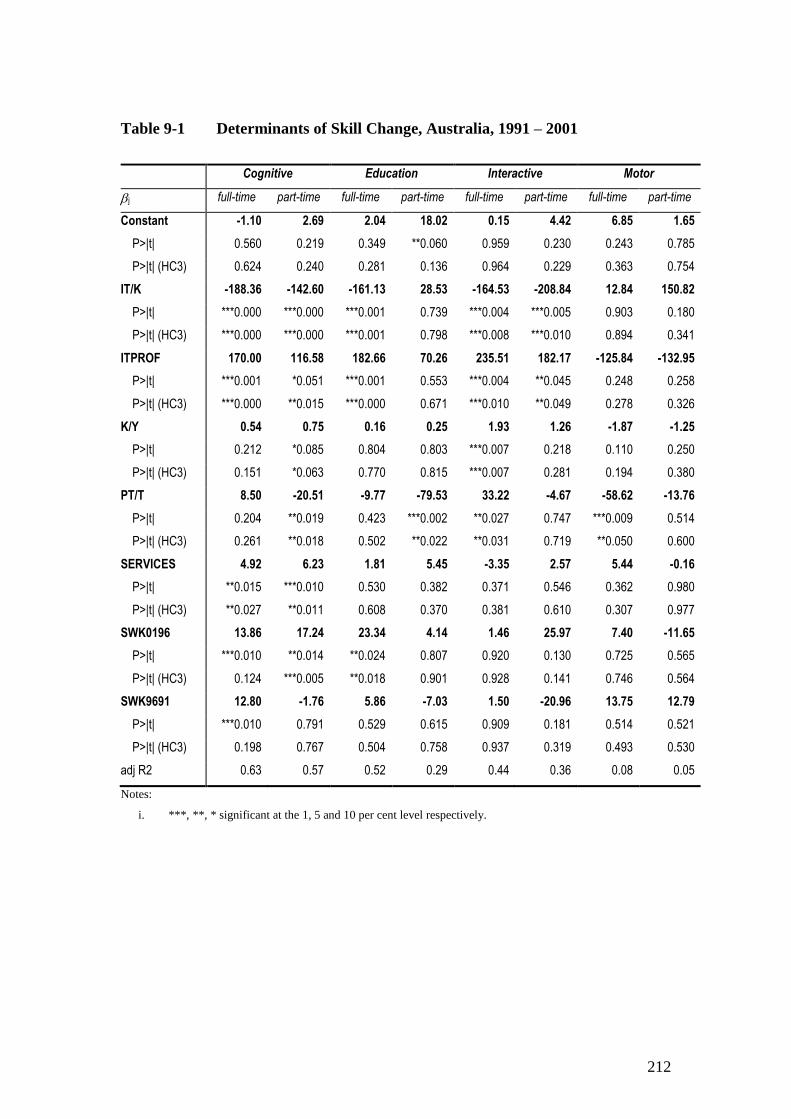
212
Table 9-1 Determinants of Skill Change, Australia, 1991 – 2001
Cognitive Education Interactive Motor
j full-time part-time full-time part-time full-time part-time full-time part-time
Constant -1.10 2.69 2.04 18.02 0.15 4.42 6.85 1.65
P>|t| 0.560 0.219 0.349 **0.060 0.959 0.230 0.243 0.785
P>|t| (HC3) 0.624 0.240 0.281 0.136 0.964 0.229 0.363 0.754
IT/K -188.36 -142.60 -161.13 28.53 -164.53 -208.84 12.84 150.82
P>|t| ***0.000 ***0.000 ***0.001 0.739 ***0.004 ***0.005 0.903 0.180
P>|t| (HC3) ***0.000 ***0.000 ***0.001 0.798 ***0.008 ***0.010 0.894 0.341
ITPROF 170.00 116.58 182.66 70.26 235.51 182.17 -125.84 -132.95
P>|t| ***0.001 *0.051 ***0.001 0.553 ***0.004 **0.045 0.248 0.258
P>|t| (HC3) ***0.000 **0.015 ***0.000 0.671 ***0.010 **0.049 0.278 0.326
K/Y 0.54 0.75 0.16 0.25 1.93 1.26 -1.87 -1.25
P>|t| 0.212 *0.085 0.804 0.803 ***0.007 0.218 0.110 0.250
P>|t| (HC3) 0.151 *0.063 0.770 0.815 ***0.007 0.281 0.194 0.380
PT/T 8.50 -20.51 -9.77 -79.53 33.22 -4.67 -58.62 -13.76
P>|t| 0.204 **0.019 0.423 ***0.002 **0.027 0.747 ***0.009 0.514
P>|t| (HC3) 0.261 **0.018 0.502 **0.022 **0.031 0.719 **0.050 0.600
SERVICES 4.92 6.23 1.81 5.45 -3.35 2.57 5.44 -0.16
P>|t| **0.015 ***0.010 0.530 0.382 0.371 0.546 0.362 0.980
P>|t| (HC3) **0.027 **0.011 0.608 0.370 0.381 0.610 0.307 0.977
SWK0196 13.86 17.24 23.34 4.14 1.46 25.97 7.40 -11.65
P>|t| ***0.010 **0.014 **0.024 0.807 0.920 0.130 0.725 0.565
P>|t| (HC3) 0.124 ***0.005 **0.018 0.901 0.928 0.141 0.746 0.564
SWK9691 12.80 -1.76 5.86 -7.03 1.50 -20.96 13.75 12.79
P>|t| ***0.010 0.791 0.529 0.615 0.909 0.181 0.514 0.521
P>|t| (HC3) 0.198 0.767 0.504 0.758 0.937 0.319 0.493 0.530
adj R2 0.63 0.57 0.52 0.29 0.44 0.36 0.08 0.05
Notes:
i. ***, **, * significant at the 1, 5 and 10 per cent level respectively.
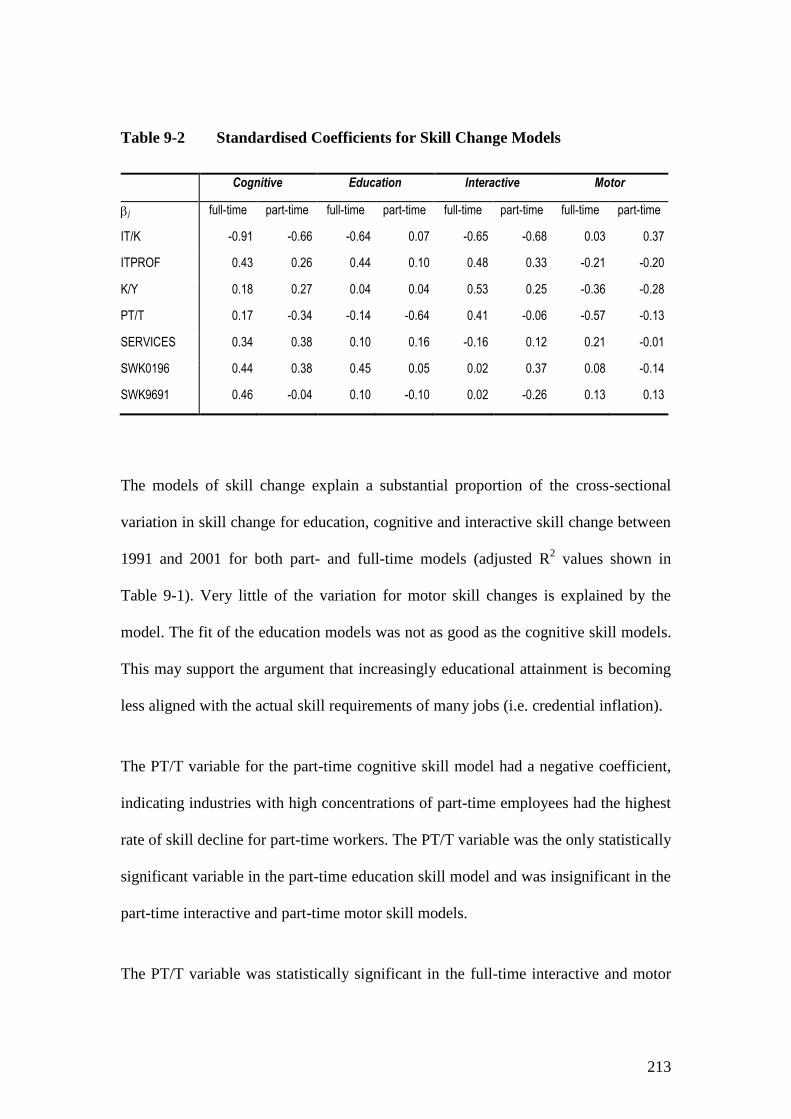
213
Table 9-2 Standardised Coefficients for Skill Change Models
Cognitive Education Interactive Motor
j full-time part-time full-time part-time full-time part-time full-time part-time
IT/K -0.91 -0.66 -0.64 0.07 -0.65 -0.68 0.03 0.37
ITPROF 0.43 0.26 0.44 0.10 0.48 0.33 -0.21 -0.20
K/Y 0.18 0.27 0.04 0.04 0.53 0.25 -0.36 -0.28
PT/T 0.17 -0.34 -0.14 -0.64 0.41 -0.06 -0.57 -0.13
SERVICES 0.34 0.38 0.10 0.16 -0.16 0.12 0.21 -0.01
SWK0196 0.44 0.38 0.45 0.05 0.02 0.37 0.08 -0.14
SWK9691 0.46 -0.04 0.10 -0.10 0.02 -0.26 0.13 0.13
The models of skill change explain a substantial proportion of the cross-sectional
variation in skill change for education, cognitive and interactive skill change between
1991 and 2001 for both part- and full-time models (adjusted R2 values shown in
Table 9-1). Very little of the variation for motor skill changes is explained by the
model. The fit of the education models was not as good as the cognitive skill models.
This may support the argument that increasingly educational attainment is becoming
less aligned with the actual skill requirements of many jobs (i.e. credential inflation).
The PT/T variable for the part-time cognitive skill model had a negative coefficient,
indicating industries with high concentrations of part-time employees had the highest
rate of skill decline for part-time workers. The PT/T variable was the only statistically
significant variable in the part-time education skill model and was insignificant in the
part-time interactive and part-time motor skill models.
The PT/T variable was statistically significant in the full-time interactive and motor
214
skill models, being positively related to skill change in the former and negatively
related in the latter. The positive coefficient for the full-time cognitive (although not
statistically significant) and interactive models suggests for those industries where the
full-time workforce is numerically less important (i.e. high values of the PT/T
variable) the full-time workforce became more skilled. Clearly there are very
different processes at work in the part-time and full-time workforce that are affecting
the skill structure of employment over time. The PT/T variable had a highly
significant and positive coefficient in the full-time interactive skill change model. The
standardised coefficient also suggests it had a relatively larger influence on
interactive skill change than for cognitive skill change (see Table 9-2).
The percentage of the workforce working in IT specific jobs (ITPROF) had a
sizeable, positive and statistically significant influence on the percentage change in
mean skill levels for the full-time and part-time cognitive and interactive models. The
variable was only statistically significant in the full-time variant of the education
skills model. The size of the parameter was considerably smaller for the part-time
workforce and the standardised coefficients suggest the influence was also much
smaller.
The proportion of the capital stock made up by ICT (IT/K) was negatively signed,
statistically significant and had the largest influence on skill change for all models
with the exception of the full-time motor skill model and the part-time education skill
model (see Table 9-2). The capital intensity of output (K/Y) had a positive impact on
the part-time cognitive model, but was statistically insignificant in the full-time
model. The variable was also statistically significant in the full-time interactive
215
model.
The high value of the IT/K parameter for the models of skill change for full-time
workers for the cognitive, education and interactive skill dimensions, provides an
important and interesting result for the central hypothesis of this thesis. That is, ICT
have altered the structure of skill demand in the Australian economy. It has been
argued by Autor, Levy and Murnane (2003) and Spitz (2003) that decreasing prices of
computer processing power should induce a substitution away from routine cognitive
skills. The sign and size of the contribution of the IT/K parameter (see standardised
coefficients in Table 9-2) in the current study supports this proposition – ICT capital
intensity for a given industry is negatively correlated with the percentage change in
mean cognitive skills. However, skill complementarity between ICT and jobs
requiring high levels of cognitive skills might also be expected. In principle, observed
skill decreases would be dominated by clerical workers and other labour associated
with routine cognitive competencies; and higher-skilled occupations would have
experienced positive skill changes due to the prevalence of non-routine higher order
cognitive competencies. This pattern was also revealed by the data presented in Table
8-4 in the previous chapter showing changes to occupational skill shares.
Variables capturing the change in use of computers, computer peripherals and
software (SWK9691 and SWK0196) over the two sub-periods 1991-1996 and 1996-
2001 provided a result consistent with the findings from the shift-share analysis for
part-time cognitive skills. The shift-share analysis presented in Chapter 8 showed that
a substantial proportion of the change in skill scores between 1991 and 1996 was a
result of between-industry effects. Between-industry changes are generally attributed
216
to changes in product demands, trade and other structural change. The skill change
recorded in the 1996 to 2001 period was almost entirely due to within-industry
effects, accounting for 86 per cent of the increase. Within-industry changes are
generally attributed to SBTC.
In the cognitive skill change model for part-time workers, the SWK0196 variable was
positive and statistically significant, while the coefficient for the SWK9691 variable
was statistically insignificant.
Of interest is that that the ICT change variables (i.e. SWK0196 and SWK9691) did
not have much of an effect on interactive skills, particularly in the full-time model.
The distinction between the cognitive and interactive results is consistent with the
proposition put by Autor, Levy and Murnane (2003) that what computer capital does
is carry out (i.e. substitutes for) manual and cognitive tasks that ‘can be accomplished
by following explicit rules’ (i.e. routine tasks) and ‘complements workers in carrying
out problem-solving and complex tasks’ (non-routine tasks) (Autor, Levy and
Murnane 2003: p. 1280). The basic concept of interactive skills is that they are not
easily automated, if at all.
9.4 Summary
Between 1991 and 2006 there were significant changes in the skill structure of the
Australian economy. For example, the mean cognitive skill level of the full-time
workforce increased by 4.5 per cent, 11.6 per cent for interactive skills and 7.4 per
cent for education. Motor skills declined by 8.6 per cent for full-time and 9.4 per cent
overall. However, as shown in the shift-share analyses the vast majority of this
217
occurred in between 1991 and 2001.
Most of the impact on skill demand from the changing industry structure of the
economy occurred prior to 1996. There was very little contribution to mean skill
changes from between-industry effects after 1996, with only 14 per cent of the
observed change in cognitive skills occurring after this time. The latter half of the
decade was characterised by the changing structure of occupations within industries.
There was further intensification of high-skilled occupations among the full-time
workforce. At the same time there was a significant decline in the employment share
of clerical occupations, which generally are characterised by routine cognitive
competencies. It is in this period that industry ramped up ICT investment, both in
aggregate and as a share of total capital expenditure. This suggests that ICT are likely
to have played a part in the observed changes in mean skill levels, something borne
out by the regression results presented in this paper.
One of the objectives of this study was to examine the impact of ICT on changing
skill use. The negative sign of the IT/K parameters in the non-motor skill regression
models and size of the contribution to overall skill change in the regression results,
evidenced by the values of the standardised coefficients, suggests a strong
substitution effect. How this works in practice, as argued by Autor, Levy and
Murnane (2003), is through the substitution of routine cognitive skills. It is further
corroborated by examination of aggregate skill change by occupational groupings for
both part-time and full-time employment. The effects were strongest for full-time
employment and this is also where we see a clear delineation in the occupations that
are affected, with clerical occupations being responsible for a substantial share of the
218
decline in aggregate skill. This was also the case for part-time workers, but to a lesser
extent.
How long the ICT investment boom has left to run, and whether the substitution
possibilities can be further exploited is unknown, but recent experience suggests that
specific occupations – those characterised by performing routine cognitive tasks –
could be at further risk in the years ahead, with obvious implications for policy.
Career guidance and allocation of training places should be cognisant of the potential
downside for employment in these occupations. The nature of professional
development and training for the existing workforce should also take these trends into
account. Finally, there is a disproportionately large share of women in the types of
jobs most at risk from the developments described above, which may have
implications for the structure of wages and gender balance in the workforce.
219
10 CONCLUSION
This thesis has attempted to fill the gap in the knowledge and understanding of the
issues surrounding skill definition, skill change and its determinants for the
Australian economy. The period examined covered 1991 to 2006 and provided
detailed analysis of skill change and the contribution of the massive growth in ICT
that has taken place and other structural changes in the Australian economy.
The research undertaken for this thesis also examined a number of factors that have
contributed to structural changes in the Australian economy over the last three
decades. Issues such as microeconomic reform and the changing Australian labour
market, growth in ICT investment by businesses, household Internet access and the
increasing share of eCommerce in the economy were examined.
A survey of employers was undertaken in 2001 as part of this thesis in order to
develop an understanding of employer expectations of the impact eCommerce would
have on skills and training. All organisations surveyed indicated that the skill
composition of their workforce had changed up to the time of survey and that their
expectation was that it would continue to change as they increased their utilisation of
ICT and eCommerce.
The primary objective of this thesis was to examine the effect that information and
communication technologies have had on skill demand. The analysis drew upon the
changes observed in occupational and industry structures since 1991, including the
distribution by locality and gender. A review of the way skills are defined and
220
measured, and the method of skill measurement adopted for this thesis, was provided
in Chapter 7.
Chapter 8 presented the results of the shift-share analysis of skill changes covering
three discreet 5-year periods, from 1991 to 2006, corresponding to different stages of
the business cycle. The results supported the central hypothesis of this thesis. That is,
that there had been changes to the composition of skills in the economy and that these
changes were substantially, but not solely, a result of technological change.
Regression analyses were undertaken for the various skill dimensions – cognitive,
education, interactive and motor – and provided further support to a vast body of
international literature that ICT have been a critical driver of skill change.
The following sections outline the major findings of the thesis.
10.1 Main findings
10.1.1 Diffusion of ICT
It was hypothesised in this thesis that technological change, and especially ICT, was
biased towards higher-skilled workers and substituted for low-skilled workers. This
brings into question whether there have been changes of a technological nature that
are large enough in magnitude to have a measurable effect on skill changes. Chapter
2, 3 and 4 examined this issue in some detail. The evidence presented provides
unequivocal support for the common perception that there has been an ICT
revolution. Households and individuals purchased computers and connected to the
Internet at unparalleled rates. For the US, radio took 38 years, television 13 years and
cable television 10 years; the Internet only took 5 years. It would appear that

221
Australia has followed a similar trajectory. By 2009 over 60 per cent of the
population had connection to the Internet (compared to 74 per cent in the US).
Nonetheless, access for low income households remains a concern.
The investment by households was matched by a massive investment by firms and
government over the last 20 years in ICT. With the rise of the Internet there was also
a corresponding push to get information, services and products on-line. The market
reaction appears to have been positive, with the latest data showing 6.9 million
consumers in Australia purchased goods or services on-line. The estimated value of
on-line sales for Australia in 2008 was $81 billion, up from $9.4 billion in 2001. In
1997 the value of on-line sales was just $61 million.
Clearly, the early predictions that the Internet would become an economic force and
change the way producers and consumers interact with each other to transact business
proved to be correct. These developments represent a significant and substantial
structural change to the Australian economy. However, not everyone directly
benefited from these developments. The key finding in relation to Internet access
provided in this thesis was that income, location, age and education all significantly
affected Internet adoption. Poorer neighbourhoods and certain regions also had
significantly lower connection rates. Moving forward to 2007/8 and the evidence
showed that the majority of low income households, those with an equivalised
income of less than $40 000, still did not have access to the Internet.
Consumer uptake of ICT, business and government investment, and growth in
eCommerce has been very rapid and on a massive scale. There is little doubt from the
222
evidence provided that the presence, consumption and utilisation of ICT in the
Australian economy has contributed to changes in skill demand since 1991.
10.1.2 The Australian labour market
Chapter 5 examined the changing structure of the Australian labour market, including
the nature and impact of microeconomic reforms implemented in the 1980s and
1990s. It was shown that both industry and occupational structures changed
dramatically, as did institutional features, such as the modification of centralised
wage bargaining, decline in union membership and a reduction in public ownership of
some large corporations such as Telstra and the Commonwealth Bank of Australia.
Between 1991 and 2006, total employment in the Australian economy grew by 2 per
cent per year, with 1.8 million net jobs added in total. Of these, two out of every three
jobs created were in the top end of the white-collar skill distribution. Of the nine
major occupational groups, only the Advanced Clerical and Service Workers
occupational group employment levels declined. Employment levels for Elementary
Clerical, Sales and Service Workers grew at a rate well below the average for all
occupations and unskilled labour (i.e. Labourers and Related Workers) also recorded
only a third of the growth rate for total employment. There was also substantial
variation between growth rates for all other occupational groups.
There was also substantial variation between industries’ employment growth over the
1991 to 2006 period. The Electricity, Gas & Water industry experienced substantial
re-structuring and labour shedding throughout the 1990s as a result of the partial de-
regulation and privatisation of the sector. Manufacturing, Agriculture Forestry and
223
Fishing, and Wholesale Trade also experienced steady decline over the same period.
These industries have different occupational profiles and, as a result, the changing
industry structures also flowed through to occupational composition of the economy
overall.
Microeconomic reform undertaken in Australia during the 1980s and into the 1990s
affected both labour and multifactor productivity. There was a around a one
percentage point increase in labour productivity growth rate between 1993 and 2000.
Of the one percentage point increase in the productivity growth rate, it is estimated
that a third was due to ICT, the remainder due to policy reforms.
10.1.3 Previous research into Australian skill change
There have been three substantial contributions to the skill change literature in
Australia since 1990. All three studies provided evidence of skill change biased
towards higher-skilled occupations and education levels, although only one study
formally tested the role of technology, and in particular some form of ICT. The study
was based on a very small sample which also covered a period that predated the sharp
increase in ICT investment in the 1996-2001 period and also the rapid diffusion of the
Internet.
10.1.4 Skill definition and measurement
The key innovation in the approach adopted for this thesis is that it has applied a
conceptually different approach to that using educational attainment or white and blue
collar definitions to measure skill. In particular it was shown that the standard blue
collar – white collar skill distinction, and the university educated – non-university
224
educated dichotomy had significant limitations. Moreover, the Australian Bureau of
Statistics skill continuum was also shown to be deficient due to its one-dimensional
nature. The alternative proposed in this thesis, based on the US Dictionary of Titles,
provided skill scores for a number skill dimensions. The skill dimensions measured
were cognitive, interactive and motor skills, with a fourth measure added for
education. Motor skills are essentially the ability to do physical tasks. Cognitive
skills relate to the possession of, and ability to create, knowledge. Interactive skills
refer to the ability to relate between managers and employees, employees and
employees, and employees and customers.
10.1.5 Shift-share analysis
The shift-share analysis of within and between-industry skill changes provided a
commonly used method for determining whether the changes that have occurred are
due to technological change, with the former (i.e. within-industry) typically
interpreted as evidence of SBTC. The analysis showed the results broken into three
sub-periods to disentangle the cyclical effects of the post-recession period of 1991-
1996 and the boom period of 2001-2006. For the 1991-1996 period and the 2001-
2006 period there were sizable contributions from both within- and between-industry
effects. For example, for cognitive skill change between 2001-2006 within-industry
effects contributed 50 per cent. In the 1991-1996 period within-industry effects
contributed 42 per cent to total cognitive skill change. For the 1996-2001 period the
source of skill change was almost entirely a result of within-industry changes for all
skill dimensions. What can be concluded from the shift-share analyses is that SBTC
was an important factor across all periods, while industry structure was only
significant in the recovery phase after the 1991 recession and at the top of the
225
business cycle.
Finally, while the changing pattern of skill demand has been heavily biased toward
the upper end of the skill distribution, it has also been biased towards cognitive and
interactive skills and away from motor skills. This is a long running trend in Australia
and in other advanced economies. Interactive skills recorded the largest increases,
consistent with the long running structural change in the economy, towards a service
economy and away from agriculture and manufacturing. It has also been due to SBTC
in all industries. It would also appear that the increased demand for part-time
positions has been in low-skill employment, on balance, and that this has lowered the
average skill level across all skill dimensions.
10.1.6 Determinants of skill change
The skill change models presented in Chapter 9 provided robust estimates of the
contribution of ICT capital to changes in the demand for cognitive, education and
interactive skills between 1991 and 2001. The results reinforced the findings from the
shift-share analyses in Chapter 8. Technological change is the most likely cause of
changes in skill demand and ICT provided the biggest contribution to observed
changes. The skill change model used was a good predictor for non-motor skills, but
failed to provide a reliable model of changes in demand for motor skills.
10.2 Implications
10.2.1 Further ICT development – how much left to go?
ICT have lead to a substantial re-ordering of occupations within industries. That is,
they are enabling a re-organisation of the workplace, one that places greater emphasis
226
on higher levels of interactive and cognitive skills and less emphasis on motor skills.
The extent to which these skills are able to be diffused through formal training and
education needs to be explored further.
The outlook for skill demand would be expected to see increasing emphasis on high
skilled employment, with opportunities for firms to exploit labour saving
technologies and renew focus on labour productivity gains from further ICT
investment.
10.2.2 Groups at risk
Traditional ‘blue-collar’ skills would be expected to stagnate or continue to decline
over the long term, given the fall in demand for motor skills. This will test the ability
of the labour market to adjust and absorb the existing supply of these skills. The
inability of many individuals to adjust to the current and expected skill demands of
industry will continue to see a large structural component of unemployment in
Australia. When capital becomes technologically obsolete, the social consequences
will be relatively benign. When the skills of workers become obsolete, the social
consequences are much more serious, with unemployment, financial hardship and
marginalisation the likely outcome.
Examination of occupational changes in the 1996 to 2006 period shows that the
downward trend in employment of advanced and elementary clerical occupations has
continued. This has important implications for the training sector, new labour market
entrants and for women. The occupations most heavily affected are highly segmented
by gender, particularly for the full-time workforce. Among full-time Advanced
227
Clerical and Service workers in 1996, for example, 87 per cent were female, and this
group accounted for over 10 per cent of female full-time employment. Between 1996
and 2006 full-time employment among this group declined at 2.1 per cent per year, on
average. Similarly, female Elementary Clerical, Sales and Service workers made up
9.5 per cent of total female full-time employment in 1996, and employment declined
by 1.1 per cent per year for this group between 1996 and 2006. Over the same period
virtually all other occupations and employment types (part-time and full-time, female
and male) experienced increases in total employment.
The analysis of skill changes in the Australian economy presented in Chapter 8 shows
that there has been a shift in demand towards high-end cognitive, education and
interactive skills since 1991 and that this demand has been largely filled by females.
The educational performance of males in high school and the impact this might be
having on career pathways needs further investigation.
10.2.3 Gender earnings differentials
As discussed in Section 10.2.2 some of the occupations that have been negatively
affected have a very high proportion of female workers. Previous episodes of
technological change have largely resulted in the automation of manual skills.
Traditional blue collar occupations dominated by males have been the most affected.
The brunt of microeconomic reforms of the 1980s and early 1990s that reduced
employment in the Electricity, Gas and Water industry impacted on occupations
traditionally occupied by males. The automation of routine cognitive skills, on the
other hand, is affecting occupations in which females have a relatively large share of
employment. However, as shown in Chapter 8, the female labour supply response to
228
increases in demand for top-end cognitive and interactive skills was exceptionally
successful in the period 1991 to 2006. Over time this should start to see equalisation
in gender earnings differentials, on average. For those workers unable to supply the
higher end of skill demand the prospects are not good and what may emerge is a
polarisation of earnings among women, with many of the middle ranking
occupations, in terms of earnings, diminishing due to continued ICT innovations.
10.3 Policy Response
The main premise of this thesis is that the distribution of skills across the economy
has been affected by structural shifts in the economy, with the most important and
pervasive influence in the last two decades being ICT. This issue is a critical one from
a policy point of view, as human capital is the most important and influential lever
available to affect economic performance and, through the distribution of lifetime
income and wealth, social equity objectives.
The analysis provided in this thesis has provided an understanding of which skills
have been affected and how they are distributed geographically, socially and across
industry. Moreover, the education and training pathways to acquire these skills have
been outlined, providing some insight into where adjustments to training policy will
be required.
10.3.1 Labour market flexibility
One particularly important area of labour market reform that has not been addressed
in Australia is the continued reliance on the minimum wage as one of the main tools
(together with social security payments) in managing welfare and equity for the

229
lowest income households in Australia. There is a substantial literature on this
specific issue, especially in Australia, with the broad consensus being that it is a very
ineffective mechanism for improving household income distribution. This is largely
due to the fact that the majority of low wage earners are in fact living in households
spread right across the income distribution. Moreover, as a policy it leaves the most
disadvantaged – the unemployed, especially the low-skilled long-term unemployed –
locked out of the labour market due to the over-pricing of their skills and
productivity.
The minimum wage issue is an important consideration in relation to structural
change. When jobs are shed as a result of re-structuring in the economy, it will be the
low-skilled minority that are most affected. A constraint on price (wage) movements
required to see these resources re-allocated in the market is not only inefficient, it is
inequitable.
10.3.2 Training market responsiveness
There is universal recognition of the importance of education for an emerging
knowledge-based society. Because of the significance of increasing the human capital
and skills base, education and training will have to be at the centre of this process.
There is a need therefore to assess, evaluate and, if necessary, change the current
education and training system to ensure it is able to cater to the challenges presented
by the emerging knowledge economy.
In Australia, as in most advanced countries, the level of education and training is not
left entirely to the market but is influenced in many ways by government policy, for

230
example, through subsidised education places in TAFE colleges and university,
trainee wages and the Higher Education Contribution Scheme (HECS).
The findings of the research presented in this thesis provide objective evidence for
training providers and policy makers to consider in relation to publicly subsidised
training. There is a role to play in informing prospective students of the long-term
decline in demand for certain types of skill. Moreover, there is a higher risk for some
types of jobs to be either transformed or eliminated through ICT related innovations.
Ultimately it will affect life-time earnings and increase the risk of spells of
unemployment or career disruption. Policies that maximise school retention and the
attainment of at least vocational skills have been recommended by the OECD, along
with ensuring access to training and education for all marginalised groups. There is
also a role for firms in the continuous training of their workforce.
The policy discussion in the US in relation to SBTC has been largely discussed in the
context of very low wages for low-skilled workers and increasing rates of poverty.
Nonetheless, the suggested policy approach to SBTC is to improve the skill base,
although there may be considerable problems with this approach in the short run. For
example, ‘hard skills’ like literacy take time and are unlikely to make inroads inside
one generation. This is because the problems with poor literacy may already be
entrenched among workers and even students by the time they reach high school.
The other major concern is that employers are demanding in many cases ‘soft skills’,
such as work habits, attitudes and responsibility (also the finding for Australia).
These are traits that are developed in childhood in families, communities and schools.

231
Upgrading the soft skills of adults through government programs may be too difficult
and expensive.
10.4 Future Research
10.4.1 Investment in education and returns to skill
This thesis has not sought to determine the economic returns to the various skill
dimensions. However, given the relatively high correlation between cognitive skills,
interactive skills and education, it is of some interest whether wage-skill equations
would shed further light on returns to education. Of particular interest is whether
there are industry, gender and regional differences in returns to skill.
There is US work in this area which examines the effect on wages from various
worker characteristics, such as industry sector, unionisation, industry concentration
ratios, capital, ICT capital and an index of skill. The methodology used also allows
for an indicator of the return to ability to be isolated. This approach could be easily
applied to Australian data using ABS Census unit record files (CURF) for different
time periods. Utilising decomposition methods would enable changes to the skill
premium over time to be analysed.
10.4.2 Gender
The findings from the shift-share analyses provided in Chapter 8 showed that the
majority of observed changes in demand for skills were supplied by females. The link
between female educational performance, vocational pathway and career choice
relative to males over the last twenty years may provide some insights into current
and future gender pay differentials. Moreover, undertaking the research for other

232
advanced economies to determine whether this is an outcome unique to Australia will
help inform the debate on male performance in high school and university entrance
relative to females. There are a number of Australian datasets that may be useful for
this research, such as the ABS Census unit record files (CURF) and the Household,
Income and Labour Dynamics, Australia (HILDA) longitudinal panel dataset.
10.4.3 Jobs and regions at risk
The results in Chapter 8 demonstrated different skill change outcomes by regional
and metropolitan areas and by state and territory. Detailed analysis within and
between regions of occupation and industry profiles in relation to skill measures to
identify areas of risk will inform regional development policy.
10.5 Conclusion
This thesis has contributed to knowledge in the field in a number of ways. It has
consolidated the theoretical contributions to definition and measurement of skill. The
research undertaken for this thesis has also provided an up-to-date analysis of skill
change for Australia covering a period that has witnessed the most dramatic changes
in ICT.
The results presented confirm the role of ICT in changing skill demand in Australia
for cognitive, education and interactive skills and support the substantial body of
international evidence that technological change is skill biased. To ensure appropriate
government policy settings for education, training and other labour market policies, it
is crucial that the drivers of skill change are understood and the importance of skill
change in the Australian economy is recognised.
233
11 REFERENCES
Abowd, J. and Freeman, B. (eds) (1991), Immigration, Trade and the Labor Market, University
of Chicago Press, Chicago
Abrego, L. and Edwards, T. (2002), The relevance of the Stolper-Samuelson theorem to the trade
and wages debate, Centre for the Study of Globalisation and Regionalisation (CSGR)
Working Paper no. 96/02, University of Warwick
Acemoglu, D. (2002), ‘Technical Change, Inequality and the Labor Market’, Journal of
Economic Literature, vol. 40, no. 1, pp. 7-72
Adams, P. and Parmenter, B. (1994), ‘Microeconomic Reform and Employment in the Short
Run’, Economic Record, vol. 70, no. 208, pp. 1-11
Adams, P., Dixon, P. and Parmenter, B. (1991), ‘Productivity Improvements and Foreign Debt
Stabilisation’, in Sources and Effects of Productivity Growth, EPAC Background Paper
no. 8, AGPS, Canberra
Agenor, P. and Aizenman, J. (1996), Wage Dispersion and Technical Progress, NBER
Working Paper no. 5417, National Bureau of Economic Research, Cambridge
Allen, A., Clark, R. and Houde, J. (2008), Market Structure and the Diffusion of E-
Commerce: Evidence from the Retail Banking Industry, Bank of Canada Working
Paper 2008-32
Anderson, A. (2007), ‘All Guts, No Glory: Trading and Diversification among On-line
Investors’, European Financial Management, June 2007, vol. 13, no. 3, pp. 448-71
Appleyard, D. and Field, A. (1992), International Economics, Irwin, US
Archibugi, D. (2001), ‘Pavitt’s Taxonomy Sixteen Years on: A Review Article’, Economics of
Innovation and New Technology, vol. 10, no. 5, pp. 415–425
Athanasou, J., Pithers, R. and Petoumenos, K. (1995), ‘Characteristics of Long Term
Unemployed and Very Long Term Unemployed Clients: A Study of Employment
Service Registrants in Australia’, Australian Bulletin of Labour, vol. 21, no. 3, pp 198-
207
Attewell, P. (1990), ‘What is Skill?’, Work and Occupations, vol. 17, no. 4, pp. 422-448
Aungles, P., Dearden, L., Karmel, T. and Ryan, C. (1993), ‘Through a Rear-View Mirror
Darkly: Occupational Change 1971-1986’, Australian Bulletin of Labour, vol. 19, no. 2,
pp. 97-113

234
Australian Bureau of Statistics (ABS) (1981), 1981 Census of Population and Housing,
Classification and Classified List of Occupations, Catalogue 1206.0, Australian
Bureau of Statistics, Canberra
– (1993), Australian and New Zealand Standard Industrial Classification (ANZSIC),
1993, Catalogue 1292.0, Australian Bureau of Statistics, Canberra
– (1994), ASCO – Australian Standard Classification of Occupations, Catalogue
1221.0, Australian Bureau of Statistics, Canberra
– (1996a), Information Paper: Census of Population and Housing: Link Between First
and Second Editions of Australian Standard Classification of Occupations (ASCO),
Catalogue 1232.0, Australian Bureau of Statistics, Canberra
– (1996b), Statistical Geography Volume 1, Australian Standard Geographical
Classification (ASGC), Catalogue 1216.0, Australian Bureau of Statistics, Canberra
– (1997a), Business Use of Information Technology 1993-4, Catalogue 8129.0,
Canberra
– (1997b), Australian Standard Classification of Occupations (ASCO) Second Edition,
1997, Catalogue 1220.0, Australian Bureau of Statistics, Canberra
– (1998), Education and Training 1998, Catalogue 4224.0, Australian Bureau of
Statistics, Canberra
– (1999), Business Use of Information Technology, 1997-98, Catalogue 8129.0,
Australian Bureau of Statistics, Canberra
– (2000), Use of the Internet by Householders, Australia, Catalogue 8147.0, Australian
Bureau of Statistics, Canberra
– (2001a), Census of Population and Housing: Time Series Profiles, 2001, Catalogue
2003.0, viewed 11/1/2010,
http://www.abs.gov.au/ausstats/[email protected]/ProductsbyReleaseDate/D61BFEE69ACA3
9CACA25734100166A96?OpenDocument
– (2001b), Australian Standard Classification of Education (ASCED), Catalogue
1272.0, Australian Bureau of Statistics, Canberra
– (2002a), Business Use of Information Technology, 2000–01, Catalogue 8129.0,
Australian Bureau of Statistics, Canberra
– (2002b), Business Use of Information Technology, 2001–02, Catalogue 8129.0,
Australian Bureau of Statistics, Canberra
– (2002c), Business Operations and Industry Performance, 2000–01, Catalogue 8140.0,
Australian Bureau of Statistics, Canberra
– (2002d), Employee Earnings, Benefits and Trade Union Membership, 2001, Australia,
Catalogue 6310.0, Australian Bureau of Statistics, Canberra
235
– (2004), Australian System of National Accounts, Table 98. Net Capital Stock, Industry
by Type of Asset - Current prices, Catalogue 5204.0, Australian Bureau of Statistics,
Canberra, viewed 30/05/2003, http://www.abs.gov.au/ausstats/
– (2005), Business Use of Information Technology, 2004–05, Catalogue 8129.0,
Australian Bureau of Statistics, Canberra
– (2006a), Census Dictionary, 2006 (Reissue), Catalogue 2901.0, Australian Bureau of
Statistics, Canberra
– (2006b), Employee Earnings, Benefits and Trade Union Membership, 2008, Australia,
Catalogue 6310.0, Australian Bureau of Statistics, Canberra
– (2006c), Census of Population and Housing, Census Tables, Catalogue 2068.0,
Australian Bureau of Statistics, Canberra, viewed 11/1/2010,
http://www.abs.gov.au/websitedbs/D3310114.nsf/home/census+data?opendocument#f
rom-banner=LN
– (2007a), Household Use of Information Technology, 2006-07, Catalogue 8146.0,
Australian Bureau of Statistics, Canberra
– (2007b), Household Use of Information Technology, 2005-06, Catalogue 8146.0,
Australian Bureau of Statistics, Canberra
– (2007c), Labour Force, Australia, Detailed, Quarterly Table 07. Employed persons by
Occupation and Sex, Catalogue 6291.0.55.003, Australian Bureau of Statistics,
Canberra, viewed 16/5/2010,
http://www.abs.gov.au/AUSSTATS/[email protected]/DetailsPage/6291.0.55.003Feb%20200
7%20(Revised%20Methodology)?OpenDocument
– (2007d), Information paper: Experimental Estimates of Industry Multifactor
Productivity, 2007, First Issue, Catalogue 5260.0.55.001, Australian Bureau of
Statistics, Canberra
– (2008a), Household Use of Information Technology, Australia 2007-08, Catalogue
8146.0, Australian Bureau of Statistics, Canberra
– (2008b), Australian System of National Accounts, Catalogue 5204.0, Australian
Bureau of Statistics, Canberra, viewed 15/11/2009,
http://www.abs.gov.au/AUSSTATS/[email protected]/DetailsPage/5204.02007-
08?OpenDocument
– (2008c), Employee Earnings, Benefits and Trade Union Membership, Catalogue
6310.0, Australian Bureau of Statistics, Canberra, viewed 17/1/2010,
http://www.abs.gov.au/AUSSTATS/[email protected]/Lookup/6310.0Main+Features1Aug%2
02008?OpenDocument
– (2009a), Labour Force, Australia, Table 02. Labour force status by Sex - Seasonally
adjusted, Detailed, Catalogue 6202.0.55.001, Australian Bureau of Statistics,
Canberra, viewed 1/6/2010,
http://www.abs.gov.au/AUSSTATS/[email protected]/DetailsPage/6202.0.55.001Jan%20200
236
9?OpenDocument
– (2009b), Household Income and Income Distribution, Australia, 2007-08, Catalogue
6523.0, Australian Bureau of Statistics, Canberra
– (2009c), Business Use of Information Technology, 2007-08, Catalogue 8129.0,
Australian Bureau of Statistics, Canberra
– (2009d), Australian System of National Accounts, 2008-09, Table 16. Selected
Analytical Series, Catalogue 5204.0, viewed 15/11/2009,
http://www.abs.gov.au/AUSSTATS/[email protected]/DetailsPage/5204.02008-
09?OpenDocument
– (2009e), Labour Force, Australia, Detailed, Quarterly Table 06. Employed persons by
Industry Subdivision and Sex (Time Series Workbook), Catalogue 6291.0.55.003,
Australian Bureau of Statistics, Canberra, viewed 16/1/2009,
http://www.abs.gov.au/AUSSTATS/[email protected]/DetailsPage/6291.0.55.003Nov%20200
8?OpenDocument
– (2009f), Employee Earnings, Benefits and Trade Union Membership, 2008, Australia,
Catalogue 6310.0, Australian Bureau of Statistics, Canberra
– (2009g), Australian System of National Accounts,2008-09, Table 13, Productivity
Measures - Selected Industries, Catalogue 5204.0, viewed 31/1/2010,
http://www.abs.gov.au/AUSSTATS/[email protected]/DetailsPage/5204.02008-
09?OpenDocument
– (2009h), Schools, Australia, 2008, Catalogue 4221.0, Australian Bureau of Statistics,
Canberra
– (2010a), Labour Force, Table 01. Labour force status by Sex, Australia, Catalogue
6202.0, Australian Bureau of Statistics, Canberra, viewed 23/2/2010,
http://www.abs.gov.au/AUSSTATS/[email protected]/DetailsPage/6202.0Dec%202009?Open
Document
– (2010b), Australian National Accounts: National Income, Expenditure and Product,
2010, Table 38. Unit Labour Costs, Catalogue 5206.0, Australian Bureau of Statistics,
Canberra, viewed 31/1/2010,
http://www.abs.gov.au/AUSSTATS/[email protected]/DetailsPage/5206.0Sep%202009?Open
Document
– (2010c), Labour Force, Australia, Table 14B. Unemployed persons by duration of
unemployment and sex, Catalogue 6291.0.55.001, viewed 3/6/2010,
http://www.abs.gov.au/AUSSTATS/[email protected]/DetailsPage/6291.0.55.001Apr%20201
0?OpenDocument
Australian Consumer and Competition Commission (ACCC) (2008), Form G Notification of
Exclusive Dealing, application to Commonwealth of Australia under the Trade Practices
Act 1974 - Subsection 93(1) by eBay International A.G., viewed 2/11/2009,
http://www.accc.gov.au/content/trimFile.phtml?trimFileName=D08+30090.pdf&trimFile
237
Title=D08+30090.pdf&trimFileFromVersionId=861515
Australian Qualifications Framework (AQF) Advisory Board (2002), Australian Qualifications
Framework Implementation Handbook Third Edition 2002, Australian Qualifications
Framework (AQF) Advisory Board, Melbourne
Autor, D. H., Katz, L. F. and Krueger, A. B. (1998), ‘Computing Inequality: Have Computers
Changed The Labour Market?’, The Quarterly Journal of Economics, vol. 113, no. 4,
pp. 1169-1213
Autor, D., Levy, F. and Murnane, R. (2000), Upstairs-Downstairs: Complementarity and
Computer-Labour Substitution on Two Floors of a Large Bank, NBER Working
Paper no. 7890, National Bureau of Economic Research, Cambridge
Autor, D., Levy, F. and Murnane, R. (2003), ‘The Skill Content of Recent Technological
Change: An Empirical Exploration’, Quarterly Journal of Economics, vol. 118, no. 4,
pp. 1279-1333
Berman, E., Bound, J. and Griliches, Z. (1994), ‘Changes in the Demand for Skilled Labour
within US Manufacturing: Evidence from the Annual Survey of Manufactures’,
Quarterly Journal of Economics, vol. 109, no. 2, pp. 367-97
Berman, E., Bound, J. and Machin, S. (1998), ‘Implications of Skill-Biased Technological
Change: International Evidence’, Quarterly Journal of Economics, 1998, vol. 113, no. 4,
pp. 1245-1279
Blackburn, M., Bloom, D. and Freeman, R. (1991), Changes in Earnings Differentials in the
1980s: Concordance, Convergence, Causes, and Consequence, Working Paper no. 61,
Levy Economics Institute, New York
Bloch, H. and McDonald, J. (2001), ‘Import Competition and Labour Productivity’, Journal of
Industry, Competition and Trade, vol. 1, no. 3, pp. 301-319
Bogan, V. (2008), ‘Stock Market Participation and the Internet’, Journal of Financial and
Quantitative Analysis, March 2008, vol. 43, no. 1, pp. 191-212
Bollier, D. (1996), The Future of Electronic Commerce, Aspen Institute, Washington
Borjas, G. and Ramey, V. (1995), ‘Foreign Competition, Market Power, and Wage Inequality’,
Quarterly Journal of Economics, vol. 110, no. 4, pp. 1075-110
Borland, J. (1999), ‘Earnings Inequality in Australia: Changes, Causes and Consequences’,
Economic Record, vol. 75, no. 229, pp. 177-202
Borland, J. (2001), ‘Microeconomic Reform in Australia - An Introduction’, Econochat, vol. 1,
no. 16, pp. 2-7
238
Borland, J. and Norris, K. (1996), ‘Equity’, in K. Norris and M. Wooden (eds), The Changing
Australian Labour Market, Commission Paper no. 11, Economic Planning Advisory
Commission, AGPS, Canberra
Borland, J. and Wilkins, R. (1996), ‘Earnings Inequality in Australia’, Economic Record, vol.
72, no. 216, pp. 7-23
Borland, J., Hirschenberg, J. and Lye, J. (2004), ‘Computer Knowledge and Earnings:
Evidence for Australia’, Applied Economics, vol. 36, no. 17, pp. 1979-93
Bosworth, D., Dawkins, P. and Stromback T. (1996), The Economics of the Labour Market,
Longman, London
Bound, J. and Johnson, G. (1992), ‘Changes in the Structure of Wages in the 1980s: An
Evaluation of Alternative Explanations’, American Economic Review, vol. 82, no. 3, pp.
371-392
Bradbury, B., Garde, P. and Vipond, J. (1986), ‘Youth Unemployment and Intergenerational
Immobility’, Journal of Industrial Relations, vol. 28, no. 2, pp. 191-210
Bradley, S. and Taylor, J. (1996), ‘Human Capital Formation and Local Economic
Performance’, Regional Studies, February 1996, vol. 30, no. 1, pp. 1-14
Bratti , M. and Matteucci, N. (2004), Is There Skill-Biased Technological Change in Italian
Manufacturing? Evidence from Firm-Level Data, QUADERNI DI RICERCA, no. 202,
Dipartimento Di Economia, Università Politecnica delle Marche
Bresnahan, T., Brynjolfsson, E. and Hitt, L. (2002), ‘Information Technology, Workplace
Organisation, and the Demand for Skilled Labour: Firm-Level Evidence’, Quarterly
Journal of Economics, vol. 117, no. 1, pp. 339-376
Breunig, R. And Wong, M. (2008), ‘A Richer Understanding of Australia’s Productivity
Performance in the 1990s: Improved Estimates Based upon Firm-Level Panel Data’,
Economic Record, vol. 84, no. 265, pp. 157-76
Cain, P. and Treiman, J. (1981), ‘The Dictionary of Occupational Titles as a Source of
Occupational Data’, American Sociological Review, vol. 46, no. 3, pp. 253-278
Callaghan, R. (1999), ‘Customer queries keep Alinta Gas humming’ The West Australian, 8
January, p.30
Card, D and DiNardo, J. (2002), ‘Skill-Biased Technological Change and Rising Wage
Inequality: Some Problems and Puzzles’, Journal of Labour Economics, vol. 24 no. 4,
pp. 733-83
Carnoy, M. (1994), ‘Efficiency and Equity in Vocational Education and Training Policies’,
239
International Labour Review, 1994, vol. 133, no. 2, pp. 221-40
Caroli, E. (1999), ‘New Technologies, Organisational Change and the Skill Bias: a go into
the Black Triangle’, in P. Petit and L. Soete (eds), Employment and Economic
Integration, Edward Elgar, London
Caroli, E. (2003), Internal Versus External Labour Flexibility: The Role Of Knowledge
Codification, Laboratoire d’Economie Appliquee (LEA) - INRA, Research Unit
Working Papers no. 0310, Paris
Chand, S., McCalman, P. and Gretton, P. (1998), ‘Trade Liberalisation And Manufacturing
Industry Productivity Growth’, in Microeconomic Reform and Productivity Growth,
Workshop Proceedings; 26–27 February 1998, Productivity Commission and Australian
National University, Canberra
Chennells, L. and Van Reenen J. (1997), ‘Technical Change and Earnings in British
Establishments’, Economica, vol. 64, no. 256, pp. 587-604
Chia, T. (1991), ‘Has the Value of a Degree Fallen? Cross-Sectional Versus Time-Series
Evidence’, in ‘International Economics Postgraduate Research Conference Volume’,
Supplement to Economic Record, vol. 67, (supplement), pp. 41-52
Chief Executive (1999), ‘CEO Report’, New York 1999 CEO Report
Chowdury, A. and Islam, I. (1993), The Newly Industrialising Economies of East Asia,
Routledge, New York
Colecchia, A. and Papaconstantinou, G. (1996), The Evolution of Skills in OECD Countries and
the Role of Technology, STI Working Paper 1996/8, OECD, Paris
(http://dx.doi.org/10.1787/613570623323)
Coppel, J. (2000), E-commerce : impacts and policy challenges, OECD working papers ; vol. 8,
no. 36, OECD, Paris
Corvers, F. and Marikull, J. (2007), ‘Occupational Structures across 25 EU Countries: The
Importance of Industry Structure and Technology in Old and New EU Countries’,
Economic Change and Restructuring, 2007, vol. 40, no. 4, pp. 327-59
Cully, M. (1999), ‘A More or Less Skilled Workforce? Changes in the Occupational
Composition of Employment 1993 to 1999’, Australian Bulletin of Labour, vol. 25, no. 2
pp. 98-104
Cully, M. (2008), ‘Youth wages, training wages and productivity: the economic anatomy of
traineeships’, in 2008 Minimum Wage Research Forum proceedings: Volume two,
Australian Fair Pay Commission, pp. 267-287, Australian Fair Pay Commission,
Melbourne Vic, viewed 5/6/2009, http://www.fairpay.gov.au/NR/rdonlyres/FDDD8BB0-
240
4
Cyree, K., Delcoure, N. and Dickens, R. (2009), ‘An examination of the performance and
prospects for the future of Internet-primary banks’, Journal of Economics and Finance,
April 2009, vol. 33, no. 2, pp. 128-47
de Blasio, G. (2008), ‘Urban-Rural Differences in Internet Usage, eCommerce, and e-
Banking: Evidence from Italy’, Growth and Change, June 2008, vol. 39, no. 2, pp. 341-
67
De Laine, C., Laplagne, P. and Stone, S. (2000), The Increasing Demand for Skilled Workers
in Australia: The Role of Technical Change, Productivity Staff Research Paper,
Ausinfo, Canberra
Demoussis, M. and Giannakopoulos, N. (2006), ‘Facets of the Digital Divide in Europe:
Determination and Extent of Internet Use’, Economics of Innovation and New
Technology, April 2006, vol. 15, no. 3, pp. 235-46
Department of Broadband, Communications and the Digital Economy (DBCDE) (2009),
Australia’s Digital Economy: Future Directions Final Report, Commonwealth
Government, Canberra
Department of Communications, Information Technology and the Arts (DCITA) (2000),
Telstra’s Universal Service Plan, Approved by Senator the Hon Richard Alston
Minister for Communications, the Information Economy and the Arts 18 May 1998.
Australia, viewed 17/12/2000, http://www.dcita.gov.au
Department of Industry, Science and Technology (DIST) (1998), Stats: Electronic Commerce
in Australia, (98/050), Canberra
Deutsches Institut für Wirtschaftsforschung (German Institute for Economic Research) (DIW)
(n.d.), SOEP Overview, viewed 6/6/2010,
http://www.diw.de/en/diw_02.c.222508.en/soep_overview.html
Devins, D., Darlow, A. and Webber, D. (2008), ‘Beyond ‘Access’: Internet Use and Take-Up
of On-line Services by Adults Living in Disadvantaged Areas in England’, Local
Economy, February 2008, vol. 23, no. 1, pp. 47-57
DiNardo, J. and Pishke, J.S. (1997), ‘The Returns to Computer Usage Revisited: Have
Pencils Changed the Wage Structure Too?’, Quarterly Journal of Economics, vol.
112, no. 1, pp. 291-303
Dockery, A. and Norris, K. (1996), ‘The ‘rewards’ for apprenticeship training in Australia’,
Australian Bulletin of Labour, vol. 22, no. 2, pp. 109-125
Dockery, A. and Webster, E. (2002), ‘Long-term unemployment and work deprived individuals:
241
Issues and policies’, The Australian Journal of Labour Economics, vol. 5, no. 2, pp. 175-
194
Dockery, A. M., Kelly, R., Norris, K. and Stromback, T. (2001), ‘Costs and benefits of New
Apprenticeships’, Australian Bulletin of Labour, vol. 27, no. 3, pp. 192-203
Doherty, L. and Grattan, M. (2000), ‘Souris to fight Telstra sell-off’, Sydney Morning Herald,
Wednesday, 2 February 2000
Dollery, B. and Wallis, J. (2000), ‘A Note on the timing of Microeconomic Reform in Australia’,
Economic Analysis and Policy, vol. 30, no. 1, pp. 63-73
Dunlop, Y. and Sheehan, P. (1998), ‘Technology, Skills and the Changing Nature of Work’,
in P. Sheehan and G. Teggart (eds), Working for the Future: Technology and
Employment in the Global Knowledge Economy, Victoria University Press,
Melbourne.
Dupuy, A. (2007), ‘Will the skill-premium in the Netherlands rise in the next decades?’,
Applied Economics, 2007, vol. 39, no. 19-21, pp. 2723–2731
Dustmann, C. and Pereira, S. (2008), ‘Wage Growth and Job Mobility in The United Kingdom
And Germany’, Industrial and Labor Relations Review, vol. 61, no. 3, pp. 374-393
Englehardt, S. (2009), ‘The Evolution of Skill-Biased Effects on American Wages in the 1980s
and 1990s’, Journal of Labour Research, vol. 30, no. 2, pp.135-148
Fair Work Australia (FWA) (n.d.), Transition to Fair Work Australia, Fair Work Australia,
viewed 27/1/2010, http://www.fwa.gov.au/index.cfm?pagename=trans
Farmakis-Gamboni, S. and Prentice, D. (2006), Does reducing union bargaining power increase
productivity, Latrobe Discussion Paper A07.04
Feenstra, R, and Hanson, G. (1999), ‘The Impact of Outsourcing and High-Technology Capital
on Wages: Estimates for the United States, 1979-1990’, Quarterly Journal of Economics,
vol. 114, no. 3, pp. 907-40
Form, W. (1987), ‘On the Degradation of Skills’, Annual Review of Sociology, vol. 13, pp. 29-47
Garicano, L. and Kaplan, S. (2001), ‘The Effects of Business-to-Business E-Commerce on
Transaction Costs’, Journal of Industrial Economics, vol. 49, no. 4, pp. 463-85
Geishecker, I. and Gorg H. (2008), ‘Winners and losers: a micro-level analysis of international
outsourcing and wages’, Canadian Journal of Economics, vol. 41, no. 1, pp.243-270
Gera, S. and Masse, P. (1996), Employment Performance In The Knowledge-Based Economy,
Industry Canada Working Paper no. 14, Human Resources Development Canada W-
242
97-9E/F, Canada
Goel, R. and Hsieh, E. (2002), ‘Internet growth and economic theory’, Netnomics, vol. 4, no.
2, pp. 221–225
Goldin, C. and Katz, L. (1998), ‘The Origins of Technology-Skill Complementarity’,
Quarterly Journal of Economic, vol. 113, no. 3, pp. 693-732
Goolsbee, A. and Kenlow, P. J. (1999), Evidence on Learning and Network Externalities in
the Diffusion of Home Computers, National Bureau of Economic Research, Working
Paper no. 7329, Cambridge: NBER
Grattan, M. (2000), ‘Poll-wary PM backs bush’, Sydney Morning Herald, 31 Jan 2000
Greenan, N. (2003), ‘Organisational Change, Technology, Employment and Skills: An Empirical
Study of French Manufacturing’, Cambridge Journal of Economics, vol. 27, no. 2, pp.
287-316
Greenstein, S. (1998), Universal Service in the Digital Age: The Commercialisation and
Geography of US Internet Coverage. National Bureau of Economic Research, Working
Paper no. 6453, Cambridge: NBER
Gregory, R. G. and Hunter, B. (1995), The Macroeconomy and the Growth of Ghettos and
Urban Poverty in Australia, Centre for Economic Policy Research Discussion Paper,
no. 325, April 1995, Canberra
Hancock, K. and Rawson, D. (1993), ‘The Metamorphosis of Australian Industrial Relations’,
British Journal of Industrial Relations, vol.31 no.4, pp. 489-513
Haskel, J. (1996), The Decline in Unskilled Employment in UK Manufacturing, Centre For
Economic Policy Research Discussion Papers, March, no. 342
Haskel, J. and Slaughter, M. (2001), ‘Trade, Technology and U.K. Wage Inequality’, Economic
Journal, vol. 111, no. 468, pp. 163-187.
Heath, A. and Swann, T. (1999), Reservation Wages and the Duration of Unemployment,
RDP1999-02, Reserve Bank of Australia, Sydney
Helpman, E. and Rangel, A. (1999), ‘Adjusting to a New Technology: Experience and Training’,
Journal of Economic Growth, December 1999, vol. 4, no. 4, pp. 359-83
Howell, D. (1996), The Collapse of Low-Skill Wages, Working Paper 178, New York University
Howell, D. and Wolff, E. (1990), Technical Change and the Demand for Skills by US Industries,
Research Report, RR#90-41, CV Starr Centre for Applied Economics, New York
University
243
Hubbard, G., Garnett, A., Lewis, P. and O’Brien, A. (2009), Microeconomics, Pearson,
Sydney
Hunter, B. (1995), ‘The Social Structure of the Australian Urban Labour Market’, Australian
Economic Review, vol. 110, no. 2, pp. 65-79
Hunter, B. (1996), Explaining Changes in the Social Structure of Employment: the
importance of geography, Social Policy Research Centre, Discussion Paper no. 67,
July 1996, University of New South Wales, Sydney
International Labor Organisation (ILO) (2010), International Standard Classification of
Occupations (ISCO), ILO, Geneva, viewed 11/4/2010,
http://www.ilo.org/public/english/bureau/stat/isco/index.htm
Internet World Stats (n.d.), Internet Usage Statistics: The Internet Big Picture World Internet
Users and Population Stats, Internet World Stats, viewed 29/9/2009
Jenkins, C. (2007), ‘Hunt on eBay for tax dodgers’, The Australian, March 13 2007
Johnston, A., Porter, D., Cobbold, T. and Dolamore, R. (2000), Productivity in Australia’s
Wholesale and Retail Trade, Productivity Commission Staff Research Paper, AusInfo,
Canberra
Junankar, P. and Kapuscinski, C. (1991), The Incidence of Long Term Unemployment in
Australia, CEPR Discussion Papers 249, Centre for Economic Policy Research, Research
School of Economics, Australian National University
Kaiser, U. (2000), ‘New Technologies and the Demand for Heterogeneous Labour: Firm-Level
Evidence for the German Business-Related Service Sector’, Economics of Innovation and
New Technology, vol. 9, no. 5, pp. 465-86
Kapuscinski, C. (2004), Dynamics of apprenticeship and traineeship training in Australia: An
historical analysis, Research Analysis and Evaluation Group, Department of Education,
Science and Training, Canberra
Karmel, T. and Mlotkowski, P. (2008), Modelling the trades: An empirical analysis of trade
apprenticeships in Australia, 1967–2006, NCVER, Adelaide
Karunaratne, N. (2007), Microeconomic Reform and Technical Efficiency in Australian
Manufacturing, Discussion Paper no. 345, April 2007, School of Economics, The
University of Queensland
Katz, L. and Murphy, K. (1992), ‘Changes in Relative Wages, 1963-1987: Supply and Demand
Factors’, Quarterly Journal of Economics, vol. 107, no. 1, pp. 35-78
Kelly, R. (2007), ‘Changing Skill Intensity in Australia Industry’, The Australian Economic
244
Review, vol 40, no. 1, pp. 1-18
Kelly, R. and Lewis, P.E.T. (2000), ‘The Impact of Intergenerational Effects and Geography
on Youth Employment outcomes: a study of the Perth Metropolitan Region’,
Australasian Journal of Regional Studies, vol. 6, no. 1, pp. 27-45
Kelly, R. and Lewis, P.E.T. (2001), ‘Household Demand for Internet Connection’, Journal of
Media Economics, vol. 14, no. 4, pp. 249-265
Kelly, R. and Lewis, P.E.T. (2002), ‘Neighbourhoods, families and youth employment
outcomes: A study of metropolitan Melbourne’, Journal of Socio-Economics, vol. 31,
no. 4, pp. 405-408 (research note)
Kelly, R. and Lewis, P.E.T. (2003), ‘The New Economy and Demand for Skills’, Australian
Journal of Labour Economics, vol. 6, no. 1, pp. 135 – 152
Kelly, R. and Lewis, P.E.T. (2006), ‘Measurement of Skill and Skill Change’, in Brown P, Liu,
S and Sharma, D. (eds), Contributions to Probability and Statistics: Applications and
Challenges, World Scientific, Singapore
Kelly, R. And Lewis, P. (2009), The Business Cycle, Structural and Technological: The Impact
on Labour Skills in Australia, Conference Proceedings from the 2009 Oxford Business &
Economics Conference (OBEC), June 24-26, 2009, St. Hugh’s College, Oxford
University
Kelly, R. And Lewis, P. (2010), ‘The Business Cycle, Structural and Technological: The Impact
On Labour Skills In Australia’, Australian Bulletin of Labour, (forthcoming)
Kenyon, P. and Wooden, M. (1996), ‘Labour Supply’, in K. Norris and M. Wooden (eds),
The Changing Australian Labour Market, Commission Paper no. 11, Economic
Planning Advisory Commission, AGPS, Canberra
Koivumäki T., Svento, R., Perttunen. J. and Oinas-Kukkonen, H. (2002), ‘Consumer choice
behavior and electronic shopping systems – a theoretical note’, Netnomics, vol. 4, no.
2, pp. 131–144
Krueger, D. and Kumar, K. (2004), ‘Skill-Specific Rather Than General Education: A Reason
for US-Europe Growth Differences?’, Journal of Economic Growth, vol. 9, no. 2, pp.
167-207
Lansbury, D. Wailes, N. and Yazbeck, C. (2007), ‘Different Paths to Similar Outcomes?
Industrial Relations Reform and Public Policy in Australia and New Zealand’, Journal of
Labour Research, vol. 28, no. 4, pp. 629–641
Laplagne, P., Glover, M. and Fry, T. (2005), The Growth of Labour Hire Employment in
Australia, Productivity Commission Staff Working Paper, Melbourne
245
Lawrence, R.Z. and M.J. Slaughter (1993), ‘International Trade and American Wages in the
1980s: Giant Sucking Sound or Small Hiccup?’, Brookings Papers on Economic Activity:
Microeconomics, vol. 2, pp. 161-210
Le, A. T. and Miller, P. W. (1999), A Risk Index Approach to Unemployment: an Application
Using the Survey of Employment and Unemployment Patterns, catalogue No
6293.0.00.001, Australian Bureau of Statistics Occasional Paper, Australian Bureau of
Statistics, Canberra
Lewis, P. (1998), The Elasticity of Demand for Labour, Working Paper no. 170, Economics
Department, Murdoch University
Lewis, P. (2006), Minimum Wages and Employment, Australian Fair Pay Commission Research
Report 1/06, Australian Fair Pay Commission, Melbourne
Lewis, P. and Corliss, C. (2010), A Regional Analysis of the Labour Market for Tradespersons,
National Centre for Vocational Education Research, Adelaide
Lewis, P. and Koshy, P. (1999), ‘Youth Employment, Unemployment and School Participation’,
Australian Journal of Education, vol 43, no. 1, pp. 42-57
Lewis, P. and Mahony, G. (2006), ‘The New Economy and Skills Development in Australia and
Singapore’, Asia Pacific Journal of Economics and Business, vol. 10, no. 1, pp. 34-47
Lewis, P. And McDonald, G. (2002), ‘The Elasticity of Demand for Labour in Australia’,
Economic Record, vol. 78, no. 240, pp. 18-30
Lewis, P. and Mclean, B. (1998), The Youth Labour Market in Australia, paper presented to the
Productivity Commission Workshop on Youth Unemployment, Australian National
University, November 1998
Lewis, P. and Spiers, D. (1990), ‘Six Years of the Accord: An Assessment’, Journal of
Industrial Relations, vol. 32, no. 1, pp. 53-68
Lewis, P., Garnett, A., Hawtrey, K. and Treadgold, M. (2006), Issues, Ideas and Indicators: A
Guide to the Australian Economy, 4th Ed., Addison Wesley, Sydney
Lewis, P.E.T. and Seltzer, A. (1996), ‘Labour Demand’, in K. Norris and M. Wooden (eds), The
Changing Australian Labour Market, Commission Paper No.11, Economic Planning
Advisory Commission, AGPS, Canberra
Lewis, S. (2000), ‘Telstra faces bush rivals from 2001’, Australian Financial Review, 23
August 2000
Long, J. and Ervin, L. (2000), ‘Using heteroscedasticity consistent standard errors in the
linear regression model’, The American Statistician, Vol 54, no.3, pp. 217-224
246
Loundes, J., Tseng, Y. and Wooden, M. (2003), ‘Enterprise Bargaining and Productivity in
Australia: What Do We Know?’, Economic Record, vol. 79, no. 245, pp. 245-58
Lucking-Reiley, D. and Spulber, D. (2001), ‘Business-to-Business Electronic Commerce’,
Journal of Economic Perspectives, vol. 15, no. 1, pp. 55-68
Machin, S. (1995), Changes in the Relative Demand for Skills in the UK Labour Market;
London School of Economics, Centre for Economic Performance Discussion Paper:
221
MacKinnon, J. and White, H. (1985), ‘Some heteroscedasticity consistent co-variance matrix
estimators with improved finite sample properties’, Journal of Econometrics, Vol. 29,
no. 3, pp. 53-57
Maddala, G. (1992), Introduction to Econometrics, 2nd
Ed, Macmillan, New York
Madden, G. and Savage, S. J., (2000), Some Economic and Social Aspects of Residential
Internet Use in Australia’, The Journal of Media Economics, vol. 13, no. 3, pp. 171-
185
Mai, Y., Adams, P., Fan, M., Li, R. and Zheng, Z. (2005), Modelling the Potential Benefits of an
Australia-China free Trade Agreement, Centre of Policy Studies/IMPACT Centre
Working Papers no. G-153, Monash University
Marshall, P. and Stone, S. (2000), Technical Change and Demand for Skilled Labour in
Small and Medium Size Australian Firms, Productivity Commission, Melbourne
Maurin, E. and Thesmar, D. (2004), ‘Changes in the Functional Structure of Firms and the
Demand for Skill’, Journal of Labor Economics, vol. 22, no. 3, pp. 639-64
Melbourne Institute of Applied Economic and Social Research (MIAESR) (n.d.), The
Household, Income and Labour Dynamics in Australia (HILDA) Survey Website,
University of Melbourne, viewed 6/6/2010: http://www.melbourneinstitute.com/hilda/
Meng, X. and Ye, A. (2009), ‘Human Capital Externality, Knowledge Spillover, and Sustainable
Economic Growth’, Annals of Economics and Finance, May 2009, vol. 10, no. 1, pp.
155-98
Mitchell, S. (2006), ‘Supply chain management streets ahead of Coles’, Australian Financial
Review, 28 February 2006
Morris, A. and Wilson, K. (1994), ‘An Empirical Analysis of Australian Strike Activity: Further
Evidence of the Role of the Prices and Incomes Accord’, Economic Record, vol. 70, no.
209, pp. 183-191
Morrison, P. and Siegel, D. (2001), ‘The Impacts of Technology, Trade and Outsourcing on
247
Employment and Labor Composition’, Scandinavian Journal of Economics, Blackwell
Publishing, vol. 103, no. 2, pp. 241-64
Mulvey, C. and Kelly, R. (2001), Flexibility in Sick Leave, CLMR DP 02/01, Centre for Labour
Market Research, The University of Western Australia
National Centre for Vocational Education Research (NCVER) (2009), Student Outcomes Survey
2009, NCVER, Adelaide, viewed 13/1/2010,
http://www.ncver.edu.au/statistic/21065.html
National Office for the Information Economy (NOIE) (2000a), Current State of Play - November
2000, Commonwealth Government, Canberra, viewed 1/2/2001,
http://www.noie.gov.au/projects/information_economy/eCommerce_analysis/ie_stats/Stat
eofPlayNov2000/start.htm
National Office for the Information Economy (NOIE) (2000b), E-Commerce: Beyond 2000,
Commonwealth Government, Canberra, viewed 1/2/2001,
http://www.noie.gov.au/projects/information_economy/eCommerce_analysis/ecom_impa
cts/index.htm
National Office for the Information Economy (NOIE) (2003), e-Government Benefits Study,
Commonwealth Government, Canberra, viewed 25/10/2009,
http://www.agimo.gov.au/archive/__data/assets/file/0012/16032/benefits.pdf
Norris, K., Kelly, R and Giles, M. (2005), Economics of Australian Labour Markets 6th Edition,
Longman, Australia
O’Neill, D. and Sweetman, O. (1997), Intergenerational Mobility in Britain: Evidence from
unemployment patterns, September 2 1997, National University of Ireland
O’Regan, K. M. and Quigley, J. M. (1998), Spatial Effects Upon Employment Outcomes: The
Case of New Jersey Youths, March 1998, University of California, Berkley
OECD (1998a), The economic and social impacts of electronic commerce: Preliminary findings
and research agenda, OECD, Paris
OECD (1998b), Technology, Productivity and Job Creation: Best Policy Practices, OECD, Paris
OECD (2006), ICT Use By Businesses: Revised OECD Model Survey, OECD, Paris
O’Leary, G. (2003), Telstra Sale: Background and Chronology, Chronology no. 3 2003-04, 15
September 2003, Economics, Commerce and Industrial Relations Group, Parliament of
Australia, viewed 4/6/2010, http://www.aph.gov.au/library/pubs/chron/2003-
04/04chr03.htm
Pappas, N. (1998), ‘Changes in the Demand for Skilled Labour in Australia’, in P. Sheehan
248
and G. Teggart (eds), Working for the Future: Technology and Employment in the
Global Knowledge Economy, Victoria University Press, Melbourne
Parham, D. (2002), Australia’s 1990s Productivity Surge and its Determinants, National
Bureau of Economic Research 13th Annual East Asian Seminar on Economics,
Melbourne, 20-22 June 2002, Productivity Commission, Australia, viewed 26/1/2010,
www.pc.gov.au/work/productivity/index.html
Parham, D. (2004), ‘Sources of Australia’s Productivity Revival’, Economic Record, vol. 80, no.
249, pp. 239-57
Parham, D., Roberts, P. and Sun, H. (2001), Information Technology and Australia’s
Productivity Surge, Productivity Commission Staff Research Paper, AusInfo, Canberra
Paul, S. and Marks, A. (2009), ‘Modelling Productivity Effects of Trade Openness: A Dual
Approach’, Australian Economic Papers, vol. 48, no. 2, pp. 105-23
Peetz, D. (2005), ‘Coming Soon to a Workplace Near You--The New Industrial Relations
Revolution’, Australian Bulletin of Labour, 2005, vol. 31, no. 2, pp. 90-111
Petit, P. (1990), ‘Structural Change, Information Technology, and Employment: The Case of
France’, in E. Appelbaum and R. Schettkat (eds), Labour Market Adjustments to
Structural Change and Technological Progress, Praeger, New York
Productivity Commission (2006), Industry Sector Productivity: Highlights – Longer-term
Trends, Tables 2 & 3, Productivity Commission, Canberra
Productivity Commission (2009), Gambling: Draft Report, Productivity Commission, Canberra
Rayport, J. and Jaworski, B. (2001), E-Commerce, McGraw Hill/Irwin, New York
Rio Tinto (2008), Rio Tinto chief executive unveils vision for ‘mine of the future’, Offical Rio
Tinto media release, viewed 7/11/2009, http://www.riotinto.com/media/5157_7037.asp
Romer, P. M. (1986), ‘Increasing Returns and Long Run Growth’, Journal of Political Economy,
vol. 94, no. 5, pp. 1002-38
Russell, W. and Tease, W. (1988), Employment, Output and Real Wages, Research Discussion
Paper RDP 8806, Reserve Bank of Australia
Ryan, C. And Watson, L. (2003), Factors Affecting Year 12 Retention Across Australian States
and Territories in the 1990’s, Discussion Paper no. 467, Centre for Economic Policy
Research, Australian National University
Schwartz, M. (1986), ‘The Nature and Scope of Contestability Theory’, Oxford Economic
Papers, vol. 38, Supplement: Strategic Behaviour and Industrial Competition, pp. 37-57
249
Shapiro, C. and Varian, H. (1999), Information Rules: A Strategic Guide to the Network
Economy, Harvard Business School Press, Boston
Sheehan, P. and Tikhomirova, G. (1998), ‘The Rise of the Global Knowledge Economy’, in
P. Sheehan and G. Teggart (eds), Working for the Future: Technology and
Employment in the Global Knowledge Economy, Victoria University Press,
Melbourne
Shettkat, R. and Wagner, M. (1990), ‘Employment Effects of Modern Technology: A Wide
Range of Empirical Findings and Competing Approaches of Analytical Integration’,
in R. Schettkat and M. Wagner (eds), Technological Change and Employment:
Innovation in the German Economy, Walter de Gruyter, Berlin
Simon, J. and Wardrop, S. (2002), Australian Use of Information Technology and its
Contribution to Growth, Research Discussion Paper 2002-02, Reserve Bank of Australia,
Sydney
Simshauser, P. (2005), ‘The Gains from the Microeconomic Reform of the Power generation
Industry in East-Coast Australia’, Economic Analysis and Policy, vol. 35, nos. 1&2, pp.
23-43
Soete, L. and Weel, B. T. (1998), Globalisation, Tax Erosion and the Internet, Department of
Economics and Maastricht Economic Research Institute on Innovation and Technology
(MERIT), Maastricht University
Song, L. and Webster, B. (2003), ‘How Segmented are Skilled and Unskilled Labour
Markets: The Case of Beveridge Curves’, Australian Economic Papers, vol. 42, no. 3,
pp. 332-45
Spenner, K. (1979), ‘Temporal changes in work content’, American Sociological Review, vol.
44, no. 6, pp. 968-75
Spenner, K. (1983), Deciphering Prometheus: Temporal Changes in Skill Content, American
Sociological Review, vol. 48, no. 6, pp. 824-37
Spitz, A., (2003), IT Capital, Job Content and Educational Attainment, ZEW Discussion
Paper no. 03-04, 2003
Stordahl, K. and Elnegaard, N. (2007), ‘Adoption rate forecasts and rollout strategies’,
Netnomics, vol. 8, nos. 1-2, pp. 150-170
Stromback, T. and Dockery, A. M. (2005), ‘Straight to work or a traineeship: a comparison of
two pathways’, Australian Journal of Labour Economics, vol. 8, no. 4, pp. 309-329
Topp, V., Soames, L., Parham, D. and Bloch, H. (2008), Productivity in the Mining Industry:
Measurement and Interpretation, Productivity Commission Staff Working Paper,
250
December
United States Department of Labour (USDOL) (n.d.), ‘Dictionary of Occupational Titles (4th
Ed.) - Appendix B’, United States Department of Labor: Office of Administrative
Law Judges Law Library, viewed 8/3/2010
http://www.oalj.dol.gov/PUBLIC/DOT/REFERENCES/DOTAPPB.HTM
US Census Bureau, (2009), 2007 E-Commerce Multi-Sector E-Stats Report, viewed 25/10/2009,
http://www.Census.gov/econ/estats/index.html
US Department of Commerce (1998), The Emerging Digital Economy, viewed 7/5/2001,
http://www.eCommerce.gov
Valadkhani, A. (2003), ‘An Empirical Analysis of Australian Labour Productivity’, Australian
Economic Papers, vol. 42, no. 3, pp.273-291
Vallas, S. (1990), ‘The Concept of Skill: A Critical review’, Work and Occupations, vol. 17 no.
4, pp. 379-98
Vipond, J. (1984), ‘The Intra-Urban Unemployment Gradient: The Influence of Location on
Unemployment’, Urban Studies, vol. 21, no. 4, pp. 377-88
Wailes, N. and Lansbury, R. (1999), Collective bargaining and flexibility: Australia,
International Labour Organisation, Geneva, Switzerland, viewed 20/01/2010,
http://www.ilo.org/public/english/dialogue/ifpdial/publ/infocus/australia/index.htm)
Wannell, T. and Ali, J. (2002), Working Smarter: The Skill Bias of Computer Technologies,
The Evolving Workplace Series no. 71-584-MIE no. 3, Business and Labour Market
Analysis Division, Statistics Canada
Welsch, R. (1980), ‘Regression Sensitivity Analysis and Bounded Influence Estimation’ in
Kmenta, J. and Ramsay, J. (eds), Evaluation of Econometric Models, Academic Press,
New York
Wolff, E. (1996), Technology and the Demand for Skills, STI Review No.18, OECD, Paris
Wolff, E.N. (1995), Technology and the Demand for Skills, Working Paper 153, New York
University
Wooden, M. (2000), ‘The Changing Skill Composition of Labour Demand’, Australian Bulletin
of Labour, vol. 26, no. 3 pp. 191-198
Wooden, M. (2001), ‘Industrial Relations Reform in Australia: Causes, Consequences and
Prospects’, Australian Economic Review, vol. 34, no. 3, pp. 243–62
Wooden, M. (2005), Australia’s Industrial Relations Reform Agenda, Invited paper presented at

251
the 34th Conference of Economists, 26-28 September 2005, University of Melbourne
Woodhead, B. (2008), ‘Supply chain drives Woolies’, The Australian, February 26 2008, viewed
7/11/2009, http://www.theaustralian.com.au/
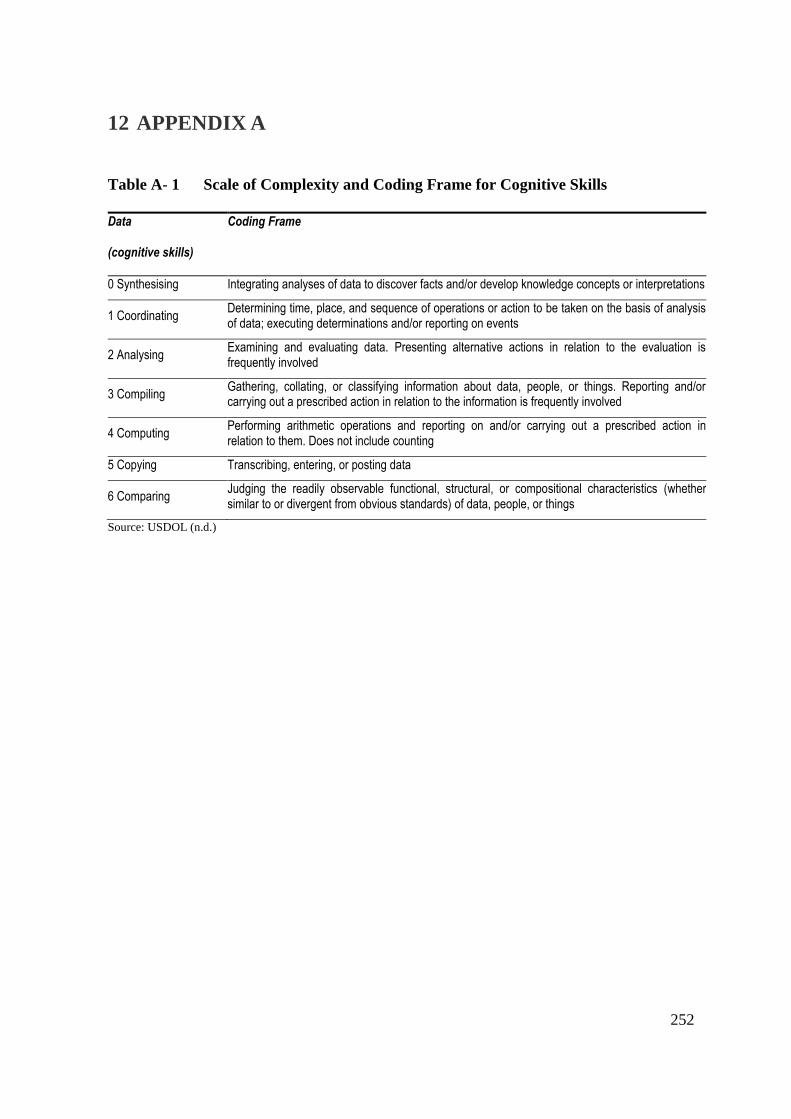
252
12 APPENDIX A
Table A- 1 Scale of Complexity and Coding Frame for Cognitive Skills
Data
(cognitive skills)
Coding Frame
0 Synthesising Integrating analyses of data to discover facts and/or develop knowledge concepts or interpretations
1 Coordinating Determining time, place, and sequence of operations or action to be taken on the basis of analysis of data; executing determinations and/or reporting on events
2 Analysing Examining and evaluating data. Presenting alternative actions in relation to the evaluation is frequently involved
3 Compiling Gathering, collating, or classifying information about data, people, or things. Reporting and/or carrying out a prescribed action in relation to the information is frequently involved
4 Computing Performing arithmetic operations and reporting on and/or carrying out a prescribed action in relation to them. Does not include counting
5 Copying Transcribing, entering, or posting data
6 Comparing Judging the readily observable functional, structural, or compositional characteristics (whether similar to or divergent from obvious standards) of data, people, or things
Source: USDOL (n.d.)
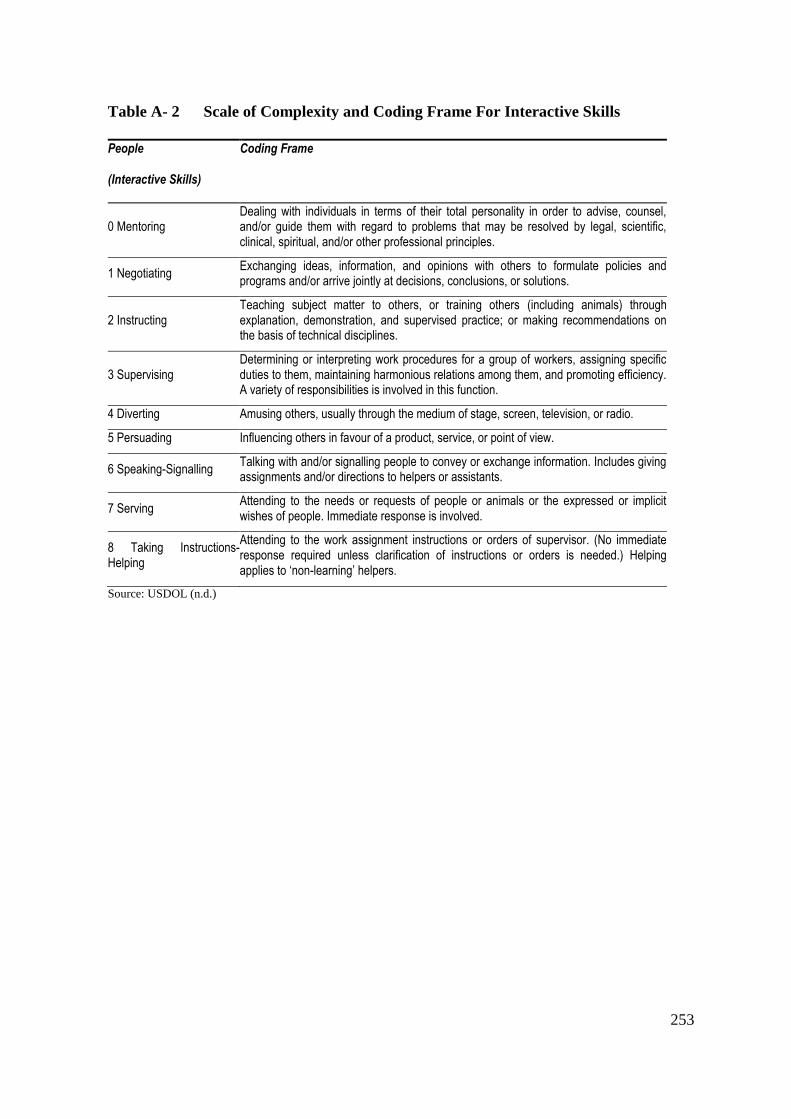
253
Table A- 2 Scale of Complexity and Coding Frame For Interactive Skills
People
(Interactive Skills)
Coding Frame
0 Mentoring Dealing with individuals in terms of their total personality in order to advise, counsel, and/or guide them with regard to problems that may be resolved by legal, scientific, clinical, spiritual, and/or other professional principles.
1 Negotiating Exchanging ideas, information, and opinions with others to formulate policies and programs and/or arrive jointly at decisions, conclusions, or solutions.
2 Instructing Teaching subject matter to others, or training others (including animals) through explanation, demonstration, and supervised practice; or making recommendations on the basis of technical disciplines.
3 Supervising Determining or interpreting work procedures for a group of workers, assigning specific duties to them, maintaining harmonious relations among them, and promoting efficiency. A variety of responsibilities is involved in this function.
4 Diverting Amusing others, usually through the medium of stage, screen, television, or radio.
5 Persuading Influencing others in favour of a product, service, or point of view.
6 Speaking-Signalling Talking with and/or signalling people to convey or exchange information. Includes giving assignments and/or directions to helpers or assistants.
7 Serving Attending to the needs or requests of people or animals or the expressed or implicit wishes of people. Immediate response is involved.
8 Taking Instructions-Helping
Attending to the work assignment instructions or orders of supervisor. (No immediate response required unless clarification of instructions or orders is needed.) Helping applies to ‘non-learning’ helpers.
Source: USDOL (n.d.)
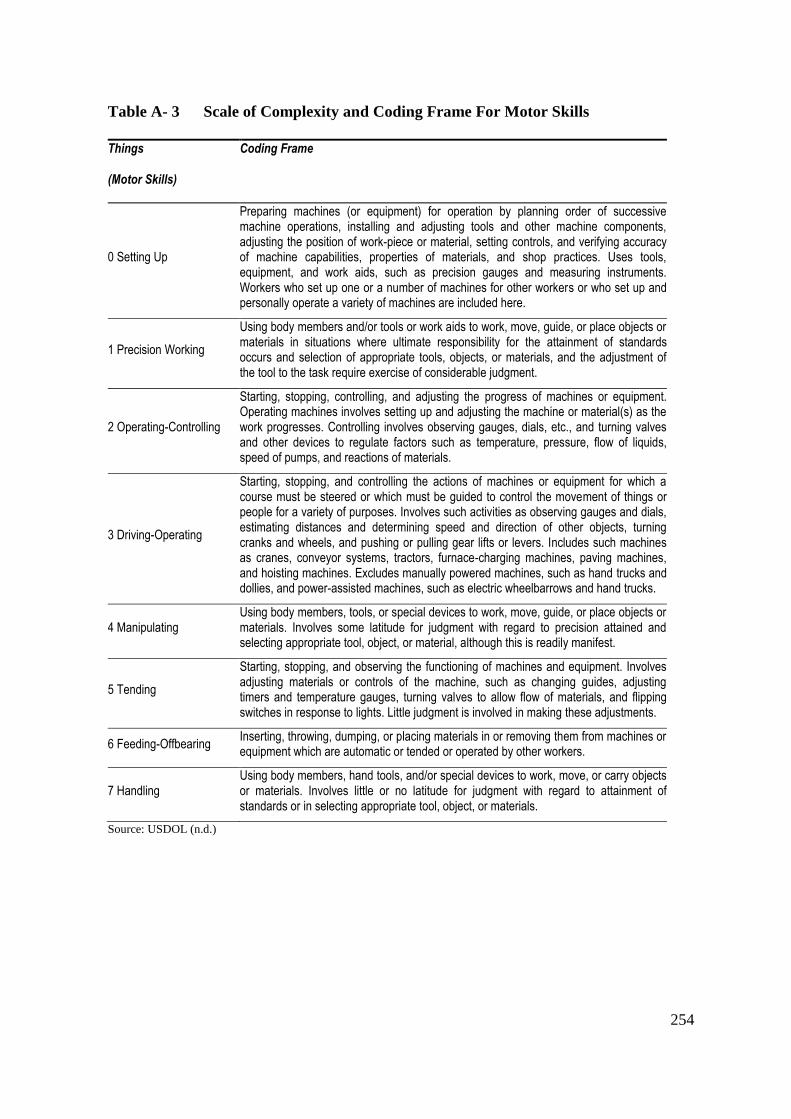
254
Table A- 3 Scale of Complexity and Coding Frame For Motor Skills
Things
(Motor Skills)
Coding Frame
0 Setting Up
Preparing machines (or equipment) for operation by planning order of successive machine operations, installing and adjusting tools and other machine components, adjusting the position of work-piece or material, setting controls, and verifying accuracy of machine capabilities, properties of materials, and shop practices. Uses tools, equipment, and work aids, such as precision gauges and measuring instruments. Workers who set up one or a number of machines for other workers or who set up and personally operate a variety of machines are included here.
1 Precision Working
Using body members and/or tools or work aids to work, move, guide, or place objects or materials in situations where ultimate responsibility for the attainment of standards occurs and selection of appropriate tools, objects, or materials, and the adjustment of the tool to the task require exercise of considerable judgment.
2 Operating-Controlling
Starting, stopping, controlling, and adjusting the progress of machines or equipment. Operating machines involves setting up and adjusting the machine or material(s) as the work progresses. Controlling involves observing gauges, dials, etc., and turning valves and other devices to regulate factors such as temperature, pressure, flow of liquids, speed of pumps, and reactions of materials.
3 Driving-Operating
Starting, stopping, and controlling the actions of machines or equipment for which a course must be steered or which must be guided to control the movement of things or people for a variety of purposes. Involves such activities as observing gauges and dials, estimating distances and determining speed and direction of other objects, turning cranks and wheels, and pushing or pulling gear lifts or levers. Includes such machines as cranes, conveyor systems, tractors, furnace-charging machines, paving machines, and hoisting machines. Excludes manually powered machines, such as hand trucks and dollies, and power-assisted machines, such as electric wheelbarrows and hand trucks.
4 Manipulating Using body members, tools, or special devices to work, move, guide, or place objects or materials. Involves some latitude for judgment with regard to precision attained and selecting appropriate tool, object, or material, although this is readily manifest.
5 Tending
Starting, stopping, and observing the functioning of machines and equipment. Involves adjusting materials or controls of the machine, such as changing guides, adjusting timers and temperature gauges, turning valves to allow flow of materials, and flipping switches in response to lights. Little judgment is involved in making these adjustments.
6 Feeding-Offbearing Inserting, throwing, dumping, or placing materials in or removing them from machines or equipment which are automatic or tended or operated by other workers.
7 Handling Using body members, hand tools, and/or special devices to work, move, or carry objects or materials. Involves little or no latitude for judgment with regard to attainment of standards or in selecting appropriate tool, object, or materials.
Source: USDOL (n.d.)
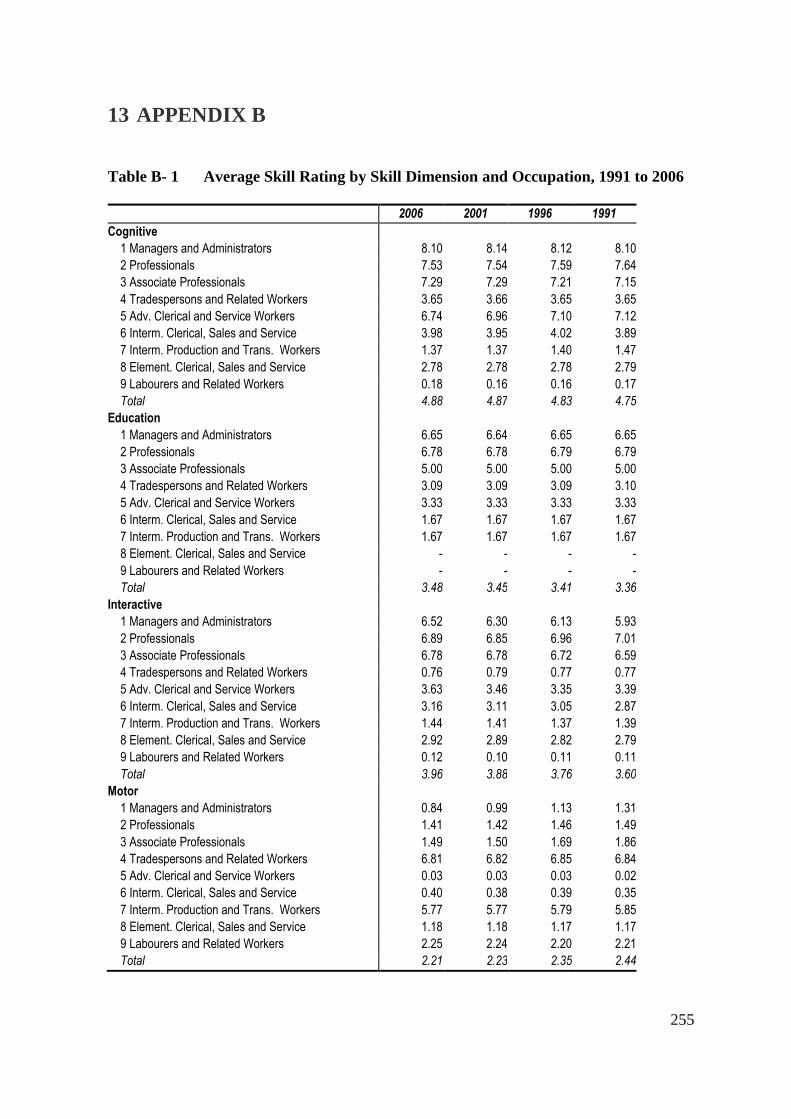
255
13 APPENDIX B
Table B- 1 Average Skill Rating by Skill Dimension and Occupation, 1991 to 2006
2006 2001 1996 1991
Cognitive
1 Managers and Administrators 8.10 8.14 8.12 8.10
2 Professionals 7.53 7.54 7.59 7.64
3 Associate Professionals 7.29 7.29 7.21 7.15
4 Tradespersons and Related Workers 3.65 3.66 3.65 3.65
5 Adv. Clerical and Service Workers 6.74 6.96 7.10 7.12
6 Interm. Clerical, Sales and Service 3.98 3.95 4.02 3.89
7 Interm. Production and Trans. Workers 1.37 1.37 1.40 1.47
8 Element. Clerical, Sales and Service 2.78 2.78 2.78 2.79
9 Labourers and Related Workers 0.18 0.16 0.16 0.17
Total 4.88 4.87 4.83 4.75
Education
1 Managers and Administrators 6.65 6.64 6.65 6.65
2 Professionals 6.78 6.78 6.79 6.79
3 Associate Professionals 5.00 5.00 5.00 5.00
4 Tradespersons and Related Workers 3.09 3.09 3.09 3.10
5 Adv. Clerical and Service Workers 3.33 3.33 3.33 3.33
6 Interm. Clerical, Sales and Service 1.67 1.67 1.67 1.67
7 Interm. Production and Trans. Workers 1.67 1.67 1.67 1.67
8 Element. Clerical, Sales and Service - - - -
9 Labourers and Related Workers - - - -
Total 3.48 3.45 3.41 3.36
Interactive
1 Managers and Administrators 6.52 6.30 6.13 5.93
2 Professionals 6.89 6.85 6.96 7.01
3 Associate Professionals 6.78 6.78 6.72 6.59
4 Tradespersons and Related Workers 0.76 0.79 0.77 0.77
5 Adv. Clerical and Service Workers 3.63 3.46 3.35 3.39
6 Interm. Clerical, Sales and Service 3.16 3.11 3.05 2.87
7 Interm. Production and Trans. Workers 1.44 1.41 1.37 1.39
8 Element. Clerical, Sales and Service 2.92 2.89 2.82 2.79
9 Labourers and Related Workers 0.12 0.10 0.11 0.11
Total 3.96 3.88 3.76 3.60
Motor
1 Managers and Administrators 0.84 0.99 1.13 1.31
2 Professionals 1.41 1.42 1.46 1.49
3 Associate Professionals 1.49 1.50 1.69 1.86
4 Tradespersons and Related Workers 6.81 6.82 6.85 6.84
5 Adv. Clerical and Service Workers 0.03 0.03 0.03 0.02
6 Interm. Clerical, Sales and Service 0.40 0.38 0.39 0.35
7 Interm. Production and Trans. Workers 5.77 5.77 5.79 5.85
8 Element. Clerical, Sales and Service 1.18 1.18 1.17 1.17
9 Labourers and Related Workers 2.25 2.24 2.20 2.21
Total 2.21 2.23 2.35 2.44
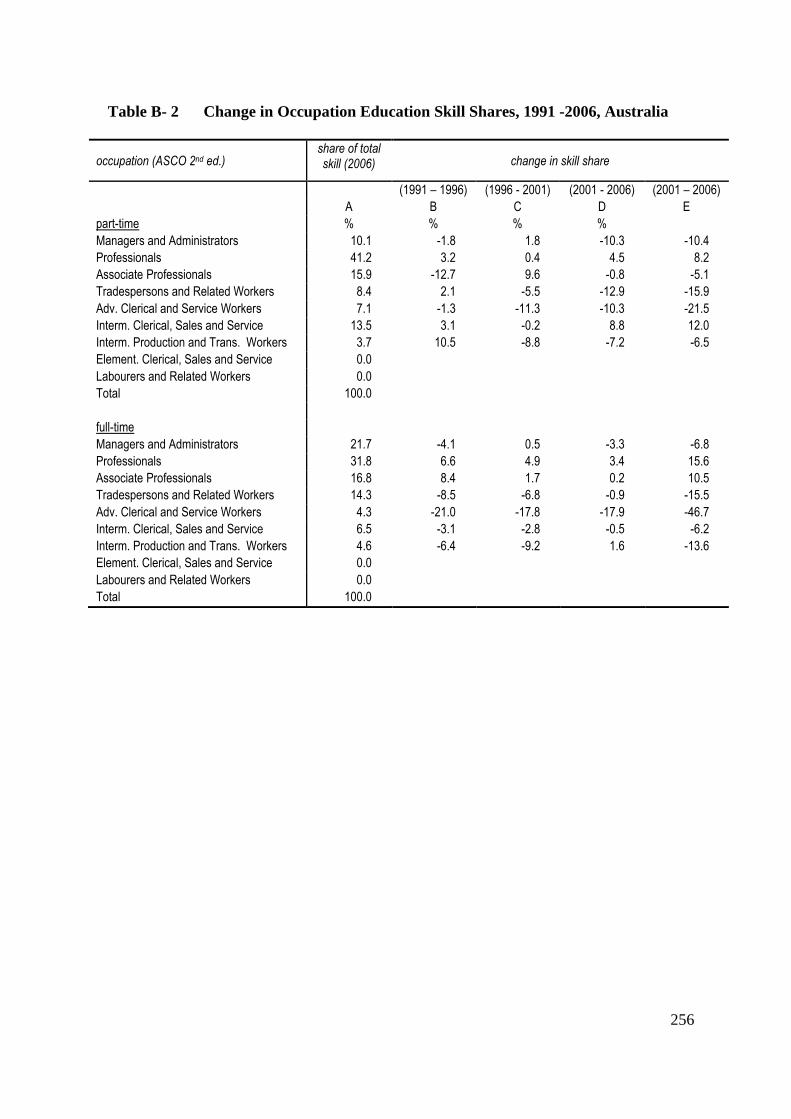
256
Table B- 2 Change in Occupation Education Skill Shares, 1991 -2006, Australia
occupation (ASCO 2nd ed.) share of total skill (2006) change in skill share
(1991 – 1996) (1996 - 2001) (2001 - 2006) (2001 – 2006)
A B C D E
part-time % % % %
Managers and Administrators 10.1 -1.8 1.8 -10.3 -10.4
Professionals 41.2 3.2 0.4 4.5 8.2
Associate Professionals 15.9 -12.7 9.6 -0.8 -5.1
Tradespersons and Related Workers 8.4 2.1 -5.5 -12.9 -15.9
Adv. Clerical and Service Workers 7.1 -1.3 -11.3 -10.3 -21.5
Interm. Clerical, Sales and Service 13.5 3.1 -0.2 8.8 12.0
Interm. Production and Trans. Workers 3.7 10.5 -8.8 -7.2 -6.5
Element. Clerical, Sales and Service 0.0
Labourers and Related Workers 0.0
Total 100.0
full-time
Managers and Administrators 21.7 -4.1 0.5 -3.3 -6.8
Professionals 31.8 6.6 4.9 3.4 15.6
Associate Professionals 16.8 8.4 1.7 0.2 10.5
Tradespersons and Related Workers 14.3 -8.5 -6.8 -0.9 -15.5
Adv. Clerical and Service Workers 4.3 -21.0 -17.8 -17.9 -46.7
Interm. Clerical, Sales and Service 6.5 -3.1 -2.8 -0.5 -6.2
Interm. Production and Trans. Workers 4.6 -6.4 -9.2 1.6 -13.6
Element. Clerical, Sales and Service 0.0
Labourers and Related Workers 0.0
Total 100.0
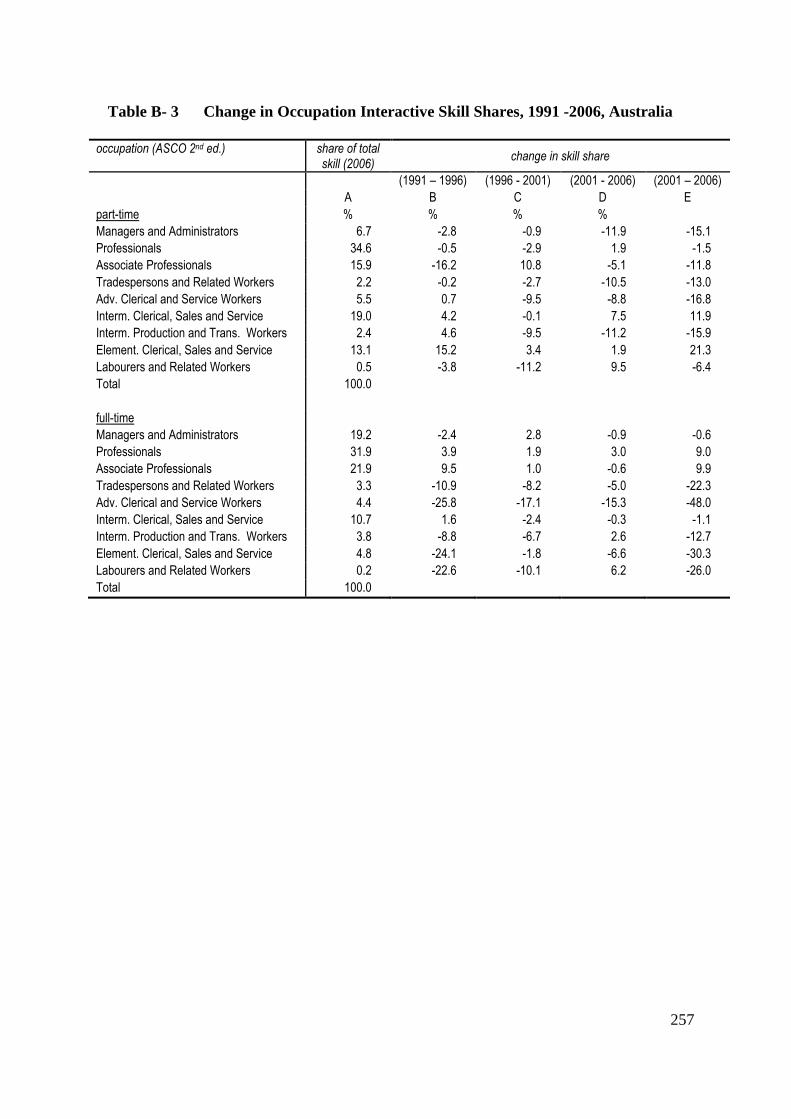
257
Table B- 3 Change in Occupation Interactive Skill Shares, 1991 -2006, Australia
occupation (ASCO 2nd ed.) share of total skill (2006)
change in skill share
(1991 – 1996) (1996 - 2001) (2001 - 2006) (2001 – 2006)
A B C D E
part-time % % % %
Managers and Administrators 6.7 -2.8 -0.9 -11.9 -15.1
Professionals 34.6 -0.5 -2.9 1.9 -1.5
Associate Professionals 15.9 -16.2 10.8 -5.1 -11.8
Tradespersons and Related Workers 2.2 -0.2 -2.7 -10.5 -13.0
Adv. Clerical and Service Workers 5.5 0.7 -9.5 -8.8 -16.8
Interm. Clerical, Sales and Service 19.0 4.2 -0.1 7.5 11.9
Interm. Production and Trans. Workers 2.4 4.6 -9.5 -11.2 -15.9
Element. Clerical, Sales and Service 13.1 15.2 3.4 1.9 21.3
Labourers and Related Workers 0.5 -3.8 -11.2 9.5 -6.4
Total 100.0
full-time
Managers and Administrators 19.2 -2.4 2.8 -0.9 -0.6
Professionals 31.9 3.9 1.9 3.0 9.0
Associate Professionals 21.9 9.5 1.0 -0.6 9.9
Tradespersons and Related Workers 3.3 -10.9 -8.2 -5.0 -22.3
Adv. Clerical and Service Workers 4.4 -25.8 -17.1 -15.3 -48.0
Interm. Clerical, Sales and Service 10.7 1.6 -2.4 -0.3 -1.1
Interm. Production and Trans. Workers 3.8 -8.8 -6.7 2.6 -12.7
Element. Clerical, Sales and Service 4.8 -24.1 -1.8 -6.6 -30.3
Labourers and Related Workers 0.2 -22.6 -10.1 6.2 -26.0
Total 100.0
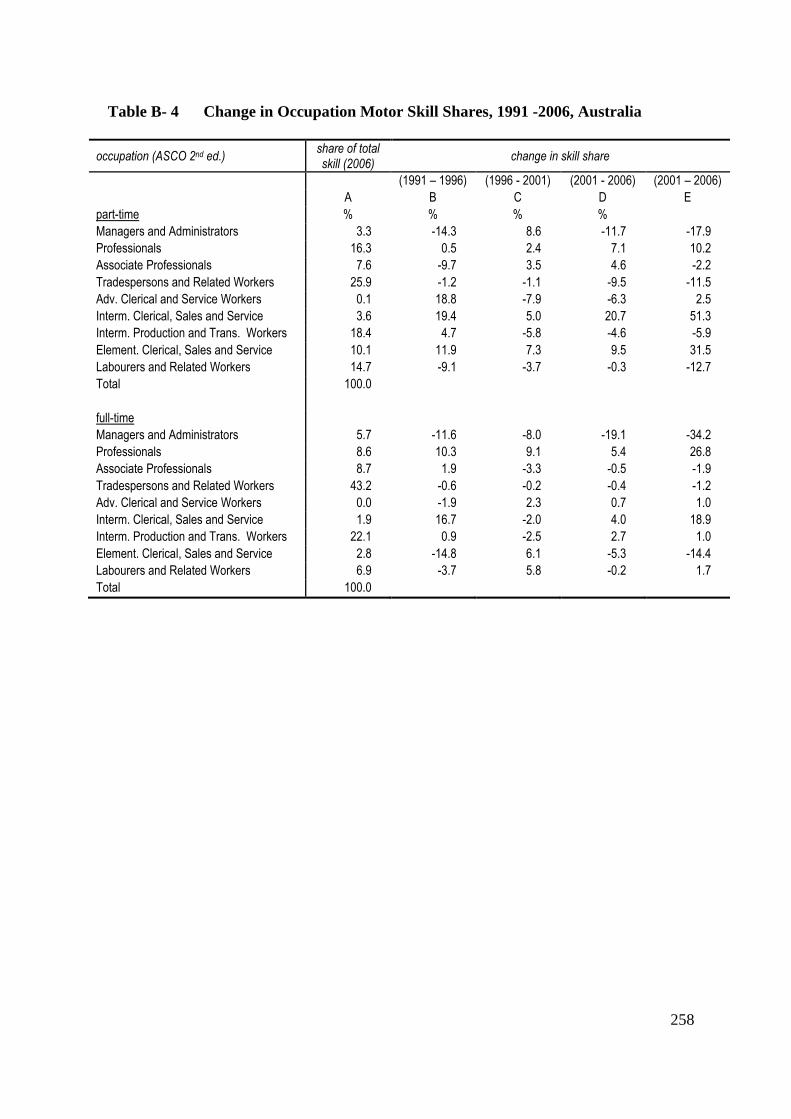
258
Table B- 4 Change in Occupation Motor Skill Shares, 1991 -2006, Australia
occupation (ASCO 2nd ed.) share of total skill (2006)
change in skill share
(1991 – 1996) (1996 - 2001) (2001 - 2006) (2001 – 2006)
A B C D E
part-time % % % %
Managers and Administrators 3.3 -14.3 8.6 -11.7 -17.9
Professionals 16.3 0.5 2.4 7.1 10.2
Associate Professionals 7.6 -9.7 3.5 4.6 -2.2
Tradespersons and Related Workers 25.9 -1.2 -1.1 -9.5 -11.5
Adv. Clerical and Service Workers 0.1 18.8 -7.9 -6.3 2.5
Interm. Clerical, Sales and Service 3.6 19.4 5.0 20.7 51.3
Interm. Production and Trans. Workers 18.4 4.7 -5.8 -4.6 -5.9
Element. Clerical, Sales and Service 10.1 11.9 7.3 9.5 31.5
Labourers and Related Workers 14.7 -9.1 -3.7 -0.3 -12.7
Total 100.0
full-time
Managers and Administrators 5.7 -11.6 -8.0 -19.1 -34.2
Professionals 8.6 10.3 9.1 5.4 26.8
Associate Professionals 8.7 1.9 -3.3 -0.5 -1.9
Tradespersons and Related Workers 43.2 -0.6 -0.2 -0.4 -1.2
Adv. Clerical and Service Workers 0.0 -1.9 2.3 0.7 1.0
Interm. Clerical, Sales and Service 1.9 16.7 -2.0 4.0 18.9
Interm. Production and Trans. Workers 22.1 0.9 -2.5 2.7 1.0
Element. Clerical, Sales and Service 2.8 -14.8 6.1 -5.3 -14.4
Labourers and Related Workers 6.9 -3.7 5.8 -0.2 1.7
Total 100.0
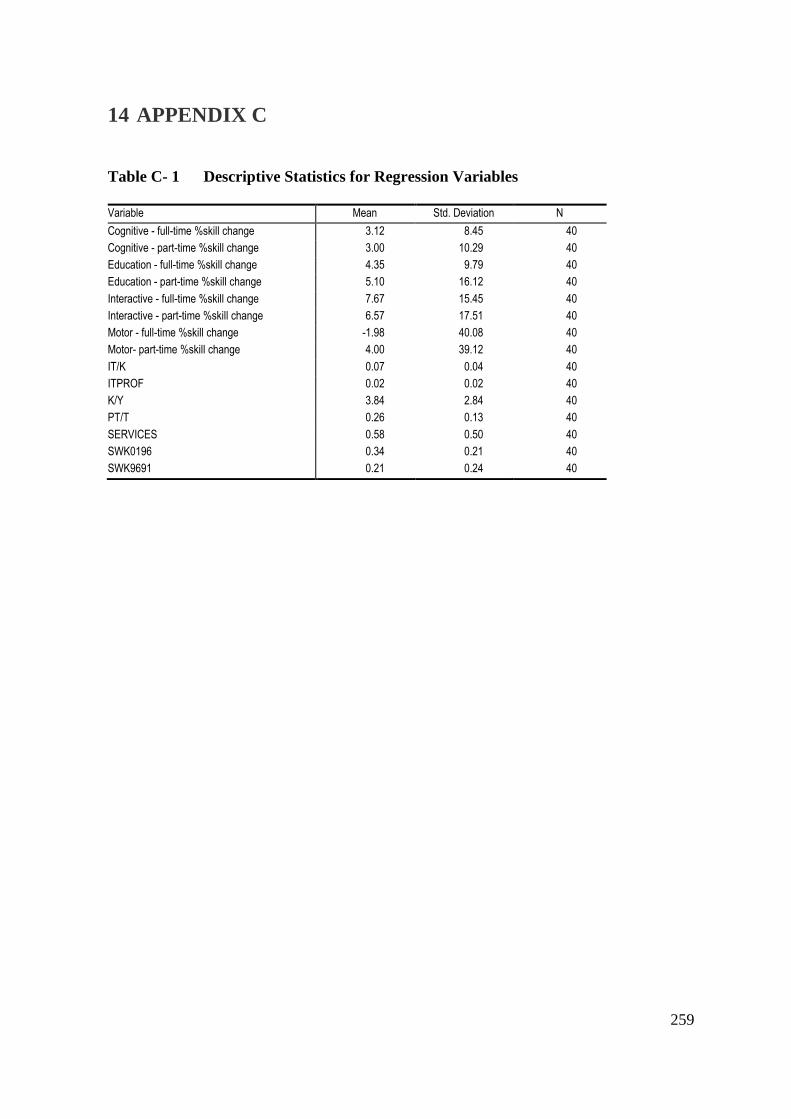
259
14 APPENDIX C
Table C- 1 Descriptive Statistics for Regression Variables
Variable Mean Std. Deviation N
Cognitive - full-time %skill change 3.12 8.45 40
Cognitive - part-time %skill change 3.00 10.29 40
Education - full-time %skill change 4.35 9.79 40
Education - part-time %skill change 5.10 16.12 40
Interactive - full-time %skill change 7.67 15.45 40
Interactive - part-time %skill change 6.57 17.51 40
Motor - full-time %skill change -1.98 40.08 40
Motor- part-time %skill change 4.00 39.12 40
IT/K 0.07 0.04 40
ITPROF 0.02 0.02 40
K/Y 3.84 2.84 40
PT/T 0.26 0.13 40
SERVICES 0.58 0.50 40
SWK0196 0.34 0.21 40
SWK9691 0.21 0.24 40
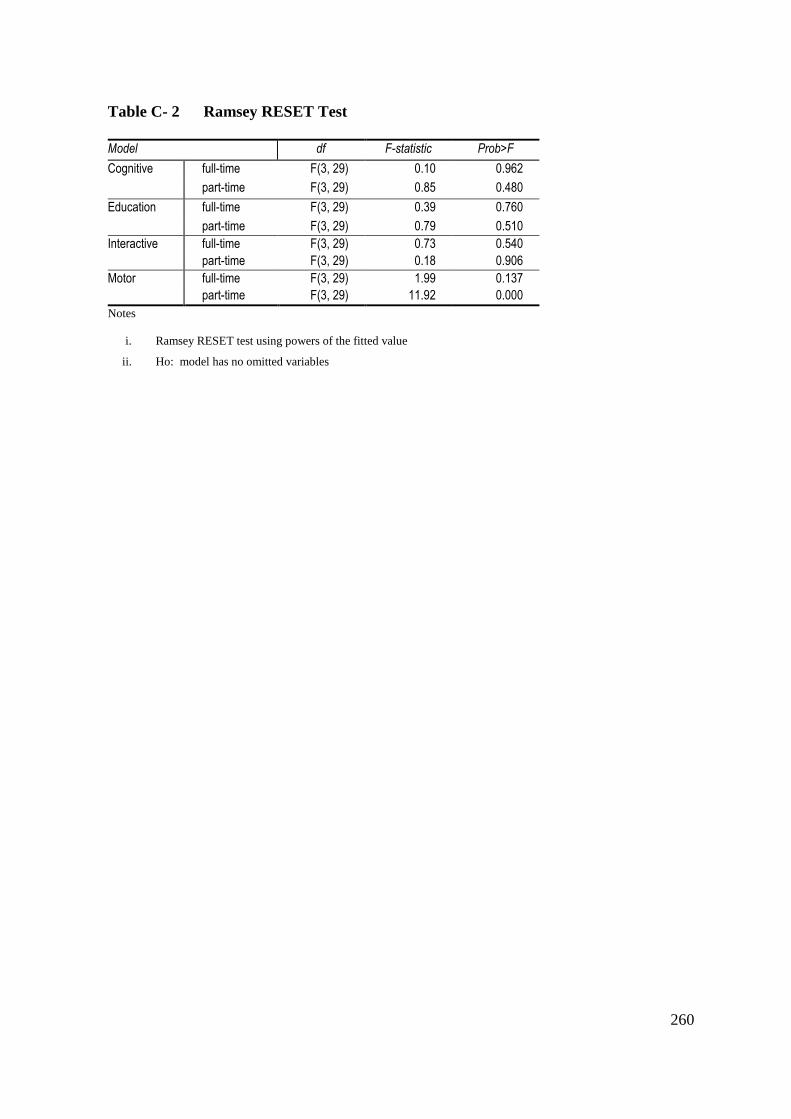
260
Table C- 2 Ramsey RESET Test
Model df F-statistic Prob>F
Cognitive full-time F(3, 29) 0.10 0.962
part-time F(3, 29) 0.85 0.480
Education full-time F(3, 29) 0.39 0.760
part-time F(3, 29) 0.79 0.510
Interactive full-time F(3, 29) 0.73 0.540
part-time F(3, 29) 0.18 0.906
Motor full-time F(3, 29) 1.99 0.137
part-time F(3, 29) 11.92 0.000
Notes
i. Ramsey RESET test using powers of the fitted value
ii. Ho: model has no omitted variables
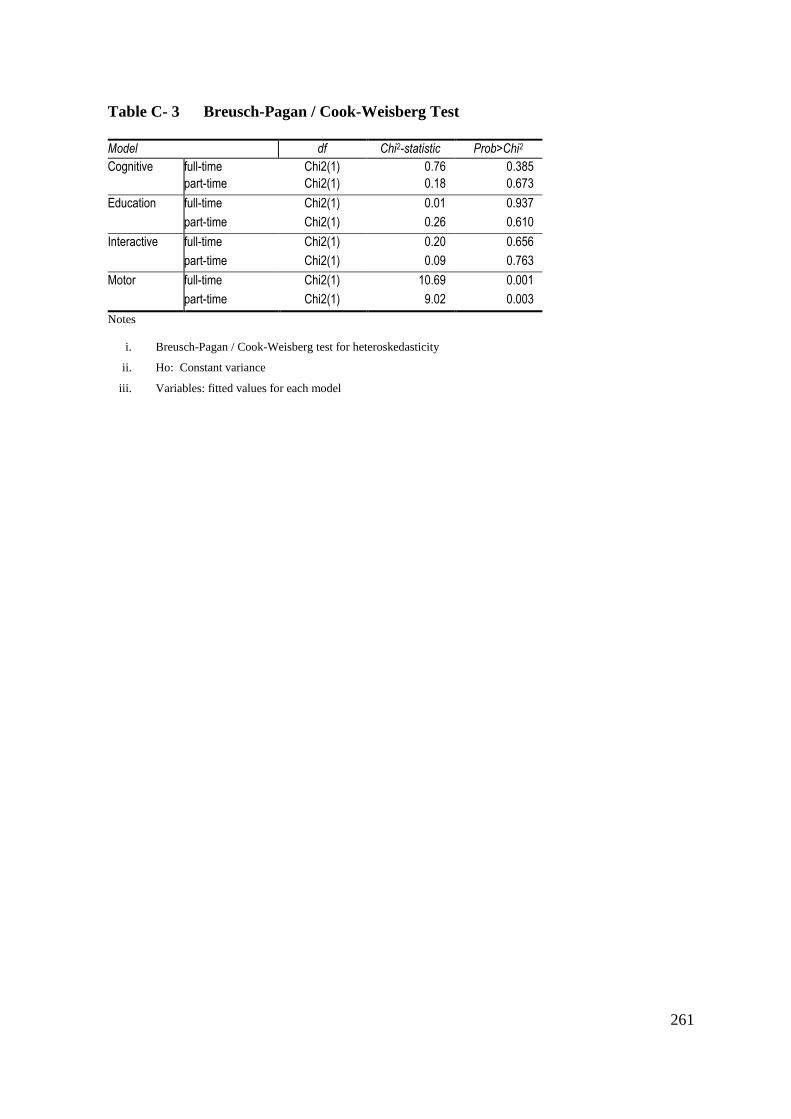
261
Table C- 3 Breusch-Pagan / Cook-Weisberg Test
Model df Chi2-statistic Prob>Chi2
Cognitive full-time Chi2(1) 0.76 0.385
part-time Chi2(1) 0.18 0.673
Education full-time Chi2(1) 0.01 0.937
part-time Chi2(1) 0.26 0.610
Interactive full-time Chi2(1) 0.20 0.656
part-time Chi2(1) 0.09 0.763
Motor full-time Chi2(1) 10.69 0.001
part-time Chi2(1) 9.02 0.003
Notes
i. Breusch-Pagan / Cook-Weisberg test for heteroskedasticity
ii. Ho: Constant variance
iii. Variables: fitted values for each model
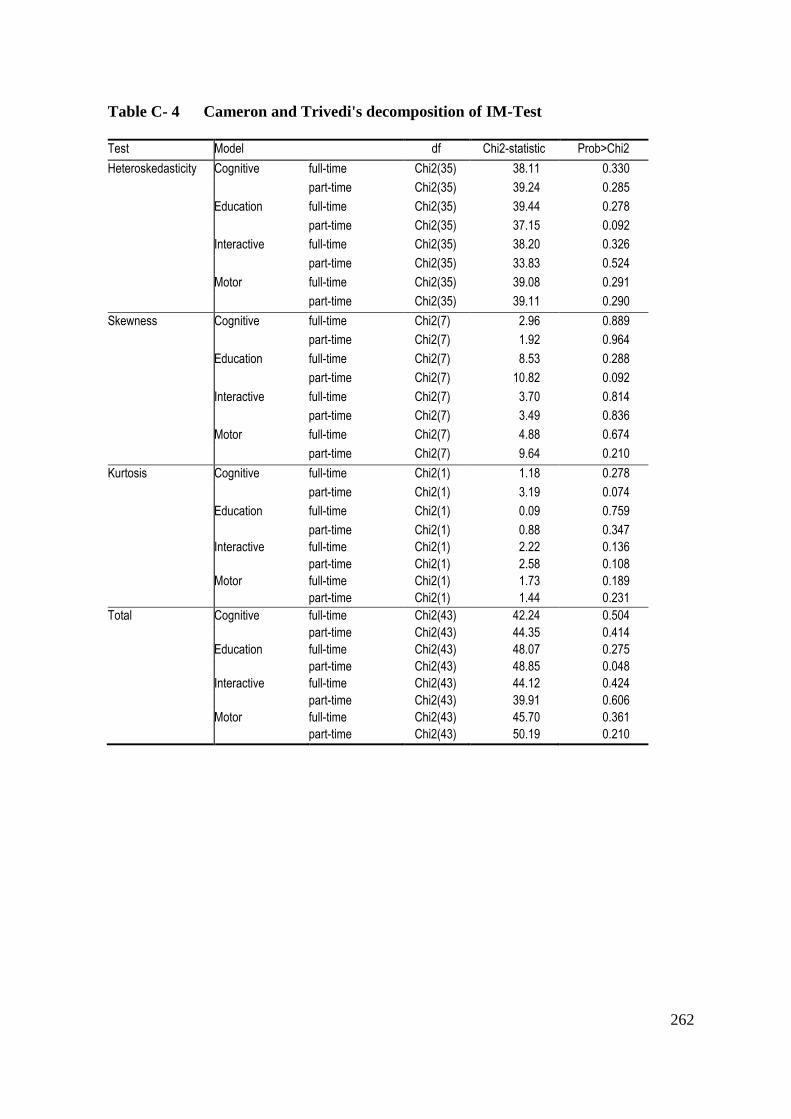
262
Table C- 4 Cameron and Trivedi's decomposition of IM-Test
Test Model df Chi2-statistic Prob>Chi2
Heteroskedasticity Cognitive full-time Chi2(35) 38.11 0.330
part-time Chi2(35) 39.24 0.285
Education full-time Chi2(35) 39.44 0.278
part-time Chi2(35) 37.15 0.092
Interactive full-time Chi2(35) 38.20 0.326
part-time Chi2(35) 33.83 0.524
Motor full-time Chi2(35) 39.08 0.291
part-time Chi2(35) 39.11 0.290
Skewness Cognitive full-time Chi2(7) 2.96 0.889
part-time Chi2(7) 1.92 0.964
Education full-time Chi2(7) 8.53 0.288
part-time Chi2(7) 10.82 0.092
Interactive full-time Chi2(7) 3.70 0.814
part-time Chi2(7) 3.49 0.836
Motor full-time Chi2(7) 4.88 0.674
part-time Chi2(7) 9.64 0.210
Kurtosis Cognitive full-time Chi2(1) 1.18 0.278
part-time Chi2(1) 3.19 0.074
Education full-time Chi2(1) 0.09 0.759
part-time Chi2(1) 0.88 0.347
Interactive full-time Chi2(1) 2.22 0.136
part-time Chi2(1) 2.58 0.108
Motor full-time Chi2(1) 1.73 0.189
part-time Chi2(1) 1.44 0.231
Total Cognitive full-time Chi2(43) 42.24 0.504
part-time Chi2(43) 44.35 0.414
Education full-time Chi2(43) 48.07 0.275
part-time Chi2(43) 48.85 0.048
Interactive full-time Chi2(43) 44.12 0.424
part-time Chi2(43) 39.91 0.606
Motor full-time Chi2(43) 45.70 0.361
part-time Chi2(43) 50.19 0.210
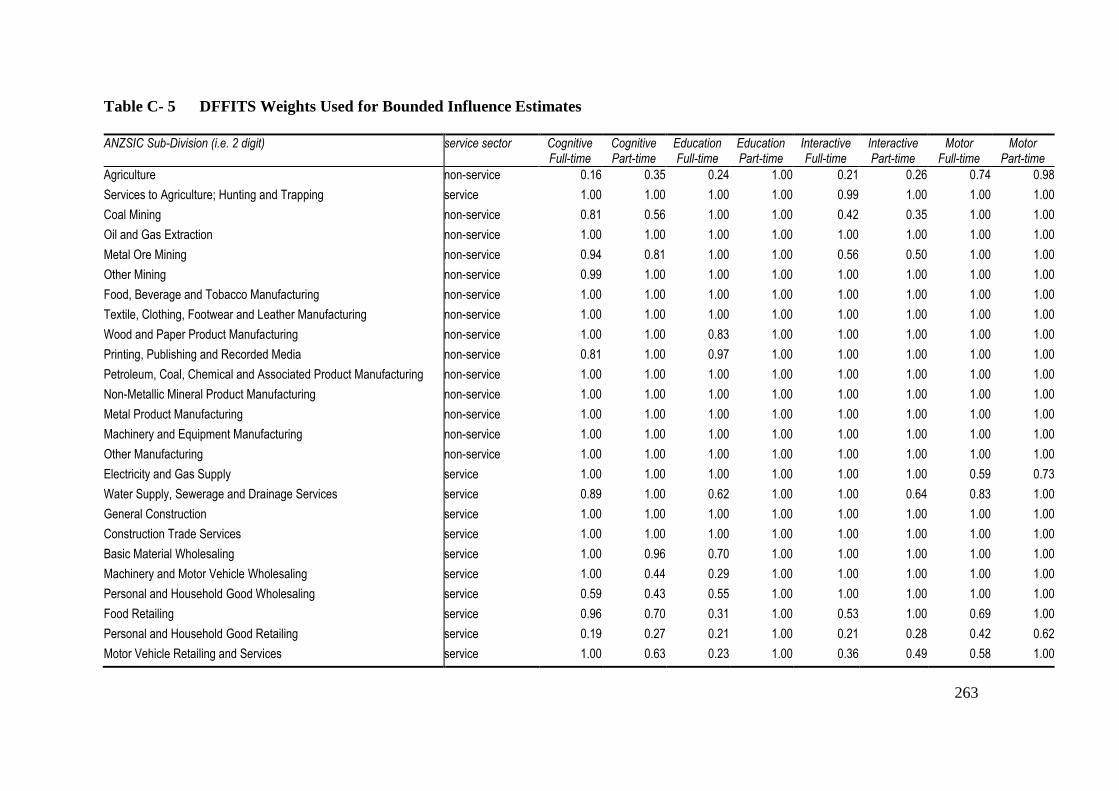
263
Table C- 5 DFFITS Weights Used for Bounded Influence Estimates
ANZSIC Sub-Division (i.e. 2 digit) service sector Cognitive Full-time
Cognitive Part-time
Education Full-time
Education Part-time
Interactive Full-time
Interactive Part-time
Motor Full-time
Motor Part-time
Agriculture non-service 0.16 0.35 0.24 1.00 0.21 0.26 0.74 0.98
Services to Agriculture; Hunting and Trapping service 1.00 1.00 1.00 1.00 0.99 1.00 1.00 1.00
Coal Mining non-service 0.81 0.56 1.00 1.00 0.42 0.35 1.00 1.00
Oil and Gas Extraction non-service 1.00 1.00 1.00 1.00 1.00 1.00 1.00 1.00
Metal Ore Mining non-service 0.94 0.81 1.00 1.00 0.56 0.50 1.00 1.00
Other Mining non-service 0.99 1.00 1.00 1.00 1.00 1.00 1.00 1.00
Food, Beverage and Tobacco Manufacturing non-service 1.00 1.00 1.00 1.00 1.00 1.00 1.00 1.00
Textile, Clothing, Footwear and Leather Manufacturing non-service 1.00 1.00 1.00 1.00 1.00 1.00 1.00 1.00
Wood and Paper Product Manufacturing non-service 1.00 1.00 0.83 1.00 1.00 1.00 1.00 1.00
Printing, Publishing and Recorded Media non-service 0.81 1.00 0.97 1.00 1.00 1.00 1.00 1.00
Petroleum, Coal, Chemical and Associated Product Manufacturing non-service 1.00 1.00 1.00 1.00 1.00 1.00 1.00 1.00
Non-Metallic Mineral Product Manufacturing non-service 1.00 1.00 1.00 1.00 1.00 1.00 1.00 1.00
Metal Product Manufacturing non-service 1.00 1.00 1.00 1.00 1.00 1.00 1.00 1.00
Machinery and Equipment Manufacturing non-service 1.00 1.00 1.00 1.00 1.00 1.00 1.00 1.00
Other Manufacturing non-service 1.00 1.00 1.00 1.00 1.00 1.00 1.00 1.00
Electricity and Gas Supply service 1.00 1.00 1.00 1.00 1.00 1.00 0.59 0.73
Water Supply, Sewerage and Drainage Services service 0.89 1.00 0.62 1.00 1.00 0.64 0.83 1.00
General Construction service 1.00 1.00 1.00 1.00 1.00 1.00 1.00 1.00
Construction Trade Services service 1.00 1.00 1.00 1.00 1.00 1.00 1.00 1.00
Basic Material Wholesaling service 1.00 0.96 0.70 1.00 1.00 1.00 1.00 1.00
Machinery and Motor Vehicle Wholesaling service 1.00 0.44 0.29 1.00 1.00 1.00 1.00 1.00
Personal and Household Good Wholesaling service 0.59 0.43 0.55 1.00 1.00 1.00 1.00 1.00
Food Retailing service 0.96 0.70 0.31 1.00 0.53 1.00 0.69 1.00
Personal and Household Good Retailing service 0.19 0.27 0.21 1.00 0.21 0.28 0.42 0.62
Motor Vehicle Retailing and Services service 1.00 0.63 0.23 1.00 0.36 0.49 0.58 1.00
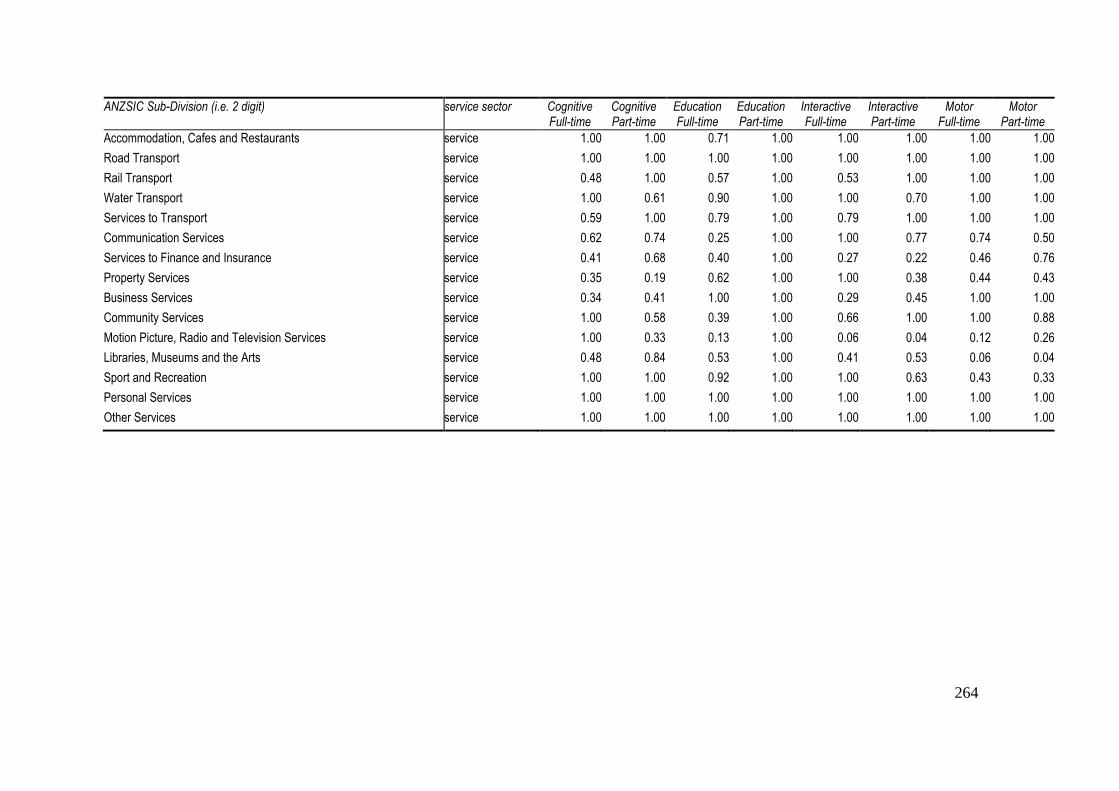
264
ANZSIC Sub-Division (i.e. 2 digit) service sector Cognitive Full-time
Cognitive Part-time
Education Full-time
Education Part-time
Interactive Full-time
Interactive Part-time
Motor Full-time
Motor Part-time
Accommodation, Cafes and Restaurants service 1.00 1.00 0.71 1.00 1.00 1.00 1.00 1.00
Road Transport service 1.00 1.00 1.00 1.00 1.00 1.00 1.00 1.00
Rail Transport service 0.48 1.00 0.57 1.00 0.53 1.00 1.00 1.00
Water Transport service 1.00 0.61 0.90 1.00 1.00 0.70 1.00 1.00
Services to Transport service 0.59 1.00 0.79 1.00 0.79 1.00 1.00 1.00
Communication Services service 0.62 0.74 0.25 1.00 1.00 0.77 0.74 0.50
Services to Finance and Insurance service 0.41 0.68 0.40 1.00 0.27 0.22 0.46 0.76
Property Services service 0.35 0.19 0.62 1.00 1.00 0.38 0.44 0.43
Business Services service 0.34 0.41 1.00 1.00 0.29 0.45 1.00 1.00
Community Services service 1.00 0.58 0.39 1.00 0.66 1.00 1.00 0.88
Motion Picture, Radio and Television Services service 1.00 0.33 0.13 1.00 0.06 0.04 0.12 0.26
Libraries, Museums and the Arts service 0.48 0.84 0.53 1.00 0.41 0.53 0.06 0.04
Sport and Recreation service 1.00 1.00 0.92 1.00 1.00 0.63 0.43 0.33
Personal Services service 1.00 1.00 1.00 1.00 1.00 1.00 1.00 1.00
Other Services service 1.00 1.00 1.00 1.00 1.00 1.00 1.00 1.00
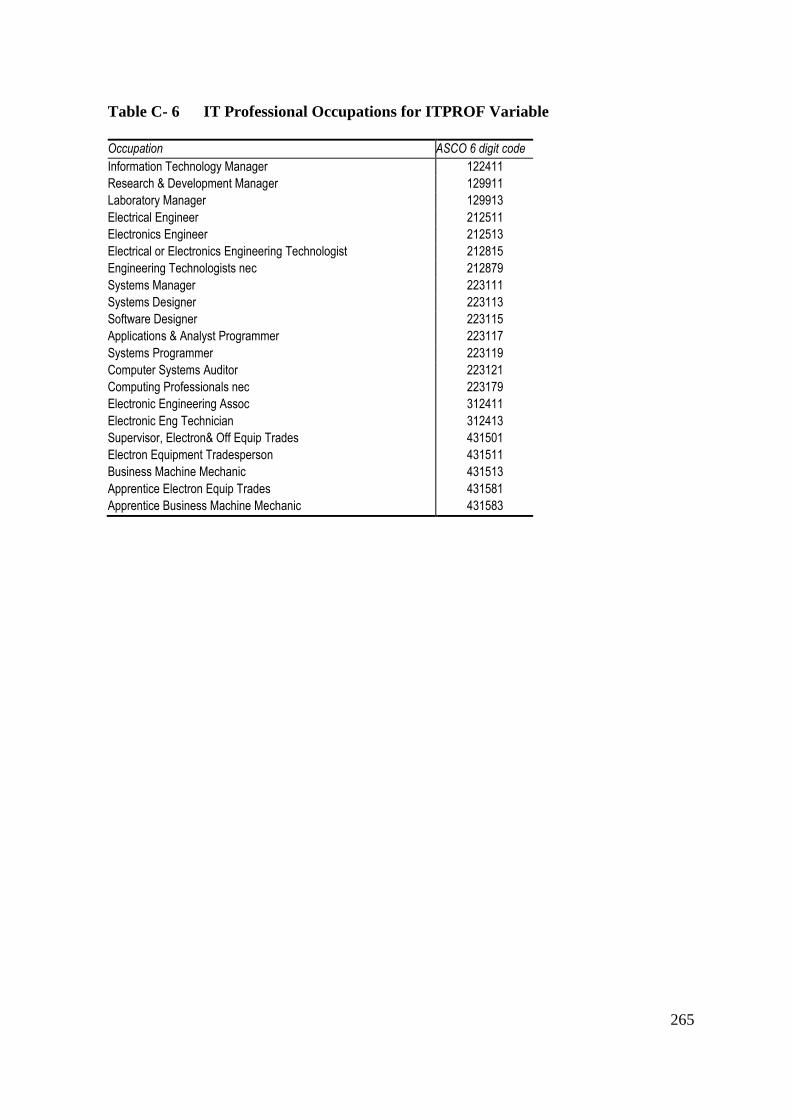
265
Table C- 6 IT Professional Occupations for ITPROF Variable
Occupation ASCO 6 digit code
Information Technology Manager 122411
Research & Development Manager 129911
Laboratory Manager 129913
Electrical Engineer 212511
Electronics Engineer 212513
Electrical or Electronics Engineering Technologist 212815
Engineering Technologists nec 212879
Systems Manager 223111
Systems Designer 223113
Software Designer 223115
Applications & Analyst Programmer 223117
Systems Programmer 223119
Computer Systems Auditor 223121
Computing Professionals nec 223179
Electronic Engineering Assoc 312411
Electronic Eng Technician 312413
Supervisor, Electron& Off Equip Trades 431501
Electron Equipment Tradesperson 431511
Business Machine Mechanic 431513
Apprentice Electron Equip Trades 431581
Apprentice Business Machine Mechanic 431583