structural change and per capita income in nepal ... · structural change and per capita income in...
TRANSCRIPT
Structural Change and Per Capita Income in
Nepal: Empirical Evidences#
Guna Raj Bhatta
Abstract
This paper empirically examines Nepalese economic structure by applying OLS technique on the
annual series of sectoral growth, population and capital related variables ranging from 1975 –
2012. The estimates obtained with due consideration of stationarity of the series including HP
filter revealed that industrial sector is significant to increase per capita income compared to the
agriculture and service sectors in Nepal. Moreover, health as indicated by life expectancy and
population at working age are found to be substantial to increase the income but, education and
capital formation are found insignificant. It is inferred that employment matters for raising per
capita income, requiring employment-led growth rather mere growth of economic sub-sectors.
Hence, it is needed to have balanced contribution of economic sub-sectors and their employment
share to national economy along with healthy workforce to raise the per capita income.
Key Words: Structural Change, Employment, Per Capita Income, Nepalese Economy
JEL Classification: O10, O49, L16, N10
# The earlier version of this paper is available at www.nrb.org.np under NRB Working Paper
series, NRB-WP-23, 2014.
Assistant Director, Nepal Rastra Bank, Research Department, Central Office, Baluwatar,
Kathmandu, Nepal. Email: [email protected], [email protected]
Acknowledgement: I would like to express my sincere thanks to the Editorial Board of NRB
Economic Review for the comments and suggestions.

42 NRB ECONOMIC REVIEW
I. INTRODUCTION
Economic growth of the country is always a major concern worldwide since rise in GDP
is one of the major human welfare indicators. Direct correlation is found between
increased real output and income, with improvements in development factors in the
history (Welker, 2012). Higher GDP growth not only provides better opportunities to
improve access over basic requirements for the livelihood, but also provides more saving
and revenue to the government. Nevertheless, economic transformation from rural
agricultural to modern industrial or service sectors is the fundamental requirement to
achieve high and sustainable growth. This can be said as the rapid and sustainable
economic development in most of the developed as well as emerging economies has been
achieved with the permanent shifts in their economic structure over the long-run. They
have experienced a gradual transformation of the economy from rural subsistent
agriculture to the modern industrial and then ultimately to the service dominant.
Although there are ample resources such as sufficient arable land, natural resources and
labour force, Nepal is still among the poorest countries in the world as the latest human
development index ranked the country 157th out of 187 and the rank for per capita income
is 207th out of 229 countries (based on purchasing power parity). Nevertheless, the rank is
35th in labor force availability and 46
th in percentage of arable land (CIA Fact Book,
2013). Likewise, Nepal is ranked fifth in employees per hectare, requiring 3.6 people to
cultivate one hectare of land.
Economic growth is predominantly determined by the performance of agricultural sector
in Nepal. This sector contributes more than one third to the country's gross domestic
product (GDP) and employs about two-thirds of the total labour force inferring a low
productivity. Moreover, the country experiences a monsoon-based growth as it witnesses
an improved agricultural GDP at the time of favorable rainfall (Acharya & Bhatta, 2013).
With these scenarios, Nepal witnessed a 4 percent growth of the economy on an average
in recent ten years, in which agriculture and industry sectors had grown by 3.3 percent
and 2.7 percent respectively whereas services sector had witnessed a growth of 5.3
percent. The share of agriculture was gradually declining over the study period whilst the
share of services steadily increasing, being more than 50 percent in 2013 and 2014.
However, the industrial share to GDP was found to be increasing until late 1990s and
started declining.
The aforesaid facts and figures clearly depicts Nepalese economy's gradual structural
shift from agro to services sector lead economy. However, problem can be witnessed in
the employment pattern. The agriculture sector contributes only one-third to the economy
but more than 64 percent of the total employment is on this sector. Similarly, the
contribution of service sector to the economy has been growing rapidly but the total
employment share of it is around 15 percent. In this milieu, this paper attempts to
examine the Nepalese economic structure more closely by comparing and contrasting
with the prominent literatures and prescribing some perceived policies for high and
sustainable growth of the economy.

Structural Change and Per Capita Income in Nepal: Empirical Evidences 43
The rest of the paper flows as follows. The next section reviews the prominent literature
of structural change. Section three portrays the structural change of the Nepalese
economy. Data and methodology are discussed in section four. Section five explains the
results and findings and finally section six concludes the paper with some policy
prescriptions for high and sustainable growth.
II. STRUCTURAL CHANGE MODELS AND LITERATURE
The economic structural change is often considered as a permanent shift in the
fundamental structure of an economy, basically an agrarian economy shifts to either
industry or service based. In many countries, it primarily involves a decline in share of
agriculture to the GDP and a rise in share of services (Maddison, 1991; Buera and
Kaboski, 2012). It is believed that without the structural change, modern economic
development is impossible (Kuznets, 1971) which is mostly associated with promising
growth and continuous transformation (Pasinetti, 1981) in the globalized and dynamic
economic system. Although employment shares in manufacturing were previously
thought to be increasing monotonically as countries develop (Uy et. Al., 2013), the rise of
new world economic powers has been primarily determined by the rapid structural
change of their economies, that is, the shift from mining and agriculture to manufacturing
and then to skill and technology-intensive sectors (Olga and Lelio, 2010).
Lewis (1954) emphasizes the need to transform the structure of an economy from low
labour productive agriculture sector to the high labour productive modern industrial
sector. In the least developed countries (LDCs), a large population depends upon
traditional rural subsistence sector with surplus labour and hence, such surplus labour can
be transferred to a highly productive modern sector in the process of development.
Observing the happenings in the United States, Fuchs (1980) emphasized the importance
of services sector in the economy, particularly, the changing patterns of employment,
which grew across western economies as time passed. Likewise, Fuchs (1980) argues that
to augment the contribution of services sector, it is required to increase participation of
females in labor force as working-wives are likely to spend more out of their earnings to
the services compared to males.
Besides the development of primary and secondary sectors, Fisher (1939) advocated
about the emergence of large services sector for the economic progress, also known as
tertiary sector development. Later on, Clark (1940) established the Fisher's theme as a
tertiary sector development model. Fisher-Clark approach of structural transformation
explains that large amount of labour force working in the services sector will lead the
country to the development and high-growth. The model proposes two significant factors
in the emergence of service sector, i.e., high income elasticity of demand and low
productivity of labor in services. Fisher-Clerk analogy is further supported by Cost
Disease Hypothesis of Baumol (1967). This hypothesis argues that there will be shift to
service from manufacturing due to low productivity, less progressiveness, higher costs
and higher relative prices of service compared to manufacturing.

44 NRB ECONOMIC REVIEW
In the stage of economic development, innovation led by dissemination and imitation
seems to be most dominant factor for structural change of the economy (Schumpeter,
1939) and structural changes especially in specific industry are significant determinants
of aggregate income and growth (Pender, 2002). Todays' advanced economies had
followed two most prominent growth strategies, short-run strategy for stimulating growth,
and a medium to long-run strategy to sustain that growth (Ocampo, 2003; Haggard and
Kaufman, 1983).
The emergence of international trade has also shifted the pattern of employment as we
observe the decline in U.S. manufacturing employment as an effect of its trade with
China (Autor, et.al., 2011). In addition, the gain received today by China and India from
the external sector has been realized by the transformation of their economies. If they had
not have emphasized on innovation and change towards industry and services, traditional
garments and agricultural products would not have been sufficient to get advantage of
international trade and investment to their economies (Rodrik, 2007). Nevertheless, the
pattern of structural transformation varies with region, for instance, the path followed by
developed economies and SAARC countries is different being heterogeneity in the
transformation processes (Sawhney, 2010).
III. CHANGES IN ECONOMIC STRUCTURE: GLOBAL AND
NEPALESE SCENARIO
3.1 Global Change in Economic Structure
As discussed earlier in section II, the structure of the advanced economies has a very low
contribution of agriculture sector and predominance of service sector. Depending upon
the individual economy, the contribution of industrial sector to GDP is found less than 50
percent from the beginning of study period, at the middle of agriculture and service.
Likewise, the pattern of employment from agriculture, industry and services are similar in
the contribution to GDP. A significant dominance of service sector in job opportunities
has been observed as compared to the agricultural sector in most of the advanced
economies (Figure 1 and Figure 2).
In emerging economies, share of each sector to the GDP has been oriented to catch the
path of advanced economies, though some countries are still far behind. It can be
identified as a declining share of agriculture and increasing share of services to GDP over
time. But sectoral contribution to employment has yet to be balanced with the
contribution to GDP in these economies. Thus, the structure of developed and emerging
economies shows a similar trend in contribution to GDP and employment, however, the
perfect balance on employment and sectoral share can only be observed in the advanced
economies (Figure 1, Figure 2 Figure 3 and Figure 4). This issue is also discussed on the
trend of Nepal's abut neighbors, India and China in the following section 3.2.

Structural Change and Per Capita Income in Nepal: Empirical Evidences 45
0
50
100
1970 1975 1980 1985 1990 1995 2000 2005 2010
USA: Value Added, % of GDP
Agriculture Industry Services
0
50
100
1980 1985 1990 1995 2000 2005 2010
USA: Sectoral Employment Share, %
Agriculture Industry Services
0
20
40
60
80
1970 1975 1980 1985 1990 1995 2000 2005 2010
Japan: Value Added, % of GDP
Agriculture Industry Services
0
50
100
1980 1985 1990 1995 2000 2005 2010
Japan: Sectoral Employment Share, %
Agriculture Industry Services
Figure 1: Economic Structure and Employment of United States
Figure 2: Economic Structure and Employment of Japan
Data Source: World Development Indicators, World Bank.
Figure 3: Economic Structure and Employment
of Philippines
of PCI
Figure 3: Sectorwise Contribution of GDP to the Economy
Figure 4:Economic Structure and
Employment of Thailand
of PCI
Figure 3: Sectorwise Contribution of GDP to the Economy
Data Source: World Development Indicators, World Bank.
46 NRB ECONOMIC REVIEW
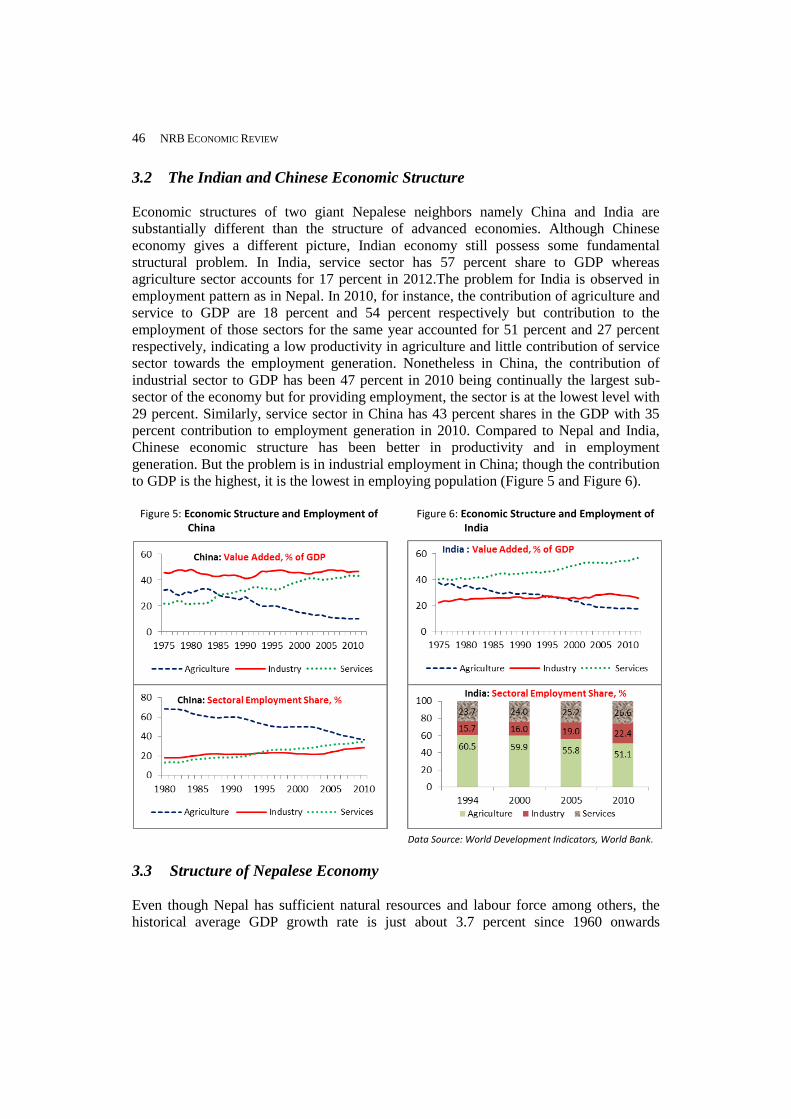
3.2 The Indian and Chinese Economic Structure
Economic structures of two giant Nepalese neighbors namely China and India are
substantially different than the structure of advanced economies. Although Chinese
economy gives a different picture, Indian economy still possess some fundamental
structural problem. In India, service sector has 57 percent share to GDP whereas
agriculture sector accounts for 17 percent in 2012.The problem for India is observed in
employment pattern as in Nepal. In 2010, for instance, the contribution of agriculture and
service to GDP are 18 percent and 54 percent respectively but contribution to the
employment of those sectors for the same year accounted for 51 percent and 27 percent
respectively, indicating a low productivity in agriculture and little contribution of service
sector towards the employment generation. Nonetheless in China, the contribution of
industrial sector to GDP has been 47 percent in 2010 being continually the largest sub-
sector of the economy but for providing employment, the sector is at the lowest level with
29 percent. Similarly, service sector in China has 43 percent shares in the GDP with 35
percent contribution to employment generation in 2010. Compared to Nepal and India,
Chinese economic structure has been better in productivity and in employment
generation. But the problem is in industrial employment in China; though the contribution
to GDP is the highest, it is the lowest in employing population (Figure 5 and Figure 6).
3.3 Structure of Nepalese Economy
Even though Nepal has sufficient natural resources and labour force among others, the
historical average GDP growth rate is just about 3.7 percent since 1960 onwards
Figure 5: Economic Structure and Employment of China
Figure 6: Economic Structure and Employment of India
Data Source: World Development Indicators, World Bank.

Structural Change and Per Capita Income in Nepal: Empirical Evidences 47
(Figure 7). The industrial growth remained more unstable throughout the study period
relative to the growth of agriculture and service (Table 1and Figure 8).
Table 1: Standard Deviations of Nepal's Growth
Sector Full Sample 1991 Onwards
Agriculture 3.3 2.2
Industry 7.2 4.0
Services 3.0 2.3
Aggregate 2.5 1.6
Source: Author's Calculation
According to Nepal Labor Force Survey (NLFS) 1998/99, of the total labour force, 76
percent were engaged in agriculture, 10 percent in industry and 14 percent in service.
After about one decade, as NLFS-2008 presented, 74 percent were in agriculture, 11
percent in industry and 15 percent in services – not much different from 1998/99.
Nevertheless, the share of these three sectors to the GDP had changed over that period. In
1998/99, the contribution of agriculture sector was 38 percent, industry 23 percent and
services 39 percent. The share of service sector in GDP jumped up to 48 percent in
2008/09, while the share of industry declined to 16 percent. The share agriculture
declined marginally to 36 percent in 2008/09. In 2012/13, agriculture sector contributed
34 percent; industry 15 percent and service sector 51 percent. In this way, the
contribution of service sector has been increasing while that of agriculture and industrial
sector has been declining (Figure 9). In short, a gradual change is observed in economic
structure since the share of services sector to GDP exceeded the sum total of agriculture
and industry sectors so far.
However, the major bottleneck in Nepalese economic transformation is employment
pattern. It is believed that increased employment opportunities are the prerequisites for
continued and sustained economic growth. In Nepal, nonetheless, we can observe a
massive underemployment with very low productivity in agriculture. The opposite is the
case of services as the contribution to economy is more than half but it provides
employment for only 15 percent of work force. From the economic sense, however, the
industrial sector is still playing vital role with closer similarities in contribution to both
GDP and employment opportunities (Figure 10).
Figure 7: Real GDP Growth Rate in Nepal
Data Source: World Development Indicators, World Bank.
Figure 8: Sectoral GDP Growth Rate in Nepal
Data Source: World Development Indicators, World Bank

48 NRB ECONOMIC REVIEW
Figure 9: Sectoral Contribution in the GDP in Nepal
Data Source: World Development Indicators, World Bank
IV. DATA AND METHODOLOGY
The paper follows the methodology of Pender (2002) to identify the determinants of
structural change variables with slight modification. As Pender (2002) uses the concept
with dynamic panel data analysis of OECD countries, the same technique has been
adopted here only for Nepalese data to model ordinary least squares (OLS).
Since per capita income of an economy is total production of the country within a year
divided by the total population, factors that may cause to change income can be
hypothesized as:
PCI = f(agri_growth, ind_growth, ser_growth, edu, health, pop, popw, capital, others)…(1)
Here, PCI refers to per capita income, agri_growth, ind_growth and ser_growth is the
growth of three major economic sectors namely, agriculture, industry and service. The
level of education (edu), health condition, total population and working population (pop,
popw), capital injection and other variables are presumed to be the major determinants of
per capita income. More precisely, based on this income hypothesis, the income model
can be estimated as:
… (2)
Where, per capita income (PCI) is the nominal annual US dollar per capita income in
purchasing power parity. Growth rate of share of agriculture, industry and services are
termed as AGRI_CG, IND_CG and SER_CG in the model, which is the percentage
growth of sectoral contribution into the total Nepalese GDP, calculated as follows.
AGRI_CG = [{
1 }
- {
1 }
-1] 1 -1 … (3)
Figure 10: Share of Sectoral Employment in Nepal
Data Source: Nepal Labor Force Survey, 1998/99 and 2008.
76.1 73.9
9.8 10.8
14.1 15.3
0
20
40
60
80
100
1998/99 2008
Agriculture Industry Services
𝑃𝐶𝐼𝑡 = 𝛼 + 𝛽1𝐴𝐺𝑅𝐼_𝐶𝐺𝑡 + 𝛽2 𝐼𝑁𝐷_𝐶𝐺𝑡 + 𝛽3𝑆𝐸𝑅_𝐶𝐺𝑡 + 𝛽4𝐸𝐷𝑈𝑡+ 𝛽5 𝐺𝐹𝐶𝐹𝑡 + 𝛽6𝐿𝐸𝑡 + 𝛽7𝑃𝑂𝑃𝑡 + 𝛽8𝑃𝑂𝑃𝑊𝑡 + 𝜀𝑡
Structural Change and Per Capita Income in Nepal: Empirical Evidences 49
IND_CG = [{
1 }
- {
1 }
-1] 1 -1 … (4)
and
SER_CG =[{
1 }
- {
1 }
-1] 1 -1 … (5)
Life expectancy (LE) is the expected years of life at birth, total population (POP) is the
total number of population in million residing in the country and population at working
age (POPW) is the population in million, with 15 to 64 years. The above data are
obtained from World Bank Database.
Gross fixed capital formation (GFCF) is the annual fixed capital formation in million
rupees, obtained from national accounts statistics published by central bureau of statistics
(CBS). Years of schooling (EDU) is the average year of schooling of working age
population, calculated by multiplying currently available information of enrollment of the
students ranging from primary school to advanced university degree that is obtained from
Economic Survey (Various Editions).
The augmented Dicky-Fuller (ADF) test for unit root has been presented below (Table 2).
Table 2: Augmented Dickey Fuller (ADF) Test for Unit Root
Variable Level First Diff
t-Stat P Value t-Stat P Value
AGRI_CG -5.93 0.000
IND_CG -4.59 0.001
SER_CG -7.57 0.000
LOG(GFCF) -0.78 0.813 -6.786 0.000
EDU -1.51 0.518 -8.183 0.000
LE -2.90 0.058
LOG (LE) -3.24 0.028
Log (PCI) 0.61 0.988 -6.475 0.000
Log (PCI) @ Trend (AIC) -3.303 0.086
POP 0.72 0.991 2.822 0.066
Log(POPW) -0.16 0.934 3.134 0.034
Source: Author’s calculation
The Augmented Dickey Fuller (ADF) test for unit root shows the variables AGRI_CG,
IND_CG, SER_CG and LE are stationary at level whilst rests are found to be non-
stationary. After first difference, log (GFCF), EDU, POP and log(POPW) become
stationary. Nonetheless, per capita income (PCI) variable shows a trend stationary nature.
When time trend is included in the test equation, PCI is found to be stationary at 10

50 NRB ECONOMIC REVIEW
percent significance level and log(PCI) at 5 percent significance in even in level data
(Table 2).
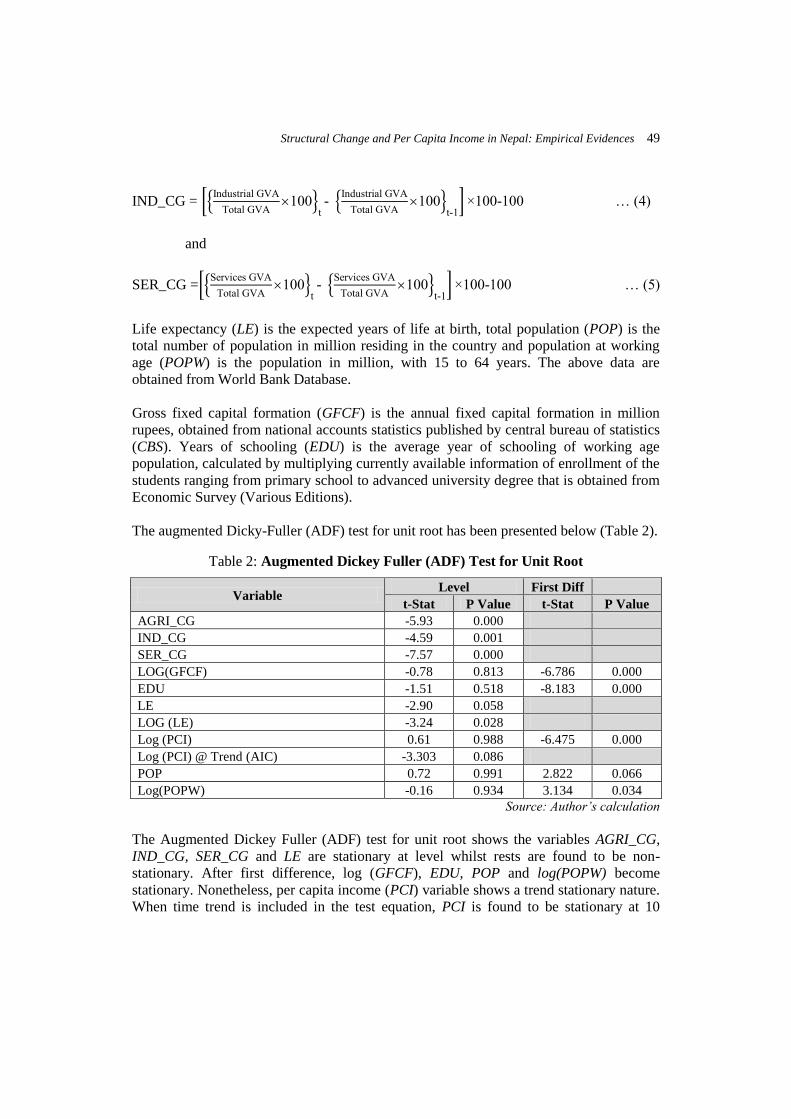
Hence, to address the trend stationarity of PCI, the Hodric-Prescott (HP) filter is
applied to extract trend and cycle from PCI. The HP filter generates new cycle
and trend from the trend-stationary series that minimizes the variance of the old
series around the new one, subject to a penalty constant . Once trend and cycle is
extracted, we can use cycle in the regression equation. Hence, in case of PCI, the
filter chooses PCI_Cyclet to minimize:
∑ _ 2
<1 + ∑ ( _ :1 _ ;1 <2
_ _ ;1 )2 … (6)
By applying this method, the new series of per capita income, pci_cyclet, which is
trend-stationary free and contains all the information of PCI too.
B P (2 2)’ m f m w k considering the nature of data
and properties, the best fit model can be presented as follows.
_ = + 1 _ + 2 _ + 3 _ + 4 ++ 5 +
6 + 7 + 8 + 9 + … (7)
Equation (7) illustrates the prime factors in influencing per capita income of the
citizens in an economy. In addition to the equation (2), one additional dummy
variable is introduced. Dummy variable (dum01) is the variable with value one if
the year of analysis is 2001 and zero otherwise, which is used to capture
compilation break from 2001 as Nepal switched in accounting GDP with new
system of National Accounts (SNA), 1993 with the broad categorization of the
sectors especially that of services.
The impact of sectoral growth variables is assumed to be positive for per capita
income. Level of education, as explained by EDUt is also expected to increase the
income since education is a human capital. Gross fixed capital formation is
assumed to impact positively to income as capital is most significant factor for
productivity increment and high growth. Effect of Life expectancy (LE) and
population at working age (POPW) are also hypothesized to have positive impact
on per capita income. Nevertheless, total population (POP) is presumed to reduce
the income, as the population rises, income is to be distributed among citizens.
There may be the possibility of multi collinearity among the regressors. To
identify whether there exists serious collinearity problem, variance inflation factor
(VIF) has been estimated. VIF helps quantifying the inflation of the variance due

Structural Change and Per Capita Income in Nepal: Empirical Evidences 51
to the collinearity with other regressors in the estimated equation. The VIF factor
for ̂ have been calculated as follows:
V. MODEL ESTIMATION AND RESULT ANALYSIS
Equation (7) is estimated by applying ordinary least squares (OLS) method of estimation
in EViews 8. The estimated coefficients of equation (7) have been presented in Table 3.
Table 3: Empirical Results
S.N. Variable Name Coefficient t-Stat
1. Constant - 166.24 -2.196**
2. AGRI_CGt 0.695 0.597
3. IND_CGt 0.936 2.251**
4. SER_CGt - 0.092 -0.139
5. EDUt -5.017 -0.452
6. log(GFCF)t 8.32 0.314
7. Log(LE)t 32.62 1.742*
8. POPt -93.12 -2.081**
9. log(POPW)t 3032.91 3.431**
10. Dum01 50.71 3.088**
*=significant at 10 percent level ** = significant at 5 percent or less level
Adj. R2= 0.41, DW = 1.6, F-Stat = 3.60**
Source: Author’s calculation.
In contradiction to the hypothesis, coefficient of AGRI_CGt, represented by the growth
rate of the agricultural share to the GDP, is found with positive sign and SER_CGt with a
negative, both the coefficient are insignificant though. The IND_CGt, which represents
the growth rate of industrial share to GDP, has expected sign and is significant at 5
percent level indicating that increased share to industrial GDP has a vital role in
increasing per capita income.
The reason behind the insignificance of agriculture sector could be justifiable.
Agricultural productivity matters for other sectors development too, as very low
agricultural productivity can severely damage modernization of economy (Kim &
Whang, 2012). Moreover, Nepal's agriculture is largely at sustenance level, being high
level of underemployment and only 40 percent farmer produce sufficient foods for one
year's consumption (CBS, 2013)1. As discussed before in section three and proved
statistically, the industrial sector is still playing vital role in raising per capita income only
1 Nepal Living Standards Survey-III reveals 32 percent underemployment in all sectors and
share of wage employment in agriculture is just 2.8 percent compared to 12.6 percent in non-
agriculture. Moreover, share of self-employment in agriculture is still 61 percent, only 10
percent down from 1996 level.
𝑉 𝐹 = 1
1 𝑖2 …… (8)

52 NRB ECONOMIC REVIEW
due to the closer similarities in contribution to both GDP and employment opportunities.
As the sector contributes about 15 percent to the economy by employing 11 percent of
total employment, it is the closest combination in the share to employment and to the
GDP so far.
Nonetheless, there is also strong evidence on the insignificance of the service sector. The
case of service sector is like the opposite the case of agriculture in terms of employment.
Service sector's contribution to economy is more than half but it provides employment
only for 15 percent of the total employed. With this, from income perspective, service
sector's growth is still playing no role till date. Unless it absorbs the workforce at a speed
of its growth and then its sectoral contribution to the national economy, it would not raise
the living standards of societies.
As hypothesized earlier, both life expectancy and population at working age have
significant positive impact to per capita income; the coefficient of log(LE)t is significant
at 10 percent level and log(POPW)t at 5 percent or lower level. These statistical results
can be inferred as the improved health condition and young working groups foster the
overall per capita income. As presumed before, increase in country's population reduces
per capita income, POPt significant at 5 percent or lower level. The dummy variable,
dum01 is significant at 5 percent or lower level. Hence, it has captured the compilation
break of services sector in 2001.
Nevertheless, education and gross fixed capital formation have been found insignificant
to raise income. Although the sign of log(GFCF)t is positive as expected, the sign of
EDUt is even negative. This contradictory finding, that is, the growth of industrial share
to GDP is significant but capital formation is not increasing the income can be argued as
follows. These two phenomena have been regressed with different scenarios, as the
former indicates the sectoral growth in the share to the total production of the economy,
and the later, with one of the factors of production that usually input for all three sectors
in aggregate (agriculture, industry and services). Although capital injection may increase
the productivity, the productive use of capital matters which may be suffering in Nepal
(Bhatta, 2014) 2. Most importantly, capital injection should directly hit the income of the
people, especially in employment creation; this might have missing in Nepalese context.
On the other hand, the insignificance of the education variable as measured by years of
schooling of working age population could be due to the couple of reasons. The increased
number of outgoing migrants in the recent years (and impact of remittance on the
education is still to witness), lack of labor movement from agriculture, being high share
of underemployment, lower level of vocational trainings etc. may be impeding the role of
education to the national economy. Besides, it is also witnessed a large chunk of educated
unemployment in Nepal, educated youths being unable to get job due to the 'lack of
access to relevant education and training, and lack of information' among others (United
2 This issue has been highlighted in an article at The Himalayan Times, March 11, 2014.

Structural Change and Per Capita Income in Nepal: Empirical Evidences 53
Nations, n.d., and Sharma, 2013). The unemployed youths tend to get higher education,
which is easily accessed without any qualifying exam restrictions in Nepal. Besides these
all, there may the minor adjustment possibility of education data used in analysis since
the education data is computed self. Nevertheless, change in sign with large variation in
the coefficient couldn't be expected even after the revision of the series.3
So that, the insignificance of education and capital variable indicates that both the current
level of education and capital injection have not contributed significantly to increase per
capita income. Thus, it is essential to enhance the level of education and capital formation
drastically in the days to come if Nepal intends to increase income of the people through
education and investment as in advanced and emerging economies. This can be inferred
on the basis of literature supports in the importance of capital, both human and physical,
in OECD and other emerging economies.
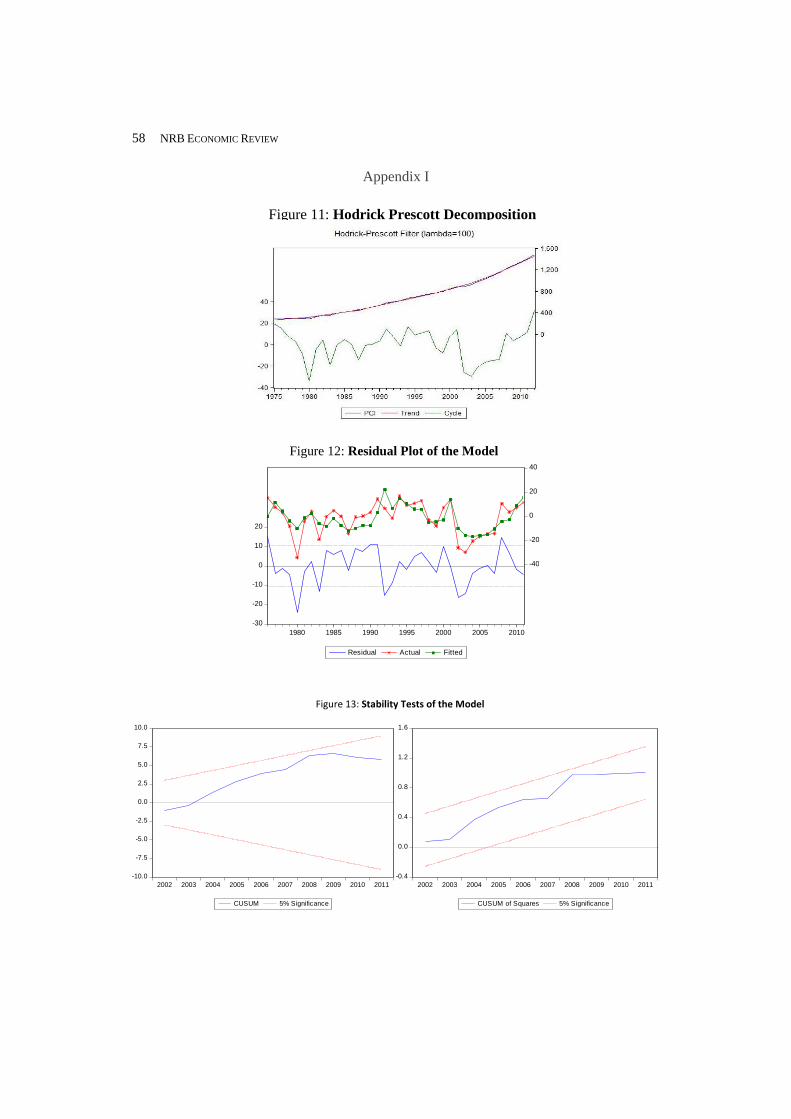
The goodness of fit, diagnostic and stability tests satisfy the minimum criteria required
for the statistical inference. The Lagrange multiplier (LM) test for autocorrelation shows
no serial correlation in residual as p-value of the test is 0.64. The residual plot of the
model shows a random move around mean (Annex I - Figure 12). The stability test of the
model is also significant since the recursive estimates represented by CUSUM and
CUSUM squares test for stability lie within 5 percent range (Annex I - Figure 13).The
adjusted R2, Durbin-Watson statistics and F-Stat for overall model significance show the
satisfactory results.
The VIF estimates for identifying the multi-collinearity among the regressors has been
presented in Table 4.
Table 4: Variance Inflation Factor (VIF) Estimates
Variable Centered VIF
AGRI_CG 7.82
IND_CG 3.22
SER_CG 6.39
D(POP) 4.48
D(LOG(POPW)) 3.82
D(EDU) 1.07
LOG(LE) 1.81
DUM01 2.43
D(LOG(GFCF)) 1.51
Source: Author’s calculation
3 The negative sign of coefficient of EDUt is something weird in our estimation. Perhaps, a
significant variation may not result even if the education data is revised. The estimated data are
near to the official published series for the specific years. See annex II-A for the details.

54 NRB ECONOMIC REVIEW
Generally, a very low value of VIF is the indication of no multi-collinearity problem, in
which some researchers say only below 5 is the tolerable, for instance, Rogerson (2001).
However, many researchers such as Neter et al., 1989: 409; Hair et al., 1995; Marquardt,
1970; Mason et al., 1989 have set the centered VIF below 10 as a tolerable limit for
collinearity. In our VIF estimates, all the values of the centered VIFs are below 10. The
VIFs of AGRI_CGt and SER_CGt have been found relatively higher but within the
tolerable limit.
The empirical findings, hence, suggest the requirement of an employment-generating
economic growth. Even though we may achieve a higher sector-specific growth, the
concern would be whether there is new employment generation. The message is that the
balance of contribution to the GDP and to the total employment is a must for increasing
income of people.
VI. CONCLUSION
Although the contribution of industrial sector does not change much in Nepal, historical
data shows a gradual shift in the share of economy from agriculture to services. But the
employment pattern has not changed in line with the change in sectoral composition of
GDP. Unbalanced contribution of agriculture, industry and service sectors is found in the
share of GDP and total employment.
In Nepal, empirical estimates show that industry is the most significant sector to increase
income compared to agriculture and service sectors. Improvement in health is also found
significant to increase per capita income. Besides, working age population contributes to
enhance per capita income of total population. Nevertheless, as against the theory and
international empirics, capitals both human and physical have been found not
contributing to raise per capita income, being investment and education variables
insignificant in the empirical analysis. This could be because increased educated
unemployment and lack of productive investment.
The unbalanced contribution of employment, that is, high subsistence on agriculture and
very low employment by the service sector could be blamed as the insignificance of these
sectors in increasing the income. Hence, it is the major structural problem in Nepal-
deviation in economic and the employment structure especially higher level of
underemployment and eroded productivity in agriculture and employment unfriendly
service sector. Industrial sector relatively observed better in increasing per capita income
as the sector is much closer in employment generation and the share of the economic
growth.
Thus, employment generation is the utmost importance in an economy to raise the income
of the people, so is for Nepal. In addition, improved health and larger share of working
age people are also needed. The focus should be on increasing the productivity of the
agriculture sector and move agriculture-based labors to other sectors of economy.
Nonetheless, massive employment can only be generated with increased productive
investment in the aforesaid sectors.

Structural Change and Per Capita Income in Nepal: Empirical Evidences 55
The paper can be further improved by analyzing the panel data of similar economies that
helps in identifying random and fixed effect estimations much comprehensively.
*****
REFERENCES
Acharya, S. P. and G. R. Bhatta. 2013. "Climate Change and Agricultural Growth in
Nepal." NRB Economic Review, 25(2) : 1-16.
Autor, D. H., D. Dorn and G. H. Hansen. 2013. "The China Syndrome: Local Labor
Market Effects of Import Competition in the United States." American Economic
Review, 103(6) : 21-68.
Baumol, W. J. 1967. "Macroeconomics of Unbalanced Growth: the Anatomy of Urban
Crisis." American Economic Review, 57(3) : 415-426.
Bhatta, G. R. 2014. "Nepal's economic growth scenario: Boosting savings and
investment." The Himalayan Times op-ed article, March 11. Available at
http://thehimalayantimes.com/fullTodays.php?headline=Nepal%27s+economic+gro
wth+scenario%3A+ Boosting+savings+and+investment+&NewsID=408304
Buera, F. J. and J. P. Kaboski. 2009. "Can Traditional Theories of Structural Change Fit
the Data?" Journal of the European Economic Association, 7 : 469-477.
CBS. 1999. Nepal Labour Force Survey 1998-99, Statistical Tables, Central Bureau of
Statistics, Kathmandu.
____ 2009. Nepal Labour Force Survey 2008, Statistical Tables, Central Bureau of
Statistics, Kathmandu.
____ 2013. "National Sample Census of Agriculture Nepal-2010/11." Central Bureau of
Statistics, Kathmandu.
CIA. 2013. The World Fact Book, 2013, Central Intelligence Agency, US. Accessed 13th
November 13, 2013onhttps://www.cia.gov/library/publications/the-world-factbook/
geos/ np.html
Clark, C .1940. The Conditions of Economic Progress, London: Macmillan.
Economics Online. Accessed 9th November, 2013 on http://www.economicsonline.co.uk/
Global_economics /Structural_change_theory.html
Fagerberg, J. 1994. "Technology and International Differences in Growth Rates." Journal
of Economic Literature, 32 : 1147-117.
Fisher, A. 1939. "Production: Primary, Secondary and Tertiary." Economic Record.
Fuchs, V. R. 1980. "Economic Growth and the Rise of Service Employment." National
Bureau of Economic Research. NBER Working Paper, No. 486.

56 NRB ECONOMIC REVIEW
Haggard, S. and R. Kaufman, eds. 1983.The Politics of Economic Adjustment, Princeton,
NJ: Princeton University Press.
Hair, J. F. Jr., et. al . 1995. Multivariate Data Analysis, 3rd eds., New York: Macmillan.
Harberger, A. C. 1998. "A Vision of the Growth Process." The American Economic
Review, 88(1) : 1-32.
Kim, H. J. 2006. "The Shift to the Service Economy: Causes and Effects." Institute for
Monetary and Economic Research,. The Bank of Korea.
Kim, J. H. and U. Whang, 2012. "Structural Transformation and Comparative Advantage:
The Implications for Small Open Economies." Editorial Express. Accessed 15th
October on https://editorialexpress.com/cgi-bin/conference/download.cgi?db_name=
MWM2012& paper _id=95
Kuznets, S. 1971. "Economic Growth of Nations: Total Output and Production
Structure." Political Science Quarterly, 86(4) : 654-657.
Lee, D. and K. I. Wolpinm. 2006. "Intersectoral Labor Mobility and the Growth of the
Service Sector." Econometrica, 74(1) : 1-46.
Lewis, W. A. 1954. “E m D pm w h U m pp f L b .”
Manchester School of Economic and Social Studies, 22 : 139-91.
Maddison, A.. 1991. "Dynamic Forces in Capitalist Development: A Long-Run
Comparative View." Oxford: Oxford University Press.
Marquardt, D. W. 1970. Generalized inverses, ridge regression, biased linear estimation,
and nonlinear estimation, Technometrics, 12 : 591–256.
Mason, R. L., R. F. Gunst and J. L. Hess. 1989. Statistical Design and Analysis of
Experiments: Applications to Engineering and Science, New York: Wiley.
Metcalfe, J. S. 2001. "Consumption, Preferences, and the Evolutionary Agenda." Journal
of Evolutionary Economics, 11(1) : 37-58.
Montobbio, F. 2000. "An Evolutionary Model of Industrial Growth and Structural
Change". CRIC Discussion Paper, 34, University of Manchester.
Nelson, R. 1995. "Recent Evolutionary Theorizing about Economic Change." Journal of
Economic Literature, 33 : 48-90.
Neter, J., W. Wasserman, and M. H. Kutner. 1989. Applied Linear Regression Models.
Homewood, IL: Irwin.
Noland, M., D. Park and G. B. Estrada. 2012. "Developing the Service Sector as Engine
of Growth for Asia: An Overview." Working Paper No. 320, Asian Development
Bank. Retrived from http://www.adb.org/sites/default/files/publication/30080/
economics-wp320.pdf on 10 May, 2014.
Ocampo, J. A. 2003. "Structural Dynamics and Economic Growth in Developing
C .” U N E m C mm f L m rica and the
Caribbean (ECLAC), Santiago: Chile.

Structural Change and Per Capita Income in Nepal: Empirical Evidences 57
OECD. 2010. "The Service Economy." Organization for Economic Cooperation and
Development.
Olga, M. and A. Lelio. 2010 . "Structural Change in the World Economy: Main Features
and Trends." WP 24/2009, UNIDO, Vienna.
Pasinetti, L. L. 1981. Structural Change and Economic Growth, Cambridge University
Press, Cambridge. ISBN 9780521274104.
Pender, M. 2002. "Structural Change and Aggregate Growth." WIFO Working Papers,
No. 182, Vienna accessed 3rd
October 2013 onhttp://www.wiwi.uni-
jena.de/Mikro/pdf/ peneder-281101.pdf accessed 12/1/2013.
Rodrik, D. 2007. One Economics, Many Recipes: Globalization, Institutions and
Economic Growth. Princeton University Press.
__________. 2013. IMF Survey Magazine. June 28 2013.Accessed 10thNovember 2013
on http://www.imf.org/external/pubs/ft/survey/so/2013/INT062813A.htm
Rogerson, P. A. 2001. Statistical methods for geography, London: Sage.
Sawhney, U. 2010. "Growth and Structural Change in SAARC Economies." International
Journal of Economics and Finance Studies, 2(2), ISSN: 1309-8055 (Online)
Schumpeter, J. A. 1939. Business Cycles: A Theoretical, Historical, and Statistical
Analysis of the Capitalist Process, New York and London: McGraw-Hill.
Sharma, S. 2013. "Educated, unemployed and mobile." The Kathmandu Post. September
29. Available at http://www.ekantipur.com/the-kathmandu-post/2013/09/28/free-the-
words/educated-unemployed-and-mobile/254166.html
Silverberg, G. 1998. "Modeling Economic Dynamics and Technical Change:
Mathematical Approaches to Self-Organization and Evolution." in Dosi, G.,
Freeman, C., Nelson, R., Silverberg, G., Soete, L. (eds.), Technical Change and
Economic Theory, 531-559.
Silverberg, G., and B. Verspagen. 1998. "Economic Growth: An Evolutionary
Perspective", in Reijnders, J. (ed.), Economics and Evolution, Edward Elgar,
Cheltenham, 137-170.
United Nations (n.d.). "Under and Unemployed Youth (15-29 years)." United Nations
Nepal Information Platform, Electronic version. Available at http://un.org.np/oneun/
undaf/ unemployed
Uy T., K. Yi, and J. Zhang. 2013. Structural Change in an Open Economy, University of
Michigan. March 12.
Verspagen, B. 2001. "Economic Growth and Technological Change: An Evolutionary
Interpretation." STI Working Papers, OECD, Paris, 1.
Welker, J. 2012. Models of Economic Growth and Development. Online version accessed
on 2nd November, 2013 fromhttp://welkerswikinomics.com/blog/2012/01/30/
models-for-economic-growth-ibeconomics/World Development Indicators. 2013.
World Bank Database.
58 NRB ECONOMIC REVIEW
Appendix I
Figure 11: Hodrick Prescott Decomposition
Figure 12: Residual Plot of the Model
-30
-20
-10
0
10
20
-40
-20
0
20
40
1980 1985 1990 1995 2000 2005 2010
Residual Actual Fitted
-10.0
-7.5
-5.0
-2.5
0.0
2.5
5.0
7.5
10.0
2002 2003 2004 2005 2006 2007 2008 2009 2010 2011
CUSUM 5% Significance
-0.4
0.0
0.4
0.8
1.2
1.6
2002 2003 2004 2005 2006 2007 2008 2009 2010 2011
CUSUM of Squares 5% Significance
Figure 13: Stability Tests of the Model

Structural Change and Per Capita Income in Nepal: Empirical Evidences 59
Appendix II
A. Data on Average Years of Schooling for Population and Working age, 15-64 years
Year Total Population,
Million
Population at Working Age,
Million
Average Years of
Schooling
UNDP
Data4
1975 12.87 7.16 0.86
1976 13.16 7.31 0.93
1977 13.45 7.46 1.05
1978 13.75 7.62 1.15
1979 14.06 7.78 1.34
1980 14.38 7.95 1.42 0.6
1981 14.72 8.12 1.47
1982 15.06 8.30 1.54
1983 15.42 8.48 1.60
1984 15.78 8.67 1.55
1985 16.14 8.85 1.70
1986 16.51 9.03 1.67
1987 16.89 9.21 1.73
1988 17.27 9.39 1.83
1989 17.68 9.60 2.07
1990 18.11 9.83 2.31 2.0
1991 18.57 10.10 2.40
1992 19.05 10.39 2.47
1993 19.55 10.71 2.41
1994 20.07 11.03 2.40
1995 20.59 11.36 2.37
1996 21.12 11.69 2.47
1997 21.65 12.02 1.89
1998 22.18 12.34 2.50
1999 22.69 12.65 2.58
2000 23.18 12.95 2.50 2.4
2001 23.66 13.22 2.63
2002 24.10 13.47 2.66
2003 24.53 13.72 2.74
2004 24.92 13.96 2.87
2005 25.29 14.20 3.01 2.7
2006 25.63 14.45 2.98 2.8
2007 25.95 14.69 3.01 2.9
2008 26.25 14.96 3.13 3.0
2009 26.54 15.24 3.28 3.1
2010 26.85 15.56 3.22 3.2
2011 27.16 15.92 3.21 3.2
2012 27.47 16.31 3.09 3.2
Data Source: Total Population and Population at Working Age Data is downloaded from World Bank
Database and Average Years of Schooling Data is self-calculated by using school
enrollment data available fr om Economic Survey,. Various Issues.
4 Average number of years of education received by people ages 25 and older, converted from
education attainment levels using official durations of each level. The data is put here for the
reference, obtained from United Nations Human Development Indicators Accessed: 2/25/2013,
at http://hdr.undp.org.

60 NRB ECONOMIC REVIEW
B. Other data series used in analysis
Year GFCF
Million, NPR IND_G SER_G AGRI_G PCI, PPP USD
PCICYCLE
(HP Filtered)
1975 2223.0 NA NA NA 281.6 19.05878
1976 2443.0 8.301994 8.890165 -3.432291 287.6 15.29110
1977 2580.0 26.50899 13.87903 -7.764521 289.8 7.541765
1978 3294.0 6.529822 0.561690 -1.363254 295.9 3.168187
1979 3263.0 0.370499 -5.285280 2.027867 296.3 -7.985212
1980 3681.0 -0.518811 11.00017 -3.956940 282.9 -34.18853
1981 4299.0 3.736784 1.614016 -1.408213 327.6 -4.086187
1982 5465.0 3.999741 -2.237120 0.170157 352.5 4.321822
1983 6576.0 -0.467740 2.925061 -1.154514 347.3 -19.03958
1984 6907.0 -1.562553 -1.819503 1.143192 386.2 -0.192662
1985 9386.0 19.92926 25.63819 -15.21721 412.9 4.774010
1986 9431.0 4.953289 -1.540583 -0.458424 431.6 0.195859
1987 11825.0 -0.174051 2.383194 -1.458986 441.7 -14.24678
1988 13414.0 2.159217 -1.540314 0.342023 481.3 -0.560529
1989 16392.0 2.274153 0.471022 -1.027216 509.1 0.312850
1990 17002.0 -1.812131 -2.897028 2.497816 539.7 3.265048
1991 22780.0 6.940153 10.24382 -8.557058 578.9 14.31836
1992 29277.0 17.47837 -1.934237 -4.976672 599.8 6.774899
1993 37278.0 1.290158 6.833271 -5.877285 620.3 -1.438216
1994 42032.0 5.101934 -5.102471 1.987817 667.4 16.79517
1995 48370.0 4.783464 0.767073 -3.039191 688.7 9.083011
1996 56081.0 0.710507 0.258643 -0.606958 719.7 10.83688
1997 60794.0 -0.228906 0.351942 -0.175306 751.7 12.95151
1998 65375.0 -1.624526 5.315892 -3.684482 766.6 -2.929753
1999 65269.0 -3.036574 -1.869622 3.473210 793.7 -7.870098
2000 73324.0 1.480300 0.404737 -1.143537 842.8 7.363763
2001 84750.5 -19.60559 20.28716 -7.782908 885.3 13.84589
2002 89889.3 1.672383 -2.793550 2.516736 884.0 -26.02243
2003 98072.8 0.315668 2.293923 -2.723048 922.1 -29.71056
2004 109181.3 -1.603388 1.482795 -0.975243 976.6 -20.39875
2005 117538.9 -0.900514 2.190292 -2.217146 1028.9 -16.86215
2006 135532.0 -2.815206 4.798017 -4.695526 1083.1 -14.64082
2007 153336.9 -0.604771 2.461346 -3.121590 1138.5 -14.19630
2008 178445.5 1.403537 1.198472 -2.477033 1220.6 10.54934
2009 211039.0 -5.551835 -0.686357 3.987479 1272.8 3.586678
2010 264888.0 -4.502185 -3.374023 7.327898 1336.8 7.142556
2011 292730.0 -1.939240 -2.733647 4.408893 1402.1 11.21697
2012 307384.0 -1.552970 4.311903 -4.645298 1484.3 31.97413
Note: The data of 1975 represents the Nepal's fiscal year 1974/75, 1976 as fiscal year 1975/76 and so on in the whole data
sets.
Data Source: World Development Indicators, the World Bank and Central Bureau of Statistics, Kathmandu, Nepal.