structural characterization of wax esters by electron ionization mass
TRANSCRIPT

1
Structural characterization of wax esters by electron ionization mass spectrometry
Klára Urbanová1, Vladimír Vrkoslav1, Irena Valterová1, Martina Háková1,2 and Josef Cvačka1*
1 Institute of Organic Chemistry and Biochemistry, Academy of Sciences of the Czech
Republic, v.v.i., Flemingovo nám. 2, CZ-166 10 Prague 6, Czech Republic
2 Department of Analytical Chemistry, Faculty of Science, Charles University in Prague,
Hlavova 2030/8, CZ-128 43 Prague 2, Czech Republic
Running title: Structural characterization of wax esters Correspondence to: Josef Cvačka, E-mail: [email protected], Telephone: +420 220 183 303, Fax: +420 220 183 583 Abbreviations: WE, wax esters; FA, fatty acids; GC, gas chromatography; GC/EI-MS, gas chromatography coupled with electron ionization mass spectrometry; PFTBA, perfluorotri-n-butylamine
by guest, on Novem
ber 22, 2018w
ww
.jlr.orgD
ownloaded from

2
Abstract:
The interpretation of the electron ionization mass spectra of straight-chain and methyl-branched
saturated and unsaturated wax esters (WEs) is discussed in this study based on the spectra of 154
standards. The most important fragments indicative of the structure of the acid and alcohol chains
are identified and summarized for WEs with various number of double bonds in the chains. Briefly,
most WEs provide acylium ions allowing structural characterization of the acid part, whereas the
alcohol part give corresponding alkyl radical cations. The elemental composition of selected
important fragments is established from a high-resolution accurate mass analysis. The ion
abundances are discussed with respect to the length and unsaturation of the aliphatic chains. The
interpretation of the spectra of branched or unsaturated WEs requires the recognition of small but
important peaks that are difficult to discern among the other fragments. We demonstrate that such
fragments are easily detected in differential mass spectra. This approach requires spectra of WE
standards (e.g., straight-chain analogues in case of branched WEs) recorded under the same
experimental conditions. The WEs mass spectral database provided in the Supplemental Data can
be used as a reference for the analysis of the GC/EI-MS data.
Supplementary key words: GC/MS, interpretation, neutral lipids, spectral database, waxes
by guest, on Novem
ber 22, 2018w
ww
.jlr.orgD
ownloaded from
3
Introduction
Wax esters (WEs), simple lipids composed of long-chain fatty alcohols esterified to long-
chain fatty acids (FAs), are widespread in nature. They serve a variety of functions in living
organisms, including surface protection (1, 2), energy storage (3), chemical communication (4), or
sound transmission (5). The human body biosynthesizes WEs to play important physiological roles
in the complex protection of fetuses and newborns, skin, hair, ears and eyes (6–10). Dietary WEs
are an important source of very long chain fatty alcohols and acids that exert regulatory roles in the
cholesterol metabolism (11). Naturally occurring WEs usually form complex mixtures composed of
many molecular species. These mixtures contain straight- and branched-chain esters of various
chain lengths and numbers of double bonds depending on the biochemical synthetic pathways in
particular organisms. WEs are also produced industrially and used in large quantities in cosmetics,
polishes, lubricants, surface coating and other applications (12). Gas chromatography (GC) has
frequently been used for analyzing WEs, often after their hydrolysis. The separation of intact WEs
has been made possible by the introduction of high-temperature columns. GC coupled with electron
ionization mass spectrometry (GC/EI-MS) offers high separation efficiency, ease of use, and mass
spectra allowing structure elucidation. Other analytical methods based on liquid
chromatography/mass spectrometry or matrix-assisted laser desorption/ionization mass
spectrometry (13–15) can also be utilized, especially in the case of thermally unstable or
insufficiently volatile WEs.
The research on the mass spectra of FA esters can be traced back to the early days of mass
spectrometry. The EI spectra are explained perhaps in all of the textbooks on organic mass
spectrometry, but the discussion is mostly limited to methyl or ethyl esters. The EI mass spectra of
saturated, straight-chain WEs has been studied for more than forty years using both low and high-
resolution measurements and deuterium-labeling experiments (16–22). The spectra interpretation is
usually straightforward in terms of the determination of the molecular weight and acid/alcohol
chain length. However, the structure elucidation becomes much more complicated for branched or
unsaturated esters, e.g. in case of samples of animal or human origin. Only a few reports closely
dealing with the EI spectra of branched or unsaturated WEs exists in the literature (17, 20, 22–24).
The application of commercial spectra libraries for spectra interpretation is of limited value because
of the low number of WE entries.
The aim of this paper is to review and broaden the knowledge on the EI spectra of WEs in
order to provide hints for the interpretation of the GC/MS data. The study is based on the EI mass
spectra of 154 WE standards recorded under standardized conditions and follows a previous work
focused on gas chromatography of straight-chain WEs (25). The main diagnostic fragments of the
various types of WEs are identified using high-resolution accurate-mass (HRAM) measurement and
their relative intensities are compared. To the best of our knowledge, the mass spectra of most WEs
included in this study, particularly those with branched and polyunsaturated chains, have never been
described before. A new interpretation strategy based on the use of differential spectra is suggested.
The spectrum database is available online in the Supplemental Data.
by guest, on Novem
ber 22, 2018w
ww
.jlr.orgD
ownloaded from
4
Materials and Methods
Standards of WEs
WE standards were obtained from Nu-Check-Prep, Inc. (Elysian, MN, USA) or synthesized via acid
chlorides (14). The FAs for synthesis were purchased from Sigma-Aldrich (St. Louis, MO, USA),
TCI America (Portland, OR, USA), Matreya LLC (Pleasant Gap, PA, USA), and Larodan Fine
Chemicals AB (Malmö, Sweden). The alcohols were prepared by the reduction of the
corresponding methyl esters (26). The standards were dissolved in hexane at a concentration of
1 mg/mL.
Gas chromatography – mass spectrometry
The mass spectra were recorded using a 5975B quadrupole mass spectrometer coupled to a 6890N
gas chromatograph (Agilent, Santa Clara, CA, USA). The samples were injected splitless at 240 °C.
Chromatographic separation was achieved on a HP-5MS capillary column (30 m x 0.25 mm, a film
thickness of 0.25 m, Agilent). The GC was operated in the constant flow mode (1.5 ml/min) with
helium as a carrier gas. The temperature program was: 70 °C (1 min), then 50 °C/min to 240 °C,
then 1 °C/min to 320 °C (10 min). The temperatures of the transfer line, ion source and quadrupole
were 250 °C, 230 °C and 150°C, respectively. The compounds were ionized by 70 eV electrons.
The ion optics was tuned and calibrated with the automatic standard spectra tune procedure using
perfluorotri-n-butylamine (PFTBA). The quadrupole was scanned in the 25–675 m/z range. The
high resolution EI spectra were measured using a GCT Premier benchtop orthogonal acceleration
time-of-flight mass spectrometer (Waters, Milford, MA, USA; instrument specifications: resolution
7000 FWHM, mass accuracy 0.1 mDa or 5 ppm) coupled to the Agilent 7890A GC System. The
chromatographic conditions were the same as described above. The high-resolution mass spectra
were internally calibrated with PFTBA.
Data processing
The low resolution mass spectra were summed across the chromatographic peaks, the background
was subtracted, exported to NIST MS Search 2.0 (National Institute of Standards and Technology,
Gaithersburg, MD, USA) and saved in the MSP file format. The spectrum database was built from
the averaged spectra calculated from 5 MSP files corresponding to 5 independent GC/MS runs. The
averaging of the MSP files was performed with in-house developed software.
The generic spectra of WEs X:0-Y:1 and WEs X:1-Y:0 were calculated from the spectra of
five selected esters of a given type (either containing monounsaturated acid and saturated alcohol,
or vice versa). Each spectrum was modified by the removal of fragments characteristic for the
compound (i.e., ions diagnostic for an acid or an alcohol chain of a particular length). The modified
spectra (MSP file format) were averaged and added to the spectrum library.
The differential spectra of the branched and unsaturated WEs were calculated in the
Comparison Window (Subtraction tab) of the NIST MS Search 2.0 program.
by guest, on Novem
ber 22, 2018w
ww
.jlr.orgD
ownloaded from

5
Abbreviations and nomenclature of WEs
An abbreviated nomenclature for naming the WEs was adopted (25). The first part of the
abbreviations refers to the alcohol segment of the molecule, whereas the second part indicates the
FA. Unless stated otherwise, a common methylene interrupted arrangement and/or cis geometry of
double bonds is assumed. Thus, for instance, an abbreviation WE 18:0-22:0 is used for octadecyl
docosanoate (stearyl behenate), WE 14:0-2Me16:0 for tetradecyl 2-methylhexadecanoate and
WE 22:0-18:1(n–9) for docosanoyl (9Z)-octadecenoate (behenyl oleate). To indicate a group of
WEs, X is used for the alcohol chain carbons and Y for the acid chain carbons. Thus, for instance
WEs X:0-Y:1 stands for wax esters with saturated alcohols and monounstaurated acids. The general
formula of WEs is considered to be RCOOR’, where R and R’ are the alkyl moieties of the acid and
alcohol part, respectively.
Results and Discussion
SATURATED STRAIGHT-CHAIN WEs (WEs X:0-Y:0)
Saturated, straight-chain WEs (see the spectrum of WE 14:0-17:0 in Figure 1) provided molecular
ions (M+) of appreciable intensities (4–9%), sufficient for the reliable assignment of molecular
weight. The fragments important for structure elucidation originated from cleavages near the ester
bond. The most remarkable fragments (56–100%) were protonated acids [RCOOH2]+ (m/z 271 in
WE 14:0-17:0) formed by a rearrangement with a double hydrogen transfer (16–19). The
moderately abundant peaks (10–18%) one mass unit lower (m/z 270 in WE 14:0-17:0) were radical
cations [RCOOH]+ rationalized by a single hydrogen rearrangement (16, 18). Alpha cleavage at
the carbonyl group yielded fairly abundant (5–22%) acylium ions [RCO]+ (m/z 253 in WE 14:0-
17:0) (16, 19). The EI spectra also showed fragments allowing a characterization of the alcohol part.
Among them, the most abundant were radical cations [R’-H]+, formally products of the elimination
of FA from the molecular ions (m/z 196 in WE 14:0-17:0) formed by at least two distinct
mechanisms (16). They were fairly abundant (up to 48%) in WEs containing shorter alcohols, but
their intensity decreased down to several rel. percent (4–7%) for alcohols with 20 carbons or more.
The radical cations readily eliminated ethylene (in analogy with the fragmentation of alkenes)
yielding [R’-C2H5]+ (m/z 168 in WE 14:0-17:0; HRAM: measured 168.1860, calcd. 168.1878;
[C12H24]+). The C-C bond -cleavage at the carbonyl group provided small (4–10%) fragments
[R’OCO]+ (m/z 241 in WE 14:0-17:0) which were practical for the confirmation of the alcohol
chain length (16, 19). Previously described [CH2COH2OR’]+ fragments (16) (m/z 257 in WE 14:0-
17:0) were rather small (0–5%). WEs also provided two rearrangement ions, [CH2C(OH)2]+
(m/z 60) and [CH2C(OH)(OH2)]+ (m/z 61) (27). Their intensities ranged from 4–10% and 7–22%,
respectively. Interestingly, their intensity ratio (60/61) was found to be almost constant within the
group of saturated WEs (0.52±0.04) and, as will be demonstrated later, strongly dependent on the
number of double bonds in the WE chains. The peaks of the aliphatic series [CnH2n+1]+ and [CnH2n–
1]+ dominated the low mass region. There were also [CnH2n–1O2]
+ ions, the fragmentation products
by guest, on Novem
ber 22, 2018w
ww
.jlr.orgD
ownloaded from

6
of [RCOOH]+. The ion [RCOOH-C3H7]+ (m/z 227 in WE 14:0-17:0; HRAM: measured 227.2020,
calcd. 227.2011; [C14H27O2]+) was more prominent than the others because of the favored loss of
the propyl radical.
SATURATED METHYL-BRANCHED WEs
Whereas the interpretation of the mass spectra of straight-chain saturated WEs is rather
straightforward, the recognition and correct interpretation of branched WEs might be a challenging
task. The retention parameters are quite important and serve as useful clues for the disclosure of
branched WEs in chromatograms, but mass spectrometry is usually needed to deduce the exact
position of the branching.
Saturated monomethyl-branched WEs
The mass spectra of WEs with monomethyl branching near the end or in the middle of the FA chain
closely resembled those of straight-chain esters and showed only slight variations in the peak
intensities (cf. Figures 1 and 2a). The molecular ions were as abundant as in the spectra of straight-
chain analogs (6-9%). The iso- and anteiso- methyl branched esters eliminated methyl and ethyl
radical yielding [M-CH3]+ and [M–C2H5]
+, respectively, but these fragments were too small for a
reliable localization of the branching position. Similarly, the -bond cleavage at the branching point
in the middle of the acid chain provided only tiny peaks; e.g., the intensity of [M-C6H13]+ in
WE 14:0-10Me16:0 (m/z 381 in Figure 2a; HRAM: measured 381.3749, calcd. 381.3733;
[C25H49O2]+) did not exceed 0.5%. The appearance of the spectrum changed significantly when the
branching point was next to the ester bond, e.g., in WE 14:0-2Me16:0 (Figure 2b). The
rearrangement ions shifted to m/z 74 ([CH2(CH3)C(OH)2]+) and m/z 75 ([CH2(CH3)C(OH)(OH2)]
+)
and their intensities increased. The spectrum base peak m/z 271 was protonated
2-methylhexadecanoic acid [RCOOH2]+, likely with the contribution of [CH2(CH3)C(OH2)(OR’)]+.
A fairly abundant m/z 87 (HRAM: measured 87.0450, calcd. 87.0446; [C4H7O2]+) was another
fragment indicating methyl branching in position 2 in the acid chain.
The spectra changed to a larger extent when methyl branching was located in the alcohol
chains (see the spectrum of WE 12Me13:0-17:0 in Figure 3a). The intensities of molecular ions
remained in the same range (6–9%), but they did not lose any radicals related to the branched site.
However, radicals were eliminated from [R’-H]+ and [R’–C2H5]+ ions yielding fragments
indicative of the branching position. For instance, they appeared at m/z 181 ([R’-CH4]+; (the
accurate mass was not determined because of an overlap with a peak of the internal calibrant) and
m/z 153 ([R’–C3H8]+; HRAM: measured 153.1638, calcd. 153.1643; [C11H21]
+), respectively in
WE 12Me13:0-17:0). The rearrangement fragment m/z 140 (HRAM: measured 140.1590, calcd.
140.1565; [C10H20]+) was presumably formed from branched [R’–H]+ after the elimination of
C4H8. The most useful fragments for disclosing iso- and anteiso- branched alcohols were markedly
increased butene ([C4H8]+; m/z 56) and pentene ([C5H10]
+; m/z 70) rearrangement ions,
respectively.
by guest, on Novem
ber 22, 2018w
ww
.jlr.orgD
ownloaded from
7
Saturated WEs monomethyl-branched in both chains
The features characteristic for methyl-branched alcohols and acids were combined in the spectra of
the WEs with methyl branching in both chains. Iso- or anteiso- branched alcohols esterified by
methyl-branched FAs yielded abundant rearrangement fragments m/z 56 or m/z 70 and at the same
time barely noticeable cations formed by the loss of radicals from the branched acid chains. For
instance, fragments indicating branching in the acid part of WE 12Me13:0-2Me16:0 (Supplemental
Data, Spectrum #42) were found at m/z 74, m/z 75 and m/z 87 whereas iso-branched alcohol
manifested itself by the more abundant m/z 56.
Saturated multiply methyl-branched WEs
The mass spectra of WEs with multiply-branched chains provided fragments allowing for at least a
partial localization of the branching sites. The clearly visible molecular peak of pristanic acid
tetradecyl ester (WE 14:0-2,6,10,14-tetraMe15:0) m/z 494 was accompanied by a tiny m/z 479
([M-CH3]+) largely formed by the fragmentation of the iso-branched site (Figure 3b). The
[RCOOH2]+ peak (m/z 299) was of moderate intensity, but other acid-related fragments [RCOOH]+
(m/z 298) and [RCO]+ (m/z 281) were barely detected. The ions related to alcohol, [R’OCO]+,
[R’-H]+, [R’-C2H5]+ appeared at m/z 241, m/z 196, and m/z 168, respectively. The remarkable
rearrangement peak m/z 222 (HRAM: measured 222.2347, calcd. 222.2342, [C16H30]+) is known
from the spectra of pristanic acid methyl ester (28). Another ion m/z 270 (HRAM: measured
270.2567, calcd. 270.2553; [C17H34O2]+) was consistent with the structure of
[CH(CH3)COH2OR’]+. Rearrangement ions of this type have been described for straight-chain
WEs (16). The ion intensity was considerably increased in the pristanic acid ester because of the
methyl branching in position 2. Branching in the same position was evident also from abundant m/z
74, m/z 75 and m/z 87, the same ions as in WE 14:0-2Me16:0 (see above). Methyl branching in
position 6 manifested itself by m/z 143 (HRAM: measured: 143.1075, calcd. 143.1067; [C8H15O2]+)
produced by a -bond cleavage of [RCOOH]+, and m/z 339 (HRAM: measured 339.3274, calcd.
339.3258, [C22H43O2]+) formed by an analogous cleavage of [M]+. The only fragment evidencing
methyl branching in position 10 was the hardly noticeable m/z 213 (the -bond cleavage of
[RCOOH]+). The esters of pristanic acid and iso or anteiso branched alcohols closely resembled
the spectrum explained above.
UNSATURATED WEs
The mass spectra of the unsaturated WEs tended to be uninformative. The extensive fragmentation
resulted in small or even missing molecular ions and rather low abundant diagnostic fragments. In
general, the more double bonds present, the more difficult it was to interpret the spectra. An
interpretation strategy based on converting unsaturated WEs to saturated ones using reduction with
deuterium has been suggested (16), but this approach is not always applicable for WE mixtures.
by guest, on Novem
ber 22, 2018w
ww
.jlr.orgD
ownloaded from

8
Direct interpretation of the spectra of unsaturated WEs is then the only way to obtain at least partial
structural information.
WEs with one double bond in the acid part (WEs X:0-Y:1)
The molecular ion of myristyl oleate (WE 14:0-16:1(n–9)) was barely visible (Figure 4a); its
intensity was <1%, like in all of the spectra of WEs of this type. The most important diagnostic
fragments were related to the acid chains. Among them, radical cations [RCO–H]+ (m/z 264 in WE
14:0-16:1(n–9)) (17, 23) corresponding to the neutral loss of alcohol were the most abundant (24–
46%). Other fragments, [RCO]+ (m/z 265 in WE 14:0-16:1(n–9)) and [RCOOH2]+ (m/z 283 in
WE 14:0-16:1(n–9)) were considerably smaller (6–15%) and [RCOOH]+ fragments (m/z 282 in
WE 14:0-16:1(n–9)) were less important (<2%) (17, 23). An appreciably abundant ion m/z 222 in
the spectrum of WE 14:0-16:1(n–9) was explained by a hydrogen rearrangement with a charge
retention on the hydrocarbon (HRAM: measured 222.2346, calcd. 222.234; [C16H30]+) (17).
Further elimination of alkenes C3H6, C4H8, C5H10 provided relatively prominent m/z 180, 166 and
152, respectively, like in the spectra of shorter esters (methyl, ethyl or propyl esters) (29). An effect
of the double bond position and geometry has been studied in a series of WEs containing
octadecenoic acid (WE 16:0-18:1; (n–12), (n–9), trans(n–9), (n–7); Supplemental Data, Spectra
#109–112). As expected, the effect was very small because of the extensive isomerization prior to
or during fragmentation. The only differences were tiny changes in the ion intensities, which cannot
be used for distinguishing isomers.
Only small fragments diagnostic for the alcohol part of WEs were detected. The relative
abundances of [R’–H]+ (m/z 196 in WE 14:0-16:1(n–9); HRAM: measured 196.2198, calcd.
196.2191; [C14H28]+) and [R’-C2H5]
+ (m/z 168 in WE 14:0-16:1(n–9)) were up to 5% in esters
with shorter alcohols, but they dropped almost to zero for longer ones. The abundances of
[R’OCO]+ (m/z 241 in WE 14:0-16:1(n–9)) were up to 2%. In the low mass region, the peaks of the
aliphatic [CnH2n–1]+ and [CnH2n+1]
+ series were mostly present.
Unsaturated WEs with a double bond in the alcohol part (WEs X:1-Y:0)
The spectra of WEs with a double bond in the alcohol part were markedly different, showing also
ions diagnostic for the alcohol part of esters (see the spectrum of WE 14:1(n–5)-18:0, Figure 4b).
The molecular ions were absent. The main fragments indicating an acid chain were relatively
abundant protonated acids [RCOOH2]+ (m/z 285 in WE 14:1(n–5)-18:0; 11–20%) and acylium ions
[RCO]+ (m/z 267 in WE 14:1(n–5)-18:0; 4–18%) (17, 23). Other acid-related fragments,
[RCOOH]+ (m/z 284 in WE 14:1(n–5)-18:0) and [RCOOH-C3H7]+ (m/z 241 in WE 14:1(n–5)-
18:0) were up to 2%. The most important alcohol-related fragments were abundant (20–44%)
radical cations [R’–H]+ (m/z 194 in WE 16:1(n–7)-18:0) and appreciably abundant (4–12%)
products of ethylene elimination [R’-C2H5]+ (m/z 166 in WE 14:1(n–5)-18:0) (17). An effect of the
double bond position in the alcohol chain on the low mass ions intensities was noticed, especially
when the double bond was close to the ester group. For instance, fragment m/z 82 (HRAM:
by guest, on Novem
ber 22, 2018w
ww
.jlr.orgD
ownloaded from
9
measured 82.0782, calcd. 82.0783; [C6H10]+) in WE 18:1(n–12)-16:0 was markedly higher than in
the other isomers because of preferential cleavage of the alcohol chain in the position of the double
bond. The differences were rather small for unambiguous identification of isomers with a different
double bond position, but a library search should score the correct isomers higher. The mass spectra
of cis/trans n–9 isomers were practically indistinguishable. The low mass spectra region of WEs
with unsaturated alcohol was dominated by [CnH2n–2]+ fragments, as is the case in the spectra of
monounsaturated acetates (29). Other fragments were ions of the [CnH2n–1]+ and [CnH2n+1]
+ aliphatic
series.
Unsaturated WEs with a double bond in the acid and alcohol part (WEs X:1-Y:1)
WEs with one double bond in the acid chain and one double bond in the alcohol chain provided
spectra with diagnostic peaks of low intensities. Small molecular peaks (1%) were present. The
acid-related fragments were [RCO]+ (6–9%), [RCO–H]+ (3–5%), [RCOOH2]+ (1–4%) (17) and
[RCO–3H]+ (2–3%; HRAM of WE 16:1(n–9)-14:1(n–5): measured 206.1686, calcd. 206.1671,
[C14H22O]+; Supplemental Data, Spectrum #72). The ions disclosing the alcohol part of WEs were
of similar abundances; [R’-H]+ (5–9%),[17] [R’-3H]+ (1-5%; HRAM of WE 16:1(n–9)-14:1(n–
5): measured 248.2480, calcd. 248.2504, [C18H32]+) and [R’-C2H5]
+ (1–6%). The low mass ions
were fragments of aliphatic series [CnH2n–1]+, [CnH2n–2]
+ and [CnH2n+1]+ with C4H7
+ (m/z 55) being
the base peak.
Unsaturated WEs – esters of linoleic acid and saturated alcohols (WEs X:0-Y:2)
The esters of linoleic acid and saturated alcohols provided appreciably abundant molecular ions (2–
3%). As in WEs with monounsaturated acids, acid-related fragments were relatively abundant,
whereas alcohol-related diagnostic fragments were missing. The most important fragments were
[RCO–H]+ (18–30%), [RCOO]+ (10–13%), [RCO]+ (9–10%), and [RCOOH]+ (6–9%), which in
linoleic acid esters appeared at m/z 262, m/z 263, m/z 279 and m/z 280. The ion [RCOO]+ (HR of
WE 14:0-18:2(n–6): measured 279.2379, calcd. 279.2319, [C18H31O2]+), which corresponds to the
elimination of the hydrocarbon radical from the molecular ion, was not important in the previous
types of WEs. A rearrangement ion m/z 220 (HRAM of WE 14:0-18:2(n–6): measured 220.2235,
calcd. 220.2186, [C16H28]+; Supplemental Data, Spectrum #87) was formed by an analogical
mechanism as m/z 222 in WE 14:0-16:1(n–9). The alcohol-related ions were missing for long-chain
alcohols, but shorter ones provided [R’-H]+ (up to 3%) and [R’-C2H5]+ (up to 4%). The fragments
in the low mass region belonged mostly to the [CnH2n–1]+, [CnH2n+1]
+, [CnH2n–3]+, and [CnH2n–2]
+ ion
series.
Unsaturated WEs – esters of saturated acids and linoleyl alcohol (WEs X:2-Y:0)
The esters of saturated acids with linoleyl alcohol provided small but distinguishable molecular ions
(~1%). Fragments allowing the characterization of the acid and alcohol chains were present. The
most abundant acid-related fragments were [RCO]+ (6–25%) and [RCOOH2]+ (7–13%); the
by guest, on Novem
ber 22, 2018w
ww
.jlr.orgD
ownloaded from
10
alcohol parts manifested themselves by [R’–H]+ (15–43%), [R’O]+ (4–5%) and [R’–C2H5]+ (2–
3%) fragments. These fragments appeared in linoleyl alcohol esters at m/z 183, m/z 201, m/z 248
and m/z 265, respectively. The [R’O]+ fragments [HRAM of m/z 265 in of WE 18:2(n–6)-14:0
(Supplemental Data, Spectrum #85) was not determined because of an overlap with a peak of the
internal calibrant] were rationalized by an alpha cleavage in the carbonyl group followed by the loss
of CO. The low mass region contained fragments of the [CnH2n–3]+, [CnH2n–1]
+, [CnH2n–2]+, [CnH2n–
5]+ and [CnH2n–4]
+ aliphatic ion series.
Unsaturated WEs – esters of -linolenic acid and saturated alcohols (WEs X:0-Y:3)
Molecular ions were the most abundant diagnostic peaks (3–5%) in the spectra of α-linolenic acid
esters. The molecular ions eliminated C2H5, C3H7
, C5H9 radicals and neutral butene, which is
typical for the n–3 arrangement of double bonds, e.g. in α-linolenic acid methyl and ethyl esters
(29). Gama-linolenic acid esters provide different fragments which can be used for distinguishing
between the isomeric chains. Like in other esters with unsaturated acids and saturated alcohols, only
the acid-related diagnostic fragments were present, namely [RCOO]+ (4–5%) and [RCO]+ (2–3%).
These fragments appeared at m/z 277 and m/z 261, respectively, in α-linolenic acid esters. The low
mass region was crowded with many ions of aliphatic series, mainly [CnH2n–1]+, [CnH2n–3]
+, [CnH2n–
5]+, [CnH2n+1]
+, [CnH2n–4]+ and [CnH2n–7]
+. The most prominent peak of the [CnH2n–4]+ series m/z
108 (HRAM of WE 14:0-18:3(n–3): measured 108.0938, calcd. 108.0939, [C8H12]+; Supplemental
Data, Spectrum #83) also indicated the n–3 polyenic chain (30).
Unsaturated WEs – esters of saturated acids and -linolenyl alcohol (WEs X:3-Y:0)
Esters of saturated FAs and α-linolenyl alcohol also provided appreciably abundant (3–4%)
molecular peaks. Again, the n–3 arrangement of double bonds appeared by the loss of C2H5, C3H7
,
C5H9 radicals and butene. Fragments indicative of both ester parts were detected: [RCO]+ (4–
19%), [RCOOH2]+ (9–18%) and less intense [R’–H]+ (< 2%) and [R’O]+ (3–5%) (HRAM of WE
18:3(n–3)-14:0: measured 263.2386, calcd. mass 263.2375, [C18H31O]+; Supplemental Data,
Spectrum #81). Abundant fragments of the [CnH2n–5]+, [CnH2n–3]
+, [CnH2n–1]+, [CnH2n–4]
+,
[CnH2n+1]+ and [CnH2n–7]
+ ion series were detected. As in the previous case, the increased peak m/z
108 indicated the n–3 double bond arrangement (30).
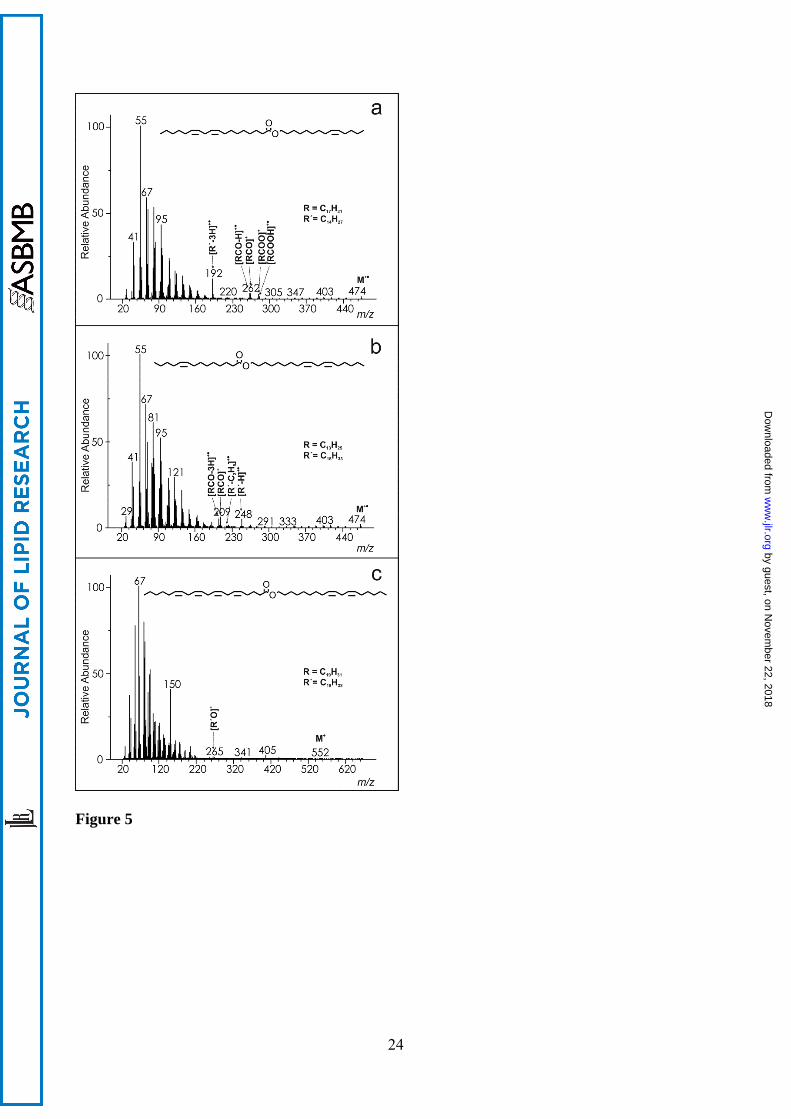
WEs with monounsaturated alcohol and polyunsaturated acid
Esters of linoleic or -linolenic acid with singly unsaturated alcohols provided low molecular and
diagnostic fragments, typically in the range of 3–4%. The acid-related [RCO]+ and [RCOO]+
fragments were observed and linoleic acid esters also showed similarly abundant [RCO–H]+ and
less pronounced [RCOOH]+ (1–2%).Whereas -linolenic acid did not yield any fragments related
to the alcohol part, the spectra of linoleic acid esters (Figure 5a) contained an appreciably abundant
(6–12%) fragment [R’–3H]+ (HRAM of WE 14:1(n–5)-18:2(n–6): measured 192.1896, calcd.
192.1878, [C14H24]+; Supplemental Data, Spectrum #84). Esters of arachidonic acid provided
by guest, on Novem
ber 22, 2018w
ww
.jlr.orgD
ownloaded from

11
molecular ions and [RCOO]+ fragments close to the noise level. The polyunsaturated methylene-
interrupted double bond arrangement in the acid chains was easily disclosed based on the
pronounced m/z 108 (an n–3 arrangement in an α-linolenoic acid chain) and m/z 150 (an n–6
arrangement in an arachidonic acid chain) (30). The most pronounces low mass ions belonged to the
[CnH2n–1]+, [CnH2n–3]
+, [CnH2n–5]+, and [CnH2n–4]
+ aliphatic series; the base peak was m/z 55.
WEs with monounsaturated acid and polyunsaturated alcohol
The mass spectra of esters composed of monounsaturated FA and linoleyl or -linolenyl alcohol
contained molecular ions (2–3%) as well as fragments allowing the characterization of both ester
parts. The linoleyl alcohol esters (Figure 5b) yielded [RCO]+ (m/z 209; 6–8%), [RCO–3H]+ (4–
5%) (HRAM of WE 18:2(n–6)-14:1(n–5): measured mass 206.1686, calcd. mass 206.1671,
[C14H22O]+), [R’–H]+ (m/z 248; 5–7%) and [R’–C2H5]+ (m/z 220; 1–3%), whereas α-linolenyl
alcohol esters provided [RCO]+ (6–7%) and [R’O]+ (2–3%). As in the previous cases, the n–3
methylene-interrupted polyunsaturated system manifested itself by m/z 108 and the loss of small
radicals and butene from the molecular ions. The most abundant ion series were [CnH2n–1]+, [CnH2n–
3]+, [CnH2n–2]
+, and [CnH2n–4]+; the base peak was m/z 55.
WEs polyunsaturated in both chains
The molecular peaks of highly unsaturated WEs were either absent or up to 1%. Tiny acylium ions
[RCO]+ (up to 3%) were usually the only ions usable for characterizing the esters. These fragments
allowed distinctions to be made among the similar spectra of WE 18:2(n–6)-18:3(n–3) and
WE 18:3(n–3)-18:2(n-6) (m/z 261 and m/z 263, respectively). Some other fragments appearing
close to noise level, e.g., [RCOO–2H]+ in WE 18:2(n–6)-18:2(n–6) (HRAM: measured 277.2172,
calcd. 277.2162; [C18H29O2]+; Supplemental Data, Spectrum #124) or [R’O]+ in WE 18:2(n–6)-
20:4(n–3) (Figure 5c) were noticed. The most prominent low mass ions were those of the aliphatic
series [CnH2n–3]+, [CnH2n–5]
+ and [CnH2n–1]+ with m/z 67 [C6H7
+] or m/z 79 [C6H7+] being the base
peaks. The n–3 and n–6 polyunsaturated chains provided typical fragments as described above.
Although the spectra of highly polyunsaturated WEs did not provide prominent diagnostic peaks,
they were usually distinct enough to identify them correctly based on the WE library search.
This section is summarized in an overview of the important diagnostic fragments provided in
Table S1 in the Supplemental Data.
DIFFERENTIAL MASS SPECTRA
The correct interpretation of the spectra of WEs bearing specific structural features, such as
branching or double bonds often requires recognizing small peaks that are difficult to discern
among the other fragments. Relatively small differences in the ion intensities might also be
important for structure elucidation. However, such small nuances are easy to overlook. For
example, WEs with iso or anteiso branching in the alcohol chain yielded even electron fragments
by guest, on Novem
ber 22, 2018w
ww
.jlr.orgD
ownloaded from

12
after the elimination of radicals from [R’–H]+ and [R’–C2H5]+ and elevated fragments m/z 56 or
m/z 70, resp. When compared to straight-chain analogs, the spectra were almost undistinguishable at
first sight. However, when the spectra of the branched WEs and their straight-chain analogs were
subtracted, all the above mentioned features became clearly visible. An example of the differential
spectra of WE 12Me13:0-17:0 and WE 14:0-2Me16:0 calculated in this way is given in Figure 6a,b.
Having both spectra measured under the same experimental conditions is an important prerequisite
for calculating the differential spectra correctly. When analyzing WE mixtures by GC/MS, the
peaks of straight-chain WEs are usually present and their spectra are thus recorded under the same
conditions. The subtraction can easily be performed using standard library search software, such as
NIST MS Search.
Differential spectra were also useful for unsaturated WEs. As double bonds change the
fragmentation completely, the spectra of straight-chain esters could not be used for subtractions and
special reference spectra had to be created. This approach was based on an observation that low
mass fragments were practically the same within a group of WEs with the same number of double
bonds either in the alcohol or acid chain. The spectra differed from each other just in a small
number of peaks related to the particular acid and alcohol. When removed, “blank” generic spectra
were obtained. For instance, the generic spectrum of WEs X:0-Y:1 (Supplemental Data, Spectrum
#155 ) was constructed from the EI spectra of five esters (WE 22:0-18:1(n–9); WE 18:0-18:1(n–9);
WE 16:0-16:1(n–7); WE 14:0-16:1(n–7); WE 12:0-14:1(n–5)). In each spectrum, peaks
corresponding to [RCO–H]+, [RCO]+, [RCOOH2]+ [RCOOH]+, [R’–H]+ and [R’–C2H5]
+ were
deleted and the resulting spectra were summed (averaged). The generic spectrum was used for
calculating the differential spectra of WEs monounsaturated in the acid part. When applied for WE
14:0-18:1(n–9) (Figure 6c), all of the diagnostic fragments were better seen than in the original
spectrum. In principle, generic spectra can be calculated for all types of unsaturated esters and used
for calculating differential spectra.
TRENDS IN THE ION ABUNDANCES
The abundance of fragment ions is affected by their stability and the stability of the neutral products
formed during the decomposition of the molecular ions. Thus, the number of carbons in both chains
has an influence on the intensities of the diagnostic ions. Knowing the trends in the fragment ion
intensities might be useful for the interpretation process.
The most distinct fragments of saturated WEs were protonated acids ([RCOOH2]+). In a
series of WEs with the same alcohol and increasing acid chain length, the intensity of this particular
ion decreased as shown in Figure 7a. Interestingly, the curves exhibited distinct minima for all WEs
composed of stearic acid. In a series with the same acid and increasing alcohol chain length the
intensity of [RCOOH2]+ increased, see Figure 7b, which is likely related to the preferential loss of
the larger alkyl radicals at a reactive site. Similar trends were observed in the spectra of WEs with
monounsaturated acids; the abundance of [RCOOH2]+ decreased with the acid chain length,
whereas the intensities of [RCO–H]+ (the most distinct acid-related fragments in WEs X:0-Y:1)
by guest, on Novem
ber 22, 2018w
ww
.jlr.orgD
ownloaded from
13
increased with the number of carbons in saturated alcohol (Figure 7c,d). Radical cations [R’–H]+•
were significant fragments allowing the characterization of the alcohol parts of WEs. Their
abundances in saturated esters were not significantly affected by acid chain length (Figure 7e), but
decreased with the increasing number of carbons in the alcohol chain (Figure 7f). It was consistent
with the decreasing stability of the alkene radical cations (by analogy with the decreasing intensity
of molecular ions of 1-alkenes with the increasing number of carbons). A strong increase of the
[R’–H]+• signal with the length of the acid chain was observed for WEs with one double bond in the
alcohol chain (Figure 7g). When a double bond was located in acid, the [R’–H]+• fragments were
rather small and further decreased with the alcohol chain length (Figure 7h), analogously to the
saturated WEs.
The relative abundances of the low mass fragments (ions of aliphatic series) were found to
be affected by the number and location (alcohol vs. acid chain) of double bonds. They can serve as a
fingerprint for various WE types and can be used for constructing the artificial spectra suitable for
calculating differential mass spectra as shown above. We have noticed that the relative intensities of
the rearrangement ions m/z 60 and 61 can be used as an empirical measure indicating the number of
double bonds. This intensity ratio increased from ca 0.5 (saturated WEs) to ca 5 (polyunsaturated
WEs) as shown in Table S2 in the Supplemental Data. Such a ratio might be useful for analyzing
spectra lacking a molecular peak.
Conclusions
The EI mass spectra of intact WEs provided information about the molecular weight, number of
carbons and double bonds in the acid and alcohol chains and to some extent also about the positions
of methyl branching and double bonds. The molecular peaks were pronounced in saturated and
usually recognizable in most unsaturated WEs. Monounsaturated WEs with a double bond in the
alcohol chain were an exception; they lacked molecular ions entirely. A number of various
fragments utilizable for the characterization of the acid and alcohol chains were formed. Their
structures and abundances depended on the number and location (acid vs. alcohol chain) of the
double bonds and the chain lengths. Saturated WEs provided sufficiently abundant and
diagnostically relevant fragments for establishing the number of carbons in both chains. The methyl
branching of the aliphatic chains caused only tiny changes in the spectra appearance, which were
usually quite difficult to discern. The spectra features relevant to the branching sites became clearly
apparent from differential spectra calculated by the subtraction of the straight-chain analog spectra.
Unsaturated WEs provided less abundant diagnostic fragments for interpreting the spectra. The
double bond position in monounsaturated WEs had a negligible impact on the spectra; differential
spectra showed small variations in the ion intensities only for isomers with a double bond in close
proximity to an ester bond. The spectra of the cis/trans isomers were indistinguishable. Methylene-
interrupted double bond systems in polyunsaturated WEs were possible to disclose based on their
characteristic CnH(2n–4) fragments. With the increasing number of double bonds, the intensities of
the diagnostic ion decreased and the spectra of some very highly polyunsaturated esters did not
by guest, on Novem
ber 22, 2018w
ww
.jlr.orgD
ownloaded from

14
contain any fragments usable for interpretation. However, the low mass fragments were usually
characteristic enough for a successful identification by library search. Curiously, the number of
double bonds had an impact on the relative intensities of rearrangement ions m/z 60 and 61. Their
ratio might help to estimate the number of double bonds if both molecular ions and diagnostic
fragments are missing.
When analyzing WE mixtures by GC/MS, combining mass spectral data with retention
parameters is the best strategy for characterizing molecular species. The retention logic might
suggest e.g. branching, which is then confirmed from the differential mass spectrum. The mass
spectra discussed in this work have been recorded with standard ion source tuning. The intensities
of the molecular ions and some fragments can be enhanced by changing the ion source parameters
or using EI-MS with a supersonic molecular beam (31).
by guest, on Novem
ber 22, 2018w
ww
.jlr.orgD
ownloaded from
15
Acknowledgements
The research was supported by the Czech Science Foundation GACR (Project No. 203/09/0139)
and Academy of Sciences of the Czech Republic (Research Project Z4 055 0506). The authors
thank Dr. Anna Březinová for help with the sample measurement and Mr. Sean Mark Miller for
proofreading the manuscript and making corrections.
by guest, on Novem
ber 22, 2018w
ww
.jlr.orgD
ownloaded from

16
References
1. Gunstone, F.D., J. L. Harwood, and A. J. Dijkstra. 2007. The Lipid Handbook, CRC Press, Boca
Raton, FL.
2. Riederer, M., and C. Müller. 2006. Biology of the Plant Cuticle, Blackwell Publishing Ltd.
3. Lee, R. F., W. Hagen, and G. Kattner. 2006. Lipid storage in marine zooplankton. Mar. Ecol.:
Prog. Ser. 307: 273-306.
4. Nelson, D. R. and G. J. Blomquist. 1995. Waxes, chemistry, molecular biology and functions,
(Ed.: R. J. Hamilton), The Oily Press, Dundee, Scotland. 1-90.
5. Varanasi, U., H. R. Feldman, and D. C. Malins. 1975. Molecular basis for formation of lipid
sound lens in echolocating cetaceans. Nature. 255: 340-343.
6. Rissmann, R., H. W. W. Groenink, A. M. Weerheim, S. B. Hoath, M. Ponec, and J. A. Bouwstra.
2006. New insights into ultrastructure, lipid composition and organization of vernix caseosa. J.
Invest. Dermatol. 126: 1823-1833.
7. Rawlings, A. V. 1995. Waxes, chemistry, molecular biology and functions, (Ed.: R. J. Hamilton),
The Oily Press, Dundee, Scotland. 223-256.
8. Masukawa, Y., H. Tsujimura, and G. Imokawa. 2005. A systematic method for the sensitive and
specific determination of hair lipids in combination with chromatography. J. Chromatogr. B:
Biomed. Appl. 823: 131-142.
9. Kocer, M., T. Guldur, M. Akarcay, M. C. Miman, and G. Beker. 2008. Investigation of age, sex
and menstrual stage variation in human cerumen lipid composition by high performance thin
layer chromatography. J. Laryngol. Otol. 122: 881-886.
10. Butovich, I. A., E. Uchiyama, and J. P. McCulley. 2007. Lipids of human meibum: mass-
spectrometric analysis and structural elucidation. J. Lipid Res. 48: 2220-2235.
11. Hargrove, J. L., P. Greenspan, and D. K. Hartle. 2004. Nutritional significance and metabolism
of very long chain fatty alcohols and acids from dietary waxes. Exp. Biol. Med. 229: 215-226.
by guest, on Novem
ber 22, 2018w
ww
.jlr.orgD
ownloaded from

17
12. Hamilton, R. J. 1995. Waxes: Chemistry, Molecular Biology and Functions, (Ed. R. J.
Hamilton), The Oily Press, Dundee, Scotland. 257–310.
13. Vrkoslav, V., R. Míková, and J. Cvačka. 2009. Characterization of natural wax esters by
MALDI-TOF mass spectrometry. J. Mass Spectrom. 44: 101-110.
14. Vrkoslav, V., K. Urbanová, and J. Cvačka. 2010. Analysis of wax ester molecular species by
high performance liquid chromatography/atmospheric pressure chemical ionisation mass
spectrometry. J. Chromatogr. A. 1217: 4184-4194.
15. Vrkoslav, V., M. Háková, K. Pecková, K. Urbanová, and J. Cvačka. 2011. Localization of
double bonds in wax esters by high-performance liquid chromatography/atmospheric pressure
chemical ionization mass spectrometry utilizing the fragmentation of acetonitrile-related
adducts. Anal. Chem. 83: 2978-2986.
16. Aasen, A. J., H. H. Hofstett, B. T. R. Iyengar, and R. T. Holman. 1971. Identification and
analysis of wax esters by mass spectrometry. Lipids. 6: 502-507.
17. Vajdi, M., W. W. Nawar, and C. Merritt. 1981. GC/MS analysis of some long chain esters,
ketones and propanediol diesters. J. Am. Oil Chem. Soc. 58: 106-110.
18. Audisio, G., A. Rossini, G. Bianchi, and P. Avato. 1987. GC-MS determination of mixtures of
long chain aliphatic esters. J. High Resolut. Chromatogr. 10: 594-597.
19. Arrendale, R. F., R. F. Severson, O. T. Chortyk, and M. G. Stephenson. 1988. Isolation and
identification of the wax esters from the cuticular waxes of green tobacco leaf. Beitrage zur
Tabakforschung International. 14: 67-84.
20. Bianchi, G., A. Tava, G. Vlahov, and N. Pozzi. 1994. Chemical structure of long-chain esters
from “sansa” olive oil. J. Am. Oil Chem. Soc. 71: 365-369.
21. Reiter, B., M. Lechner, E. Lorbeer, and R. Aichholz. 1999. Isolation and characterization of wax
esters in fennel and caraway seed oils by SPE-GC. J. High Resolut. Chromatogr. 22: 514-520.
by guest, on Novem
ber 22, 2018w
ww
.jlr.orgD
ownloaded from

18
22. Zhang, L. X., Y. F. Yun, Y. Z. Liang, and D. S. Cao. 2010. Discovery of mass spectral
characteristics and automatic identification of wax esters from gas chromatography mass
spectrometry data. J. Chromatogr. A. 1217: 3695-3701.
23. Spencer, G. F. 1979. Alkoxy-acyl combinations in the wax esters from winterized sperm whale
oil by gas chromatography-mass spectrometry. J. Am. Oil Chem. Soc. 56: 642-646.
24. Pereira, A. S., D. S. Siqueira, V. O. Elias, B. R. Simoneit, J. A. Cabral, and F. R. Aquino Neto.
2002. Three series of high molecular weight alkanoates found in Amazonian plants.
Phytochemistry. 61: 711-719.
25. Stránský, K., M. Zarevúcka, I. Valterová, Z. Wimmer. 2006. Gas chromatographic retention
data of wax esters. J. Chromatogr. A. 1128: 208-219.
26. Nystrom, R. F. and W. G. Brown. 1947. Reduction of Organic Compounds by Lithium
Aluminum Hydride. I. Aldehydes, Ketones, Esters, Acid Chlorides and Acid Anhydrides. J.
Am. Chem. Soc. 69: 1197-1199.
27. McFadden, W. H., L. E. Boggs, and R. G. Buttery. 1966. Specific rearrangements in mass
spectra of butyl hexanoates and similar aliphatic esters. J. Phys. Chem. 70: 3516-3523.
28. Christie, W. W. 2011. The AOCS Lipid Library (Ed. W.W. Christie), URL:
http://lipidlibrary.aocs.org/.
29. National Institute of Standards and Technology (NIST) Library, 2005 Edition, Gaithersburg,
MD, USA.
30. Fellenberg, A. J., D. W. Johnson, A. Poulos, and P. Sharp. 1987. Simple mass-spectrometric
differentiation of the normal-3, normal-6 and normal-9 series of methylene interrupted
polyenoic acids. Biomed. Environ. Mass Spectrom. 14: 127-129.
31. Amirav, A., A. Gordin, M. Poliak, and A. B. Fialkov. 2008. Gas chromatography-mass
spectrometry with supersonic molecular beams. J. Mass Spectrom. 43: 141-163.
by guest, on Novem
ber 22, 2018w
ww
.jlr.orgD
ownloaded from

19
Figure Captions:
Figure 1. The EI mass spectrum of tetradecyl heptadecanoate (WE 14:0-17:0).
Figure 2. The EI mass spectrum of tetradecyl 10-methylhexadecanoate (WE 14:0-10Me16:0) (a)
and tetradecyl 2-methylhexadecanoate (WE 14:0-2Me16:0) (b). For a description of the unmarked
ions, see Fig.1.
Figure 3. The EI mass spectrum of 12-methyltridecyl heptadecanoate (WE 12Me13:0-17:0; for a
description of the unmarked ions, see Fig.1.) (a) and pristanyl myristate (WE 2,6,10,14-
tetraMe15:0-14:0) (b).
Figure 4. The EI mass spectrum of myristyl oleate (WE 14:0-18:1(n-9)) (a) and myristoleyl stearate
(WE 14:1(n–5)-18:0) (b).
Figure 5. The EI mass spectrum of myristoleyl linolate (WE 14:1(n–5)-18:2(n–6)) (a), linoleyl
myristoleate (WE 18:2(n–6)-14:1(n–5)) (b) and linoleyl arachidonate (WE 18:2(n–6)-20:4(n–3))
(c).
Figure 6. The EI differential mass spectrum of 12-methyltridecyl heptadecanoate (WE 12Me13:0-
17:0) (a), tetradecyl 2-methylhexadecanoate (WE 14:0-2Me16:0) (b) and myristyl oleate (WE 14:0-
18:1(n–9)) (c).The spectra were constructed by the subtraction of the spectrum of WE 14:0-17:0
(a,b) or the generic spectrum WEs X:0-Y:1 (c). For details, see the Results and Discussion section.
Figure 7. The dependences of the fragment ion abundances on the number of carbons in the acid
(a,c,e,g) and alcohol (b,d,f,h) chains. The error bars are standard deviations calculated from five
measurements.
by guest, on Novem
ber 22, 2018w
ww
.jlr.orgD
ownloaded from