structural elucidation of guanosine self - qspace - queen's university
TRANSCRIPT

STRUCTURAL ELUCIDATION OF GUANOSINE SELF-
ASSEMBLIES USING SPECTROSCOPIC AND COMPUTATIONAL
METHODS
by
Irene Ching Man Kwan
A thesis submitted to the Department of Chemistry
In conformity with the requirements for
the degree of Doctor of Philosophy
Queen’s University
Kingston, Ontario, Canada
(June, 2012)
Copyright © Irene Ching Man Kwan, 2012
i
Abstract
In this thesis, we document a comprehensive study of the cation-directed self-
assembly of three guanosine derivatives: i) guanosine 5'-monophosphate (5'-GMP), ii)
guanosine 5'-thiomonophosphate (5'-GSMP), and iii) 2',3',5'-O-triacetylguanosine (TAG).
We discovered that, under the neutral pH condition, Na2(5'-GMP) molecules self-
assemble into a right-handed helix structure consisting of alternating all-C2'endo and all-
C3'endo planar G-quartets stacking on top of each other with a 30° twist. This self-
assembled supramolecular structure uses multiple non-covalent forces (e.g., hydrogen-
bond, phosphate-hydroxyl, π-π (base-base) stacking, ion-carbonyl, and ion-phosphate) to
align individual monomers in a way that resembles RNA and DNA sequences in which
covalent bonds are used to link monomers. Na+ ions are located in the channel and
surface sites of the G-quadruplex. In contrast, under acidic pH conditions, Na2(5'-GMP)
molecules self-assemble into a continuous right-handed helix where guanine bases are
hydrogen-bonded in a lock-washer fashion with only C3'-endo monomers. Na+ ions are
absent in the channel site due to smaller channel radius and lesser repulsions between
phosphate groups (-1 vs. -2 charge under neutral pH) contribute to the stronger stacking
mechanism. In Na2(5'-GSMP), a longer phosphate bond compared with Na2(5'-GMP)
allows stronger P-O-…Na+…-O-P interactions to occur, thus enhancing self-assembly.
Solid-state NMR, FT-IR, powder x-ray diffraction, model building, and calculation
showed that Na2(5'-GSMP) forms the same self-assembled structure as Na2(5'-GMP) but
with significantly greater tendency. This study proves that single-bond modification can
enhance stacking in G self-assemblies, and shows direct evidence that Na+ ions reside at

ii
the surface (phosphate) sites. Lastly, using lipophilic TAG, we were able to show for the
first time that trivalent lanthanide metal ions can facilitate G-quartet formation. A new
mode of metal ion binding in G-quartet structures (i.e., a triple-decker G dodecamer
containing a single metal ion in the central G-quartet) is reported. We also report the first
1H and 43Ca NMR characterization of Ca2+-templated G-quartet formation in a [TAG8-
Ca]2+ octamer.
iii
Acknowledgements
First of all, I would like to sincerely thank my supervisor, Professor Dr. Gang Wu,
for being such a great mentor throughout my graduate studies. I would like to thank him
for all the opportunities, guidance, support, and patience he gave me during my studies,
and all his help with the thesis. I would also like to knowledge him for all the solid-state
NMR experiments performed for this thesis. I have learned very much from him in the
past few years, and I shall forever be grateful for these valuable knowledge and
experiences in the lab. Thank you again, Dr. Wu!! ☺
Secondly, I would like to thank my committee members Drs. Anne Petitjean and
J. Hugh Horton for their advices over the years. My Wu group colleagues Jennifer
Adams, Parisa Akhshi, Dr. Ramsey Ida, Dr. Xianqi Kong, Xin Mo, Dr. Alan Wong, and
Dr. Jianfeng Zhu are acknowledged for their fruitful discussions, support, and friendships
in and outside the lab. Alan is also thanked for helping us with the 43Ca NMR
experiments at University of Warwick. I would also like to thank Drs. Françoise Sauriol
and Harmut Schmeider (High Performance Computing Virtual Laboratory) for their help
with the NMR spectrometers and quantum chemical calculations, respectively. I thank
Mr. Alan Grant (Geology) for x-ray powder diffraction analysis, and Dr. Yi-Min She for
his assistance in ESI-MS experiments. I would also like to thank Drs. Zhimin Yan and
Yining Huang of the University of Western Ontario for the REDOR experiment, and Drs.
Eric Ye and Victor Terskikh for helping me with the 2D BABA, 31P{1H} HETCOR, and
1D ultra-fast MAS 1H experiments at the 900 MHz NMR facility in Ottawa. Access to
the 900 MHz NMR spectrometer was provided by the National Ultrahigh Field NMR
iv
Facility for Solids (Ottawa, Canada), a national research facility funded by the Canada
Foundation for Innovation, the Ontario Innovation Trust, Recherche Québec, the National
Research Council Canada, and Bruker BioSpin and managed by the University of
Ottawa. I would also like to thank Dr. Xiaohu Yan (Medicine) for the training in using a
scanning electron microscope, and Dr. Suning Wang for the access of a fluorescence
spectrometer. Dr. David Hodgson (Durham, UK) is acknowledged for providing us the
5'-GSMP sample.
I would also like to express gratitude to my parents Kwan Kin Ming and Mak Oi
Kam, and siblings Shuk Man (Joyce) and Chun Kit (Peter) for their love, support, and
encouragement throughout all these years. I am also grateful to all of my aunts, uncles,
and cousins for the joyous times we shared. Jeffrey W. Walsh and his family are
acknowledged for having been holding my hands during difficult times. Thank you for
your continuous beliefs in me. I also want to express gratitude to all my friends around
the world, for their friendships and encouraging words from time to time.
Lastly, I would like to dedicate this thesis to my late grandparents, especially my
grandmother Pak Hang Fong. Thank you for your unconditional love and care when I
was young and little. I hope you all rest in peace now, and continue to watch over us from
above.

v
Statement of Originality
I hereby certify that all of the work described within this thesis is the original work of the author.
Any published (or unpublished) ideas and/or techniques from the work of others are fully
acknowledged in accordance with the standard referencing practices.
Irene Ching Man Kwan
June, 2012
vi
Table of Contents
Abstract............................................................................................................................................. i
Acknowledgements.........................................................................................................................iii
Statement of Originality................................................................................................................... v
Table of Contents............................................................................................................................vi
List of Figures................................................................................................................................. ix
List of Tables ...............................................................................................................................xvii
List of Abbreviations & Symbols .................................................................................................xix
Chapter 1 Introduction ..................................................................................................................... 1
1.1 Nucleic Acids and the double-helix model ............................................................................ 1
1.2 A special kind of nucleic acid structure: G-quadruplex......................................................... 9
1.3 The first biological G-quadruplex: 5'-GMP......................................................................... 14
1.4 Motivation and organization of the thesis............................................................................ 19
Chapter 2 Structure determination of disodium guanosine 5'-monophosphate G-quadruplex in
neutral solution .............................................................................................................................. 22
2.1 Introduction.......................................................................................................................... 22
2.2 Experimental Details............................................................................................................ 22
2.2.1 Sample preparation ....................................................................................................... 22
2.2.2 NMR spectroscopy........................................................................................................ 23
2.2.3 Quantum chemical calculations .................................................................................... 28
2.3 Results and Discussion ........................................................................................................ 28
2.3.1 Confirmation of G-quadruplex formation..................................................................... 28
2.3.2 Relative sizes of Na2(5'-GMP) aggregates.................................................................... 36
2.3.3 G-quadruplex building blocks: monomer structures..................................................... 40
2.3.3.1 Proton resonance assignment ................................................................................. 41
2.3.3.2 Anti vs. syn, C2'-endo vs. C3'-endo conformations, and 3JHH coupling constants .45
2.3.3.3 Carbon-13 chemical shifts, 1JCH coupling constants, and assignment of H5' and
H5'' ..................................................................................................................................... 54
2.3.3.4 Connectivity between H8 and H1' signals ............................................................. 57
2.3.3.5 Connectivity between H8 and base exchangeable protons .................................... 59
2.3.3.6 Heteronuclear 1H-31P COSY and 3JPH coupling constants...................................... 60
2.3.3.7 Torsion angles β, γ, and δ in C2'-endo and C3'-endo monomers........................... 62
vii
2.3.3.8 Confirmation of monomer structures using quantum chemical calculations ......... 64
2.3.4 G-quartet arrangement .................................................................................................. 70
2.3.5 G-quadruplex formation................................................................................................ 71
2.3.6 Role of metal ions ......................................................................................................... 77
2.3.7 Confirmation of stacking dimers................................................................................... 78
2.4 Conclusion ........................................................................................................................... 82
Chapter 3 Structural determination of disodium guanosine 5'-monophosphate G-quadruplex under
acidic conditions ............................................................................................................................ 84
3.1 Introduction.......................................................................................................................... 84
3.2 Experimental ........................................................................................................................ 87
3.2.1 Sample preparation ....................................................................................................... 87
3.2.2 Solid-state 1D NMR ..................................................................................................... 87
3.2.3 Solid-state 2D NMR ..................................................................................................... 88
3.2.4 FT-IR............................................................................................................................. 89
3.3 Results and Discussion ........................................................................................................ 89
3.3.1 Determination of helix-orientation using 13C NMR and FT-IR .................................... 89
3.3.2 A unique G-quadruplex feature: absence of channel ions ............................................ 94
3.3.3 Phosphate-amino hydrogen-bonds................................................................................ 98
3.4 Conclusion ......................................................................................................................... 105
Chapter 4 Self-assembled G-quadruplex structures of disodium guanosine 5'-thiomonophosphate:
the role of cation bridging............................................................................................................ 106
4.1 Introduction........................................................................................................................ 106
4.2 Experimental ...................................................................................................................... 108
4.2.1 Synthesis and solution sample preparation ................................................................. 108
4.2.2 Solution-state NMR .................................................................................................... 108
4.2.3 Solid-state NMR ......................................................................................................... 109
4.2.4 FT-IR and powder x-ray diffraction............................................................................ 110
4.2.5 Quantum chemical calculations .................................................................................. 110
4.2.6 Scanning Electron Microscopy (SEM) ....................................................................... 111
4.3 Results and Discussion ...................................................................................................... 111
4.3.1 Solution-state experiments.......................................................................................... 111
4.3.2 Solid-state experiments ............................................................................................... 116
4.4 Conclusions........................................................................................................................ 127

viii
Chapter 5 G-quartet formation of 2', 3', 5'-O-triacetylguanosine promoted by divalent and
trivalent cations............................................................................................................................ 129
5.1 Introduction........................................................................................................................ 129
5.2 Experimental ...................................................................................................................... 131
5.2.1 Sample preparation ..................................................................................................... 131
5.2.2 Solution-state NMR .................................................................................................... 131
5.2.3 Mass Spectrometry...................................................................................................... 133
5.2.4 Fluorescence ............................................................................................................... 134
5.2.5 Quantum chemical calculations .................................................................................. 134
5.3 Results and discussion ....................................................................................................... 135
5.3.1 [TAG]M3+ G-quadruplexes ......................................................................................... 135
5.3.1.1 Mixture of large G-quadruplexes......................................................................... 135
5.3.1.2 Ion-size dependent [TAG]M3+ aggregate formation ............................................ 139
5.3.1.3 Fluorescence properties of [TAG]M3+ G-quadruplexes....................................... 145
5.3.2 [TAG]Ca2+ G-quadruplex ........................................................................................... 148
5.3.2.1 Formation of discrete octamers............................................................................ 148
5.3.2.2 Direct detection of Ca2+ by calcium-43 NMR ..................................................... 152
5.3.2.3 Quantum chemical calculations ........................................................................... 154
5.4 Conclusion ......................................................................................................................... 156
Chapter 6 Concluding remarks .................................................................................................... 158
References.................................................................................................................................... 161
Appendices...................................................................................................................................180

ix
List of Figures
Figure 1-1. (Top) Basic components of DNA and RNA: nucleic acid bases, pentose sugar, and
phosphate. (Bottom) An example of mononucleotide: guanylic acid (also known as
guanosine 5'-monophosphate) with all atom labels. ................................................................ 2
Figure 1-2. C2'-endo (S) and C3'-endo (N) puckering of the ribose ring. ....................................... 3
Figure 1-3. Definitions of anti and syn conformations in a guanylic acid molecule. ...................... 5
Figure 1-4. Definitions of the torsion angle γ along the C4'-C5' bond, looking in the direction of
C5' to C4'.................................................................................................................................. 5
Figure 1-5. A DNA polynucleotide chain........................................................................................ 6
Figure 1-6. Watson-Crick base pairings in DNA and RNA. R = ribose and phosphate groups. ..... 8
Figure 1-7. (From left to right) A, B, and Z-form of DNA.............................................................. 9
Figure 1-8. Hoogsteen type of base-pairing between A and T. ..................................................... 10
Figure 1-9. Hydrogen bond donors and acceptors of guanosine 5'-monophosphate which
participate in G-quadruplex formation................................................................................... 11
Figure 1-10. (Left) G-quartet with Hoogsteen hydrogen-bonding atoms labeled and (right) G-
quadruplex formed with multiple layers of stacked G-quartets and metal cations. R = 5'-
phosphate ribose..................................................................................................................... 11
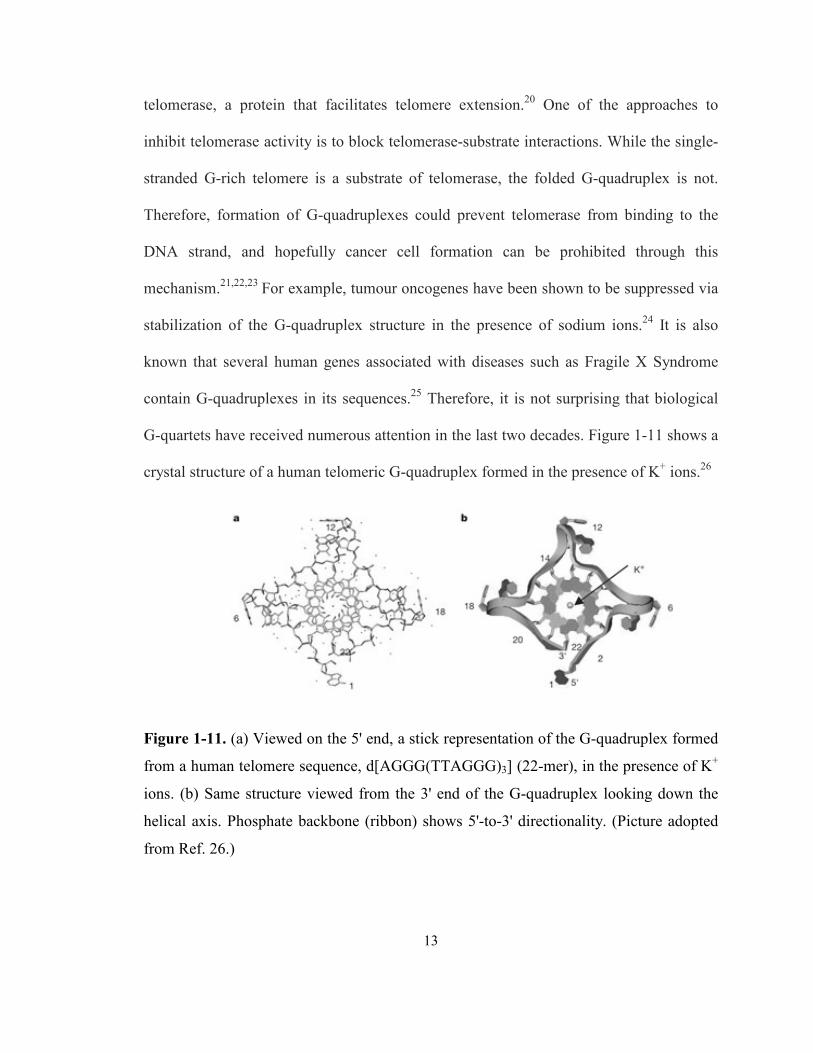
Figure 1-11. (a) Viewed on the 5' end, a stick representation of the G-quadruplex formed from a
human telomere sequence, d[AGGG(TTAGGG)3] (22-mer), in the presence of K+ ions. (b)
Same structure viewed from the 3' end of the G-quadruplex looking down the helical axis.
Phosphate backbone (ribbon) shows 5'-to-3' directionality. (Picture adopted from Ref. 26.)13
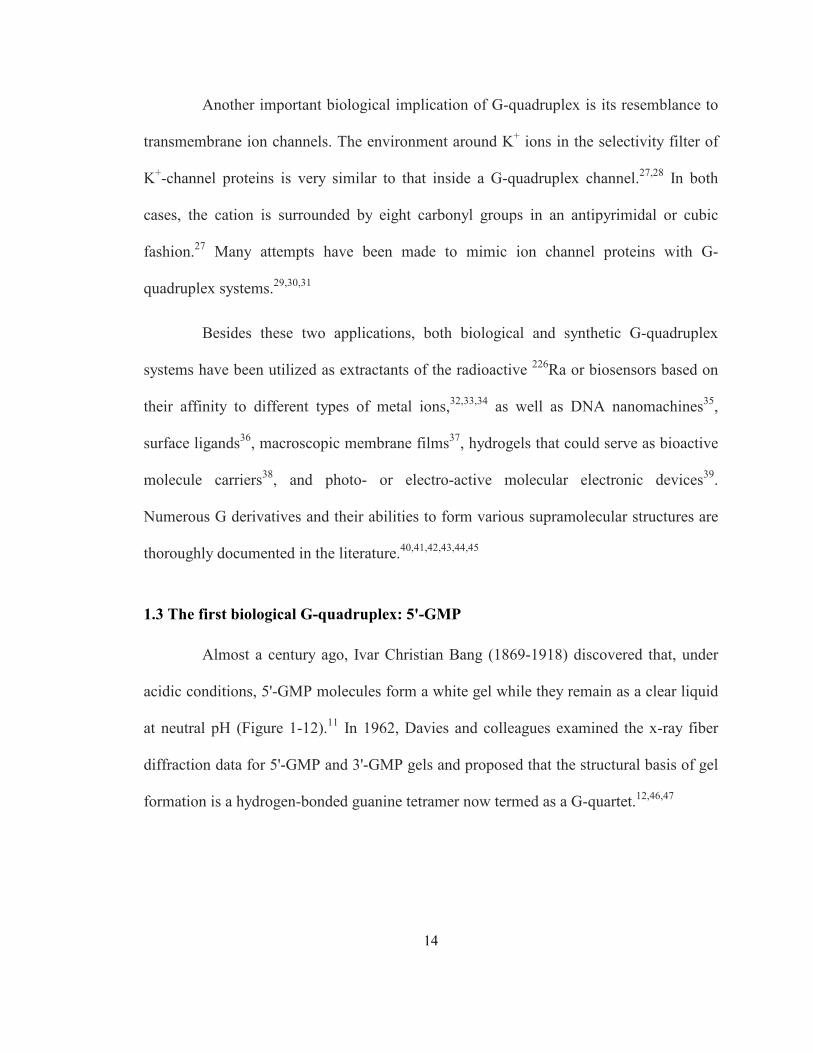
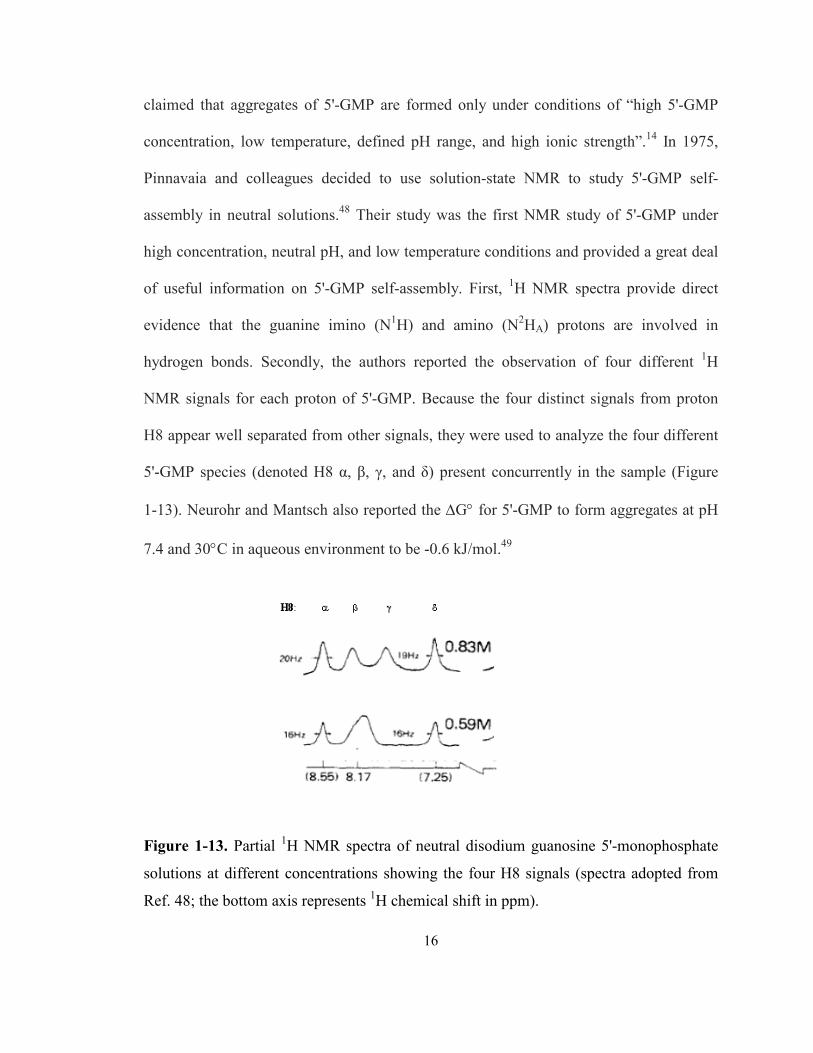
Figure 1-12. Disodium guanosine 5'-monophosphate aggregates formed under pH 5 (left) and pH
8 (right) conditions. The samples are of the same concentrations. ........................................ 15
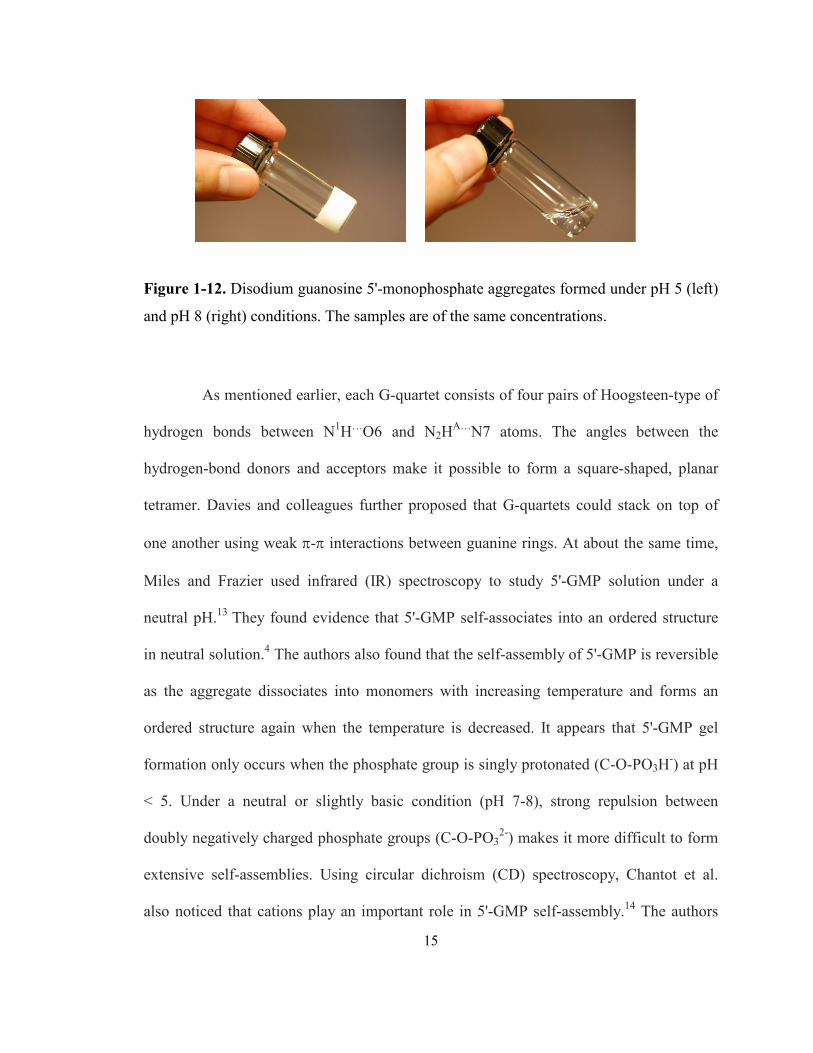
Figure 1-13. Partial 1H NMR spectra of neutral disodium guanosine 5'-monophosphate solutions
at different concentrations showing the four H8 signals (spectra adopted from Ref. 48; the
bottom axis represents 1H chemical shift in ppm). ................................................................ 16
Figure 2-1. The 1H NMR spectrum of a 0.1 M neutral Na2(5'-GMP) in D2O at 298 K................. 29
Figure 2-2. 1H NMR spectra of a neutral 1.0 M Na2(5'-GMP) solution in D2O at various
temperatures and 14.1 T and pH 8. ........................................................................................ 30
x
Figure 2-3. 1H NMR spectra of a neutral 1.0 M Na2(5'-GMP) solution in 1:1 H2O/D2O at various
temperatures and 14.1 T and pH 8. The broad shoulder next to H8γ belongs to an unassigned
hydrogen-bonded proton........................................................................................................ 30
Figure 2-4. 1H NMR spectra of a neutral 1.0 M Na2(5'-GMP) solution in D2O (top) and 1:1
H2O/D2O (bottom) at various temperatures and 14.1 T. ........................................................ 32
Figure 2-5. G-quartet with one pair of Hoogsteen-type of hydrogen-bonds highlighted in red.
Nuclear Overhauser effect (NOE) is present between protons N1H-N2HA (intra-molecular),
and H8-N1H, H8-N2HA (inter-molecular). R' = 5'-phosphate ribose...................................... 34
Figure 2-6. 2D NOESY spectrum of a neutral 1.0 M Na2(5'-GMP) solution in 1:1 H2O/D2O at 278
K and 14.1 T with a mixing time of 50 ms showing the H8 and exchangeable protons
regions. Intra-molecular NOE’s between N1H and N2HA are highlighted in the green box.
H8(α)-N2HA(δ) cross peak is highlighted in the black box (see text for explanation). α and δ
species are represented in red and blue, respectively............................................................. 35
Figure 2-7. (Top) Diffusion 1H NMR results of 1.0 M neutral Na2(5'-GMP) in D2O at 278.0 K and
14.1 T. The four curves represent proton signals H8α, β, γ, and δ. (Bottom) 2D DOSY
spectra showing the relative log(Dt) values of the four H8 signals at 278 K and 298 K. ...... 39
Figure 2-8. 2D 1H-1H COSY spectrum showing the ribose region of 1.0 M neutral Na2(5'-GMP)
in D2O at 298 K and 14.1 T. Cross peaks with scalar couplings are connected with lines.
Note that the stereospecific assignment of proS and proR protons (H5'/H5'') are arbitrarily
assigned. (Color code for the four species: red α, green β, brown γ, blue δ). ....................... 42
Figure 2-9. 2D TOCSY spectra of 1.0 M neutral Na2(5'-GMP) in D2O at 298 K and 14.1 T. Cross
peaks of spins from an unbroken chain of scalar coupling are connected with dotted lines.
Mixing times: a) 50 ms, b) 100 ms, c) 200 ms, and d) 400 ms. ............................................. 43
Figure 2-10. Long-range COSY spectrum showing the ribose region of 1.0 M neutral Na2(5'-
GMP) in D2O at 298.0 K and 14.1 T. Cross peaks with scalar couplings are connected with
lines. Note that the stereospecific assignment of proS and proR protons (H5'/H5'') were
arbitrarily assigned for all species. (Color code for the four species: red α, green β, brown γ,
blue δ). ................................................................................................................................... 44
Figure 2-11. 2D DOSY-NOESY spectrum of 1.0 M neutral Na2(5'-GMP) in H2O/D2O at 278 K
and 14.1 T. Mixing time 50 ms. Cross peaks that give structural information are boxed in. 47
Figure 2-12. Contour plot of the cross peak expressed as an “anti-phase square array” of
multiplets. Positive contours are colored black, and negative red. The anti-phase doublet is
plotted for both axes............................................................................................................... 48

xi
Figure 2-13. Relationship between J and linewidth (LW) in affecting the intensity of a 2D COSY
cross peak signal. (Figure adopted from Ref.72). .................................................................. 48
Figure 2-14. Partial plot of a theoretical DQF-COSY spectrum of a four-spin system. ................ 50
Figure 2-15. Simulated multiplicities of a three-spin system using equations listed in Table 2-6
with controllable parameters: active-J = 9 Hz, passive-J = 6 Hz, and LW = 14 Hz.............. 51
Figure 2-16. Phase sensitive DQF-COSY of 1.0 M neutral Na2(5'-GMP) in D2O at 298 K and
14.1 T. Positive contour is colored black, and negative red. Correlations (3JHH) of GMP
ribose protons are linked using red and blue dotted line for C2'-endo and C3'-endo G-
quadruplex, respectively. Coupling constants are extracted from cross peaks (labeled boxes
with measured “apparent J-couplings”) in next page. ........................................................... 52
Figure 2-17. (Top) HSQC spectrum of neutral 1.0 M Na2(5'-GMO) in D2O at 298 K and 14.1 T
showing the ribose region. (Bottom) The same HSQC spectrum showing the heteronuclei
C8-H8 spin-spin correlations. 1JCH coupling constants are measured directly from the
spectrum................................................................................................................................. 55
Figure 2-18. 13C-NMR spectrum of neutral 1.0 M Na2(5'-GMP) in D2O at 298 K and 14.1 T. .... 56
Figure 2-19. 13C-1H heteronuclear couplings (3J or 4J) for protons H8 (blue) and H1' (red) that
connects them to each other in the Na2(5'-GMP) molecule. .................................................. 58
Figure 2-20. (Left) 2D 1H-13C HSQC and (right) gradient-enhanced HMBC spectra of 1.0 M
Na2(5'-GMP) in D2O at 298 K and 14.1 T. ............................................................................ 58
Figure 2-21. (Top) 13C-1H heteronuclear couplings that connects H8 and N1H through C5 in
Na2(5'-GMP). (Bottom) 2D refocused-HMBC spectrum of 1.0 M Na2(5'-GMP) in 90% H2O/
10% D2O at 298 K and 14.1 T. .............................................................................................. 59
Figure 2-22. Phase sensitive, proton-detected 1H-31P COSY of 1.0 M neutral Na2(5'-GMP) in D2O
at 298 K and 14.1 T. Positive contour is colored black, and negative red. Correlations (3JHP)
are linked using dotted lines. Labeled boxes are expanded views of 1H-31P COSY cross
peaks used to measure “apparent J-couplings”...................................................................... 61
Figure 2-23. The 3JH4'H5' and 3JH4'H5'' coupling constants calculated as a function of the torsion
angle γ (O5'-C5'-C4'-C3') on the basis of their Karplus relations. Solid and dotted straight
lines represent experimental coupling constants from C2'-endo and C3'-endo molecules,
respectively. (Plot adopted from Ref. 75). ............................................................................. 63
Figure 2-24. The 3JH5'P5 and 3JH5''P5 coupling constants calculated as a function of the torsion angle
β (P5-O5'-C5'-C4') on the basis of their Karplus relations. Solid and dotted straight lines

xii
represent experimental coupling constants from C2'-endo and C3'-endo molecules,
respectively. (Plot adopted from Ref. 75). ............................................................................. 64
Figure 2-25. Experimental and calculated (B3LYP/6-311++G(d,p)) 13C NMR chemical shifts of
the C2'-endo and C3'-endo 5'-GMP monomers. .................................................................... 67
Figure 2-26. Differences in experimental and calculated 1H and 13C chemical shifts between the
C2'-endo and C3'-endo conformers........................................................................................ 67
Figure 2-27. Final models of calculated 5'-GMP molecules using B3LYP/6-311++G(d,p). ........ 68
Figure 2-28. NOESY spectrum of a neutral 1.0 M Na2(5'-GMP) solution in 1:1 H2O/D2O at 278 K
and 14.1 T with a mixing time of 50 ms. Expected cross peak for adjacent-C2'-endo/C3'-
endo or alternate-C2'-endo/C3'-endo G-quartet are enclosed in the boxes. (This spectrum is
an enlarged portion of Figure 2-6). ........................................................................................ 70
Figure 2-29. 2D NOESY spectrum of a neutral 1.0 M Na2(5'-GMP) solution in 1:1 H2O/D2O at
278 K and 14.1 T with a mixing time of 50 ms. The inter-quartet cross peaks are highlighted
using arrows. C2'-endo and C3'-endo signals are in red and blue, respectively. .................. 72
Figure 2-30. Enlarged 2D NOESY spectrum showing the ribose region of a neutral 1.0 M Na2(5'-
GMP) solution in 1:1 H2O/D2O at 278 K and 14.1 T with a mixing time of 50 ms. The inter-
quartet cross peaks are highlighted using arrows. C2'-endo and C3'-endo signals are in red
and blue, respectively............................................................................................................. 73
Figure 2-31. The two faces of a G-quartet. Hoogsteen hydrogen bond with a clockwise rotation
from donor to acceptor is called the “head” face, and the “tail” face has a counter-clockwise
rotation. .................................................................................................................................. 73
Figure 2-32. (Left) A full turn of the right-handed 5'-GMP G-quadruplex with Na+ ions (purple
balls) reside in the channel site. (Right) Top view of the G-quadruplex where Na+-P
distances are highlighted and labeled..................................................................................... 74
Figure 2-33. (Left) A partial structure of the 5'-GMP helix showing inter-quartet phosphate-
hydroxyl hydrogen-bonds, where O…O distances are given. (Right) Schematic display of the
hydrogen-bond linkage along the 5'-GMP helix. ................................................................... 76
Figure 2-34. Solution-state 23Na NMR of 1.0 M Na2(5'-GMP) in D2O at 298 K and 14.1 T. Peaks
assignment for phosphate-bound and channel Na+ ions are obtained using reference........... 78
Figure 2-35. NOESY spectrum of a neutral 1.0 M Na2(5'-GMP) solution in 1:1 H2O/D2O at 278 K
and 14.1 T with a mixing time of 50 ms. Expected G-quartet cross peak between H8(β) and
N1H(β) is shown in the box. (This spectrum is an enlarged portion of Figure 2-6)............... 80

xiii
Figure 2-36. The structure of a GG32 dimer according to Jeffrey and Saenger’s notations. R = 5'-
phosphate ribose..................................................................................................................... 80
Figure 2-37. ROESY spectrum of a 1.0 M Na2(5'-GMP) solution in H2O/D2O at 298 K and 14.1
T, with a mixing time of 100 ms. The cross peaks due to chemical exchange are labeled.
Diagonal and exchange cross peaks are in the same phase (black), while NOE cross peaks
are in opposite phase (red). .................................................................................................... 81
Figure 3-1. Illustration of planar G-quartet (left) as in neutral Na2(5'-GMP) solution and acidic
Na2(3'-GMP) gel; (right) open-ended G-quartet as in acidic Na2(5'-GMP) gel. Red = O, blue
= N, and gray = C. Ribose rings and hydrogen atoms are omitted for clarity. ...................... 85
Figure 3-2. Solid-state 13C CP-MAS spectrum of acidic Na2(5'-GMP)/HCl gel at 14.1 T and
spinning at 11 kHz. ................................................................................................................ 91
Figure 3-3. Canonical coordinate prediction plot for RNA ribose C2'/C3'-endo puckering adopted
from Olenschlager et al. The white and black dots represent RNA residues with known C3'-
endo and C2'-endo structures, respectively. The dashed vertical line is the threshold
proposed for pyrimidine, and the solid line for purines. The horizontal line separates the gg
and gt conformations. (Plot adopted from Ref. 97). .............................................................. 93
Figure 3-4. FT-IR spectra of Na2(5'-GMP) monomers and dried Na2(5'-GMP)/HCl acidic gel
using KBr disc........................................................................................................................ 93
Figure 3-5. Continuous right-handed helix model of acidic Na2(5'-GMP) G-quadruplex
constructed using x-ray fiber diffraction data. Red = O, blue = N, gray = C. Ribose rings and
hydrogen atoms are omitted for clarity. ................................................................................. 94
Figure 3-6. Solid-state 23Na NMR spectra of (top) acidic and (bottom) neutral Na2(5'-GMP). .... 95
Figure 3-7. 23Na{31P} REDOR results of the reference (A-form DNA) and the two types of
Na2(5'-GMP) aggregates at various pH conditions. ............................................................... 96
Figure 3-8. Na2(5'-GMP) G-quadruplexes formed under different pH conditions. A planar,
tetrameric stacking under neutral pH (bottom), and a continuous, lock-washer-like helix
under acidic pH (top). Helix senses are both right-handed (RH)........................................... 97
Figure 3-9. Scheme of the phosphate-base hydrogen bond between phosphate (i) and N2HB (i+3)
three monomers away in the right-handed, continuous helix model of acidic Na2(5'-GMP).99
Figure 3-10. A 2D double-quantum spectrum. Protons A and X have different frequency values
and the identity peaks are located at (νA + νA) and (νX + νX), respectively. Cross peaks
between them are located at (νA + νX). ................................................................................ 100
xiv
Figure 3-11. 2D BABA DQ-MAS spectrum of dried acidic Na2(5'-GMP)/acetic acid gel 21.1 T
and very fast spinning (62.5 kHz) at room temperature. The blue bars represent intra-
molecular dipole interactions, and the red bar represents inter-molecular dipolar interactions.
The scheme of these dipolar couplings between two 5'-GMP molecules in a G-quartet is
shown in the insert. .............................................................................................................. 102
Figure 3-12. 2D 31P{1H} HETCOR spectrum of dried Na2(5'-GMP)/acetic acid gel in a 2.5 mm
MAS probe, and spinning at 33 kHz and a contact time of 2 ms......................................... 104
Figure 4-1. Structures of (left) 5'-GMP and 5'-GSMP molecules, and (right) the different bond
lengths shown in detail......................................................................................................... 107
Figure 4-2. Illustration of short distances between phosphate groups in 5'-GMP G-quadruplex.107
Figure 4-3. Proton NMR of 25 mM Na2(5'-GSMP) in D2O at pH 10.5 and 298 K. The impurities
are marked with asterisks..................................................................................................... 112
Figure 4-4. 31P NMR titration curve of a diluted Na2(5'-GSMP) solution at 298 K. ................... 113
Figure 4-5. Proton NMR spectra of Na2(5'-GMP) and Na2(5'-GSMP) at pH 8.0 and 298 K in D2O.
Both solutions have a concentration of 0.1 M. Monomer signals are shown while aggregate
signals are too broad to be detected. .................................................................................... 113
Figure 4-6. Proton NMR spectra of various concentrations of Na2(5'-GSMP) at different
temperatures and pH 8.0. Concentrations of samples are labeled in the spectra. ................ 115
Figure 4-7. Diffusion 1H NMR of 50 mM 5'-GSMP at pH 8, 14.1 T, in D2O and 298 K. .......... 116
Figure 4-8. Physical states of (a) 1.7 M Na2(5'-GMP) and (b) 0.17 M Na2(5'-GSMP). Both are
aqueous solutions at pH 8.0. ................................................................................................ 117
Figure 4-9. Powder x-ray diffraction patterns for Na2(5'-GSMP), Na2(5'-GMP), and NaCl. ...... 117
Figure 4-10. Solid-state 13C CP-MAS spectra of dried Na2(5'-GMP) and Na2(5'-GSMP). All
spinning sidebands are marked with an asterisk. The spinning rate for Na2(5'-GSMP) is 10
kHz....................................................................................................................................... 118
Figure 4-11. Solid-state FT-IR spectra of Na2(5'-GMP) and Na2(5'-GSMP) samples using KBr
discs. .................................................................................................................................... 119
Figure 4-12. Solid-state 23Na MAS NMR spectra obtained at 14.1 T. The sample’s spinning rate
was 10 kHz. High power 1H decoupling is applied and 64 transients were collected with a
recycle delay of 5 s. ............................................................................................................. 120
Figure 4-13. Solid-state 31P CP-MAS spectrum of dried 0.17 M Na2(5'-GSMP) gel at 14.1 T. The
sample’s spinning rate was 10 kHz...................................................................................... 121
xv
Figure 4-14. The cluster model [CH3-S-PO3…Na(H2O)4
…O3P-S-CH3]3- used in ab initio
calculations. The dotted lines indicate the variable (Na-O distance) in the calculations..... 122
Figure 4-15. Computed results of 23Na (closed circles) and 31P (open circles) chemical shifts for
the [CH3-S-PO3…Na(H2O)4
…O3P-S-CH3]3- cluster model with various Na-O distances at
B3LYP/6-31G(d)/cc-pVTZ(Na+) level. The calculations of 23Na chemical shifts using the
[CH3-O-PO3…Na(H2O)4
…O3P-O-CH3]3- cluster model are shown in triangles. ................... 125
Figure 4-16. Scheme of cation-bridging between phosphate groups along the self-assembled 5'-
GMP and 5'-GSMP G-quadruplex helices. The horizontal bar represents a G-quartet made of
either C2'-endo or C3'-endo monomers, and only one of four phosphate groups is shown on
each G-quartet...................................................................................................................... 126
Figure 4-17. SEM images of dried, neutral pH, 50 mM Na2(5'-GSMP). (a) Columns of Na2(5'-
GSMP) G-quadruplexes with obvious striations, (b) right-handed helices are highlighted
with arrows, (c) hair-like extensions on the edge, and (d) increased magnification of a
section in part c. ................................................................................................................... 127
Figure 5-1. Scheme of 2',3',5'-O-triacetylguanosine (TAG). ....................................................... 130
Figure 5-2. Proton-NMR spectrum of TAG in DMSO at 298.2 K. ............................................. 135
Figure 5-3. 1H NMR spectra of [TAG]M3+ species in CDCl3 at 14.1 T and 298 K. .................... 136
Figure 5-4. A portion of the 2D NOESY spectrum of the [TAG]La3+ (top) and [TAG]Eu3+
(bottom) complexes at 268 K. G-quartet signature cross peaks formed between N2HA and H8
were highlighted in the solid box while those formed between N1H and H8 were enclosed in
the dashed box. Estimated cross peaks formed between N1H/N2HA and H8 were highlighted
in the solid box for the [TAG]Eu3+ complex........................................................................ 138
Figure 5-5. High-resolution ESI-MS(+) spectra of various [TAG]M3+ complexes. .................... 141
Figure 5-6. ESI-MS/MS(+) spectra of two Tb3+ complexes: [TAG12 + Tb]3+ (top) and [TAG8 +
Tb]3+ (bottom). The parent ion is marked by an asterisk (*)................................................ 143
Figure 5-7. Illustrations of the various ion-binding modes in G-quartet systems. The bar
represents a G-quartet plane................................................................................................. 144
Figure 5-8. Relationship between the relative abundance of TAG dodecamers and TAG octamers
observed in ESI-MS(+) spectra, and the ionic radius of the metal ion. All ionic radii
correspond to a coordination number of 8. .......................................................................... 146
Figure 5-9. Excitation and emission spectra of the sparingly soluble TbCl3 (top), TAG (middle)
and the clear TAG-Tb solution (bottom) in CHCl3 at room temperature. ........................... 147
Figure 5-10. 1H NMR spectra of TAG in DMSO and TAG-Ca2+ in chloroform......................... 149
xvi
Figure 5-11. NOESY spectrum of the [TAG]Ca-pic2 complex in CDCl3 at 268 K. Cross peaks
formed between N2HA and H8 were highlighted in the solid box while those formed between
N1H and H8 were enclosed in the dashed box. .................................................................... 150
Figure 5-12. Positive mode of high resolution ESI-MS spectra of the [TAG]Ca2+ complex (top)
and the tandem-MS/MS spectrum of [TAG8]Ca2+ octamer at 1656.424 m/z (bottom). The
parent ion is marked by an *. G = monomeric TAG with 409.360 a.m.u............................ 151
Figure 5-13. Natural abundance 43Ca NMR spectra of (a) CaCl2(aq) (400 transients, 0.25 s recycle
delay), (b) CaPic2(aq) (3757 transients, 0.25 s recycle delay), and (c) TAG-Ca2+ complex in
CDCl3 (approximately 60 mM, 544,890 transients, 0.25 s recycle delay) at 14.1 T. All 43Ca
chemical shifts are referenced to CaCl2(aq) at δ = 0 ppm. ..................................................... 153
Figure 5-14. [TAG8]Ca2+ octamers model used in quantum chemical calculations. Color scheme:
green = Ca2+, red = O6, black = C, blue = N, and gray = H................................................. 154
Figure 5-15. Relationship between computed 43Ca chemical shifts and average Ca-O6 distances of
four octamers models (see text for model descriptions). ..................................................... 156

xvii
List of Tables
Table 1-1. Definitions of different torsion angles used to describe nucleic acid structures (n = a
particular nucleotide in the polynucleotide chain). .................................................................. 4
Table 2-1. A list of proton chemical shifts of monomeric Na2(5'-GMP) in water at 298 K in
reference to TMS. .................................................................................................................. 29
Table 2-2. Estimated percentages of G-quadruplex in a 1.0 M Na2(5'-GMP) sample with different
solvents at various temperatures calculated using Equation 2-1............................................ 33
Table 2-3. Experimental NMR translational diffusion coefficients (Dt) for neural Na2(5'-GMP)
self-assemblies at various temperatures and number of stacking G-quartets (n). .................. 40
Table 2-4. 1H NMR chemical shifts of the ribose protons in a neutral 1.0 M Na2(5'-GMP) sample
obtained from COSY experiment (Figure 2-8). ..................................................................... 43
Table 2-5. Cross peak multiplicities in DQF-COSY spectra assuming JAX > JAM. ....................... 50
Table 2-6. Equations used to generate the Lorentzian plot in Figure 2-15. ................................... 51
Table 2-7. 3JHH coupling constants (in Hz) of the 5'-GMP ribose protons extracted from DQF-
COSY experiment.................................................................................................................. 54
Table 2-8. Carbon-13 resonances (in ppm) and 1JCH coupling constants (in Hz) for 1.0 M Na2(5'-
GMP) at 278 K....................................................................................................................... 56
Table 2-9. Experimental chemical shifts (in ppm) of guanine exchangeable protons in 1.0 M
Na2(5'-GMP) at 298 K. .......................................................................................................... 60
Table 2-10. 3JHP coupling constants (in Hz) of 5'-GMP protons and phosphorous extracted from 1H-31P COSY experiment, and 31P chemical shifts from 31P NMR spectrum. ....................... 62
Table 2-11. Computed 1H and 13C chemical shifts (in ppm) and 1JCH coupling constants (in Hz)
for 5'-GMP molecules in C2'-endo and C3'-endo sugar pucker conformations. The level of
calculation is B3LYP/6-311++G(d,p).a.................................................................................. 69
Table 2-12. Torsion angles, pseudorotation phase angle (P), and puckering amplitudes (ν)
determined for the two 5'-GMP molecules. All quantities are in degrees. ............................ 69
Table 2-13. Comparison of geometric parameters of common nucleic acid helices. .................... 77
Table 2-14. Proton and carbon-13 resonances (in ppm) and indirect spin-spin coupling constants
(in Hz) for monomer and dimer aggregates in 1.0 M Na2(5'-GMP) at 278 K (m = monomer,
d = dimer)............................................................................................................................... 82
Table 3-1. 31P{1H} HETCOR spectrum analysis. The 31P-1H distances are obtained from the
right-handed model built using x-ray data from Sasisekharan et al..................................... 104

xviii
Table 4-1. Structural details of the cluster model used in quantum chemical calculations (using a
Na-O distance of 3.2 Å). ...................................................................................................... 123
Table 5-1. Summary of experimental diffusion coefficients (Dt) of various TAG-cation
complexes determined at different 1D proton chemical shifts at 298.2 K and 1.0 mM.124,127
............................................................................................................................................. 139
Table 5-2. Different species of [TAG]n(MCl3)n analyzed from ESI-MS(+) spectra. M =
monomeric TAG with 409.36 a.m.u. ................................................................................... 142
Table 5-3. Translational diffusion coefficients of various G octamers in the presence of metal
cations. ................................................................................................................................. 150
Table 5-4. Relative intensity of the tandem-MS/MS fragments of [TAG8]Ca2+ at 1656.424 m/z.
............................................................................................................................................. 152
Table 5-5. Calculated and experimental 43Ca chemical shifts (in ppm) for four models, each
contains two G-quartets and a central Ca2+ ion. Atoms besides Ca2+ are calculated using the
same method and basis set 6-31G(d). .................................................................................. 155

xix
List of Abbreviations & Symbols
νmax
σref
Puckering amplitudes
Absolute shielding constant for reference sample
2D 2-dimensional
3'-GMP Guanosine 3'-monophosphate
5'-GMP Guanosine 5'-monophosphate
5'-GSMP Guanosine 5'-thiomonophosphate
A
ATP
Adenine
Adenosine triphosphate
BABA DQ-MAS Back-to-Back Double Quantum Magic-Angle-Spinning
C Cytosine
CD Circular Dichroism
COSY Correlation Spectroscopy
cP centi-Poise (unit)
dC Deoxy-Cytosine
DFT Density Functional Theory
dG Deoxy-Guanosine
DLS Dynamic Light Scattering
DNA Deoxyribonucleic acid
DOSY Diffusion-Ordered Spectroscopy
DOSY-NOESY Diffusion-Ordered Nuclear Overhauser Spectroscopy
DQF-COSY Double Quantum-Filter Correlation Spectroscopy
Dt Translational diffusion rate
EFG
ESI-MS
Electric Field Gradient
Electrospray-Ionization Mass-Spectrometry
FT-IR Fourier-Transform Infra-Red spectroscopy
G Guanine
GIAO Gauge Including Atomic Orbital
HETCOR Heteronuclear Correlation Spectroscopy
HMBC Heteronuclear Multiple-Bond Correlation spectroscopy
xx
HSQC Heteronuclear Single Quantum Coherence spectroscopy
I Inosine
J Indirect spin-spin coupling constant
K Kelvin (unit)
Long-range COSY Long-range Correlation Spectroscopy
LW Linewidth
MAS Magic-Angle-Spinning
N C3'-endo puckering
NMR Nuclear Magnetic Resonance
NOE Nuclear Overhauser Effect
NOESY Nuclear Overhauser Effect Spectroscopy
ORD Optical Rotatory Dispersion
P Pseudorotation phase angle
ppm Parts per million (unit)
REDOR Rotational-Echo Double-Resonance spectroscopy
Refocused HMBC Refocused Heteronuclear Multiple-Bond Correlation spectroscopy
RNA Ribonucleic acid
ROESY Rotating frame Overhauser Effect Spectroscopy
S C2'-endo puckering
T Thymine or Tesla (unit)
TAG Triacetylguanosine
TOCSY Total Correlation Spectroscopy
U Uracil
UV Ultra-violet

1
Chapter 1
Introduction
1.1 Nucleic Acids and the double-helix model
Hereditary genetic material in organisms, also known as deoxyribose nucleic
acid (DNA), was discovered by a Swiss biochemist, Friedrich Miescher, in 1869.1 James
Watson, Francis Crick, Rosalind Franklin, and Maurice Wilkins deciphered its structure
in 1953 using x-ray diffraction data and molecular modeling.2 Later on, multiple ribose
nucleic acids (RNA) that play different roles in protein synthesis were also discovered.3
Both DNA and RNA are composed of polynucleotide chains. The basic building block,
mononucleotide, has three parts: 1) nucleobase, 2) ribose/deoxyribose sugar, and 3)
phosphate. There are four basic nucleobases in DNA (adenine, cytosine, guanine, and
thymine; abbreviated as A, C, G, and T, respectively) and four in RNA (A, C, G, and
uracil (U)). Both A and G consist of purine rings and thus are referred to as the “purine-
bases”, while C, T, and U are referred to as the “pyrimidine-bases”.4 All purine and
pyrimidine bases are planar because the ring systems are conjugated including exocyclic
carbonyl and amino groups.5 As shown in Figure 1-1, the ribose carbons are designated
with primed numbers from 1' through 5', and the nucleobase atoms are labeled from 1
through 9.4 When the ribose sugar is attached to the nucleobase at C1' position, the
molecule is called a “nucleoside”, and together with the phosphate group attached at the
C5' position the molecule becomes a “nucleotide” (Figure 1-1).4

2
Figure 1-1. (Top) Basic components of DNA and RNA: nucleic acid bases, pentose
sugar, and phosphate. (Bottom) An example of mononucleotide: guanylic acid (also
known as guanosine 5'-monophosphate) with all atom labels.4
3
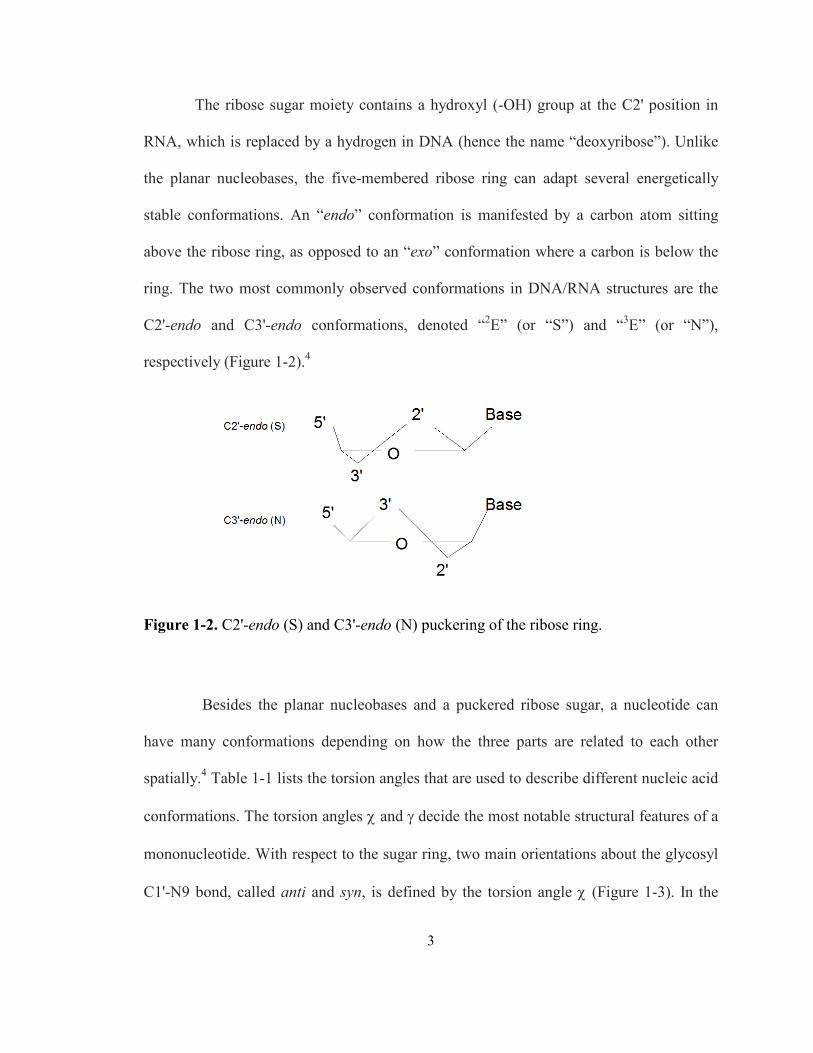
The ribose sugar moiety contains a hydroxyl (-OH) group at the C2' position in
RNA, which is replaced by a hydrogen in DNA (hence the name “deoxyribose”). Unlike
the planar nucleobases, the five-membered ribose ring can adapt several energetically
stable conformations. An “endo” conformation is manifested by a carbon atom sitting
above the ribose ring, as opposed to an “exo” conformation where a carbon is below the
ring. The two most commonly observed conformations in DNA/RNA structures are the
C2'-endo and C3'-endo conformations, denoted “2E” (or “S”) and “3E” (or “N”),
respectively (Figure 1-2).4
Figure 1-2. C2'-endo (S) and C3'-endo (N) puckering of the ribose ring.
Besides the planar nucleobases and a puckered ribose sugar, a nucleotide can
have many conformations depending on how the three parts are related to each other
spatially.4 Table 1-1 lists the torsion angles that are used to describe different nucleic acid
conformations. The torsion angles χ and γ decide the most notable structural features of a
mononucleotide. With respect to the sugar ring, two main orientations about the glycosyl
C1'-N9 bond, called anti and syn, is defined by the torsion angle χ (Figure 1-3). In the
4
anti conformation (180° ± 90°), the nucleobase is directed away from the sugar, while it
is towards or above the sugar in a syn conformation (0° ± 90°).4
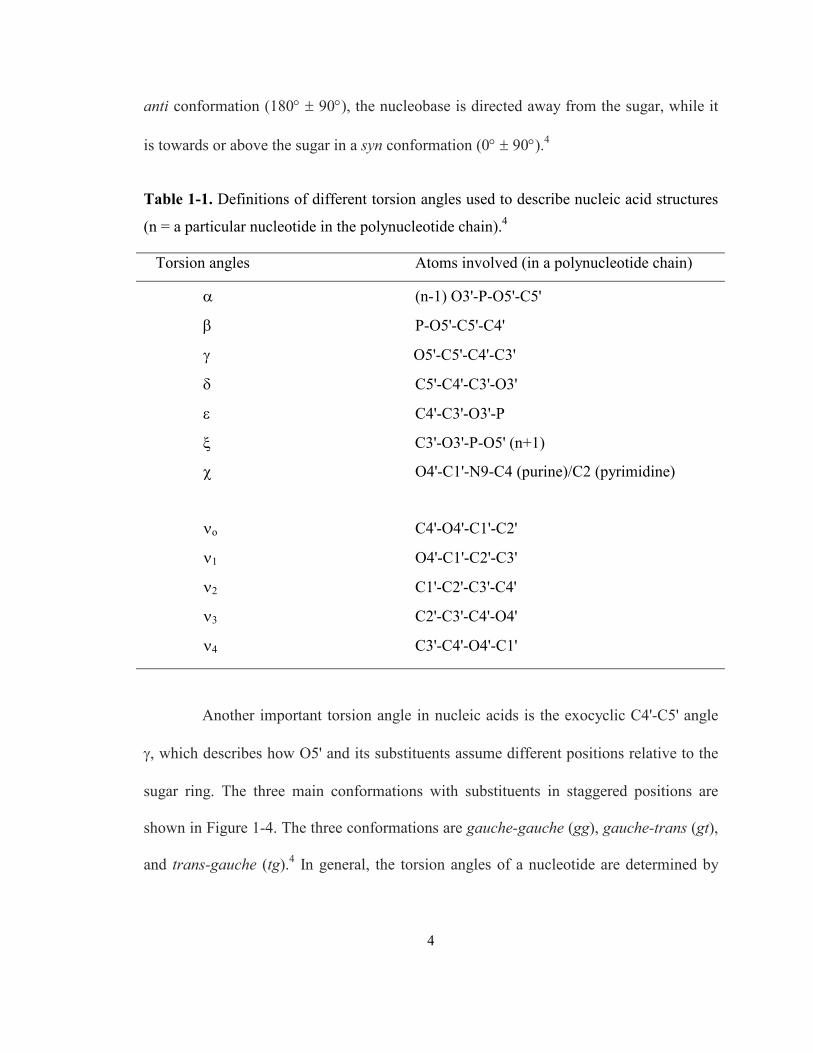
Table 1-1. Definitions of different torsion angles used to describe nucleic acid structures
(n = a particular nucleotide in the polynucleotide chain).4
Torsion angles Atoms involved (in a polynucleotide chain)
α (n-1) O3'-P-O5'-C5'
β P-O5'-C5'-C4'
γ O5'-C5'-C4'-C3'
δ C5'-C4'-C3'-O3'
ε C4'-C3'-O3'-P
ξ C3'-O3'-P-O5' (n+1)
χ O4'-C1'-N9-C4 (purine)/C2 (pyrimidine)
νo C4'-O4'-C1'-C2'
ν1 O4'-C1'-C2'-C3'
ν2 C1'-C2'-C3'-C4'
ν3 C2'-C3'-C4'-O4'
ν4 C3'-C4'-O4'-C1'
Another important torsion angle in nucleic acids is the exocyclic C4'-C5' angle
γ, which describes how O5' and its substituents assume different positions relative to the
sugar ring. The three main conformations with substituents in staggered positions are
shown in Figure 1-4. The three conformations are gauche-gauche (gg), gauche-trans (gt),
and trans-gauche (tg).4 In general, the torsion angles of a nucleotide are determined by
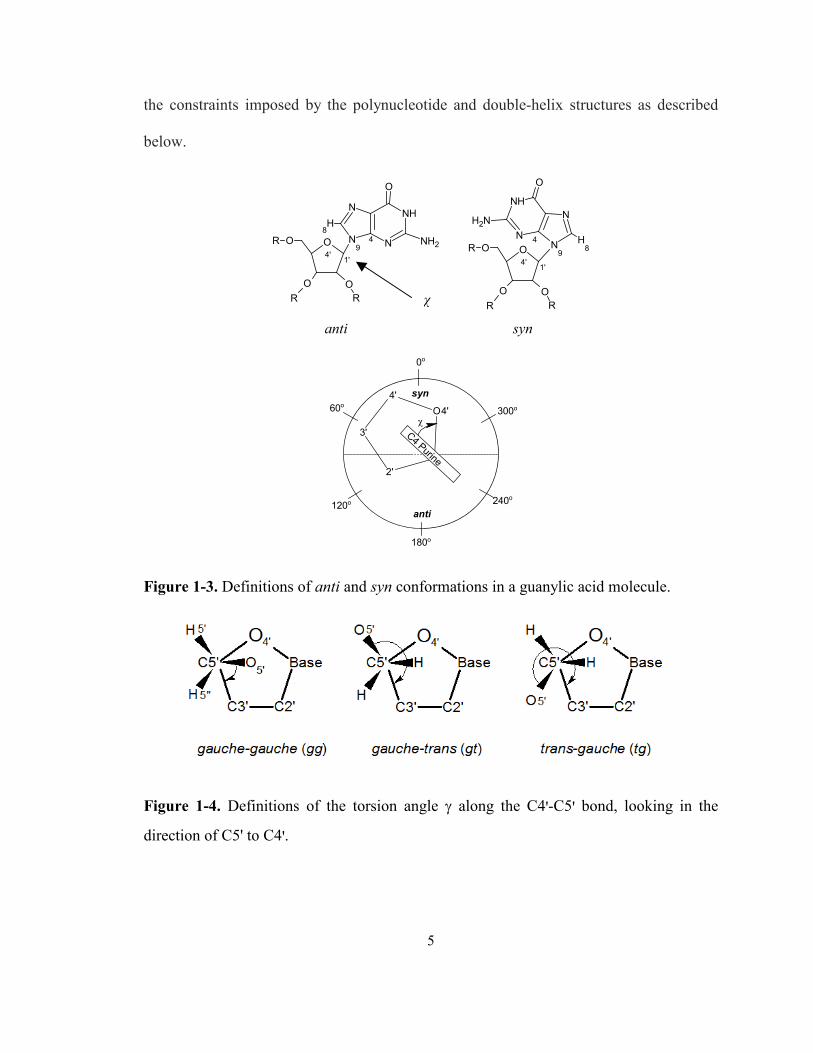
5
the constraints imposed by the polynucleotide and double-helix structures as described
below.
NH
N4
N
N9
NH2O
4'1'
O
OO
O
RR
R
H8
NH
N4
N
N9
NH2
O
4'1'
O
OO
O
RR
RH8
anti syn
3'
4'
2'
O4'
C4 Purine
240o
180o
120o
60o
0o
300o
anti
syn
χ
Figure 1-3. Definitions of anti and syn conformations in a guanylic acid molecule.
Figure 1-4. Definitions of the torsion angle γ along the C4'-C5' bond, looking in the
direction of C5' to C4'.
χ

6
Mononucleotides can be joined using enzymes (polymerases) that create
phosphodiester bonds to form a polynucleotide chain. A covalent bond is formed between
the 5'-phosphate (n) and the 3'-hydroxyl group of the next mononucleotide (n+1) through
a condensation reaction. The free 5'-phosphate group is termed the “5'-end”, while the
free 3'-hydroxyl group is called the “3'-end” (Figure 1-5).4 A polynucleotide chain is also
negatively charged due to deprotonation of backbone phosphate groups at neutral pH.
Figure 1-5. A DNA polynucleotide chain.
Besides elongation through phosphodiester bonds, mononucleotides can also
bind to each other through hydrogen bonds. In terms of chemical structure, a nucleoside

7
has many hydrogen-bond donors and acceptors (Figure 1-1). The major hydrogen-bond
donors include imino (-NH) and amino (-NH2) groups for nucleobases, and the major
acceptor groups are carbonyl C=O and -N= groups. Since these donors and acceptors are
part of a π-conjugated system, π-bond polarization occurs during hydrogen-bond
formation, and enhances the stability of the hydrogen bonds in nucleic acids.5 In fact, the
double helix structures of DNA and RNA are formed due to hydrogen bonding between
two polynucleotide chains. The principle of “base pairing” unique to DNA/RNA is
shown in Figure 1-6 where a purine forms either two or three hydrogen bonds with a
pyrimidine. The allowed base pairings include A•T (or A•U in RNA) and G•C. These are
collectively known as the “Watson-Crick base pairings” and other types of pairing are
generally considered mismatches in DNA/RNA structures.
Using hydrogen bonds between bases and other weak forces, such as van der
Waals base-stacking interactions, hydrophilic (backbone)/hydrophobic (bases) effects,
and electrostatic repulsion or attractions between the negatively charged nucleotides and
surrounding ions, two DNA polynucleotide chains form a double-helix with regular,
repeating structure but random sequence of bases. The sugar-phosphate backbones are on
the outside while the bases are in the inside and the entire double-helix is made without
covalent bonds between the two strands. In terms of base pairing, small pyrimidine bases
must only pair with large purines or else a bulge (from two purines) or a hole (from two
pyrimidines) would form. The spacing between stacking base pairs is 3.4 Å, and the
overall helix repeat distance is about 34 Å (~10 base pairs). The two polynucleotide
strands are anti-parallel to each other, i.e., one has 5' � 3' polarity from the top to
bottom, while the other has a 3' � 5' polarity from the same direction.4

8
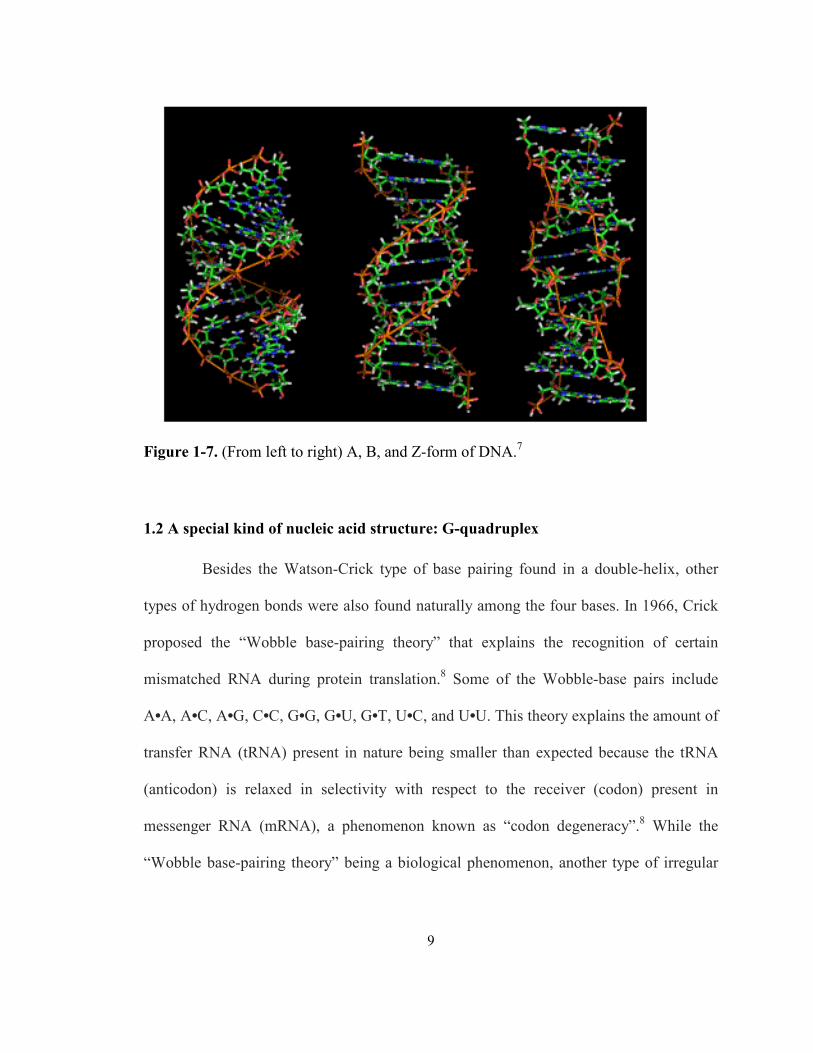
There are three types of double-helices: A, B, or Z forms (Figure 1-7). The
structure proposed by Watson and Crick in 1953 is the B-form DNA. It exists in high
humidity (92%) while the A-form exists in a dryer condition (75% humidity).4 Both A-
and B-forms are right-handed helices composed of anti nucleotides. The A-form that is
more common in RNA, has only C3'-endo puckering, while B-form in DNA contains
only C2'-endo ribose. In the B-form DNA, all base pairs are horizontal while they are
slightly tilted towards the helix axis in the A-form. Rich and colleagues discovered that
Z-DNA with alternating purines and pyrimidines nucleotides (e.g., poly[G-C]•poly[C-G])
forms a Z-form DNA. The Z-form only exists occasionally in DNA with high salt
concentrations.6 Contrary to the A- and B-forms, Z-DNA has a left-handed helix with a
dinucleotide repeating unit, with all cytosines being in anti with C2'-endo puckering, and
all guanosines are in syn with C3'-endo puckering.6
Figure 1-6. Watson-Crick base pairings in DNA and RNA. R = ribose and phosphate
groups.4
9
Figure 1-7. (From left to right) A, B, and Z-form of DNA.7
1.2 A special kind of nucleic acid structure: G-quadruplex
Besides the Watson-Crick type of base pairing found in a double-helix, other
types of hydrogen bonds were also found naturally among the four bases. In 1966, Crick
proposed the “Wobble base-pairing theory” that explains the recognition of certain
mismatched RNA during protein translation.8 Some of the Wobble-base pairs include
A•A, A•C, A•G, C•C, G•G, G•U, G•T, U•C, and U•U. This theory explains the amount of
transfer RNA (tRNA) present in nature being smaller than expected because the tRNA
(anticodon) is relaxed in selectivity with respect to the receiver (codon) present in
messenger RNA (mRNA), a phenomenon known as “codon degeneracy”.8 While the
“Wobble base-pairing theory” being a biological phenomenon, another type of irregular

10
base pairing proposed by Hoogsteen in 1963, named “Hoogsteen base-pairing”, needs to
be discussed in further detail as it has huge biological and chemical implications.
Using x-ray crystallography, Hoogsteen observed a stable structure in which N3
of thymine could form a hydrogen bond with N7 of adenine, instead of N1 as in the
Watson-Crick pairing model (Figure 1-8).9 The Hoogsteen type of base pairing is then
defined as any base pairing using hydrogen donors and/or acceptors different from those
used in the Watson-Crick model. Hoogsteen base-pairing is very rarely observed in
transcribing DNA (<1%) and its discovery revolutionized the traditional view on nucleic
acid structure. Using the Hoogsteen type of base pairing, DNA and RNA molecules now
become building blocks of a vast amount of possible, alternate structures including
triplex or even quadruplex DNA helices.10 One of the most important structures is the
quadruplex of guanosine-rich DNA sequences, or “G-quadruplexes”.
Figure 1-8. Hoogsteen type of base-pairing between A and T.
Guanine, being one of the DNA bases, is very unique because its hydrogen bond
donors and acceptors are 90º to each other (Figure 1-9). Under slightly acidic conditions,
guanosine 5'-monophosphate, or 5'-GMP, was observed to form a gel in aqueous
environments.11 X-ray fiber diffraction, UV, CD, and IR studies of this gel revealed a
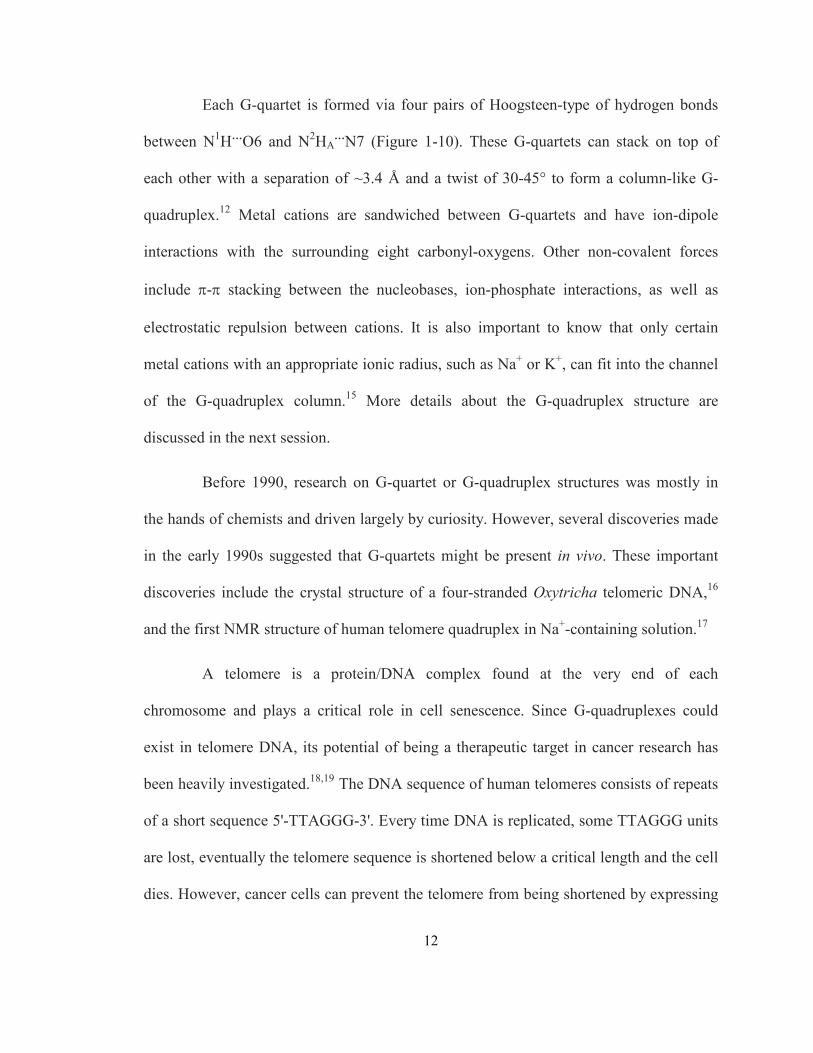
11
structure where four 5'-GMP molecules self-assemble into a “G-quartet” using
Hoogsteen-type of hydrogen bonds (Figure 1-10).12,13,14
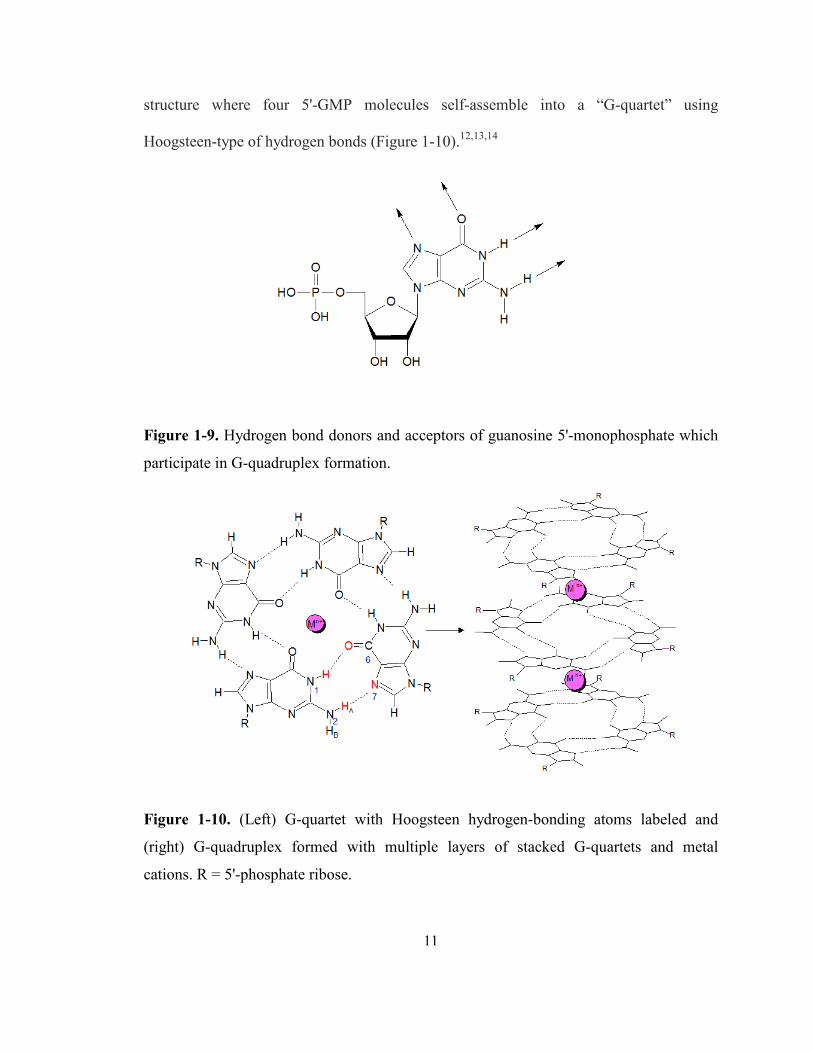
Figure 1-9. Hydrogen bond donors and acceptors of guanosine 5'-monophosphate which
participate in G-quadruplex formation.
Figure 1-10. (Left) G-quartet with Hoogsteen hydrogen-bonding atoms labeled and
(right) G-quadruplex formed with multiple layers of stacked G-quartets and metal
cations. R = 5'-phosphate ribose.
12
Each G-quartet is formed via four pairs of Hoogsteen-type of hydrogen bonds
between N1H…O6 and N2HA…N7 (Figure 1-10). These G-quartets can stack on top of
each other with a separation of ~3.4 Å and a twist of 30-45° to form a column-like G-
quadruplex.12 Metal cations are sandwiched between G-quartets and have ion-dipole
interactions with the surrounding eight carbonyl-oxygens. Other non-covalent forces
include π-π stacking between the nucleobases, ion-phosphate interactions, as well as
electrostatic repulsion between cations. It is also important to know that only certain
metal cations with an appropriate ionic radius, such as Na+ or K+, can fit into the channel
of the G-quadruplex column.15 More details about the G-quadruplex structure are
discussed in the next session.
Before 1990, research on G-quartet or G-quadruplex structures was mostly in
the hands of chemists and driven largely by curiosity. However, several discoveries made
in the early 1990s suggested that G-quartets might be present in vivo. These important
discoveries include the crystal structure of a four-stranded Oxytricha telomeric DNA,16
and the first NMR structure of human telomere quadruplex in Na+-containing solution.17
A telomere is a protein/DNA complex found at the very end of each
chromosome and plays a critical role in cell senescence. Since G-quadruplexes could
exist in telomere DNA, its potential of being a therapeutic target in cancer research has
been heavily investigated.18,19 The DNA sequence of human telomeres consists of repeats
of a short sequence 5'-TTAGGG-3'. Every time DNA is replicated, some TTAGGG units
are lost, eventually the telomere sequence is shortened below a critical length and the cell
dies. However, cancer cells can prevent the telomere from being shortened by expressing
13
telomerase, a protein that facilitates telomere extension.20 One of the approaches to
inhibit telomerase activity is to block telomerase-substrate interactions. While the single-
stranded G-rich telomere is a substrate of telomerase, the folded G-quadruplex is not.
Therefore, formation of G-quadruplexes could prevent telomerase from binding to the
DNA strand, and hopefully cancer cell formation can be prohibited through this
mechanism.21,22,23 For example, tumour oncogenes have been shown to be suppressed via
stabilization of the G-quadruplex structure in the presence of sodium ions.24 It is also
known that several human genes associated with diseases such as Fragile X Syndrome
contain G-quadruplexes in its sequences.25 Therefore, it is not surprising that biological
G-quartets have received numerous attention in the last two decades. Figure 1-11 shows a
crystal structure of a human telomeric G-quadruplex formed in the presence of K+ ions.26
Figure 1-11. (a) Viewed on the 5' end, a stick representation of the G-quadruplex formed
from a human telomere sequence, d[AGGG(TTAGGG)3] (22-mer), in the presence of K+
ions. (b) Same structure viewed from the 3' end of the G-quadruplex looking down the
helical axis. Phosphate backbone (ribbon) shows 5'-to-3' directionality. (Picture adopted
from Ref. 26.)
14
Another important biological implication of G-quadruplex is its resemblance to
transmembrane ion channels. The environment around K+ ions in the selectivity filter of
K+-channel proteins is very similar to that inside a G-quadruplex channel.27,28 In both
cases, the cation is surrounded by eight carbonyl groups in an antipyrimidal or cubic
fashion.27 Many attempts have been made to mimic ion channel proteins with G-
quadruplex systems.29,30,31
Besides these two applications, both biological and synthetic G-quadruplex
systems have been utilized as extractants of the radioactive 226Ra or biosensors based on
their affinity to different types of metal ions,32,33,34 as well as DNA nanomachines35,
surface ligands36, macroscopic membrane films37, hydrogels that could serve as bioactive
molecule carriers38, and photo- or electro-active molecular electronic devices39.
Numerous G derivatives and their abilities to form various supramolecular structures are
thoroughly documented in the literature.40,41,42,43,44,45
1.3 The first biological G-quadruplex: 5'-GMP
Almost a century ago, Ivar Christian Bang (1869-1918) discovered that, under
acidic conditions, 5'-GMP molecules form a white gel while they remain as a clear liquid
at neutral pH (Figure 1-12).11 In 1962, Davies and colleagues examined the x-ray fiber
diffraction data for 5'-GMP and 3'-GMP gels and proposed that the structural basis of gel
formation is a hydrogen-bonded guanine tetramer now termed as a G-quartet.12,46,47
15
Figure 1-12. Disodium guanosine 5'-monophosphate aggregates formed under pH 5 (left)
and pH 8 (right) conditions. The samples are of the same concentrations.
As mentioned earlier, each G-quartet consists of four pairs of Hoogsteen-type of
hydrogen bonds between N1H…O6 and N2HA…N7 atoms. The angles between the
hydrogen-bond donors and acceptors make it possible to form a square-shaped, planar
tetramer. Davies and colleagues further proposed that G-quartets could stack on top of
one another using weak π-π interactions between guanine rings. At about the same time,
Miles and Frazier used infrared (IR) spectroscopy to study 5'-GMP solution under a
neutral pH.13 They found evidence that 5'-GMP self-associates into an ordered structure
in neutral solution.4 The authors also found that the self-assembly of 5'-GMP is reversible
as the aggregate dissociates into monomers with increasing temperature and forms an
ordered structure again when the temperature is decreased. It appears that 5'-GMP gel
formation only occurs when the phosphate group is singly protonated (C-O-PO3H-) at pH
< 5. Under a neutral or slightly basic condition (pH 7-8), strong repulsion between
doubly negatively charged phosphate groups (C-O-PO32-) makes it more difficult to form
extensive self-assemblies. Using circular dichroism (CD) spectroscopy, Chantot et al.
also noticed that cations play an important role in 5'-GMP self-assembly.14 The authors
16
claimed that aggregates of 5'-GMP are formed only under conditions of “high 5'-GMP
concentration, low temperature, defined pH range, and high ionic strength”.14 In 1975,
Pinnavaia and colleagues decided to use solution-state NMR to study 5'-GMP self-
assembly in neutral solutions.48 Their study was the first NMR study of 5'-GMP under
high concentration, neutral pH, and low temperature conditions and provided a great deal
of useful information on 5'-GMP self-assembly. First, 1H NMR spectra provide direct
evidence that the guanine imino (N1H) and amino (N2HA) protons are involved in
hydrogen bonds. Secondly, the authors reported the observation of four different 1H
NMR signals for each proton of 5'-GMP. Because the four distinct signals from proton
H8 appear well separated from other signals, they were used to analyze the four different
5'-GMP species (denoted H8 α, β, γ, and δ) present concurrently in the sample (Figure
1-13). Neurohr and Mantsch also reported the ∆G° for 5'-GMP to form aggregates at pH
7.4 and 30°C in aqueous environment to be -0.6 kJ/mol.49
Figure 1-13. Partial 1H NMR spectra of neutral disodium guanosine 5'-monophosphate
solutions at different concentrations showing the four H8 signals (spectra adopted from
Ref. 48; the bottom axis represents 1H chemical shift in ppm).
17
Based on spin-lattice relaxation measurements, the authors suggested that both α
and δ (1:1 ratio) were signals from a head-to-tail stacking octamer (C4 symmetry), while
β was another type of octamer, perhaps tail-to-tail or head-to-head stacking (D4
symmetry) and γ was assigned the monomer or dimer 5'-GMP molecules. Over the next
decade, Pinnavaia and colleagues studied the 5'-GMP system in neutral solution using
other NMR techniques such as 13C, 31P, relaxation measurements, and nuclear
Overhauser effect (NOE).50,51,52 They also found that the G-quadruplex structure exhibits
different affinity for different metal ions.15 In a G-quadruplex, each cation is sandwiched
between two G-quartets. It can be imagined that each cation is being encapsulated in a
pseudo-cage where eight carbonyl oxygen atoms form the corners (Figure 1-10). Both
ionic radius and charge of the cation are critical for the formation and stability of the G-
quadruplex structure. Pinnavaia and colleagues discovered that neither too small nor too
large cations such as Li+ and Cs+ (ionic radius 0.92 and 1.69 Å, respectively) promote G-
quadruplex formation, whereas Na+, K+, and Rb+ (ionic radius 1.18, 1.51, and 1.61 Å,
respectively) are necessary for stable G-quadruplex structures.15 Because small cations
are too far from the corners of this pseudo-cage to balance the electronegative carbonyl
oxygens, no G-quadruplex is formed. The opposite occurs for large cations, as the G-
quadruplex will be forced to break apart when a large cation enters the cage. The
averaged O6…M+ distance in a stable G-quadruplex is 2.2-2.3 Å, and among monovalent
cations, K+ has the highest affinity for G-quadruplex formation followed by Na+ and
Rb+.15
Pinnavaia and colleagues also noted that two different cation-binding sites exist
for the G-quadruplex formed by 5'-GMP in neutral solution.51 The specific structure-

18
directing site, also known as the “channel” site, is where the cations reside inside the G-
quadruplex. The other non-specific binding site, also known as the “surface” site, is the
phosphate group (C-O-PO32-) of the 5'-GMP molecules. Cations binding to the surface
site can balance the electrostatic repulsion between neighboring phosphate groups,
therefore they also play a role in G-quadruplex stability.51 In the early 1980s, Detellier et
al. used NMR to study binding affinity and found that, when Na+ and K+ are both present
in 5'-GMP solution, the stoichiometry of the aggregate is approximately 4Na+(G4-K+-G4).
In particular, K+ ions have a higher binding affinity for the channel site while Na+ ions
are preferred at the surface sites.53 Detellier et al. were also the first to use NMR for
direct detection of alkali metal ions (e.g., 23Na+, I = 3/2) in G-quadruplex systems. These
authors confirmed the formation of octamers and/or hexadecamers in neutral 5'-GMP
solutions.54,55
Several other research groups had also studied the neutral 5'-GMP system. In
1982, Peterson et al. reported the presence of two different types of dimers in Na2(5'-
GMP) solution using 1H, 13C, and 31P NMR results.56 The proposed asymmetric
hydrogen-bonded dimer was essentially one half of a G-quartet, while the symmetric
dimer model was a pure speculation at the time. Although the asymmetric dimer model
has been largely discarded by other researchers in the field, the observed fast exchange
between the H8 β and γ signals is consistent with the possibility of β being the stacking
symmetric dimers instead of the isomeric D4 octamers as suggested by Pinnavaia and
colleagues.48,57 Another single-crystal x-ray study by Lipanov et al. confirmed that
monomers from a neutral 5'-GMP sample form G-quartets that are perpendicular to the
helical axis.58 The authors also reported the 5'-GMP G-quadruplex to be a right-handed
19
helix composed of twelve molecules (i.e., three G-quartets). Further studies using CD and
NMR yielded contradicting results such as a left-handed helix composed of fourteen
residues, etc.59,60 It is clear that, despite considerable effort, the 5'-GMP self-assembly
process has never been fully understood.
1.4 Motivation and organization of the thesis
Because of the aforementioned biological implications of G-quartet and G-
quadruplex, a huge amount of effort has been devoted to this field since the 1990s largely
led by biochemists and molecular biologists. However, it is rather remarkable that the
exact structure of 5'-GMP helix, the first G-quartet system, is still unknown after nearly
50 years. In 2000, in a search for NMR signatures for channel and surface ions in G-
quadruplex DNA, Wu and Wong revisited the neutral 5'-GMP system using solid-state
NMR.61,62 These authors examined the Na+ ions using magic-angle spinning (MAS) 23Na
NMR and established the signature signal of Na+ in G-quadruplex systems.61 The authors
also found the channel and surface 39K signals using a very high magnetic field (900
MHz) and proved the capability of examining G-quadruplex structures using solid-state
NMR on cation nuclei.62 In addition, the same authors were able to quantitatively
determine the free energy differences for ion competition among Na+, K+, NH4+, Rb+, and
Cs+ in both channel and surface sites.63
Out of all the methods employed to study 5'-GMP G-quadruplex, none were
able to reveal the true aggregate size until Jurga-Nowak et al. studied the system using
dynamic light-scattering (DLS).64 In this case, the hydrodynamic radius of the self-
assembled structure as a function of temperature, ionic strength, and nucleotide

20
concentration were determined by measuring translational and rotational diffusion
coefficients of the aggregates from which the size and shape of G-quadruplexes could be
calculated. The authors reported that, in a highly concentrated 5'-GMP solution, there are
at least 32 layers of G-quartets present in a single helix.64 This provoking result prompted
Spindler et al. to study a similar G-derivative (5'-dGMP) using 31P NMR and DLS,65
which ultimately led to a collaboration between Spindler and Wu in using both diffusion-
ordered NMR spectroscopy (DOSY) and DLS to study Na2(5'-GMP) under neutral
conditions.66 Similar to DLS, a DOSY experiment measures the translational diffusion
rate (Dt) of a molecule, which is a function of molecular size, solvent viscosity, and
temperature. In this study, the authors reported several significant results. First, at 18-
34% w/w Na2(5'-GMP) concentrations, two types of rod-like cylinders were observed:
the stacking monomer cylinder and the G-quartet cylinder. Each G-quartet cylinder is
about 8-30 nm long and corresponds to 24-87 stacking G-quartets.66 Another finding was
that the column length increases with the 5'-GMP concentration, but insensitive to the
Na+ concentration, which suggests that an equilibrium is established between the stacking
monomers and G-quartets. Further introduction of Na+ ions would not shift the system to
form more G-quadruplexes. The authors also observed an increase of monomeric
aggregate size when the temperature of solution decreases, while the size of G-quartet
aggregates was found to remain unaffected by temperature. The authors proposed a
common stacking mechanism between the monomer and G-quartet cylinders as a linear
relationship was observed between cylinder sizes and Na2(5'-GMP) concentration.66
The aforementioned new results regarding the size of 5'-GMP self-assembly
have not only provided new insights into the 5'-GMP self-assembly process, but also

21
called for a new interpretation of the previously reported NMR data. This renewed
interest in 5'-GMP self-assembly and its relevance to G-quadruplex nucleic acid
structures led us to ask the unavoidable question: what is the exact helical structure of 5'-
GMP in the neutral to slightly basic (referred to as “neutral” only in the text) solution? In
Chapter 2, we present the structural determination of Na2(5'-GMP) self-assembly in
neutral solution. In Chapter 3, we investigate the structure of acidic Na2(5'-GMP) gel and
disapprove a long-believed model of this G-quadruplex helix. In Chapter 4, we
investigate the self-assembly of disodium thioguanosine 5'-monophosphate (5'-GSMP).
In Chapter 5, we report for the first time that a lipophilic guanosine derivative forms G-
quadruplexes in the presence of trivalent metal cations (M3+). Lastly, Chapter 6 provides
concluding remarks for this thesis.
22
Chapter 2
Structure determination of disodium guanosine 5'-monophosphate G-
quadruplex in neutral solution
2.1 Introduction
As mentioned in Chapter 1, the exact structure of Na2(5'-GMP) helix formed
under neutral conditions remains unknown. The current information reveals that, at high
concentrations and in the presence of Na+ ions, ordered G-quadruplexes are formed. The
G-quadruplexes are large aggregations composed of stacking layers of G-quartets, whose
size depends on concentration and temperature. Because single crystals are extremely
difficult to obtain from concentrated neutral Na2(5'-GMP) solutions, we decided to use
NMR to determine the exact structure of Na2(5'-GMP) G-quadruplex in aqueous solution.
2.2 Experimental Details
2.2.1 Sample preparation
The D2O sample was prepared by dissolving 305 mg Na2(5'-GMP).6H2O
(Sigma, Lot 035K1194, no further purification) twice in D2O (0.6mL, 99.99%) to remove
H2O from the hydrous 5'-GMP. The sample is then degassed with N2 for 20 min to
remove any dissolved O2. For the H2O/D2O sample, Na2(5'-GMP) was dissolved in equal
amounts of H2O and D2O without degassing the sample. Final concentration of both D2O
and H2O/D2O samples is 1.0 M (50% w/w). Acidity of these samples is pH 8.0 without
introducing any acids or bases. All 31P titration experiments were performed using a
dilute Na2(5'-GMP) sample (1.5 x 10⁻² to 5.0 x 10⁻² M in D2O) and pH was adjusted using

23
concentrated DCl(aq). The final pH values were obtained using the formula: pH = pD +
0.4.67
2.2.2 NMR spectroscopy
All solution-state NMR spectra were recorded on a Bruker Avance 600 MHz
spectrometer (14.1 T), including both 1D and 2D experiments. All chemical shifts were
reported in parts per million (ppm). For 1H experiments, the 1H 90° and 180° pulse
widths at a pulse power of 0.0 dB were 13.0 µs and 26.0 µs, respectively. For 13C
experiments, the 13C 90° and 180° pulse widths at a pulse power of -1.5 dB were 25 µs
and 50 µs, respectively. The 31P 180° pulse was 50 µs at 0.0 dB, and 85% H3PO4(aq) was
used as an external reference. For solution-state 23Na NMR, the Hahn-echo pulse
sequence HE.GW.TXT without H-decoupling was used with a 180° pulse of 32 µs at 5
dB. Delay time 0.2 s was used, and a total of 1,024 transients with 2,024 scans were
collected. An analogue filter was used with processing parameter lb=10Hz. Sample was
referenced externally to 1.0 M NaCl(aq) at 0 ppm. All pulse sequences were available in
the program Bruker Xwin NMR Version 3.5, and experimental temperatures were
carefully controlled by a Bruker BT-3000 unit.
COSY. 2D homonuclear shift correlation (1H-1H COSY) spectra which detects
1H-1H through scalar coupling was carried out on the D2O 5’-GMP sample at 278.0 K
using the pulse program COSYGPQF (Bruker XWinNMR Version 3.5) on a Bruker
Avance 600 MHz spectrometer. The data were collected using a 90° pulse of 10.0 µs at a
power of 0 dB and a relaxation delay of 3.0 s. The spectral width was 4194.63 Hz on
24
either dimension. Two scans were collected. Final data matrix was 2048 (F2) x 1024
(F1).
1H-
31P COSY. Proton-detected 2D heteronuclear shift correlation was performed
on the D2O sample at 298.0 K. The 90° and 180° pulse widths of 31P at pulse power 0.0
dB were 22.0 µs and 44.0 µs, respectively. 31P chemical shift was externally referenced to
85% H3PO4(aq) at 298.0 K. The spectral widths were 2403.8 Hz (F2) and 971.8 Hz (F1). A
total of 20 scans were collected with a relaxation delay of 10.0 s, and the final data matrix
was 1024 (F2) x 256 (F1).
Long-range COSY. 2D long-rage homonuclear shift correlation spectra which
detects 1H-1H of < 3 Hz scalar coupling was carried out on the D2O 5'-GMP sample at
298.0 K using the pulse program COSYLGQF (Bruker XWinNMR Version 3.5) on a
Bruker Avance 600 MHz spectrometer. The data were collected using a 90° pulse of 12.0
µs at pulse power 0 dB, and a relaxation delay of 2.0 s. The fixed delays for evolution of
long-range coupling (d6) were varied between 0.01-0.1s. The spectral width was
4194.631 Hz on either dimension. Eight scans were collected. Final data matrix was 2048
(F2) x 512 (F1).
DOSY. 1H diffusion experiment was carried out on the D2O 5'GMP sample at
278.0 K. The pulse sequence of longitudinal eddy current delay with bipolar-gradient
pulse (LEDBPGP2s) was employed. The pulse field gradient duration (δ) was 7.5 ms,
and the variable gradient strength (G) was 5.645-5.750 G/mm. The diffusion period (∆)
was 75.0 ms, and a total of 4096 transient points with 16 scans were collected for each of
the 32 increment steps with a recycle delay of 5.0 s. The eddy current delay (tw)
25
employed was 5 ms, and the gradient recovery delay was set at 0.2 ms. Calibration of the
field gradient strength was performed by measuring the value of translational diffusion
coefficient (Dt) for the residual 1H signal in D2O (99.99% 2H atom), where Dt = 1.90 x
10-9 m2/s.68 The spectral width was 4194.6 Hz and a line-broadening of 10 Hz was
employed in data processing (F2).
DOSY-NOESY. A 2D experiment was created (by Dr. Gang Wu) by modifying
the 3D DOSY-NOESY experiment (LEDBPGPNO3s3d) and was carried out on the D2O
sample at 298.0 K. The NMR experimental parameters were identical to the DOSY
experiment, except the pulse field gradient duration (δ) was 1.0 ms, and the diffusion
period (∆) was 300.0 ms. A total of 8 scans were collected with a recycle delay of 3.0 s.
The mixing time (τmix) for NOE was 100 ms, and the final data matrix was 2048 (F2) x
512 (F1).
DQF-COSY. 2D homonuclear shift correlation spectrum (COSY) with double
quantum filter using gradient selection was recorded at 298.0 K on the D2O sample from
the pulse program COSYDFETGP. A total of 16 scans and a relaxation delay of 6.0 s
were collected for a spectrum with 2403.8 Hz on either dimension. The final data matrix
was 2048 (F2) x 512 (F1). Contrary to regular COSY experiment, the signals observed
are all derived from double-quantum coherence present between the second and third 90°
pulses. This allows all the lines in the spectrum having all double absorption mode
lineshape (compare to COSY where cross and diagonal peaks have opposite lineshapes).
However, because only the double-quantum part of the coherence is observed, signal
intensity is less compared to COSY experiments.

26
HMBC. 2D spectrum of 1H-13C correlation through heteronuclear zero and
double quantum coherence transfer was performed using the pulse program
HMBCGPLPNDQF at 298.0 K on the H2O/D2O sample. A low-pass J-filter was
employed to suppress one-bond correlations, and no 13C decoupling was applied during
acquisition. The long-range coupling delay was 62.5 ms (corresponds to a long-range
coupling of 8 Hz) and the one-bond coupling delay was 3.45 ms (145 Hz). A total of 450
scans were collected with a relaxation delay of 1.0 s. The spectrum widths were 6009.6
Hz (F2) and 21,130.1 Hz (F1), and the final data matrix was 4096 (F2) x 256 (F1).
Refocused-HMBC. 2D 1H-13C correlation via heteronuclear zero and double
quantum coherence was performed with the pulse program HMQCGPQF on a 90% H2O/
10% D2O sample at 298.0 K. The long range coupling delay was 15 ms (corresponds to a
J-coupling of 33.3 Hz). The 13C decoupling sequence employed in the experiment was
garp, and the 90° pulse for decoupling sequence was 85 µs at a power level of –1.5 dB. A
total of 1000 scans were collected with a relaxation delay of 10.0 s. The spectral widths
were 3591.9 Hz (F2) and 10,565.3 Hz (F1), and the final data matrix was 4096 (F2) x 32
(F1).
HSQC. (1) 2D 1H-13C heteronuclear one-bond correlation via double inept
transfer was performed on the D2O sample at 298.0 K using the pulse program
HSQCETGP with decoupling (phase sensitive using echo/antiecho-TPPI gradient
selection). (2) Another HSQC experiment was performed using the pulse program
HSQCETGPSISPNP without decoupling. A trim pulse (1 ms, F1 dimension) was
employed in both experiments in the inept transfer while shape pulses were employed on
27
the F2 dimension. The 180° shape pulses for inversion and refocusing at –1.3 dB on the
F2 dimension were 500 µs and 2000 µs, respectively. A correlation delay of 1.25 ms,
which corresponds to a 1JHC-coupling of 200 Hz, was used to observe 1H-13C
correlations. The spectrum widths were 6613.7 Hz (F1) and 21,129.4 Hz (F2). A total of
30 scans were collected with a relaxation delay of 1.0 s, and the final data matrix was
2048 (F2) x 1024 (F1).
NOESY. The 2D homonuclear correlation via dipolar coupling NOESY
spectrum was performed at 278.0 K on the H2O/D2O sample using the pulse program
NOESYGPPH with a mixing time (τmix) of 50 ms. The relaxation delay was 4.0 s, and a
spectral width of 7183.9 Hz in each dimension was employed. A total of 16 scans were
collected for each experiment, and the final data matrix was 2048 (F2) x 512 (F1).
ROESY. A 2D homonuclear NOE experiment measured under spin-locked
condition was performed on the 1:1 H2O/D2O sample at 298.0 K using the pulse program
ROESYETGP. A continuous wave spinlock was used for mixing with an echo/antiecho-
TPPI gradient selection. A series of experiment with different spin-lock pulses (5 - 40
ms), which corresponds to the “mixing time” in ROESY, was employed at a power level
of 24.61 dB. The spectral width was 4194.6 Hz on either dimension, and a total of 16
scans were collected with a relaxation delay of 3.0 s. The final data matrix was 2048 (F2)
x 512 (F1).
TOCSY. 2D total-correlation COSY was performed on the H2O/D2O sample at
298.0 K using the pulse sequence DIPSI2ETGPSI with Hartmann-Hahn transfer using
DIPSI2 sequence for mixing. A series of experiments with different TOCSY mixing time

28
(50 – 400 ms) was employed at a power level of 10 dB. The spectral width was 4194.6
Hz on either dimension, and a total of 8 scans were collected with a relaxation delay of
4.0 s. The final data matrix was 2048 (F2) x 512 (F1).
2.2.3 Quantum chemical calculations
Quantum chemical calculations of NMR parameters such as chemical shielding
and indirect spin-spin coupling constants were performed on a Sun Fire cluster using the
Gaussian 03 suite of programs. The Sun Fire cluster is comprised of seven Sun Fire
25000 servers. Each of the Sun Fire 25000 servers is equipped with 72 x (2 MB on-chip
L2 cache and 32 MB L3 cache) dual-core (CPU) UltraSPARC-IV+ processors and 576
GB of RAM. The level of calculations was B3LYP/6-311++G(d,p).
2.3 Results and Discussion
2.3.1 Confirmation of G-quadruplex formation
Because both Na2(5'-GMP) monomers and G-quadruplexes exist in concentrated
samples, it is necessary to identify their respective 1H chemical shifts. Figure 2-1 shows
the 1H NMR spectrum of a 0.1 M Na2(5'-GMP) sample where only monomers exist. The
chemical shift assignment of monomeric 5'-GMP is listed in Table 2-1.

29
Figure 2-1. The 1H NMR spectrum of a 0.1 M neutral Na2(5'-GMP) in D2O at 298 K.
Table 2-1. A list of proton chemical shifts of monomeric Na2(5'-GMP) in water at 298 K
in reference to TMS.
Protons 1H chemical shift (ppm)
N2HA/B 6.1
H8 7.9
H1' 5.6
H2' 4.5
H3' 4.3
H4' 4.1
H5'/ H5" 3.8
According to Pinnavaia et al., a highly concentrated Na2(5'-GMP) solution
yields four sets of distinct proton signals in the 1H NMR spectrum.15 Figure 2-2 shows
the 1H NMR spectra of a concentrated 1.0 M Na2(5'-GMP) sample in D2O at various
temperatures. It is clear from these 1H NMR spectra that four sets of H8 resonances are
observed at both 298 and 278 K. The ribose signals in the 3-6 ppm region are heavily
overlapped and a reliable chemical shift assignment is not possible at the moment. Figure

30
2-3 displays the proton NMR spectra of the same 1.0 M Na2(5'-GMP) sample in 1:1 ratio
of H2O and D2O to illustrate exchangeable imino (N1H) and amino (N2HA,B) protons.
Figure 2-2. 1H NMR spectra of a neutral 1.0 M Na2(5'-GMP) solution in D2O at various
temperatures and 14.1 T and pH 8.
Figure 2-3. 1H NMR spectra of a neutral 1.0 M Na2(5'-GMP) solution in 1:1 H2O/D2O at
various temperatures and 14.1 T and pH 8. The broad shoulder next to H8γ belongs to an
unassigned hydrogen-bonded proton.

31
It can be seen in the 1H-NMR spectra that hydrogen-bonded structures are
formed when the chemical shifts of exchangeable protons are shifted towards high
frequency from 6.1 ppm of the monomers to the 8.5-12.0 ppm region under high
concentrations (Figure 2-3). It is also observed that signal intensities of H8α and H8δ (G-
quadruplexes) increase at lower temperatures while the intensities of the other signals
decrease. This observation confirms previous observation that H8β and H8γ are indeed
monomeric and dimeric (non-G-quadruplex) aggregates because their signals “disappear”
at lower temperatures when larger G-quadruplexes are formed. Moreover, although the
signal intensities of H8β and H8γ vary at different temperatures, the ratio of H8α and
H8δ signals always remains 1:1 (Figure 2-4). The 1H chemical shifts of all four H8
signals are (in ppm): H8α = 8.26, 8.26; H8β = 7.87, 7.95; H8γ = 7.76, 7.57; and H8δ =
6.96, 6.96 at 298 K and 278 K, respectively. Using these distinct H8 signals, the
approximate G-quadruplex concentration can be calculated using peak deconvolution of
these four signals:
Equation 2-1 %1008HH8 H8 (H8
)H8 (H8×
−
+++
+
)aggregatesAll
quadruplexG
δγβα
δα
The G-quadruplexes formed in the 1.0 M solution under different temperatures
are shown in Figure 2-4 and their population percentages were calculated using Equation
2-1 and the results are shown in Table 2-2. Since there are other exchangeable proton(s)
embedded within the H8 region, the population calculated using peak intensities is
slightly smaller in the H2O/D2O sample.

32
Figure 2-4. 1H NMR spectra of a neutral 1.0 M Na2(5'-GMP) solution in D2O (top) and
1:1 H2O/D2O (bottom) at various temperatures and 14.1 T.

33
Table 2-2. Estimated percentages of G-quadruplex in a 1.0 M Na2(5'-GMP) sample with
different solvents at various temperatures calculated using Equation 2-1.
Besides the high frequency shift of exchangeable protons and the appearance of
four H8 signals, the third piece of evidence of G-quartet formation is provided by 2D
NOESY spectrum that yields spatial relationships between protons within 5.0 Å through
dipole-dipole interactions. The signature NOESY cross peaks of a G-quartet are formed
between the imino (N1H) and one of the amino protons (N2HA) with H8 from a neighbour
molecule within the G-quartet, as illustrated in Figure 2-5.
In this case, because the signature NOE cross peaks involve exchangeable
protons, an NOESY experiment was performed on the 1:1 H2O/D2O sample. Intra-
molecular cross peak are expected to be more intense than the inter-molecular ones
because of shorter distances between them (i.e., stronger dipole interaction). Figure 2-6
shows the NOESY spectrum of a 1.0 M Na2(5'-GMP) solution at 278 K, and cross peaks
Temperature (K) D2O (%) H2O/D2O (%)
278 49.3 41.1
288 45.3 35.1
298 37.7 28.6
308 20.0 10.4
318 1.2 0.0
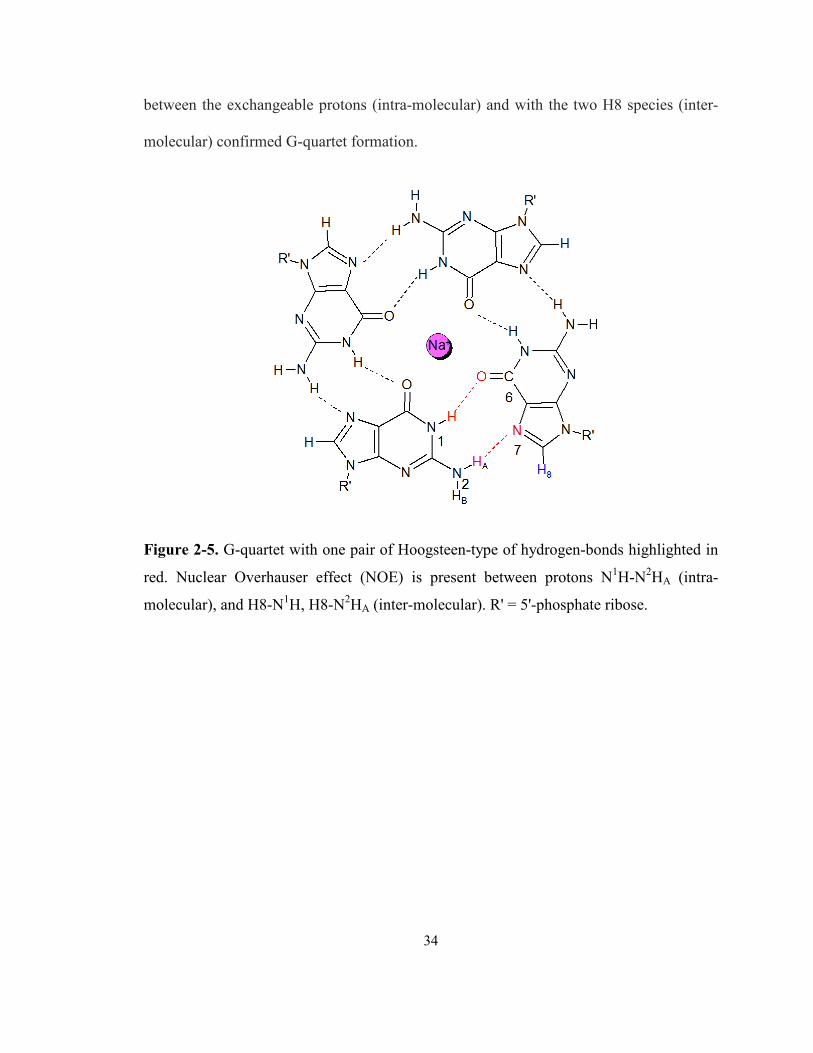
34
between the exchangeable protons (intra-molecular) and with the two H8 species (inter-
molecular) confirmed G-quartet formation.
Figure 2-5. G-quartet with one pair of Hoogsteen-type of hydrogen-bonds highlighted in
red. Nuclear Overhauser effect (NOE) is present between protons N1H-N2HA (intra-
molecular), and H8-N1H, H8-N2HA (inter-molecular). R' = 5'-phosphate ribose.
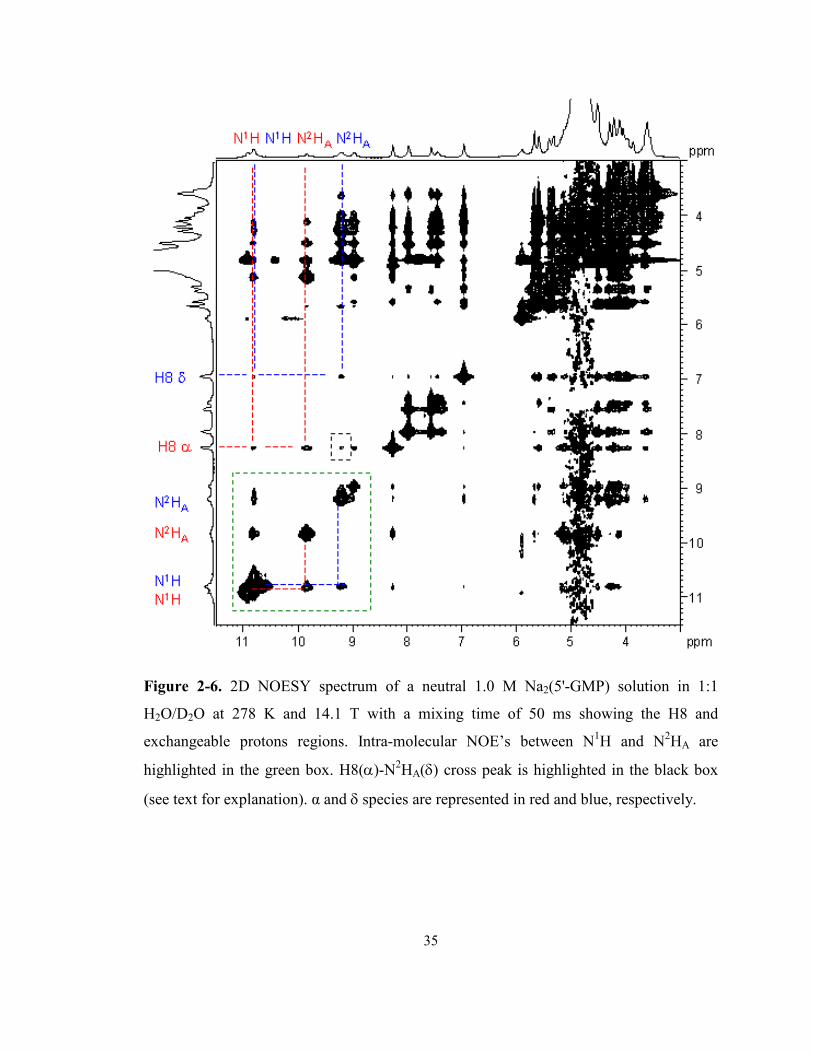
35
Figure 2-6. 2D NOESY spectrum of a neutral 1.0 M Na2(5'-GMP) solution in 1:1
H2O/D2O at 278 K and 14.1 T with a mixing time of 50 ms showing the H8 and
exchangeable protons regions. Intra-molecular NOE’s between N1H and N2HA are
highlighted in the green box. H8(α)-N2HA(δ) cross peak is highlighted in the black box
(see text for explanation). α and δ species are represented in red and blue, respectively.

36
Moreover, we also observed cross peak H8(α)-N2HA(δ) but not H8(δ)-N2HA(α)
in the NOESY spectrum (Figure 2-6, black box). This inconsistency could arise from two
situations. First, α and δ are signals of two distinct types of G-quadruplexes that are
composed entirely of either α or δ monomers, and they have almost identical populations
as shown in their 1:1 signal intensities in the 1H NMR spectrum. The H8(α)-N2HA(δ)
cross peaks arose from simply “inter-quadruplex” interactions. The second explanation is
that there is only one type of G-quadruplex and it has two proton environments. For
example, α and δ monomers are arranged alternatively or adjacent to each other in the
same G-quartet. However, only one set of H8-N2HA combination is observed. In this
case, the absence of such cross peaks suggests that this G-quadruplex is composed of
alternating all-α and all-δ G-quartets. These two types of G-quartets within the same G-
quadruplex give rise to the 1:1 H8 signal ratio (α or δ) in the proton spectrum, and the
H8α-N2HAδ cross peaks are “inter-quartet” signals. We think that the latter explanation is
more reasonable as detection of NOE is more effective within a short distance, hence the
H8(α)-N2HA(δ) cross peaks are likely to be inter-quartet rather than between
quadruplexes.
2.3.2 Relative sizes of Na2(5'-GMP) aggregates
After obtaining evidence of G-quartet formation, the next task is to study the
sizes of the four species present in neutral Na2(5'-GMP) solution. In this case, we
employed diffusion-ordered spectroscopy (DOSY) NMR technique. DOSY is an NMR
method that is used to measure the translational diffusion coefficient (Dt) of molecules

37
dissolved in solution, which in turn provides information about molecular size. DOSY
NMR has been widely used to determine the size of molecular aggregates such as
polymers or nanoparticles.69,70 The diffusion coefficients being measured are affected by
various parameters including temperature, concentration, solvent viscosity, the size and
shape of the molecule of interest. According to the Stokes-Einstein equation,71 a sphere’s
diffusion coefficient is inversely related to the hydrodynamic radius of the molecule and
solvent viscosity:
Equation 2-2 R
kTDt
πη6=
where k = Boltzmann constant, T = temperature, R = hydrodynamic radius, and η =
solvent viscosity. However, it has been known that G-quadruplexes are of rod-like
cylinder shapes instead of behaving like a sphere. Therefore, another equation for
hydrodynamic models using experimental Dt data is employed:
Equation 2-3 )(ln3
νπη
+= pL
kTDt
where kT is the Boltzmann constant, η is the solvent viscosity, L is the length of the
symmetric cylinder, p is the axial ratio of the cylinder (p = L / d, where d = diameter of
cylinder), and ν as the end-effect correction term. Tirado and Garcia de la Torre72
calculated that when 2 ≤ p ≤ 30, the end-effect correction is expressed as:
Equation 2-4 ν = 0.312 + 0.565p-1 - 0.100p
-2.
In this case, the diameter (d) of the cylinder is 26 Å, and the viscosity of D2O at 278 K
and 298 K were 1.988 cP and 1.097 cP, respectively.73 (Note: 1 cP = 0.001 kg/m.s).

38
Wong et al. reported that at a concentration of 24.6 % w/w (0.8 M) and 278 K, the
estimated number of stacking G-quartets is 48 ± 3 with a Dt value of 2.5 x 10⁻¹¹ m2/s.66
Translational diffusion rates of the four H8 signals from the DOSY experiment at 278 K
are shown in Figure 2-7. Both α and δ signals were of the same size (both Dt = 8.8 x10⁻¹²
m2/s), and they are larger aggregates compared to those reported in Wong et al. because
of higher concentration.66 Meanwhile β was assigned to a smaller aggregate (stacking
dimers with Dt = 11.6 x10⁻¹² m2/s), and γ to a even smaller aggregate (stacking
monomers, Dt = 17.2 x10⁻¹² m2/s, as previously suggested).56,48 The fact that both α and δ
species shared the same diffusion rate further suggests that these two H8 signals were
from the same G-quadruplex that had two different H8 environments.
Because 5'-GMP solutions with similar concentration was reported to have a p
value within the range set by Tirado and Garcia de la Torre,72 Equation 2-3 and Equation
2-4 were employed to obtain the length of the G-quadruplex in our experiment. Since
each stacking is separated by 3.4 Å, the number of stacking (n) would equal to (L + 0.34
nm)/0.34 nm. The calculated p, L, and n values using the above equations are listed in
Table 2-3. The increased concentration of 5'-GMP in this work explained the smaller Dt
value and larger aggregate size observed under the same temperature. Because the p
value (i.e., 34.7) obtained at 278 K is not far from the application range of 2 ≤ p ≤ 30 in
Equation 2-4, it is employed in estimating the number of G-quartet stacking at this
temperature. Note that the ln(I/Io) plot where Dt values are derived is not shown. The Dt
values are obtained directly from the SimFit function in the Bruker XWinNMR T1/T2
package.
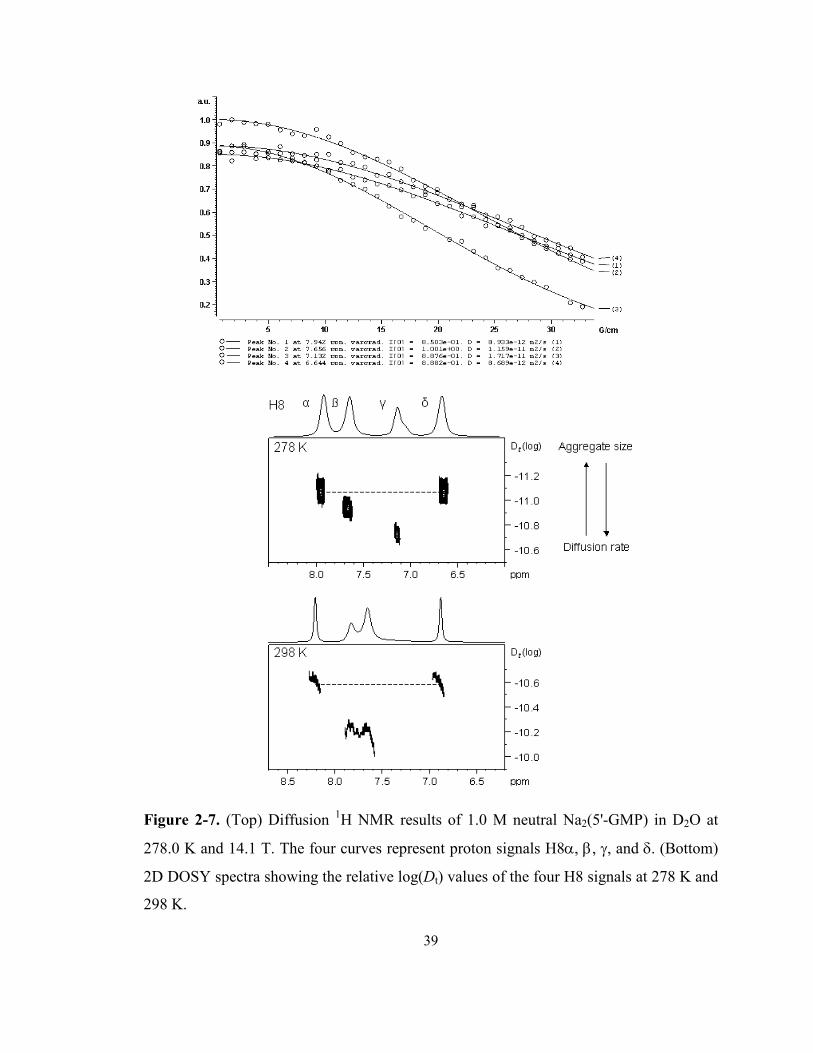
39
Figure 2-7. (Top) Diffusion 1H NMR results of 1.0 M neutral Na2(5'-GMP) in D2O at
278.0 K and 14.1 T. The four curves represent proton signals H8α, β, γ, and δ. (Bottom)
2D DOSY spectra showing the relative log(Dt) values of the four H8 signals at 278 K and
298 K.

40
Table 2-3. Experimental NMR translational diffusion coefficients (Dt) for neural Na2(5'-
GMP) self-assemblies at various temperatures and number of stacking G-quartets (n).
Temperature (K) Dt (m2/s)a p L (nm) n
298
278
2.70 x 10⁻¹¹
0.88 x 10⁻¹¹
18.6
34.7
48.4
90.2
143 ± 15
266 ± 27
a The uncertainty in Dt was estimated to be ± 0.3 x 10⁻¹¹ m2/s (298 K) and ± 0.1 x 10⁻¹¹
m2/s (278 K).
As a summary, four signals were identified in a concentrated, neutral Na2(5'-
GMP) solution using 1H NMR and DOSY experiments. These four signals represent G-
quadruplexes (α and δ), stacking dimers (β), and stacking monomers (γ) as previously
suggested by Wong et al.66 2D NOESY data also suggest that these G-quadruplexes are
composed of alternating all-α and all-δ G-quartets.
2.3.3 G-quadruplex building blocks: monomer structures
One of the major tasks of studying the neutral Na2(5'-GMP) helix is to
understand its individual monomers because they are the building blocks that self-
assemble into an ordered G-quadruplex. Now that we have confirmed the origin of α and
δ signals as G-quadruplex formation in the 1.0 M solution, we need to answer the
question as to why two (α and δ), instead of one signal, are present for G-quadruplex. To
this end, it is important to identify all the proton chemical shifts that belong to both α and
δ species.
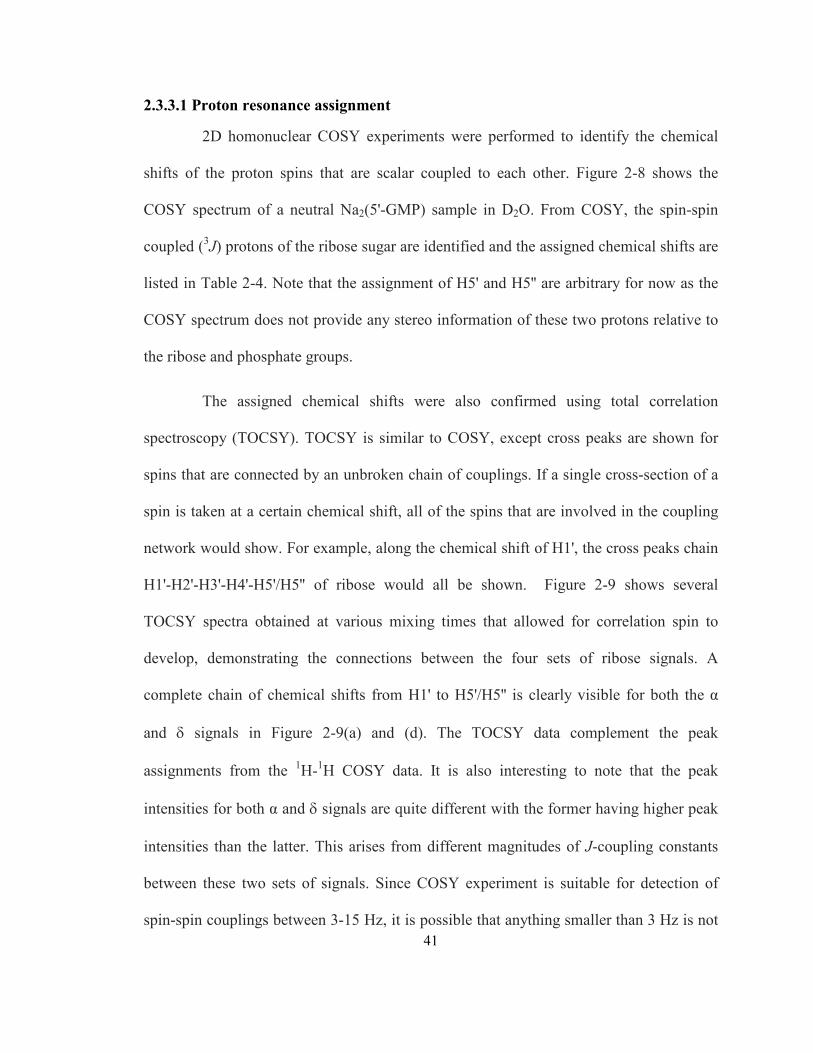
41
2.3.3.1 Proton resonance assignment
2D homonuclear COSY experiments were performed to identify the chemical
shifts of the proton spins that are scalar coupled to each other. Figure 2-8 shows the
COSY spectrum of a neutral Na2(5'-GMP) sample in D2O. From COSY, the spin-spin
coupled (3J) protons of the ribose sugar are identified and the assigned chemical shifts are
listed in Table 2-4. Note that the assignment of H5' and H5'' are arbitrary for now as the
COSY spectrum does not provide any stereo information of these two protons relative to
the ribose and phosphate groups.
The assigned chemical shifts were also confirmed using total correlation
spectroscopy (TOCSY). TOCSY is similar to COSY, except cross peaks are shown for
spins that are connected by an unbroken chain of couplings. If a single cross-section of a
spin is taken at a certain chemical shift, all of the spins that are involved in the coupling
network would show. For example, along the chemical shift of H1', the cross peaks chain
H1'-H2'-H3'-H4'-H5'/H5'' of ribose would all be shown. Figure 2-9 shows several
TOCSY spectra obtained at various mixing times that allowed for correlation spin to
develop, demonstrating the connections between the four sets of ribose signals. A
complete chain of chemical shifts from H1' to H5'/H5'' is clearly visible for both the α
and δ signals in Figure 2-9(a) and (d). The TOCSY data complement the peak
assignments from the 1H-1H COSY data. It is also interesting to note that the peak
intensities for both α and δ signals are quite different with the former having higher peak
intensities than the latter. This arises from different magnitudes of J-coupling constants
between these two sets of signals. Since COSY experiment is suitable for detection of
spin-spin couplings between 3-15 Hz, it is possible that anything smaller than 3 Hz is not

42
detected in the δ species which show weaker signals intensities. In order to eliminate this
possibility, a long-range COSY (or selective COSY) is performed. The purpose of this
experiment is to introduce a mandatory delay into the pulse sequence where the weakest
spin-spin couplings are detected. In this case, no extra cross-peaks are observed in the
long-range COSY spectrum (Figure 2-10), hence the COSY and TOCSY data sets
showed all short and long-range coupling interactions.
Figure 2-8. 2D 1H-1H COSY spectrum showing the ribose region of 1.0 M neutral
Na2(5'-GMP) in D2O at 298 K and 14.1 T. Cross peaks with scalar couplings are
connected with lines. Note that the stereospecific assignment of proS and proR protons
(H5'/H5'') are arbitrarily assigned. (Color code for the four species: red α, green β, brown
γ, blue δ).

43
Table 2-4. 1H NMR chemical shifts of the ribose protons in a neutral 1.0 M Na2(5'-GMP)
sample obtained from COSY experiment (Figure 2-8).
1H chemical shift (ppm) H1' H2' H3' H4' H5'/ H5" *
α 5.59 4.93 4.21 4.52 3.63 / 3.98
β 5.52 4.82 4.41 4.12 3.74 /3.83
γ 5.52 4.37 4.18 4.00 3.68 / 3.74
δ 5.67 4.50 4.10 4.29 3.99 / 4.15
*Stereospecific assignment of proS and proR protons was not available.
Figure 2-9. 2D TOCSY spectra of 1.0 M neutral Na2(5'-GMP) in D2O at 298 K and 14.1
T. Cross peaks of spins from an unbroken chain of scalar coupling are connected with
dotted lines. Mixing times: a) 50 ms, b) 100 ms, c) 200 ms, and d) 400 ms.

44
Figure 2-10. Long-range COSY spectrum showing the ribose region of 1.0 M neutral
Na2(5'-GMP) in D2O at 298.0 K and 14.1 T. Cross peaks with scalar couplings are
connected with lines. Note that the stereospecific assignment of proS and proR protons
(H5'/H5'') were arbitrarily assigned for all species. (Color code for the four species: red α,
green β, brown γ, blue δ).
As a summary, the 1H-1H COSY, 1H-1H TOCSY, and long-range COSY spectra
provided the chemical shift assignments of all the ribose protons for the four α, β, γ, δ
species except the temporarily stereospecific assignments of protons (H5'/H5'').

45
2.3.3.2 Anti vs. syn, C2'-endo vs. C3'-endo conformations, and 3JHH coupling
constants
Since we are only interested in the α and δ G-quadruplexes signals, a new
approach called DOSY-NOESY was introduced to “filter” out the β and γ cross peak
signals in order to obtain a simplified spectrum. The diffusion rate was carefully selected
so that only signals from large molecules were detected. This novel NMR approach
allows us to connect H8 signals to the formerly crowded region of ribose sugars. From
the DOSY-NOESY spectrum shown in Figure 2-11, H8(α) and H8(δ) signals have a
strong NOE with the H2' and H3' protons, but a weak NOE with H1', H4', and H5'/H5''
protons. This suggests that both α and δ molecules adopt an anti conformation instead of
syn. Observations of nucleosides in the syn conformer are rare because the C1'-N9
glycosidic bond is flexible and anti is preferred due to the steric effect. The syn
conformers have been observed mostly in purines with C8 substituents that form intra-
molecular hydrogen bonding. The fact that both molecules are anti in this case explains
the multiple stacking of G-quartets in forming large G-quadruplexes, as syn conformers
would hinder such stacking due to repulsion between G-quartets. Moreover, the relative
intensities between H8 and the ribose sugars (H1', H2', H3', H4', H5', and H5'') in the
DOSY-NOESY spectrum can pinpoint the glycosidic angle χ. For example, protons H1'
and H4' are located at the bottom of the ribose ring and cross peak intensities with H8
would be weaker compared to H2' and H3' as H8 sits directly above the latter two protons
in an anti conformation. In this case, the α molecule has strong H8-H2', medium H8-H3',
and equally weak H8-H1' and H8-H4' dipole interactions. This would put the guanine
ring in a certain position with respect to the ribose ring with the estimated χ angle to be -
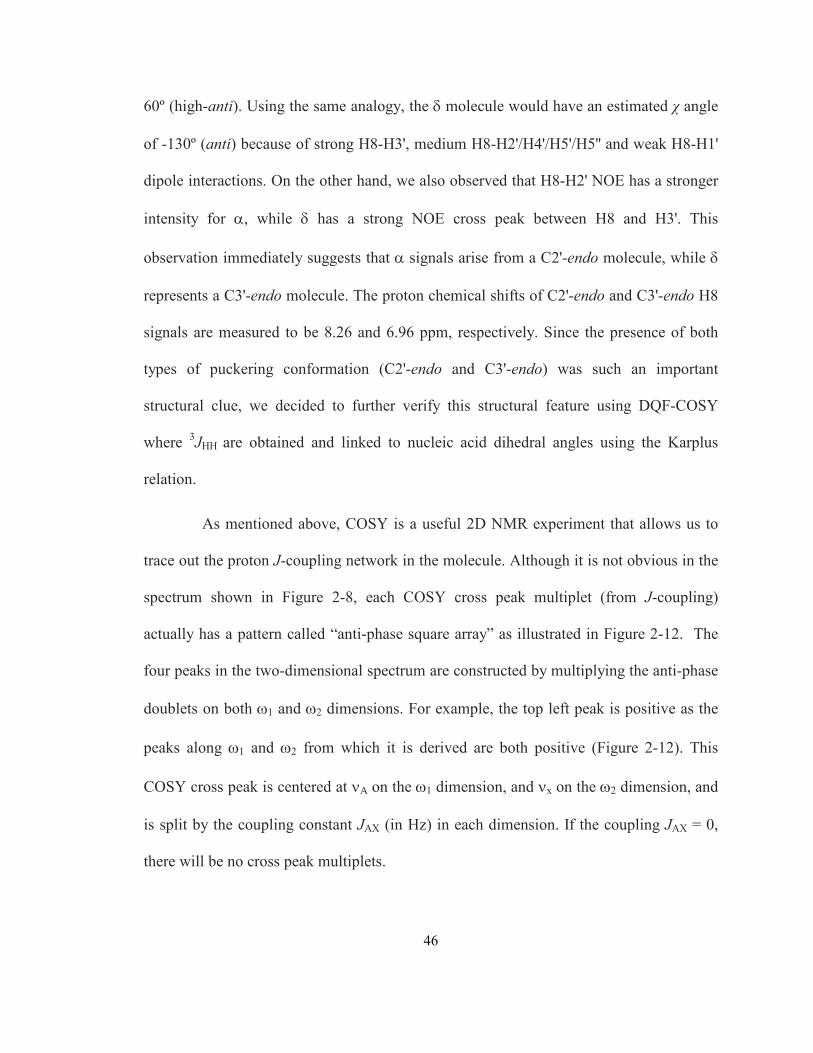
46
60º (high-anti). Using the same analogy, the δ molecule would have an estimated χ angle
of -130º (anti) because of strong H8-H3', medium H8-H2'/H4'/H5'/H5'' and weak H8-H1'
dipole interactions. On the other hand, we also observed that H8-H2' NOE has a stronger
intensity for α, while δ has a strong NOE cross peak between H8 and H3'. This
observation immediately suggests that α signals arise from a C2'-endo molecule, while δ
represents a C3'-endo molecule. The proton chemical shifts of C2'-endo and C3'-endo H8
signals are measured to be 8.26 and 6.96 ppm, respectively. Since the presence of both
types of puckering conformation (C2'-endo and C3'-endo) was such an important
structural clue, we decided to further verify this structural feature using DQF-COSY
where 3JHH are obtained and linked to nucleic acid dihedral angles using the Karplus
relation.
As mentioned above, COSY is a useful 2D NMR experiment that allows us to
trace out the proton J-coupling network in the molecule. Although it is not obvious in the
spectrum shown in Figure 2-8, each COSY cross peak multiplet (from J-coupling)
actually has a pattern called “anti-phase square array” as illustrated in Figure 2-12. The
four peaks in the two-dimensional spectrum are constructed by multiplying the anti-phase
doublets on both ω1 and ω2 dimensions. For example, the top left peak is positive as the
peaks along ω1 and ω2 from which it is derived are both positive (Figure 2-12). This
COSY cross peak is centered at νA on the ω1 dimension, and νx on the ω2 dimension, and
is split by the coupling constant JAX (in Hz) in each dimension. If the coupling JAX = 0,
there will be no cross peak multiplets.

47
Figure 2-11. 2D DOSY-NOESY spectrum of 1.0 M neutral Na2(5'-GMP) in H2O/D2O at
278 K and 14.1 T. Mixing time 50 ms. Cross peaks that give structural information are
boxed in.
As the coupling constant becomes smaller, the two anti-phase lines begin to
overlap. Since they are of opposite sign, they begin to cancel each other and the overall
intensity of the cross peaks gets smaller, and eventually the anti-phase doublet is no
longer visible. In addition to the magnitude of JAX, the amount of cancellation also
depends on the linewidth (LW, measured at half height) of the signal. If JAX >> LW,
there will be no cancellation. If LW > JAX, the amount of cancellation is very significant,
as is explained in Figure 2-13. Moreover, as the diagonal peak multiplets in COSY are all
in-phase, they reinforce one another and making it more difficult to locate weaker cross
peaks close to the diagonal. This problem can be practically eliminated using double-

48
quantum filtered COSY (DQF-COSY) where both the diagonal and cross peak multiplets
are in anti phase. By making the diagonal peaks less dominant in DQF-COSY, it will be
easier to extract coupling constants from cross peaks.
Figure 2-12. Contour plot of the cross peak expressed as an “anti-phase square array” of
multiplets. Positive contours are colored black, and negative red. The anti-phase doublet
is plotted for both axes.
Figure 2-13. Relationship between J and linewidth (LW) in affecting the intensity of a
2D COSY cross peak signal.74 (Figure adopted from Ref.72).
In DQF-COSY, all of the observed signals are generated from selecting double-
quantum coherences with either phase cycling or pulse field gradients. This means that

49
uncoupled spins (such as solvent signals) will not be detected in the DQF-COSY
spectrum, as they cannot pass the double-quantum filter. Both diagonal and cross peaks
can be phased to have the same line shape and show anti-phase structure in both
dimensions. However, the intensity of signals in DQF-COSY is reduced to one half when
compared with the conventional COSY due to the double-quantum filtering.75
In a DQF-COSY spectrum, the intensity of cross peaks depends on the type
(active and passive) and the magnitude of the J-coupling involved. Active-J refers to the
coupling responsible for the cross peak, while passive-J is the coupling from another spin
that involves one of the spins participating in the cross peak. For example, Figure 2-14
shows the expected DQF-COSY spectrum with correlation H1 � H2 � H3 � H4. In
box a, the active-J would be J12 on ω2, and there are no passive-J. The passive-J on ω1 for
the same cross peak would be J23. In box b, J23 would be the active-J on ω2 because it is
responsible for the cross peak between H2 and H3, and J12 is the passive-J because H2 is
also coupled to H1. On the other hand, J23 would be the active-J on ω1 for the same cross
peak and J34 would be the passive-J. Table 2-5 shows the expected in-phase and anti-
phase multiplicities of different spin systems.
Another complication in analyzing anti-phase cross peak is that, as Wüthrich et
al. documented, the apparent separation in an anti-phase doublet (i.e., apparent-J) is
usually larger than the real J-coupling constant and that it is not possible to measure any J
when the apparent-J/linewidth ratio is below 0.576.76 Because of the complexity in
reading these convoluted COSY cross peaks (especially in multi-spin systems),
simulations are often used in order to find the real J-coupling constants. Table 2-6 shows

50
the equations used to generate the simulation plot of anti-phase systems shown in Figure
2-15.
Figure 2-14. Partial plot of a theoretical DQF-COSY spectrum of a four-spin system.
Table 2-5. Cross peak multiplicities in DQF-COSY spectra assuming JAX > JAM.
Multiplicity In-phase Anti-phase
A 1 0
AX 1 1 1 -1
AX2 1 2 1 1 0 -1
AXM 1 1 1 1 1 1 -1 -1
AMX 1 1 1 1 1 -1 1 -1
Using this simulation process, we obtained the 3JHH coupling constants of the 5'-
GMP ribose protons from the DQF-COSY spectrum (Figure 2-16) and the results are
shown in Table 2-7. The drastically different values of 3J(H1', H2') for the two sets of
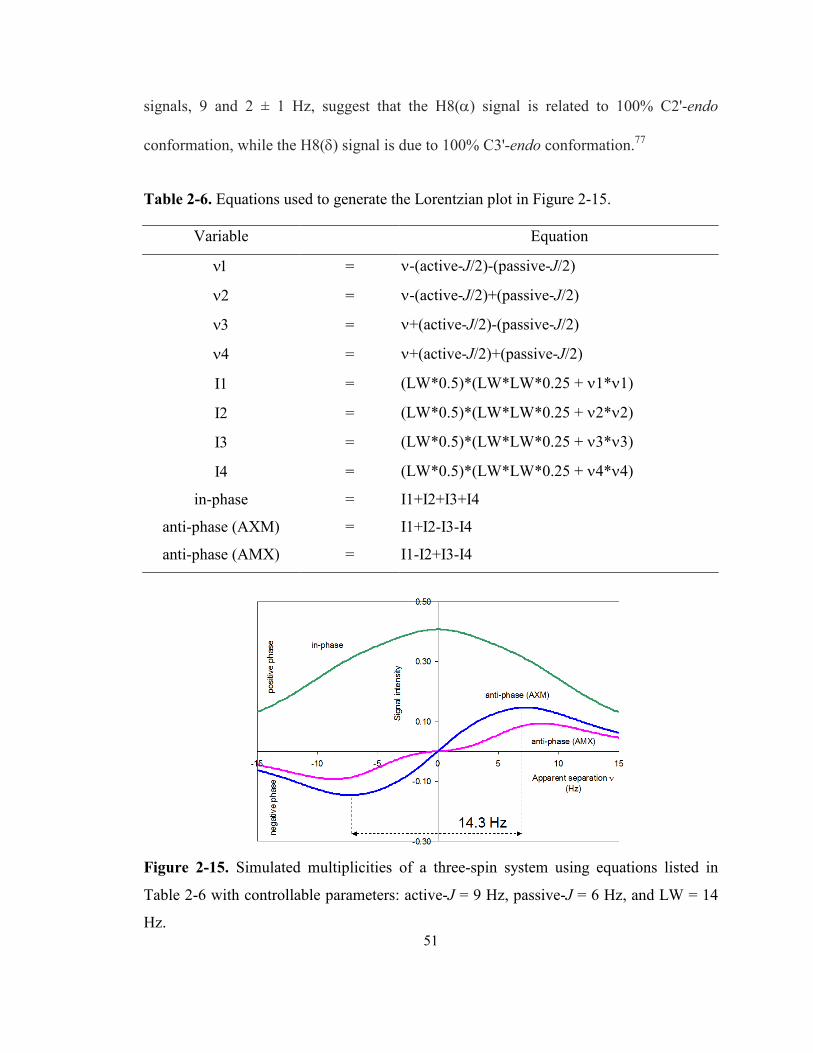
51
signals, 9 and 2 ± 1 Hz, suggest that the H8(α) signal is related to 100% C2'-endo
conformation, while the H8(δ) signal is due to 100% C3'-endo conformation.77
Table 2-6. Equations used to generate the Lorentzian plot in Figure 2-15.
Variable Equation
ν1 = ν-(active-J/2)-(passive-J/2)
ν2 = ν-(active-J/2)+(passive-J/2)
ν3 = ν+(active-J/2)-(passive-J/2)
ν4 = ν+(active-J/2)+(passive-J/2)
I1 = (LW*0.5)*(LW*LW*0.25 + ν1*ν1)
I2 = (LW*0.5)*(LW*LW*0.25 + ν2*ν2)
I3 = (LW*0.5)*(LW*LW*0.25 + ν3*ν3)
I4 = (LW*0.5)*(LW*LW*0.25 + ν4*ν4)
in-phase = I1+I2+I3+I4
anti-phase (AXM) = I1+I2-I3-I4
anti-phase (AMX) = I1-I2+I3-I4
Figure 2-15. Simulated multiplicities of a three-spin system using equations listed in
Table 2-6 with controllable parameters: active-J = 9 Hz, passive-J = 6 Hz, and LW = 14
Hz.

52
Figure 2-16. Phase sensitive DQF-COSY of 1.0 M neutral Na2(5'-GMP) in D2O at 298 K
and 14.1 T. Positive contour is colored black, and negative red. Correlations (3JHH) of
GMP ribose protons are linked using red and blue dotted line for C2'-endo and C3'-endo
G-quadruplex, respectively. Coupling constants are extracted from cross peaks (labeled
boxes with measured “apparent J-couplings”) in next page.

53
Figure 2-16. (continued)

54
Table 2-7. 3JHH coupling constants (in Hz) of the 5'-GMP ribose protons extracted from
DQF-COSY experiment.
3JHH C2'-endo (S) C3'-endo (N)
H1'-H2' 9 ± 1 < 2
H2'-H3' 6 ± 1 7 ± 1
H3'-H4' < 2 8 ± 1
H4'-H5' 2 ± 1 2 ± 1
H4'-H5" 3 ± 1 8 ± 1
2.3.3.3 Carbon-13 chemical shifts, 1JCH coupling constants, and assignment of H5'
and H5''
The 13C-1H heteronuclear single quantum coherence (HSQC) spectrum of 1.0 M
neutral Na2(5'-GMP) solution is shown in Figure 2-17. The one-bond 1JCH is at least ten
times larger than two-bond or three-bond couplings, and is used to establish direct
correlation between 1H and 13C.78 In this case, we performed an HSQC experiment
without decoupling during acquisition where the 1JCH coupling constants can be
measured (Figure 2-17). For clarity, the determination of 1JCH coupling constants is
shown in the C8-H8 region only. We also performed a high resolution 1D 13C NMR
experiment for 13C chemical shift assignment (Figure 2-18). Both experimental results are
listed in Table 2-8.
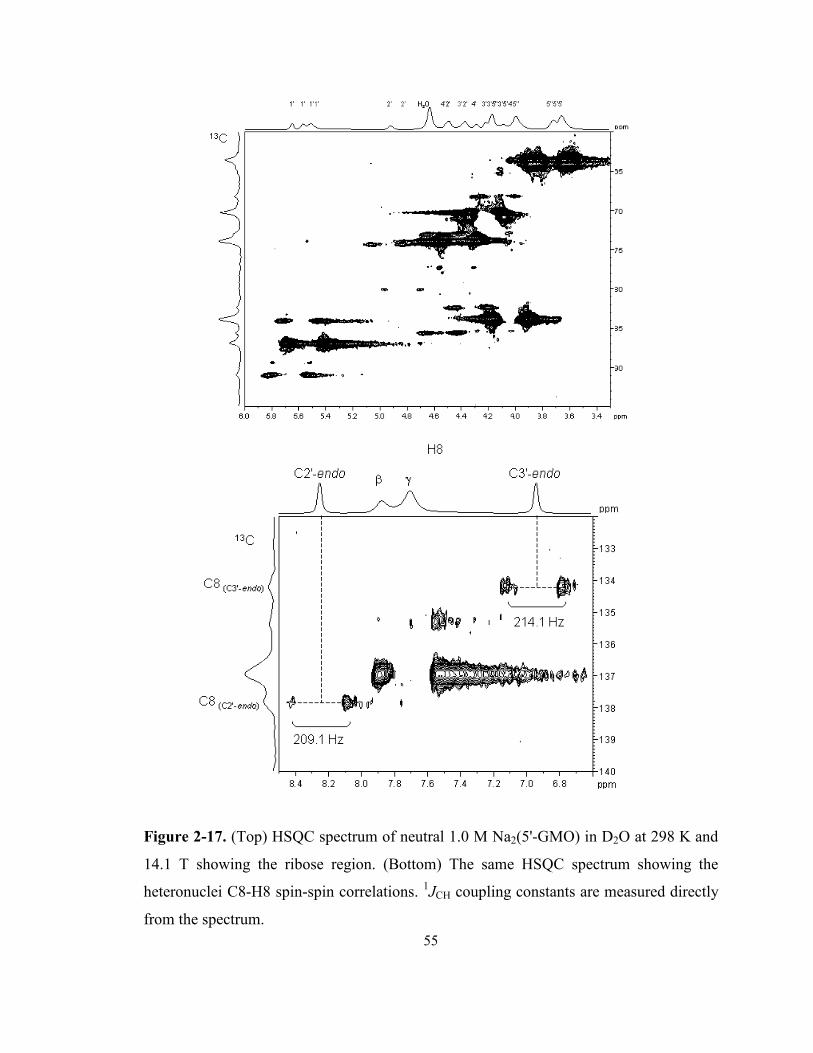
55
Figure 2-17. (Top) HSQC spectrum of neutral 1.0 M Na2(5'-GMO) in D2O at 298 K and
14.1 T showing the ribose region. (Bottom) The same HSQC spectrum showing the
heteronuclei C8-H8 spin-spin correlations. 1JCH coupling constants are measured directly
from the spectrum.

56
Figure 2-18. 13C-NMR spectrum of neutral 1.0 M Na2(5'-GMP) in D2O at 298 K and
14.1 T.
Table 2-8. Carbon-13 resonances (in ppm) and 1JCH coupling constants (in Hz) for 1.0 M
Na2(5'-GMP) at 278 K.
C2'-endo (S) C3'-endo (N)
13C chemical shift 1JCH 13C chemical shift 1
JCH
Ribose carbons
C1' 83.8 162.5 90.7 172.6
C2' 74.1 144.2 72.8 153.8
C3' 73.5 154.2 67.9 144.2
C4' 85.3 151.3 82.1 150.4
C5' 64.5 155.4/150.4 65.0 150.6/144.6
Base carbons
C2 152.7 153.2
C4 152.5 148.9
C5 114.0 115.0
C6 159.7 159.7
C8 137.6 209.1 133.9 214.1
It is also known that stereochemical assignment of the H5' and H5'' signals can
be achieved using the literature definition where the two observed 1J(C5', H5) couplings are
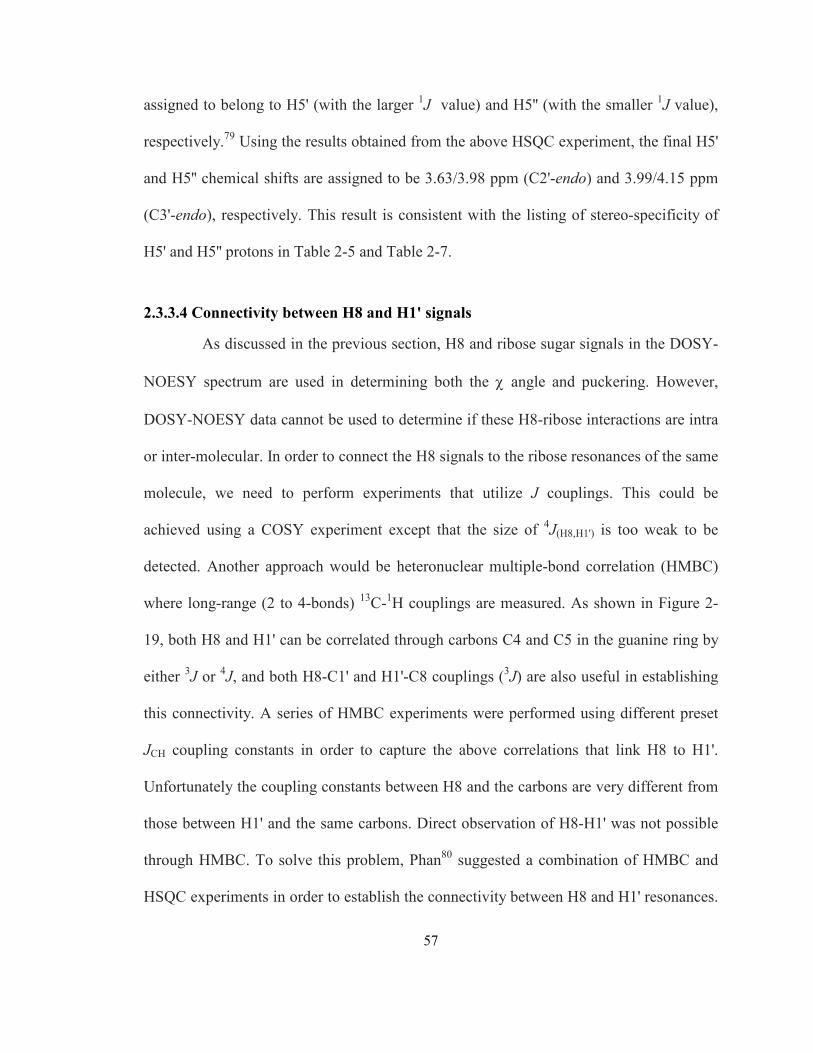
57
assigned to belong to H5' (with the larger 1J value) and H5'' (with the smaller 1
J value),
respectively.79 Using the results obtained from the above HSQC experiment, the final H5'
and H5'' chemical shifts are assigned to be 3.63/3.98 ppm (C2'-endo) and 3.99/4.15 ppm
(C3'-endo), respectively. This result is consistent with the listing of stereo-specificity of
H5' and H5'' protons in Table 2-5 and Table 2-7.
2.3.3.4 Connectivity between H8 and H1' signals
As discussed in the previous section, H8 and ribose sugar signals in the DOSY-
NOESY spectrum are used in determining both the χ angle and puckering. However,
DOSY-NOESY data cannot be used to determine if these H8-ribose interactions are intra
or inter-molecular. In order to connect the H8 signals to the ribose resonances of the same
molecule, we need to perform experiments that utilize J couplings. This could be
achieved using a COSY experiment except that the size of 4J(H8,H1') is too weak to be
detected. Another approach would be heteronuclear multiple-bond correlation (HMBC)
where long-range (2 to 4-bonds) 13C-1H couplings are measured. As shown in Figure 2-
19, both H8 and H1' can be correlated through carbons C4 and C5 in the guanine ring by
either 3J or 4
J, and both H8-C1' and H1'-C8 couplings (3J) are also useful in establishing
this connectivity. A series of HMBC experiments were performed using different preset
JCH coupling constants in order to capture the above correlations that link H8 to H1'.
Unfortunately the coupling constants between H8 and the carbons are very different from
those between H1' and the same carbons. Direct observation of H8-H1' was not possible
through HMBC. To solve this problem, Phan80 suggested a combination of HMBC and
HSQC experiments in order to establish the connectivity between H8 and H1' resonances.

58
Figure 2-20 displays the 13C-decoupled HSQC and HMBC spectra side by side of each
other. The H8-H1' connectivity within the same molecule is achieved via H8-C8 (HSQC)
and C8-H1' (HMBC) correlations.
Figure 2-19. 13C-1H heteronuclear couplings (3
J or 4J) for protons H8 (blue) and H1'
(red) that connects them to each other in the Na2(5'-GMP) molecule.
Figure 2-20. (Left) 2D 1H-13C HSQC and (right) gradient-enhanced HMBC spectra of
1.0 M Na2(5'-GMP) in D2O at 298 K and 14.1 T.

59
2.3.3.5 Connectivity between H8 and base exchangeable protons
Because H8 and the base exchangeable protons (N1H, N2HA/B) from the same 5'-
GMP molecule are too far apart to have NOE interactions, we cannot assign the latter
protons to either set of signals (S or N). Here we used a refocused-HMBC approach to
establish the connectivity between H8 and N1H through a common carbon atom: H8 �
C5 � N1H (Figure 2-21). Then the imino and amino protons are connected to each other
using NOESY as shown in Figure 2-6. The assigned imino and amino proton chemical
shifts are listed in Table 2-9.
Figure 2-21. (Top) 13C-1H heteronuclear couplings that connects H8 and N1H through C5
in Na2(5'-GMP). (Bottom) 2D refocused-HMBC spectrum of 1.0 M Na2(5'-GMP) in 90%
H2O/ 10% D2O at 298 K and 14.1 T.

60
Table 2-9. Experimental chemical shifts (in ppm) of guanine exchangeable protons in 1.0
M Na2(5'-GMP) at 298 K.
Proton C2'-endo (S) C3'-endo (N)
N1H 10.83 10.78
N2HA 9.83 9.30
N2HB 5.12 4.29
2.3.3.6 Heteronuclear 1
H-31
P COSY and 3JPH coupling constants
Besides proton-proton coupling constants, the proton-phosphorous (3JHP)
relationship is also studied using the heteronuclear 2D experiment 1H-31P COSY. In this
case, the phosphorous-31 nucleus is J-coupled to neighboring protons, such as H5', H5'',
and sometimes H4' (4JHP). Figure 2-22 shows the 1H-31P COSY spectrum with the
corresponding 1D 31P and 1H spectra shown on the F1 and F2 dimension, respectively.
We observe that the 31P signals from either C2'-endo or C3'-endo molecules have very
different chemical shifts, possibly due to different orientations of the phosphate groups
and the subsequent different magnetic environments in the two molecules (see next
section). Moreover, we observe cross peaks between these two 31P signals with protons
from the ribose sugar. The measured 3JHP coupling constants of both C2'-endo or C3'-
endo molecules, as well as the 31P chemical shifts (in ppm) of these two types of
molecules are listed in Table 2-10. The monomer has a 31P chemical shift of 4.5 ppm.

61
Figure 2-22. Phase sensitive, proton-detected 1H-31P COSY of 1.0 M neutral Na2(5'-
GMP) in D2O at 298 K and 14.1 T. Positive contour is colored black, and negative red.
Correlations (3JHP) are linked using dotted lines. Labeled boxes are expanded views of
1H-31P COSY cross peaks used to measure “apparent J-couplings”.

62
Table 2-10. 3JHP coupling constants (in Hz) of 5'-GMP protons and phosphorous
extracted from 1H-31P COSY experiment, and 31P chemical shifts from 31P NMR
spectrum.
3JHP C2'-endo (S) C3'-endo (N)
31P-H4' 2 ± 2 NA 31P-H5' < 2 9 ± 2 31P-H5" 7 ± 2 9 ± 2
δ (31P) (ppm) 2.3 4.6
2.3.3.7 Torsion angles ββββ, γ, and δ in C2'-endo and C3'-endo monomers
The torsion angles β and γ of a guanosine molecule are defined in Chapter 1.
The well-known Karplus equation (derived by Martin Karplus)77,81 can be used to link
dihedral angles to vicinal 3JHH coupling constants:
Equation 2-5 3
JHH = A + B cosθ + C cos2θ,
where θ = dihedral angle, and A, B, and C are constants whose values depend on the
atoms and substituents involved on the carbon atoms where these coupling-constants are
measured.81 The Karplus equation has been well established in carbohydrate, protein, and
nucleic acid systems.82,83,84 As shown in Figure 2-23, the γ angle can be estimated using
the hill-and-valley expression of the Karplus equation specific for nucleic acids. In this
case, the γ angle is determined using the coupling constants JH4'H5' and JH4'H5'' and the final
results are ca. 40-50º and 200-220º for C2'-endo and C3'-endo molecules, respectively.
These angles represent a distinct C4'-C5' bond orientations for these two species: (+)
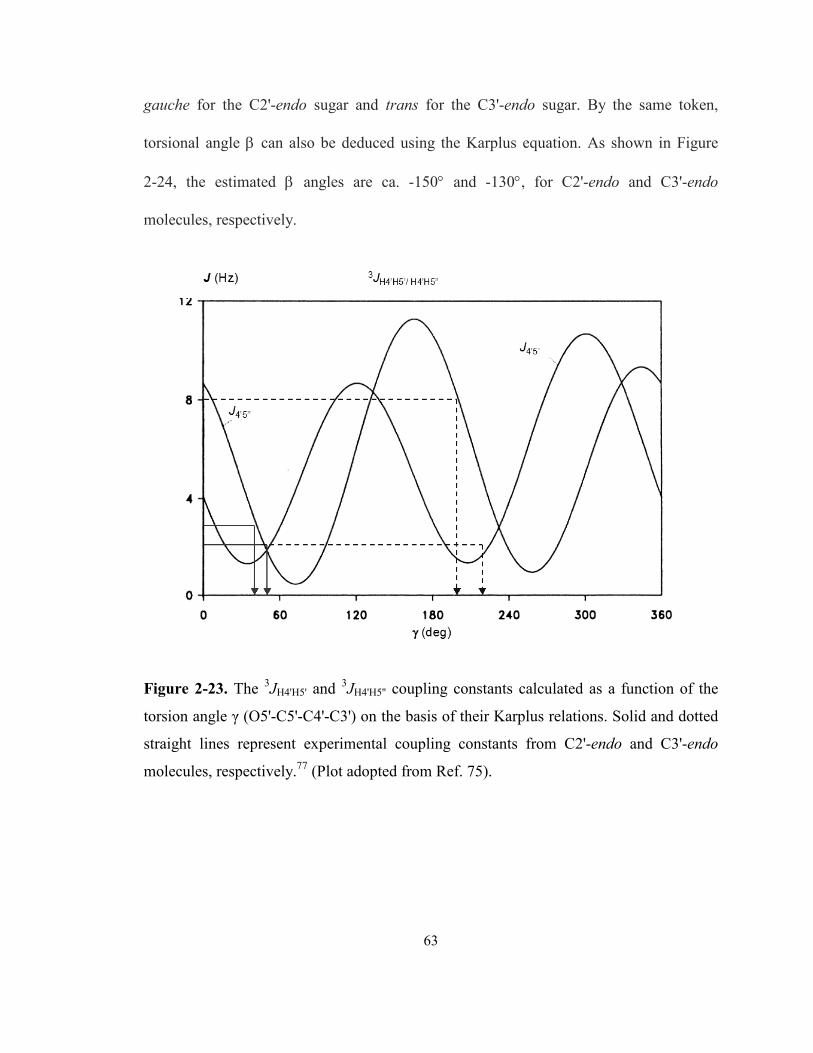
63
gauche for the C2'-endo sugar and trans for the C3'-endo sugar. By the same token,
torsional angle β can also be deduced using the Karplus equation. As shown in Figure
2-24, the estimated β angles are ca. -150° and -130°, for C2'-endo and C3'-endo
molecules, respectively.
Figure 2-23. The 3JH4'H5' and 3
JH4'H5'' coupling constants calculated as a function of the
torsion angle γ (O5'-C5'-C4'-C3') on the basis of their Karplus relations. Solid and dotted
straight lines represent experimental coupling constants from C2'-endo and C3'-endo
molecules, respectively.77 (Plot adopted from Ref. 75).
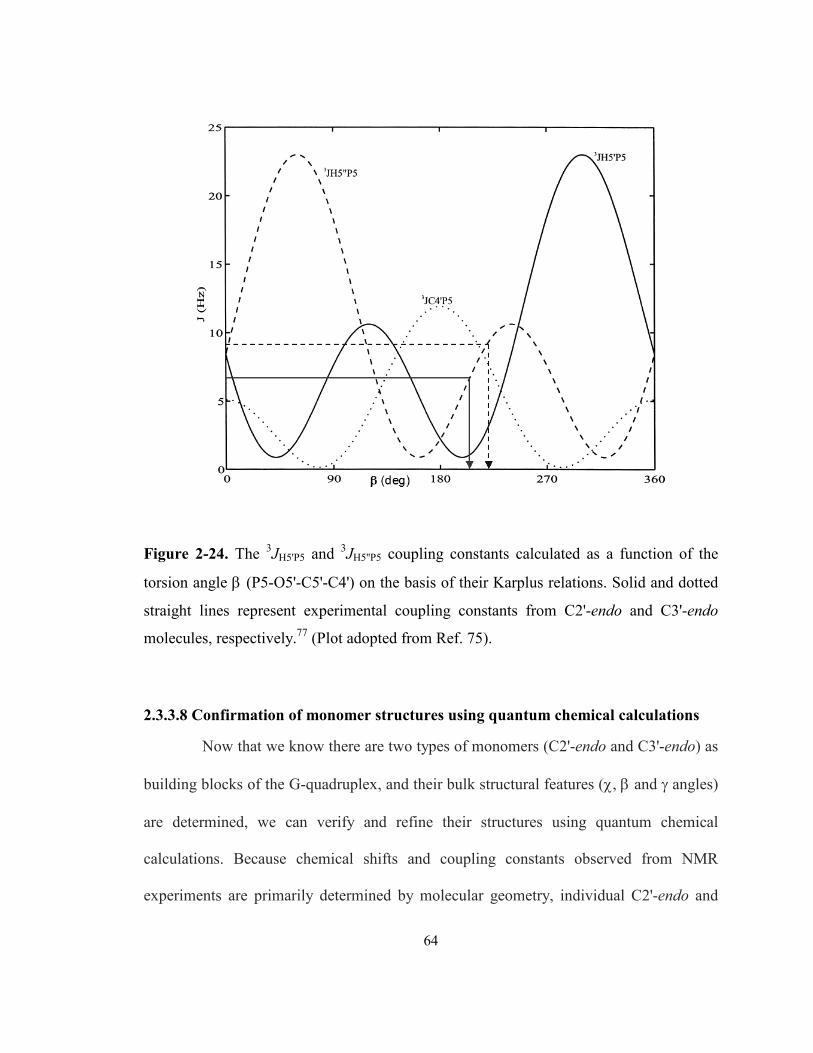
64
Figure 2-24. The 3JH5'P5 and 3
JH5''P5 coupling constants calculated as a function of the
torsion angle β (P5-O5'-C5'-C4') on the basis of their Karplus relations. Solid and dotted
straight lines represent experimental coupling constants from C2'-endo and C3'-endo
molecules, respectively.77 (Plot adopted from Ref. 75).
2.3.3.8 Confirmation of monomer structures using quantum chemical calculations
Now that we know there are two types of monomers (C2'-endo and C3'-endo) as
building blocks of the G-quadruplex, and their bulk structural features (χ, β and γ angles)
are determined, we can verify and refine their structures using quantum chemical
calculations. Because chemical shifts and coupling constants observed from NMR
experiments are primarily determined by molecular geometry, individual C2'-endo and

65
C3'-endo monomers were chosen as the basic units of calculation instead of a tetramer
(G-quartet).
First, models of both C2'-endo and C3'-endo monomers were built using known
5'-GMP crystal structures and were manually optimized to fit experimental data (e.g.,
DOSY-NOESY and NOESY).47,48,58 Since it is difficult to obtain experimental 15N and
17O chemical shifts, as well as the infeasibility of comparing the overlapped 1H chemical
shifts to the calculated results, we decided to perform calculations on 13C chemical shifts
for the two conformers. The calculated 13C chemical shifts were then compared to
experimental results. The geometries of these models may be different from the real
structures because a vast amount of adjustable parameters exist, including bond lengths,
angles, and torsional angles. Therefore an extensive amount of calculations were
performed in order to obtain the most representative structure of the models.
Each [5'-GMP]2- molecule contains 36 atoms and all quantum chemical
calculations were performed at the density functional theory (DFT) level using the hybrid
B3LYP exchange functional with the 6-311++G(d,p) basis set.85,86 The gauge-including-
atomic-orbital (GIAO) approach as implemented in Gaussian 03 was used in shielding
and coupling constant calculations.87 To make direct comparison between the calculated
shielding and the observed chemical shift, the absolute 13C shielding scale of σref = 185.4
ppm was used.88 As shown in Figure 2-25, the correlation (R value) for the two different
sets of data was 0.984 and 0.992 for C2'-endo and C3'-endo monomers, respectively. This
shows good agreements between experimental and calculated 13C chemical shifts of the
final models. However, the large intercept (approximately 9 ppm) for both sets of data

66
suggested that there were factors preventing the calculation from agreeing with the actual
experimental results. These factors may include basis-set limitation where the current
basis set does not have sufficient basis functions to fully represent the molecule. In
addition, the experimental data were obtained at room temperature while the calculation
was performed at absolute zero with no thermal correction. The gas phase molecule is
also not representative of the solution-state 5'-GMP sample. Moreover, the lack of
neighboring Na+ atoms might have also contributed to the differences between the
computation and experimental results.
Because of these various reasons that might have contributed to inconsistency,
direct comparison between calculations and experimental 13C chemical shifts may not be
very useful. Therefore, we decided to evaluate the difference in 13C chemical shifts
between the two conformers instead. The difference in 13C chemical shifts was defined as
(in ppm): the 13C chemical shift of a particular carbon of the C2'-endo monomer subtracts
the 13C chemical shift of the same carbon in the C3'-endo conformation. The final 13C and
1H chemical shift differences between these two molecules are compared with
experimental values and are shown in Figure 2-26. The x-axis of this graph shows the
various carbon atoms of the 5'-GMP molecules, while the y-axis shows the differences of
the chemical shifts between the two puckering molecules of the same carbon atom.
Proton chemical shifts are also used as complementary data. It should be noted that
because 13C has a larger chemical shift range compared with proton, a larger difference
between experimental and calculation result is expected. Nonetheless, the calculations are
in good agreement with experimental values, and two final puckering molecules served
as the building blocks of the G-quadruplex are produced. Figure 2-27 shows the

67
structures of these two monomers, and their Cartesian coordinates in protein-data-bank
(PDB) format are listed in Appendix I.
Figure 2-25. Experimental and calculated (B3LYP/6-311++G(d,p)) 13C NMR chemical
shifts of the C2'-endo and C3'-endo 5'-GMP monomers.
Figure 2-26. Differences in experimental and calculated 1H and 13C chemical shifts
between the C2'-endo and C3'-endo conformers.

68
All computed 1H and 13C chemical shifts and coupling constants for these 5'-
GMP molecules are listed in Table 2-11. The final pseudorotation phase angle (P), and
puckering amplitudes (νmax) of C2'-endo and C3'-endo molecules are also calculated
using the following equations89 and the results are summarized in Table 2-12. The
definitions of ν0-4 are listed in Table 1-1, Chapter 1.
Equation 2-6 )72sin36(sin2
)()(tan
2
0314
+
+−+=
ν
ννννP
Equation 2-7 Pcos
2max
νν =
Figure 2-27. Final models of calculated 5'-GMP molecules using B3LYP/6-
311++G(d,p).

69
Table 2-11. Computed 1H and 13C chemical shifts (in ppm) and 1JCH coupling constants
(in Hz) for 5'-GMP molecules in C2'-endo and C3'-endo sugar pucker conformations. The
level of calculation is B3LYP/6-311++G(d,p).a
C2'-endo (S) C3'-endo (N) (13C)/(1JCH) C2'-endo (S) C3'-endo (N)
Non-
exchangeable Ribose carbons
protons
H8 8.26 8.06 C1' 87.9 (171.6) 97.4 (173.8)
H1' 5.44 5.55 C2' 78.5 (155.3) 77.2 (158.6)
H2' 5.40 3.06 C3' 75.5 (170.3) 72.9 (143.3)
H3' 4.63 3.94 C4' 93.7 (147.0) 83.3 (153.6)
H4' 3.33 4.08 C5' 58.9 (139.7/133.3) 60.9 (138.6/131.1)
H5' 2.62 3.27
H5" 3.38 4.20 Base carbons
C2 157.6 157.7
C4 159.9 158.0
C5 126.0 126.6
C6 162.0 161.6
C8 141.4 (194.7) 140.0 (195.2)
a Chemical shifts (δ) are converted from the calculated shielding (σ) using δ = σref - σ,
where σref(13C) = 185.4 ppm and σref(
1H) = 34.9 ppm.
Table 2-12. Torsion angles, pseudorotation phase angle (P), and puckering amplitudes
(ν) determined for the two 5'-GMP molecules. All quantities are in degrees.
Pucker χ β δ γ ν0 ν1 ν2 ν3 ν4 P νm
C2'-endo -60 -150 138 40 -18.8 30.2 -28.4 17.6 0.6 159.9 30.2
C3'-endo -130 -150 83 -140 3.4 -25.7 37.3 -36.2 20.8 13.7 38.4

70
2.3.4 G-quartet arrangement
In Section 2.3.3.5, we have established the connection between H8 and N1H of
the same 5'-GMP molecule using 1H-13C refocused HMBC experiment, and concluded
that the observed H8 with N1H/N2HA cross peaks in NOESY were from the same quartet
instead of inter-quartets. Moreover, the same NOESY spectrum does not show any cross
peaks that would indicate a mixed C2'-endo/C3'-endo G-quartet formation, i.e., no H8(S)-
N1H/N2HA(N) or H8(N)-N1H/N2HA(S) cross peaks are observed; see Figure 2-28. This
concludes that the G-quartets are all-C2'-endo (all-S) and all-C3'-endo (all-N), instead of
adjacent-C2'-endo/C3'-endo or alternate-C2'-endo/C3'-endo. This is consistent with the
observation discussed in session 2.3.1 about all-α and all-γ G-quartets.
Figure 2-28. NOESY spectrum of a neutral 1.0 M Na2(5'-GMP) solution in 1:1 H2O/D2O
at 278 K and 14.1 T with a mixing time of 50 ms. Expected cross peak for adjacent-C2'-
endo/C3'-endo or alternate-C2'-endo/C3'-endo G-quartet are enclosed in the boxes. (This
spectrum is an enlarged portion of Figure 2-6).

71
2.3.5 G-quadruplex formation
Now that we have two types of G-quartets (all-S and all-N), we need to find the
stacking pattern with which G-quartets form a G-quadruplex helix. In this regard, both
NOESY and DOSY-NOESY can provide spatial arrangement information between
stacking G-quartet layers. Eleven inter-quartet cross peaks including H1'(S)-
H8/H4'/H5'/H5''(N), H2'(S)-H2'/2'OH(N), H8(S)-H1'/H2'/2'OH(N), and N2HB(S)-
H2'/H3'(N) are highlighted in the NOESY spectrum (Figures 2-29 and 2-30). The H1'(S)-
H8 cross peak gives an indication that the head face of the all-S quartet is opposed to the
tail face of an all-N quartet, i.e., head-to-tail stacking. The “head” and “tail” faces of a G-
quartet refer to the direction of the Hoogsteen hydrogen-bond from the donor to the
acceptor (Figure 2-31). It is called a “head” face when the direction is clockwise, and it is
called a “tail” face when the direction is counter-clockwise.
In this case, the head-to-tail stacking suggests alternate stacking of all-S and all-
N quartets on each other to form a G-quadruplex. This is a reasonable stacking pattern as
either head-to-head or tail-to-tail hinders formation of long columns due to repulsion.
Using molecular models, the NOE cross peaks H8(S)-H2'(N) and H1'(S)-H5'/H5''(N) also
suggest that the quartets are twisted 30° relative to each other in a right-handed fashion
with a separation of 3.4 Å between G-quartets. This is in agreement with the G-
quadruplex model suggested by Zimmerman using x-ray fiber diffraction.47 From the
same NOESY spectrum, the chemical shifts of the hydroxyl protons are also discovered
(in ppm): 2'-OH = 5.09 (S), 7.44 (N), and 3'-OH = 9.30 (S), 9.20 (N). It is very interesting
to note that, three of these four hydroxyl groups are located at high frequency, suggesting

72
their involvement in hydrogen-bonding. Using this information, a G-quadruplex model is
built using the final C2'-endo and C3'-endo models from calculations (Figure 2-32).
Figure 2-29. 2D NOESY spectrum of a neutral 1.0 M Na2(5'-GMP) solution in 1:1
H2O/D2O at 278 K and 14.1 T with a mixing time of 50 ms. The inter-quartet cross peaks
are highlighted using arrows. C2'-endo and C3'-endo signals are in red and blue,
respectively.

73
Figure 2-30. Enlarged 2D NOESY spectrum showing the ribose region of a neutral 1.0
M Na2(5'-GMP) solution in 1:1 H2O/D2O at 278 K and 14.1 T with a mixing time of 50
ms. The inter-quartet cross peaks are highlighted using arrows. C2'-endo and C3'-endo
signals are in red and blue, respectively.
Figure 2-31. The two faces of a G-quartet. Hoogsteen hydrogen bond with a clockwise
rotation from donor to acceptor is called the “head” face, and the “tail” face has a
counter-clockwise rotation.

74
Figure 2-32. (Left) A full turn of the right-handed 5'-GMP G-quadruplex with Na+ ions
(purple balls) reside in the channel site. (Right) Top view of the G-quadruplex where
Na+-P distances are highlighted and labeled.
The final G-quadruplex model is composed of twelve layers of G-quartets in a
full rotation of the helix (360º) with a total molecular weight of approximately 17 kDa
(48 GMP molecules x 364 g/mol). It is of C4 symmetry with alternate C2'-endo and C3'-
endo quartets stacking onto each other in a head-to-tail fashion. The coordinates of the
first two G-quartets (all-S and all-N) are provided in Appendix I. The following equations
are used to generate the whole 5'-GMP G-quadruplex:

75
Equation 2-8 x' = x(cosφ) – y(sinφ)
Equation 2-9 y' = y(cosφ) + x(sinφ)
Equation 2-10 z' = z + 6.8
where x, y, and z are the original coordinates from the calculated models, and φ is the
twist angle (90°, 180°, and 270°) used in making a single all-S or all-N G-quartet. When
building the G-quadruplex, the next all-S layer is twisted 60° and 6.8 Å away from the
previous all-S layer because of alternating all-S and all-N stacking. The same rules also
apply to all-N quartets when stacking. The intra-molecular, intra-quartet, and inter-
quartet distances of all protons in the 5'-GMP G-quadruplex are listed in Appendix I as
well.
Upon examining this 12-layer 5'-GMP G-quadruplex model, several interesting
observations are made. First, hydrogen bonds are observed to form between the
phosphate group P(S)-O- and the hydroxyl group H-O3'(N) three quartets away, as shown
in Figure 2-33. This kind of inter-quartet hydrogen-bond formation along the helix has
never been reported, and they certainly contribute further to the stability of the G-
quadruplex structure. This reaffirms the pH dependence in G-quadruplex formation
because phosphate group has two negatively charged oxygens for phosphate-hydroxyl
bond only at neutral to slightly alkaline pH. Secondly, we observed that the arrangement
of adjacent 5'-GMP molecules in the helix is almost identical to those in polynucleotides
systems where they are linked by covalent phosphodiester bonds. This type of automatic
self-alignment could perhaps shed a light on how mononucleotides might have arranged
into oligomers under prebiotic conditions.

76
Figure 2-33. (Left) A partial structure of the 5'-GMP helix showing inter-quartet
phosphate-hydroxyl hydrogen-bonds, where O…O distances are given. (Right) Schematic
display of the hydrogen-bond linkage along the 5'-GMP helix.
As shown in Table 2-13, it is interesting to observe that only Z-DNA shares the
property of having two types of sugar puckering in the same system with Na2(5'-GMP),
although Z-DNA has a left-handed helix and has both types of anti and syn glycosidic
angles. Since the C2'-endo sugar pucker of 5'-GMP is in high-anti conformation (χ = -
60°), rather than syn, this explains the right-handed helix formation in the 5'-GMP
system. Moreover, Z-DNA is composed of both dG and dC polynucleotides while our 5'-
GMP G-quadruplex is only comprised of G mononucleotides. We believe that the right-
handed Na2(5'-GMP) G-quadruplex formed under neutral condition represent a new class
of nucleotide structure that has not been reported before.90
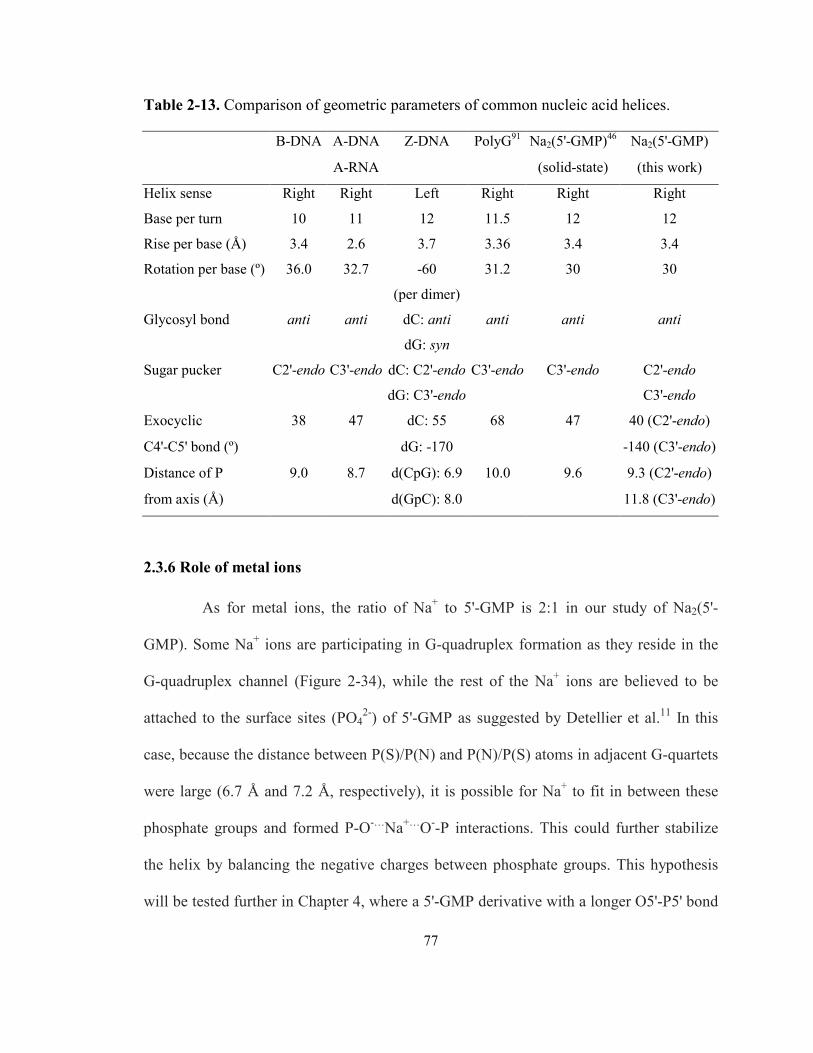
77
Table 2-13. Comparison of geometric parameters of common nucleic acid helices.
B-DNA A-DNA Z-DNA PolyG91 Na2(5'-GMP)46 Na2(5'-GMP)
A-RNA (solid-state) (this work)
Helix sense Right Right Left Right Right Right
Base per turn 10 11 12 11.5 12 12
Rise per base (Å) 3.4 2.6 3.7 3.36 3.4 3.4
Rotation per base (º) 36.0 32.7 -60 31.2 30 30
(per dimer)
Glycosyl bond anti anti dC: anti anti anti anti
dG: syn
Sugar pucker C2'-endo C3'-endo dC: C2'-endo C3'-endo C3'-endo C2'-endo
dG: C3'-endo C3'-endo
Exocyclic 38 47 dC: 55 68 47 40 (C2'-endo)
C4'-C5' bond (º) dG: -170 -140 (C3'-endo)
Distance of P 9.0 8.7 d(CpG): 6.9 10.0 9.6 9.3 (C2'-endo)
from axis (Å) d(GpC): 8.0 11.8 (C3'-endo)
2.3.6 Role of metal ions
As for metal ions, the ratio of Na+ to 5'-GMP is 2:1 in our study of Na2(5'-
GMP). Some Na+ ions are participating in G-quadruplex formation as they reside in the
G-quadruplex channel (Figure 2-34), while the rest of the Na+ ions are believed to be
attached to the surface sites (PO42-) of 5'-GMP as suggested by Detellier et al.11 In this
case, because the distance between P(S)/P(N) and P(N)/P(S) atoms in adjacent G-quartets
were large (6.7 Å and 7.2 Å, respectively), it is possible for Na+ to fit in between these
phosphate groups and formed P-O-…Na+…O--P interactions. This could further stabilize
the helix by balancing the negative charges between phosphate groups. This hypothesis
will be tested further in Chapter 4, where a 5'-GMP derivative with a longer O5'-P5' bond
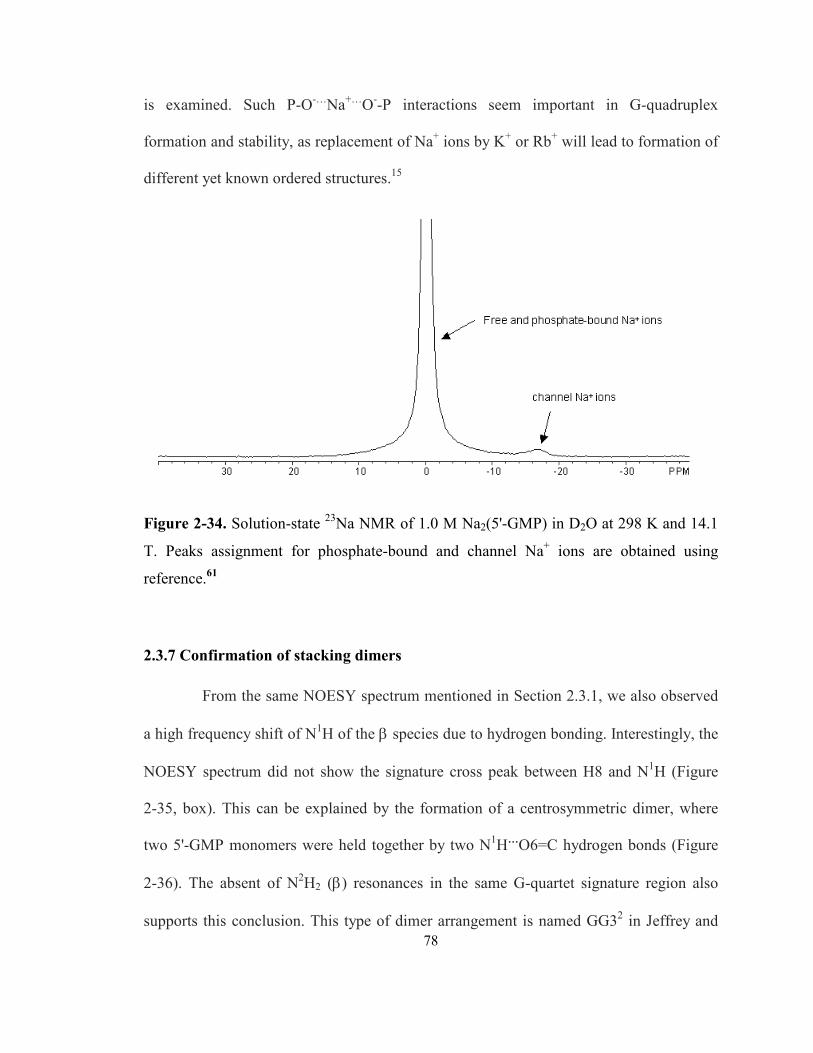
78
is examined. Such P-O-…Na+…O--P interactions seem important in G-quadruplex
formation and stability, as replacement of Na+ ions by K+ or Rb+ will lead to formation of
different yet known ordered structures.15
Figure 2-34. Solution-state 23Na NMR of 1.0 M Na2(5'-GMP) in D2O at 298 K and 14.1
T. Peaks assignment for phosphate-bound and channel Na+ ions are obtained using
reference.61
2.3.7 Confirmation of stacking dimers
From the same NOESY spectrum mentioned in Section 2.3.1, we also observed
a high frequency shift of N1H of the β species due to hydrogen bonding. Interestingly, the
NOESY spectrum did not show the signature cross peak between H8 and N1H (Figure
2-35, box). This can be explained by the formation of a centrosymmetric dimer, where
two 5'-GMP monomers were held together by two N1H…O6=C hydrogen bonds (Figure
2-36). The absent of N2H2 (β) resonances in the same G-quartet signature region also
supports this conclusion. This type of dimer arrangement is named GG32 in Jeffrey and

79
Saenger’s notations.92 Moreover, the assignment of β as stacking dimers is also supported
by the ROESY experiment, where exchange activity is observed between dimer (β) and
monomer (γ) species (Figure 2-37). ROESY is an experiment similar to NOESY, except
it measures NOE in the rotating frame. ROESY cross peaks are basically due to cross-
relaxation effect from spins close to each other in space, and chemical exchange. Because
ROESY is carried out in the rotating frame, the NOE in the transverse plane (i.e., ROE) is
always opposite phase from the diagonal. Hence, in a ROESY spectrum, when the
diagonal has a positive phase, the ROE would have a negative phase, and the chemical
exchange signals would have a positive phase. As shown in Figure 2-37, the same phase
cross peaks (compared with the diagonal) between the H8 signals (β and γ) suggests that
they are exchanging in the millisecond NMR time scale. However, exchange between
these two species with either G-quadruplex signal (α and γ) are not observed (Figure
2-37). This is consistent with a previous 31P magnetization-transfer NMR study of Na2(5'-
GMP).57 The presence of dimers also support the results of Wong et al., where stacking
dimers are observed in a concentrated solution of Na2(5'-GMP) at neutral pH.66 Proton
and carbon-13 chemical shifts and coupling constants of both monomer and dimer signals
are extracted from COSY, NOESY and HSQC experiments, and the values are shown in
Table 2-14.
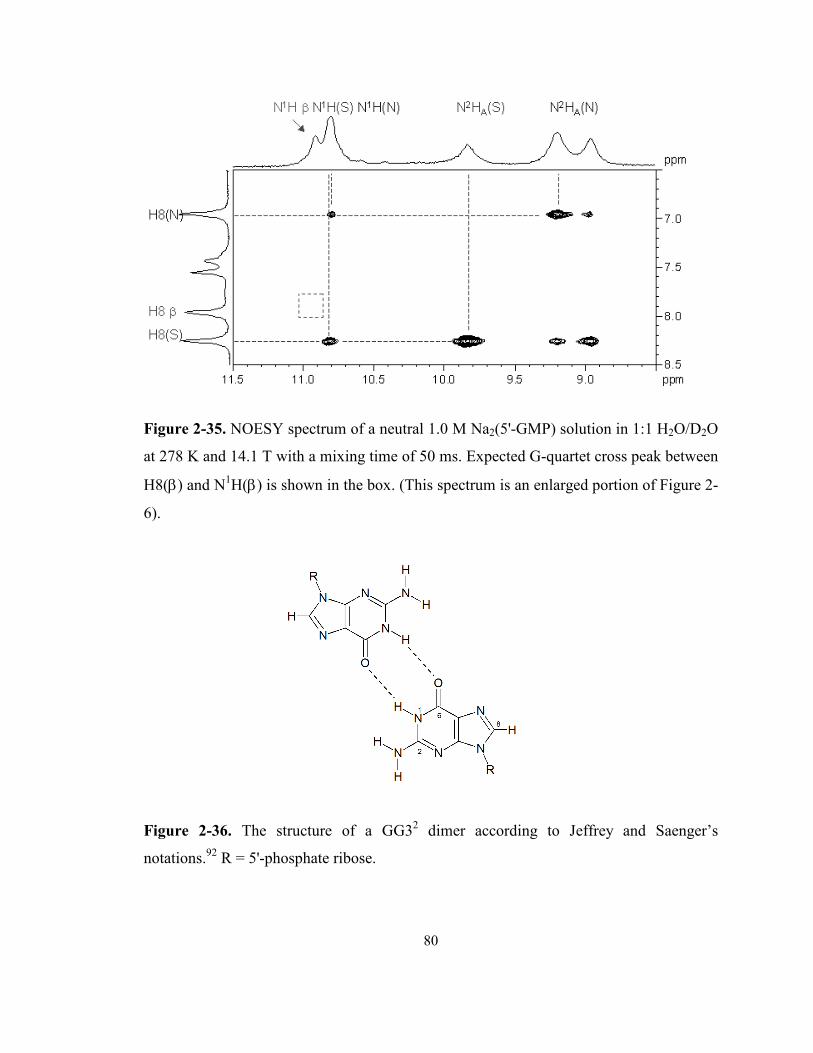
80
Figure 2-35. NOESY spectrum of a neutral 1.0 M Na2(5'-GMP) solution in 1:1 H2O/D2O
at 278 K and 14.1 T with a mixing time of 50 ms. Expected G-quartet cross peak between
H8(β) and N1H(β) is shown in the box. (This spectrum is an enlarged portion of Figure 2-
6).
Figure 2-36. The structure of a GG32 dimer according to Jeffrey and Saenger’s
notations.92 R = 5'-phosphate ribose.
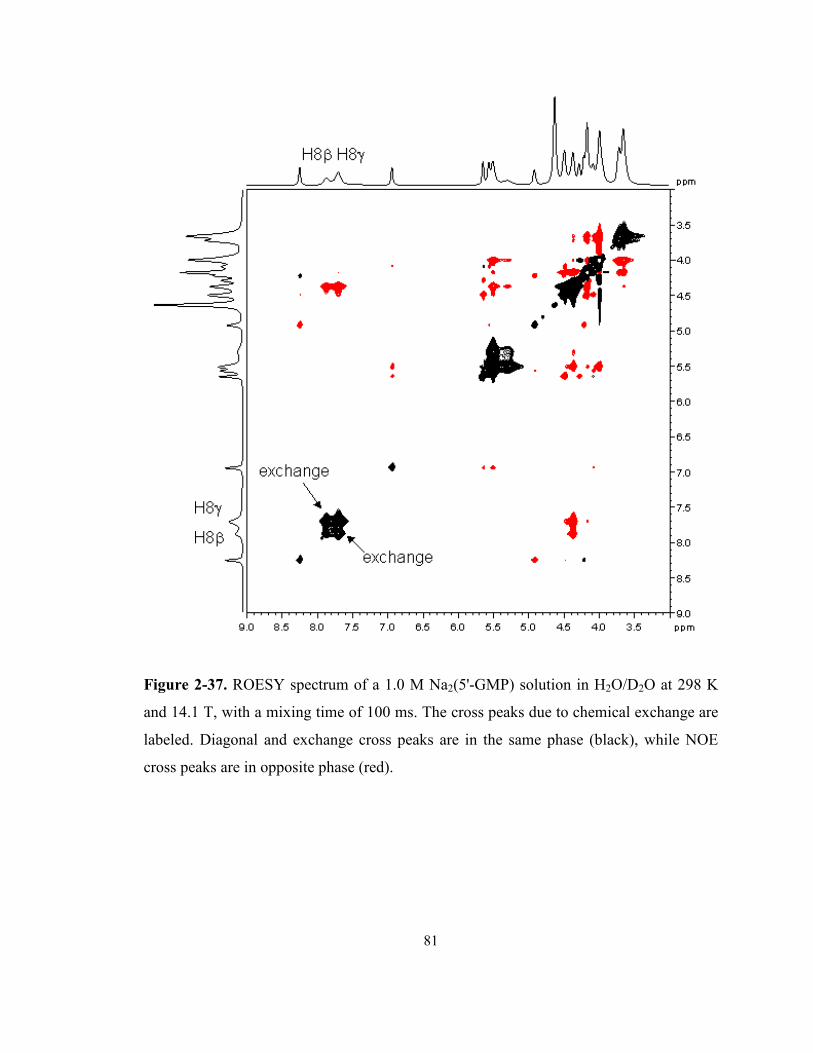
81
Figure 2-37. ROESY spectrum of a 1.0 M Na2(5'-GMP) solution in H2O/D2O at 298 K
and 14.1 T, with a mixing time of 100 ms. The cross peaks due to chemical exchange are
labeled. Diagonal and exchange cross peaks are in the same phase (black), while NOE
cross peaks are in opposite phase (red).

82
Table 2-14. Proton and carbon-13 resonances (in ppm) and indirect spin-spin coupling
constants (in Hz) for monomer and dimer aggregates in 1.0 M Na2(5'-GMP) at 278 K (m
= monomer, d = dimer).
1H chemical shift 13C chemical shift 1JCH
Non-exchangeable protons Ribose carbons
H8 7.95 (m) / 7.57 (d) C1' 86.7 165
H1' 5.40 (m) / 5.33 (d) C2' 73.6 153.6
H2' NA C3' 70 154.6
H3' 4.11 C4' 83.6 150.7
H4' 4.04 C5' 63.3 140.0/145.3
H5' 3.86 Base carbons
H5" 3.59 C2 157.4
C4 121
Exchangeable protons C5 115.5
N1H 10.91 (d) C6 168.8
N2H2 5.81-6.01
(broad, m/d)
C8 135.0 (m)
136.6 (d)
215.7
2.4 Conclusion
In summary, we are able to determine successfully two self-assembled
structures of Na2(5'-GMP) under neutral conditions using both NMR and computation
methods. A GG32 dimer and a right-handed G-quadruplex helix with head-to-tail all-S on
all-N stacking form spontaneously under neutral pH using various weak, non-covalent
forces. The G-quadruplex is formed using hydrogen-bonds (base-base and hydroxyl-
phosphate), π-π stacking (base-base), ion-dipole interaction between the channel Na+ ions
and the surrounding carbonyl oxygens (Na+…O6), as well as ion-phosphate interactions

83
(P-O-…Na+…O--P) as previously suggested.61 Since the G-quadruplex expressed less
temperature dependence (from 278 to 298 K), we believe that the same structure exists in
solid-state. It is also possible that similar structures exist in compounds form by
guanosine derivative self-assembles, or in other nucleic acid systems.

84
Chapter 3
Structural determination of disodium guanosine 5'-monophosphate G-
quadruplex under acidic conditions
3.1 Introduction
Gel formation of guanosine 5'-monophosphate (5′-GMP) under slightly acidic
conditions (e.g., pH 5) was first discovered by Ivar Christian Bang in 1910 (Figure 1-1,
Chapter 1).11 However, it was not until 50 years later that the structural basis of such 5'-
GMP gel was examined. In 1962, Gellert et al. used x-ray fiber diffraction data to show
that different GMP isomers form different helical structures.12 For 3'-GMP gel, the
helical structure is formed by successive stacking of planar hydrogen-bonded guanine
tetramers now known as G-quartets on top of each other.12 For 5'-GMP gel formed at pH
5, in contrast, the planar (disc-like) G-quartet is broken at one side forming a continuous
helix using hydrogen bonds between 5'-GMP bases in a lock-washer fashion (Figure
3-1).12 The authors suggested that the helix formed by such linear aggregation using
hydrogen-bonds and van der Waals attractions should form a cylinder (now known as G-
quadruplex) where there is enough room in the channel for water molecules to reside.
They also stated the specific types of inter-molecular hydrogen-bonds form between
phosphate and i) amino (i.e., NH…O=P) from the layer above, ii) neighboring phosphates,
and iii) a 2'-hydroxyl of a neighboring ribose. Together with electrostatic repulsions
between phosphate groups, these forces contribute to the stability of the G-quadruplex.
Based on their x-ray data and the subsequently built model, acidic Na2(5'-GMP) gel
adopts a left-handed helical structure.12

85
disc-G4
lock-washer-G4disc-G
4disc-G
4lock-washer-G
4lock-washer-G
4
Figure 3-1. Illustration of planar G-quartet (left) as in neutral Na2(5'-GMP) solution and
acidic Na2(3'-GMP) gel; (right) open-ended G-quartet as in acidic Na2(5'-GMP) gel. Red
= O, blue = N, and gray = C. Ribose rings and hydrogen atoms are omitted for clarity.
In 1964, Miles and Frazier studied 3'-GMP and 5'-GMP gels using solution-state
IR, UV rotatory dispersion, and optical rotatory dispersion (ORD).13 Although the Cotton
effect from UV cannot distinguish the handedness of helical structures, they found that
Na2(5'-GMP) gel has a similar ORD profile as poly-inosine (poly-I) fibers, that were
known to have right-handed helix conformation.93 The possibility of acidic Na2(5'-GMP)
gel having a right-handed helical conformation was later supported by Homer and Mason
(1966) when they observed a positive, parallel-polarized CD band at 244 nm for acidic 5'-
GMP gel.94
Within the next ten years, Chantot et al. (1971) found that a large negative
Cotton effect at around 260 nm is associated with an anti conformation of G residues.14
They documented that Na2(5'-GMP) forms gel between pH 2.2 and 5.8 only, and the
atoms N7, O6, N1, and one hydrogen of the amino group are essential in forming a gel.
86
In 1972, Chantot took a different approach and quantified the thermodynamics properties
of the self-associating 5'-GMP gel system, for which he found that 20.9 kJ/mol (5
kcal/mol) is involved in hydrogen-bonded base-base interactions, and 14.6-16.7 kJ/mol
(3.5-4 kcal/mol) for stacking interactions. These results support the importance of the
“vertical” hydrogen-bonds between G-quartets and other van der Waals interactions in
forming a stable G-quadruplex structure.95 In 1975, Sasisekharan and colleagues
proposed a continuous, left-handed 15/4 helix (i.e., 15 monomers in 4 turns) for acidic
Na2(5'-GMP) gels using x-ray fiber diffraction.46 Since then, it is commonly believed that
this helix is left-handed and is composed of 5'-GMP monomers all in the C2'-endo sugar
pucker conformation.46 However, in their original paper, although the authors were quite
certain with the continuous helix model, they were not sure about the sugar puckering
and helical handedness.46 Because the 5'-GMP helix is not constrained by covalent
phosphodiester bonds, it is possible to have either right or left-handed helices. In this
case, the helix was “arbitrarily assigned” as left-handed, assuming that monomers are of
C2'-endo puckering. According to the same authors, it is also possible to have a right-
handed helix if the sugar pucker conformation is C3'-endo. It is also clear from the study
of Sasisekharan et al. that whether the acidic 5'-GMP helix is left-handed or right-handed
depends critically on the sugar pucker conformation. Clearly the x-ray fiber diffraction
data cannot provide enough information to distinguish between these two models.
Furthermore, the authors noticed that the quality of the x-ray diffraction data
“dramatically” improved after the salt concentration was reduced in the sample. This
seems to suggest that this continuous helix is quite different from the G-quadruplex helix
where salt ions were required.46
87
Since there is no one consistent and absolute structure proposed for acidic
Na2(5'-GMP) gel, we decided to further investigate this system using the knowledge
gained from our studies of neutral 5'-GMP as described in Chapter 2. It is important to
note that, 5'-GMP (pKa2 = 7.5) is doubly charged under neutral to slightly alkaline
condition such as pH 8 while it is singly charged under acidic conditions (i.e., pH 5). The
difference in the phosphate charge and the potential state for ion coordination are
drastically different between neutral and acidic Na2(5'-GMP) systems as evidenced by
their physical states (see Figure 1-12, Chapter 1). In this chapter, we use solid-state 13C
NMR and FT-IR results to deduce the true helical structure of acidic Na2(5'-GMP) gel.
3.2 Experimental
3.2.1 Sample preparation
The Na2(5'-GMP) gel sample was prepared by acidifying 0.5 M Na2(5'-GMP)
aqueous solution to pH 5 using concentrated HCl(aq) or acetic acid. The pH is measured at
room temperature using a calibrated Fisher Scientific Accumet Basic pH probe.
3.2.2 Solid-state 1D NMR
Solid-state 13C NMR experiments were performed by Dr. Gang Wu on a Bruker
Avance-600 spectrometer operating at 159.91 MHz for 13C with the following
parameters: sample spinning frequency, 11 kHz; cross polarization mixing time, 2 ms; 1H
decoupling, 80 kHz, recycle time, 10 s; 4866 transients. All 13C chemical shifts were
referenced to that of TMS. Solid-state 23Na NMR experiments were performed on a
Bruker Avance-500 spectrometer operating at 132.72 MHz for 23Na nuclei with the
88
following parameters: sample spinning, 10 kHz, 1H decoupling, 65 kHz; recycle time, 10
s; 64 transients. All 23Na chemical shifts were referenced to that of 1.0 M NaCl(aq).
3.2.3 Solid-state 2D NMR
23Na{31P} rotational-echo double-resonance spectroscopy (REDOR)
experiments were performed by Dr. Zhimin Yan and Dr. Yining Huang of the University
of Western Ontario (London, ON). Using the original version of the pulse sequence,96
this 2D solid-state experiment was performed on a Varian/Chemagnetics Infinity-plus
400 WB spectrometer operating at a magnetic field strength of 9.4 T. The 31P and 23Na
resonance frequencies at this field strength are 161.72 and 105.67 MHz, respectively. All
MAS spectra were acquired using a Varian/Chemagnetics T3 4-mm triple-tuned MAS
probe. Typical RF power levels corresponded to 180° pulse lengths of 7.0 and 7.8 µs for
23Na and 31P nuclei, respectively. A total of 512 transients were accumulated for each
REDOR measurement. The sample spinning rate was kept constant at 10,000 ± 2 Hz. The
recycle delay was 0.2 s. The curve fitting was performed using the Simulation Package
for Solid-state NMR Spectroscopy (SIMPSON, version 1.1.0) program.97
2D back-to-back double-quantum magic-angle-spinning experiments (BABA
DQ-MAS) were performed by Dr. Eric Ye (National Ultrahigh Field NMR Facility for
Solids, Ottawa, ON) on the Na2(5'-GMP)/acetic acid gel at 21.1 T. The MAS experiment
was performed using a 1.3 mm rotor spinning at an ultra-fast spinning rate (62.5 kHz)
and the pulse program ggba.st2d. The 1H NMR data were collected using a pulse of 1.5
µs (13.0 dB) and a relaxation delay of 8 s with 48 scans collected. The spectral width is
89
63,000 Hz on F1 dimension (DQ), and 50,000 Hz on F2 dimension (SQ). The final data
matrix is 1024 (F2) vs. 160 (F1).
31P{1H} heteronuclear correlation spectroscopy (HETCOR) experiments were
also performed by Dr. Eric Ye at the 900 MHz solid-state facility in Ottawa. The sample
Na2(5'-GMP)/acetic acid gel was spinning at a rate of 33 kHz in a 2.5 mm rotor. The
pulse program used is ggcphet.ye.2d, and the operating frequencies of 31P and 1H are
900.1 MHz and 364.4 MHz, respectively. The 180º pulses for 31P are 2 µs (8.5 dB) and
2.5 µs (12 dB) for 1H. A total of 128 scans were collected with a relaxation delay of 5 s.
The spectrum dimension is 2048 (F2, 31P) x 90 (F1, 1H).
3.2.4 FT-IR
All FT-IR spectra were obtained from a Scimitar 1000 FT-IR (Varian) as KBr
pellets with a resolution of 4 cm-1 from wavenumber 500 to 3000 cm-1. A total of 10
scans were accumulated for each spectrum with a sensitivity of 1 cm-1.
3.3 Results and Discussion
3.3.1 Determination of helix-orientation using 13
C NMR and FT-IR
Since fiber x-ray crystallographic data did not yield the information about the
helical orientation of acidic Na2(5'-GMP) gel, we decided to use solid-state 13C NMR.
From solid-state 13C NMR spectra, it is relatively easy to obtain 13C chemical shifts for
the sugar carbons. As shown in Figure 3-2, the solid-state 13C NMR spectrum is very
simple, suggesting that the gel system is well ordered. The observed 13C chemical shifts

90
for sugar carbons C1', C2', C3', C4', and C5' are 87.9, 76.3, 69.3, 82.2, and 62.8 ppm,
respectively. These chemical shifts are similar to those obtained for the neutral Na2(5'-
GMP) sample. Harbison and coworkers recently established a general procedure in
linking 13C chemical shifts to sugar pucker conformation.98 In particular, they studied
solid-state 13C NMR spectra of 25 nucleotides and nucleosides with known crystal
structures from x-ray crystallography. The authors paired up the chemical shifts of the
sugar carbons and noticed the distribution of two distinct groups when the 13C chemical
shifts were plotted against each other. They observed that these two groups correspond to
either N or S puckering conformation. Furthermore, a plot of C1' versus C5' chemical
shifts separates the N group into two clusters corresponding to the gg and gt
configurations. To verify that the distribution of these distinct clusters was not due to
chance, the researchers performed some canonical discrimination calculations, using
linear combinations of variables that maximize the statistical discrimination between two
populations (e.g., N or S, gg or gt). In this case, the authors found out that it is possible to
use canonical calculations to verify chemical shift-structure relationship in terms of
puckering and exocyclic angle γ, but not the glycosidic angle χ. This method was further
verified by Ohlenschlager and colleagues who performed the same canonical
discrimination calculations on approximately 400 RNA residues with complete sugar and
backbone carbon data.99 Two values were calculated using empirically derived constants
and chemical shifts of the sugar carbon atoms (Equations 3-1, 3-2), and they were plotted
against each other. The location of the residue’s coordinate in this plot along with a preset
limit for these values from experimental data allowed the prediction of sugar puckering
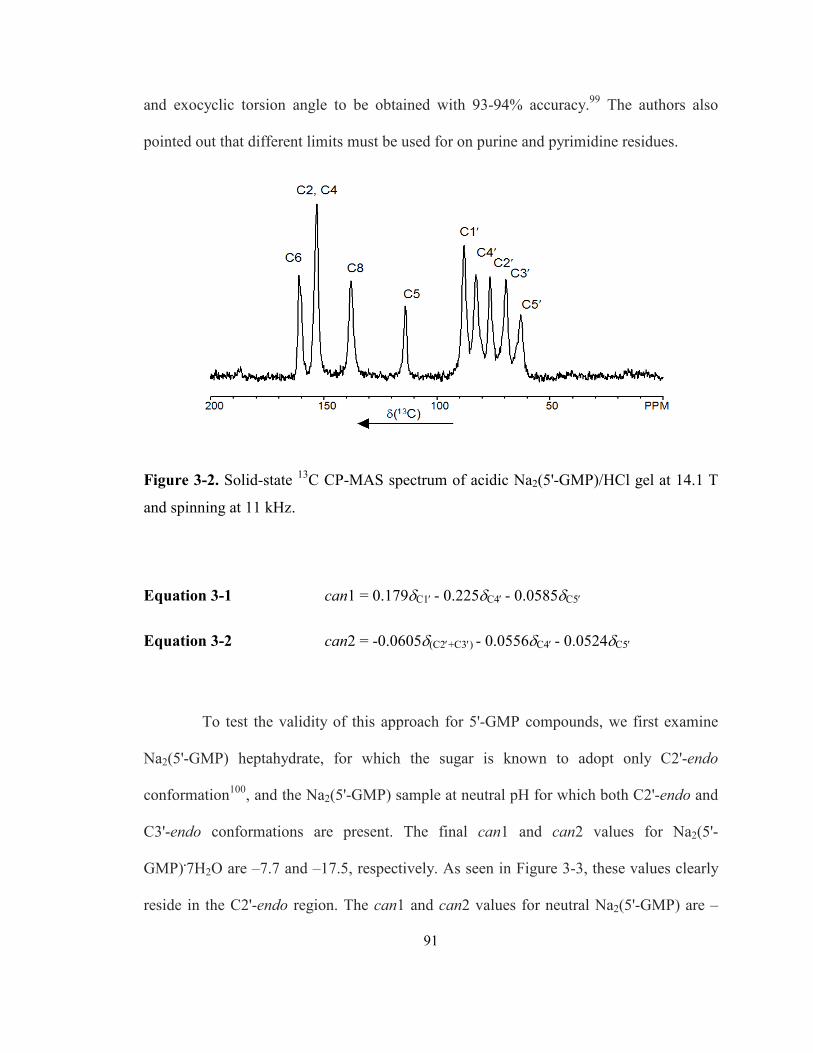
91
and exocyclic torsion angle to be obtained with 93-94% accuracy.99 The authors also
pointed out that different limits must be used for on purine and pyrimidine residues.
Figure 3-2. Solid-state 13C CP-MAS spectrum of acidic Na2(5'-GMP)/HCl gel at 14.1 T
and spinning at 11 kHz.
Equation 3-1 can1 = 0.179δC1′ - 0.225δC4′ - 0.0585δC5′
Equation 3-2 can2 = -0.0605δ(C2′+C3′) - 0.0556δC4′ - 0.0524δC5′
To test the validity of this approach for 5'-GMP compounds, we first examine
Na2(5'-GMP) heptahydrate, for which the sugar is known to adopt only C2'-endo
conformation100, and the Na2(5'-GMP) sample at neutral pH for which both C2'-endo and
C3'-endo conformations are present. The final can1 and can2 values for Na2(5'-
GMP).7H2O are –7.7 and –17.5, respectively. As seen in Figure 3-3, these values clearly
reside in the C2'-endo region. The can1 and can2 values for neutral Na2(5'-GMP) are –

92
8.0 and –17.1 (C2'-endo) and –6.0 and –16.5 (C3'-endo), respectively. They also
correspond to the correct puckering regions in the same plot. In general, we conclude that
13C chemical shifts allow a reliable determination of the sugar puckering in RNA
systems. Using the same equations, the can1 and can2 values for acidic Na2(5'-GMP) gel
are –6.6 and –16.8, respectively, and this reveals that Na2(5'-GMP) at low pH indeed has
a C3'-endo puckering instead of C2'-endo which was suggested by Sasisekharan et al.46
Moreover, the fact that can1 > −6.77 and can2 > −16.82 for acidic Na2(5'-GMP) gel
strongly suggests that the sugar pucker conformation is C3'-endo with the exocyclic γ-
torsion angle being in gg conformation.99
Another piece of evidence comes from the FT-IR spectrum. Tajmir-Riahi101
established that the IR signature bands for C3'-endo and C2'-endo sugars appear at ranges
800-806 and 817-824 cm-1, respectively. As shown in Figure 3-4, the FT-IR spectrum of
acidic Na2(5'-GMP) gel contains a signature band at 800 cm-1. Therefore, contrary to the
long-believed model, this finding leads to the conclusion that the continuous helix of
acidic Na2(5'-GMP) gel is composed entirely of C3'-endo monomers and is indeed right-
handed instead of left-handed. Combining this new structural feature with the helical
parameters of Sasisekharan et al.,46 we were able to build a right-handed 15/4 helix model
as illustrated in Figure 3-5. (Atomic coordinates are listed in Appendix II).
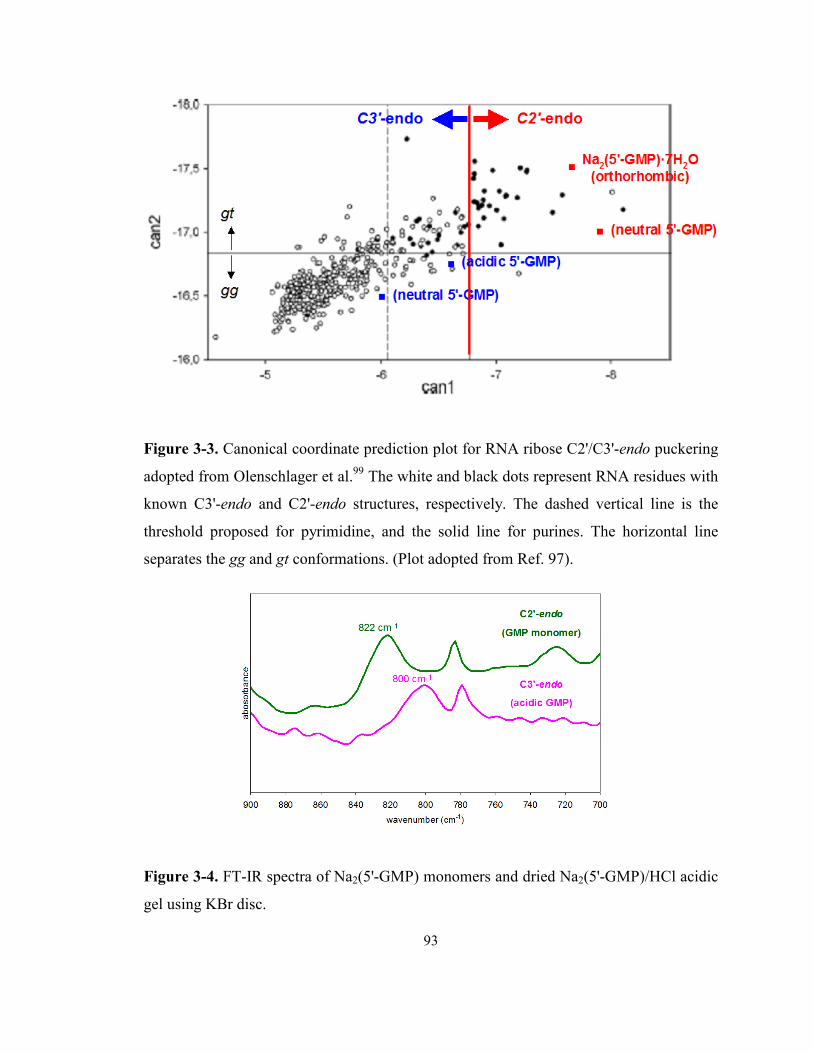
93
Figure 3-3. Canonical coordinate prediction plot for RNA ribose C2'/C3'-endo puckering
adopted from Olenschlager et al.99 The white and black dots represent RNA residues with
known C3'-endo and C2'-endo structures, respectively. The dashed vertical line is the
threshold proposed for pyrimidine, and the solid line for purines. The horizontal line
separates the gg and gt conformations. (Plot adopted from Ref. 97).
Figure 3-4. FT-IR spectra of Na2(5'-GMP) monomers and dried Na2(5'-GMP)/HCl acidic
gel using KBr disc.

94
Figure 3-5. Continuous right-handed helix model of acidic Na2(5'-GMP) G-quadruplex
constructed using x-ray fiber diffraction data.46 Red = O, blue = N, gray = C. Ribose
rings and hydrogen atoms are omitted for clarity.
3.3.2 A unique G-quadruplex feature: absence of channel ions
Once the helix orientation is determined, the next step is to examine the weak
forces that drive 5'-GMP self-aggregation. Being the most crucial component in G-
quadruplex formation, ion-carbonyl interaction at the channel site and ion-phosphate
binding at the surface site might behave differently in acidic Na2(5'-GMP) gels compared
to those observed in neutral Na2(5'-GMP) solution. To further investigate how Na+ ions
are bound in the acidic 5'-GMP structure, we recorded solid-state 23Na NMR spectra for
the acidic Na2(5'-GMP) gel. As seen from Figure 3-6, only two 23Na NMR signals are
observed for acidic Na2(5'-GMP) gel. The sharp signal at 7.2 ppm is due to excessive
NaCl in the sample. The other signal is centered at −5.0 ppm, typical of phosphate-bound
Na+ ions.61 Indeed, this signal is very similar to that of the phosphate-bound Na+ ions
observed for a solid 5'-GMP sample prepared from neutral solution as described in
Chapter 2.
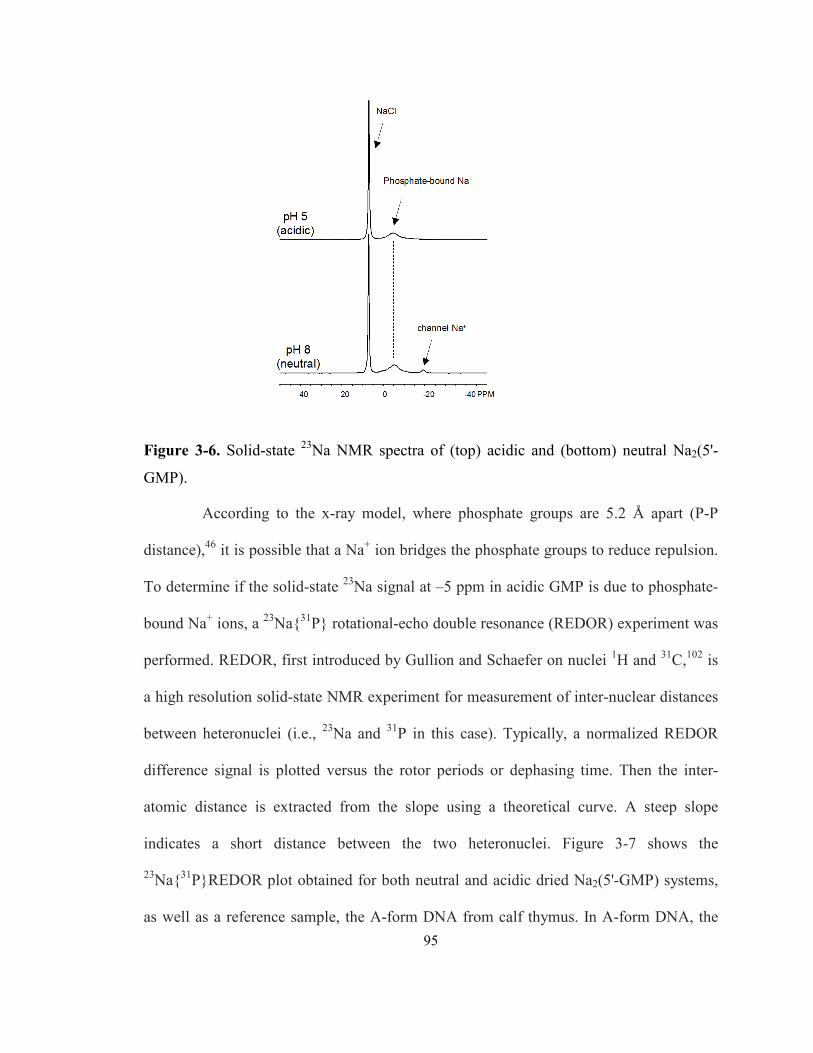
95
Figure 3-6. Solid-state 23Na NMR spectra of (top) acidic and (bottom) neutral Na2(5'-
GMP).
According to the x-ray model, where phosphate groups are 5.2 Å apart (P-P
distance),46 it is possible that a Na+ ion bridges the phosphate groups to reduce repulsion.
To determine if the solid-state 23Na signal at –5 ppm in acidic GMP is due to phosphate-
bound Na+ ions, a 23Na{31P} rotational-echo double resonance (REDOR) experiment was
performed. REDOR, first introduced by Gullion and Schaefer on nuclei 1H and 31C,102 is
a high resolution solid-state NMR experiment for measurement of inter-nuclear distances
between heteronuclei (i.e., 23Na and 31P in this case). Typically, a normalized REDOR
difference signal is plotted versus the rotor periods or dephasing time. Then the inter-
atomic distance is extracted from the slope using a theoretical curve. A steep slope
indicates a short distance between the two heteronuclei. Figure 3-7 shows the
23Na{31P}REDOR plot obtained for both neutral and acidic dried Na2(5'-GMP) systems,
as well as a reference sample, the A-form DNA from calf thymus. In A-form DNA, the

96
only possible binding site for Na+ is on the singly charged phosphate group. As shown in
Figure 3-7, the slopes at the small dephasing times are similar among the three systems.
Assuming that the 23Na and 31P nuclei can be treated as an isolated two-spin system, the
calculated inter-nuclear distance obtained from REDOR for dried acidic Na2(5'-GMP) gel
is 3.5 Å. This short 23Na-31P distance indicates that they are in the first-coordination shell
of each other, hence confirming the direct binding of 23Na ions at –5 ppm to the
phosphate sites in acidic Na2(5'-GMP). The binding of 23Na to 31P is only observable in
the solid phase in this case because Na+ ions undergo rapid exchange in solution, hence it
is not possible to detect the direct binding of 23Na to 31P in liquid phase.
Figure 3-7. 23Na{31P} REDOR results of the reference (A-form DNA) and the two types
of Na2(5'-GMP) aggregates at various pH conditions.

97
The 23Na NMR spectrum of acidic Na2(5'-GMP) gel shown in Figure 3-6 also
reveals that the established spectral signature for Na+ ions residing inside a G-quadruplex
channel at −18 ppm is missing.61,103 This observation immediately suggests that there are
no Na+ ions inside the central channel of the continuous helix formed by 5'-GMP under
slightly acidic conditions. This aspect of the helix is totally unexpected, because there are
very few G-quadruplex systems without a channel cation. However we can try to
understand it using a structural model. As shown in Figure 3-8, when a disc-like G4 is
twisted into a washer-like G4, the size of the central cavity surrounded by carbonyl
oxygen atoms is significantly reduced. As a result, a Na+ ion can no longer fit into this
cavity.
Figure 3-8. Na2(5'-GMP) G-quadruplexes formed under different pH conditions. A
planar, tetrameric stacking under neutral pH (bottom), and a continuous, lock-washer-like
helix under acidic pH (top). Helix senses are both right-handed (RH).
98
3.3.3 Phosphate-amino hydrogen-bonds
At this point, it is worth comparing the acidic 5'-GMP helix with that
determined for 5'-GMP under neutral or slightly basic conditions (Chapter 2).90 Since the
phosphate group of 5'-GMP has a pKa2 of 7.5, it is doubly charged at pH 8 but only singly
charged at pH 5. As we mentioned in Chapter 2, phosphate groups in the 5'-GMP helix
formed at pH 8 are possibly bridged by Na+ ions. For the 5'-GMP helix formed at pH 5,
singly charged phosphate groups form a continuous hydrogen-bonded chain along the
helical “strand” (i.e., ···HO−P−O−···HO−P−O−···). Because the repulsion between singly
charged phosphate groups is much weaker than that between doubly charged phosphates,
the P···P distance is significantly shorter in the acidic 5'-GMP helix (5.2 Å) than in the
neutral 5'-GMP helix (6.7 and 7.2 Å).
Another unique feature in the acidic 5'-GMP helix is the formation of a
phosphate-base hydrogen bond. In particular, as Sasisekharan et al.46 also noted, the ith
phosphate group can be hydrogen-boned to the exocyclic amino group of the (i+3)th
guanine base (i.e., N−H···O=P, Figure 3-9). In our model, the N···O distance is ca. 2.82
Å. We postulate that the weaker repulsing forces between singly charged phosphate
groups and the formation of this hydrogen bond are largely responsible for the helical
formation of 5′-GMP at pH 5. To verify if these hydrogen-bonds are consistent with a
right-handed helix model, we performed 2D solid-state back-to-back double-quantum
magic-angle-spinning (BABA DQ-MAS) 1H NMR and 31P{1H} HETCOR NMR
experiments.

99
Figure 3-9. Scheme of the phosphate-base hydrogen bond between phosphate (i) and
N2HB (i+3) three monomers away in the right-handed, continuous helix model of acidic
Na2(5'-GMP).
The 2D BABA DQ-MAS experiment is often used in determining hydrogen
bonding networks, such as self-assembling C^G rosette nanotubes.104 The experiment
utilizes the creation of the 1H-1H double quantum coherence via the homonuclear dipole-
dipole couplings. As a result, DQ signals can be used directly to infer spatial distances
between two protons. Like spins (AA) give rise to the so-called “diagonal” spins located
at [νA, (νA + νA)], while unlike spins (AX) have “cross peaks” at both [νA, (νA + νX)] and
[νX, (νA + νX)] locations. The unique feature of BABA DQ spectra is that the resonance
frequency on the DQ dimension is the sum of two single-quantum frequencies of the two
spins involved, as illustrated in Figure 3-10. Hence, a 2D BABA spectrum can be read as
a regular NOESY spectrum except the appearance of “cross peaks” is slightly different.
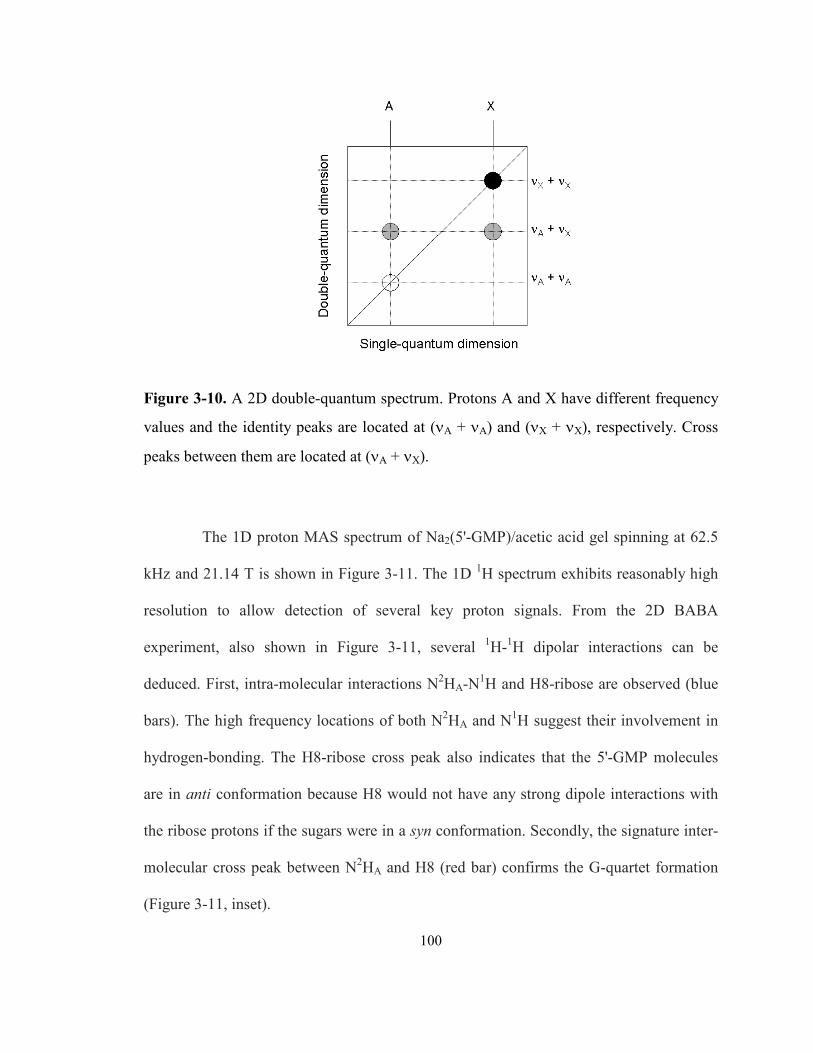
100
Figure 3-10. A 2D double-quantum spectrum. Protons A and X have different frequency
values and the identity peaks are located at (νA + νA) and (νX + νX), respectively. Cross
peaks between them are located at (νA + νX).
The 1D proton MAS spectrum of Na2(5'-GMP)/acetic acid gel spinning at 62.5
kHz and 21.14 T is shown in Figure 3-11. The 1D 1H spectrum exhibits reasonably high
resolution to allow detection of several key proton signals. From the 2D BABA
experiment, also shown in Figure 3-11, several 1H-1H dipolar interactions can be
deduced. First, intra-molecular interactions N2HA-N1H and H8-ribose are observed (blue
bars). The high frequency locations of both N2HA and N1H suggest their involvement in
hydrogen-bonding. The H8-ribose cross peak also indicates that the 5'-GMP molecules
are in anti conformation because H8 would not have any strong dipole interactions with
the ribose protons if the sugars were in a syn conformation. Secondly, the signature inter-
molecular cross peak between N2HA and H8 (red bar) confirms the G-quartet formation
(Figure 3-11, inset).
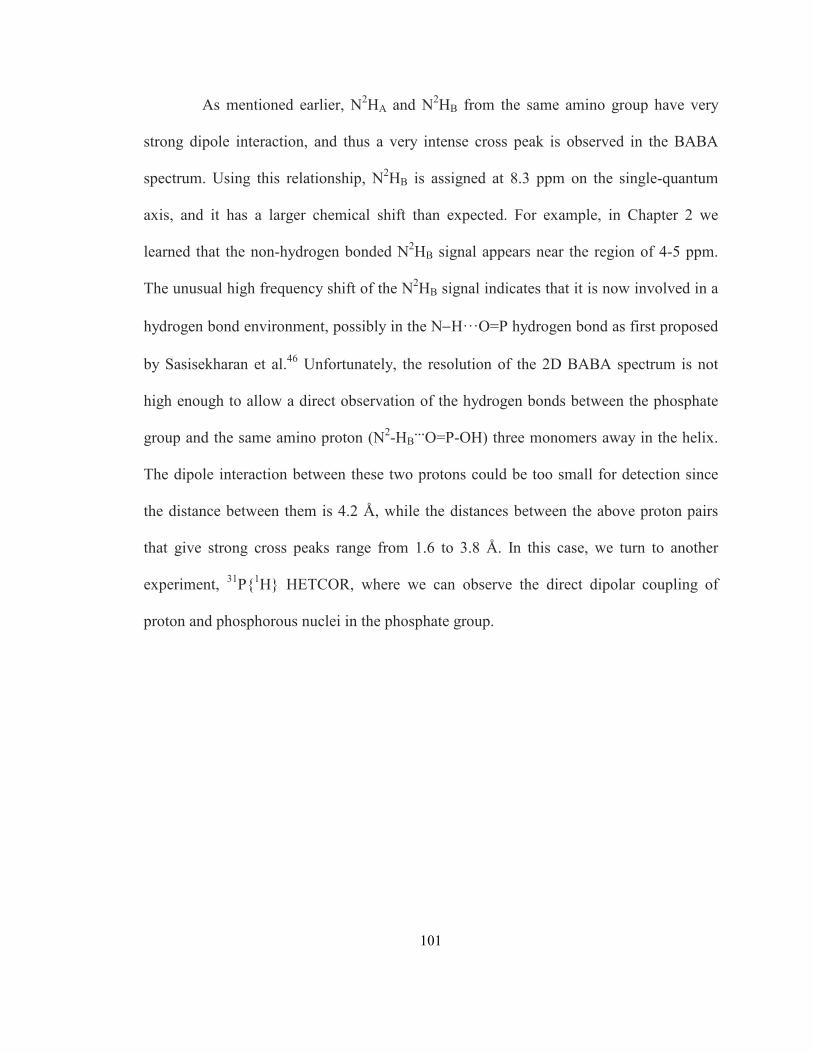
101
As mentioned earlier, N2HA and N2HB from the same amino group have very
strong dipole interaction, and thus a very intense cross peak is observed in the BABA
spectrum. Using this relationship, N2HB is assigned at 8.3 ppm on the single-quantum
axis, and it has a larger chemical shift than expected. For example, in Chapter 2 we
learned that the non-hydrogen bonded N2HB signal appears near the region of 4-5 ppm.
The unusual high frequency shift of the N2HB signal indicates that it is now involved in a
hydrogen bond environment, possibly in the N−H···O=P hydrogen bond as first proposed
by Sasisekharan et al.46 Unfortunately, the resolution of the 2D BABA spectrum is not
high enough to allow a direct observation of the hydrogen bonds between the phosphate
group and the same amino proton (N2-HB…O=P-OH) three monomers away in the helix.
The dipole interaction between these two protons could be too small for detection since
the distance between them is 4.2 Å, while the distances between the above proton pairs
that give strong cross peaks range from 1.6 to 3.8 Å. In this case, we turn to another
experiment, 31P{1H} HETCOR, where we can observe the direct dipolar coupling of
proton and phosphorous nuclei in the phosphate group.
102
Figure 3-11. 2D BABA DQ-MAS spectrum of dried acidic Na2(5'-GMP)/acetic acid gel
21.1 T and very fast spinning (62.5 kHz) at room temperature. The blue bars represent
intra-molecular dipole interactions, and the red bar represents inter-molecular dipolar
interactions. The scheme of these dipolar couplings between two 5'-GMP molecules in a
G-quartet is shown in the insert.
31P{1H} HETCOR is a 2D heteronuclear NMR experiment similar to HMQC
where direct interaction via dipolar-coupling are detected. However, unlike HMQC,
direct detection is used in HETCOR since 31P has a natural abundance of 100%. As
shown in Figure 3-12, the relatively sharp signal at 2 ppm on the F2 dimension (31P)

103
represents the single 31P environment from the phosphate group. In the F1 dimension
(1H), we observe cross peaks forming at 4.7, 8.3, and 10.5 ppm, and their assignments are
shown in Table 3-1.
Similar to other experiments that detect dipolar coupling, the time allowed for
the two nuclei to “communicate” is crucial for observation of such relationship. In this
case, a contact time of 2 ms used in the HETCOR experiment allowed us to observe
several intra and inter-molecular 31P-1H bonds. First of all, the strong cross peak at 4.7
ppm (F2 dimension) represent the intra-molecular P/H5' and P/H5'' bonds. The next
intramolecular interaction would be at 10.5 ppm on the F1 dimension where 31P of the
phosphate is binding to its own proton. Most importantly, the cross peak at 8.3 ppm
(N2HB) confirmed the N−H(i+3)···O=P(i) bonding suggested by Sasisekharan46 but was not
observed directly before (Figure 3-9).

104
Figure 3-12. 2D 31P{1H} HETCOR spectrum of dried Na2(5'-GMP)/acetic acid gel in a
2.5 mm MAS probe, and spinning at 33 kHz and a contact time of 2 ms.
Table 3-1. 31P{1H} HETCOR spectrum analysis. The 31P-1H distances are obtained from
the right-handed model built using x-ray data from Sasisekharan et al.46
Cross peak on 1H
dimension (ppm) Proton assignment 31P-1H distance (Å) Intra/Inter-molecule
10.5 P-OH 2.00 intra
4.7 H5' * 2.75 intra
4.7 H5" * 2.71 intra
8.3 N2HB(i+3) 3.16 inter
* stereospecific assignment of proS, proR protons is not performed.

105
3.4 Conclusion
We have used modern 1D/2D solid-state NMR experiments, as well as FT-IR, and
canonical calculations to prove that the acidic Na2(5'-GMP) gel forms a right-handed
helical structure composed of only C3'-endo monomers. This is in contrast to the long-
believed C2'-endo/left-handed model in the literature. We also observed the absence of
Na+ ions inside the channel site due to a smaller cavity in the lock-washer-like helix as
opposed to the planar, stacking tetramer model. The major forces that contribute to the
acidic Na2(5'-GMP) self-assembly include base-base hydrogen-bonds, Na+-phosphate
binding, and hydrogen-bonds between amino and phosphate groups among layers of
tilted G-quartets. The gel formation of Na2(5'-GMP) under the acidic condition can be
attributed to these forces accentuated four times around the helix, as well as smaller
repulsion forces between phosphate groups. This part of the Na2(5'-GMP) study provides
information on nucleic acid self-assembly under acidic pH and low salt conditions, which
could be useful in designing other supramolecular structures under similar conditions.

106
Chapter 4
Self-assembled G-quadruplex structures of disodium guanosine 5'-
thiomonophosphate: the role of cation bridging
4.1 Introduction
Guanosine 5'-thiomonophosphate, or 5'-GSMP, differs from 5'-GMP by
substituting the oxygen atom at the 5' position with a sulfur atom (Figure 4-1). This
molecule has a longer O-P-S5'-C5' bond compared to the O-P-O5'-C5' bond in 5'-GMP
(Figure 4-1), and this causes the phosphate group to extend away from the nucleoside.
Because there are no other structural differences at the guanine base and ribose ring, 5'-
GSMP is expected to form G-quadruplexes in the presence of Na+ ions, in a similar
fashion as 5'-GMP.105 If this is true, the elongated -O-P-S5'-C5' bond will allow
additional flexibility that will enable them to optimize their relative locations as the
doubly charged phosphate groups exhibit strong repulsion to each other. (Figure 4-2).
This repulsion force can often be offset by a positively charged cation, such as Na+. This
kind of cation-bridging system between two phosphate groups and a cation is identical to
that discussed in the 5'-GMP G-quadruplex system (Chapter 2). It was documented in
Chapter 3 that cations binding to the phosphate groups are discovered using both solution
and solid-state 23Na-NMR in G-quadruplexes systems.53,55,61,63,103,105,106,107 There is also
evidence that different ions can compete for the phosphate-binding site (Figure 4-2).
However, there are no direct studies on the phosphate groups regarding cation-bridging
from 5'-GMP’s point of view. Fortunately, the molecule 5'-GSMP provides the
opportunity to study this site directly. In this chapter, we investigate the self-assembly of

107
5'-GSMP using both solution- and solid-state NMR experiments, quantum calculations,
and other methods.
Figure 4-1. Structures of (left) 5'-GMP and 5'-GSMP molecules, and (right) the different
bond lengths shown in detail.
Figure 4-2. Illustration of short distances between phosphate groups in 5'-GMP G-
quadruplex.

108
4.2 Experimental
4.2.1 Synthesis and solution sample preparation
Disodium 5'-deoxy-5'-thioguanosine 5'-monophosphate, Na2(5'-GSMP),
C10N5O7SPNa2H12 (molecular weight 423.247 g/mol) was a gift from Dr. David Hodgson
(Durham University, United Kingdom) and was synthesized using a modified method
from the literature procedure.108 To prepare a 0.17 M Na2(5'-GSMP) solution for NMR
experiments, 70.6 mg was dissolved in 1.0 mL D2O. Because a small amount of NaOH
was used in the synthesis of 5'-GSMP, the pH of the solution was initially ~10.5. The
solution was brought to neutral pH 8.0 using a minute amount of concentrated HCl(aq). A
clear viscous solution was observed, which turns to a gel upon standing at room
temperature for several hours. Solution-state 1H NMR experiments were performed at
various temperatures on these wet gel samples. The pKa value of the thiophosphoryl
group was determined using solution-state 31P NMR. A series of diluted solutions were
also prepared including 10 mM, 25 mM, 50 mM, and 100 mM for aggregation process
studies.
4.2.2 Solution-state NMR
All solution-state NMR spectra were recorded on a Bruker Avance 600 MHz
spectrometer (14.1 T), including both 1D and 2D experiments. All chemical shifts were
reported in parts per million (ppm). For 1H experiments, the 1H 90° and 180° pulse
widths at a pulse power of 0.0 dB were 13.0 and 26.0 µs, respectively. The 31P 180°
pulse was 50 µs at 0.0 dB, and 85% H3PO4(aq) was used as an external 31P chemical shift

109
reference. All pulse sequences were available in the program Bruker Xwin NMR Version
3.5. Experimental temperatures were carefully controlled with a Bruker BT-3000 unit.
Diffusion NMR experiments were carried out for 50 mM Na2(5'-GSMP) in D2O at 298 K.
The pulse sequence of longitudinal eddy current delay with bipolar-gradient pulse
(LEDBPGP2s) was employed. The pulse field gradient duration (δ) was 1.5 ms, and the
variable gradient strength (G) was 5.655 mT/m. The diffusion period (∆) was 75 ms, and
a total of 8192 experiments with 8 scans were collected for each of the 16 increment steps
with a recycle delay of 5.0 s. The eddy current delay (tw) employed was 5 ms, and the
gradient recovery delay was set at 9.2 ms. Calibration of the field gradient strength was
performed by measuring the value of translational diffusion coefficient (Dt) for the
residual 1H signal in D2O (99.99% 2H atom), where Dt = 1.90 x 10⁻⁹ m2/s.68 The total
spectral width was 6009.6 Hz and a line-broadening of 2 Hz was employed in data
processing.
4.2.3 Solid-state NMR
The same 0.17 M gel was dried under N2(g) environment for solid-state 13C ,
23Na, 31P NMR experiments, as well as FT-IR and powder x-ray analyses. Solid-state
NMR experiments were performed by Dr. Gang Wu on Bruker Avance-500 and Avance-
600 NMR spectrometers. Chemical shifts for 13C, 23Na, 31P were referenced to the signals
of TMS, 1.0 M Na+(aq), and 85% H3PO4(aq), respectively. The detail sample spinning rates
in Magic Angle Spinning (MAS) experiments are listed in figure captions.

110
4.2.4 FT-IR and powder x-ray diffraction
All FT-IR spectra were obtained from a Scimitar 1000 FT-IR (Varian) as KBr
pellets with a resolution of 4 cm-1 from wavenumber 500 to 3000 cm-1. A total of 10
scans were accumulated for each spectrum with a sensitivity (digital resolution) of 1 cm-1.
All XRD spectra were obtained on a Philips X'Pert Pro Multi Purpose Diffractometer
(2002) using Ni-filtered Cu Kα 1,2 radiation (λ1 = 1.5406 Å, λ2 = 1.5444 Å), a fixed
divergence slit width of 0.5°, 0.02 Radian soller slit, 15 mm mask, 2 s revolution and 40 s
count time. Samples were prepared on flat borosilicate glass discs and the diffraction data
were collected from 10° to 70° using an X'pert X'celerator high speed detector for a total
scan time per sample of approximately 20 min. Data were processed on a Pentium PC
using PanAlytical X'pert HighScore for Windows XP.
4.2.5 Quantum chemical calculations
Quantum chemical calculations were performed using Gaussian 03 suite of
programs87 on a SunFire 6800 symmetric multiprocessor system. Each of the four nodes
is equipped with 24 × 1.05 GHz (8 MB E-Cache) UltraSPARC-III processor and 96 GB
of RAM. Shielding calculations were performed using the GIAO method as implemented
in Gaussian 03. Basis sets of cc-pVTZ and 6-31G(d) were used for Na and other atoms,
respectively. The computed absolute shielding constant (σ) was converted to the
chemical shift scale (δ) using δ = σref − σ, where σref is the absolute shielding constant for
the reference sample. In this study, σref(13C) = 185.4 ppm, σref(
23Na) = 574.6 ppm and
σref(31P) = 317.0 ppm were used.
111
4.2.6 Scanning Electron Microscopy (SEM)
A GSMP sample with a concentration of 10 mM(aq) was freshly prepared and
transported to an aluminum stud using a Pasteur pipette and the droplet of solution was
left to dry in a closed environment for one day prior to experimentation. The aluminum
stud was then placed in a vacuum environment (purged twice with Ar) at 25 mTorr, and
was plated with gold at 10 mAmp for 6 min using a Technics Hummer V voltage
generator. The sample was then analyzed immediately with a Hitachi S-2300 SEM unit at
20 kV and images were captured using the computer program URSA200.
4.3 Results and Discussion
4.3.1 Solution-state experiments
First a very diluted Na2(5'-GSMP) sample was prepared and studied using
solution-state 1H NMR. Figure 4-3 shows a 25 mM Na2(5'-GSMP) solution at pH 10.5
where only monomeric 5'-GSMP molecules are present (the pKa1 of guanine at N1H is
~9.0,109 and N1H is required in Hoogsteen hydrogen-bonding of a G-quartet, hence G-
quartets do not form at pH > 9.0). The proton NMR signal assignments for 5'-GSMP
monomers are shown in Figure 4-3, and the small amount of impurities (below 3 ppm)
are thiol groups from decomposition. Next, the pH of the 5'-GMSP sample was brought
down from 10.5 to a slightly basic 8.0 using a minute amount of hydrochloric acid, and
the titration process was monitored using 31P NMR. Since phosphorus-31 has a natural
abundance of 100% and receptivity is ~38 times more sensitive compared to 13C-NMR,
31P-NMR is a good candidate in directly measuring the phosphate group compared to C5'.
As shown in Figure 4-4, the 31P chemical shifts are plotted against the acidity of the 25

112
mM 5'-GSMP solution from pH 10.5 to 2.0. These 31P chemical shift data points were
then fitted using a sigmoid curve with the following equation:
Equation 4-1 X = [Xb + Xa(10n(pKa-pH))]/[1 + 10n(pKa-pH)]
where X = observed chemical shift, Xb = chemical shift of base, Xa = chemical shift of
acid, n = 1, pKa = fitting parameter, and pH = range of pH observed. The midpoint
between the protonation states, i.e., pH 5.1 ± 0.2, is determined to be the pKa2 of 5'-
GSMP. Therefore, 5'-GSMP carries a doubly negative charge between pH 5.1 and 9.0,
and any pH within this range would give 5'-GSMP the same protonation state on the
phosphate group as 5'-GMP at pH 8 when the latter forms G-quadruplex.
Figure 4-5 shows a comparison of the proton NMR spectra of Na2(5'-GMP) and
Na2(5'-GSMP), both at 0.1 M concentration and pH 8.0. It is clear that 5'-GSMP
monomers have smaller intensities compared with 5'-GMP monomer signals due to
aggregate formation. Therefore, we know that 5'-GSMP molecules are forming large
aggregates that give broad signals beyond detection due to slow tumbling even at such a
low concentration.
Figure 4-3. Proton NMR of 25 mM Na2(5'-GSMP) in D2O at pH 10.5 and 298 K. The
impurities are marked with asterisks.
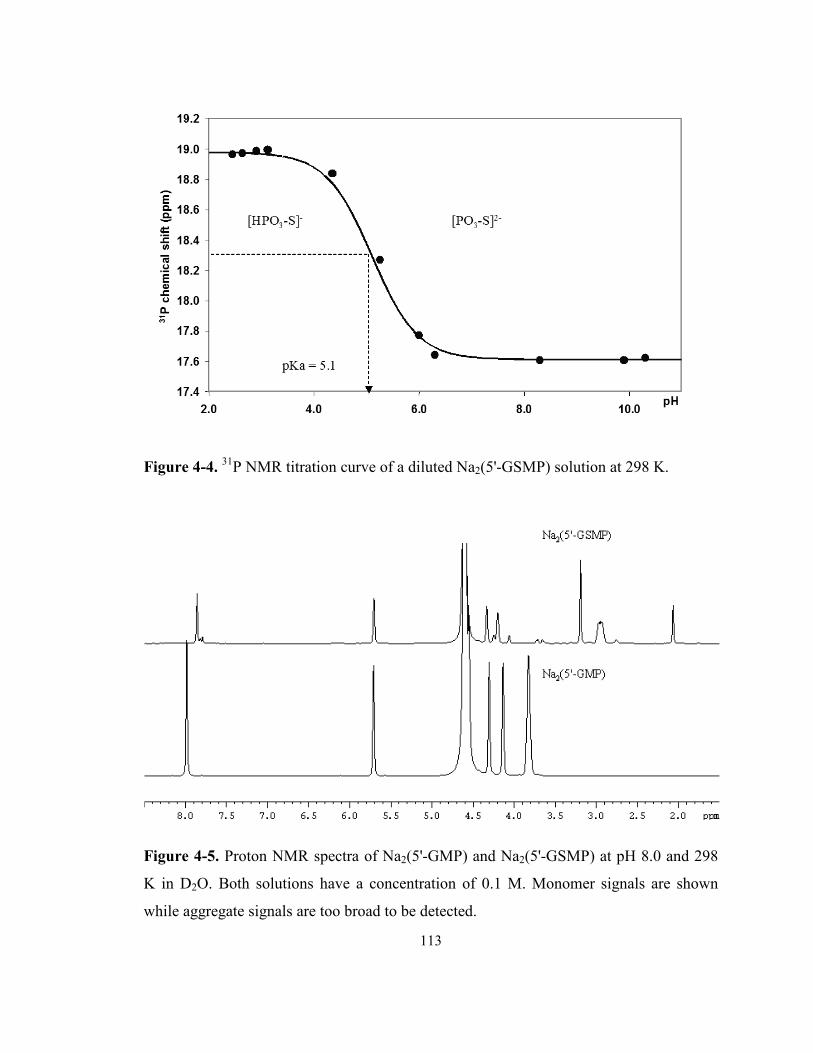
113
Figure 4-4. 31P NMR titration curve of a diluted Na2(5'-GSMP) solution at 298 K.
Figure 4-5. Proton NMR spectra of Na2(5'-GMP) and Na2(5'-GSMP) at pH 8.0 and 298
K in D2O. Both solutions have a concentration of 0.1 M. Monomer signals are shown
while aggregate signals are too broad to be detected.

114
With this information in hand, we decided to study neutral 5'-GSMP at a lower
concentration (below 0.1 M) using 1H-NMR, hoping that we can catch a glimpse of the
aggregate formation, such as the four H8 signals unique to the 5'-GMP G-quadruplex. In
this case, we have samples of 25, 50 mM at various temperatures, and 100 mM is used as
a reference of aggregate formation. As shown in Figure 4-6, there are no G-quartet H8
signals observed in the 1H NMR spectrum, but only the monomer signals at various
concentrations and temperatures. Signal intensities increase as concentration increases,
and the monomer signal intensities decrease as the temperature decreases. This can be
attributed to the formation of large-size aggregates at lower temperatures. However, it is
interesting to note that at 278 K, proton signals from various concentrations share the
same intensity. This suggests that there is an equilibrium between monomers and
aggregates at this temperature. Interestingly, there is a small signal to the right of H8 (~8
ppm) that could represent a different set of monomer or dimer signals. To understand this
small signal, a 2D DOSY experiment was performed on the 50 mM sample at 298 K, and
the result indicates that this small peak next to H8 has a similar size as the monomer
stacks (Figure 4-7). The two signals have a Dt value of ~3.98 x 10⁻¹⁰ m2/s. At this point,
we can only conclude that solution-state NMR provided clues that aggregation, possibly
G-quadruplexes, occurs in solution.

115
Figure 4-6. Proton NMR spectra of various concentrations of Na2(5'-GSMP) at different
temperatures and pH 8.0. Concentrations of samples are labeled in the spectra.

116
Figure 4-7. Diffusion 1H NMR of 50 mM 5'-GSMP at pH 8, 14.1 T, in D2O and 298 K.
4.3.2 Solid-state experiments
Figure 4-8 shows that upon sitting on the bench for several hours, Na2(5'-
GSMP) at pH 8 forms a clear and transparent gel at a concentration of 0.17 M. We also
noted that concentrations > 0.17 M caused precipitation. The gelation gives strong
evidence that G-quadruplex formation occurs in Na2(5'-GSMP) similar to acidic Na2(5'-
GMP). This conclusion is supported by the powder x-ray diffraction study of dried
Na2(5'-GSMP) gel, which gives the characteristic signal that corresponds to a separation
of 3.25 Å between stacking G-quartets (Figure 4-9). Moreover, the ability of 5'-GSMP to
form a gel at a concentration of 0.17 M is remarkable, because 5'-GMP does not form any
aggregates at such a low concentration at all (Chapter 2). This observation shows that G-
quadruplex is formed with greater tendency in Na2(5'-GSMP) compared to Na2(5'-GMP).
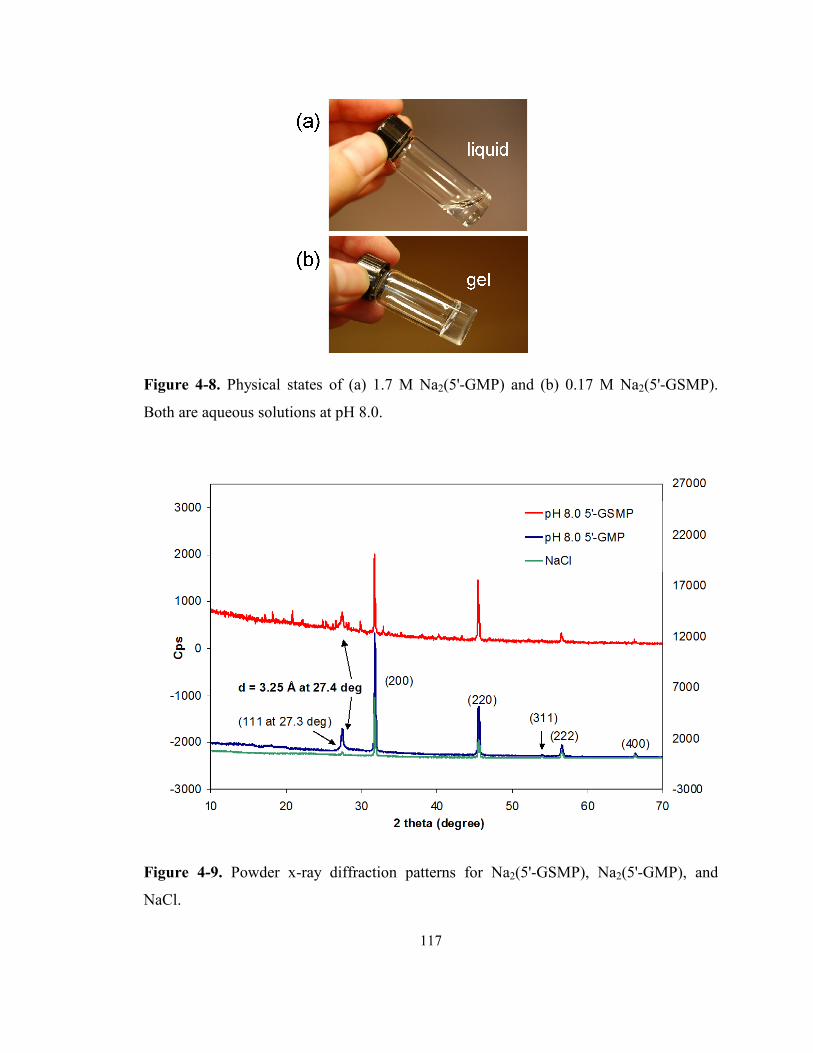
117
Figure 4-8. Physical states of (a) 1.7 M Na2(5'-GMP) and (b) 0.17 M Na2(5'-GSMP).
Both are aqueous solutions at pH 8.0.
Figure 4-9. Powder x-ray diffraction patterns for Na2(5'-GSMP), Na2(5'-GMP), and
NaCl.

118
To learn more about the molecular structure of the Na2(5'-GSMP) gel, we
recorded 13C solid-state NMR spectra of a dried gel sample. Figure 4-10 shows that the
13C CP-MAS NMR spectrum of GSMP is very similar to that of GMP except carbon C5',
as it is now shifted to low frequency due to shielding from the presence of a sulfur atom.
This experiment confirms that the Na2(5'-GSMP) gel contains a G-quadruplex structure
similar to that in dried Na2(5'-GMP). Moreover, FT-IR experiment of the dried Na2(5'-
GSMP) gel shows that both C2'-endo and C3'-endo conformations identical to the signals
observed in Na2(5'-GMP) G-quadruplex are present (Figure 4-11). Since the presence of
both ribose puckering is a unique feature of the Na2(5'-GMP) G-quadruplex system, it
further confirms the formation of G-quadruplex in Na2(5'-GSMP).
Figure 4-10. Solid-state 13C CP-MAS spectra of dried Na2(5'-GMP) and Na2(5'-GSMP).
All spinning sidebands are marked with an asterisk. The spinning rate for Na2(5'-GSMP)
is 10 kHz.
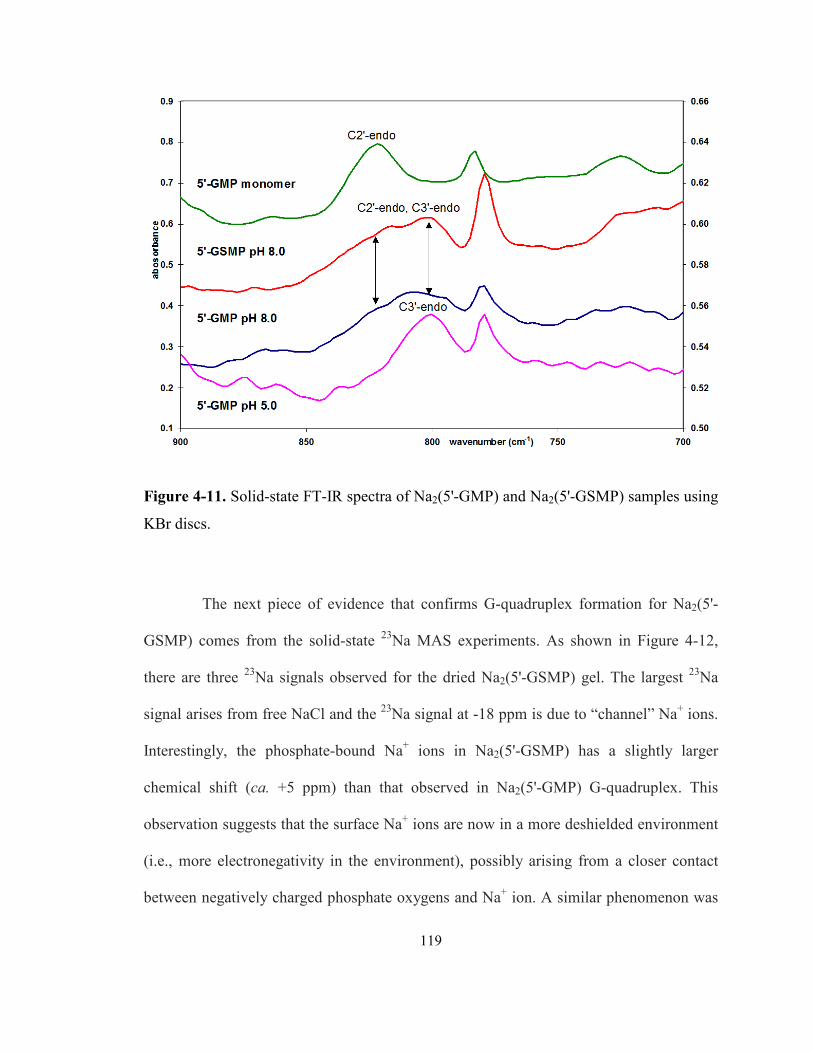
119
Figure 4-11. Solid-state FT-IR spectra of Na2(5'-GMP) and Na2(5'-GSMP) samples using
KBr discs.
The next piece of evidence that confirms G-quadruplex formation for Na2(5'-
GSMP) comes from the solid-state 23Na MAS experiments. As shown in Figure 4-12,
there are three 23Na signals observed for the dried Na2(5'-GSMP) gel. The largest 23Na
signal arises from free NaCl and the 23Na signal at -18 ppm is due to “channel” Na+ ions.
Interestingly, the phosphate-bound Na+ ions in Na2(5'-GSMP) has a slightly larger
chemical shift (ca. +5 ppm) than that observed in Na2(5'-GMP) G-quadruplex. This
observation suggests that the surface Na+ ions are now in a more deshielded environment
(i.e., more electronegativity in the environment), possibly arising from a closer contact
between negatively charged phosphate oxygens and Na+ ion. A similar phenomenon was

120
also observed in the solid-state 31P CP-MAS spectrum of dried Na2(5'-GSMP) gel. As
seen from Figure 4-13, the 31P chemical shift of the phosphate group is now at 19.3 ppm
compared to 17.6 ppm in monomers (Figure 4-4). This deshielding effect may come from
the same source as observed for 23Na chemical shifts. In order to learn if smaller P-O-
…Na+…-O-P distances in 5'-GSMP G-quadruplex contribute to the observed changes in
chemical shifts, we performed quantum chemical calculations.
Figure 4-12. Solid-state 23Na MAS NMR spectra obtained at 14.1 T. The sample’s
spinning rate was 10 kHz. High power 1H decoupling is applied and 64 transients were
collected with a recycle delay of 5 s.
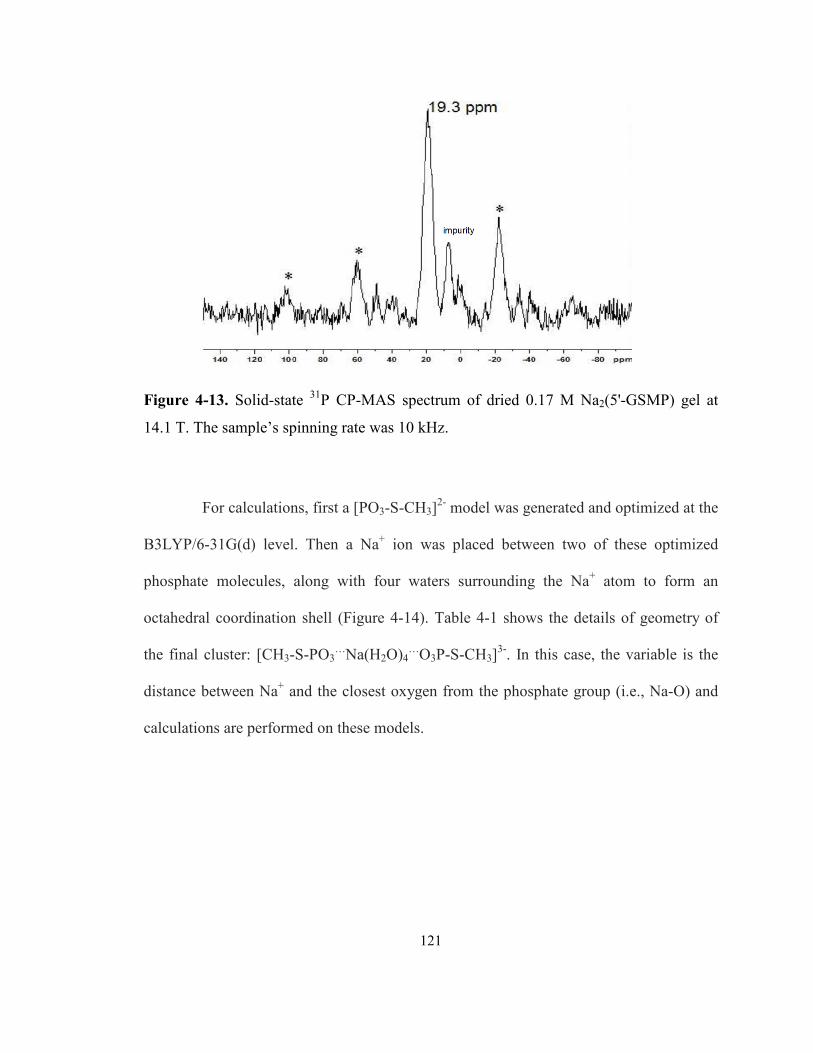
121
Figure 4-13. Solid-state 31P CP-MAS spectrum of dried 0.17 M Na2(5'-GSMP) gel at
14.1 T. The sample’s spinning rate was 10 kHz.
For calculations, first a [PO3-S-CH3]2- model was generated and optimized at the
B3LYP/6-31G(d) level. Then a Na+ ion was placed between two of these optimized
phosphate molecules, along with four waters surrounding the Na+ atom to form an
octahedral coordination shell (Figure 4-14). Table 4-1 shows the details of geometry of
the final cluster: [CH3-S-PO3…Na(H2O)4
…O3P-S-CH3]3-. In this case, the variable is the
distance between Na+ and the closest oxygen from the phosphate group (i.e., Na-O) and
calculations are performed on these models.

122
Figure 4-14. The cluster model [CH3-S-PO3…Na(H2O)4
…O3P-S-CH3]3- used in ab initio
calculations. The dotted lines indicate the variable (Na-O distance) in the calculations.

123
Table 4-1. Structural details of the cluster model used in quantum chemical calculations
(using a Na-O distance of 3.2 Å).
Bond distances (Å) Bond angles (º)
Na-O1 3.20 Na-P1-S1 132
Na-O2 4.22 P1-S1-CH3 101
Na-O3 4.08 O1-P1-O2 119
Na-Ow1-4 2.48 O1-P1-O3 114
O2-P1-O3 100
P1-O1 1.48 O1-P1-S1 113
P1-O2 1.61 P1-Na-Ow1-4 84-97
P1-O3 1.63
P1-S1 2.10
S1-C 1.84
Ow1-Ow2 3.45
Ow1-Ow3 4.96
Ow1-Ow4 3.51
CH3-S-PO3
2- [1] and CH3-S-PO32- [2] are related by an inversion center.
The plane of symmetry contains Na+ and the four waters (square planar).
The two CH3-S-PO32- molecules and Na+ are related by the following parameters:
Bond distances (Å) Na-P2 same as Na-P1
Na-O4 same as Na-O1
Bond angles (º) P1-Na-P2 180
P1-Na-S2 164
Dihedral angle (º) P1-O1-O4-P2 180

124
The computational results are summarized in Figure 4-15, from which several
observations were made. First, the 23Na chemical shift appears to be more sensitive to the
changing Na-O distance than does the 31P chemical shift. Second, the calculated 23Na
chemical shifts are insensitive to the nature of the phosphate groups, as [CH3-S-
PO3…Na(H2O)4
…O3P-S-CH3]3- and [CH3-O-PO3
…Na(H2O)4…O3P-O-CH3]
3- systems give
virtually identical results. Therefore, it is the Na-O distance rather than the presence of
O5' or S5' atom that determines the 23Na chemical shifts. Since the cluster model shown
in Figure 4-14 may not represent the exact Na2(5'-GSMP) G-quadruplex environment,
only the trends instead of the absolute values are considered. In this regard, the
calculations suggest that, as the Na-O distance decreases, both 23Na and 31P chemical
shifts should increase.
As seen from Figure 4-15, an increase of 5 ppm in the 23Na signal between 5'-
GSMP and 5'-GMP corresponds to a shortening of the Na-O distance by about 0.1 Å. The
same amount of distance reduction would yield an increase of the 31P chemical shift by
ca. 1 ppm, which is in accordance with the observed 31P chemical shift increase of 1.7
ppm between monomers and G-quadruplex. Therefore, the calculations strongly support
the hypothesis that enhanced cation bridging between phosphate groups in Na2(5'-GSMP)
is responsible for its gelation at only 0.17 M.
Figure 4-16 illustrates the arrangement of cation-bridging where it occurs along
the helical axis of the G-quadruplex. The Na+ ions are positioned between the phosphate
groups linking to a C2'-endo(i) molecule and a C3'-endo(i+1) molecule.110 As discussed in
Chapter 2, the P-P distance between these two G-quartets is smaller in 5'-GMP (6.7 Å)

125
than that between C3'-endo(i+1) and C2'-endo(i+2) G-quartets (7.2 Å). Hence a Na+ ion
would most likely fit in and bridge the two phosphate groups in a fashion shown in
Figure 4-16. It should also be noted that the enhanced cation-bridging in 5'-GSMP has a
fourfold amplification around the helix. Moreover, the gelation observed in 5'-GSMP has
a similar self-assembling mechanism compared with acidic GMP, where the longer -O-P-
S-C5' bond lengths compensate for the shorter P-P distance caused by smaller repulsion
in the singly-charged phosphate groups in acidic 5'-GMP. As mentioned in Chapter 3,
cation-bridging may play an important role in different G-quadruplex systems. For
example, K+, Rb+, and NH4+ have been known to facilitate different, yet known 5'-GMP
G-quadruplexes.15,60,111
Figure 4-15. Computed results of 23Na (closed circles) and 31P (open circles) chemical
shifts for the [CH3-S-PO3…Na(H2O)4
…O3P-S-CH3]3- cluster model with various Na-O
distances at B3LYP/6-31G(d)/cc-pVTZ(Na+) level. The calculations of 23Na chemical
shifts using the [CH3-O-PO3…Na(H2O)4
…O3P-O-CH3]3- cluster model are shown in
triangles.
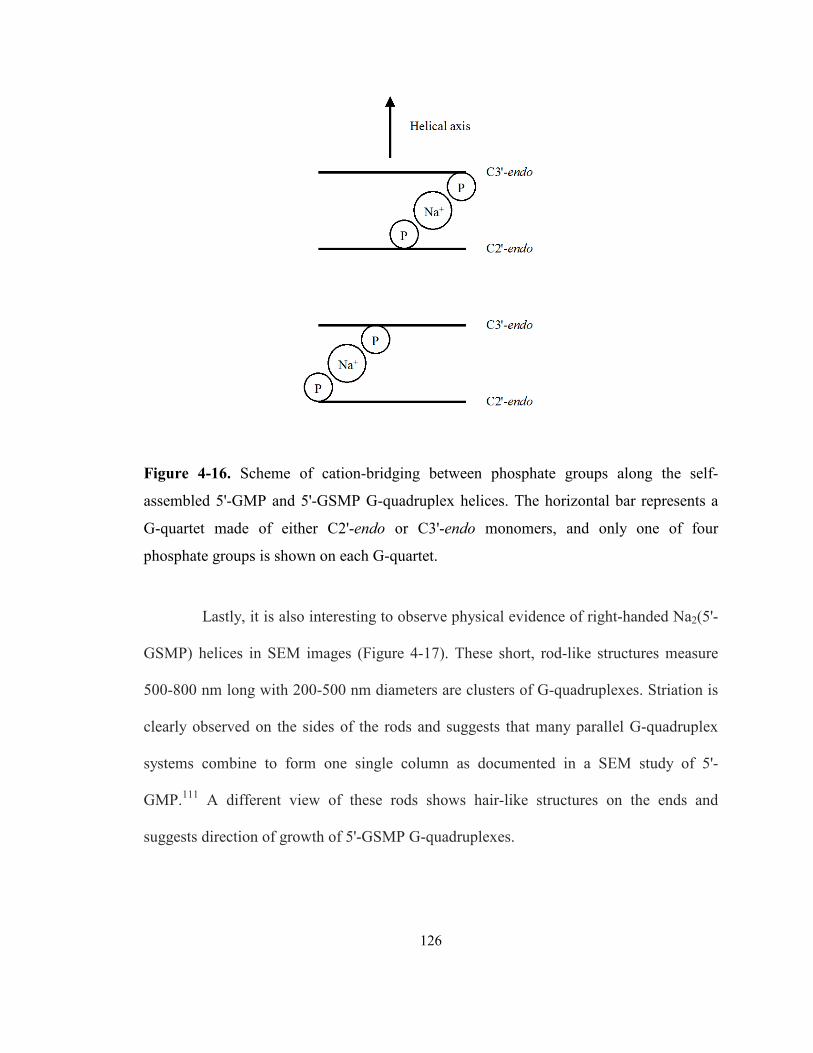
126
Figure 4-16. Scheme of cation-bridging between phosphate groups along the self-
assembled 5'-GMP and 5'-GSMP G-quadruplex helices. The horizontal bar represents a
G-quartet made of either C2'-endo or C3'-endo monomers, and only one of four
phosphate groups is shown on each G-quartet.
Lastly, it is also interesting to observe physical evidence of right-handed Na2(5'-
GSMP) helices in SEM images (Figure 4-17). These short, rod-like structures measure
500-800 nm long with 200-500 nm diameters are clusters of G-quadruplexes. Striation is
clearly observed on the sides of the rods and suggests that many parallel G-quadruplex
systems combine to form one single column as documented in a SEM study of 5'-
GMP.111 A different view of these rods shows hair-like structures on the ends and
suggests direction of growth of 5'-GSMP G-quadruplexes.
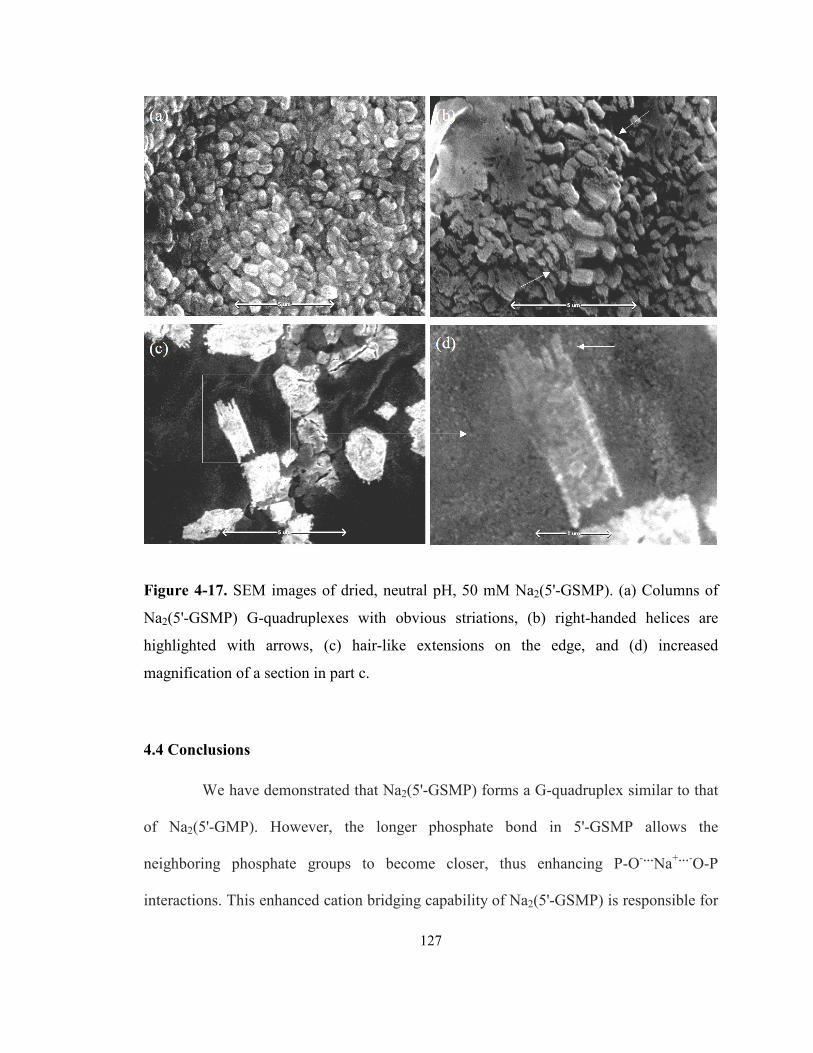
127
Figure 4-17. SEM images of dried, neutral pH, 50 mM Na2(5'-GSMP). (a) Columns of
Na2(5'-GSMP) G-quadruplexes with obvious striations, (b) right-handed helices are
highlighted with arrows, (c) hair-like extensions on the edge, and (d) increased
magnification of a section in part c.
4.4 Conclusions
We have demonstrated that Na2(5'-GSMP) forms a G-quadruplex similar to that
of Na2(5'-GMP). However, the longer phosphate bond in 5'-GSMP allows the
neighboring phosphate groups to become closer, thus enhancing P-O-…Na+…-O-P
interactions. This enhanced cation bridging capability of Na2(5'-GSMP) is responsible for

128
its ability to form gels at low concentrations under neutral conditions. Under the same
conditions, Na2(5'-GMP) remains to be a liquid even at high concentrations. This study
represents an example that a single atom modification can lead to quite different self-
assembly properties.
129
Chapter 5
G-quartet formation of 2', 3', 5'-O-triacetylguanosine promoted by
divalent and trivalent cations
5.1 Introduction
In the past decade, G-quartet has attracted considerable attention in various
areas of research ranging from molecular biology to nanotechnology.41,112 Most previous
studies on G self-assembly were carried out in water.41 This is because many G
derivatives are insoluble in organic solvents. In addition, base-stacking is weakened in
organic solvents. However, Davis and Gottarelli et al. discovered that a lipophilic G
nucleoside, 3',5'-didecanoyl-2'-dG, can form G-octamers in the presence of K+ in
CDCl3.113 Moreover, Spada et al. reported a series of deoxyguanosine derivatives that can
extract alkali metal salts into organic solvents.114 These studies show that formation of
lipophilic G-quartets is clearly achievable in organic solvents. Lipophilic G derivatives
can also form high-ordered aggregates that resemble transmembrane ion channels. The
environment around K+ ions in the selectivity filter of K+-channel proteins is very similar
to that inside of a G-quadruplex channel.27 In both cases, each cation is surrounded by
eight carbonyl groups in an antipyrimidal or cubic fashion.27 Therefore, many lipophilic
G-quadruplexes were made to mimic protein ion channels as artificial ion channels.41
With only a few exceptions,115,116,117 G-quartet formation generally requires the presence
of metal ions. To date, only monovalent (Na+, K+, Rb+, NH4+, Tl+) and divalent (Sr2+,
Ba2+, Pb2+) cations have been found to assist G-quartet formation.118 To our knowledge,
trivalent cations have not been shown to induce G-quartet formation. In this chapter, we

130
report the first example of G-quartet formation of a simple lipophilic guanosine
derivative (2',3',5'-O-triacetylguanosine, TAG; Figure 5-1) promoted by trivalent
lanthanide metal ions (La3+, Eu3+, Tb3+, Dy3+, Tm3+).119
The second part of this chapter describes our attempt to form G-quadruplex
using TAG and Ca2+ cations. Being one of the most abundant elements in human bodies,
Ca2+ also plays a huge role in signal transduction as a second messenger in biological
systems. Studies in G-quadruplex formation between DNA sequences and Ca2+
cations,120,121 including a recently revealed crystallographic structure of [d(TG4T)]4-G-
quadruplex in the presence of Ca2+ cations,122 show the potential of incorporating Ca2+
ions into G-quadruplex systems. We believe that our TAG/Ca2+ self-assembly can help in
understanding the calcium binding site, as well as synthetic calcium channel studies.
Lipophilic G derivative was previously observed to form a G-quadruplex ionophore with
Ca2+ ions,123 and our group was able to prepare discrete octamers using TAG and other
divalent cations (i.e., Sr2+, Ba2+) in organic solvent.124 We used NMR and ESI-MS
methods to study [TAG]Ca2+ complexes, and 43Ca NMR and quantum chemical
calculation are also used to study the Ca2+ binding site within the G-quadruplex.125
Figure 5-1. Scheme of 2',3',5'-O-triacetylguanosine (TAG).
131
5.2 Experimental
5.2.1 Sample preparation
[TAG]M3+
complexes. 2',3',5'-O-Triacetylguanosine (98% purity) was purchased
from Sigma-Aldrich and used without further purification. [TAG]M3+ complexes were
prepared using a solid-liquid extraction method in CHCl3. Metal chlorides were used as
the source of metal ions. After 24 hours of extraction, the organic phase became clear and
was collected and subsequently dried under vacuum. The extraction ratio TAG:M3+ for
extraction is 1:1 unless otherwise stated.
Picrate salts. Picrate salt (i.e., Ca-picrate2) was synthesized by neutralizing
picric acid (Aldrich, 99+%; WARNING: Explosive) with calcium hydroxide, Ca(OH)2,
in aqueous environment. Picrate salts were collected after crystallization.
[TAG]Ca2+
complexes. [TAG]Ca2+ complexes were prepared using a solvent-
solvent extraction method: to one mole of TAG suspended in CHCl3, one mole of picrate
salt (Ca-picrate2) dissolved in H2O was added drop-wise to the stirring solution. The two-
phase solution was stirred until the organic phase became visually clear. The aqueous
phase was then removed, and solid TAG-Ca2+ complexes were obtained after the organic
phase was dried in air.
5.2.2 Solution-state NMR
All solution-state NMR spectra were recorded on a Bruker Avance 600 MHz
spectrometer and in CDCl3 at 268.2 K and 298.2 K. For 1H NMR experiments, a pi-pulse

132
of 20 µs at a power level of 0 dB was used. Temperatures were achieved and maintained
carefully by a Bruker BT-3000 unit.
DOSY. 1H diffusion experiments were carried out using the pulse sequence of
longitudinal eddy current delay with bipolar-gradient pulses: LEDBPGP2s (Bruker
XWinNMR Version 3.5) on 1.0 mM samples in CDCl3. The pulse field gradient duration
(δ) ranged from 1.0 to 2.0 ms, and the variable gradient strength (G) was changed from
5.75 to 5.8 mT/m. The diffusion period (∆) was 50 ms. A total of 16 scans were collected
for each of the 16 increment steps with a recycle delay of 5 s. The eddy current delay (te)
was 5 ms, and the gradient recovery delay was 0.2 ms. All diffusion experiments were
performed at 298.2 K. Calibration of the field gradient strength was performed by
measuring the value of translational diffusion coefficient (Dt) for the residual 1H signal in
D2O (99.99% 2H atom), where Dt = 1.90 x 10⁻⁹ m2/s.68 All diffusion coefficients were
acquired using integration of the proton peaks to a single exponential decay, using the
Simfit software (Bruker XWinNMR Version 3.5).
NOESY. NOESY spectra for [TAG]M3+ were recorded using the pulse program
NOESYGPPH (Bruker XWinNMR Version 3.5) with a mixing time (τmix) of 400 ms on a
1:2 (M3+:TAG) mixing ratio at 268K CDCl3. The experiments were performed using the
phase-sensitive TPPI mode. The data were collected using a 90° pulse of 10.0 µs at 0 dB,
and a relaxation delay of 2.0 s. Spectral width of 13,227 Hz in each dimension was
employed. A total of 2 scans were collected for each time increment. Final data matrix
was 2048 (F2) x 1024 (F1). The 2D NOESY spectrum for [TAG]Ca2+ was performed
with a mixing time (τmix) of 400 ms and the phase-sensitive TPPI mode. The data were

133
collected using a 90° pulse of 10.0 µs and a relaxation delay of 3.0 s. A total of 8 scans
were collected for each time increment. Final data matrix was 2048 (F2) x 1024 (F1).
43Ca NMR. All solution 43Ca NMR experiments were performed by Dr. Alan
Wong on a Chemagnetics-Varian Infinity 600 (14.1 T) spectrometer operating at 40.386
MHz for 43Ca nuclei at the University of Warwick, UK. A Varian T3 rotor (9.5 mm
diameter) was used to increase the NMR sensitivity. The strength of the radio-frequency
field was approximately 14 kHz. A spectral window of 50 kHz was used. All 43Ca
chemical shifts are referenced to the signal from 1.0 M CaCl2(aq), δ(43Ca) = 0 ppm.
5.2.3 Mass Spectrometry
ESI-MS spectra were recorded with an Applied Biosystems QSTAR XL
quadrupole time-of-flight (QqTOF) mass spectrometer in positive mode. ESI-MS data
were acquired using Analyst QS 1.1 software. Samples were dissolved in anhydrous
nitromethane (CH3NO2) and injected with a syringe pump at a flow rate of 5.0 µL min-1.
The mass range of single MS measurements was set at m/z 300 to 6000. To observe
[TAGn + M]3+ complexes, the declustering potential (DP) was set to 20 V during the MS
experiment. Subsequent tandem mass spectrometry (MS/MS) measurements were
performed using nitrogen as the collision gas. A collision induced dissociation (CID)
energy of 35 eV was applied to break down the TAG dodecamers and TAG octamers.
The mass range of MS/MS measurements was set at m/z 100 to 4000. For spectral
assignment, theoretical MS peaks were generated using Data Explorer v. 4.0.0.0 (Applied
Biosystems, 1997– 2000).

134
5.2.4 Fluorescence
Excitation and emission spectra were recorded on a Photon Technology
International (PTI) QuantaMaster model C-60 spectrometer at room temperature using
the software FeliX (v. 1.4, 1999) supplied by PTI.
5.2.5 Quantum chemical calculations
Quantum chemical calculations were performed using the Gaussian 03 suite of
programs87 on a SunFire 6800 symmetric multiprocessor system. Each of the four nodes
is equipped with a 2461.05 GHz (8MB E-Cache) UltraSPARC-III processor and 96 GB
of RAM. For the central Ca atom, we chose three different all-electron basis sets: 6-
311++G(d,p), cc-pVTZ and Sadlej pVTZ.126 A 6-31G(d) basis set was used for all other
non-metal atoms. Each octamer model consists of 129 atoms. Chemical shielding
calculations were performed at both Hartree–Fock (HF) and density-functional theory
(DFT) levels using the GIAO method as implemented in Gaussian 03. The computed
absolute shielding constant was converted to the chemical shift scale (δ) using δ = σref -σ,
where σref is the absolute shielding constant for the reference sample, a fully hydrated
cluster, [Ca(H2O)8]2+ (MP2/6-311++G(d,p) fully optimized geometry: Ca–O: 2.480 Å).
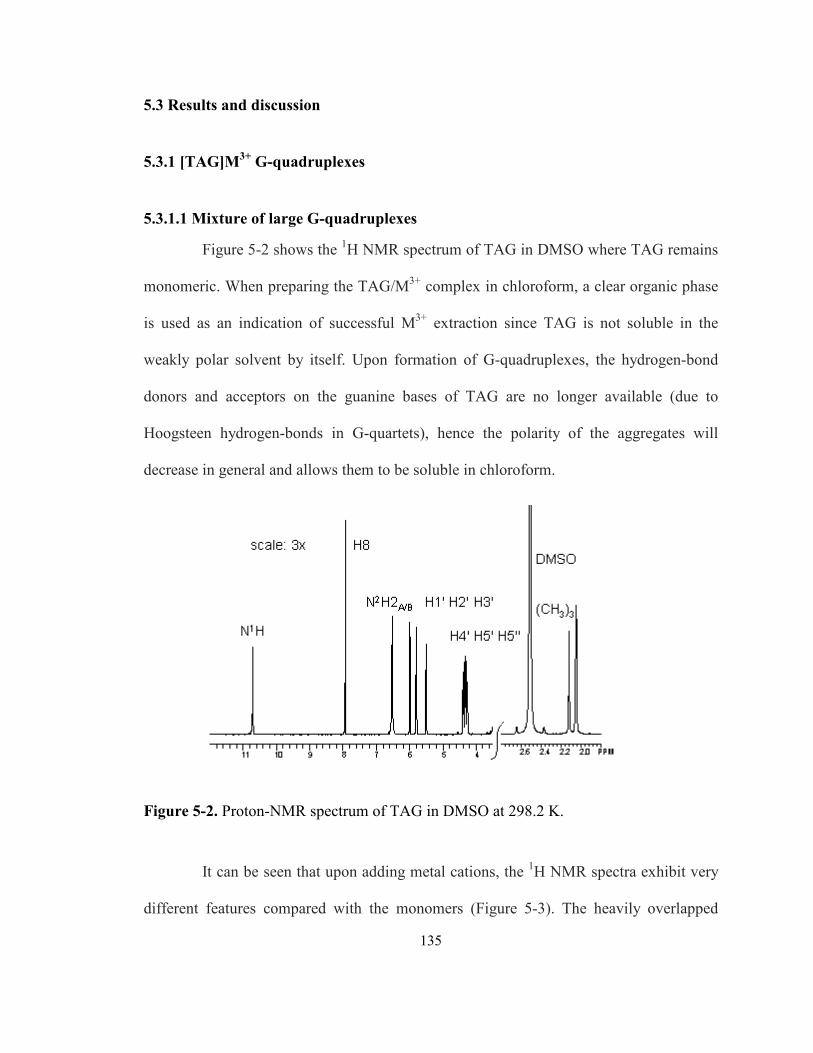
135
5.3 Results and discussion
5.3.1 [TAG]M3+
G-quadruplexes
5.3.1.1 Mixture of large G-quadruplexes
Figure 5-2 shows the 1H NMR spectrum of TAG in DMSO where TAG remains
monomeric. When preparing the TAG/M3+ complex in chloroform, a clear organic phase
is used as an indication of successful M3+ extraction since TAG is not soluble in the
weakly polar solvent by itself. Upon formation of G-quadruplexes, the hydrogen-bond
donors and acceptors on the guanine bases of TAG are no longer available (due to
Hoogsteen hydrogen-bonds in G-quartets), hence the polarity of the aggregates will
decrease in general and allows them to be soluble in chloroform.
Figure 5-2. Proton-NMR spectrum of TAG in DMSO at 298.2 K.
It can be seen that upon adding metal cations, the 1H NMR spectra exhibit very
different features compared with the monomers (Figure 5-3). The heavily overlapped
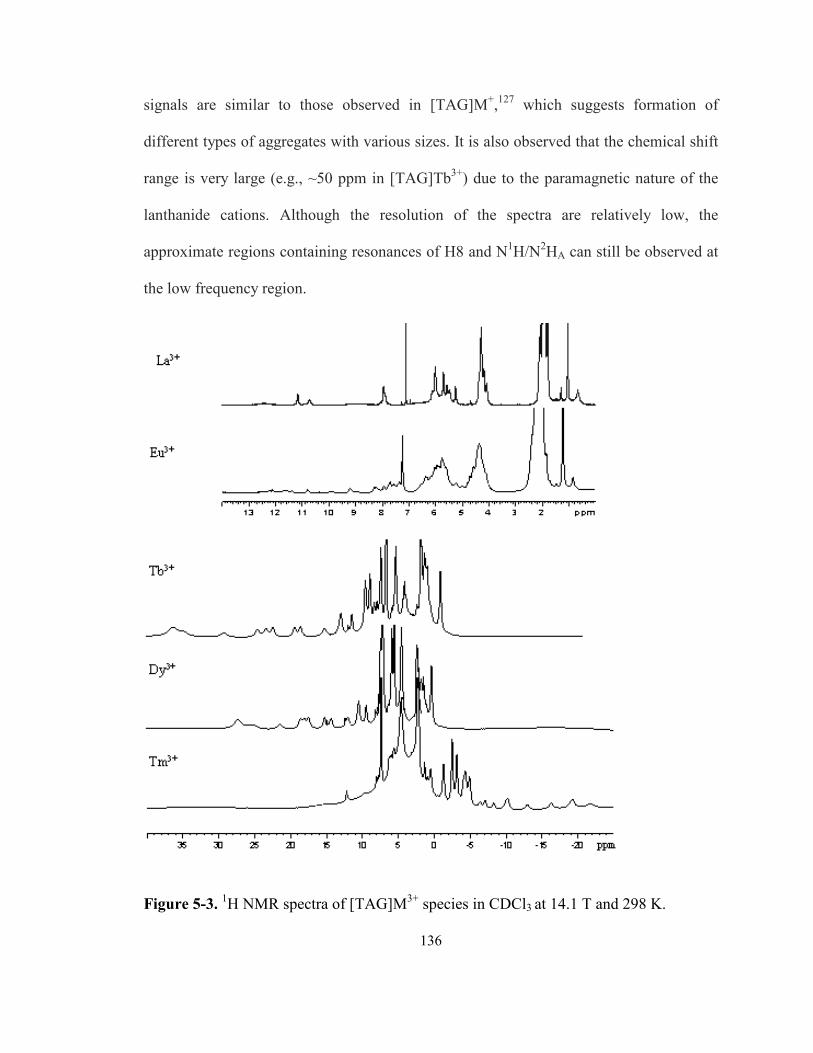
136
signals are similar to those observed in [TAG]M+,127 which suggests formation of
different types of aggregates with various sizes. It is also observed that the chemical shift
range is very large (e.g., ~50 ppm in [TAG]Tb3+) due to the paramagnetic nature of the
lanthanide cations. Although the resolution of the spectra are relatively low, the
approximate regions containing resonances of H8 and N1H/N2HA can still be observed at
the low frequency region.
Figure 5-3. 1H NMR spectra of [TAG]M3+ species in CDCl3 at 14.1 T and 298 K.
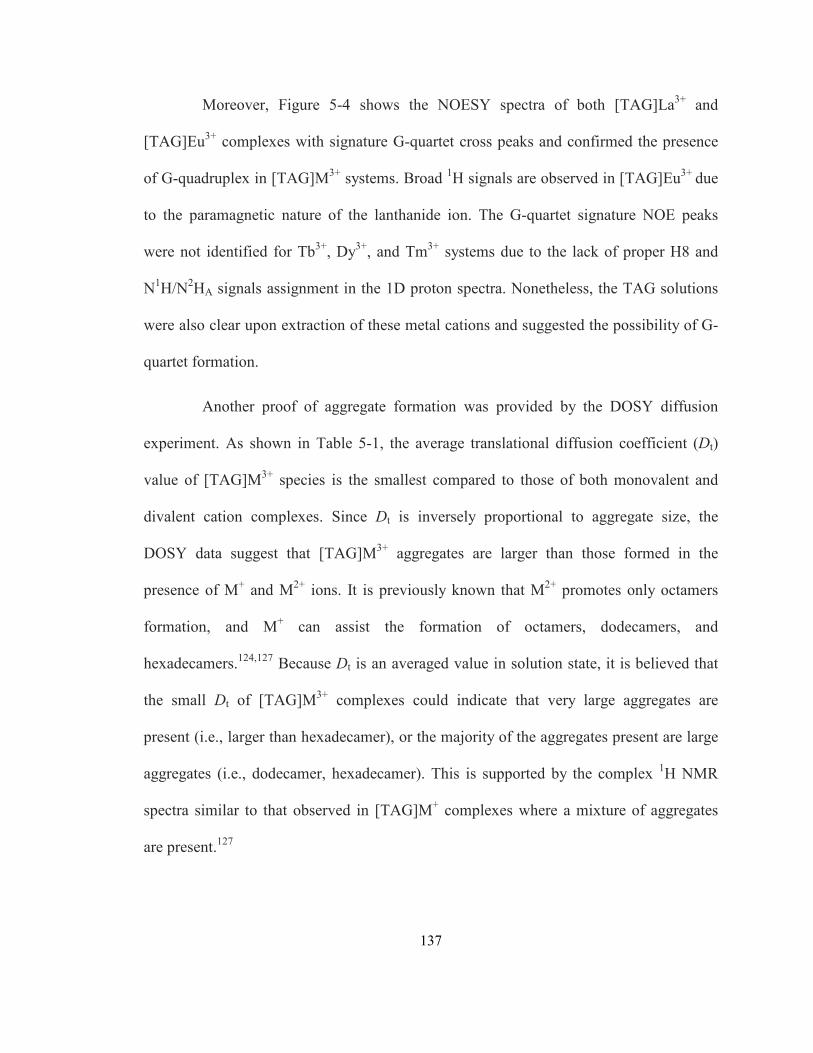
137
Moreover, Figure 5-4 shows the NOESY spectra of both [TAG]La3+ and
[TAG]Eu3+ complexes with signature G-quartet cross peaks and confirmed the presence
of G-quadruplex in [TAG]M3+ systems. Broad 1H signals are observed in [TAG]Eu3+ due
to the paramagnetic nature of the lanthanide ion. The G-quartet signature NOE peaks
were not identified for Tb3+, Dy3+, and Tm3+ systems due to the lack of proper H8 and
N1H/N2HA signals assignment in the 1D proton spectra. Nonetheless, the TAG solutions
were also clear upon extraction of these metal cations and suggested the possibility of G-
quartet formation.
Another proof of aggregate formation was provided by the DOSY diffusion
experiment. As shown in Table 5-1, the average translational diffusion coefficient (Dt)
value of [TAG]M3+ species is the smallest compared to those of both monovalent and
divalent cation complexes. Since Dt is inversely proportional to aggregate size, the
DOSY data suggest that [TAG]M3+ aggregates are larger than those formed in the
presence of M+ and M2+ ions. It is previously known that M2+ promotes only octamers
formation, and M+ can assist the formation of octamers, dodecamers, and
hexadecamers.124,127 Because Dt is an averaged value in solution state, it is believed that
the small Dt of [TAG]M3+ complexes could indicate that very large aggregates are
present (i.e., larger than hexadecamer), or the majority of the aggregates present are large
aggregates (i.e., dodecamer, hexadecamer). This is supported by the complex 1H NMR
spectra similar to that observed in [TAG]M+ complexes where a mixture of aggregates
are present.127

138
Figure 5-4. A portion of the 2D NOESY spectrum of the [TAG]La3+ (top) and
[TAG]Eu3+ (bottom) complexes at 268 K. G-quartet signature cross peaks formed
between N2HA and H8 were highlighted in the solid box while those formed between
N1H and H8 were enclosed in the dashed box. Estimated cross peaks formed between
N1H/N2HA and H8 were highlighted in the solid box for the [TAG]Eu3+ complex.

139
Table 5-1. Summary of experimental diffusion coefficients (Dt) of various TAG-cation
complexes determined at different 1D proton chemical shifts at 298.2 K and 1.0
mM.124,127
Species Average Dt
(x 10-10 m2/s)
No. of data
points Aggregate size
[TAG]M+
M+ = Na+, K+, Rb+
4.35 ± 0.69 85 Hexadecamers, dodecamers,
and octamers
[TAG]M2+
M2+ = Sr2+, Ba2+
4.96 ± 0.36 41 Octamers
[TAG]M3+
M3+ = La3+, Eu3+
3.35 ± 0.21 31 Mixed large aggregates
5.3.1.2 Ion-size dependent [TAG]M3+
aggregate formation
Since [TAG]M3+ could contain very large G-quadruplexes not previously
observed, we decided to use mass-spectrometry to further examine [TAG]M3+
aggregations. Figure 5-5 shows the high-resolution electrospray ionization mass-
spectrometry (ESI-MS) spectra of various [TAG]M3+ species (M3+ = La3+, Eu3+, Tb3+,
Dy3+, and Tm3+) obtained at the positive mode. All spectra were obtained under the same
condition. For the La3+ and Eu3+ complexes, the predominant species is a TAG
dodecamer containing only one metal ion, [TAG12 + M]3+, whereas for the Tb3+, Dy3+ and
Tm3+ complexes, both dodecamer and octamer formations have large relative
abundances. In each case, clusters corresponding to [TAGn + M]3+ (n = 9, 10, 11, 13, 14)
are also present, but mostly with much weaker abundances (< 10%). There is also no

140
observation of any aggregates smaller than octamers, which suggests that the [TAG8 +
M]3+ complexes are very stable. We also noted that some peaks arose from aggregates
formed with a trace amount of Na+ and K+ present in the solvent (Table 5-2). For
example, in the ESI-MS spectrum of the Eu3+ complex, an additional peak was observed
between the signals for [TAG11 + Eu]3+ (m/z 1551.418) and [TAG12 + Eu]3+ (m/z
1686.809). This peak (m/z 1656.995) was assigned to [TAG8 + K + H]2+. However, these
monovalent species do not constitute a significant portion of the aggregate population.
The signal assignments and relative intensities of each [TAGn + M]3+ species after
fragmentation are also shown in Table 5-2.
To further investigate whether the observed [TAG8 + M]3+ and [TAG12 + M]3+
clusters were indeed related to G-quartet formation, we subsequently performed tandem
ESI-MS/MS experiments. Figure 5-6 shows the ESI-MS/MS spectra of [TAG12 + Tb]3+
(m/z 1689.476) and [TAG8 + Tb]3+ (m/z 1143.964) as two examples. Collision-induced
dissociation of the TAG dodecamer at a low energy led to fragments of 11-mer, 10-mer,
9-mer and 8-mer, whereas a further breakdown of the TAG octamer gave rise to 7-mer,
6-mer, 5-mer and 4-mer (i.e., G-quartet). These observations are consistent with the
expectation that a G-quartet is the basic unit of these clusters. The ESI-MS/MS spectra of
the other complexes and their relative abundances are shown in Appendices III.

141
Figure 5-5. High-resolution ESI-MS(+) spectra of various [TAG]M3+ complexes.

142
Table 5-2. Different species of [TAG]n(MCl3)n analyzed from ESI-MS(+) spectra. M =
monomeric TAG with 409.36 a.m.u.
[TAG]nLa3+n m/z Rel. intensity [TAG]nDy3+
n m/z Rel. intensity [M2]+ 819.3 2.9 [M8+Dy]3+ 1145.6 100.0 [M8+La]3+ 1137.9 3.5 [M9+Dy]3+ 1282.4 9.7 [M11+La]3+ 1547.1 5.1 [M10+Dy]3+ 1419 4.9 [M12+La]3+ 1683.1 100.0 [M11+Dy]3+ 1555.1 5.7 [M13+La]3+ 1820.5 6.0 [M12+Dy]3+ 1691.5 49.8 [M14+La]3+ 1956..8 3.5 [M8-H+Dy]2+ 1717.9 2.0 [M12+Na+K]3+ 2485.3 3.1 [M9-H+Dy]2+ 1922.5 5.1 [M10-3H+K+Dy]2+ 2146.1 3.0 [M12+2K]2+ 2494.3 3.1 [TAG]nEu3+
n m/z Rel. intensity [TAG]nTm3+n m/z Rel. intensity [M2]+ 819.3 2.4 [M8+Tm]3+ 1147.6 100.0 [M8+Eu]3+ 1142.3 3.0 [M9+Tm]3+ 1284.3 5.6 [M9+Eu]3+ 1278.7 3.0 [M10+Tm]3+ 1420.7 3.8 [M10+Eu]3+ 1415.1 12.6 [M11+Tm]3+ 1557.1 4.5 [M11+Eu]3+ 1551.4 45.3 [M12+Tm]3+ 1693.5 39.8 [M12+Eu]3+ 1687.8 100.0 [M8+K+H]2+ 1656.9 7.9 [M13+Eu]3+ 1824.4 5.4 [M10-H+Tm+HCl]2+ 2148.6 5.4 [M14+Eu]3+ 1961.2 4.2 [M11-H+Tm+HCl]2+ 2353.6 3.0 [M15+Eu]3+ 2098.2 2.4 [M12+K+Na]2+ 2486.7 5.6 [M8+K]2+ 1656.9 33.0 [M14-H+La+Na+K+CH3NO2H]3+ 1997.2 7.8 [M12+K+Na]2+ 2486.7 7.8 [M15+La+Na+CH3NO2H2]
3+ 2121.6 6.3 [TAG]nTb3+
n m/z Rel. intensity [M8+Tb]3+ 1144.3 94.6 [M9+Tb]3+ 1280.7 10.6 [M10+Tb]3+ 1417.4 7.2 [M11+Tb]3+ 1553.7 12.8 [M12+Tb]3+ 1689.8 100.0 [M13+Tb]3+ 1826.5 7.6 [M12+Eu]3+ 1687.8 12.2 [M13+La]3+ 1820.2 10.9 [M9-H+Tb]2+ 1920.9 6.4 [M12+K+Na]2+ 2487.1 3.6
143
Figure 5-6. ESI-MS/MS(+) spectra of two Tb3+ complexes: [TAG12 + Tb]3+ (top) and
[TAG8 + Tb]3+ (bottom). The parent ion is marked by an asterisk (*).
After G-quartet formation was confirmed using NMR and ESI-MS techniques, it
was interesting to us to understand the structure of the [TAG]M3+ complex structure as
the 12:1 ratio of ligand to metal ion has never been observed before (i.e., dodecamer with
one M3+). It has been known that monovalent and divalent cations in G-quadruplexes are
sandwiched between G-quartets at the channel sites, and sodium ion is the only metal
cation reported to be able to bind in the “in-plane” fashion.128,129,130 Our ESI-MS data not
only provide evidence that lanthanide metal cations facilitate formation of G-
quadruplexes, but also suggest a new mode of ion-binding in G-quartet structures which
is the triple-decker (dodecamer) model, as illustrated in Figure 5-7. We believe this

144
triple-decker model represents the most stable form of a dodecamer due to very strong
ion dipole interactions between trivalent cations and all the O6 carbonyl oxygens atoms
from the guanine bases. It is also possible that the G-quartets in an octamer and a
dodecamer containing trivalent cations are more closely stacked than those in the
octamers containing monovalent and divalent cations. This would further enhance the
stability of the stacking G-quartets in the former complexes due to slightly stronger π-π
interactions between stacking guanine bases.
Figure 5-7. Illustrations of the various ion-binding modes in G-quartet systems. The bar
represents a G-quartet plane.
We also observed that there is a correlation between the relative abundance of
dodecamers and octamers, and the ionic radius of the metal ion. Figure 5-8 shows the
relative abundance of dodecamers and octamers of different [TAG]M3+ species and the
respective ionic radius of the trivalent cations. The abundance of dodecamer decreases as
the ionic radius of the metal ion decreases from La3+ to Tm3+. This suggests that
compared with other lanthanide ions, La3+ has an optimal size to fit into the G-quartet

145
plane to form a very stable ion-filled G-quartet. This is not surprising because with an
ionic radius of 1.16 Å (for a coordination number of 8), La3+ has an almost identical ionic
radius as Na+ ions (1.18 Å).131 Hence La3+ can also adopt the in-plane position and form
a stable dodecamer. Since Na+ has a smaller charge than La3+, the weaker ion-carbonyl
interaction explains why a G dodecamer containing a single Na+ ion has never been
observed.
Since all ESI-MS spectra were obtained under the same condition, we may also
use the fragmentation pattern as an indicator of TAG-quadruplex stability. For example,
in the MS spectrum of the La3+ complex, only G dodecamer signal is observed, which
indicates very little fragmentation and the structure of the dodecamer is very stable.
However, in the MS spectrum of the Tb3+ complex, the signals from the dodecamers and
octamers have almost equal intensities, suggesting that the TAG dodecamer containing a
Tb3+ ion is not as stable as its La3+ analog. Using the relative intensities of each
aggregate, the stability of TAG dodecamer formation is in the following order: La3+ >
Eu3+ > Tb3+ > Dy3+ > Tm3+, and that the stability of octamer formation is in the reverse
order (Figure 5-8). This observation correlates with the ionic radii of the lanthanide ions
and the stability of the octamer or dodecamer formed using these ions.
5.3.1.3 Fluorescence properties of [TAG]M3+
G-quadruplexes
Figure 5-9 displays the sensitized luminescence excitation spectrum of Tb3+
complex in CHCl3, which exhibits characteristic peaks at 492 (5D4 � 7F6), 545 (5D4 �
7F5) and 584 (5D4 � 7F4) nm, giving rise to a green hue under the UV light. Both TAG
monomers and TbCl3 in CHCl3 do not enhance Tb3+ fluorescence.132 Thus formation of a
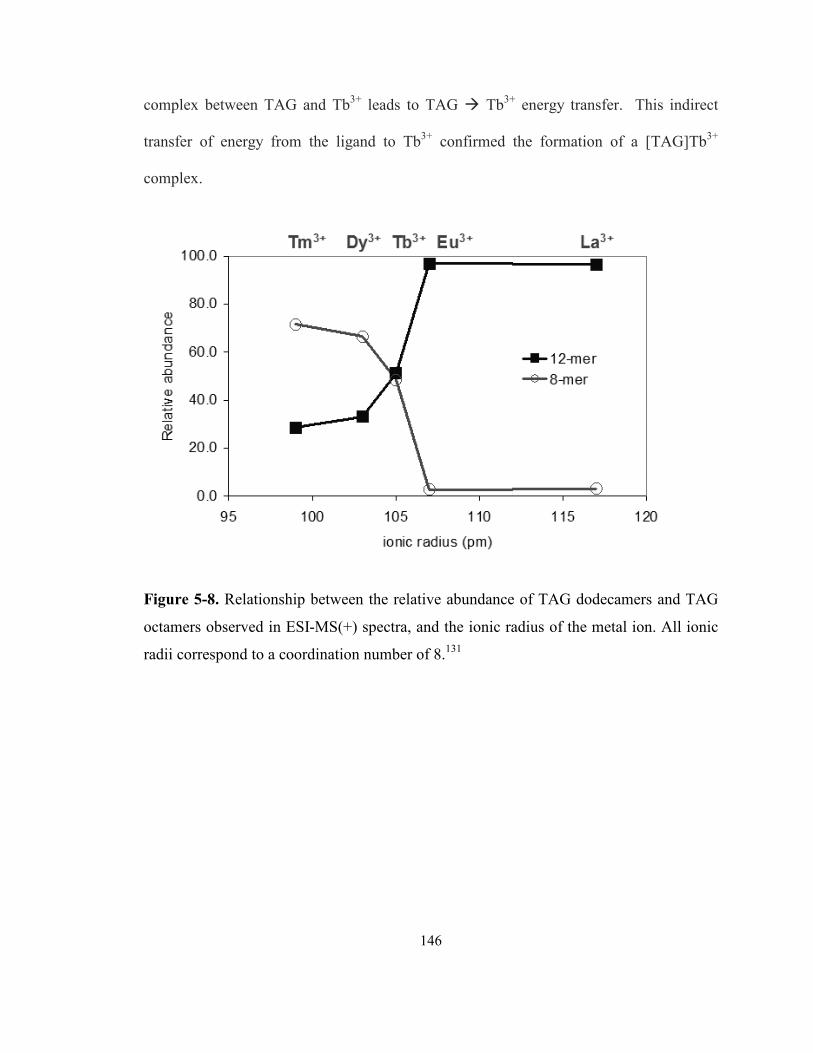
146
complex between TAG and Tb3+ leads to TAG � Tb3+ energy transfer. This indirect
transfer of energy from the ligand to Tb3+ confirmed the formation of a [TAG]Tb3+
complex.
Figure 5-8. Relationship between the relative abundance of TAG dodecamers and TAG
octamers observed in ESI-MS(+) spectra, and the ionic radius of the metal ion. All ionic
radii correspond to a coordination number of 8.131

147
Figure 5-9. Excitation and emission spectra of the sparingly soluble TbCl3 (top), TAG
(middle) and the clear TAG-Tb solution (bottom) in CHCl3 at room temperature.

148
5.3.2 [TAG]Ca2+
G-quadruplex
5.3.2.1 Formation of discrete octamers
Figure 5-10 shows the 1H NMR spectra of monomeric TAG in DMSO and
[TAG]Ca2+ complex in CDCl3 at different temperatures. Compared to [TAG]M3+
complexes discussed earlier, [TAG]Ca2+ exhibits a much simpler proton NMR spectrum
in which two sets of peaks in 1:1 ratio are observed. This kind of spectral appearance is
likely due to the presence of both syn and anti TAG monomers in equal amounts based
on examples reported in the literature.113 As seem from Figure 5-10, the imino proton
N1H and one of the amino protons N2HA are deshielded (9.5-11.5 ppm), suggesting their
participation in hydrogen-bonding. All of these observations suggest G-quartet formation.
Moreover, according to the 4:1 signal integrations between TAG and the counter-ion
picrate (with two protons), we conclude that an octamer is formed with eight TAG
monomers and one Ca2+ ion. The formation of TAG octamers with M2+ cations such as
Sr2+ and Ba2+ was previously observed,124 and the 8:1 ratio is independent of the picrate
concentration in the aqueous phase during the extraction process. This suggests that the
[TAG8]Ca2+ octamer is a very stable aggregate in organic phase. Signature intra-quartet
cross-peaks (N2HA/H8 and N1H/H8) are observed in the NOESY spectrum of
[TAG8]Ca2+, as shown in Figure 5-11. The size of the octamer species is also confirmed
using DOSY experiment, where the average Dt value is of the same magnitude as other
octameric species including [TAG8]Sr2+, [TAG8]Ba2+, and another similar G derivative
reported by Davis (Table 5-3).133

149
Figure 5-10. 1H NMR spectra of TAG in DMSO and TAG-Ca2+ in chloroform.
Moreover, ESI-MS and tandem-MS/MS experiments were performed for the
TAG-Ca2+ complex (see Appendix IV for detail analysis). As seen from Figure 5-12 and
Table 5-4, the octamer peak (m/z 1656.424) is predominant. This also provides evidence
that the octamer is composed of two G-quartets and one Ca2+. Because the ionic radius of
Ca2+ (1.12 Å for a coordination number of 8) is similar to those of Na+ (1.18 Å), K+ (1.33
Å) and Sr2+ (1.26 Å),131 it is not surprising that a Ca2+ ion can fit into the central cavity
between two G-quartets.
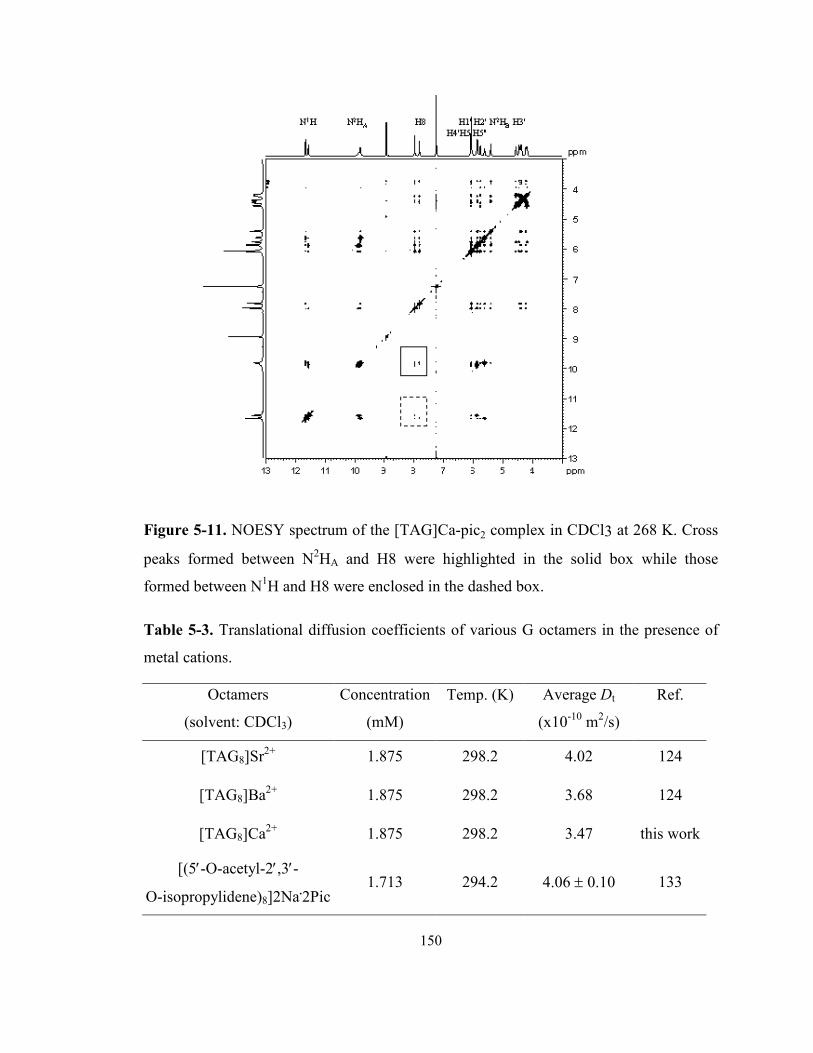
150
Figure 5-11. NOESY spectrum of the [TAG]Ca-pic2 complex in CDCl3 at 268 K. Cross
peaks formed between N2HA and H8 were highlighted in the solid box while those
formed between N1H and H8 were enclosed in the dashed box.
Table 5-3. Translational diffusion coefficients of various G octamers in the presence of
metal cations.
Octamers
(solvent: CDCl3)
Concentration
(mM)
Temp. (K)
Average Dt
(x10-10 m2/s)
Ref.
[TAG8]Sr2+ 1.875 298.2 4.02 124
[TAG8]Ba2+ 1.875 298.2 3.68 124
[TAG8]Ca2+ 1.875 298.2 3.47 this work
[(5′-O-acetyl-2′,3′-
O-isopropylidene)8]2Na.2Pic 1.713 294.2 4.06 ± 0.10 133

151
Figure 5-12. Positive mode of high resolution ESI-MS spectra of the [TAG]Ca2+
complex (top) and the tandem-MS/MS spectrum of [TAG8]Ca2+ octamer at 1656.424 m/z
(bottom). The parent ion is marked by an *. G = monomeric TAG with 409.360 a.m.u.
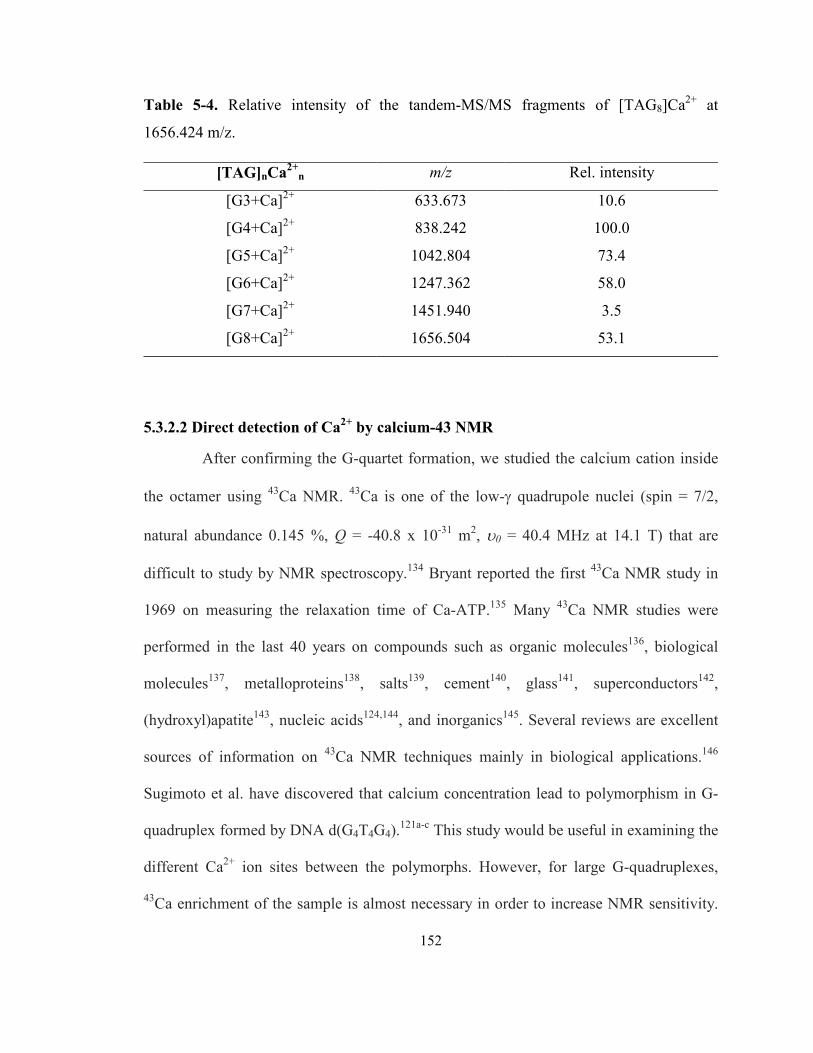
152
Table 5-4. Relative intensity of the tandem-MS/MS fragments of [TAG8]Ca2+ at
1656.424 m/z.
5.3.2.2 Direct detection of Ca2+
by calcium-43 NMR
After confirming the G-quartet formation, we studied the calcium cation inside
the octamer using 43Ca NMR. 43Ca is one of the low-γ quadrupole nuclei (spin = 7/2,
natural abundance 0.145 %, Q = -40.8 x 10⁻³¹ m2, υ0 = 40.4 MHz at 14.1 T) that are
difficult to study by NMR spectroscopy.134 Bryant reported the first 43Ca NMR study in
1969 on measuring the relaxation time of Ca-ATP.135 Many 43Ca NMR studies were
performed in the last 40 years on compounds such as organic molecules136, biological
molecules137, metalloproteins138, salts139, cement140, glass141, superconductors142,
(hydroxyl)apatite143, nucleic acids124,144, and inorganics145. Several reviews are excellent
sources of information on 43Ca NMR techniques mainly in biological applications.146
Sugimoto et al. have discovered that calcium concentration lead to polymorphism in G-
quadruplex formed by DNA d(G4T4G4).121a-c This study would be useful in examining the
different Ca2+ ion sites between the polymorphs. However, for large G-quadruplexes,
43Ca enrichment of the sample is almost necessary in order to increase NMR sensitivity.
[TAG]nCa2+
n m/z Rel. intensity
[G3+Ca]2+ 633.673 10.6
[G4+Ca]2+ 838.242 100.0
[G5+Ca]2+ 1042.804 73.4
[G6+Ca]2+ 1247.362 58.0
[G7+Ca]2+ 1451.940 3.5
[G8+Ca]2+ 1656.504 53.1

153
A new approach using magic-angle coil spinning (MACS) detector could also be
employed as a low-cost strategy for future 43Ca solid-state NMR spectroscopy.147
Recently, Bryce presented a comprehensive review with a focus on solid-state 43Ca NMR
in both organic and inorganic systems.148 Figure 5-13 shows the natural abundance 43Ca
NMR signals obtained for CaCl2(aq), CaPic2(aq), and TAG-Ca2+ in CDCl3 at 14.1 T. The
[TAG8]Ca2+ octamer has a distinctive 43Ca signal at -43 ppm.
Figure 5-13. Natural abundance 43Ca NMR spectra of (a) CaCl2(aq) (400 transients, 0.25 s
recycle delay), (b) CaPic2(aq) (3757 transients, 0.25 s recycle delay), and (c) TAG-Ca2+
complex in CDCl3 (approximately 60 mM, 544,890 transients, 0.25 s recycle delay) at
14.1 T. All 43Ca chemical shifts are referenced to CaCl2(aq) at δ = 0 ppm.

154
5.3.2.3 Quantum chemical calculations
To determine the relationship between the observed 43Ca chemical shift and ion
coordination geometry, quantum chemical calculations were performed using four
different types of octamer models. The first model (Model I) is based on the crystal
structure of 5′-silyl-2′,3′-O-isopropylidene guanosine with one Sr2+ ion, except the Sr2+
ion is now replaced by a Ca2+ ion.149 Model II is the truncated 43Ca site (Ca55) in
Neidle’s new crystal structure of a G-quadruplex formed from the DNA strand,
d(TG4T).122 Model III is the crystal structure of 5′-silyl-2′,3′-O-isopropylidene guanosine
with one Na+ ion, except Na+ is replaced by a Ca2+ in the model. The last model (Model
IV) is an octamer composed of geometrically optimized G-quartets (optimization
performed at B3LYP/6-311G(d,p)) that are 3.32 Å apart with a Ca2+ ion located at the
central channel site. All of these four models have one Ca2+ ion coordinating to eight
guanine O6 atoms in a bipyramidal antiprism fashion as illustrated in Figure 5-14. From
the perspective of the Ca2+ cation, the main difference between these models is the Ca2+-
O6 distance. Table 5-5 shows the calculated 43Ca chemical shifts from these models.
Figure 5-14. [TAG8]Ca2+ octamers model used in quantum chemical calculations. Color
scheme: green = Ca2+, red = O6, black = C, blue = N, and gray = H.

155
Figure 5-15 shows that a correlation exists between the calculated chemical shift
and the average Ca-O6 distances. In fact, this strong correlation can be used to determine
Ca-O6 distances as demonstrated by previous researchers in organic and inorganic
systems.136d,137a,145b/c/h As seen from Figure 5-15, the calculated 43Ca chemical shifts from
all method and basis set combinations of each model lie within a range of 10 ppm. This is
much smaller than the entire 43Ca chemical shift range, i.e., 200 ppm.134 Therefore the
calculated chemical shifts can yield reliable and accurate results. The estimated Ca-O6
distance of the TAG-Ca2+ complex is 2.70 ± 0.05 Å. The estimation is reasonable
compared to the Ca55 site in d(TG4T) with a Ca-O6 distance of 2.76 Å.122
Table 5-5. Calculated and experimental 43Ca chemical shifts (in ppm) for four models,
each contains two G-quartets and a central Ca2+ ion. Atoms besides Ca2+ are calculated
using the same method and basis set 6-31G(d).
Method/basis set (43Ca) Model I Model II Model III Model IV
HF/6-311++G(d,p) -38.1 -62.8 -75.0 -63.9
HF/cc-pVTZ -28.8 -50.8 -63.8 -53.4
HF/Sadlej pVTZ -34.5 -55.6 -66.8 -57.4
B3LYP/6-311++G(d,p) -37.2 -63.0 -74.1 -62.9
B3LYP/cc-pVTZ -26.4 -50.2 -63.5 -52.2
B3LYP/Sadlej pVTZ -37.9 -61.3 -73.5 -63.4
Experimental -43 ± 2
Besides chemical shifts, electric field gradient (EFG) of all Ca2+ sites in the four
models were also calculated. The calculated EFG’s of 43Ca sites are also consistent with

156
the small magnitude of the 43Ca nuclear quadrupole coupling constants (CQ). Because CQ
is proportional to line width, it explains the narrow line width (ca. 600 Hz or 15 ppm)
observed in the 43Ca spectrum of [TAG8]Ca2+.
Figure 5-15. Relationship between computed 43Ca chemical shifts and average Ca-O6
distances of four octamers models (see text for model descriptions).
5.4 Conclusion
In this chapter, we have studied a lipophilic G derivative, TAG, and discovered
for the first time that trivalent lanthanide metal ions can facilitate G-quartet formation. A
new mode of metal ion binding in G-quartet structures, i.e., a triple-decker G dodecamer
containing a single metal ion in the central G-quartet is reported. Our findings open up
157
new possibilities in regard to designing the electronic, magnetic and photonic properties
of guanosine-based materials for nanotechnology. Moreover, we report the first 1H and
43Ca NMR characterization of Ca2+-templated G-quartet formation. The 43Ca NMR
signature observed for Ca2+ ions residing in the channel site provides a benchmark for
future studies of Ca2+ ion binding in DNA G-quadruplex systems. Because calcium is
ubiquitous in biological systems, its role in DNA G-quadruplexes or protein sites should
be further investigated.

158
Chapter 6
Concluding remarks
This thesis documents the study of several G derivatives in forming self-
assemblies called G-quadruplexes under various conditions (e.g., pH, cation,
concentration, aqueous and lipophilic, etc). We have employed a wide range of
spectroscopic techniques such as NMR, ESI-MS, FT-IR, as well as quantum chemical
calculations to obtain structural information at the atomic level for these G-quadruplexes
when x-ray crystallography is not applicable to our samples. The combination of the
above methods enhances the accuracy of structural elucidation compared with previous
studies of similar systems for which only bulk structural features were obtained.
As there are not many studies reported in the literature that examine G-
quadruplexes formed from mononucleotides such as those discussed in this thesis, our
research has produced a significant amount of new information. It is important to note
that the greater degree of flexibility of mononucleotides (e.g., sugar pucker, glycosidic
bond, exocyclic torsion angle, and the charge of the phosphate group, etc) provides an
extra layer of complexity in studying the monomers and the subsequently formed G-
quadruplexes compared to polynucleotides with rigid backbones. Moreover, G-
quadruplexes with different sizes can also coexist. The presence of four sets of proton
signals in neutral Na2(5'-GMP) and the various distribution of octamers and dodecamers
in [TAG]M3+ are excellent examples. These conformational changes and wide
distribution of sizes often lead to multiple signals that are often too complicated to study.
To resolve this problem, we have used a 2D NMR approach called DOSY-NOESY, to
159
selectively detect signals arising only from G-quadruplex molecules. This method allows
us to study coexisting species separately provided that their transitional diffusion rates are
considerably different.
We are especially delighted to have solved the structure of Na2(5'-GMP) G-
quadruplex formed under neutral conditions as this structure has been puzzling the
scientific world for over 60 years. We also report for the first time the observation of a
GG32 dimer. Our data confirms the alternate structure of a long-believed model of the
acidic Na2(5'-GMP) G-quadruplex, which also has a hollow channel site. This made
acidic Na2(5'-GMP) one of the few examples where channel cations are not required to
form a G-quadruplex. The study of Na2(5'-GSMP) allows us to recognize the power of
self-assembly when modifying one single atom could lead to dramatic aggregation
abilities between molecules. The introduction of trivalent and Ca2+ cations to TAG in
organic solvent opens up doors for nanotechnology and ion-channel studies in biological
systems, respectively, where these metal cations are often employed. We also discovered
a new binding mode for trivalent cations where La3+, with a suitable ionic radius, can sit
in-plane in a [TAG12]La3+ dodecamer molecule.
In the future, several experiments can be performed to complement our G-
quadruplex study. First, we can solve the puckering of 5'-GMP molecules present in
dimer and its stacking helix. The chemical shift of the H8β signal sits between the 100%
C2'-endo (H8α) and 100% C3'-endo (H8δ) resonances. It would be interesting to know if
dimers undergo conformational change between these two forms or a new type of
puckering is present. Secondly, a 15N-labeled guanosine sample can be used in the
160
15N{1H} HETCOR experiment where hydrogen bonding between the phosphate group
and N2HB can be confirmed in the acidic Na(5'-GMP) sample. Second, our group has
published the results in studying the movement of ions (Na+, K+, and NH4+) in G-
quadruplexes DNA channels using computational methods.150 We can also perform
similar calculations on the release rate of channel Na+ ions when changing the pH of
Na2(5'-GMP) from neutral to acidic condition, where the channel Na+ ion is no longer
present. The stability and population of the Na2(5'-GMP) G-quadruplexes can also be
enhanced by introducing stabilizing agents. The amine groups (-NH3+) on the ends of the
polyamine can bind to surface sites (-PO42-) of the G-quadruplex, while the long carbon
chain can stabilize the structure similar to a “clamp”. An ideal size of polyamine is yet to
be determined because the amine groups must bind onto phosphate groups of the G-
quadruplex that are separated with a specific distance. Moreover, we can also introduce
other types of cation to 5'-GMP, such as M2+ or M3+, with appropriate ionic radii that can
fit into the channel site. G-quadruplex formation can be observed using techniques
described in this thesis, and exotic nuclei NMR experiments of these ions can add onto
our knowledge of ion channels formed using G-quadruplexes.

161
References
1 Miescher, F. “Ueber die chemische Zusammensetzung der Eiterzeller”. Medicinisch-
chemische Untersuchungen. 1871, 4, 441-460. 2 Watson, J.D.; Crick, F.H.C. “Molecular structure of nucleic acids: a structure for
deoxyribose nucleic acid”. Nature. 1953, 171, 737-738. Wilkins, M.H.F.; Stokes, A.R.;
Wilson, H.R. “Molecular structure of nucleic acids: molecular structure of deoxypentose
nucleic acids”. Nature. 1953, 171, 738-740. Franklin, R.E.; Gosling, R.G. “Molecular
configuration in sodium thymonucleate”. Nature. 1953, 171, 740-741. 3 Rich, A. “The era of RNA awakening: structural biology of RNA in the early years”. Q.
Rev. Biophys. 2009, 42(2), 117-137. 4 Saenger, W. Principles of Nucleic Acid Structure; Springer-Verlag New York Inc: New
York, 1984. 5 Jeffery, G.A. and Saenger, W. Hydrogen Bonding in Biological Structures; Springer-
Verlag, Berlin Heidelberg: Germany, 1991. 6 Wang, A.H.-J.; Quigley, G.J.; Kolpak, F.J.; Crawford, J.L.; Van Boom, J.H.; Van der
Marel, G.; Rich, A. “Molecular structure of a left-handed double helical DNA fragment
at atomic resolution”. Nature. 1979, 282, 680-686. 7 Picture credit: Wikipedia (original uploader Richard Wheeler)
http://en.wikipedia.org/wiki/File:A-DNA,_B-DNA_and_Z-DNA.png (accessed Sept 17,
2011). 8 Crick, F.H.C. “Codon-anticodon pairing: the wobble hypothesis”. J. Mol. Biol., 1966,
19, 548-555. 9 Hoogsteen, K. “The crystal and molecular structure of a hydrogen-bonded complex
between 1-methylthymine and 9-methyladenine”. Acta Cryst. 1963, 16, 907-916. 10 Nikolova, E.N.; Euane, K.; Wise, A.A.; O’Brien, P.J.; Andricioaei, I.; Al-Hashimi,
H.M. “Transient Hoogsteen base pairs in canonical duplex DNA”. Nature. 2011, 470,
498-502.

162
11 Bang, I.C. “Untersuchungen über Guanylsäure”. Biochemische Zeitschrift, 1910, 26,
293-311. 12 Gellert, M. ; Lipsett, M.N. ; Davies, D.R. “Helix formation by guanylic acid”. Proc.
Natl. Acad. Sci. U.S.A. 1962, 48, 2013-2018. 13 Miles, H.T.; Frazier, J. “Infrared spectra in D2O solution of guanylic acid helices and
of poly-G”. Biochim. Biophys. Acta. 1964, 79, 216-220. 14 Chantot, J.-F.; Sarocchi, M.T.; Guschlbauer, W. “Physiochemical properties of
nucleotides 4. Gel formation by guanosine and its analogs”. Biochemie. 1971, 53(3), 347-
354. 15 Pinnavaia, T.J.; Marshall, C.L.; Mettler, C.M.; Fisk, C.L.; Miles, H.T.; Becker, E.D.
“Alkali metal ion specificity in the solution ordering of a nucleotide, 5'-guanosine
monophosphate”. J. Am. Chem. Soc. 1978, 100(11), 3625-3627. 16 Kang, C.; Zhang, X.; Ratliff, R.; Moyzis, R.; Rich, A. “Crystal structure of four-
stranded Oxytricha telomeric DNA”. Nature. 1992, 356, 126-131. 17 Wang, Y.; Patel, D.J. “Solution structure of the human telomeric repeat
d[AG3(T2AG3)3]G-tetraplex”. Structure (Cambridge, MA, United States). 1993, 1(4),
263-282. 18 Zahler, A.M.; Williamson, J.R.; Cech, T.R.; Prescott, D.M. “Inhibition of telomerase
by G-quartet DNA structures”. Nature. 1991, 350(6320), 718-720. 19 Guschlbauer, W.; Chantot, J.F.; Thiele, D. “Four-stranded nucleic acid structures 25
years later: from guanosine gels to telomere DNA”. J. Biomol. Struct. Dyn. 1990, 8(3),
491-511. 20 Blackburn, E.H. “Structure and function of telomeres”. Nature. 1991, 350(6319): 569-
573. 21 Hahn, W.C.; Stewart, S.A.; Brooks, M.W.; York, S.G.; Eaton, E.; Kurachi, A.;
Beijersbergen, R.L.; Knoll, J.H.M.; Meyerson, M.; Weinberg, R.A. “Inhibition of
telomerase limits the growth of human cancer cells”. Nat. Med. 1999, 5(10), 1164-1170.

163
22 Han, H.; Hurley, L.H. “G-quadruplex DNA: a potential target for anti-cancer drug
design”, Trends Pharmacol. Sci. 2000, 21, 136-142. 23 Neidle, S.; Parkinson, G. “Telomere maintenance as a target for anticancer drug
discovery”. Nat. Rev. Drug Discovery. 2002, 1(5), 383-393. 24 Ou, T.-M.; Lu, Y.J.; Zhang, C.; Huang, Z.S.; Wang, X.D.; Tan, J.H.; Chen, Y.; Ma,
D.L.; Wong, K.Y.; Tang, J. C.O.; Chan, A.S.C.; Gu, L.Q. “Stabilization of G-quadruplex
DNA and down-regulation of oncogene c-myc by quindoine derivatives”. J. Med. Chem.
2007, 50(7), 1465-1474. 25 Wu, Y.; Brosh, Jr., Y.M. “G-quadruplex nucleic acids and human diseases”. FEBS J.
2010, 277(17), 3470-3488. 26 Parkinson, G.N.; Lee, M.P.H.; Neidle, S. “Crystal structure of parallel quadruplexes
from human telomeric DNA”. Nature, 2002, 417, 876-880. 27 Zhou, Y. ; Morais-Cabral, J.H.; Kaufman, A.; MacKinnon, R. “Chemistry of ion
coordination and hydration revealed by a K+ channel–Fab complex at 2.0 Å resolution”.
Nature. 2001, 414, 43-48. 28 MacKinnon, R. “Ion channels: potassium channels and the atomic basis of selective ion
condition” (Nobel lecture). Angew. Chem. Int. Ed. 2004, 43, 4265-4277. 29 Daivs, J.T.; Tirumala, S.; Jenssen, J.R.; Radler, E. “Self-assembled ionophores from
isoguanosine”. J. Org. Chem.1995, 60, 4167-4176. 30 Forman, S,L.; Fettinger, J.C.; Pieraccini, S.; Gottarelli, G.; Davis, J.T. “Towards
artificial ion channels: a lipophilic G-quadruplex”. J. Am. Chem. Soc. 2000, 122, 4060-
4067.
31 Kaucher, M.S.; Harrell, W.A.; Davis, J.T. “A unimolecular G-quadruplex that
functions as a transmembrane Na+ transporter”. J. Am. Chem. Soc. 2006, 128(1), 38-39. 32 Van Leeuwen, F.W.B.; Miermans, C.J.H.; Beijleveld, H.; Tomasberger, T.; Davis, J.T.;
Verboon, W.; Reinhoudr, D.N. “Selective removal of 226Ra2+ from gas-field-produced
waters”. Environ. Sci. Technol. 2005, 39(14), 5455-5459.

164
33 Shi, X.; Mullaugh, K.M.; Fettinger, J.C.; Jiang, Y.; Hofstadler, S.A.; Davis, J.T.
“Lipophilic G-quadruplexes are self-assembled ion pair receptors, and the bound anion
modulates the kinetic stability of these complexes”. J. Am. Chem. Soc. 2003, 125,
10830-10841. 34 Ma, L.; Iezzi, M.; Kaucher, M.S.; Lam, Y.-F.; Davis, J.T. “Cation exchange in
lipophilic G-quadruplexes: not all binding sites are equal”. J. Am. Chem. Soc. 2006,
128(47), 15269-15277. 35 Alberti, P.; Bourdoncle, A.; Saccà, B.; Lacroix, L.; Mergny, J.-L. “DNA nanomachines
and nanostructures involving quadruplexes”. Org. Biomol. Chem. 2006, 4, 3389-3391. 36 Kunstelj, K.; Spindler, L.; Federiconi, F.; Bonn, M.; Drevenšek-Olenik, I.; Čopič, M.
“Self-organization of guanosine 5'-monophosphate on mica”. Colloids Surf., B. 2007, 59,
120-127. 37 Arnal-Herault, C.; Pase, A.; Michau, M.; Cot, D.; Petit, E.; Barboiu, M. “Functional G-
quartet macroscopic membrane films”. Angew. Chem. Int. Ed. 2007, 46(44), 8409-8413. 38 Sreenivasacchary, N.; Lehn, J.-M. “Structural selection in G-quartet-based hydrogels
and controlled release of bioactive molecules”. Chem. Asian J. 2008, 3(1), 134-139. 39 Lena, S.; Neviani, P.; Masiero, S.; Pieraccini, S.; Spada, G.P. “Triggering of guanosine
self-assembly by light”. Angew. Chem. Int. Ed. 2010, 49(21), 3657-3660. 40 Gottarelli, G.; Sapada, G.P. “The stepwise supramolecular organization of guanosine
derivatives”. Chem. Rec. 2004, 4(1), 39-49. 41 Davis, J.T. “G-quartets 40 years later: from 5'-GMP to molecular biology and
supramolecular chemistry”. Angew. Chem. Int. Ed. 2004, 43, 668-698. 42 Kaucher, M.S.; Harrell Jr., W.A.; Davis, J.T. “The G-quartets in supramolecular
chemistry and nanoscience” in Quadruplex Nucleic Acid; Neidle, S.; Balasubramanian, S.
Ed.; RSC Publishing: Cambridge, 2006; p 253-296. 43 Davis, J.T.; Spada, G.P. “Surpamolecular architectures generated by self-assembly of
guanosine derivatives”. Chem. Soc. Rev. 2007, 36(2), 296-313.

165
44 Lena, S.; Masiero, S.; Pieraccini, S.; Spada, G.P. “The supramolecular organization of
guanosine derivatives”. Mini-reviews in organic chemistry. 2008, 5, 262-273. 45 Lena, S.; Masiero, S.; Pieraccini, S.; Spada, G.P. “Guanosine hydrogen-bonded
scaffolds: a new way to control the bottom-up realization of well-defined
nanoarchitectures”. Chem. Eur. J. 2009, 15, 7792-7806. 46 Sasisekharan, V.; Zimmerman, S.B.; Davies, D.R. “The structure of helical 5'-
guanosine monophosphate”. J. Mol. Biol. 1975, 92, 171-179. 47 Zimmerman, S.B. “X-ray study by fiber diffraction methods of a self-aggregate of
guanosine-5'-monophosphate with the same helical parameters as poly(rG)”. J. Mol. Biol.
1976, 106, 663-672. 48 Pinnavaia, T.J.; Miles, H.T.; Becker, E.D. “Self-assembly of 5'-GMP – NMR evidence
for a regular, ordered structure and slow chemical exchange”. J. Am. Chem. Soc. 1975,
97(24), 7198-7200.
49 Neurohr, K.L.; Mantsch, H.H. “The self-association of naturally occurring purine
nucleoside 5'-monophosphates in aqueous solution”. Can. J. Chem. 1979, 57(15), 1986-
1994. 50 Fisk, C.L.; Becker, E.D.; Miles, H.T.; Pinnavaia, T.J. “Self-structured guanosine 5'-
phosphate heptahydrate”. J. Am. Chem. Soc. 1982, 104, 3307-3314. 51 Bouhoutsos-Brown, E.; Marshal, C.L.; Pinnavaia, T.J. “Structure-directing properties
of Na+ in the solution ordering of guanosine 5'-monophosphate. Stoichiometry of
aggregation, binding to ethdium, and modes of Na+ complexation”. J. Am. Chem. Soc.
1982, 104, 6576-6584. 52 Walmsley, J.A.; Barr, R.G.; Bouhoutsos-Brown, E.; Pinnavaia, T.J. “Ordered forms of
dianionic guanosine 5'-monophosphate with Na+ as the structure director. 1H and 31P
NMR studies of hydrogen bonding and comparisons of stacked tetramers and stacked
dimmer models”. J. Phys. Chem. 1984, 88, 2599-2605.

166
53 Detellier, C.; Laszlo, P. “Role of alkali metal and ammonium cations in the self-
assembly of the 5'-gunaosine monophosphate dianion”. J. Am. Chem. Soc. 1980, 102(3),
1135-1141. 54 Detellier, C.; Laszlo, P. “Influence of amino acids, ammonium and potassium cations
on the self-assembly of 5'-GMP”. Helvetica Chimica Acta, 1979, 62(5), 1559-1565. 55 Borzo, M.; Detellier, C.; Laszlo, P.; Paris, A. “1H, 23Na, and 31P NMR studies of the
self-assembly of the 5'-guanosine monophosphate dianion in neutral aqueous solution in
the presence of sodium cations”. J. Am. Chem. Soc. 1980, 102(3), 1124-1134. 56 Peterson, S.B.; Led, J.J.; Johnston, E.R.; Grant, D.M.; Detellier, C.; Laszlo, P. “NMR
studies of self-association of disodium guanosine 5'-monophosphate”. J. Am. Chem. Soc.
1982, 104(19), 5007-5015. 57 Led, J.J.; Gesmar, H. “31P magnetization-transfer NMR studies of the interchange
between structures of self-assembled disodium guanosine 5'-monophosphate in solution”.
J. Phys. Chem. 1985, 89, 583-588. 58 Lipanov, A.A.; Quintana, J.; Dickerson, R.E. “Disordered single crystal evidence for a
quadruplex helix formed by guanosine 5'-monophosphate”. J. Biomol. Struct. Dyn. 1990,
8(3), 483-489. 59 Gottarelli, G.; Proni, G.; Spada, G.P. “The self-assembly and lyotropic mesomorphism
of riboguanylic acids (GMP)”. Liquid Crystals, 1997, 22(5), 563-566. 60 Walmsley, J.A.; Burnett, J.F. “A new model for the K+-induced macromolecular
structure of guanosine 5'-monophosphate in solution”. Biochemistry, 1999, 38, 14063-
14068. 61 Wu, G.; Wong, A. “Direct detection of the bound sodium ions in self-assembled 5'-
GMP gels: a solid-state 23Na NMR approach”. Chem. Commun. 2001, 2658-2659. 62 Wu, G.; Wong, A.; Gan, A.; Davis, J.T. “Direct detection of potassium cations bound
to G-quadruplex structures by solid-state 39K NMR at 19.6 T”. J. Am. Chem. Soc. 2003,
125, 7182-7183.

167
63 Wong, A.; Wu, G. “Selective binding of monovalent cations to the stacking G-quartet
structure formed by guanosine 5'-monophosphate: a solid-state NMR study”. J. Am.
Chem. Soc. 2003, 125, 13895-13905. 64 Jurga-Nowak, H.; Banachowicz, E.; Dobek, A.; Patkowski, A. “Supramolecular
guanosine 5'-monophosphate structures in solution. Light scattering study.” J. Phys.
Chem. B. 2004, 108, 2744-2750. 65 Spindler, L.; Drevenšek-Olenik, I.; Čopič, M.; Cerar, J.; Skerjanc, J.; Pariani, P.
“Dynamic light scattering and 31P NMR study of the self-assembly of deoxyguanosine 5'-
monophosphate: the effect of added salt”. Eur. Phys. J. E. 2004, 13, 27-33. 66 Wong, A.; Ida, R.; Spindler, L.; Wu, G. “Disodium guanosine 5'-monophosphate self-
associates into nanoscale cylinders at pH 8: a combined diffusion NMR spectroscopy and
dynamic light scattering study”. J. Am. Chem. Soc. 2005, 127, 6990-6998. 67 (a) Mikkelsen, K.; Nielsen, S.O. “Acidity measurement with the glass electrode in
H2O-D2O mixtures”. J. Phys. Chem. 1960, 64, 632–637. (b) Glasoe, P.K.; Long, F.A.
“Use if glass electrodes to measure acidities in deuterium oxide”. J. Phys. Chem. 1960,
64, 188–190. 68 Van Geet, A.L.“Calibration of methanol nuclear magnetic resonance thermometer at
low temperature”. Anal. Chem. 1970, 42(6), 679-680. 69 Ten Cate, A.T.; Dankers, P.Y.W.; Kooijman, H.; Spek, A.L.; Sijbesma, R.P.; Meijer,
E.W. “Enantioselective cyclization of racemic supramolecular polymers”, J. Am. Chem.
Soc. 2003, 125, 6860-6861. 70 Kohlmann, O.; Steinmetz, W.E.; Mao, X.A.; Wuelfing, W.P.; Templeton, A.C.;
Murray, R.W.; Johnson, C.S. “NMR diffusion, relaxation, and spectroscopic studies of
water soluble, monolayer-protected gold nanoclusters”, J. Phys. Chem. B, 2001, 105,
8801-8809. 71 a) Einstein. A. “Über die von der molekularkinetischen Theorie der Wärme geforderte
Bewegung von in ruhenden Flüssigkeiten suspendierten Teilchen”, Ann. Physik, 1905,

168
322(8), 549-560. b) Stokes, G.G. "On the steady motion of incompressible fluids".
Transactions of the Cambridge Philosophical Society, 1842, 7, 439–453. 72 (a) Tirado, M.M.; Garcia de la Torre, J. “Translational friction coefficients of rigid,
symmetric top macromolecules. Application to circular cylinders”. J. Chem. Phys. 1979,
71, 2581-2587. (b) Tirado, M.M.; Garcia de la Torre, J. “Rotational dynamics of rigid,
symmetric top macromolecules. Application to circular cylinders”. J. Chem. Phys. 1980,
73, 1986-1993. Tirado, M.M.; Lopez Martinez, C.; Garcia de la Torre, J. “Comparison of
theories for the translational and rotational diffusion coefficients of rod-like molecules.
Application to short DNA fragments”. J. Chem. Phys. 1984, 81, 2047-2052. 73 Cho, C.H.; Urquidi, J.; Singh, S.; Wilse Robinson, G. “Thermal offset viscosities of
liquid H2O, D2O, and T2O”. J. Phys. Chem. B. 1999, 103, 1991-1994 74 Figure adopted from www.intermnet.ua.es/inteRMNet/doc/chem843-4.PDF, copyright
by Gerd Gemmecker, 1999 (accessed October 1, 2011). 75 Keeler, J. Understanding NMR Spectrscopy; John Wiley & Sons Ltd: West Sussex,
UK, 2005. 76 Neuhaus, D.; Wagner, G.; Vašák, M.; Kägi, J.H.R.; Wüthrich, K. “Systematic
application of high-resolution, phase-sensitive two-dimensional 1H-NMR techniques for
the identification of the amino-acid-proton spin systems in proteins Rabbit
metallothionein-2”. Eur. J. Biochem. 1985, 151, 257-273. 77 Wijmenga, S.S.; Van Buuren, B.N.M. “The use of NMR methods for conformational
studies of nucleic acids”. Prog. Nucl. Magn. Reson. Spectrosc. 1998, 32, 287-387. 78 Pavia, D.L., Lapman, G.M., Kirz, G.S., and Vyvyan, J.A. Introduction to Spectroscopy,
Brooks/Cole, Cengage Learning: Belmont, USA, 2001. 79 Ippel, J.H.; Wijmenga, S.S.; de Jong, R.; Heus, H.A.; Hilbers, C.W.; de Vroom, E.;
Van der Marel, G.A.; Van Boom, J.H. Magn. Reson. Chem. 1996, 34, S156-S176.
“Heteronuclear scalar couplings in the bases and sugar rings of nucleic acids: their
determination and application in assignment and conformational analysis”

169
80 Phan, A.T. “Through-bond correlation of sugar and base protons in unlabeled nucleic
acids”. J. Magn. Reson. 2001, 153, 223-226. 81 (a) Karplus, M. “Contact electron-spin coupling of nuclear magnetic moments”. J.
Chem. Phys. 1959, 30, 11-15. (b) Karplus, M. “Vicinal proton coupling in nuclear
magnetic resonance”. J. Am. Chem. Soc. 1963, 85, 2870-2871. 82 Lerner, L.E. “Chapter 7: Carbohydrate structures and dynamics from NMR”. In NMR
Spectroscopy and Its Application to Biomedical Research; Sarkar, S.K., Ed.; Elsevier
B.V., 1996; pg. 313-344. 83 Weber, P.L. “Chapter 4: Protein structure determination from NMR data”. In NMR
Spectroscopy and Its Application to Biomedical Research; Sarkar, S.K., Ed.; Elsevier
B.V., 1996; pg. 187-239. 84 Wemmer, D.E. “Chapter 6: Nucleic acid structure and dynamics from NMR”. In NMR
Spectroscopy and Its Application to Biomedical Research; Sarkar, S.K., Ed.; Elsevier
B.V., 1996; pg. 281-312. 85 (a) Becke, A.D. “Density-functional thermochemistry. III. The role of exact
exchange”. J. Chem. Phys. 1993, 98, 5648. (b) Lee, C.; Yang, W.; Parr, R.G.
“Development of the Colle-Salvetti correlation-energy formula into a functional of the
electron density”. Phys. Rev. B, 1988, 37, 785. 86 6-311++G(d,p) basis set reference: H, Li-Ne: Krishnan, R.; Binkley, J.S.; Seeger, R.;
Pople, J.A. J. Chem. Phys. 1980, 72, 650; Na-Ar: McLean, A.D., Chandler , G.S. J.
Chem. Phys. 1980, 72, 5639; K-Ca: Blaudeau, J-P., McGrath, M. P., Curtiss, L.A.,
Radom, L. J. Chem. Phys. 1997, 107, 5016; Ga-Kr: Curtiss, L. A., McGrath, M. P.,
Blandeau, J-P., Davis, N. E., Binning, R. C., Radom, Jr. L. J. Chem. Phys. 1995, 103,
6104; Glukhovstev, M.N., Pross, A., McGrath, M.P., Radom, L. J. Chem. Phys.1995,
103, 1878. 87 Frisch, M.J.; Trucks, G.W.; Schlegel, H.B.; Scuseria, G.E.; Robb, M.A.; Cheeseman, J.
R.; Montgomery Jr., J. A.; Vreven, T.; Kudin, K.N.; Burant, J.C.; Millam, J.M.; Iyengar,
S.S.; Tomasi, J.; Barone, V.; Mennucci, B.; Cossi, M.; Scalmani, G Inorg. Chim. Acta.;

170
Rega, N.; Petersson, G.A.; Nakatsuji, H.; Hada, M.; Ehara, M.; Toyota, K.; Fukuda, R.;
Hasegawa, J.; Ishida, M.; Nakajima, T.; Honda, Y.; Kitao, O.; Nakai, H.; Klene, M.; Li,
X.; Knox, J.E.; Hratchian, H.P.; Cross, J.B.; Bakken, V.; Adamo, C.; Jaramillo, J.;
Gomperts, R.; Stratmann, R.E.; Yazyev, O.; Austin, A.J.; Cammi, R.; Pomelli, C.;
Ochterski, J.; Ayala, P.Y.; Morokuma, K.; Voth, G.A.; Salvador, P.; Dannenberg, J. J.;
Zakrzewski, V.G.; Dapprich, S.; Daniels, A.D.; Strain, M.C.; Farkas, O.; Malick, D.K.;
Rabuck, A.D.; Raghavachari, K.; Foresman, J.B.; Ortiz, J.V.; Cui, Q.; Baboul, A. G.;
Clifford, S.; Cioslowski, J.; Stefanov, B.B.; Liu, G.; Liashenko, A.; Piskorz, P.;
Komaromi, I.; Martin, R.L.; Fox, D.J.; Keith, T.; Al-Laham, M.A.; Peng, C.Y.;
Nanayakkara, A.; Challacombe, M.; Gill, P.M.W.; Johnson, B.G.; Chen, W.; Wong,
M.W.; Gonzalez, C.; Pople, J.A. GAUSSIAN 03 (Revision C.02), Gaussian, Inc.,
Wallingford, CT, 2004. 88 Morin, F.G.; Solum, M.S.; Withers, J.D.; Grant, D.M.; Dalling, D.K.” The temperature
dependence of the magnetic susceptibility and proton and carbon-13 chemical shifts of
tetramethylsilane”. J. Magn. Reson. 1982, 48, 138-142. 89 Altona, C.; Sundaralingan, M. “Conformational analysis of the sugar ring in
nucleosides and nucleotides. A new description using the concept of pseudorotation.” J.
Am. Chem. Soc. 1972, 94, 8205-8212. 90 Wu, G.; Kwan, I.C.M. “Helical structure of disodium 5'-guanosine monophosphate
self-assembly in neutral solution”. J. Am. Chem. Soc. 2009, 131, 3180-3182. 91 Zimmerman, S.B.; Gerson, H.C.; Davies, D.R. “X-ray fiber diffraction and model-
building study of polyguanylic acid and polyinosinic acid”. J. Mol. Biol. 1975, 92, 181-
192. 92 Jeffrey, G.A.; Saenger, W. Hydrogen Bonding in Biological Structures. Springer-
Verlag, Berlin, 1991. 93
Rich, A. “Molecular structure of polyinosinic acid”. Biochim. Biophys. Acta, 1958, 29,
502-509.
171
94 Homer, R.B.; Mason, S.F. “Helix formation by guanosine 5’-phosphate”. Chem.
Commun. 1966, 11, 332-333. 95 Chantot, J. F. “Nucleoside conformation. IX. A calorimetric study of gel formation by
guanylic acids”. Arch. Biochem. Biophys. 1972, 153, 347-356. 96 Gullion, T.; Vega, A. J. “Measuring heteronuclear dipolar couplings for I = 1/2, S > 1/2
spin pairs by REDOR and REAPDOR NMR”. Prog. Nucl. Magn. Reson. Spectrosc.
2005, 47, 123-136. 97 Bak, M.; Rasmussen, J.T.; Nielsen, N.C. “SIMPSON: a general simulation program for
solid-state NMR spectroscopy”. J. Magn. Reson. 2000, 147, 296-330. 98 Rossi, P.; Harbison, G. S. “Calculation of 13C chemical shifts in RNA nucleosides:
structure-13C chemical shift relationships”. J. Magn. Reson. 2001, 151, 1−8.
99 Ohlenschläger, O.; Haumann, S.; Ramachandran, R.; Görlach, M. “Conformational
signatures of 13C chemical shifts in RNA ribose”. J. Biomol. NMR. 2008, 42, 139−142. 100 Katti, S. K.; Seshadri, T. P.; Viswamitra, M. A. “Structure of disodium guanosine 5'-
phosphate heptahydrate”. Acta Crystallogr., Sect. B: Struct. Sci. 1981, B37(10), 1825-31. 101 Tajmir-Riahi, H.-A. “A comparative study of adenylic, guanylic and deoxyguanylic
acids and their sodium salts as solid and in solution: structural information and
conformational features”. Biochim. Biophys. Acta. 1989, 1009, 168-176. 102 Gullion, T.; Schaefer, J. “Rotational-echo double-resonance NMR”. J. Magn. Reson.
1989, 81, 196-200. 103 Wong, A.; Fettinger, J. C.; Forman, S. L.; Davis, J. T.; Wu, G. “The sodium ions
inside a G-quadruplex channel as probed by solid-state 23Na NMR”. J. Am. Chem. Soc.
2002, 124, 742–743. 104 Tikhomirov, G.; Brouwer, D.H.; Myles, A.J.; Bouatra, S.; Fenniri, H. “Elucidation of
hydrogen bonding network of rosette nanotubes by solid-state NMR”. (Manuscript in
preparation, as shown in the 2007-2008 Annual Report of the National Ultrahigh-Field
NMR Facility for solids).

172
105 Delville, A.; Detellier, C.; Laszlo, P. “Determination of the correlation time for a
slowly reorienting spine-3/2 nucleus: binding of Na+ with the 5'-GMP supramolecular
assembly”. J. Magn. Reson. 1979, 34, 301-315. 106 Wong, A.; Ida, R.; Wu, G. “Direct NMR detection of “invisible” alkali metal cations
tightly bound to G-quadruplex structures”. Biochem. Biophys. Res. Commun. 2005, 337,
363-366. 107 Ida, R.; Wu, G. “Direct NMR detection of alkali metal ions bound to G-quadruplex
DNA”. J. Am. Chem. Soc. 2008, 130, 3590-3602. 108 Zhang, B.; Cui, Z.; Sun, L. “Synthesis of 5'-Deoxy-5'-thioguanosine-5'-
monophosphorothioate and its incorporation into RNA 5'-termini”. Org. Lett. 2001, 3,
275-278. 109 Jang, Y.H.; Goddard III, W.A.; Noyes, K.T.; Sowers, L.C.; Hwang, S.; Chung, D.S.
“pKa values of guanine in water: density functional theory calculations combined with
Poisson-Boltzmann Continuum-Solvation model”. J. Phys. Chem. B. 2003, 107, 344-357. 110 Kwan, I.C.M.; Delley, R.J.; Hodgson, D.R.W.; Wu, G. “Single atom modification
leads to enhanced nucleotide self-assembly: the role of cation bridging”. Chem. Commun.
2011, 47, 3882-3884. 111 Hightower, J.B.; Olmos, D.R.; Walmsley, J.A. “Supramolecular structure and
polymorphism of alkali metal salts of guanosine 5'-monophosphate: SEM and NMR
study”. J. Phys. Chem. B. 2009, 113(36), 12214-12219. 112 Neidle, S.; Balasubramanian, S. Ed. Quadruplex Nucleic Acids; Royal Society of
Chemistry, Cambridge: UK, 2006. 113 Marlow, A.L.; Mezzina, E.; Spada, G.P.; Masiero, S.; Davis, J.T.; Gottarelli, G.
“Cation-templated self-assembly of a lipophilic deoxyguanosine: solution structure of a
K+-dG8 octamer”. J. Org. Chem. 1999, 64, 5116-5123. 114 Gottarelli, G.; Masiero, S.; Spada, G. P. “Self-assembly in organic solvents of a
deoxyguanosine derivative induced by alkali metal picrates”. Chem. Commun. 1995, 24,
2555-2557.

173
115 Sessler, J. L.; Sathiosatham, M.; Doerr, K.; Lynch, V.; Abboud, K.A. “A G-quartet
formed in the absence of a templating metal cation: A New 8-(N,Ndimethylaniline)
guanosine derivative”. Angew. Chem., Int. Ed.. 2000, 39, 1300–1303. 116 Kotch, F.W.; Sidorov, V.; Kayser, K.; Lam, Y. F.; Kaucher, M.S.; Li, H.; Davis, J.T.
“Water-mediated association provides an ion pair receptor”. J. Am. Chem. Soc. 2003,
125, 15140– 15150. 117 Otero, R.; Schock, M.; Molina, L.M.; Laegsgaard, E.; Strensgaard, I.; Hammer, B.;
Besenbacher, F. “Guanine quartet networks stabilized by cooperative hydrogen bonds”.
Angew. Chem., Int. Ed.. 2005, 44, 2270–2275. 118 Hud, N.V. Ed. Nucleic Acid-Metal Ion Interactions; Royal Society of Chemistry,
Cambridge: UK, 2009. 119 Kwan, I.C.M.; She, Y.-M.; Wu, G. “Trivalent lanthanide metal ions promote
formation of stacking G-quartets”. Chem. Commun. 2007, 4286. 120 Toehl, J.; Eimer, W. “Interaction of a G-DNA quadruplex with mono- and divalent
cations. A force field calculation”. Biophys. Chem. 1997, 67(1-3), 177-186. 121 (a) Miyoshi, D.; Nakao, A.; Toda, T.; Sugimoto, N. “Effect of divalent cations on
antiparallel G-quartet structure of d(G4T4G4)”. FEBS Lett. 2001, 496(2,3), 128-133. (b)
Miyoshi, D.; Nakao, A.; Sugimoto, N. “Structural transition from antiparallel to parallel
G-quadruplex of d(G4T4G4) induced by Ca2+ ”. Nucleic Acids Res. 2003, 31(4), 1156-
1163. (c) Miyoshi, D.; Matsumura, S.; Li, W.; Sugimoto, N. “Structural polymorphism of
telomeric DNA regulated by pH and divalent cation”. Nucleosides Nucleotide Nucleic
Acid. 2003, 22(2), 203-221. 122 Lee, M.P.H.; Parkinson, G.N.; Hazel, P.; Neidle, S. “Observation of the coexistence of
sodium and calcium ions in a DNA G-quadruplex ion channel”. J. Am. Chem. Soc. 2007,
129, 10106-10107. 123 Van Leeuwen, F.W.B.; Davis, J.T.; Verboom, W.; Reinhoudt, D.N. “Non-covalent
(iso)guanosine-based ionophores for alkali(ne earth) cations”. Inorg. Chim. Acta, 2006,
359(6), 1779-1785.

174
124 Kwan, I.C.M.; She, Y.-M.; Wu, G. “Nuclear magnetic resonance and mass
spectrometry studies of 2',3',5'-O-triacetylguanosine self-assembly in the presence of
alkaline earth metal ions (Ca2+, Sr2+, Ba2+). Can. J. Chem. 2011, 89, 835-844. 125 Kwan, I.C.M.; Wong, A.; She, Y.-M.; Smith, M. E.; Wu, G. “Direct NMR evidence
for Ca2+ ion binding to G-quartets”. Chem. Commun, 2008, 682. 126 Sadlej, A.J. “Medium-size polarized basis sets for high-level-correlated calculations of
molecular electric properties. IV. Third-row atoms: Ge through Br”. Theor. Chim. Acta,
1992, 81, 45–63. 127 Kwan, I.C.M. “Nuclear magnetic resonance and computational studies of cation-
directed self-assembly of guanosine derivatives”. M.Sc. thesis, Queen’s University,
Kingston, ON, Canada. 2007. 128 Fukushima, K.; Iwahashi, H. “Complex of guanine quartet with alkali metal cations
detected by electrospray ionization mass spectrometry”. Chem. Commun. 2000, 895–896. 129 (a) Laughlan, G.; Murchie, A.I.H.; Norman, D.G.; Moore, M.H.; Moody, P.C.E.;
Lilley, D.M.J.; Luisi, B. “The high-resolution crystal structure of a parallel-stranded
guanine tetraplex”. Science. 1994, 265, 520–524. (b) Phillips, K.; Dauter, Z.; Murchie,
A.I.H.; Lilley, D.M.J.; Luisi, B. “The crystal structure of a parallel-stranded guanine
tetraplex at 0.95 Å resolution”. J. Mol. Biol. 1997, 273, 171–182. 130 Horvath, M.P.; Schultz, S.C. “DNA G-quartets in a 1.86 Å resolution structure of an
oxytricha nova telomeric protein-DNA complex”. J. Mol. Biol. 2001, 310, 367–377. 131 Shannon, R.D. “Revised effective ionic radii and systematic studies of interatomic
distances in halides and chalcogenides”. Acta Crystallogr., Sect. A: Cryst. Phys., Diffr.,
Theor. Gen. Cryst., 1976, 32, 751–767. 132 Kato, D.; Shimoda, K. “Fluorescence spectrum of Tb3+ in the POCl3
.SnCl4 liquid”,
Japan J. Appl. Phys. 1970, 9, 581-582. 133 Kaucher, M.S.; Lam, Y.-F.; Pieraccini, S.; Gottarelli, G.; Davis, J.T. “Using diffusion
NMR to characterize guanosine self-association: insights into structure and mechanism”.
Chem. Eur. J. 2005, 11, 164-173.

175
134 Smith, M.E. “Recent progress in solid-state NMR of low-γ nuclei”. Annu. Rep. NMR
Spectrosc. 2001, 43, 121–175. 135 Bryant, R.G. “Nuclear magnetic resonance study of calcium-43”. J. Am. Chem. Soc.
1969, 91(7), 1870-1871. 136 Organic: (a) Drakenberg, T. “Calcium-43 NMR relaxation times and quadrupole
coupling constants for some small calcium complexes”. Acta Chem. Scand. Ser. A. 1982,
A36(1), 79-92. (b) Bryant, R.G.; Ganapathy, S.; Kennedy, S.D. “High-resolution calcium-
43 NMR in solids”. J. Magn. Reson. 1987, 72(2), 376-378. (c) Bouhoutsos-Brown, E.;
Murk Rose, D.; Bryant, R.G. “High resolution alkaline earth NMR”. J. Inorg. Nucl.
Chem. 1981, 43(10), 2247-2248. (d) Wong, A.; Laurencin, D.; Wu, G.; Dupree, R.;
Smith, M.E. “An Ab Initio Quantum Chemical Investigation of 43Ca NMR Interaction
Parameters for the Ca2+ Sites in Organic Complexes and in Metalloproteins”. J. Phys.
Chem. A. 2008, 112(40), 9807-9813. (e) Laurencin, D.; Gervais, C.; Wong, A.; Coelho,
C.; Mauri, F.; Massiot, D.; Smith, M.E.; Bonhomme, C. “Implementation of high
resolution 43Ca solid state NMR spectroscopy: toward the elucidation of calcium sites in
biological materials”. J. Am. Chem. Soc. 2009, 131(37), 13430. (f) Pallagi, A.; Sebok, P.;
Forgo, P.; Jakusch, T.; Palinko, I.; Sipos, P. “Multinuclear NMR and molecular modelling
investigations on the structure and equilibria of complexes that form in aqueous solutions of Ca2+
and gluconate”. Carbohy. Res. 2010, 345(13), 1856-1864. (g) Pallagi, A.; Dudas, C.; Csendes,
Z.; Forgo, P.; Palinko, I.; Sipos, P. “Structure and equilibria of Ca2+-complexes of
glucose and sorbitol from multinuclear (1H, 13C and 43Ca) NMR measurements
supplemented with molecular modeling calculations”. J. Mol. Struct. 2011, 993(1-3),
336-340. 137 Biological compounds: (a) Wong, A.; Howes, A.P.; Dupree, R.; Smith, M.E. “Natural
abundance 43Ca NMR study of calcium-containing organic solids: A model study for Ca-
binding biomaterials”. Chem. Phys. Lett. 2006, 427, 201-205. (b) Xu, J.; Zhu, P.; Gan, Z.;
Sahar, N.; Tecklenburg, M.; Morris, M.D.; Kohn, D.H.; Ramamoorthy, A. “Natural-
abundance 43Ca solid-state NMR spectroscopy of bone”. J. Am. Chem. Soc. 2010,

176
132(33), 11504-11509. (c) Laurencin, D.; Wong, A.; Chrzanowski, W.; Knowles, J.C.;
Qiu, D.; Pickup, D.M.; Newport, R.J.; Gan, Z.; Duer, M.J.; Smith, M.E. “Probing the
calcium and sodium local environment in bones and teeth using multinuclear solid state
NMR and X-ray absorption spectroscopy”. Phys. Chem. Chem. Phys. 2010, 12(5), 1081-
1091. 138 Metalloproteins: (a) Parello, J.; Lilja, H.; Cave, A.; Lindman, B. “A calcium-43 NMR
study of the binding of calcium to parvalbumins” FEBS Lett. 1978, 87, 191–195. (b)
Andersson, T.; Drakenberg, T.; Forsen, S.; Wieloch, T.; Lindstrom, M. “Calcium binding
to porcine pancreatic prophospholipase A2 studied by calcium-43 NMR”. FEBS Lett.
1981, 123, 115–117. (c) Andersson, T.; Drakenberg, T.; Forsen, S.; Thulin, E.; Swaerd,
M. “Direct observation of the calcium-43 NMR signals from calcium(2+) bound to
proteins”. J. Am. Chem. Soc. 1982, 104, 576–580. (d) Shimizu, T.; Hatano, M.; Nagao,
S.; Nozawa, Y. “Calcium-43 NMR studies of calcium(2+)-tetrahymena calmodulin
complexes”. Biochem. Biophys. Res. Commun. 1982, 106, 1112–1118. (e) Svaerd, M.;
Drakenberg, T.; Anderson, T.; Fernlund, P. “Calcium binding to bone γ-carboxyglutamic
acid protein from calf studied by calcium-43 NMR”. Eur. J. Biochem. 1986, 158(2), 373-
378. (f) Drakenberg, T.; Andersson, T.; Forsen, S.; Wieloch, T. “Calcium ion binding to
pancreatic phospholipase A2 and its zymogen: a calcium-43 NMR study”. Biochemistry.
1984, 23(11), 2387-2392. (g) Vogel, H.J.; Braunlin, W.H. “Shift reagents for calcium-43
NMR studies of calcium-binding proteins”. J. Magn. Reson, 1985, 62(1), 42-53. h)
Ogoma, Y.; Shimizu, T.; Hatano, M.; Fujii, T.; Hachimori, A.; Kondo, Y. “Calcium-43
nuclear magnetic resonance spectra of calcium(2+)-S100 protein solutions”. Inorg. Chem.
1988, 27(11), 1853-1855. (h) Shimizu, T.; Hatano, M. “Calcium-43 nuclear magnetic
resonance of calcium(2+)-calmodulin solutions: effects of trifluoperazine and peptides”.
Inorganica Chimica Acta, 1988, 152(4), 257-260. (i) Martin, S.R.; Linse, S.; Johansson,
C.; Bayley, P.M.; Forsen, S.“Protein surface charges and Ca2+ binding to individual sites
in calbindin D9k: stopped-flow studies”. Biochemistry. 1990, 29, 4188–4193. (j)
Aramini, J.M.; Drakenberg, T.; Hiraoki, T.; Ke, Y.; Nitta, K.; Vogel, H.J. “Calcium-43

177
NMR studies of calcium-binding lysozyms and α-lactalbumins”. Biochemistry. 1992, 31,
6761–6768. (k) Ogoma, Y.; Kobayashi, H.; Fuiji, T.; Kondo, Y.; Hachimori, A.; Shimizu,
T.; Hatano, M. “Binding study of metal ions of S100 protein: calcium-43, magnesium-25,
zinc-65 and potassium-29 NMR”. Int. J. Biol. Macromol. 1992, 14(5), 279-286. (l)
Wahlgren, N.; Dejmek, M.D.P.; Drakenberg, T. “ Binding of magnesium and calcium to
β-casein A1: a multi-nuclear magnetic resonance study”. J. Dairy Res. 1993, 60(1), 65-
78. (m) Malmendal, A.; Linse, S.; Evenas, J.; Forsen, S.; Drakenberg, T. “Battle for the
EF-Hands: Magnesium-calcium interference in calmodulin”. Biochemistry. 1999, 38(36),
11844-11850. (n) Ambrus, A.; Banyai, I.; Weiss, M.S.; Hilgenfeld, R.; Keresztessy, Z.;
Muszbek, L.; Fesus, L. “calcium binding of transglutaminases: a 43Ca NMR study
combined with surface polarity analysis”. J. Biomol. Struct. Dyn. 2001, 19(1), 59-74. 139 Salts: (a) Jacquinot, J.F.; Wenckebach, W.T.; Goldman, M.; Abragam, A.
“Polarization and NMR observation of calcium-43 nuclei in calcium fluoride”. Phys. Rev.
Lett. 1974, 32(20), 1096-1097. (b) Farmer, R.M.; Popov, A.I. “Calcium-43 NMR study of
calcium salts in various solvents”. Inorg. Nucl. Chem. Lett. 1981, 123(1), 115-117. 140 Cement: (a) Zanni, H.; Rassem-Bertolo, R.; Masse, S.; Fernandez, L.; Nieto, P.;
Bresson, B. “A spectroscopic NMR investigation of the calcium silicate hydrates present
in cement and concrete”. Magn. Reson. Imaging, 1996, 14(7/8), 827-831. (b) Bowers,
G.M.; Kirkpatrick, R.J. “Natural abundance 43Ca NMR spectroscopy of tobermorite and
jennite: model compounds for C-S-H”. J. Am. Chem. Soc. 2009, 92(2), 545-548. 141 Glass: (a) Angeli, F.; Gaillard, M.; Jollivet, P.; Charpentier, T. “Contribution of 43Ca
MAS NMR for probing the structural configuration of calcium in glass”. Chem. Phys.
Lett. 2007, 440 (4-6), 324-328. (b) Shimoda, K.; Tobu, Y.; Kanehashi, K.; Saito, K.;
Nemoto T. “First evidence of multiple Ca sites in amorphous slag structure. Multiple-
quantum MAS NMR spectroscopy on calcium-43 at high magnetic field”. Solid State
Nucl. Mag. 2006, 30, 198. 142 Superconductors: (a) Trokiner, A.; Le Noc, L.; Yakubovskii, A.; Mykhalyov, K.N.;
Verkhovskii, S.V. “The 43Ca NMR study of bismuth-based high-Tc superconductor”. Z.

178
Naturforsch A. 1994, 49(102), 373-378. (b) Bellot, P.-V.; Trokiner, A.; Zhdanov, Y.;
Yakubovskii, A. “43Ca NMR in solid state”. J. Chim. Phys. PCB, 1998, 95(2), 280-288.
(c) Marchand, S.; Trokiner, A.; Yakubovskii, A.; Monod, P.; Knizhnik, A.; Eckstein, Y.
“43Ca NMR study of the doping effects in the high temperature superconductor (La1-
xCax)(Ba1.75-xLa0.25+x)Cu30y”. Cr. Acad. Sci. II C. 2001, 4(11), 819-824. 143 (Hydroxyl)apatite: (a) Sahai, N.; Tossell, J.A. “Molecular orbital study of apatite
(Ca5(PO4)3OH) nucleation at silica bioceramic surfaces”. J. Phys. Chem. B. 2000,
104(18), 4322-4341. (b) Laurencin, D.; Wong, A.; Dupree, R.; Smith, M.E. “Natural
abundance 43Ca solid-state NMR characterization of hydroxyapatite: identification of the
two calcium sites”. Magn. Reson. Chem. 2008, 46(4), 347-350. (c) Wong, A.; Laurencin,
D.; Dupree, R.; Smith, M.E. “Two dimensional 43Ca-1H correlation solid-state NMR
spectroscopy”, Solid State Nucl. Mag., 2009, 35(1), 32-36. 144 Nucleic acids: (a) Braunlin, W.H.; Drakenberg, T.; Nordenskioeld, L. “A calcium-43
NMR study of calcium(II)-DNA interactions”. Biopolymers. 1987, 26(7), 1047-1062. (b)
Braunlin, W.H.; Nordenskioeld, L.; Drakenberg, T. “The interaction of calcium(II) with
DNA probed by calcium-43 NMR is not influenced by terminal phosphate groups at ends
and nicks”. Biopolymers. 1989, 28(7), 1339-1342. (c) Braunlin, W.H.; Drakenberg, T.;
Nordenskioeld, L. “Calcium binding environments on natural and synthetic polymeric
DNA’s”. J. Biomol. Struct. Dyn. 1992, 10(2), 333-343. 145 Inorganics: (a) Bryant, R.G.; Ganapathy, S.; Kennedy, S.D. “High-resolution calcium-
43 NMR in solids”. J. Magn. Reson. 1987, 72, 376–378. (b) Lin, Z.; Smith, M.E.;
Sowrey, P.E.; Newport, R.J. “Probing the local structural envieonment of calcium by
natural-abundance solid-state 43Ca NMR”. Phys. Rev. B: Condens. Matter Mater. Phys.
2004, 69(22), 224107/1-224107/7. (c) Dupree, R.; Howes, A.P.; Kohn, S.C. “Natural
abundance solid state 43Ca NMR”. Chem. Phys. Lett. 1997, 276, 399–404. (d) Trokiner,
A.; Bessière, A.; Thouvenot, R.; Hau, D.; Marko, J.; Nardello, V.; Pierlot, C.; Aubry, J.-
M. “Solid state and solution 43Ca NMR of calcium peroxides involved in the
disproportionation of hydrogen peroxide by calcium hydroxide”. Solid State Nucl. Magn.
179
Reson. 2004, 25, 209. (e) Padro, D.; Jennings, V.; Smith, M.E.; Hoppe, R.; Thomas, P.A.;
Dupree, R. Variations of titanium interactions in solid state NMR-correlations to local
structure”. J. Phys. Chem. B. 2002, 106, 13176. (f) MacKenzie, K.J.D.; Schmucker, M.;
Smith, M.E.; Poplett, I.J.F.; Kemmitt, T. “Evolution of crystalline aluminates from hybrid
gel-derived precursors studied by XRD and multinuclear solid state MAS NMR IV:
Calcium dialuminate, CaAl4O7 and calcium hexaluminate, CaAl12O19”. Thermochim.
Acta, 2000, 363, 181. (g) MacKenzie, K.J.D.; Smith, M.E.; Wong, A. “A multinuclear
MAS NMR study of calcium-containing aluminosilicate inorganic polymers”. J. Mater.
Chem. 2007, 17, 5090. (h) Gervais, C.; Laurencin, D.; Wong, A.; Pourpoint, F.; Labram,
J.; Woodward, B.; Howes, A.P.; Pike, K.J.; Dupree, R.; Mauri, F.; Christian, B.; Smith,
M.E. “New Perspectives on calcium environments in inorganic materials containing
calcium-oxygen bonds: A combined computational-experimental 43Ca NMR approach”.
Chem. Phys. Lett. 2008, 464(103), 42-48. 146 Reviews: (a) Forsen, S.; Johansson, C.; Linse, S. “Calcium nuclear magnetic
resonance”. Method Enzymol. 1993, 227 (Metallobiochemistry, Pt. D), 107-118. (b)
Aramini, J. M.; Vogel, H. J. “Quadrupolar metal ion NMR studies of metalloproteins”.
Biochem. Cell Biol. 1998, 76(2/3), 210-222. (c) Drakenberg, T. “Calcium-43 NMR of
calcium-binding proteins”. Methods Mol. Biol. (Totowa, NJ, US). 2002, 173, 217–230. 147 Wong, A.; Agular, P.M.; Charpentier, T.; Sakellariou, D. “A low-cost strategy for 43Ca solid-state NMR spectroscopy”. Chem. Sci. 2011, 2(4), 815-818. 148 Bryce, D. L. “Calcium binding environments probed by 43Ca NMR spectroscopy”.
Dalton Trans. 2010, 39(37), 8593-8602. 149 Shi, X.; Fettinger, J. C.; Davis, J. T. “Enantiomeric Self-Recognition: Cation-
Templated Formation of Homochiral Isoguanosine Pentamers”. Angew. Chem. Int. Ed.
2001, 40, 2827–2831. 150 Akhshi, P.; Mosey, N.J.; Wu, G. “Free-energy landscapes of ion movement through a
G-quadruplex DNA channel”. Angew. Chem. Int. Ed., 2012, 51, 2850-2854.

180
Appendix I: (Chapter 2)
Coordinates of the all-S and all-N G-quartets and channel Na+ ions used in building the
final Na2(5'-GMP) G-quadruplex. Table 1 lists all proton-proton distances in the G-
quadruplex including those observed in DOSY-NOESY and NOESY.
The following equations are used to build the 5'-GMP G-quadruplex:
x' = x(cosφ) – y(sinφ)
y' = y(cosφ) + x(sinφ)
z' = z + 6.8,
where x, y are the original coordinates from the calculated models, and φ is the twist
angle (90°, 180°, and 270°) used in making a single all-S or all-N G-quartet. When
building the stacking G-quadruplex, the next all-S layer is twisted 60° and 6.8 Å away
from the previous all-S layer because of alternating all-S and all-N stacking. The same
rules also apply to all-N quartets when stacking.
All-S (C2'-endo) quartet HETATM 1 N 1 -2.194 -2.888 -19.843 N
HETATM 2 H 1 -2.460 -1.893 -19.843 H
HETATM 3 C 1 -3.216 -3.824 -19.843 C
HETATM 4 N 1 -4.453 -3.323 -19.843 N
HETATM 5 H 1 -4.594 -2.303 -19.843 H
HETATM 6 H 1 -5.265 -3.956 -19.843 H
HETATM 7 N 1 -3.010 -5.140 -19.843 N
HETATM 8 C 1 -1.677 -5.436 -19.843 C
HETATM 9 C 1 -0.608 -4.589 -19.843 C
HETATM 10 C 1 -0.827 -3.193 -19.843 C
HETATM 11 O 1 0.000 -2.280 -19.843 O
HETATM 12 N 1 0.591 -5.307 -19.843 N
HETATM 13 C 1 0.199 -6.557 -19.843 C
HETATM 14 H 1 0.814 -7.293 -19.843 H
HETATM 15 N 1 -1.170 -6.728 -19.843 N
HETATM 16 H 1 -3.219 -11.099 -19.569 H
HETATM 17 O 1 -2.185 -11.216 -19.562 O
HETATM 18 C 1 -1.600 -10.187 -18.776 C
HETATM 19 C 1 -2.567 -9.288 -17.969 C
HETATM 20 C 1 -0.902 -9.118 -19.633 C

181
HETATM 21 H 1 -0.937 -10.560 -18.189 H
HETATM 22 C 1 -2.013 -9.032 -16.575 C
HETATM 23 O 1 -2.689 -8.016 -18.634 O
HETATM 24 H 1 -3.429 -9.707 -17.926 H
HETATM 25 C 1 -1.912 -7.976 -19.811 C
HETATM 26 O 1 -0.494 -9.728 -20.846 O
HETATM 27 H 1 -0.137 -8.776 -19.165 H
HETATM 28 O 1 -0.595 -8.807 -16.623 O
HETATM 29 H 1 -2.446 -8.264 -16.195 H
HETATM 30 H 1 -2.199 -9.788 -16.013 H
HETATM 31 H 1 -2.474 -8.083 -20.582 H
HETATM 32 H 1 0.376 -9.340 -21.171 H
HETATM 33 P 1 0.249 -9.258 -15.306 P
HETATM 34 O 1 1.127 -8.109 -14.869 O
HETATM 35 O 1 1.123 -10.458 -15.577 O
HETATM 36 O 1 -0.645 -9.666 -14.134 O
HETATM 37 N 1 2.888 -2.194 -19.843 N
HETATM 38 H 1 1.893 -2.460 -19.843 H
HETATM 39 C 1 3.824 -3.216 -19.843 C
HETATM 40 N 1 3.323 -4.453 -19.843 N
HETATM 41 H 1 2.303 -4.594 -19.843 H
HETATM 42 H 1 3.956 -5.265 -19.843 H
HETATM 43 N 1 5.140 -3.010 -19.843 N
HETATM 44 C 1 5.436 -1.677 -19.843 C
HETATM 45 C 1 4.589 -0.608 -19.843 C
HETATM 46 C 1 3.193 -0.827 -19.843 C
HETATM 47 O 1 2.280 0.000 -19.843 O
HETATM 48 N 1 5.307 0.591 -19.843 N
HETATM 49 C 1 6.557 0.199 -19.843 C
HETATM 50 H 1 7.293 0.814 -19.843 H
HETATM 51 N 1 6.728 -1.170 -19.843 N
HETATM 52 H 1 11.099 -3.219 -19.569 H
HETATM 53 O 1 11.216 -2.185 -19.562 O
HETATM 54 C 1 10.187 -1.600 -18.776 C
HETATM 55 C 1 9.288 -2.567 -17.969 C
HETATM 56 C 1 9.118 -0.902 -19.633 C
HETATM 57 H 1 10.560 -0.937 -18.189 H
HETATM 58 C 1 9.032 -2.013 -16.575 C
HETATM 59 O 1 8.016 -2.689 -18.634 O
HETATM 60 H 1 9.707 -3.429 -17.926 H
HETATM 61 C 1 7.976 -1.912 -19.811 C
HETATM 62 O 1 9.728 -0.494 -20.846 O
HETATM 63 H 1 8.776 -0.137 -19.165 H
HETATM 64 O 1 8.807 -0.595 -16.623 O
HETATM 65 H 1 8.264 -2.446 -16.195 H
HETATM 66 H 1 9.788 -2.199 -16.013 H

182
HETATM 67 H 1 8.083 -2.474 -20.582 H
HETATM 68 H 1 9.340 0.376 -21.171 H
HETATM 69 P 1 9.258 0.249 -15.306 P
HETATM 70 O 1 8.109 1.127 -14.869 O
HETATM 71 O 1 10.458 1.123 -15.577 O
HETATM 72 O 1 9.666 -0.645 -14.134 O
HETATM 73 N 1 2.194 2.888 -19.843 N
HETATM 74 H 1 2.460 1.893 -19.843 H
HETATM 75 C 1 3.216 3.824 -19.843 C
HETATM 76 N 1 4.453 3.323 -19.843 N
HETATM 77 H 1 4.594 2.303 -19.843 H
HETATM 78 H 1 5.265 3.956 -19.843 H
HETATM 79 N 1 3.010 5.140 -19.843 N
HETATM 80 C 1 1.677 5.436 -19.843 C
HETATM 81 C 1 0.608 4.589 -19.843 C
HETATM 82 C 1 0.827 3.193 -19.843 C
HETATM 83 O 1 0.000 2.280 -19.843 O
HETATM 84 N 1 -0.591 5.307 -19.843 N
HETATM 85 C 1 -0.199 6.557 -19.843 C
HETATM 86 H 1 -0.814 7.293 -19.843 H
HETATM 87 N 1 1.170 6.728 -19.843 N
HETATM 88 H 1 3.219 11.099 -19.569 H
HETATM 89 O 1 2.185 11.216 -19.562 O
HETATM 90 C 1 1.600 10.187 -18.776 C
HETATM 91 C 1 2.567 9.288 -17.969 C
HETATM 92 C 1 0.902 9.118 -19.633 C
HETATM 93 H 1 0.937 10.560 -18.189 H
HETATM 94 C 1 2.013 9.032 -16.575 C
HETATM 95 O 1 2.689 8.016 -18.634 O
HETATM 96 H 1 3.429 9.707 -17.926 H
HETATM 97 C 1 1.912 7.976 -19.811 C
HETATM 98 O 1 0.494 9.728 -20.846 O
HETATM 99 H 1 0.137 8.776 -19.165 H
HETATM 100 O 1 0.595 8.807 -16.623 O
HETATM 101 H 1 2.446 8.264 -16.195 H
HETATM 102 H 1 2.199 9.788 -16.013 H
HETATM 103 H 1 2.474 8.083 -20.582 H
HETATM 104 H 1 -0.376 9.340 -21.171 H
HETATM 105 P 1 -0.249 9.258 -15.306 P
HETATM 106 O 1 -1.127 8.109 -14.869 O
HETATM 107 O 1 -1.123 10.458 -15.577 O
HETATM 108 O 1 0.645 9.666 -14.134 O
HETATM 109 N 1 -2.888 2.194 -19.843 N
HETATM 110 H 1 -1.893 2.460 -19.843 H
HETATM 111 C 1 -3.824 3.216 -19.843 C
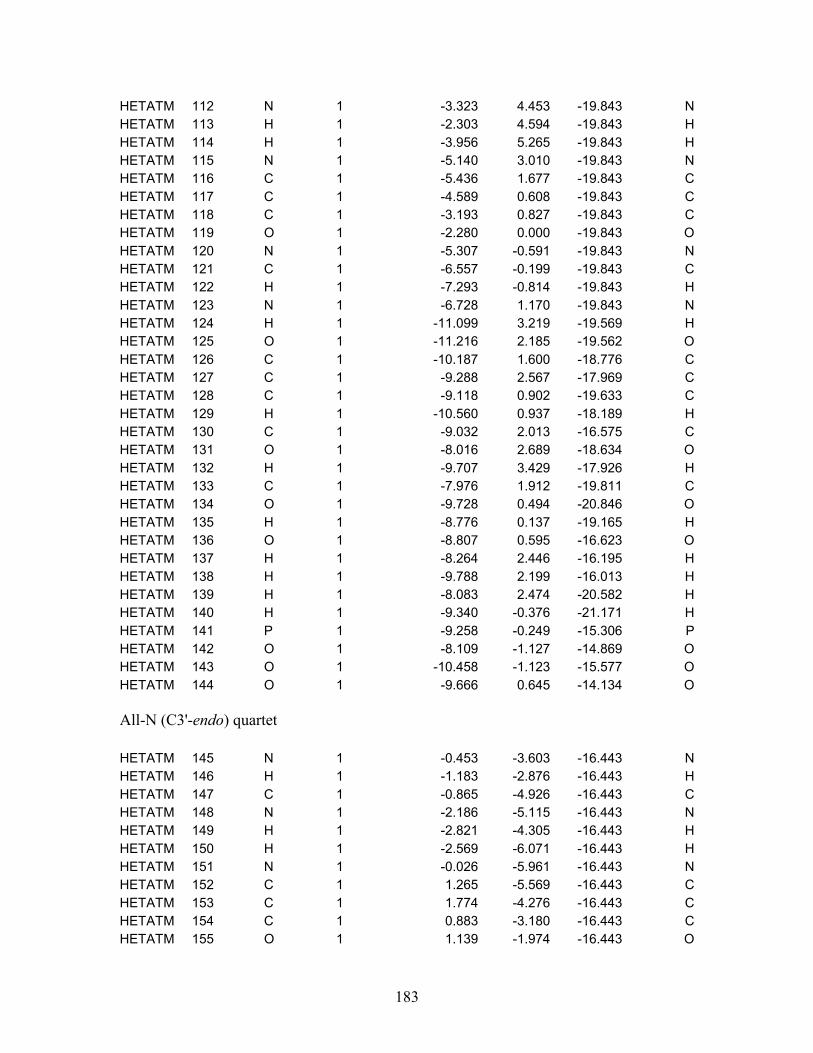
183
HETATM 112 N 1 -3.323 4.453 -19.843 N
HETATM 113 H 1 -2.303 4.594 -19.843 H
HETATM 114 H 1 -3.956 5.265 -19.843 H
HETATM 115 N 1 -5.140 3.010 -19.843 N
HETATM 116 C 1 -5.436 1.677 -19.843 C
HETATM 117 C 1 -4.589 0.608 -19.843 C
HETATM 118 C 1 -3.193 0.827 -19.843 C
HETATM 119 O 1 -2.280 0.000 -19.843 O
HETATM 120 N 1 -5.307 -0.591 -19.843 N
HETATM 121 C 1 -6.557 -0.199 -19.843 C
HETATM 122 H 1 -7.293 -0.814 -19.843 H
HETATM 123 N 1 -6.728 1.170 -19.843 N
HETATM 124 H 1 -11.099 3.219 -19.569 H
HETATM 125 O 1 -11.216 2.185 -19.562 O
HETATM 126 C 1 -10.187 1.600 -18.776 C
HETATM 127 C 1 -9.288 2.567 -17.969 C
HETATM 128 C 1 -9.118 0.902 -19.633 C
HETATM 129 H 1 -10.560 0.937 -18.189 H
HETATM 130 C 1 -9.032 2.013 -16.575 C
HETATM 131 O 1 -8.016 2.689 -18.634 O
HETATM 132 H 1 -9.707 3.429 -17.926 H
HETATM 133 C 1 -7.976 1.912 -19.811 C
HETATM 134 O 1 -9.728 0.494 -20.846 O
HETATM 135 H 1 -8.776 0.137 -19.165 H
HETATM 136 O 1 -8.807 0.595 -16.623 O
HETATM 137 H 1 -8.264 2.446 -16.195 H
HETATM 138 H 1 -9.788 2.199 -16.013 H
HETATM 139 H 1 -8.083 2.474 -20.582 H
HETATM 140 H 1 -9.340 -0.376 -21.171 H
HETATM 141 P 1 -9.258 -0.249 -15.306 P
HETATM 142 O 1 -8.109 -1.127 -14.869 O
HETATM 143 O 1 -10.458 -1.123 -15.577 O
HETATM 144 O 1 -9.666 0.645 -14.134 O
All-N (C3'-endo) quartet HETATM 145 N 1 -0.453 -3.603 -16.443 N
HETATM 146 H 1 -1.183 -2.876 -16.443 H
HETATM 147 C 1 -0.865 -4.926 -16.443 C
HETATM 148 N 1 -2.186 -5.115 -16.443 N
HETATM 149 H 1 -2.821 -4.305 -16.443 H
HETATM 150 H 1 -2.569 -6.071 -16.443 H
HETATM 151 N 1 -0.026 -5.961 -16.443 N
HETATM 152 C 1 1.265 -5.569 -16.443 C
HETATM 153 C 1 1.774 -4.276 -16.443 C
HETATM 154 C 1 0.883 -3.180 -16.443 C
HETATM 155 O 1 1.139 -1.974 -16.443 O

184
HETATM 156 N 1 3.172 -4.294 -16.443 N
HETATM 157 C 1 3.462 -5.571 -16.443 C
HETATM 158 H 1 4.365 -5.898 -16.443 H
HETATM 159 N 1 2.365 -6.407 -16.443 N
HETATM 160 C 1 2.297 -7.916 -16.433 C
HETATM 161 H 1 1.396 -8.192 -16.254 H
HETATM 162 C 1 2.782 -8.566 -17.728 C
HETATM 163 H 1 2.675 -7.988 -18.486 H
HETATM 164 C 1 4.249 -8.840 -17.417 C
HETATM 165 H 1 4.754 -8.029 -17.511 H
HETATM 166 C 1 4.193 -9.236 -15.961 C
HETATM 167 H 1 3.931 -10.157 -15.890 H
HETATM 168 C 1 5.484 -9.008 -15.163 C
HETATM 169 H 1 5.416 -8.191 -14.665 H
HETATM 170 H 1 6.226 -8.930 -15.767 H
HETATM 171 O 1 3.158 -8.395 -15.389 O
HETATM 172 O 1 2.067 -9.782 -17.878 O
HETATM 173 H 1 1.685 -10.081 -16.947 H
HETATM 174 O 1 4.822 -9.862 -18.233 O
HETATM 175 H 1 4.734 -9.595 -19.235 H
HETATM 176 O 1 5.703 -10.107 -14.266 O
HETATM 177 O 1 7.975 -9.954 -13.108 O
HETATM 178 O 1 6.264 -8.390 -12.435 O
HETATM 179 O 1 6.115 -10.872 -11.855 O
HETATM 180 P 1 6.490 -9.819 -12.872 P
HETATM 181 N 1 -3.603 0.453 -16.443 N
HETATM 182 H 1 -2.876 1.183 -16.443 H
HETATM 183 C 1 -4.926 0.865 -16.443 C
HETATM 184 N 1 -5.115 2.186 -16.443 N
HETATM 185 H 1 -4.305 2.821 -16.443 H
HETATM 186 H 1 -6.071 2.569 -16.443 H
HETATM 187 N 1 -5.961 0.026 -16.443 N
HETATM 188 C 1 -5.569 -1.265 -16.443 C
HETATM 189 C 1 -4.276 -1.774 -16.443 C
HETATM 190 C 1 -3.180 -0.883 -16.443 C
HETATM 191 O 1 -1.974 -1.139 -16.443 O
HETATM 192 N 1 -4.294 -3.172 -16.443 N
HETATM 193 C 1 -5.571 -3.462 -16.443 C
HETATM 194 H 1 -5.898 -4.365 -16.443 H
HETATM 195 N 1 -6.407 -2.365 -16.443 N
HETATM 196 C 1 -7.916 -2.297 -16.433 C
HETATM 197 H 1 -8.192 -1.396 -16.254 H
HETATM 198 C 1 -8.566 -2.782 -17.728 C
HETATM 199 H 1 -7.988 -2.675 -18.486 H
HETATM 200 C 1 -8.840 -4.249 -17.417 C
HETATM 201 H 1 -8.029 -4.754 -17.511 H
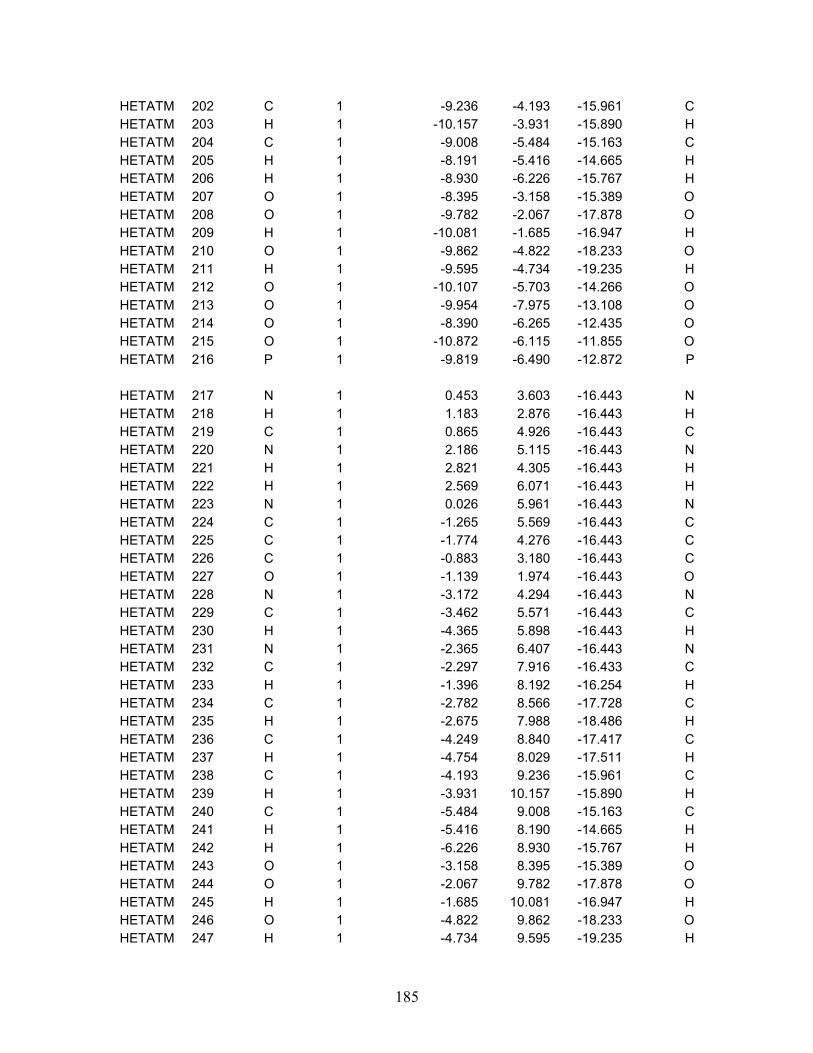
185
HETATM 202 C 1 -9.236 -4.193 -15.961 C
HETATM 203 H 1 -10.157 -3.931 -15.890 H
HETATM 204 C 1 -9.008 -5.484 -15.163 C
HETATM 205 H 1 -8.191 -5.416 -14.665 H
HETATM 206 H 1 -8.930 -6.226 -15.767 H
HETATM 207 O 1 -8.395 -3.158 -15.389 O
HETATM 208 O 1 -9.782 -2.067 -17.878 O
HETATM 209 H 1 -10.081 -1.685 -16.947 H
HETATM 210 O 1 -9.862 -4.822 -18.233 O
HETATM 211 H 1 -9.595 -4.734 -19.235 H
HETATM 212 O 1 -10.107 -5.703 -14.266 O
HETATM 213 O 1 -9.954 -7.975 -13.108 O
HETATM 214 O 1 -8.390 -6.265 -12.435 O
HETATM 215 O 1 -10.872 -6.115 -11.855 O
HETATM 216 P 1 -9.819 -6.490 -12.872 P
HETATM 217 N 1 0.453 3.603 -16.443 N
HETATM 218 H 1 1.183 2.876 -16.443 H
HETATM 219 C 1 0.865 4.926 -16.443 C
HETATM 220 N 1 2.186 5.115 -16.443 N
HETATM 221 H 1 2.821 4.305 -16.443 H
HETATM 222 H 1 2.569 6.071 -16.443 H
HETATM 223 N 1 0.026 5.961 -16.443 N
HETATM 224 C 1 -1.265 5.569 -16.443 C
HETATM 225 C 1 -1.774 4.276 -16.443 C
HETATM 226 C 1 -0.883 3.180 -16.443 C
HETATM 227 O 1 -1.139 1.974 -16.443 O
HETATM 228 N 1 -3.172 4.294 -16.443 N
HETATM 229 C 1 -3.462 5.571 -16.443 C
HETATM 230 H 1 -4.365 5.898 -16.443 H
HETATM 231 N 1 -2.365 6.407 -16.443 N
HETATM 232 C 1 -2.297 7.916 -16.433 C
HETATM 233 H 1 -1.396 8.192 -16.254 H
HETATM 234 C 1 -2.782 8.566 -17.728 C
HETATM 235 H 1 -2.675 7.988 -18.486 H
HETATM 236 C 1 -4.249 8.840 -17.417 C
HETATM 237 H 1 -4.754 8.029 -17.511 H
HETATM 238 C 1 -4.193 9.236 -15.961 C
HETATM 239 H 1 -3.931 10.157 -15.890 H
HETATM 240 C 1 -5.484 9.008 -15.163 C
HETATM 241 H 1 -5.416 8.190 -14.665 H
HETATM 242 H 1 -6.226 8.930 -15.767 H
HETATM 243 O 1 -3.158 8.395 -15.389 O
HETATM 244 O 1 -2.067 9.782 -17.878 O
HETATM 245 H 1 -1.685 10.081 -16.947 H
HETATM 246 O 1 -4.822 9.862 -18.233 O
HETATM 247 H 1 -4.734 9.595 -19.235 H

186
HETATM 248 O 1 -5.703 10.107 -14.266 O
HETATM 249 O 1 -7.975 9.954 -13.108 O
HETATM 250 O 1 -6.264 8.390 -12.435 O
HETATM 251 O 1 -6.115 10.872 -11.855 O
HETATM 252 P 1 -6.490 9.819 -12.872 P
HETATM 253 N 1 3.603 -0.453 -16.443 N
HETATM 254 H 1 2.876 -1.183 -16.443 H
HETATM 255 C 1 4.926 -0.865 -16.443 C
HETATM 256 N 1 5.115 -2.186 -16.443 N
HETATM 257 H 1 4.305 -2.821 -16.443 H
HETATM 258 H 1 6.071 -2.569 -16.443 H
HETATM 259 N 1 5.961 -0.026 -16.443 N
HETATM 260 C 1 5.569 1.265 -16.443 C
HETATM 261 C 1 4.276 1.774 -16.443 C
HETATM 262 C 1 3.180 0.883 -16.443 C
HETATM 263 O 1 1.974 1.139 -16.443 O
HETATM 264 N 1 4.294 3.172 -16.443 N
HETATM 265 C 1 5.571 3.462 -16.443 C
HETATM 266 H 1 5.898 4.365 -16.443 H
HETATM 267 N 1 6.407 2.365 -16.443 N
HETATM 268 C 1 7.916 2.297 -16.433 C
HETATM 269 H 1 8.192 1.396 -16.254 H
HETATM 270 C 1 8.566 2.782 -17.728 C
HETATM 271 H 1 7.988 2.675 -18.486 H
HETATM 272 C 1 8.840 4.249 -17.417 C
HETATM 273 H 1 8.029 4.754 -17.511 H
HETATM 274 C 1 9.236 4.193 -15.961 C
HETATM 275 H 1 10.157 3.931 -15.890 H
HETATM 276 C 1 9.008 5.484 -15.163 C
HETATM 277 H 1 8.191 5.415 -14.665 H
HETATM 278 H 1 8.930 6.226 -15.767 H
HETATM 279 O 1 8.395 3.158 -15.389 O
HETATM 280 O 1 9.782 2.067 -17.878 O
HETATM 281 H 1 10.081 1.685 -16.947 H
HETATM 282 O 1 9.862 4.822 -18.233 O
HETATM 283 H 1 9.595 4.734 -19.235 H
HETATM 284 O 1 10.107 5.703 -14.266 O
HETATM 285 O 1 9.954 7.975 -13.108 O
HETATM 286 O 1 8.390 6.264 -12.435 O
HETATM 287 O 1 10.872 6.115 -11.855 O
HETATM 288 P 1 9.819 6.490 -12.872 P
Channel Na+ ions HETATM 1729 Na 1 0.000 0.000 -18.143 Na
HETATM 1730 Na 1 0.000 0.000 -14.743 Na
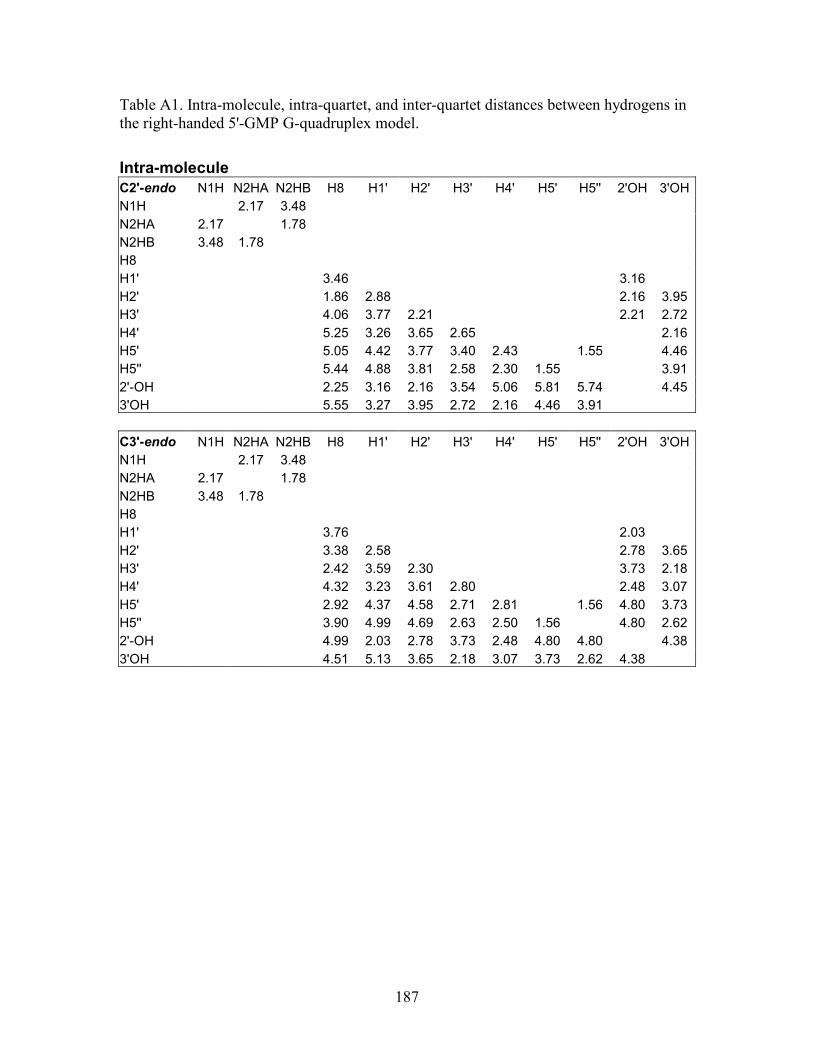
187
Table A1. Intra-molecule, intra-quartet, and inter-quartet distances between hydrogens in the right-handed 5'-GMP G-quadruplex model.
Intra-molecule
C2'-endo N1H N2HA N2HB H8 H1' H2' H3' H4' H5' H5'' 2'OH 3'OH
N1H 2.17 3.48
N2HA 2.17 1.78
N2HB 3.48 1.78
H8
H1' 3.46 3.16
H2' 1.86 2.88 2.16 3.95
H3' 4.06 3.77 2.21 2.21 2.72
H4' 5.25 3.26 3.65 2.65 2.16
H5' 5.05 4.42 3.77 3.40 2.43 1.55 4.46
H5'' 5.44 4.88 3.81 2.58 2.30 1.55 3.91
2'-OH 2.25 3.16 2.16 3.54 5.06 5.81 5.74 4.45
3'OH 5.55 3.27 3.95 2.72 2.16 4.46 3.91
C3'-endo N1H N2HA N2HB H8 H1' H2' H3' H4' H5' H5'' 2'OH 3'OH
N1H 2.17 3.48
N2HA 2.17 1.78
N2HB 3.48 1.78
H8
H1' 3.76 2.03
H2' 3.38 2.58 2.78 3.65
H3' 2.42 3.59 2.30 3.73 2.18
H4' 4.32 3.23 3.61 2.80 2.48 3.07
H5' 2.92 4.37 4.58 2.71 2.81 1.56 4.80 3.73
H5'' 3.90 4.99 4.69 2.63 2.50 1.56 4.80 2.62
2'-OH 4.99 2.03 2.78 3.73 2.48 4.80 4.80 4.38
3'OH 4.51 5.13 3.65 2.18 3.07 3.73 2.62 4.38

188
Table A1. (continued)
Intra-quartet
C2'-endo N1H N2HA N2HB H8 H1' H2' H3' H4' H5' H5'' 2'OH 3'OH
N1H 4.94
N2HA 3.07
N2HB 3.73
H8
H1'
H2' 4.82 5.37
H3'
H4'
H5'
H5''
2'-OH 5.03
3'OH
C3'-endo N1H N2HA N2HB H8 H1' H2' H3' H4' H5' H5'' 2'OH 3'OH
N1H 4.95
N2HA 3.08
N2HB 3.74
H8
H1'
H2'
H3'
H4'
H5'
H5''
2'-OH
3'OH
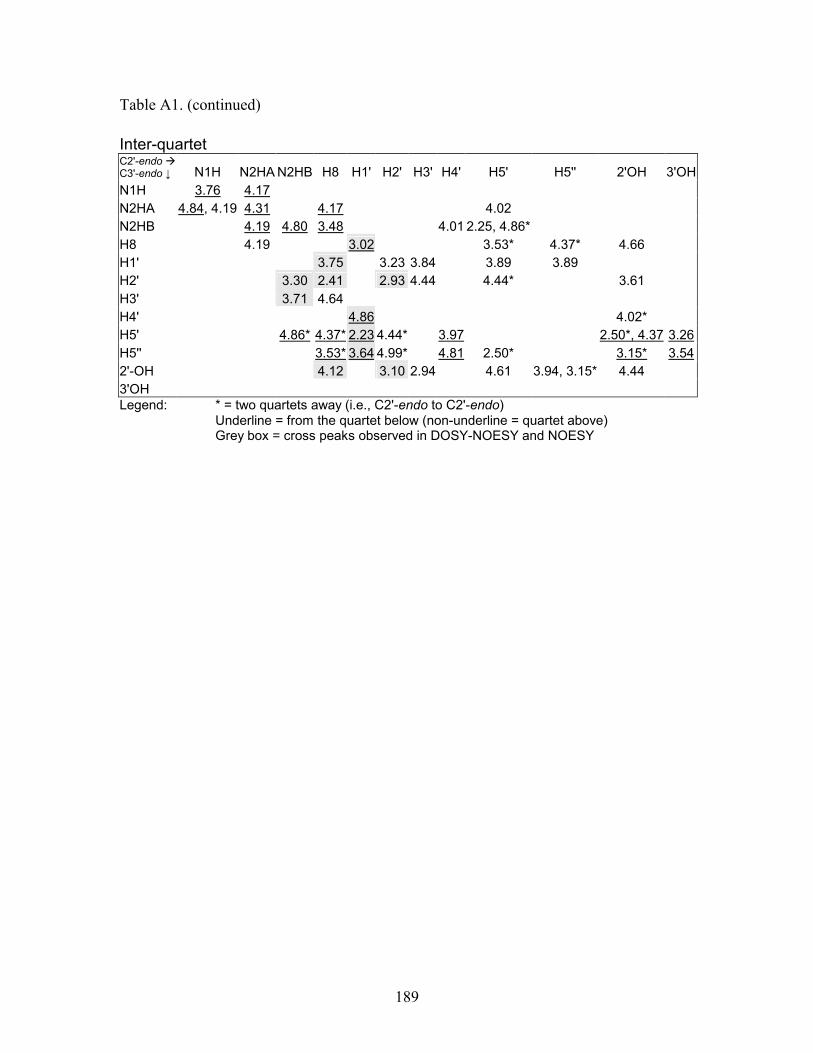
189
Table A1. (continued)
Inter-quartet C2'-endo � C3'-endo ↓ N1H N2HA N2HB H8 H1' H2' H3' H4' H5' H5'' 2'OH 3'OH
N1H 3.76 4.17
N2HA 4.84, 4.19 4.31 4.17 4.02
N2HB 4.19 4.80 3.48 4.01 2.25, 4.86*
H8 4.19 3.02 3.53* 4.37* 4.66
H1' 3.75 3.23 3.84 3.89 3.89
H2' 3.30 2.41 2.93 4.44 4.44* 3.61
H3' 3.71 4.64
H4' 4.86 4.02*
H5' 4.86* 4.37* 2.23 4.44* 3.97 2.50*, 4.37 3.26
H5'' 3.53* 3.64 4.99* 4.81 2.50* 3.15* 3.54
2'-OH 4.12 3.10 2.94 4.61 3.94, 3.15* 4.44
3'OH
Legend: * = two quartets away (i.e., C2'-endo to C2'-endo) Underline = from the quartet below (non-underline = quartet above) Grey box = cross peaks observed in DOSY-NOESY and NOESY

190
Appendix II: (Chapter 3)
Coordinates of the acidic, right-handed Na2(5'-GMP) G-quadruplex model. HETATM 1 N 1 1.665 2.907 -4.000 N
HETATM 2 H 1 0.788 2.775 -3.848 H
HETATM 3 C 1 2.140 4.218 -3.900 C
HETATM 4 N 1 3.500 4.512 -3.940 N
HETATM 5 C 1 4.197 3.398 -4.200 C
HETATM 6 C 1 3.893 2.114 -4.340 C
HETATM 7 C 1 2.421 1.805 -4.310 C
HETATM 8 N 1 4.949 1.234 -4.550 N
HETATM 9 C 1 5.963 2.065 -4.600 C
HETATM 10 H 1 6.854 1.780 -4.815 H
HETATM 11 N 1 5.639 3.429 -4.310 N
HETATM 12 O 1 1.930 0.661 -4.340 O
HETATM 13 N 1 1.274 5.186 -3.520 N
HETATM 14 H 1 0.417 4.977 -3.339 H
HETATM 15 H 1 1.554 6.038 -3.448 H
HETATM 16 C 1 6.602 4.623 -4.150 C
HETATM 17 H 1 6.182 5.377 -4.571 H
HETATM 18 C 1 7.897 4.359 -4.910 C
HETATM 19 H 1 8.129 3.429 -4.870 H
HETATM 20 C 1 8.901 5.222 -4.050 C
HETATM 21 H 1 9.742 4.763 -3.990 H
HETATM 22 C 1 8.273 5.291 -2.680 C
HETATM 23 H 1 8.376 6.181 -2.335 H
HETATM 24 C 1 8.913 4.309 -1.710 C
HETATM 25 H 1 9.864 4.312 -1.839 H
HETATM 26 H 1 8.737 4.593 -0.810 H
HETATM 27 O 1 6.893 5.008 -2.810 O
HETATM 28 O 1 7.810 4.786 -6.230 O
HETATM 29 H 1 7.260 4.294 -6.652 H
HETATM 30 O 1 9.087 6.410 -4.650 O
HETATM 31 H 1 9.627 6.878 -4.190 H
HETATM 32 O 1 8.414 2.963 -1.890 O
HETATM 33 P 1 9.009 1.866 -1.050 P
HETATM 34 O 1 9.129 2.242 0.390 O
HETATM 35 H 1 9.632 2.923 0.464 H
HETATM 36 O 1 10.359 1.585 -1.750 O
HETATM 37 H 1 10.850 2.278 -1.706 H
HETATM 38 O 1 8.058 0.592 -1.110 O
HETATM 39 H 1 8.387 0.018 -1.644 H
HETATM 40 N 1 2.717 -1.960 -4.883 N
HETATM 41 H 1 2.677 -1.073 -4.731 H
HETATM 42 C 1 3.971 -2.569 -4.783 C
HETATM 43 N 1 4.121 -3.952 -4.823 N

191
HETATM 44 C 1 2.941 -4.529 -5.083 C
HETATM 45 C 1 1.695 -4.093 -5.223 C
HETATM 46 C 1 1.542 -2.597 -5.193 C
HETATM 47 N 1 0.710 -5.050 -5.433 N
HETATM 48 C 1 1.430 -6.146 -5.483 C
HETATM 49 H 1 1.053 -7.002 -5.698 H
HETATM 50 N 1 2.821 -5.967 -5.193 N
HETATM 51 O 1 0.455 -1.989 -5.223 O
HETATM 52 N 1 5.024 -1.809 -4.403 N
HETATM 53 H 1 4.906 -0.935 -4.222 H
HETATM 54 H 1 5.842 -2.177 -4.331 H
HETATM 55 C 1 3.908 -7.049 -5.033 C
HETATM 56 H 1 4.701 -6.710 -5.454 H
HETATM 57 C 1 3.510 -8.309 -5.793 C
HETATM 58 H 1 2.560 -8.443 -5.753 H
HETATM 59 C 1 4.263 -9.398 -4.933 C
HETATM 60 H 1 3.719 -10.187 -4.873 H
HETATM 61 C 1 4.397 -8.781 -3.563 C
HETATM 62 H 1 5.271 -8.977 -3.218 H
HETATM 63 C 1 3.354 -9.315 -2.593 C
HETATM 64 H 1 3.258 -10.261 -2.722 H
HETATM 65 H 1 3.655 -9.169 -1.693 H
HETATM 66 O 1 4.260 -7.379 -3.693 O
HETATM 67 O 1 3.943 -8.268 -7.113 O
HETATM 68 H 1 3.511 -7.669 -7.535 H
HETATM 69 O 1 5.425 -9.707 -5.533 O
HETATM 70 H 1 5.834 -10.293 -5.073 H
HETATM 71 O 1 2.067 -8.677 -2.773 O
HETATM 72 P 1 0.914 -9.155 -1.933 P
HETATM 73 O 1 1.276 -9.313 -0.493 O
HETATM 74 H 1 1.900 -9.885 -0.419 H
HETATM 75 O 1 0.494 -10.468 -2.633 O
HETATM 76 H 1 1.131 -11.029 -2.589 H
HETATM 77 O 1 -0.254 -8.076 -1.993 O
HETATM 78 H 1 -0.859 -8.343 -2.527 H
HETATM 79 N 1 -2.233 -2.497 -5.766 N
HETATM 80 H 1 -1.347 -2.550 -5.614 H
HETATM 81 C 1 -2.970 -3.681 -5.666 C
HETATM 82 N 1 -4.361 -3.686 -5.706 N
HETATM 83 C 1 -4.811 -2.452 -5.966 C
HETATM 84 C 1 -4.248 -1.258 -6.106 C
HETATM 85 C 1 -2.744 -1.262 -6.076 C
HETATM 86 N 1 -5.097 -0.178 -6.316 N
HETATM 87 C 1 -6.262 -0.780 -6.366 C
HETATM 88 H 1 -7.074 -0.316 -6.581 H
HETATM 89 N 1 -6.229 -2.181 -6.076 N
HETATM 90 O 1 -2.025 -0.245 -6.106 O

192
HETATM 91 N 1 -2.324 -4.808 -5.286 N
HETATM 92 H 1 -1.443 -4.782 -5.105 H
HETATM 93 H 1 -2.776 -5.583 -5.214 H
HETATM 94 C 1 -7.419 -3.149 -5.916 C
HETATM 95 H 1 -7.165 -3.974 -6.337 H
HETATM 96 C 1 -8.630 -2.622 -6.676 C
HETATM 97 H 1 -8.665 -1.664 -6.636 H
HETATM 98 C 1 -9.792 -3.258 -5.816 C
HETATM 99 H 1 -10.519 -2.634 -5.756 H
HETATM 100 C 1 -9.192 -3.455 -4.446 C
HETATM 101 H 1 -9.478 -4.304 -4.101 H
HETATM 102 C 1 -9.614 -2.361 -3.476 C
HETATM 103 H 1 -10.545 -2.167 -3.605 H
HETATM 104 H 1 -9.501 -2.677 -2.576 H
HETATM 105 O 1 -7.783 -3.465 -4.576 O
HETATM 106 O 1 -8.635 -3.058 -7.996 O
HETATM 107 H 1 -7.994 -2.690 -8.418 H
HETATM 108 O 1 -10.221 -4.381 -6.416 O
HETATM 109 H 1 -10.847 -4.726 -5.956 H
HETATM 110 O 1 -8.846 -1.149 -3.656 O
HETATM 111 P 1 -9.200 0.048 -2.816 P
HETATM 112 O 1 -9.395 -0.295 -1.376 O
HETATM 113 H 1 -10.029 -0.857 -1.302 H
HETATM 114 O 1 -10.463 0.603 -3.516 O
HETATM 115 H 1 -11.087 0.028 -3.472 H
HETATM 116 O 1 -8.005 1.097 -2.876 O
HETATM 117 H 1 -8.208 1.726 -3.410 H
HETATM 118 N 1 -2.250 2.482 -6.649 N
HETATM 119 H 1 -2.395 1.607 -6.497 H
HETATM 120 C 1 -3.350 3.339 -6.549 C
HETATM 121 N 1 -3.210 4.723 -6.589 N
HETATM 122 C 1 -1.935 5.041 -6.849 C
HETATM 123 C 1 -0.807 4.356 -6.989 C
HETATM 124 C 1 -0.968 2.861 -6.959 C
HETATM 125 N 1 0.356 5.088 -7.199 N
HETATM 126 C 1 -0.121 6.309 -7.249 C
HETATM 127 H 1 0.425 7.068 -7.464 H
HETATM 128 N 1 -1.518 6.423 -6.959 N
HETATM 129 O 1 -0.032 2.040 -6.989 O
HETATM 130 N 1 -4.538 2.814 -6.169 N
HETATM 131 H 1 -4.605 1.935 -5.988 H
HETATM 132 H 1 -5.262 3.344 -6.097 H
HETATM 133 C 1 -2.357 7.708 -6.799 C
HETATM 134 H 1 -3.203 7.541 -7.220 H
HETATM 135 C 1 -1.706 8.857 -7.559 C
HETATM 136 H 1 -0.749 8.791 -7.519 H
HETATM 137 C 1 -2.216 10.079 -6.699 C

193
HETATM 138 H 1 -1.519 10.737 -6.639 H
HETATM 139 C 1 -2.475 9.503 -5.329 C
HETATM 140 H 1 -3.290 9.876 -4.984 H
HETATM 141 C 1 -1.344 9.808 -4.359 C
HETATM 142 H 1 -1.053 10.714 -4.488 H
HETATM 143 H 1 -1.669 9.728 -3.459 H
HETATM 144 O 1 -2.633 8.103 -5.459 O
HETATM 145 O 1 -2.138 8.907 -8.879 O
HETATM 146 H 1 -1.840 8.232 -9.301 H
HETATM 147 O 1 -3.288 10.623 -7.299 O
HETATM 148 H 1 -3.567 11.281 -6.839 H
HETATM 149 O 1 -0.218 8.917 -4.539 O
HETATM 150 P 1 1.010 9.144 -3.699 P
HETATM 151 O 1 0.688 9.375 -2.259 O
HETATM 152 H 1 0.196 10.064 -2.185 H
HETATM 153 O 1 1.694 10.342 -4.399 O
HETATM 154 H 1 1.187 11.023 -4.355 H
HETATM 155 O 1 1.927 7.847 -3.759 O
HETATM 156 H 1 2.575 7.982 -4.293 H
HETATM 157 N 1 2.703 1.979 -7.532 N
HETATM 158 H 1 1.848 2.214 -7.380 H
HETATM 159 C 1 3.671 2.983 -7.432 C
HETATM 160 N 1 5.032 2.698 -7.472 N
HETATM 161 C 1 5.216 1.398 -7.732 C
HETATM 162 C 1 4.416 0.348 -7.872 C
HETATM 163 C 1 2.946 0.664 -7.842 C
HETATM 164 N 1 5.023 -0.886 -8.082 N
HETATM 165 C 1 6.287 -0.539 -8.132 C
HETATM 166 H 1 6.985 -1.162 -8.347 H
HETATM 167 N 1 6.547 0.839 -7.842 N
HETATM 168 O 1 2.032 -0.181 -7.872 O
HETATM 169 N 1 3.273 4.219 -7.052 N
HETATM 170 H 1 2.406 4.377 -6.871 H
HETATM 171 H 1 3.876 4.884 -6.980 H
HETATM 172 C 1 7.912 1.538 -7.682 C
HETATM 173 H 1 7.835 2.397 -8.103 H
HETATM 174 C 1 8.987 0.770 -8.442 C
HETATM 175 H 1 8.821 -0.174 -8.402 H
HETATM 176 C 1 10.256 1.150 -7.582 C
HETATM 177 H 1 10.837 0.389 -7.522 H
HETATM 178 C 1 9.710 1.468 -6.212 C
HETATM 179 H 1 10.166 2.239 -5.867 H
HETATM 180 C 1 9.895 0.311 -5.242 C
HETATM 181 H 1 10.766 -0.073 -5.371 H
HETATM 182 H 1 9.850 0.643 -4.342 H
HETATM 183 O 1 8.334 1.771 -6.342 O
HETATM 184 O 1 9.082 1.196 -9.762 O

194
HETATM 185 H 1 8.379 0.970 -10.184 H
HETATM 186 O 1 10.908 2.160 -8.182 O
HETATM 187 H 1 11.592 2.368 -7.722 H
HETATM 188 O 1 8.891 -0.715 -5.422 O
HETATM 189 P 1 8.989 -1.960 -4.582 P
HETATM 190 O 1 9.251 -1.665 -3.142 O
HETATM 191 H 1 8.777 -1.003 -2.897 H
HETATM 192 O 1 10.109 -2.765 -5.282 O
HETATM 193 H 1 10.839 -2.333 -5.238 H
HETATM 194 O 1 7.602 -2.737 -4.642 O
HETATM 195 H 1 7.669 -3.395 -5.176 H
HETATM 196 N 1 1.685 -2.895 -8.415 N
HETATM 197 H 1 2.009 -2.069 -8.263 H
HETATM 198 C 1 2.583 -3.962 -8.315 C
HETATM 199 N 1 2.157 -5.287 -8.355 N
HETATM 200 C 1 0.845 -5.334 -8.615 C
HETATM 201 C 1 -0.116 -4.428 -8.755 C
HETATM 202 C 1 0.352 -2.999 -8.725 C
HETATM 203 N 1 -1.406 -4.902 -8.965 N
HETATM 204 C 1 -1.193 -6.196 -9.015 C
HETATM 205 H 1 -1.886 -6.825 -9.230 H
HETATM 206 N 1 0.150 -6.598 -8.725 N
HETATM 207 O 1 -0.393 -2.002 -8.755 O
HETATM 208 N 1 3.854 -3.696 -7.935 N
HETATM 209 H 1 4.102 -2.850 -7.754 H
HETATM 210 H 1 4.452 -4.365 -7.863 H
HETATM 211 C 1 0.702 -8.029 -8.565 C
HETATM 212 H 1 1.565 -8.042 -8.986 H
HETATM 213 C 1 -0.173 -9.018 -9.325 C
HETATM 214 H 1 -1.095 -8.755 -9.285 H
HETATM 215 C 1 0.072 -10.320 -8.465 C
HETATM 216 H 1 -0.746 -10.818 -8.405 H
HETATM 217 C 1 0.445 -9.810 -7.095 C
HETATM 218 H 1 1.164 -10.345 -6.750 H
HETATM 219 C 1 -0.725 -9.873 -6.125 C
HETATM 220 H 1 -1.198 -10.699 -6.254 H
HETATM 221 H 1 -0.390 -9.863 -5.225 H
HETATM 222 O 1 0.891 -8.473 -7.225 O
HETATM 223 O 1 0.240 -9.157 -10.645 O
HETATM 224 H 1 0.088 -8.434 -11.067 H
HETATM 225 O 1 1.008 -11.074 -9.065 O
HETATM 226 H 1 1.143 -11.776 -8.605 H
HETATM 227 O 1 -1.641 -8.768 -6.305 O
HETATM 228 P 1 -2.889 -8.735 -5.465 P
HETATM 229 O 1 -2.623 -9.027 -4.025 O
HETATM 230 H 1 -1.915 -8.624 -3.780 H
HETATM 231 O 1 -3.807 -9.764 -6.165 O
195
HETATM 232 H 1 -3.453 -10.536 -6.121 H
HETATM 233 O 1 -3.517 -7.275 -5.525 O
HETATM 234 H 1 -4.178 -7.272 -6.059 H
HETATM 235 N 1 -3.056 -1.373 -9.298 N
HETATM 236 H 1 -2.268 -1.782 -9.146 H
HETATM 237 C 1 -4.211 -2.155 -9.198 C
HETATM 238 N 1 -5.483 -1.593 -9.238 N
HETATM 239 C 1 -5.393 -0.283 -9.498 C
HETATM 240 C 1 -4.392 0.578 -9.638 C
HETATM 241 C 1 -3.020 -0.037 -9.608 C
HETATM 242 N 1 -4.729 1.910 -9.848 N
HETATM 243 C 1 -6.037 1.834 -9.898 C
HETATM 244 H 1 -6.591 2.589 -10.113 H
HETATM 245 N 1 -6.578 0.541 -9.608 N
HETATM 246 O 1 -1.950 0.600 -9.638 O
HETATM 247 N 1 -4.079 -3.447 -8.818 N
HETATM 248 H 1 -3.263 -3.782 -8.637 H
HETATM 249 H 1 -4.806 -3.971 -8.746 H
HETATM 250 C 1 -8.059 0.141 -9.448 C
HETATM 251 H 1 -8.162 -0.716 -9.869 H
HETATM 252 C 1 -8.951 1.115 -10.208 C
HETATM 253 H 1 -8.592 2.004 -10.168 H
HETATM 254 C 1 -10.271 1.007 -9.348 C
HETATM 255 H 1 -10.681 1.873 -9.288 H
HETATM 256 C 1 -9.803 0.582 -7.978 C
HETATM 257 H 1 -10.410 -0.077 -7.633 H
HETATM 258 C 1 -9.744 1.753 -7.008 C
HETATM 259 H 1 -10.515 2.309 -7.137 H
HETATM 260 H 1 -9.768 1.419 -6.108 H
HETATM 261 O 1 -8.520 0.000 -8.108 O
HETATM 262 O 1 -9.132 0.719 -11.528 O
HETATM 263 H 1 -8.397 0.794 -11.950 H
HETATM 264 O 1 -11.119 0.155 -9.948 O
HETATM 265 H 1 -11.831 0.094 -9.488 H
HETATM 266 O 1 -8.548 2.548 -7.188 O
HETATM 267 P 1 -8.385 3.786 -6.348 P
HETATM 268 O 1 -8.703 3.552 -4.908 O
HETATM 269 H 1 -8.376 2.806 -4.663 H
HETATM 270 O 1 -9.313 4.807 -7.048 O
HETATM 271 H 1 -10.117 4.535 -7.004 H
HETATM 272 O 1 -6.867 4.258 -6.408 O
HETATM 273 H 1 -6.796 4.915 -6.942 H
HETATM 274 N 1 -1.046 3.182 -10.181 N
HETATM 275 H 1 -1.535 2.442 -10.029 H
HETATM 276 C 1 -1.703 4.413 -10.081 C
HETATM 277 N 1 -1.011 5.620 -10.121 N
HETATM 278 C 1 0.283 5.393 -10.381 C
196
HETATM 279 C 1 1.034 4.308 -10.521 C
HETATM 280 C 1 0.279 3.007 -10.491 C
HETATM 281 N 1 2.394 4.503 -10.731 N
HETATM 282 C 1 2.455 5.813 -10.781 C
HETATM 283 H 1 3.264 6.284 -10.996 H
HETATM 284 N 1 1.225 6.485 -10.491 N
HETATM 285 O 1 0.800 1.876 -10.521 O
HETATM 286 N 1 -3.002 4.417 -9.701 N
HETATM 287 H 1 -3.420 3.640 -9.520 H
HETATM 288 H 1 -3.447 5.195 -9.629 H
HETATM 289 C 1 0.982 8.000 -10.331 C
HETATM 290 H 1 0.141 8.192 -10.752 H
HETATM 291 C 1 2.044 8.785 -11.091 C
HETATM 292 H 1 2.892 8.336 -11.051 H
HETATM 293 C 1 2.075 10.109 -10.231 C
HETATM 294 H 1 2.979 10.427 -10.171 H
HETATM 295 C 1 1.604 9.688 -8.861 C
HETATM 296 H 1 1.012 10.361 -8.516 H
HETATM 297 C 1 2.762 9.507 -7.891 C
HETATM 298 H 1 3.396 10.216 -8.020 H
HETATM 299 H 1 2.432 9.566 -6.991 H
HETATM 300 O 1 0.891 8.473 -8.991 O
HETATM 301 O 1 1.669 9.007 -12.411 O
HETATM 302 H 1 1.667 8.269 -12.833 H
HETATM 303 O 1 1.317 11.042 -10.831 O
HETATM 304 H 1 1.330 11.757 -10.371 H
HETATM 305 O 1 3.428 8.235 -8.071 O
HETATM 306 P 1 4.642 7.943 -7.231 P
HETATM 307 O 1 4.442 8.284 -5.791 O
HETATM 308 H 1 3.666 8.037 -5.546 H
HETATM 309 O 1 5.754 8.759 -7.931 O
HETATM 310 H 1 5.568 9.588 -7.887 H
HETATM 311 O 1 4.952 6.384 -7.291 O
HETATM 312 H 1 5.599 6.245 -7.825 H
HETATM 313 N 1 3.274 0.708 -11.064 N
HETATM 314 H 1 2.589 1.271 -10.912 H
HETATM 315 C 1 4.567 1.232 -10.964 C
HETATM 316 N 1 5.695 0.418 -11.004 N
HETATM 317 C 1 5.334 -0.845 -11.264 C
HETATM 318 C 1 4.176 -1.479 -11.404 C
HETATM 319 C 1 2.961 -0.592 -11.374 C
HETATM 320 N 1 4.228 -2.852 -11.614 N
HETATM 321 C 1 5.524 -3.050 -11.664 C
HETATM 322 H 1 5.909 -3.903 -11.879 H
HETATM 323 N 1 6.322 -1.897 -11.374 N
HETATM 324 O 1 1.783 -0.992 -11.404 O
HETATM 325 N 1 4.706 2.523 -10.584 N

197
HETATM 326 H 1 3.978 3.021 -10.403 H
HETATM 327 H 1 5.527 2.885 -10.512 H
HETATM 328 C 1 7.853 -1.813 -11.214 C
HETATM 329 H 1 8.132 -0.996 -11.635 H
HETATM 330 C 1 8.523 -2.952 -11.974 C
HETATM 331 H 1 7.988 -3.747 -11.934 H
HETATM 332 C 1 9.837 -3.120 -11.114 C
HETATM 333 H 1 10.058 -4.053 -11.054 H
HETATM 334 C 1 9.467 -2.608 -9.744 C
HETATM 335 H 1 10.198 -2.089 -9.399 H
HETATM 336 C 1 9.166 -3.741 -8.774 C
HETATM 337 H 1 9.805 -4.445 -8.903 H
HETATM 338 H 1 9.259 -3.419 -7.874 H
HETATM 339 O 1 8.334 -1.771 -9.874 O
HETATM 340 O 1 8.783 -2.602 -13.294 O
HETATM 341 H 1 8.049 -2.522 -13.716 H
HETATM 342 O 1 10.844 -2.464 -11.714 O
HETATM 343 H 1 11.553 -2.552 -11.254 H
HETATM 344 O 1 7.832 -4.270 -8.954 O
HETATM 345 P 1 7.415 -5.447 -8.114 P
HETATM 346 O 1 7.775 -5.284 -6.674 O
HETATM 347 H 1 7.610 -4.486 -6.429 H
HETATM 348 O 1 8.110 -6.638 -8.814 O
HETATM 349 H 1 8.953 -6.539 -8.770 H
HETATM 350 O 1 5.832 -5.593 -8.174 O
HETATM 351 H 1 5.625 -6.221 -8.708 H
HETATM 352 N 1 0.362 -3.330 -11.947 N
HETATM 353 H 1 0.994 -2.708 -11.795 H
HETATM 354 C 1 0.748 -4.670 -11.847 C
HETATM 355 N 1 -0.179 -5.707 -11.887 N
HETATM 356 C 1 -1.398 -5.216 -12.147 C
HETATM 357 C 1 -1.907 -3.998 -12.287 C
HETATM 358 C 1 -0.898 -2.883 -12.257 C
HETATM 359 N 1 -3.278 -3.907 -12.497 N
HETATM 360 C 1 -3.610 -5.175 -12.547 C
HETATM 361 H 1 -4.499 -5.468 -12.762 H
HETATM 362 N 1 -2.547 -6.089 -12.257 N
HETATM 363 O 1 -1.173 -1.669 -12.287 O
HETATM 364 N 1 2.018 -4.944 -11.467 N
HETATM 365 H 1 2.588 -4.272 -11.286 H
HETATM 366 H 1 2.292 -5.798 -11.395 H
HETATM 367 C 1 -2.624 -7.621 -12.097 C
HETATM 368 H 1 -1.841 -7.984 -12.518 H
HETATM 369 C 1 -3.826 -8.168 -12.857 C
HETATM 370 H 1 -4.561 -7.552 -12.817 H
HETATM 371 C 1 -4.132 -9.457 -11.997 C
HETATM 372 H 1 -5.082 -9.580 -11.937 H

198
HETATM 373 C 1 -3.583 -9.143 -10.627 C
HETATM 374 H 1 -3.144 -9.924 -10.282 H
HETATM 375 C 1 -4.678 -8.725 -9.657 C
HETATM 376 H 1 -5.446 -9.287 -9.786 H
HETATM 377 H 1 -4.368 -8.851 -8.757 H
HETATM 378 O 1 -2.633 -8.103 -10.757 O
HETATM 379 O 1 -3.505 -8.463 -14.177 O
HETATM 380 H 1 -3.350 -7.741 -14.599 H
HETATM 381 O 1 -3.584 -10.527 -12.597 O
HETATM 382 H 1 -3.745 -11.223 -12.137 H
HETATM 383 O 1 -5.065 -7.342 -9.837 O
HETATM 384 P 1 -6.192 -6.805 -8.997 P
HETATM 385 O 1 -6.067 -7.180 -7.557 O
HETATM 386 H 1 -5.257 -7.099 -7.312 H
HETATM 387 O 1 -7.449 -7.372 -9.697 O
HETATM 388 H 1 -7.439 -8.220 -9.653 H
HETATM 389 O 1 -6.171 -5.215 -9.057 O
HETATM 390 H 1 -6.775 -4.944 -9.591 H
HETATM 391 N 1 -3.350 -0.012 -12.830 N
HETATM 392 H 1 -2.797 -0.705 -12.678 H
HETATM 393 C 1 -4.723 -0.256 -12.730 C
HETATM 394 N 1 -5.657 0.775 -12.770 N
HETATM 395 C 1 -5.041 1.935 -13.030 C
HETATM 396 C 1 -3.777 2.315 -13.170 C
HETATM 397 C 1 -2.774 1.195 -13.140 C
HETATM 398 N 1 -3.543 3.669 -13.380 N
HETATM 399 C 1 -4.769 4.131 -13.430 C
HETATM 400 H 1 -4.968 5.046 -13.645 H
HETATM 401 N 1 -5.789 3.169 -13.140 N
HETATM 402 O 1 -1.537 1.341 -13.170 O
HETATM 403 N 1 -5.128 -1.490 -12.350 N
HETATM 404 H 1 -4.519 -2.127 -12.169 H
HETATM 405 H 1 -6.006 -1.673 -12.278 H
HETATM 406 C 1 -7.305 3.406 -12.980 C
HETATM 407 H 1 -7.748 2.666 -13.401 H
HETATM 408 C 1 -7.724 4.659 -13.740 C
HETATM 409 H 1 -7.034 5.326 -13.700 H
HETATM 410 C 1 -8.973 5.097 -12.880 C
HETATM 411 H 1 -8.996 6.055 -12.820 H
HETATM 412 C 1 -8.718 4.519 -11.510 C
HETATM 413 H 1 -9.541 4.164 -11.165 H
HETATM 414 C 1 -8.188 5.565 -10.540 C
HETATM 415 H 1 -8.667 6.387 -10.669 H
HETATM 416 H 1 -8.346 5.269 -9.640 H
HETATM 417 O 1 -7.783 3.465 -11.640 O
HETATM 418 O 1 -8.050 4.371 -15.060 O
HETATM 419 H 1 -7.349 4.141 -15.482 H

199
HETATM 420 O 1 -10.094 4.664 -13.480 O
HETATM 421 H 1 -10.770 4.898 -13.020 H
HETATM 422 O 1 -6.773 5.805 -10.720 O
HETATM 423 P 1 -6.120 6.869 -9.880 P
HETATM 424 O 1 -6.506 6.785 -8.440 O
HETATM 425 H 1 -6.511 5.971 -8.195 H
HETATM 426 O 1 -6.553 8.179 -10.580 O
HETATM 427 H 1 -7.398 8.258 -10.536 H
HETATM 428 O 1 -4.542 6.683 -9.940 O
HETATM 429 H 1 -4.209 7.255 -10.474 H
HETATM 430 N 1 0.339 3.333 -13.713 N
HETATM 431 H 1 -0.409 2.855 -13.561 H
HETATM 432 C 1 0.239 4.724 -13.613 C
HETATM 433 N 1 1.362 5.545 -13.653 N
HETATM 434 C 1 2.452 4.811 -13.913 C
HETATM 435 C 1 2.697 3.515 -14.053 C
HETATM 436 C 1 1.478 2.634 -14.023 C
HETATM 437 N 1 4.019 3.140 -14.263 N
HETATM 438 C 1 4.607 4.311 -14.313 C
HETATM 439 H 1 5.537 4.413 -14.528 H
HETATM 440 N 1 3.757 5.426 -14.023 N
HETATM 441 O 1 1.494 1.389 -14.053 O
HETATM 442 N 1 -0.946 5.256 -13.233 N
HETATM 443 H 1 -1.643 4.717 -13.052 H
HETATM 444 H 1 -1.036 6.148 -13.161 H
HETATM 445 C 1 4.151 6.909 -13.863 C
HETATM 446 H 1 3.461 7.426 -14.284 H
HETATM 447 C 1 5.441 7.194 -14.623 C
HETATM 448 H 1 6.032 6.439 -14.583 H
HETATM 449 C 1 6.008 8.391 -13.763 C
HETATM 450 H 1 6.963 8.314 -13.703 H
HETATM 451 C 1 5.406 8.198 -12.393 C
HETATM 452 H 1 5.138 9.053 -12.048 H
HETATM 453 C 1 6.390 7.562 -11.423 C
HETATM 454 H 1 7.258 7.952 -11.552 H
HETATM 455 H 1 6.113 7.750 -10.523 H
HETATM 456 O 1 4.260 7.379 -12.523 O
HETATM 457 O 1 5.188 7.549 -15.943 O
HETATM 458 H 1 4.886 6.876 -16.365 H
HETATM 459 O 1 5.694 9.552 -14.363 O
HETATM 460 H 1 5.997 10.199 -13.903 H
HETATM 461 O 1 6.481 6.129 -11.603 O
HETATM 462 P 1 7.471 5.369 -10.763 P
HETATM 463 O 1 7.427 5.761 -9.323 O
HETATM 464 H 1 6.618 5.851 -9.078 H
HETATM 465 O 1 8.819 5.662 -11.463 O
HETATM 466 H 1 8.986 6.494 -11.419 H

200
HETATM 467 O 1 7.121 3.818 -10.823 O
HETATM 468 H 1 6.378 3.680 -10.433 H
HETATM 469 N 1 3.279 -0.685 -14.596 N
HETATM 470 H 1 2.882 0.108 -14.444 H
HETATM 471 C 1 4.673 -0.732 -14.496 C
HETATM 472 N 1 5.372 -1.934 -14.536 N
HETATM 473 C 1 4.529 -2.941 -14.796 C
HETATM 474 C 1 3.213 -3.049 -14.936 C
HETATM 475 C 1 2.465 -1.745 -14.906 C
HETATM 476 N 1 2.703 -4.325 -15.146 N
HETATM 477 C 1 3.806 -5.033 -15.196 C
HETATM 478 H 1 3.810 -5.968 -15.411 H
HETATM 479 N 1 5.004 -4.304 -14.906 N
HETATM 480 O 1 1.225 -1.631 -14.936 O
HETATM 481 N 1 5.326 0.391 -14.116 N
HETATM 482 H 1 4.863 1.141 -13.935 H
HETATM 483 H 1 6.223 0.388 -14.044 H
HETATM 484 C 1 6.437 -4.851 -14.746 C
HETATM 485 H 1 7.024 -4.218 -15.167 H
HETATM 486 C 1 6.586 -6.163 -15.506 C
HETATM 487 H 1 5.773 -6.672 -15.466 H
HETATM 488 C 1 7.717 -6.852 -14.646 C
HETATM 489 H 1 7.540 -7.793 -14.586 H
HETATM 490 C 1 7.588 -6.233 -13.276 C
HETATM 491 H 1 8.467 -6.057 -12.931 H
HETATM 492 C 1 6.852 -7.145 -12.306 C
HETATM 493 H 1 7.150 -8.049 -12.435 H
HETATM 494 H 1 7.068 -6.890 -11.406 H
HETATM 495 O 1 6.893 -5.008 -13.406 O
HETATM 496 O 1 6.965 -5.949 -16.826 O
HETATM 497 H 1 6.327 -5.578 -17.248 H
HETATM 498 O 1 8.904 -6.661 -15.246 O
HETATM 499 H 1 9.516 -7.030 -14.786 H
HETATM 500 O 1 5.418 -7.086 -12.486 O
HETATM 501 P 1 4.558 -7.991 -11.646 P
HETATM 502 O 1 4.953 -7.989 -10.206 O
HETATM 503 H 1 5.127 -7.194 -9.961 H
HETATM 504 O 1 4.709 -9.363 -12.346 O
HETATM 505 H 1 5.519 -9.616 -12.302 H
HETATM 506 O 1 3.053 -7.481 -11.706 O
HETATM 507 H 1 2.993 -6.728 -11.316 H
HETATM 508 N 1 -1.024 -3.190 -15.479 N
HETATM 509 H 1 -0.194 -2.878 -15.327 H
HETATM 510 C 1 -1.216 -4.571 -15.379 C
HETATM 511 N 1 -2.485 -5.141 -15.419 N
HETATM 512 C 1 -3.398 -4.197 -15.679 C
HETATM 513 C 1 -3.369 -2.877 -15.819 C

201
HETATM 514 C 1 -1.993 -2.269 -15.789 C
HETATM 515 N 1 -4.584 -2.236 -16.029 N
HETATM 516 C 1 -5.403 -3.259 -16.079 C
HETATM 517 H 1 -6.334 -3.166 -16.294 H
HETATM 518 N 1 -4.803 -4.526 -15.789 N
HETATM 519 O 1 -1.750 -1.048 -15.819 O
HETATM 520 N 1 -0.168 -5.337 -14.999 N
HETATM 521 H 1 0.627 -4.955 -14.818 H
HETATM 522 H 1 -0.265 -6.229 -14.927 H
HETATM 523 C 1 -5.497 -5.895 -15.629 C
HETATM 524 H 1 -4.929 -6.545 -16.050 H
HETATM 525 C 1 -6.818 -5.906 -16.389 C
HETATM 526 H 1 -7.239 -5.044 -16.349 H
HETATM 527 C 1 -7.621 -6.959 -15.529 C
HETATM 528 H 1 -8.539 -6.684 -15.469 H
HETATM 529 C 1 -6.992 -6.895 -14.159 C
HETATM 530 H 1 -6.908 -7.787 -13.814 H
HETATM 531 C 1 -7.823 -6.068 -13.189 C
HETATM 532 H 1 -8.752 -6.269 -13.318 H
HETATM 533 H 1 -7.591 -6.309 -12.289 H
HETATM 534 O 1 -5.701 -6.332 -14.289 O
HETATM 535 O 1 -6.644 -6.305 -17.709 O
HETATM 536 H 1 -6.209 -5.709 -18.131 H
HETATM 537 O 1 -7.555 -8.159 -16.129 O
HETATM 538 H 1 -7.987 -8.729 -15.669 H
HETATM 539 O 1 -7.614 -4.647 -13.369 O
HETATM 540 P 1 -8.424 -3.698 -12.529 P
HETATM 541 O 1 -8.463 -4.091 -11.089 O
HETATM 542 H 1 -7.690 -4.347 -10.844 H
HETATM 543 O 1 -9.803 -3.704 -13.229 O
HETATM 544 H 1 -10.140 -4.484 -13.185 H
HETATM 545 O 1 -7.759 -2.254 -12.589 O
HETATM 546 H 1 -7.004 -2.274 -12.199 H
HETATM 547 N 1 -3.065 1.352 -16.362 N
HETATM 548 H 1 -2.842 0.493 -16.210 H
HETATM 549 C 1 -4.419 1.687 -16.262 C
HETATM 550 N 1 -4.853 3.009 -16.302 N
HETATM 551 C 1 -3.818 3.818 -16.562 C
HETATM 552 C 1 -2.509 3.651 -16.702 C
HETATM 553 C 1 -2.048 2.219 -16.672 C
HETATM 554 N 1 -1.744 4.792 -16.912 N
HETATM 555 C 1 -2.677 5.714 -16.962 C
HETATM 556 H 1 -2.486 6.630 -17.177 H
HETATM 557 N 1 -4.000 5.250 -16.672 N
HETATM 558 O 1 -0.859 1.850 -16.702 O
HETATM 559 N 1 -5.291 0.725 -15.882 N
HETATM 560 H 1 -4.994 -0.105 -15.701 H
202
HETATM 561 H 1 -6.167 0.915 -15.810 H
HETATM 562 C 1 -5.288 6.083 -16.512 C
HETATM 563 H 1 -5.994 5.586 -16.933 H
HETATM 564 C 1 -5.161 7.398 -17.272 C
HETATM 565 H 1 -4.260 7.726 -17.232 H
HETATM 566 C 1 -6.124 8.307 -16.412 C
HETATM 567 H 1 -5.755 9.191 -16.352 H
HETATM 568 C 1 -6.127 7.675 -15.042 C
HETATM 569 H 1 -7.022 7.685 -14.697 H
HETATM 570 C 1 -5.217 8.414 -14.072 C
HETATM 571 H 1 -5.320 9.360 -14.201 H
HETATM 572 H 1 -5.481 8.209 -13.172 H
HETATM 573 O 1 -5.701 6.332 -15.172 O
HETATM 574 O 1 -5.576 7.267 -18.592 O
HETATM 575 H 1 -5.029 6.772 -19.014 H
HETATM 576 O 1 -7.325 8.367 -17.012 O
HETATM 577 H 1 -7.847 8.855 -16.552 H
HETATM 578 O 1 -3.826 8.058 -14.252 O
HETATM 579 P 1 -2.797 8.764 -13.412 P
HETATM 580 O 1 -3.184 8.844 -11.972 O
HETATM 581 H 1 -3.519 8.103 -11.727 H
HETATM 582 O 1 -2.659 10.137 -14.112 O
HETATM 583 H 1 -3.399 10.553 -14.068 H
HETATM 584 O 1 -1.431 7.952 -13.472 O
HETATM 585 H 1 -1.529 7.203 -13.082 H

203
Appendix III: (Chapter 5)
Supplementary data for ESI-MS spectral analyses. G = monomeric TAG with 409.35
a.m.u.
Figure 1. ESI-MS/MS spectra of the [TAG]La3+ complex: [TAG12 + La]
3+ (top) and
[TAG8 + La]3+ (bottom). The parent ion is marked by an asterisk *.
0
200
400
600
800
1000
1200
0 500 1000 1500 2000m/z
inte
nsity
0
2000
4000
6000
8000
10000
500 1000 1500 2000m/z
inte
nsity
[G2+H]+
[G8+La]3+
[G9+La]3+
[G10+La]3+
[G11+La]3+
* [G12+La]3+
[G4 -H+La]2+
[G5 -H+La]2+
* [G8+La]3+
[G8 -H+La]2+
[G7 -H+La]2+
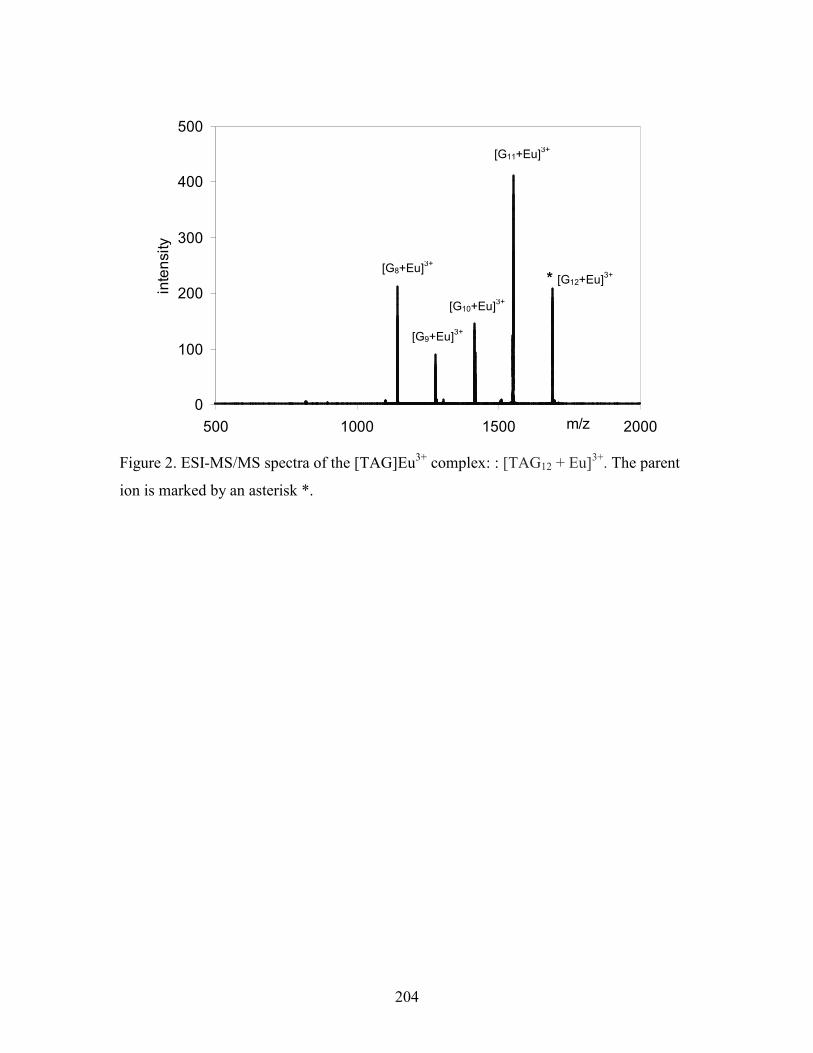
204
Figure 2. ESI-MS/MS spectra of the [TAG]Eu3+ complex: : [TAG12 + Eu]
3+. The parent
ion is marked by an asterisk *.
0
100
200
300
400
500
500 1000 1500 2000m/z
inte
nsity
[G8+Eu]3+
[G9+Eu]3+
[G10+Eu]3+
[G11+Eu]3+
* [G12+Eu]3+
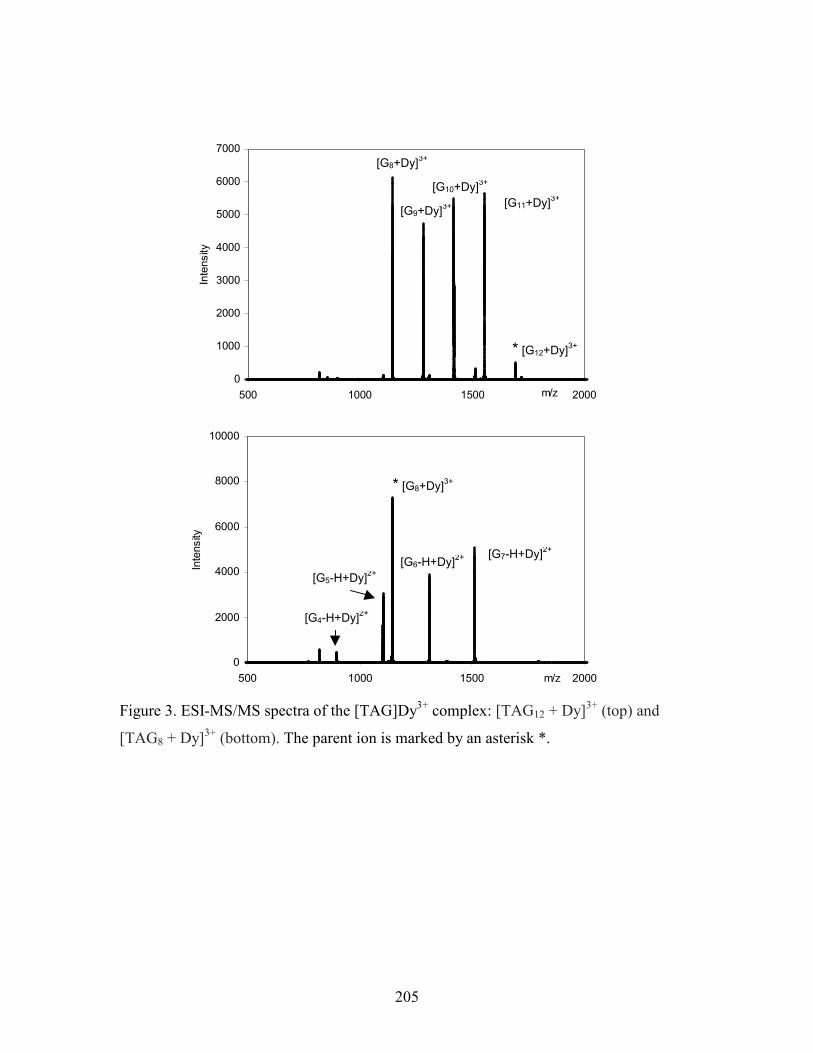
205
Figure 3. ESI-MS/MS spectra of the [TAG]Dy3+ complex: [TAG12 + Dy]
3+ (top) and
[TAG8 + Dy]3+ (bottom). The parent ion is marked by an asterisk *.
0
1000
2000
3000
4000
5000
6000
7000
500 1000 1500 2000m/z
Inte
nsity
0
2000
4000
6000
8000
10000
500 1000 1500 2000m/z
Inte
nsity
[G8+Dy]3+
[G9+Dy]3+
[G10+Dy]3+
[G11+Dy]3+
* [G12+Dy]3+
* [G8+Dy]3+
[G6-H+Dy]2+ [G7-H+Dy]
2+
[G5-H+Dy]2+
[G4-H+Dy]2+

206
Figure 4. ESI-MS/MS spectra of the [TAG]Tm3+ complex: [TAG12 + Tm]
3+ (top) and
[TAG8 + Tm]3+ (bottom). The parent ion is marked by an asterisk *.
0
5000
10000
15000
20000
500 1000 1500 2000m/z
Inte
ns
ity
0
1000
2000
3000
500 1000 1500 2000m/z
Inte
nsity
[G8+Tm]3+
[G9+Tm]3+
[G10+Tm]3+
[G11+Tm]3+
* [G8+Tm]3+
* [G8+Tm]3+
[G7-H+Tm]2+
[G6-H+Tm]2+
[G5-H+Tm]2+
[G4-H+Tm]2+

207
Table 1a. TANDEM MS of [M12+La]3+ (1683.1 m/z) at DP80. G = monomeric TAG
with 409.36 a.m.u.
[TAG]nLa3+n m/z Rel. intensity
[G+H]+ 410.1 15.8
[G2+H]+ 819.2 8.2
[G8+La]3+ 1137.3 100.0
[G9+La]3+ 1273.7 51.3
[G10+La]3+ 1410.1 81.8
[G11+La]3+ 1546.4 86.9
[G12+La]3+ 1683.1 48.5
Table 1b. TANDEM MS of [M8+La]3+ (1137.7 m/z) at DP80. G = monomeric TAG with
409.36 a.m.u.
[TAG]nLa3+n m/z Rel. intensity
monoacetyl sugar 139.0 43.3 guanine 152.0 24.5 triacetyl sugar 250.1 76.3 [G+H]+ 410.1 100.0 [G3-3H+La+Eu]2+ 758.2 6.9 [G4-H+La]2+ 887.2 44.6 [G5-H+La]2+ 1091.8 30.1 [G8+La]3+ 1137.7 14.2 [G6-H+La]2+ 1296.9 8.2 [G3-2H+La]+ 1364.3 6.2
Table 2. TANDEM MS of [M12+Eu]3+ (1687.8 m/z) at DP80. G = monomeric TAG with
409.36 a.m.u.
[TAG]nEu
3+n m/z Rel. intensity
[G+H]+ 410.1 5.8 [G8+Eu]3+ 1142.3 51.8 [G9+Eu]3+ 1278.7 21.9 [G10+Eu]3+ 1415.1 35.5 [G11+Eu]3+ 1551.7 100.0 [G12+Eu]3+ 1687.8 50.9

208
Table 3a. TANDEM MS of [M12+Tb]3+ (1689.4 m/z) at DP80. G = monomeric TAG
with 409.36 a.m.u.
[TAG]nTb3+n m/z Rel. intensity
[G+H]+ 410.2 0.9 [G8+Tb]3+ 1144.3 33.4 [G9+Tb]3+ 1280.7 24.8 [G10+Tb]3+ 1417.4 36.8 [G11+Tb]3+ 1553.4 100.0 [G12+Tb]3+ 1689.4 77.5
Table 3b. TANDEM MS of [M8+Tb]3+ (1143.9 m/z) at DP80. G = monomeric TAG with
409.36 a.m.u.
[TAG]nTb3+n m/z Rel. intensity
guanine 152.1 12.9 triacetyl sugar 259.1 48.1 [G+H]+ 410.1 100.0 [G2+H]+ 819.3 1.6 [G4-H+Tb]2+ 897.7 3.7 [G5-H+Tb]2+ 1101.8 27.1 [G6-H+Tb]2+ 1306.8 26.5 [G7-H+Tb]2+ 1511.4 32.4 [G8+Tb]3+ 1143.9 60.6
Table 4a. TANDEM MS of [M12+Dy]3+ (1691.4 m/z) at DP80. G = monomeric TAG
with 409.36 a.m.u.
[TAG]nDy3+n m/z Rel. intensity
[G+H]+ 410.1 10.4
[G2+H]+ 819.7 2.3
[G8+Dy]3+ 1145.6 108.5
[G9+Dy]3+ 1282.0 83.9
[G10+Dy]3+ 1418.7 97.0
[G11+Dy]3+ 1555.1 100.0
[G12+Dy]3+ 1691.4 7.7
[G5-H+Dy]2+ 1104.3 2.4
[G6-H+Dy]2+ 1308.9 2.4
[G7-H+Dy]2+ 1513.4 5.7

209
[G8-H+Dy]2+ 1718.0 1.3
Table 4b. TANDEM MS of [M8+Dy]3+ (1144.6 m/z) at DP80. G = monomeric TAG
with 409.36 a.m.u.
[TAG]nDy3+n m/z Rel. intensity
guanine 152 12.9 triacetyl sugar 259 31.0
[G+H]+ 410.1 100.0
[G2+H]+ 819.3 2.8
[G4-H+Dy]2+ 899.2 2.7
[G5-H+Dy]2+ 1103.8 19.6
[G6-H+Dy]2+ 1308.3 24.4
[G7-H+Dy]2+ 1512.9 32.5
[G8+Dy]3+ 1144.6 46.4
Table 5a. TANDEM MS of [M12+Tm]3+ (1692.8 m/z) at DP80. G = monomeric TAG
with 409.36 a.m.u.
[TAG]nTm3+n m/z Rel. intensity
[G+H]+ 410.1 8.5
[G2+H]+ 819.3 3.1
[G5-H+Tm]2+ 1106.8 1.6
[G6-H+Tm]2+ 1311.4 1.8
[G7-H+Tm]2+ 1516.4 4.8
[G8-H+Tm]2+ 1720.9 0.9
[G8+Tm]3+ 1147.7 64.4
[G9+Tm]3+ 1284.0 62.2
[G10+Tm]3+ 1420.4 83.7
[G11+Tm]3+ 1556.8 100
[G12+Tm]3+ 1692.8 21.1

210
Table 5b. TANDEM MS of [M8+Tm]3+ (1147.3 m/z) at DP80. G = monomeric TAG
with 409.36 amu.
[TAG]nTm3+n m/z Rel. intensity
guanine 152.1 6 triacetyl sugar 259.1 17.1
[G+H]+ 410.1 100.0
[G5-H+Tm]2+ 1106.8 11.4
[G6-H+Tm]2+ 1311.9 20.5
[G7-H+Tm]2+ 1516.4 24.8
[G8+Tm]3+ 1147.3 31.3

211
ESI-MS spectra of both theoretical and experimental data of [TAG]n-(cation-picrate)n
species. TAG = monomeric 2′,3′-5′-O-triacetylguanosine with 409.35 a.m.u.
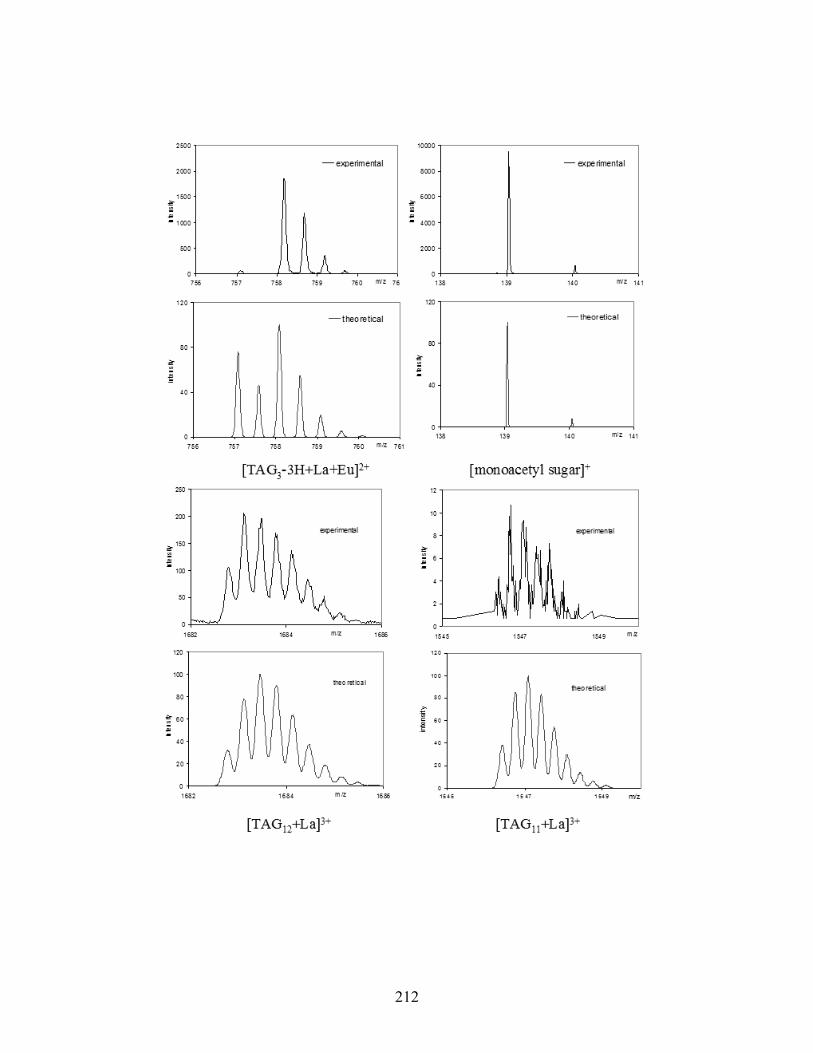
212

213
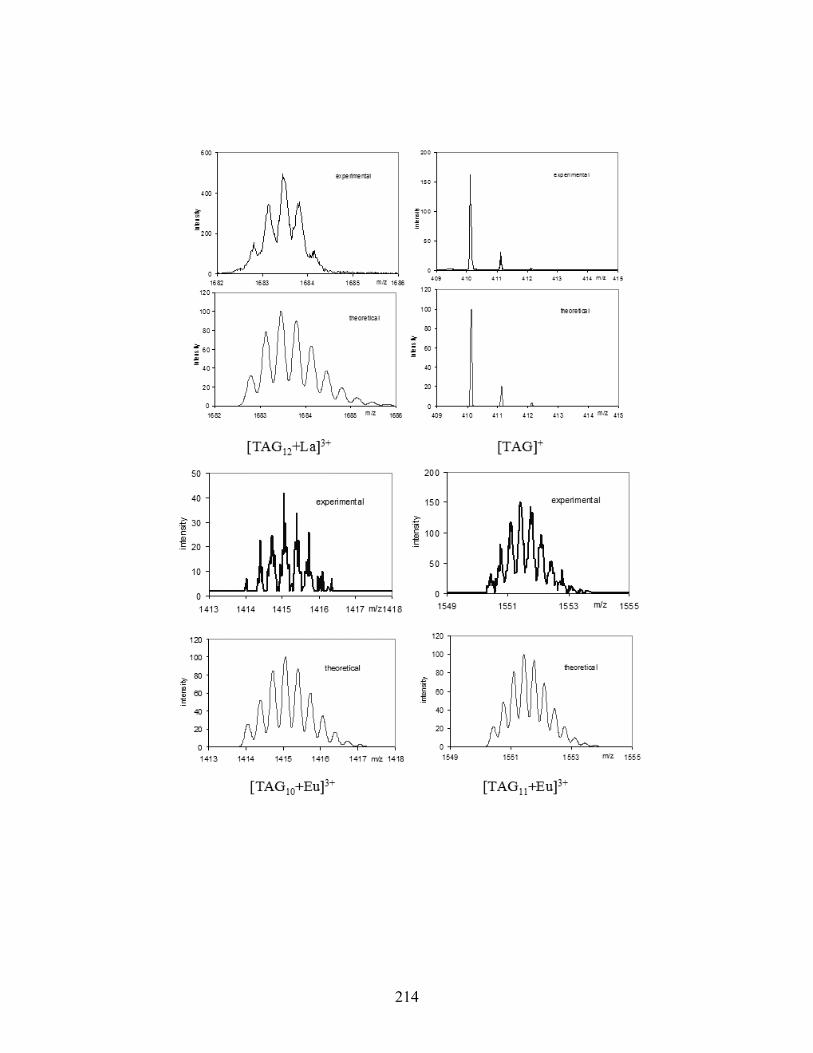
214

215
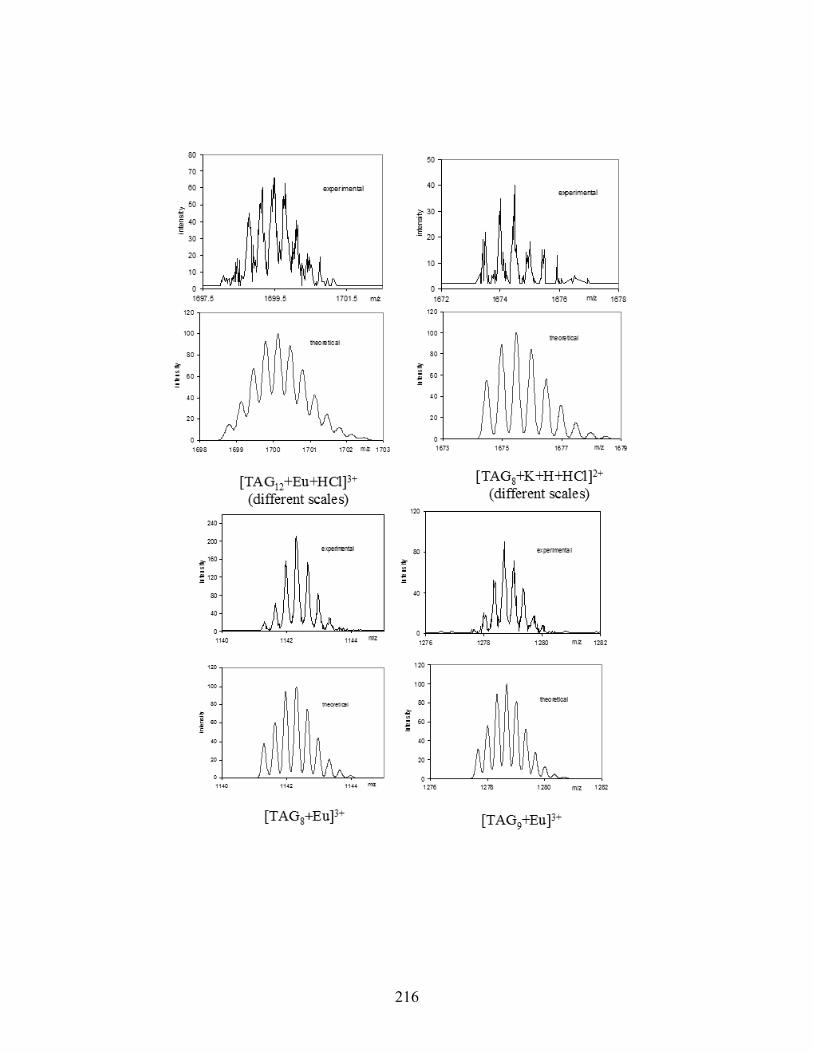
216

217

218

219

220

221

222

223

224

225
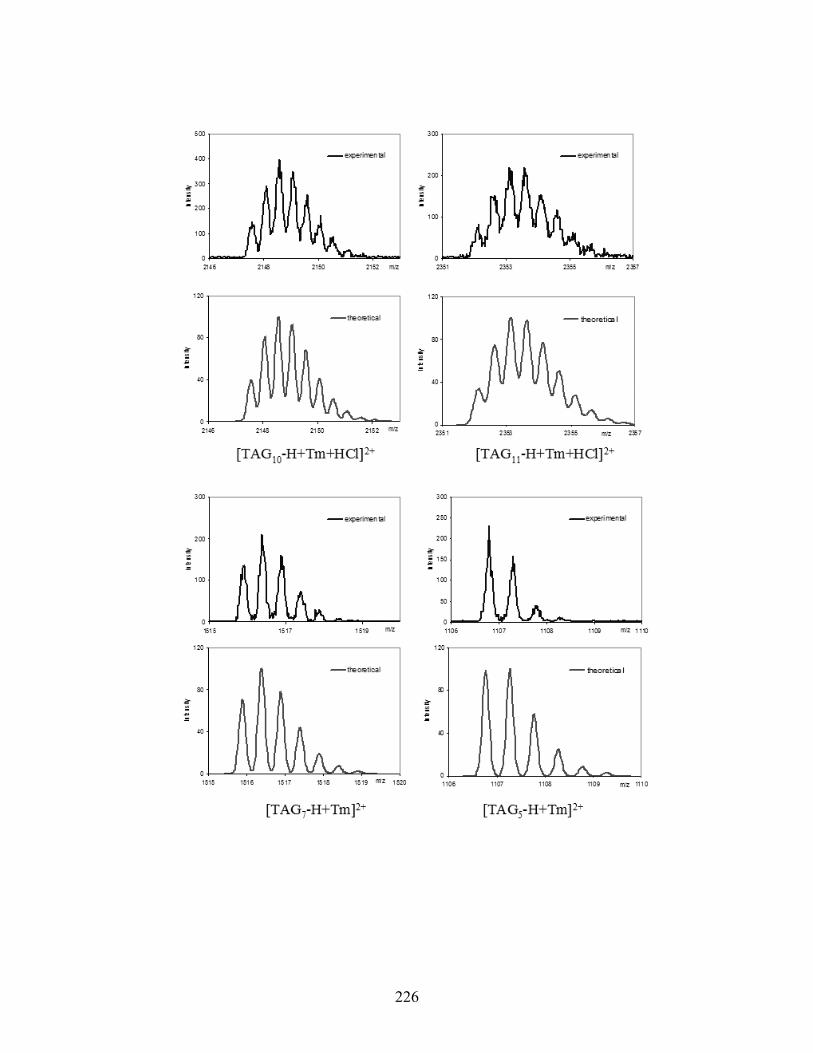
226

227
Appendix IX: (Chapter 5)
ESI-MS spectra of both theoretical and experimental data of [TAG]n-(Ca2+picrate)n
species. TAG = monomeric 2′,3′-5′-O-triacetylguanosine with 409.35 a.m.u.

228