structural equations modeling – part 1: confirmatory factor ... · structural equations modeling...
TRANSCRIPT

Structural Equations Modeling – Part 1:Confirmatory Factor Analysis
Pekka Malo 30E00500 – Quantitative Empirical Research Spring 2016
Agenda
• Basic concepts
• Confirmatory Factor Analysis (CFA)
• Practical guidelines
• Tutorial on SPSS Amos and CFA
25.01.16 Confirmatory Factor Analysis
2

Section 1: What is Structural Equations Modeling?
3

What is SEM?
Structural equation modeling (SEM) is a collection of statistical techniques that allow a set of
relationships between one or more independent variables (IV’s), either continuous or discrete, and
one or more dependent variables (DV’s), either continuous or discrete, to be examined.
(~ Series of multiple regression equations)
25.01.16 Confirmatory Factor Analysis
4
Why use SEM?
1. Estimation of several interrelated relationships
2. Ability to represent unobserved (latent) concepts and correct for measurement error
3. Defines a model to explain an entire set of relationships
25.01.16 Confirmatory Factor Analysis
5
What is a latent construct?
• Represents theoretical concepts, which cannot be observed directly
• Similar to factors discussed in Exploratory Factor Analysis
• Needs to be measured indirectly using multiple measured variables (a.k.a. indicator or manifest variables)
25.01.16 Confirmatory Factor Analysis
6
Exogenous vs. Endogenous Constructs • Exogenous construct ~ latent, multi-item equivalent of an
independent variable – Variate (linear combination) of measures is used to represent a
construct
– Multiple measured variables represent the exogenous constructs
• Endogenous construct ~ latent, multi-item equivalent to a dependent variable
– Theoretically determined by factors within the model
– Multiple measured variables represent the endogenous constructs
25.01.16 Confirmatory Factor Analysis
7
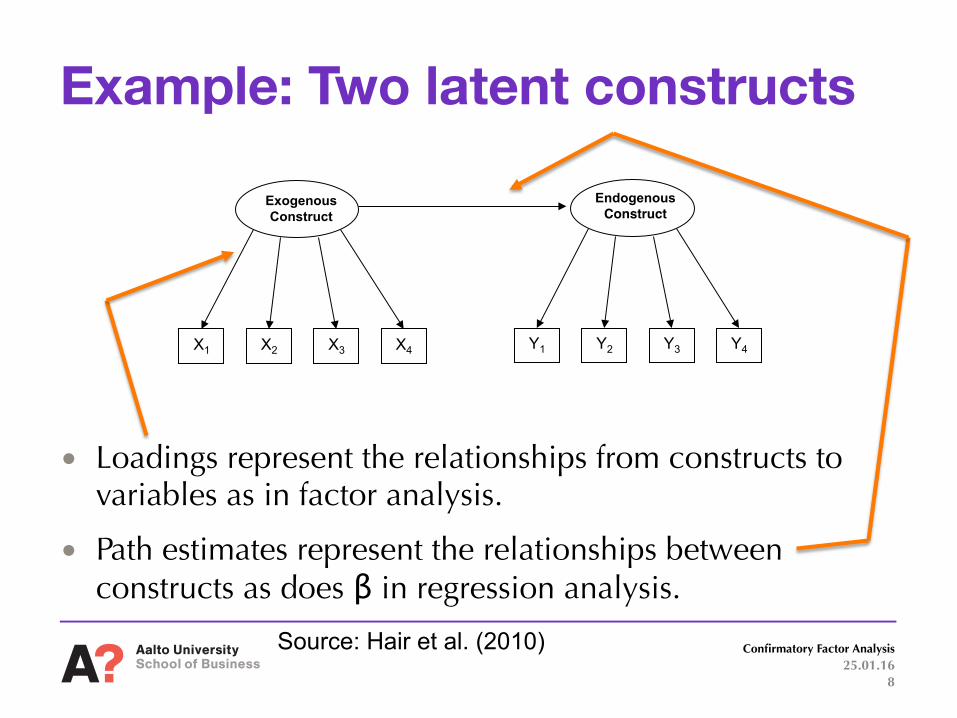
Example: Two latent constructs
• Loadings represent the relationships from constructs to variables as in factor analysis.
• Path estimates represent the relationships between constructs as does β in regression analysis.
Source: Hair et al. (2010)
EndogenousConstruct
Y1 Y2 Y3 Y4
Exogenous Construct
X1 X2 X3 X4
25.01.16 Confirmatory Factor Analysis
8
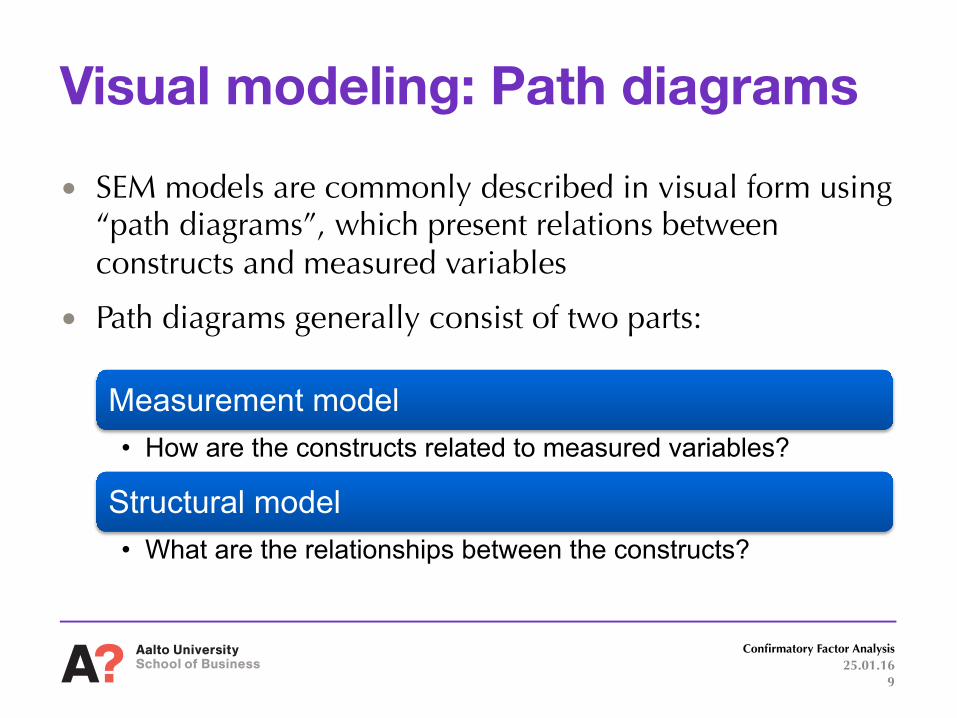
Visual modeling: Path diagrams • SEM models are commonly described in visual form using
“path diagrams”, which present relations between constructs and measured variables
• Path diagrams generally consist of two parts:
Measurement model • How are the constructs related to measured variables?
Structural model • What are the relationships between the constructs?
25.01.16 Confirmatory Factor Analysis
9
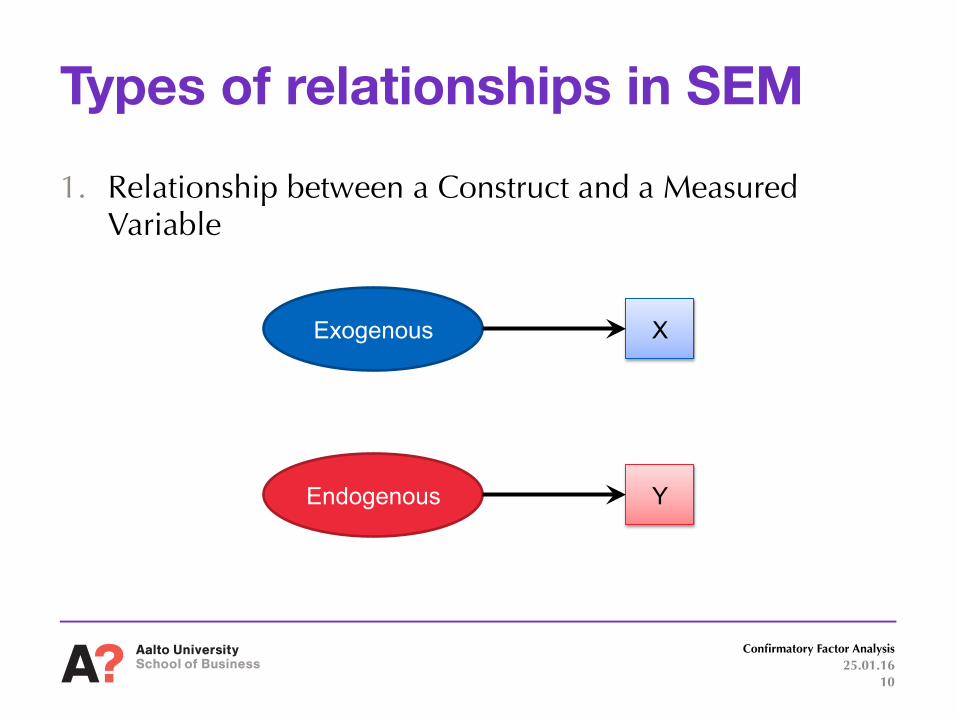
Types of relationships in SEM 1. Relationship between a Construct and a Measured
Variable
Endogenous
Exogenous X
Y
25.01.16 Confirmatory Factor Analysis
10
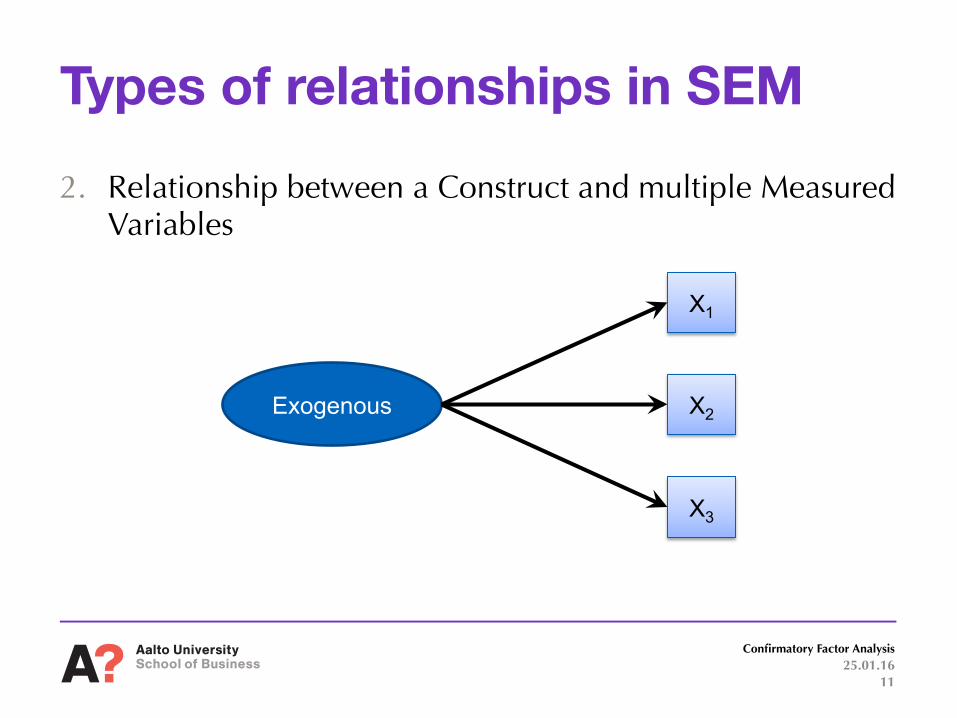
Types of relationships in SEM 2. Relationship between a Construct and multiple Measured
Variables
Exogenous
X1
X2
X3
25.01.16 Confirmatory Factor Analysis
11

Types of relationships in SEM 3. Dependence relationship between two constructs
(Structural relationship)
Exogenous Endogenous
25.01.16 Confirmatory Factor Analysis
12

Types of relationships in SEM 4. Correlational relationship between constructs
Construct 1
Construct 2
25.01.16 Confirmatory Factor Analysis
13
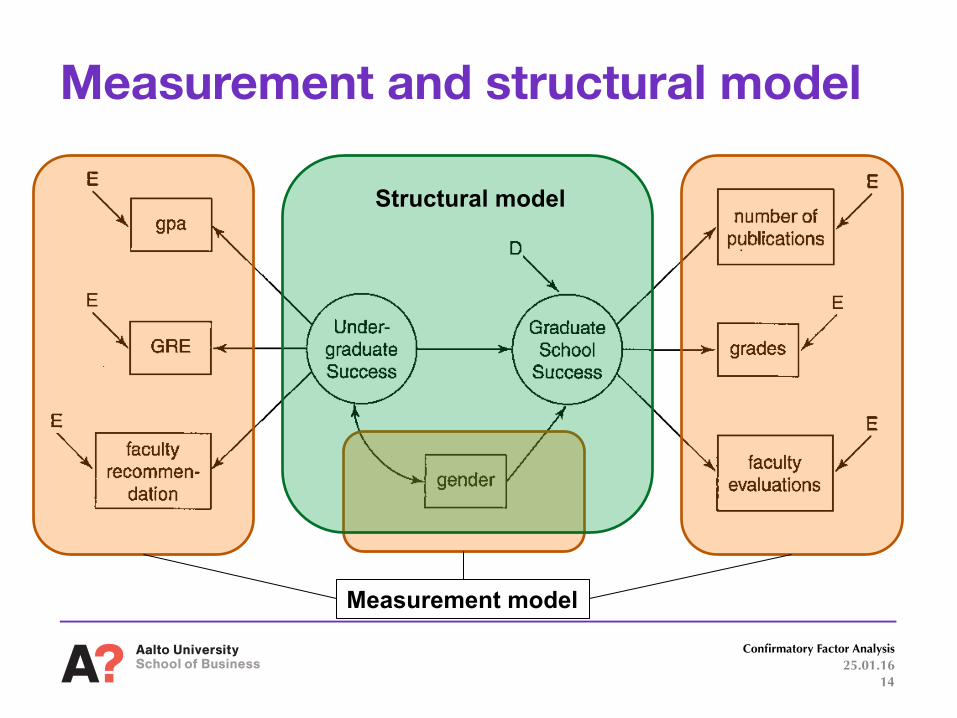
Measurement and structural model
Measurement model
Structural model
25.01.16 Confirmatory Factor Analysis
14
“Cause-and-effect” relationships
Substantial evidence required:
1. Covariation
2. Sequence
3. Non-spurious covariance
4. Theoretical support
25.01.16 Confirmatory Factor Analysis
15

Causal modeling in SEM?
25.01.16 Confirmatory Factor Analysis
16
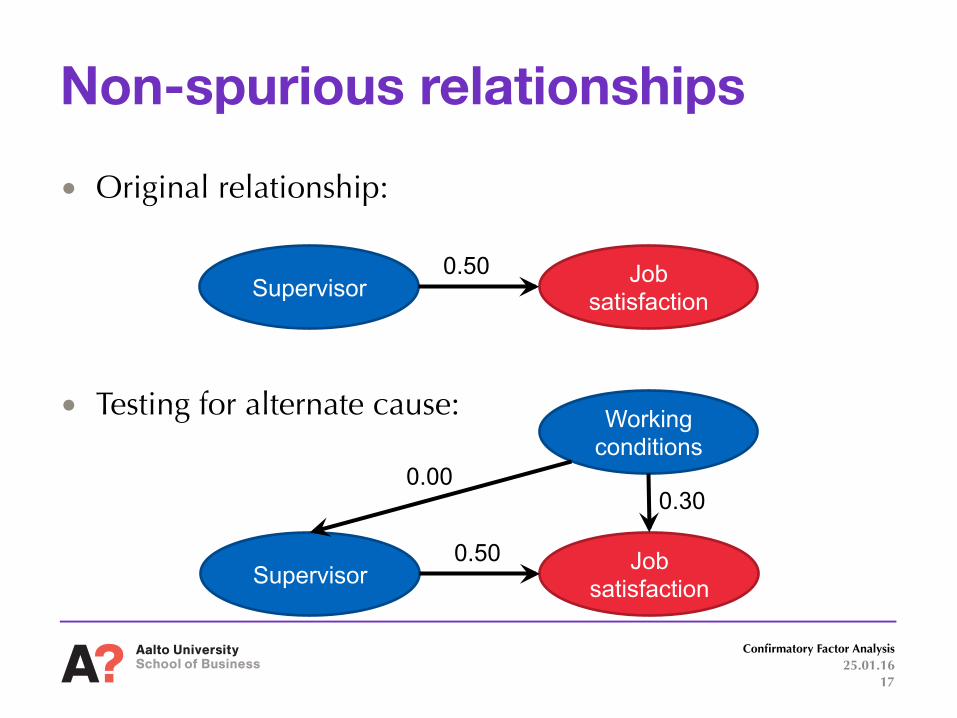
Non-spurious relationships • Original relationship:
• Testing for alternate cause:
Supervisor Job satisfaction
0.50
Supervisor Job satisfaction
Working conditions
0.50
0.00 0.30
25.01.16 Confirmatory Factor Analysis
17
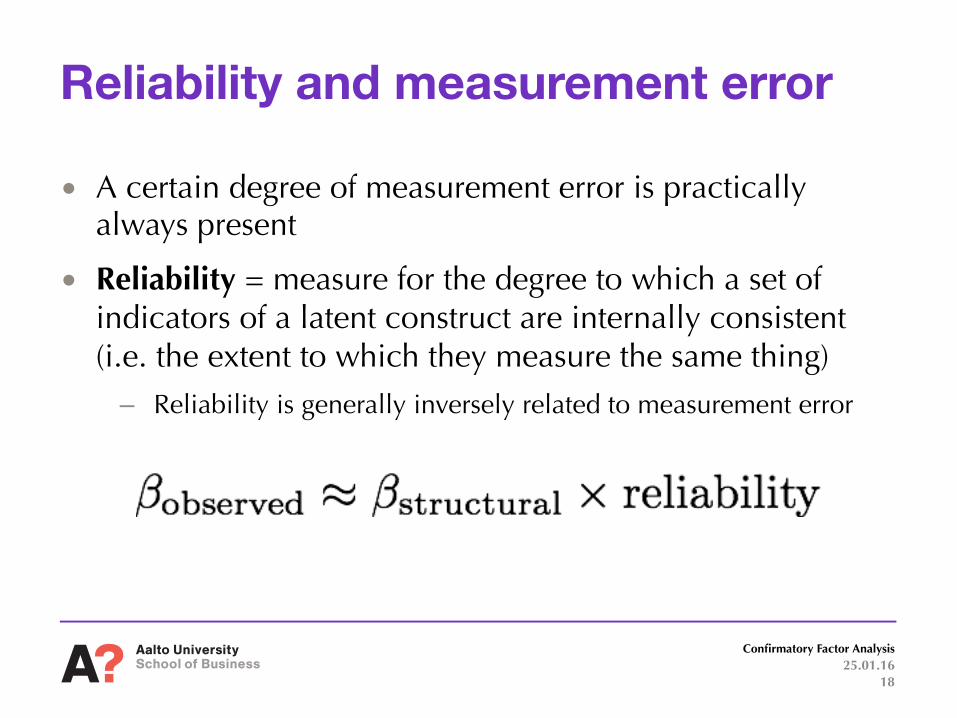
Reliability and measurement error
• A certain degree of measurement error is practically always present
• Reliability = measure for the degree to which a set of indicators of a latent construct are internally consistent (i.e. the extent to which they measure the same thing)
– Reliability is generally inversely related to measurement error
25.01.16 Confirmatory Factor Analysis
18
Improving statistical estimation • In the previous multivariate techniques, we have assumed
that we can overlook the measurement error in the variables
• SEM automatically applies a “correction” for the amount of measurement error and estimates the correct structural coefficient (i.e. the relationships between constructs)
• Relationship coefficients estimated by SEM tend to be larger than coefficients obtained from multiple regression
25.01.16 Confirmatory Factor Analysis
19

Strong theoretical basis needed
• No SEM model should be considered without an underlying theory
• Theory is needed for specifying the path diagram: – Measurement model
– Structural model
25.01.16 Confirmatory Factor Analysis
20
Modeling strategies • Confirmatory modeling strategy
– Specify a single model
– “It either works or it doesn’t”
• Competing models strategy – Multiple alternative specifications
– Strongest test is to compare models representing different but plausible hypothesized relationships
• Model development strategy – Basic model proposed as a starting point
– SEM used to get insights for re-specification
– Model needs to be verified with an independent sample
25.01.16 Confirmatory Factor Analysis
21
SEM and other multivariate techniques
• SEM is most appropriate when researcher has multiple constructs, each represented by several measurement variables
• SEM ~ hybrid of multiple regression, MANOVA and factor analysis
• Opposite of exploratory techniques; everything is theory driven
25.01.16 Confirmatory Factor Analysis
22
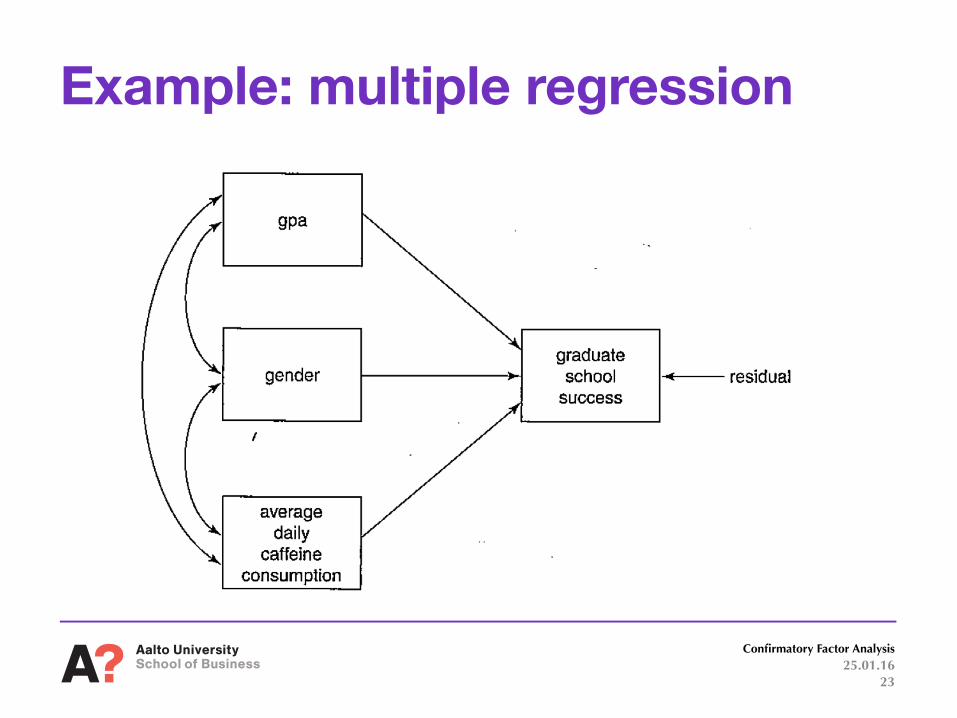
Example: multiple regression
25.01.16 Confirmatory Factor Analysis
23

Section 2: Confirmatory Factor Analysis
24
Confirmatory Factor Analysis
Similar to EFA in many respects, but with a completely different philosophy. With CFA,
researcher needs to specify both number of factors as well as what variables define the factors.
25.01.16 Confirmatory Factor Analysis
25
CFA as a tool for evaluating measurement model
• Specification of the measurement model is a crucial step in SEM (!)
• Commonly CFA is used as a tool to validate the measurement model before specifying and estimating the structural model:
– Are the constructs unidimensional and valid?
– How many indicators should be used for each construct?
– Are the measures able to portray the construct or explain it?
25.01.16 Confirmatory Factor Analysis
26
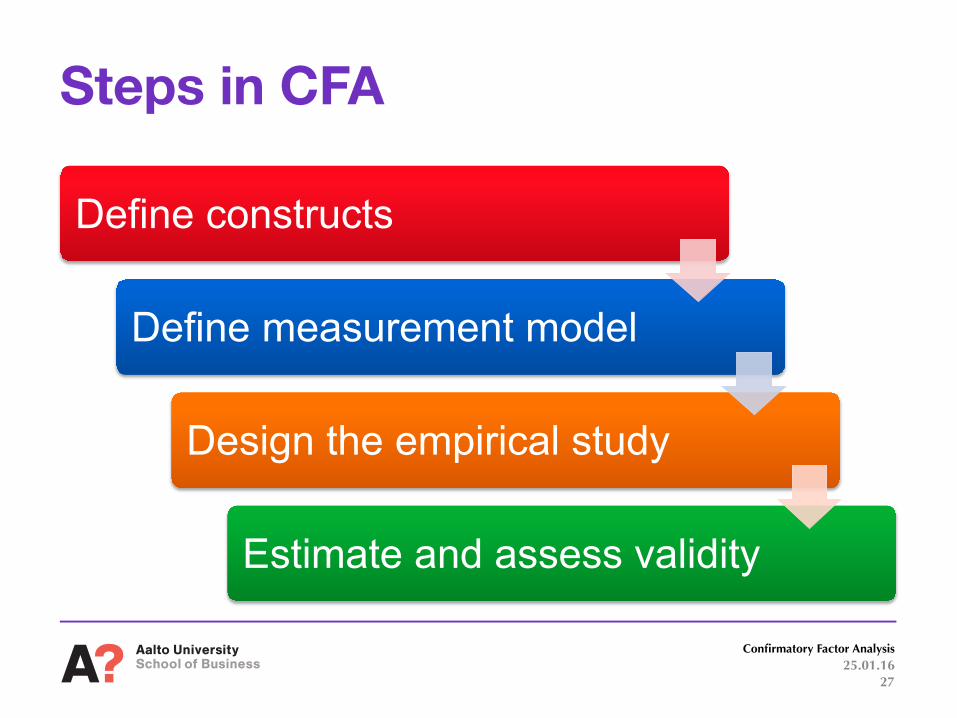
Steps in CFA
Define constructs
Define measurement model
Design the empirical study
Estimate and assess validity
25.01.16 Confirmatory Factor Analysis
27

Step 1: Defining the constructs
• Operationalization
• Scales from prior research
• Development of new scales
• Pretesting
25.01.16 Confirmatory Factor Analysis
28

Step 2: Defining the measurement model
• Are the constructs unidimensional (i.e. no cross-loadings)?
• Is the measurement model congeneric (i.e. no covariance between or within construct error variances)?
• Is there a sufficient number of indicators per construct (i.e. ensure identification)?
25.01.16 Confirmatory Factor Analysis
29
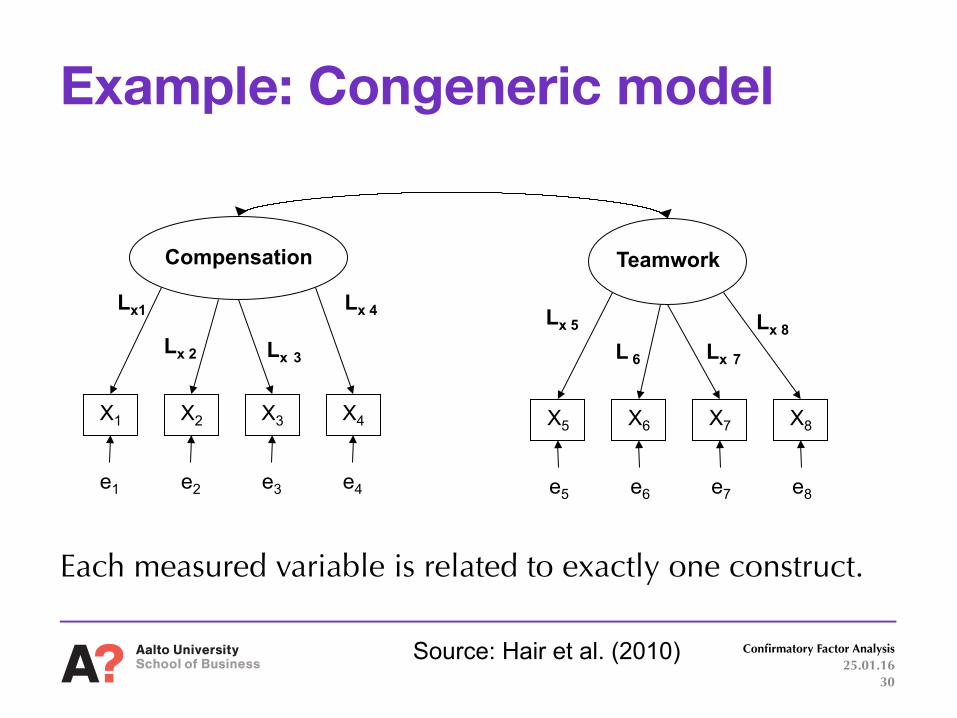
Compensation
X1 X2 X3 X4
e1 e2 e3 e4
Lx1
Lx 2 Lx 3
Lx 4
Teamwork
X5 X6 X7 X8
e5 e6 e7 e8
Lx 5 L 6 Lx 7
Lx 8
Source: Hair et al. (2010)
Example: Congeneric model
Each measured variable is related to exactly one construct.
25.01.16 Confirmatory Factor Analysis
30
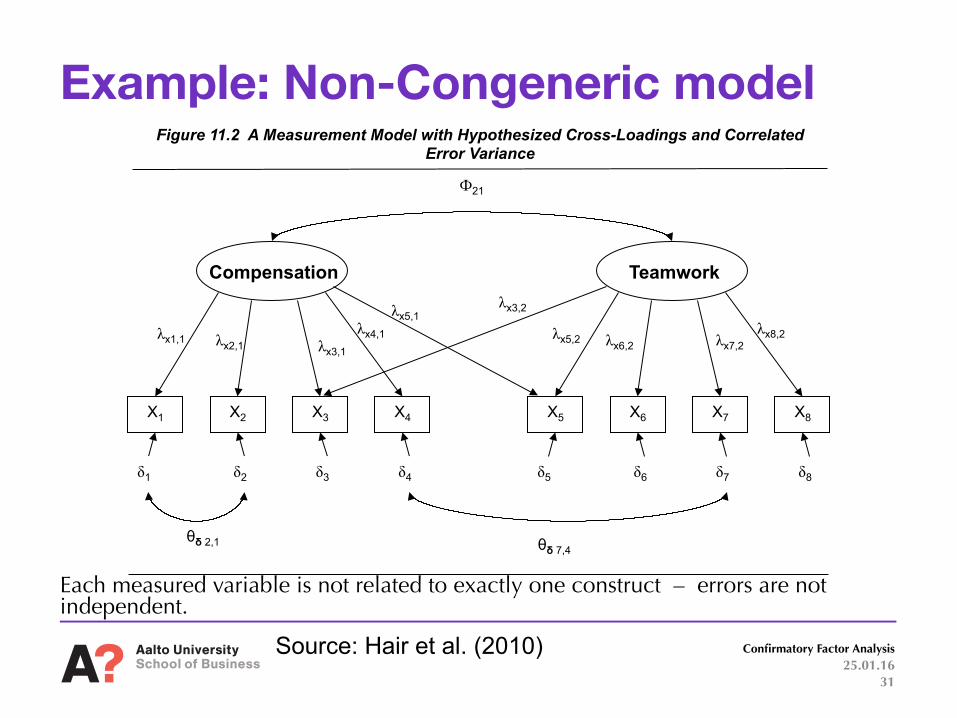
X5 X6 X7 X8
δ5 δ6 δ7 δ8
λx5,2 λx6,2 λx7,2 λx8,2
X1 X2 X3 X4
λx1,1 λx2,1 λx3,1 λx4,1
λx3,2 λx5,1
δ1 δ2 δ3 δ4
Ф21
θδ 2,1 θδ 7,4
Figure 11.2 A Measurement Model with Hypothesized Cross-Loadings and Correlated Error Variance
Compensation Teamwork
Source: Hair et al. (2010)
Example: Non-Congeneric model
Each measured variable is not related to exactly one construct – errors are not independent.
25.01.16 Confirmatory Factor Analysis
31

Items per construct • Good practice dictates a minimum of 3 indicator variables
per construct (4 is preferred)
• Assessment of single-item constructs is problematic (if included, they don’t generally stand for latent constructs)
• Rationale for requirement of 3 indicators: – Measurement model with a single constructs and only 2
indicators is under-identified (= there are more parameters than unique covariances)
– Remember: the number of unique variances and covariances in the observed covariance matrix = degrees of freedom
25.01.16
Confirmatory Factor Analysis
32

Measured Items X1=Cheerful X2=Stimulated X3=Lively X4=Bright
Loading Estimates λx 1,1=0.78 λx 2,1=0.89 λx 3,1=0.83 λx 4,1=0.87
Error Variance Estimates θδ1,1=0.39 θδ2,2=0.21 θδ3,3=0.31 θδ4,4=0.24
Eight paths to estimate
10 unique variance-covariance terms
ξ1
X1 X2 X3 X4
δ1 δ2 δ3 δ4
λx 1,1 λx 2,1 λx
3,1 λx 4,1
θδ 1,1 θδ 2,2 θδ 3,3 θδ 4,4
Symmetric Covariance Matrix: | X1 X2 X3 X4 --------------------------------------- X1 | 2.01 X2 | 1.43 2.01 X3 | 1.31 1.56 2.24 X4 | 1.36 1.54 1.57 2.00 Model Fit: χ2 = 14.9 df = 2 p = .001 CFI = .99
Source: Hair et al. (2010)
Example: Over-identified construct
25.01.16 Confirmatory Factor Analysis
33
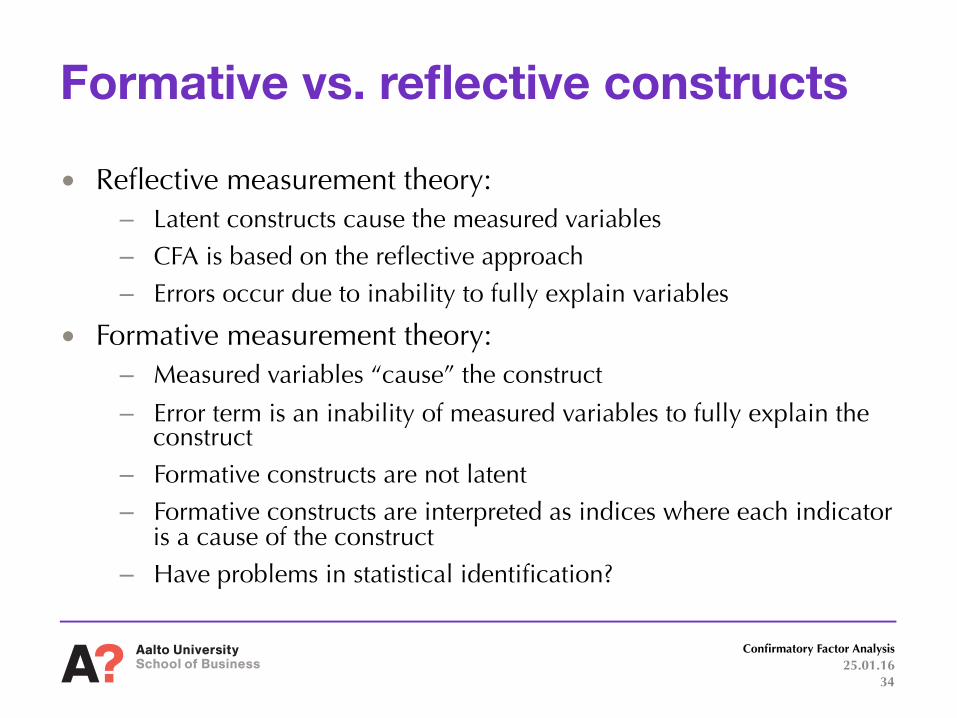
Formative vs. reflective constructs
• Reflective measurement theory: – Latent constructs cause the measured variables – CFA is based on the reflective approach – Errors occur due to inability to fully explain variables
• Formative measurement theory: – Measured variables “cause” the construct
– Error term is an inability of measured variables to fully explain the construct
– Formative constructs are not latent – Formative constructs are interpreted as indices where each indicator
is a cause of the construct – Have problems in statistical identification?
25.01.16 Confirmatory Factor Analysis
34
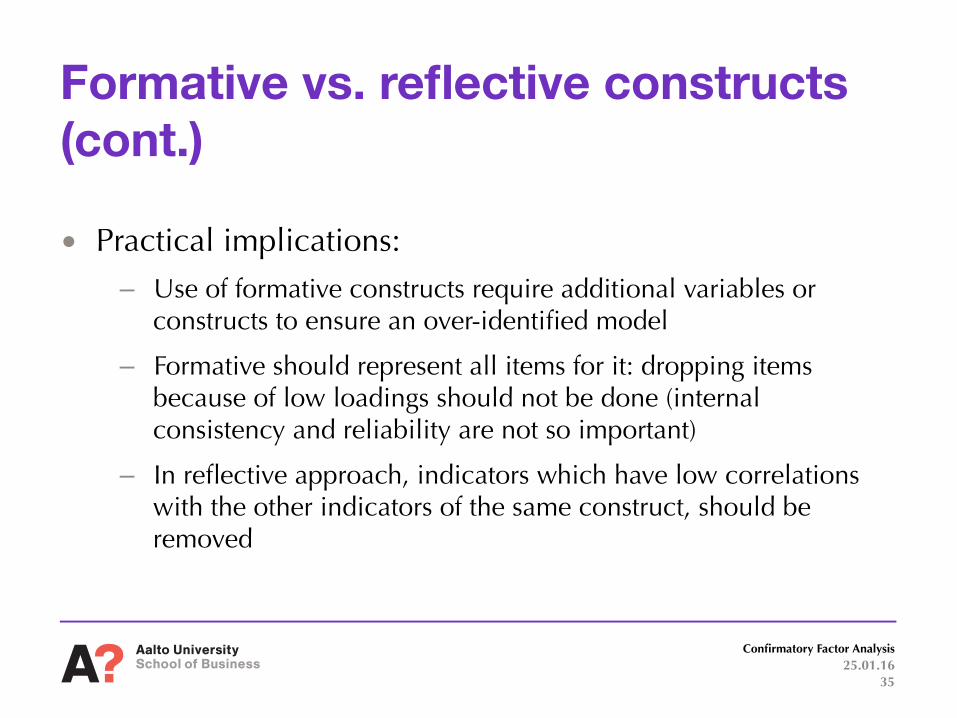
Formative vs. reflective constructs (cont.)
• Practical implications: – Use of formative constructs require additional variables or
constructs to ensure an over-identified model
– Formative should represent all items for it: dropping items because of low loadings should not be done (internal consistency and reliability are not so important)
– In reflective approach, indicators which have low correlations with the other indicators of the same construct, should be removed
25.01.16 Confirmatory Factor Analysis
35

Step 3: Design the empirical study
• Choice of measurement scales
• Sampling issues
• Model specification and identification issues
• Countering potential estimation problems
25.01.16 Confirmatory Factor Analysis
36
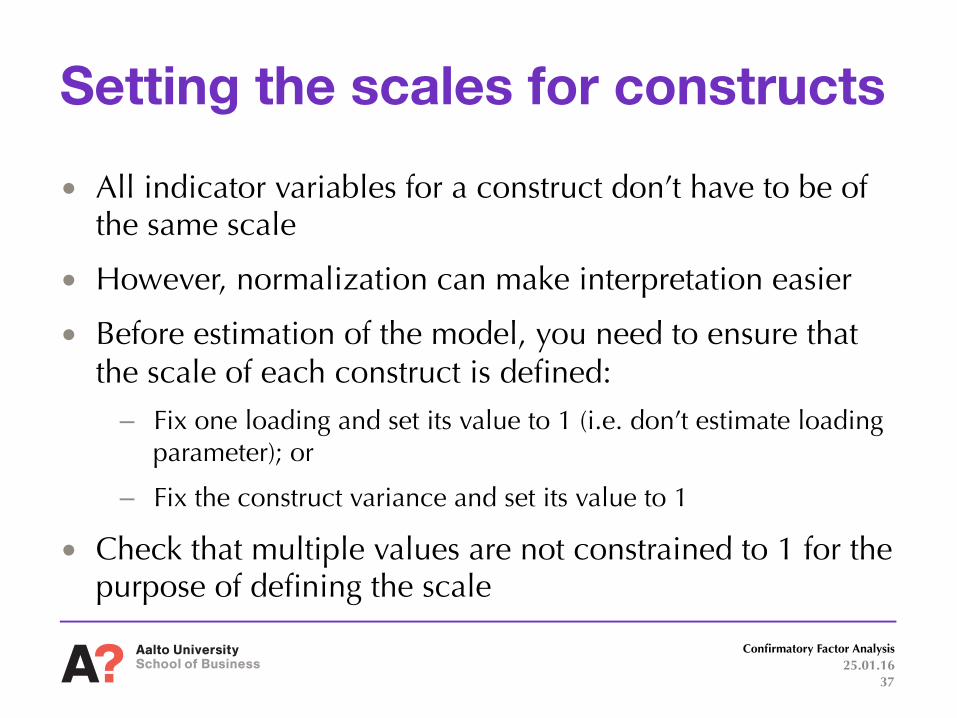
Setting the scales for constructs • All indicator variables for a construct don’t have to be of
the same scale
• However, normalization can make interpretation easier
• Before estimation of the model, you need to ensure that the scale of each construct is defined:
– Fix one loading and set its value to 1 (i.e. don’t estimate loading parameter); or
– Fix the construct variance and set its value to 1
• Check that multiple values are not constrained to 1 for the purpose of defining the scale
25.01.16 Confirmatory Factor Analysis
37
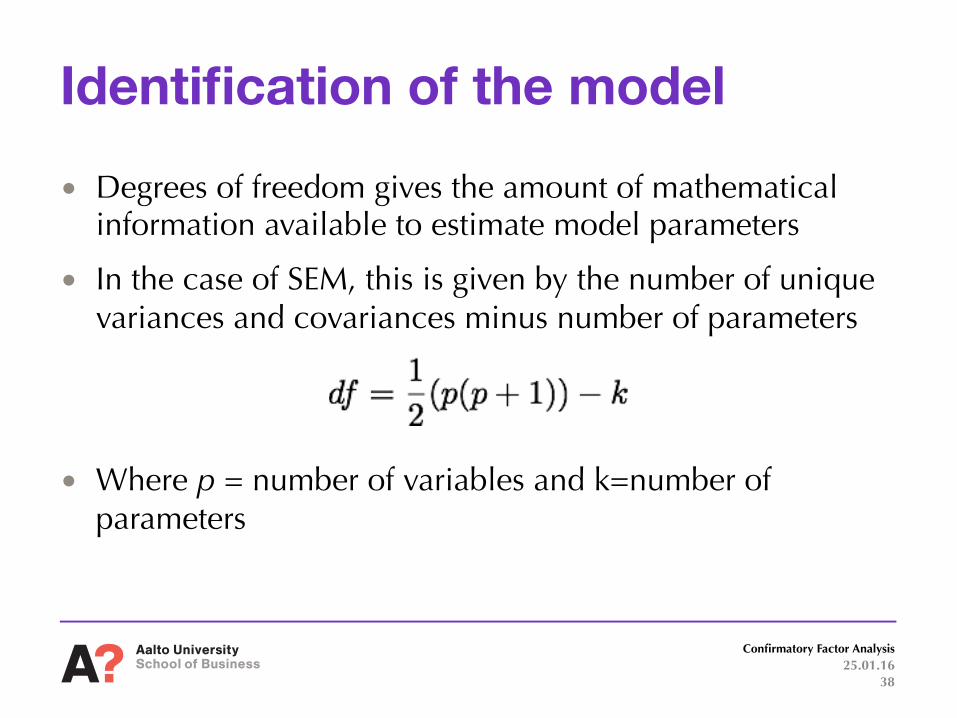
Identification of the model • Degrees of freedom gives the amount of mathematical
information available to estimate model parameters
• In the case of SEM, this is given by the number of unique variances and covariances minus number of parameters
• Where p = number of variables and k=number of parameters
25.01.16 Confirmatory Factor Analysis
38
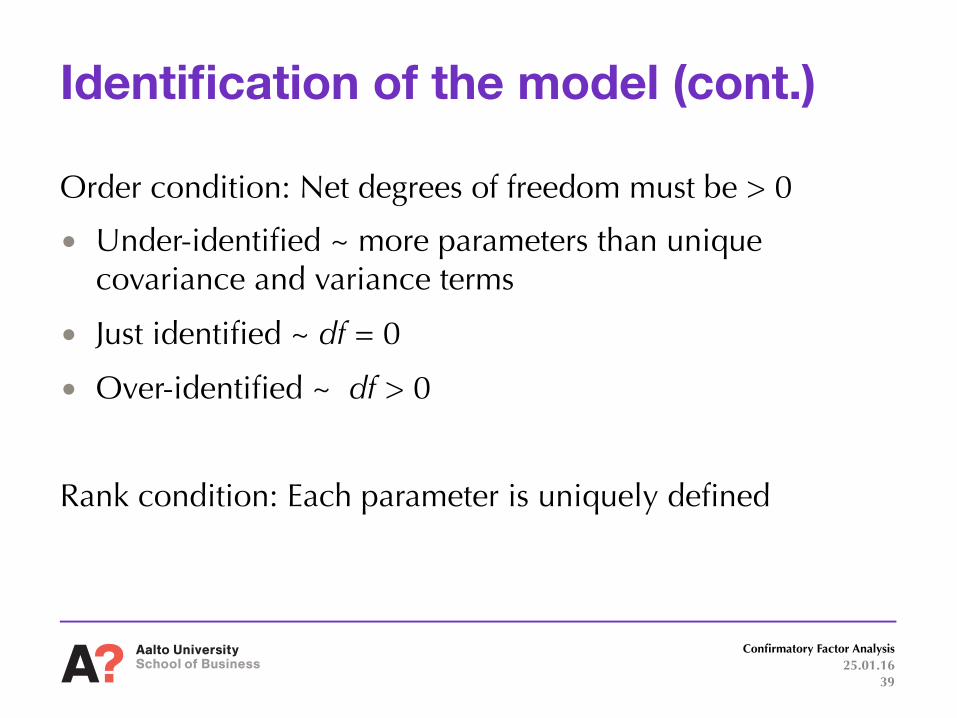
Identification of the model (cont.)
Order condition: Net degrees of freedom must be > 0
• Under-identified ~ more parameters than unique covariance and variance terms
• Just identified ~ df = 0
• Over-identified ~ df > 0
Rank condition: Each parameter is uniquely defined
25.01.16 Confirmatory Factor Analysis
39
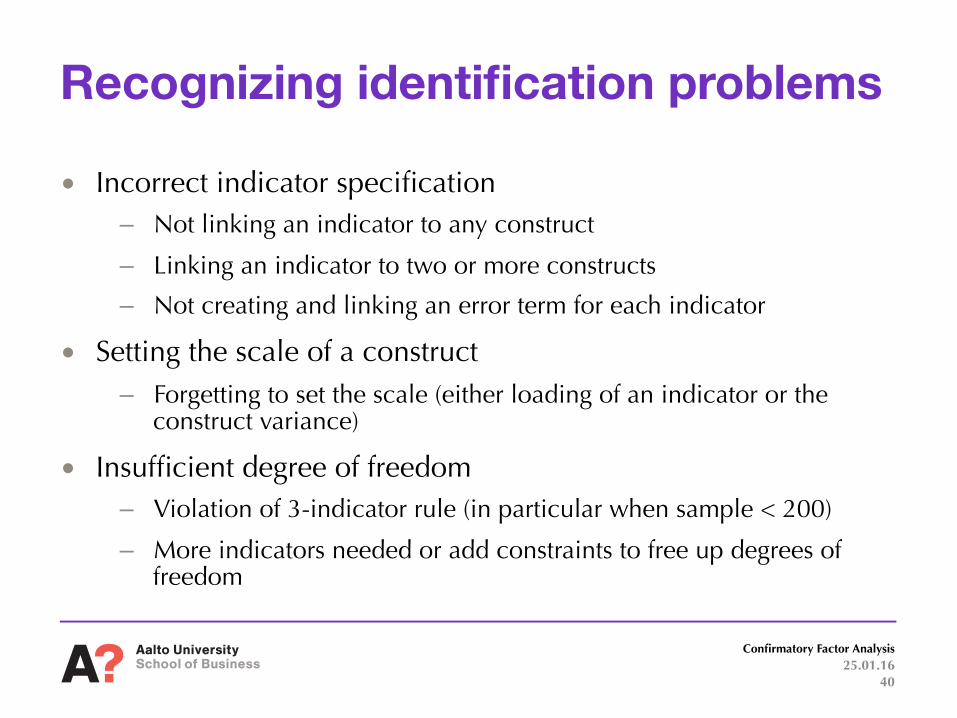
Recognizing identification problems
• Incorrect indicator specification – Not linking an indicator to any construct
– Linking an indicator to two or more constructs
– Not creating and linking an error term for each indicator
• Setting the scale of a construct – Forgetting to set the scale (either loading of an indicator or the
construct variance)
• Insufficient degree of freedom – Violation of 3-indicator rule (in particular when sample < 200)
– More indicators needed or add constraints to free up degrees of freedom
25.01.16 Confirmatory Factor Analysis
40

Recognizing identification problems (cont.)
• Very large standard errors
• Inability to invert the information matrix (no solution found)
• Wildly unreasonable estimates, including negative error variances
• Unstable parameter values
25.01.16 Confirmatory Factor Analysis
41
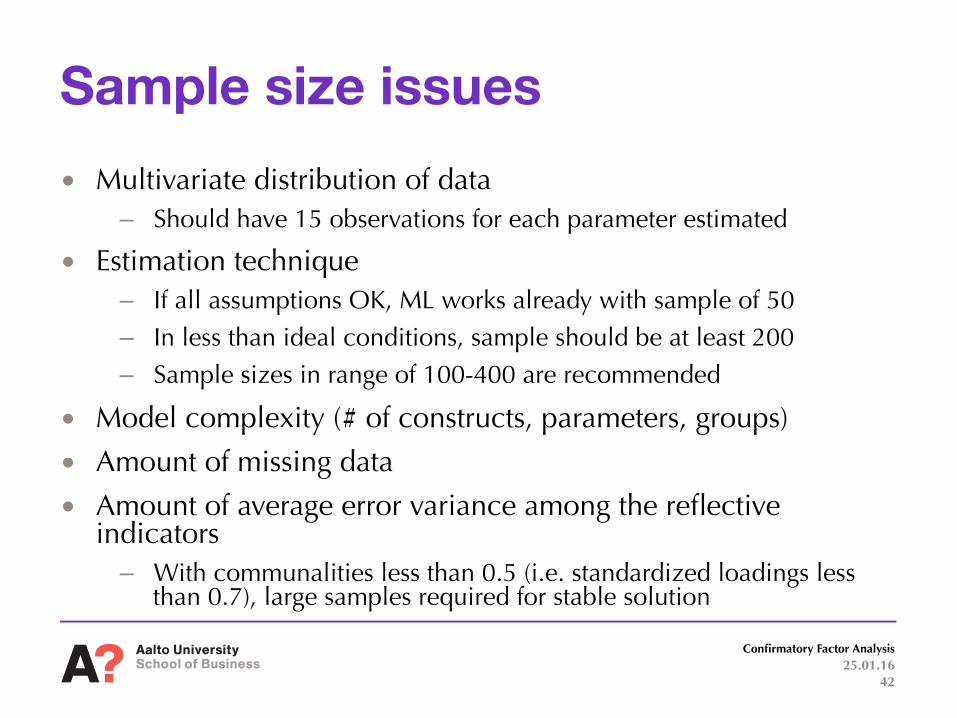
Sample size issues • Multivariate distribution of data
– Should have 15 observations for each parameter estimated
• Estimation technique – If all assumptions OK, ML works already with sample of 50 – In less than ideal conditions, sample should be at least 200 – Sample sizes in range of 100-400 are recommended
• Model complexity (# of constructs, parameters, groups)
• Amount of missing data
• Amount of average error variance among the reflective indicators
– With communalities less than 0.5 (i.e. standardized loadings less than 0.7), large samples required for stable solution
25.01.16 Confirmatory Factor Analysis
42
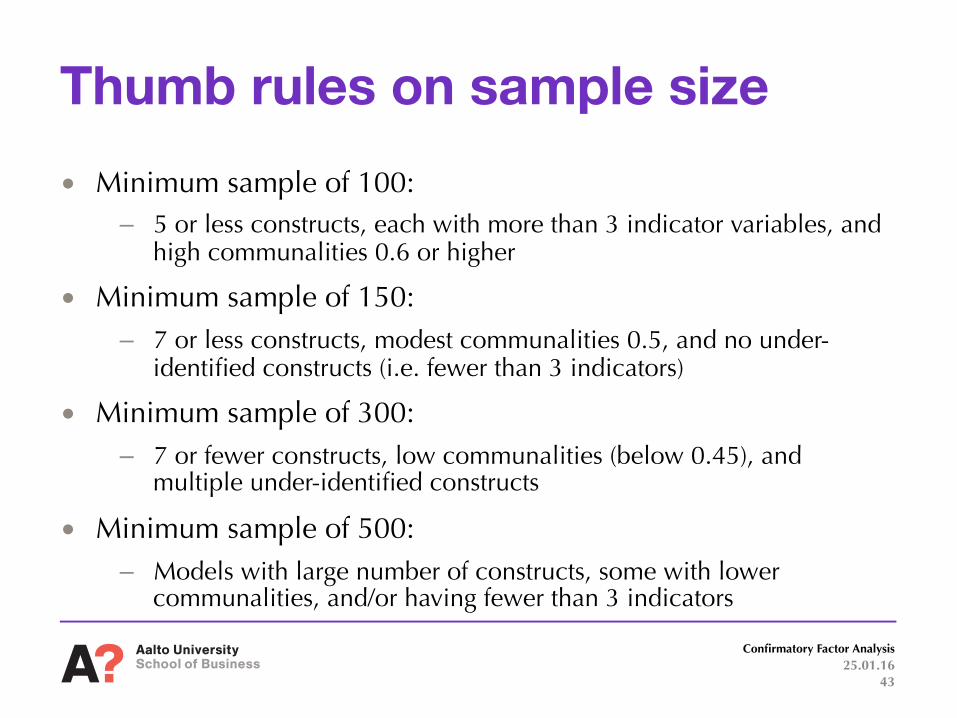
Thumb rules on sample size • Minimum sample of 100:
– 5 or less constructs, each with more than 3 indicator variables, and high communalities 0.6 or higher
• Minimum sample of 150: – 7 or less constructs, modest communalities 0.5, and no under-
identified constructs (i.e. fewer than 3 indicators)
• Minimum sample of 300: – 7 or fewer constructs, low communalities (below 0.45), and
multiple under-identified constructs
• Minimum sample of 500: – Models with large number of constructs, some with lower
communalities, and/or having fewer than 3 indicators
25.01.16 Confirmatory Factor Analysis
43
Step 4: Examination of model validity
• Are the constructs valid?
• Is the model fit acceptable?
• Diagnostics?
25.01.16 Confirmatory Factor Analysis
44
Construct validity • SEM can be used to evaluate the validity of constructs (i.e.
to what extent do the measured items reflect the theoretical latent construct?)
• Aspects of construct validity: – Convergent validity: loadings, variance extracted, reliability
– Discriminant validity
– Nomological validity
– Face validity
25.01.16 Confirmatory Factor Analysis
45
Convergent validity • Indicators of a specific construct should “converge” or
share a high proportion of variance in common
• Statistics for convergent validity – Loadings
– Average variance extracted
– Reliability
25.01.16 Confirmatory Factor Analysis
46

Statistics for convergent validity • Standardized factor loadings and squared factor loadings
– High loadings indicate convergence
– Should be statistically significant
• AVE = average variance extracted
– where squared standardized factor loadings indicate the amount
of variation in the indicator that can be explained by the factor
– AVE > 0.5 => adequate convergence
25.01.16
Confirmatory Factor Analysis
47
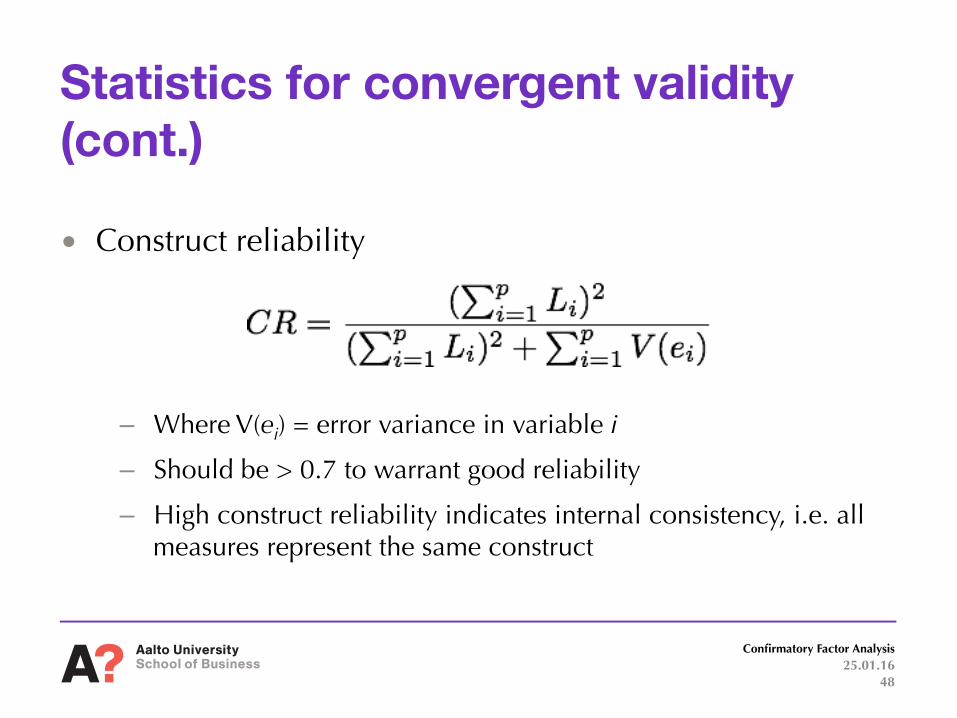
Statistics for convergent validity(cont.)
• Construct reliability
– Where V(ei) = error variance in variable i
– Should be > 0.7 to warrant good reliability
– High construct reliability indicates internal consistency, i.e. all measures represent the same construct
25.01.16 Confirmatory Factor Analysis
48
Guidelines for evaluating convergent and discriminant validity
• Estimated loadings should be 0.5 or higher
• AVE should be 0.5 or higher to support convergent validity
• AVE estimates for two factors should be greater than the square of the correlation between two factors to provide evidence of discriminant validity
• Construct reliability should be 0.7 or higher to suggest convergence and internal consistency
25.01.16 Confirmatory Factor Analysis
49
Discriminant validity • Is the construct unique?
• Does it differ from other constructs?
• Do the individual indicator variables represent only one latent construct?
• Examine correlations between constructs
• Presence of cross-loadings is an indicator of discriminant validity problems
25.01.16 Confirmatory Factor Analysis
50

Nomological and face validity • Face validity ~ “looks like it will work”
– Needs to be established before experiment
– Ensure understanding of every indicators content and meaning
• Nomological validity ~ “does the construct behave as it should with respect to other constructs”
– Theoretical propositions, e.g. “as age increases, memory loss increases”
– Check whether the correlations between constructs make sense!
25.01.16 Confirmatory Factor Analysis
51
Assessment of model validity
• Goodness-of-fit: Does the estimated implied covariance matrix match the observed covariance structure?
– Absolute goodness-of-fit
– Incremental goodness-of-fit
– Parsimonious fit measures
• Construct validity
25.01.16 Confirmatory Factor Analysis
52
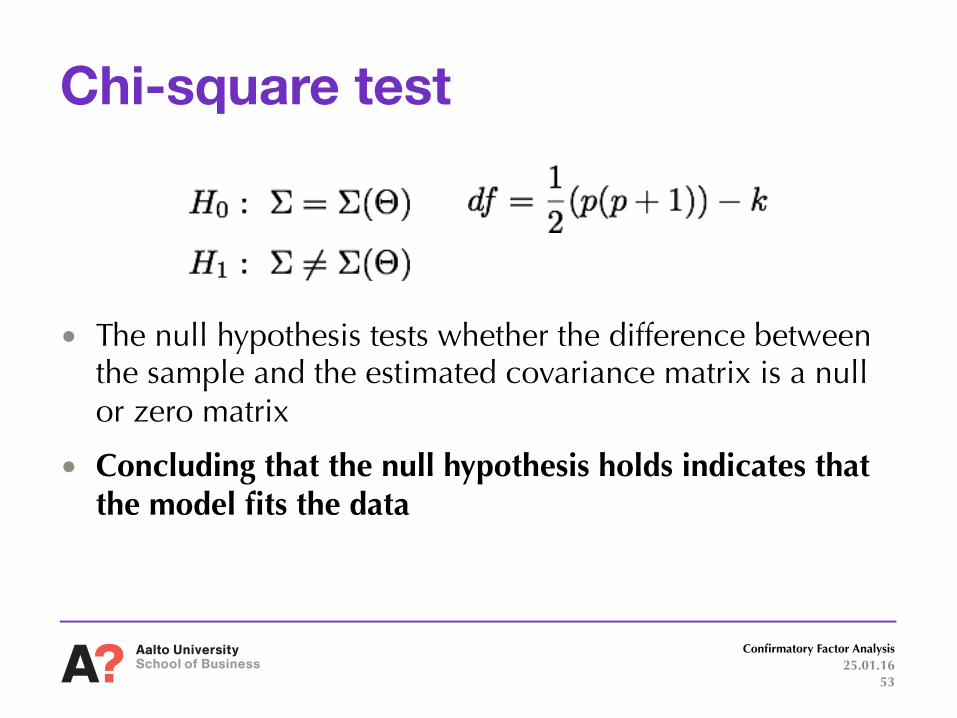
Chi-square test
• The null hypothesis tests whether the difference between the sample and the estimated covariance matrix is a null or zero matrix
• Concluding that the null hypothesis holds indicates that the model fits the data
25.01.16 Confirmatory Factor Analysis
53
Problems with Chi-square test • Chi-square statistic is a function of the sample size N and
the difference between observed and estimated covariance matrices
• As N increases, so does the test-statistic even when differences between matrices don’t change
• Chi-square statistic also increases when adding number of observed variables, which makes it more difficult to achieve a fit
Need for complementary statistics!!
25.01.16 Confirmatory Factor Analysis
54

Comparative fit indices • Based on idea of comparing nested models on
continuum: saturated --- estimated --- independence
• Bentler-Bonett normed fit index (NFI): compares estimated model to independence model
– High values (> 0.95) indicate good-fit
• Bentler’s comparative fit index (CFI): – High values (> 0.95) indicate good-fit
25.01.16 Confirmatory Factor Analysis
55
Comparative fit indices (cont.) • Tucker-Lewis Index (TLI):
– Conceptually similar to NFI
– Takes model complexity into account
– Not normalized, but generally models with good fit have values close to 1
• Relative non-centrality index (RNI) – Compares observed fit to that of a null model
– Higher values represent better model (> 0.9)
25.01.16 Confirmatory Factor Analysis
56
Parsimony fit indices
• Improved either by a better fit or a simpler model
• Conceptually similar to adjusted R2
• Examples: – Adjusted Goodness-of-fit (AGFI)
– Parsimony normed fit index (PNFI)
25.01.16 Confirmatory Factor Analysis
57
Badness-of-fit indices • Root mean square error of approximation (RMSEA)
– Quite broadly used
– Attempts to correct for tendency of chi-square to reject models with large sample or large number of observed variables
– Lower values imply better fit (< 0.08)
• Root mean square residual (RMR) or standardized RMR – Generally standardized residuals exceeding |4.0| should be
scrutinized
– SRMR > 0.1 indicates a problem with fit
25.01.16 Confirmatory Factor Analysis
58

Source: Hair et al. (2010)

Thank you!
60

Very Useful Materials • http://statwiki.kolobkreations.com/
• Download the helpful Excel-tool by J. Gaskin! It is useful during the course!
• There are additionally two plugins, which you can install when using your laptops / home computers (requires admin rights).
61