structural mechanism of dna-mediated nanog–sox2
TRANSCRIPT

RSC Advances
PAPER
Ope
n A
cces
s A
rtic
le. P
ublis
hed
on 1
3 M
arch
201
9. D
ownl
oade
d on
3/2
3/20
22 5
:53:
20 A
M.
Thi
s ar
ticle
is li
cens
ed u
nder
a C
reat
ive
Com
mon
s A
ttrib
utio
n 3.
0 U
npor
ted
Lic
ence
.
View Article OnlineView Journal | View Issue
Structural mecha
Department of Molecular Science and Tech
Korea. E-mail: [email protected]; Fax
† Electronic supplementary informa10.1039/c8ra10085c
Cite this: RSC Adv., 2019, 9, 8121
Received 8th December 2018Accepted 4th March 2019
DOI: 10.1039/c8ra10085c
rsc.li/rsc-advances
This journal is © The Royal Society of C
nism of DNA-mediated Nanog–Sox2 cooperative interaction†
Dhanusha Yesudhas, Muhammad Ayaz Anwar and Sangdun Choi *
The efficiency of stem cell transcriptional regulation always depends on the cooperative association and
expression of transcription factors (TFs). Among these, Oct4, Sox2, and Nanog play major roles. Their
cooperativity is facilitated via direct protein–protein interactions or DNA-mediated interactions, yet the
mechanism is not clear. Most biochemical studies have examined Oct4/Sox2 cooperativity, whereas few
studies have evaluated how Nanog competes in the connection between these TFs. In this study, using
computational models and molecular dynamics simulations, we built a framework representing the DNA-
mediated cooperative interaction between Nanog and Sox2 and analyzed the plausible interaction factors
experienced by Nanog because of Sox2, its cooperative binding partner. Comparison of a wild-type and
mutant Nanog/Sox2 model with the Nanog crystal structure revealed the regulatory structural mechanism
between Nanog/Sox2–DNA-mediated cooperative bindings. Along with the transactivation domains
interaction, the DNA-mediated allosteric interactions are also necessary for Nanog cooperative binding.
DNA-mediated Nanog–Sox2 cooperativity influences the protein conformational changes and a stronger
interaction profile was observed for Nanog-Mut (L103E) in comparison with the Nanog-WT complex.
1 Introduction
Nanog is a homeodomain protein that appears to function atthe top of a regulatory circuitry necessary for developmentprocesses and stem cell pluripotency.1 The 305 amino acids ofthe Nanog polypeptide have three functional domains: a serine-rich N-terminal domain (ND), central homeodomain (HD), andC-terminal domain (CD).2 The homeodomain consists of 3helices, of which helices 2 and 3 (H2 and H3) form a helix–turn–helix motif. Helix 3, also known as the recognition helix, isinserted in the major groove of DNA and is primarily respon-sible for interacting with the bases; additional base contacts areformed by the N-terminus of the homeodomain, which reachesinto the minor groove.2
The self-renewal efficiency of embryonic stem cell (ESC) isdetermined by the Nanog protein level expression. However,how Nanog is regulated at the protein level and the proteinpartners of Nanog that function to direct self-renewal are largelyunclear.3,4 Based on experimental studies, more than 130proteins (including transcription factors [TF], chromatinmodifying complexes, phosphorylation and ubiquitinationenzymes, basal transcriptional machinery members, and RNAprocessing factors)5,6 made a Nanog interactome, and Sox2 wasidentied as a healthy interacting partner of Nanog. Nanog-
nology, Ajou University, Suwon, 16499,
: +82 31-219-1615; Tel: +82 31-219-2600
tion (ESI) available. See DOI:
hemistry 2019
bound promoters are co-occupied by the octamer bindingprotein 4 (Oct4) and SRY-related HMG-box gene 2 (Sox2)proteins.2 Nanog and Sox2 are mainly interacting via theirtransactivation domain (TAD), whereas modeling and simu-lating the unstructured TAD domain residues (�250) of boththe proteins is a tedious process.
To date, biochemical characterization of protein–proteininteractions in pluripotent cells has been studied extensively forSox2 and Oct4.6–8 From a biochemical as well as computationalperspective, little is known about how Nanog ts into the tightrelationship between Oct4 and Sox2.9 Hutchins et al. (2013)described a de novo motif representation for the Nanog–Sox2complex. They developed a tool for systematically evaluatingChIP-seq data (from mouse ESCs) to identify TF compositemotifs and found that the Nanog–Sox2 motifs are in proximityto each other.10 ChIP-seq peaks of the Nanog–Sox2 motif havebeen observed in Zfp42, Klf5, Ncam1, and Myst4.6 Since there isno crystal structure showing the direct physical interaction ofNanog–Sox2, we modeled the complex based on the motifrepresentation10 described by Hutchins et al. The model systemactively included the mutant L122E, which enhances proteinstability and DNA-binding affinity.10,11 Comparative study of thewild-type and mutant Nanog–Sox2 model systems against theNanog crystal structure reveals the cooperative protein–proteinand protein–DNA mediated interactions.
Molecular dynamics (MD) simulation is suitable forexploring the mechanism of a protein–protein/protein–DNAinterface.12 Therefore, we conducted comparative studies of thehypothesis models (Nanog–Sox2 partnership) and Nanog crystal
RSC Adv., 2019, 9, 8121–8130 | 8121
RSC Advances Paper
Ope
n A
cces
s A
rtic
le. P
ublis
hed
on 1
3 M
arch
201
9. D
ownl
oade
d on
3/2
3/20
22 5
:53:
20 A
M.
Thi
s ar
ticle
is li
cens
ed u
nder
a C
reat
ive
Com
mon
s A
ttrib
utio
n 3.
0 U
npor
ted
Lic
ence
.View Article Online
structure using MD simulation. Our results revealed the struc-tural mechanism and changes of Nanog that are inuenced byits cooperative binding partner, Sox2.
2 Methods2.1 Molecular system
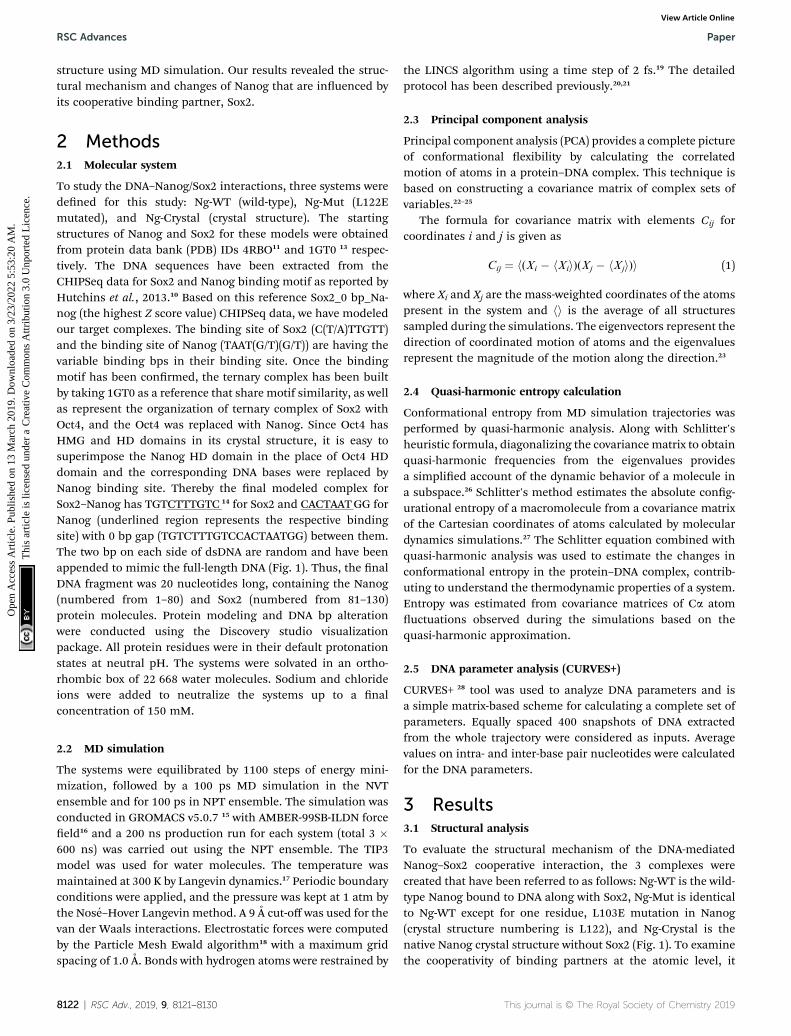
To study the DNA–Nanog/Sox2 interactions, three systems weredened for this study: Ng-WT (wild-type), Ng-Mut (L122Emutated), and Ng-Crystal (crystal structure). The startingstructures of Nanog and Sox2 for these models were obtainedfrom protein data bank (PDB) IDs 4RBO11 and 1GT0 13 respec-tively. The DNA sequences have been extracted from theCHIPSeq data for Sox2 and Nanog binding motif as reported byHutchins et al., 2013.10 Based on this reference Sox2_0 bp_Na-nog (the highest Z score value) CHIPSeq data, we have modeledour target complexes. The binding site of Sox2 (C(T/A)TTGTT)and the binding site of Nanog (TAAT(G/T)(G/T)) are having thevariable binding bps in their binding site. Once the bindingmotif has been conrmed, the ternary complex has been builtby taking 1GT0 as a reference that share motif similarity, as wellas represent the organization of ternary complex of Sox2 withOct4, and the Oct4 was replaced with Nanog. Since Oct4 hasHMG and HD domains in its crystal structure, it is easy tosuperimpose the Nanog HD domain in the place of Oct4 HDdomain and the corresponding DNA bases were replaced byNanog binding site. Thereby the nal modeled complex forSox2–Nanog has TGTCTTTGTC 14 for Sox2 and CACTAATGG forNanog (underlined region represents the respective bindingsite) with 0 bp gap (TGTCTTTGTCCACTAATGG) between them.The two bp on each side of dsDNA are random and have beenappended to mimic the full-length DNA (Fig. 1). Thus, the nalDNA fragment was 20 nucleotides long, containing the Nanog(numbered from 1–80) and Sox2 (numbered from 81–130)protein molecules. Protein modeling and DNA bp alterationwere conducted using the Discovery studio visualizationpackage. All protein residues were in their default protonationstates at neutral pH. The systems were solvated in an ortho-rhombic box of 22 668 water molecules. Sodium and chlorideions were added to neutralize the systems up to a nalconcentration of 150 mM.
2.2 MD simulation
The systems were equilibrated by 1100 steps of energy mini-mization, followed by a 100 ps MD simulation in the NVTensemble and for 100 ps in NPT ensemble. The simulation wasconducted in GROMACS v5.0.7 15 with AMBER-99SB-ILDN forceeld16 and a 200 ns production run for each system (total 3 �600 ns) was carried out using the NPT ensemble. The TIP3model was used for water molecules. The temperature wasmaintained at 300 K by Langevin dynamics.17 Periodic boundaryconditions were applied, and the pressure was kept at 1 atm bythe Nose–Hover Langevin method. A 9 A cut-off was used for thevan der Waals interactions. Electrostatic forces were computedby the Particle Mesh Ewald algorithm18 with a maximum gridspacing of 1.0 A. Bonds with hydrogen atoms were restrained by
8122 | RSC Adv., 2019, 9, 8121–8130
the LINCS algorithm using a time step of 2 fs.19 The detailedprotocol has been described previously.20,21
2.3 Principal component analysis
Principal component analysis (PCA) provides a complete pictureof conformational exibility by calculating the correlatedmotion of atoms in a protein–DNA complex. This technique isbased on constructing a covariance matrix of complex sets ofvariables.22–25
The formula for covariance matrix with elements Cij forcoordinates i and j is given as
Cij ¼ h(Xi � hXii)(Xj � hXji)i (1)
where Xi and Xj are the mass-weighted coordinates of the atomspresent in the system and hi is the average of all structuressampled during the simulations. The eigenvectors represent thedirection of coordinated motion of atoms and the eigenvaluesrepresent the magnitude of the motion along the direction.23
2.4 Quasi-harmonic entropy calculation
Conformational entropy from MD simulation trajectories wasperformed by quasi-harmonic analysis. Along with Schlitter'sheuristic formula, diagonalizing the covariance matrix to obtainquasi-harmonic frequencies from the eigenvalues providesa simplied account of the dynamic behavior of a molecule ina subspace.26 Schlitter's method estimates the absolute cong-urational entropy of a macromolecule from a covariance matrixof the Cartesian coordinates of atoms calculated by moleculardynamics simulations.27 The Schlitter equation combined withquasi-harmonic analysis was used to estimate the changes inconformational entropy in the protein–DNA complex, contrib-uting to understand the thermodynamic properties of a system.Entropy was estimated from covariance matrices of Ca atomuctuations observed during the simulations based on thequasi-harmonic approximation.
2.5 DNA parameter analysis (CURVES+)
CURVES+ 28 tool was used to analyze DNA parameters and isa simple matrix-based scheme for calculating a complete set ofparameters. Equally spaced 400 snapshots of DNA extractedfrom the whole trajectory were considered as inputs. Averagevalues on intra- and inter-base pair nucleotides were calculatedfor the DNA parameters.
3 Results3.1 Structural analysis
To evaluate the structural mechanism of the DNA-mediatedNanog–Sox2 cooperative interaction, the 3 complexes werecreated that have been referred to as follows: Ng-WT is the wild-type Nanog bound to DNA along with Sox2, Ng-Mut is identicalto Ng-WT except for one residue, L103E mutation in Nanog(crystal structure numbering is L122), and Ng-Crystal is thenative Nanog crystal structure without Sox2 (Fig. 1). To examinethe cooperativity of binding partners at the atomic level, it
This journal is © The Royal Society of Chemistry 2019

Fig. 1 Structural organization of the complexes. (A) DNA organization labeled with corresponding Sox2 and Nanog binding sites. (B) The structuralmodels of Ng-WT, Ng-Mut (mutated residue has been shown in stick representation), andNg-Crystal have been presented. DNA bases are in brown,filled-circle shape, Sox2 has been represented as green, and Nanog is in blue. All the structures are with reference to Nanog binding with DNA.
Paper RSC Advances
Ope
n A
cces
s A
rtic
le. P
ublis
hed
on 1
3 M
arch
201
9. D
ownl
oade
d on
3/2
3/20
22 5
:53:
20 A
M.
Thi
s ar
ticle
is li
cens
ed u
nder
a C
reat
ive
Com
mon
s A
ttrib
utio
n 3.
0 U
npor
ted
Lic
ence
.View Article Online
would be worthwhile to compare the modeled systems (Ng-WTand Ng-Mut) with the native Nanog crystal structure (Ng-Crystal)(Fig. 1). All three systems were independently simulated thricefor a span of 200 ns each, and the average results are illustratedbelow.
The root mean square deviation (RMSD) of the backboneatoms of the Ng-Crystal was constant throughout the simula-tion, whereas the Ng-WT and Ng-Mut complexes showed devi-ation in their backbone atoms (Fig. S1†). The superimposedstructures of rst, last and intermediate snapshots were
Fig. 2 Structural comparison at varying time intervals. Superimpose sintermediate (cyan) and final state (magenta) conformations are represennearby DNA base pair is also marked.
This journal is © The Royal Society of Chemistry 2019
displaying the fact that in both complexes, Nanog structureswere moving towards DNA for better interaction (Fig. 2). Theminimum distance between Nanog and Sox2 uctuated fromaround 3.3 to 3.5 nm for both the complexes (Fig. S2†). Eventhough the distance between Sox2 and Nanog was �3.4 nm, thehydrogen bond interactions between Nanog and Sox2 wereobserved to be zero in Ng-WT, whereas in Ng-Mut only oneinteraction had been observed between Arg76 of Sox2 withGln135 of Nanog. However the mutant residue E103 does nottake part in any of the interaction with Sox2 (Table 1). Table 1
tructure of Ng-WT (A) and Ng-Mut (B) complexes in initial (green),ted. Theminimum distance between the mutant residue (L103E) and its
RSC Adv., 2019, 9, 8121–8130 | 8123

Table 1 Interacting residues in protein–protein and protein–DNA interactionsa
Ng-WT (Sox2–Nanog) NilNg-Mut (Sox2–Nanog) ARG76 NH1 GLN135 O 3.232 ANg-WT (Sox2–DNA) Ng-WT (Nanog–DNA)SER31 HB1 DC4 O2 2.542 SER31 HB2 DT5 O40 2.706LYS35 HZ1 DT5 H50 3.142 SER34 HB2 DT5 H20 2.403SER31 HB2 DC4 H10 3.34 LYS35 HG1 DT5 H20 3.468LYS35 HE2 DT6 O1P 2.316 GLY38 CA DT6 H40 3.215PHE10 HZ DT6 H 2.889 MET11 HE3 DT6 O2 3.232MET11 HE2 DT6 H3 3.417 PHE10 CZ DT6 H20 3.035GLY38 HA2 DT6 H20 3.334 GLY38 HA2 DT7 H50 3.418LYS42 HZ3 DT7 O1P 3.28 TRP41 HD1 DT7 H50 2.936MET11 HE1 DT7 O2 2.806 TRP41 HD1 DT7 C40 3.053TRP41 HD1 DT7 C30 3.327 ASN8 ND2 DT7 O2 3.356ASN8 HD2 DG8 C10 3.397 ARG5 NH1 DG8 N2 3.188MET11 HE2 DA32 N3 3.447 TYR72 HE2 DC10 O2 2.546MET7 HG1 DA32 H20 3.352 TYR72 HD2 DC10 O2 3.225LYS4 HZ2 DA33 P 2.359 PRO74 HG2 DC10 O2 3.104ASN30 H DA36 O 2.88 ARG76 HH2 DT12 P 2.423HIS29 HD2 DA36 C10 3.033 LYS77 HZ3 DG29 H40 3.35HIS29 HD2 DA36 C40 3.296 PRO74 HG2 DG29 N2 3.073MET28 C DA36 H 3.466 ARG75 O DA30 C40 3.241Ng–Mut (Sox2–DNA) Ng–Mut (Nanog–DNA)SER31 HB1 DC4 H10 3.342 LYS121 HZ2 DG8 O2P 1.775LYS35 HE2 DT5 H50 2.273 GLN125 HE2 DG8 C20 3.041SER31 CA DT5 H10 3.007 TYR100 HE2 DT9 O1P 3.277SER34 HB2 DT5 C10 3.277 ARG128 HH2 DT9 O2P 1.839LYS35 HE2 DT5 C30 3.293 GLN125 NE2 DT9 O2P 2.746GLY38 HA1 DT6 C40 3.448 ARG128 HE DT9 O2P 2.201PHE10 CE2 DT6 H10 3.245 GLN125 HG2 DT9 C5 3.44SER34 HB1 DT6 H10 2.76 MET129 SD DC10 O50 3.373ARG5 HD2 DC31 H40 2.088 MET129 HE1 DC10 H30 2.63TYR72 CE1 DC31 H40 3.139 ARG133 HD2 DT24 H50 3.246ARG75 HH2 DC31 O2P 2.407 LYS130 CE DC25 O2P 3.259HIS29 ND1 DC37 H40 3.383 ARG133 HD2 DC25 O2P 3.341ASN30 HB1 DA36 O40 3.256 LYS130 HZ3 DC25 O50 3.367ARG75 NH2 DC31 O50 3.341 TRP123 HD1 DA26 O2P 2.875TYR72 CE1 DC31 H50 3.372 THR81 H1 DA26 H40 2.54TYR72 HE1 DC31 H50 2.318 GLN119 NE2 DA26 H30 3.437ARG75 HE DC31 P 2.518 THR81 H2 DA26 O30 2.847
GLN119 HE2 DA27 O1P 3.305THR122 HG2 DA26 C8 3.186ASN126 HD2 DA27 H61 3.193
a The protein residues (from Sox2 and Nanog) with the base pairs interactions have been tabulated, and the interacting distances are in A. Theprotein–protein interaction marked with italic.
RSC Advances Paper
Ope
n A
cces
s A
rtic
le. P
ublis
hed
on 1
3 M
arch
201
9. D
ownl
oade
d on
3/2
3/20
22 5
:53:
20 A
M.
Thi
s ar
ticle
is li
cens
ed u
nder
a C
reat
ive
Com
mon
s A
ttrib
utio
n 3.
0 U
npor
ted
Lic
ence
.View Article Online
lists the residues that are making both protein–protein andprotein–DNA interactions in all three systems. The subtledifference between the number of hydrogen bonds are criticalas the energy contribution for individual hydrogen bond can befrom �1.5 kcal mol�1 per hydrogen bond that can be translatedto a roughly 10-fold difference in probability of two conforma-tions.29,30 Thus, the breakage/formation of a single hydrogenbond has profound effect on protein–DNA stability.
Furthermore, the lowest energy structure was taken based onthe free energy landscape (FEL) energy values, and the interac-tion patterns were observed (Fig. S3†). The importance of themutant residue (L103E) was monitored very carefully byincluding the simulation of Ng-Crystal–Mut structure also(Fig. S4 and S5†). The radius of gyration shows that the Ng-Crystal–WT complex was observing very high compact confor-mation compared with the Ng-Crystal–Mut complex; same has
8124 | RSC Adv., 2019, 9, 8121–8130
been reected in the RMSF prole also (Fig. S4†). The interac-tion prole of L103E residue against DNA was observed and itwas evident that for Ng-Crystal–Mut and Ng-Crystal–WTcomplexes alone was experiencing a direct interaction of E103with the DNA bases at less than 4 A, whereas the othercomplexes (Ng-WT and Ng-Mut) didn't observe this specicinteraction (Table 1 and S1†). Although the minimum distancebetween Nanog and DNA was �2.8 nm for both the complexes(Fig. S5A†), both Ng-WT and Ng-Mut failed to make directinteraction between E103 and DNA base pair.
3.2 Residual movement
Both the Ng-WT and Ng-Mut complexes showed dominantmovement with respect to DNA sequence and the movementswere distinct for each complex. The relative movement of the
This journal is © The Royal Society of Chemistry 2019

Paper RSC Advances
Ope
n A
cces
s A
rtic
le. P
ublis
hed
on 1
3 M
arch
201
9. D
ownl
oade
d on
3/2
3/20
22 5
:53:
20 A
M.
Thi
s ar
ticle
is li
cens
ed u
nder
a C
reat
ive
Com
mon
s A
ttrib
utio
n 3.
0 U
npor
ted
Lic
ence
.View Article Online
protein along the DNA was identied by examining the posi-tions of helix 3 residues with respect to the plane of the DNAbases (Fig. S6 and S7†). Because helix H3 formed an extensiveDNA contact interface in the major groove, the interactions ofhelix H3 residues were considered critical for determining thespecicity to the core consensus sequence. Sox2 binding alteredthe Nanog conformation along with its DNA. Therefore, even ifthe Nanog protein remains bound to the DNA molecule for theentire MD trajectory, it would not be xed at a specic DNAsequence site and consequently, facilitate non-specic binding.Therefore, the protein was moving and sampled at least two orthree different base pair sequences.
The alignment of charged residues fromNanog helix H3 withthe plane of the DNA was observed and distinguishedthroughout the simulation. In the Ng-WT system, all residues(K118, T122, and Q125) surveyed the A15, A16, and T17 bpsequences except M129 residue (Fig. S6†). The M129 residueshowed a stronger interaction with A16 bp, and thus its move-ment to other bp sequences was restricted. In contrast, in theNg-Mut system, more residues from helix H3 (K118, Q119,
Fig. 3 Mapping of protein conformational changes. Representation of thMut (B), and Ng-Crystal (C) using principal component analysis (PCA) by pby first removing the translational and rotational movements and then cwell as the collective motion of eigenvectors with the cumulative percenred dots denote the initial and final conformational switch of the compl
This journal is © The Royal Society of Chemistry 2019
K121, T122, Q125, R128, and M129) interacted with its corre-sponding DNA bps, and their movements towards the DNA bpsequences were higher compared to Ng-WT (Fig. S7†).
3.3 Mapping of protein conformational changes
Structural exibility of a protein has been correlated withdifferent biological functions. To better understand theconformational changes of Nanog protein inuenced by Sox2binding, the MD trajectories of the Ng-WT and Ng-Mut systemswere evaluated by principal component analysis (PCA) (Fig. 3).PCA plots show the trajectory frames onto the lowest frequencyeigenvectors, and the rst few eigenvectors account for mostprotein motions and capture large-scale motions.31 The rst 10eigenvectors greatly contributed to the collective motions; thecollective modes of each system with their cumulativepercentages of 92, 93, and 40 for Ng-WT, Ng-Mut, and Ng-Crystal, respectively, are shown in Fig. 3. Each trajectory posi-tion was plotted as the dot product of the coordinates andeigenvector, representing the range of displacement along each
e conformational changes of heavy atoms of Nanog in Ng-WT (A), Ng-lotting their eigenvectors 1, 2 and 3. These vectors have been obtainedonstructing the covariance matrix. Representation of the individual astages for Ng-WT, Ng-Mut, and Ng-Crystal are indicated. The blue andexes, the intermediate state is represented by white dots.
RSC Adv., 2019, 9, 8121–8130 | 8125

RSC Advances Paper
Ope
n A
cces
s A
rtic
le. P
ublis
hed
on 1
3 M
arch
201
9. D
ownl
oade
d on
3/2
3/20
22 5
:53:
20 A
M.
Thi
s ar
ticle
is li
cens
ed u
nder
a C
reat
ive
Com
mon
s A
ttrib
utio
n 3.
0 U
npor
ted
Lic
ence
.View Article Online
eigenvector from the average position. The distribution ofeigenvector values corresponding to the protein motions in theessential subspace has been provided with that clusters ofrepresentatives explored tertiary conformations. The red andblue color represents the nal and initial conformational clus-ters during the simulations. The white color dot represents theintermediate state. The projection of the trajectories on theplane dened by the rst, second and third eigenvectors indi-cated that Ng-WT, and Ng-Mut exhibited no energy barrierbetween their metastable states which indicated that no energypenalty required to switch from one conformation to another.In general, Ng-WT and Ng-Mut have more of wider conforma-tional basins than the single wider basin of crystal structure(Fig. 3C).
Further, we evaluated the cause of such conformationalbehavior by determining residue-wise level uctuations alongthe two principal eigenvectors for the wild-type and mutantsystems (Fig. 4). Region-specic displacement of each residuewas observed for each of the two principal eigenvectors. TheL103E mutation contributed to the uctuation of thesurrounding 96Q, 97R, 98Q, and 99K residues, whereas theL103E residue itself showed little uctuation. The importantresidues were observed to interact with DNA in the crystalstructure, but some residues, such as K118, Q119, K121, T122,Q124, Q125, R128, and M129, showed large uctuations in theNg-Mut system, as shown in Fig. 4. Eigenvector 2 values showeductuations of most residues in the Ng-Mut complex (Fig. 4),which may be because of the L103E mutation. This residualuctuation may account for the divergence in the conforma-tional behavior of both systems.
These scattered conformations visited by the Ng-WT and Ng-Mut proteins were further veried by drawing a porcupinegraph (Fig. 5). Both the systems displayed similar as well asdistinct contradicting movements with respect to each other.The dominant motions displayed by Nanog in Ng-WT and Ng-Mut were found to be similarly oriented, however, the inten-sity of motion in Ng-Mut was higher towards the DNA. The
Fig. 4 Residue fluctuation along with the principal eigenvectors. Grapheigenvectors with atom index along the X-axis and eigenvector along thblack and red, respectively.
8126 | RSC Adv., 2019, 9, 8121–8130
residues of Nanog showed more harmonious movements in Ng-WT, whereas, such harmony was reduced in Ng-Mut. Sox2exhibited the similar motion in both the systems, whereas themovement of Sox2 in Ng-Mut complex is less. The residues inthe helix 3 region of Nanog showed less movement towards theDNA, enabling non-specic binding. Thus, the L103E mutationmay have inuenced the essential motions of the surroundingatoms, facilitating their non-specic binding, therebyincreasing the stability. In the absence of Sox2, the residualmovement of Nanog showed a complete incoherence as indi-cated by the arrows pointing away from the DNA. This maysuggest that the binding of neighboring protein can drasticallyinuence the Nanog binding and functional activity.
3.4 Nanog–Sox2 interface on DNA
When the proteins (Nanog and Sox2) bound to the DNA, thebehavior and orientation of the structure and its dynamicswould undergo prominent alterations that can be related to itsfunctionality. The Nanog inserted its 3rd a-helix, H3, into themajor groove of its DNA binding site, whereas Sox2 binding wasenergetically governed by its C-terminal loop. The root meansquare uctuations (RMSF) of the DNA bases (Fig. 6) showedthat the strand 1 binding site of Nanog protein in the Ng-WTand Ng-Mut complexes exhibited similar uctuations as thatof the Ng-Crystal. In strand 2, the binding site of Nanog uc-tuated more than in the Ng-Crystal. Although strand 2 was notdirectly linked to Nanog, its movement during simulation wasreected in this RMSF of the Ng-WT and Ng-Mut systems.Hence, the plot provided a view of DNA atom mobility. Thepresence of protein clearly reduced the mobility of DNA baseswithin their binding site and the effect was observed as strongfor those atoms involved in salt bridges with the protein (Fig. 6).
The protein–DNA interface involving the major third helixwas signicantly altered in the Ng-WT and Ng-Mut systemscompared to the Ng-Crystal. Most interactions disappearedbecause of Sox2 binding. Except for T122, K125, and M129
representing the fluctuations of residues along the first two principale Y-axis for Ng-WT and Ng-Mut. Ng-WT and Ng-Mut are indicated in
This journal is © The Royal Society of Chemistry 2019

Fig. 5 Principal modes ofmotion for Ng-WT, Ng-Mut and Ng-Crystal. Dominantmotions of Nanog and Sox2 in Ng-WT, Ng-Mut, and Ng-Crystal(Nanog only in this case) complexes. The heavy atoms have been used for the analysis; however, projections for the backbone atoms have beendisplayed for clarity. The magnitudes and directions of motion of the residues are indicated by green arrows in the cartoon structure.
Paper RSC Advances
Ope
n A
cces
s A
rtic
le. P
ublis
hed
on 1
3 M
arch
201
9. D
ownl
oade
d on
3/2
3/20
22 5
:53:
20 A
M.
Thi
s ar
ticle
is li
cens
ed u
nder
a C
reat
ive
Com
mon
s A
ttrib
utio
n 3.
0 U
npor
ted
Lic
ence
.View Article Online
residues, the other residues failed to maintain its strongerinteractions with its DNA. Hence, it could be understood thatthe binding of Sox2 altered the stability of Nanog binding to itsDNA binding site.
3.5 Sox2 inuences the dynamics of DNA
The natural tendency for protein binding with DNA alters theDNA conformational states. The conformational changes inDNA were evaluated by various DNA parameters calculatedusing CURVES+.28
Sox2 is known to bend DNA, and examination of protein-induced DNA bending is necessary to gain insight into DNA'sstructural deformation. As a result of this bending nature, thebinding of Sox2 altered the conformation of B-form DNA intothe non-standard B-form (or A-form). DNA can be classiedbased on various parameters such as twist (A ¼ 33; B ¼ 36), rise(A¼ 2.56A; B¼ 3.38A), roll (A¼ 6; B¼ 0) and slide (A <�0.8; B >�0.8)32,33 (Fig. S8†). The crystal structure without Sox2 showedan average bending angle of approximately 22�, whereas Ng-WTand Ng-Mut possessing Sox2 adjacent to the Nanog binding siteshowed a bend angle of approximately 50–60�. The bend anglewas lower in Ng-WT initially, however, towards the end ofsimulation, both complexes showed a bend angle of similarrange. The binding of Sox2 adjacent to Nanog caused the DNA
This journal is © The Royal Society of Chemistry 2019
to be in a nonlinear state. Even though the average bendingvalue in Ng-Mut (�55) was higher than Ng-WT (�50), the uc-tuation was quite less than the other.
3.6 Congurational entropy
The entropy of a bio-molecule plays an important role indetermining the physical and chemical phenomena of a system.Amajor limitation in a computer simulation is the estimation ofabsolute entropies and entropy differences.34 However, variousapproximation approaches, such as quasi-harmonic analysis,show good agreement with experimental observations.27 Quasi-harmonic analysis has been demonstrated to provide a combi-nation of qualitative and quantitative information about thedynamic behavior of protein/DNA in MD simulations. Thismethod is useful for estimating changes in congurationalentropy in a complex system (protein and DNA), and may,therefore, contribute to our understanding of the thermody-namics of biomolecular interactions. Since the systemmoves inall dimensions and the movement range is not restricted byperiodic boundary conditions, the quasi-harmonic approxima-tion would provide correct changes in entropy.34
The entropy of the protein–DNA complex was calculated bysuperposition of all frames using the heavy atoms (non-hydrogen) atoms as a reference. The entropy has been
RSC Adv., 2019, 9, 8121–8130 | 8127

Fig. 6 Characteristics of the Nanog–Sox2 interface on DNA. The root mean square fluctuations of the DNA bases for strand 1 (1–19) and strand 2(20–38) have been displayed. DNA binding site for Ng-WT, Ng-Mut, and Ng-Crystal are shown. Ng-WT and Ng-Mut are indicated in green andred, respectively. The RMSF for Ng-Crystal has been given separately for comparison and is shown in black.
RSC Advances Paper
Ope
n A
cces
s A
rtic
le. P
ublis
hed
on 1
3 M
arch
201
9. D
ownl
oade
d on
3/2
3/20
22 5
:53:
20 A
M.
Thi
s ar
ticle
is li
cens
ed u
nder
a C
reat
ive
Com
mon
s A
ttrib
utio
n 3.
0 U
npor
ted
Lic
ence
.View Article Online
extracted from the covariance matrices using quasi-harmonicapproximation aer removing rotational and translationalmovement. The entropy values of all three systems wereincreasing until it reaches a plateau (Fig. S9†). The congura-tional entropy values were higher in Ng-WT and Ng-Mutcompared to the crystal structure that may be due to thenumber of atoms involved (Ng-Crystal system lacks Sox2). Thespecic tight binding of the Nanog in the crystal structurerequired less congurational subspace, whereas Sox2 bindinginuenced the Nanog-bound structure by recruiting a largercongurational subspace, resulting in signicantly higherentropy values.
4 Discussion
Sox2 inuences the orientation and dynamics of the DNA-bound conguration of other TFs including Nanog.35 Thismutual interaction can affect the induction of downstreamgenes. Therefore, it is worthwhile to study these interaction indetail and to pursue this computational analysis is leveraginga great support. The simulation of these complexes has beenrepeated three times, and the nal/average results have beendiscussed here. The Nanog and Sox2 interaction have beendelineated in this study, and based on our analysis, we foundthat the inuence of Sox2 on Ng-Mut was greater than that onNg-WT, which is correlating the fact that Ng-Mut complex ismore efficient than the Ng-WT. In protein–DNA interaction, the
8128 | RSC Adv., 2019, 9, 8121–8130
charged residues play important roles, and the charge distri-bution over protein has been widely studied that alter protein–DNA binding. In Nanog, the mutation of L103E replaces a non-polar residue by the negatively-charged residue introducingelectrostatic interactions between Nanog and DNA, therebyexperiencing higher number of interaction than WT (Table 1).Moreover, from structural viewpoint, leucine and glutamatehave comparable helix propensity values (L ¼ 1.21 vs. E ¼ 1.51)resulting in less structural inuence over Nanog (Fig. 2).
Although the binding of Sox2 in both cases (Ng-WT and Ng-Mut) inuenced the binding orientation of Nanog with its DNAand sampled less binding energy, the complex remainedaligned with its native structure via protein–protein andprotein–DNA interactions (Fig. 2, 3 and Table 1). The Ng-Mutcomplex is maintaining a single hydrogen bond betweenNanog and Sox2 (Arg76 of Sox2 with Gln135 of Nanog), whereasthe Ng-WT failed to do so (Table 1). In addition to that, Hayashiet al., studied the Nanog L122A mutation which enhance theDNA binding affinity in Oct4 promoter region brings up the factthat the mutation of Lys122 is very much important for Nanogreprogramming.11 Similarly, our mutant complex (L102E) wasshowing the better affinity with its binding partner as well asDNA (Fig. 5 and Table 1); however, both the complexes areexisting with good number of interaction with their DNA (Table1).
Differential responses of Ng-WT and Ng-Mut because of Sox2binding may be correlated to the localized protein motions
This journal is © The Royal Society of Chemistry 2019

Paper RSC Advances
Ope
n A
cces
s A
rtic
le. P
ublis
hed
on 1
3 M
arch
201
9. D
ownl
oade
d on
3/2
3/20
22 5
:53:
20 A
M.
Thi
s ar
ticle
is li
cens
ed u
nder
a C
reat
ive
Com
mon
s A
ttrib
utio
n 3.
0 U
npor
ted
Lic
ence
.View Article Online
when the systems were analyzed using PCA. The internalmotion of Ng-WT was limited to a subspace with fewerdimension compared to Ng-Mut, whereas the internal motionof the crystal structure was negligible (Fig. 3C). The Ng-WT andNg-Mut systems largely remained in one conformational spaceindicating lower energy, while the infrequent transition todifferent space for other conformations, though fewer, but havebeen observed for these complexes (Fig. 3A and B). The porcu-pine graph shows that the protein dominant movements in theNg-WT and Ng-Mut systems were different; the protein residuemovements in Ng-Mut were more coherent with lower magni-tude, and the movements of Nanog residues were supportive toeach other in DNA binding, whereas, Ng-WT showed higherdegree of residual movement away fromDNA (Fig. 5). The L103Emutation may have inuenced the essential motions of thesurrounding atoms, facilitating non-specic binding of Nanogand increasing stability (Fig. 4). Similarly, non-specic bindingof lactose repressor showed uctuating residual movements,36,37
suggesting that Sox2 alters the specic binding to become non-specic.
The RMSF of the DNA bases dynamics decreased in thepresence of Sox2 protein molecule (Fig. 6). However, thecongurational entropy of the Ng-WT and Ng-Mut systemsrevealed higher energy requirements compared to the Ng-Crystal system (Fig. S9†), suggesting that the Sox2–Nanogbound DNA structure and its transcriptional regulation is ach-ieved through concerted modulation of DNA-mediatedinteractions.
The largest changes in the conformational entropy ofa protein arise from the energetic restraints from the backboneand side chain groups.34 The conguration of Ng-Crystal systemis lower due to the absence of Sox2, thus, the entropy of thesimulated crystal structure was lower than those of the modelsystems (Ng-WT and Ng-Mut) (Fig. S9†). Although, it is almostimpossible to calculate the absolute entropic values, however,a qualitative observation can be useful to assign the energeticstate to each molecule. Ng-Mut has slightly more entropy thatallowed the complex to visit more states, and this can beattributed to the addition of a charged residue. As the entropydifference is no more than 1 kcal mol�1 K�1, both systemsessentially visited similar meta-stable states.
Cooperative binding of Sox2 forced the system to use morecongurational subspace and energy. The helix–turn–helixregion of the HMG domain bent the DNA to approximately 50–60� and the bending nature of the Sox2 molecule is necessaryfor its activity,38 and to provide better stability.14,39 Ng-Crystalshowed a constant bending angle, whereas Nanog bound toSox2 showed an increased bending angle, revealing that thesystems require a stable bending angle to stabilize the confor-mation compared to the DNA-bound structures; additionally,apart from this DNA-mediated protein–protein interaction, thesystem may require a DNA-independent interaction.6
The Ser-rich region and the transactivation domain of Nanogare unconstrained regions, where modeling and simulating thewhole length TAD protein is nearly impossible and may requirevery long simulation time with supercomputing facilities. Wetried to model this domain, however, lack of suitable template
This journal is © The Royal Society of Chemistry 2019
and abundance of non-structured region hindered its propermodeling. Therefore, a low condence protein model mighthave a spurious effect in simulation and may invalidate theoverall conclusion of this study. Moreover, a common way forthe DNA binding proteins to interact is through non-DNAbinding domains and this has been reported for Nanog–Sox2interaction as well.6 Both, the Sox2 and Nanog have multipledomains such as HMG, transactivation domain, and Ser-richmotifs for Sox2, and DNA binding domain, transactivationdomain, and Trp repeats for Nanog. The experimental evidencesuggest that the major interaction between Nanog and Sox2 isgoverned by the sequences of non-DNA-binding domains(through the transactivation domains). However, the SELEX(Systematic evolution of ligands by exponential enrichment)results suggested that the interaction occurs in a specic spatialrelationship of the DNA-binding domains of these proteins.10
Sox2 can interact with Oct4 over the DNA as reported by Merinoet al., 2014,40 so the role of DNA-based interaction cannot beruled out in case of Sox2–Nanog interactions.41 Moreover, thebending of DNA by Sox2 has drastic inuence over the ability oftranscription factors to induce transcription of target genes.38
Other ndings that the bending or conversion to non-standardDNA is desirable and supports the notion that Sox2 not onlyinteracts through its TAD but also facilitate the Nanog tran-scriptional ability by indirect physical interaction throughbending of DNA. As it has already been reported that the DNA-independent interaction is governed by the transactivationdomain of Sox2 and tryptophan repeat (WR) domain of Nanog,6
these two proteins may facilitate better and stronger binding viafewer DNA-mediated interactions, which is driven by their DNA-binding domains of the proteins. The overall interactions andthe energy prole obtained for Ng-Mut is favoring for its betterstability than the Ng-WT, which is correlating with the experi-mental data. Our MD simulation results explains the interac-tions between Nanog and Sox2 through their DNA-bindingdomains, and suggest that, despite of this weaker DNA-independent interaction prole, Nanog–Sox2 cooperativity viaDNA-binding domains are also necessary for its better andstable interaction prole.
Author contributions
DY designed and performed experiments. DY and MAAanalyzed the results. DY and SC wrote the manuscript.
Conflicts of interest
There are no conicts of interest to declare.
Acknowledgements
This work was supported by the National Research Foundationof Korea (NRF-2015R1A2A2A09001059) and the Commerciali-zations Promotion Agency for R&D Outcomes funded by theMinistry of Science and ICT (2018K000369).
RSC Adv., 2019, 9, 8121–8130 | 8129

RSC Advances Paper
Ope
n A
cces
s A
rtic
le. P
ublis
hed
on 1
3 M
arch
201
9. D
ownl
oade
d on
3/2
3/20
22 5
:53:
20 A
M.
Thi
s ar
ticle
is li
cens
ed u
nder
a C
reat
ive
Com
mon
s A
ttrib
utio
n 3.
0 U
npor
ted
Lic
ence
.View Article Online
References
1 K. Mitsui, Y. Tokuzawa, H. Itoh, K. Segawa, M. Murakami,K. Takahashi, M. Maruyama, M. Maeda and S. Yamanaka,Cell, 2003, 113, 631–642.
2 R. Jauch, C. K. Ng, K. S. Saikatendu, R. C. Stevens andP. R. Kolatkar, J. Mol. Biol., 2008, 376, 758–770.
3 T. I. Lee, R. G. Jenner, L. A. Boyer, M. G. Guenther,S. S. Levine, R. M. Kumar, B. Chevalier, S. E. Johnstone,M. F. Cole, K. Isono, H. Koseki, T. Fuchikami, K. Abe,H. L. Murray, J. P. Zucker, B. Yuan, G. W. Bell,E. Herbolsheimer, N. M. Hannett, K. Sun, D. T. Odom,A. P. Otte, T. L. Volkert, D. P. Bartel, D. A. Melton,D. K. Gifford, R. Jaenisch and R. A. Young, Cell, 2006, 125,301–313.
4 J. Wang, S. Rao, J. Chu, X. Shen, D. N. Levasseur,T. W. Theunissen and S. H. Orkin, Nature, 2006, 444, 364–368.
5 D. L. van den Berg, T. Snoek, N. P. Mullin, A. Yates,K. Bezstarosti, J. Demmers, I. Chambers and R. A. Poot,Cell Stem Cell, 2010, 6, 369–381.
6 A. Gagliardi, N. P. Mullin, Z. Ying Tan, D. Colby, A. I. Kousa,F. Halbritter, J. T. Weiss, A. Felker, K. Bezstarosti, R. Favaro,J. Demmers, S. K. Nicolis, S. R. Tomlinson, R. A. Poot andI. Chambers, EMBO J., 2013, 32, 2231–2247.
7 X. Chen, H. Xu, P. Yuan, F. Fang, M. Huss, V. B. Vega,E. Wong, Y. L. Orlov, W. Zhang, J. Jiang, Y. H. Loh,H. C. Yeo, Z. X. Yeo, V. Narang, K. R. Govindarajan,B. Leong, A. Shahab, Y. Ruan, G. Bourque, W. K. Sung,N. D. Clarke, C. L. Wei and H. H. Ng, Cell, 2008, 133, 1106–1117.
8 C. S. Lam, T. K. Mistri, Y. H. Foo, T. Sudhaharan, H. T. Gan,D. Rodda, L. H. Lim, C. Chou, P. Robson, T. Wohland andS. Ahmed, Biochem. J., 2012, 448, 21–33.
9 D. J. Rodda, J. L. Chew, L. H. Lim, Y. H. Loh, B. Wang,H. H. Ng and P. Robson, J. Biol. Chem., 2005, 280, 24731–24737.
10 A. P. Hutchins, S. H. Choo, T. K. Mistri, M. Rahmani,C. T. Woon, C. K. Ng, R. Jauch and P. Robson, Stem Cells,2013, 31, 269–281.
11 Y. Hayashi, L. Caboni, D. Das, F. Yumoto, T. Clayton,M. C. Deller, P. Nguyen, C. L. Farr, H. J. Chiu, M. D. Miller,M. A. Elsliger, A. M. Deacon, A. Godzik, S. A. Lesley,K. Tomoda, B. R. Conklin, I. A. Wilson, S. Yamanaka andR. J. Fletterick, Proc. Natl. Acad. Sci. U. S. A., 2015, 112,4666–4671.
12 M. Karplus and J. A. McCammon, Nat. Struct. Biol., 2002, 9,646–652.
13 A. Remenyi, K. Lins, L. J. Nissen, R. Reinbold, H. R. Scholerand M. Wilmanns, Genes Dev., 2003, 17, 2048–2059.
14 Y. Kamachi, M. Uchikawa and H. Kondoh, Trends Genet.,2000, 16, 182–187.
15 M. J. Abraham, T. Murtola, R. Schulz, S. Pall, J. C. Smith,B. Hess and E. Lindahl, SowareX, 2015, 1–2, 19–25.
8130 | RSC Adv., 2019, 9, 8121–8130
16 K. Lindorff-Larsen, S. Piana, K. Palmo, P. Maragakis,J. L. Klepeis, R. O. Dror and D. E. Shaw, Proteins, 2010, 78,1950–1958.
17 R. L. Davidchack, R. Handel and M. V. Tretyakov, J. Chem.Phys., 2009, 130, 234101.
18 H. Wang, F. Dommert and C. Holm, J. Chem. Phys., 2010,133, 034117.
19 B. Hess, H. Bekker, H. Berendsen and J. Fraaije, J. Comput.Chem., 1997, 18, 1463–1472.
20 D. Yesudhas, M. A. Anwar, S. Panneerselvam, P. Durai,M. Shah and S. Choi, PLoS One, 2016, 11, e0147240.
21 D. Yesudhas, M. A. Anwar, S. Panneerselvam, H. K. Kim andS. Choi, FEBS Open Bio, 2017, 7, 1750–1767.
22 G. G. Maisuradze, A. Liwo and H. A. Scheraga, J. Mol. Biol.,2009, 385, 312–329.
23 S. Mesentean, S. Fischer and J. C. Smith, Proteins, 2006, 64,210–218.
24 A. Amadei, A. B. Linssen and H. J. Berendsen, Proteins, 1993,17, 412–425.
25 T. Ichiye and M. Karplus, Proteins, 1991, 11, 205–217.26 S. A. Harris and C. A. Laughton, J. Phys.: Condens. Matter,
2007, 19, 076103.27 I. Andricioaei and M. Karplus, J. Chem. Phys., 2001, 115,
6289–6292.28 C. Blanchet, M. Pasi, K. Zakrzewska and R. Lavery, Nucleic
Acids Res., 2011, 39, W68–W73.29 J. K. Zimmerman, Biochem. Mol. Biol. Educ., 2009, 37, 133.30 S. B. Dixit, N. Arora and B. Jayaram, J. Biomol. Struct. Dyn.,
2000, 17(suppl. 1), 109–112.31 A. Amadei, A. B. Linssen, B. L. de Groot, D. M. van Aalten and
H. J. Berendsen, J. Biomol. Struct. Dyn., 1996, 13, 615–625.32 M. A. Anwar, D. Yesudhas, M. Shah and S. Choi, RSC Adv.,
2016, 6, 90138–90153.33 W. K. Olson, A. A. Gorin, X. J. Lu, L. M. Hock and
V. B. Zhurkin, Proc. Natl. Acad. Sci. U. S. A., 1998, 95,11163–11168.
34 R. Baron, P. H. Hunenberger and J. A. McCammon, J. Chem.Theory Comput., 2009, 5, 3150–3160.
35 G. M. Clore, in Sox2, ed. R. Lovell-Badge, Academic Press,Boston, 2016, pp. 25–41, DOI: 10.1016/B978-0-12-800352-7.00003-7.
36 S. Furini, P. Barbini and C. Domene, Nucleic Acids Res., 2013,41, 3963–3972.
37 Y. Yonetani and H. Kono, J. Phys. Chem. B, 2013, 117, 7535–7545.
38 P. Scaffidi and M. E. Bianchi, J. Biol. Chem., 2001, 276,47296–47302.
39 Y. Kamachi and H. Kondoh, Development, 2013, 140, 4129–4144.
40 F. Merino, C. K. L. Ng, V. Veerapandian, H. R. Scholer,R. Jauch and V. Cojocaru, Structure, 2014, 22, 1274–1286.
41 D. C. Ambrosetti, H. R. Scholer, L. Dailey and C. Basilico, J.Biol. Chem., 2000, 275, 23387–23397.
This journal is © The Royal Society of Chemistry 2019