structural microfoundations of innovation: relational
TRANSCRIPT

1
Structural Microfoundations of Innovation:
Relational Stars and Quality of Inventive Output
Konstantinos Grigoriou1
College of Management
Georgia Institute of Technology
Atlanta, GA, 30308
Voice: 404-319-9655
Frank T. Rothaermel*
College of Management
Georgia Institute of Technology
Atlanta, GA, 30308
Voice: 404-385-5108
December 16, 2010
* Corresponding author.
1 We thank Rahul Basole, Terry Blum, Garry Burton, Diane Burton, Gino Cattani, James Costantini, John Eckhardt,
Teppo Felin, Marlena Fiol, Michelle Gittelman, Devi Gnyawali, Remzi Gozubuyuk, Henrich Greve, Boris
Groysberg, Carolin Haeussler, Ashton Hawk, Matthew Higgins, Jay Horwitz, Lason Kim, Katherine Klein, Anne
Marie Knott, Tomi Laamanen, Ian Larkin, Jaegul Lee, Jeongsik Lee, Michael Leiblein, Dave Lepak, Scott
Livengood, Joe Mahoney, Anita McGahan, Gerry McNamara, Philip Nelson, Jason Owen-Smith, Alex Oettl, Lamar
Pierce, Brian Richter, Kevin Rockmann, MB Sarkar, Henry Sauermann, Andrew Shipilov, Brian Silverman, Jasjit
Singh, Paula Stephan, Beverly Tyler, Richard Wang, Brian Wu, and Maurizio Zollo for helpful comments and
suggestions.
Prior versions of the paper were presented at the Academy of Management Meetings, American Economic
Association Kaufmann Mentoring Workshop, Consortium for Cooperation and Competition (CCC), Helsinki
Conference on the Micro Origins of Routines and Capabilities, the Strategic Management Society Conference, and
the Wharton People and Organizations Conference. A prior version of the paper won the Best PhD Paper Award and
was a finalist for the Best Conference Paper Award at the 2010 Strategic Management Society Conference.
The authors acknowledge support for this research from the National Science Foundation (NSF SES 0545544).
Grigoriou acknowledges support from the Gerondelis Foundation. Rothaermel also acknowledges support from the
Sloan Foundation. Rothaermel is an Affiliate of the Sloan Biotechnology Industry Center at the University of
Maryland. All opinions expressed as well as all errors and omissions are our own.

2
Structural Microfoundations of Innovation:
Relational Stars and Quality of Inventive Output
ABSTRACT
Applying social network theory, we attempt to uncover the role of individuals as drivers of
organizational invention. Conceptualizing invention as a process of knowledge search and
recombination, we go beyond the focus on productive individuals and emphasize the importance
of individual relational capacities to effectively implement the process of invention. We rely on
intraorganizational knowledge networks emerging through individual collaboration to identify
actors who using their extreme collaboration behavior can positively influence the quality of
their organization‟s inventive output. We develop a taxonomy of three types of such relational
stars: integrators, connectors, and isolates. We test our ideas in a sample of 106 pharmaceutical
firms from 1974 to 1998. Our results suggest that all three individual role-sets have positive
effects on their organization‟s inventive quality and that the positive effects are much more
pronounced for quality than quantity of inventive output. Connectors are the strongest drivers of
quality followed by integrators and isolates. In addition, we show that relational stars
compensate for each other and that the most effective internal configuration for inventive quality
includes many integrators combined with many connectors and few isolates.
3
Since Schumpeter (1942) we have known that innovation is a vehicle of economic growth and a
source of firm performance heterogeneity. Research on the antecedents of innovation has
extensively focused on the innovative capabilities that firms need to develop in order to initiate
or respond to frequent technological change. Organizational scholars have convincingly argued
that innovative organizations are those with superior routines (Nelson and Winter, 1982),
capabilities (Kogut and Zander, 1992), competences (Henderson and Cockburn, 1994), or
dynamic capabilities (Teece, Pisano, and Shuen, 1997) of transforming existing knowledge into
something new. The simple observation that knowledge is the key raw material for innovation
(Nonaka, 1994) combined with the recognition of individual actions and interactions as the
realistic locus of knowledge creation (Felin and Hesterly, 2007), directed attention to the role of
individuals as the microfoundations of the necessary capabilities (Felin and Foss, 2005). Indeed,
research indicates that firms benefit from investments in individual expertise expressed as well
above average research productivity (Zucker, Darby, Brewer, 1998; Lacetera, Cockburn,
Henderson, 2004; Rothaermel and Hess, 2007). As a result, there is a significant degree of
consensus that the so-called „star scientists‟ positively affect innovative outcomes. However, we
still have a gap in our understanding with respect to other individual roles and skills that are
critical for innovation. Is individual productivity the only relevant skill for innovation?
Evidence suggests that innovation is a communal team-based endeavor (Wuchty, Jones, and
Uzzi, 2007). Innovative performance depends on effective knowledge sharing (Hansen, 1999),
search (Gavetti and Levinthal, 2000; Katila and Ahuja, 2002), transfer (Tsai and Ghoshal, 1998),
recombination (Galunic and Rodan, 1998), reconfiguration (Henderson and Cockburn, 1994),
diffusion (Zollo and Winter, 2002), and renewal (O‟Reilly and Tushman, 2007). Individuals are
responsible for implementing these knowledge sub-processes through their actions and

4
interactions. Such interactions result in extensive knowledge networks, in which actors occupy
various positions. Relying on the structural, cognitive, and affective benefits stemming from
their positions (Nahapiet and Ghoshal, 1998), certain individuals emerge as more effective than
others to execute the knowledge sub-processes and become highly consequential for the
innovative performance of the network as whole. In this paper, we make an effort to identify
them by looking for extreme patterns of individual collaborative behavior. Applying network
thinking, we argue for the positive effect of three individual structural roles on the inventive
output of their organizations. We refer to them as „relational stars‟ to emphasize the social aspect
of their skills and depart from traditional „productivity stars‟. More importantly, we extend our
current understanding of the effect of productivity stars on quantity of inventive output and
provide our first contribution by highlighting the role of relational stars as the structural
microfoundations of inventive quality. In essence, we argue that these actors can exploit their
patterns of collaborative behavior to not only identify more opportunities for knowledge
recombination but also select the most promising ones leading to knowledge of higher quality.
In particular, we focus on three types of relational stars: integrators, connectors, and isolates.
Integrators are the actors who have a very large network of collaborators and therefore have the
capacity to integrate and recombine knowledge from many different sources. Connectors are the
individuals who collaborate across knowledge areas, operate as the linking pins among internally
distant and otherwise unconnected clusters of knowledge and therefore have the capacity to
engage in high risk and radical trials of knowledge recombination. Isolates are productive
individuals that are relatively unconnected from their organization‟s network and therefore have
the capacity to infuse the knowledge base with diverse perspectives as they are the least affected
from the organization‟s knowledge directions. Conceptualizing invention as a search process of
5
knowledge recombination (Fleming, 2001), the three types correspond to three alternative paths:
local recombination, distant recombination, and independent knowledge production. Apparently,
all three individual roles become important for the quality of inventive output not necessarily
because they are extremely productive but mainly because their collaborative behavior facilitates
effective recombinant search. It is important to note here that if these types of actors are defined
relative to their peers in an organization‟s internal network, then every organization would have
its own share of relational stars. Instead, we define relational stars relative to their counterparts in
every competing organization‟s network looking for outliers in each of the three categories.
This approach follows existing research on „star scientists‟ where stars are the actors at the top of
the productivity distribution of all scientists across firms. More importantly, this approach allows
us to provide an important contribution to the literature on internal networks. Research on
networks has unveiled that an individual‟s position in the internal network may affect that
individual‟s involvement in innovation (Obstfeld, 2005), creativity (Fleming, Mingo, and Chen,
07), and performance (Gargiulo, Ertug, Galunic, 2009). In addition, the structure of the
knowledge network may affect the overall network‟s innovative performance (Brown and
Eisenhardt, 1997; Reagans and Zuckerman, 2001; Reagans and McEvily, 2003). Much less is
known with respect to the effect of nodes in certain positions on the overall network‟s
performance. Authors of two recent reviews on networks conclude that it is imperative to address
cross-level network phenomena and understand how micro-level network effects translate into
macro-level network phenomena (Brass et al., 2004; Ibarra, Kilduff, and Tsai, 2005). With this
study, we make an effort to document the mechanisms through which the mere presence of an
individual position (that is, a certain pattern of individual collaborative behavior) may affect not
only that individual‟s performance but also the performance of the network as whole. In

6
particular, we show that individuals who are outliers in terms of their collaborative behavior in
three meaningful dimensions can improve inventive quality of their organizations through
identifying more promising, novel, or diverse knowledge recombinations.
Finally, we provide a contribution to the literature on social capital. In particular, our objective is
to document how social capital can create human capital (Coleman, 1988) by looking at the
interaction between human and social capital. Intraorganizational collaborative networks are
built in order to transform a number of creative individuals into creative collectives (Hargadon
and Bechky, 2006). Therefore, our relational stars in these networks do not try to exploit their
position for their own benefit in a competitive environment (Burt, 2000); rather, they operate as
relational experts to promote collective creativity in a cooperative context (Lingo and
O‟Mahony, 2010). Relational stars possess the right amount and type of social capital to foster
invention at the network level but at the same time have the necessary human capital to generate
knowledge and be part of the network at the first place. Therefore, their importance stems from
the right blend of human and social capital. Building that social capital requires both opportunity
and ability (Adler and Kwon, 2002). If we look at their collaborative ties as prisms (Podolny,
2001) we can safely assume that individuals in relational star positions possess unique skills,
abilities, and capacities that make them particularly valuable for the inventive performance of
their organization. In addition, we extend current understanding on the role of knowledge
brokers by looking at individuals who not only span structural holes but also use their bridging
ties to link distant knowledge clusters and access a wider share of the network. Further, we
highlight the important role of individuals who may lack social capital but still positively affect
the invention process by providing much needed knowledge diversity. Our main argument is that
organizations with any type of relational stars have an invention advantage. We test our ideas in

7
a sample of 106 large firms in the global pharmaceutical industry using a longitudinal research
design spanning a 25-year period. We rely on co-patenting events to build extensive knowledge
networks with over 550,000 observations at the individual level from 1974 to 1998 and employ
network metrics to define the three types of relational stars. We use counts of these stars at the
organizational level to predict how important they are for inventive quality. We compare the
magnitude of the individual effects to identify the individual role that is the strongest driver of
quality. In addition, we are able to document some very interesting interactions among the three
types of relational stars and uncover the most effective internal configuration of relational stars.
Overall, our sample allows us to investigate the extent to which incumbent firms can remain
innovative and survive technological discontinuities by managing the inventive potential of their
human capital resources (Tushman and Anderson, 1986; Anderson and Tushman, 1990).
RELATIONAL STARS AND INVENTIVE QUALITY
Organizational research on the antecedents of organizational innovation has been dominated by
the notion of „routines‟ (Nelson and Winter, 1982). The knowledge-based conceptualization of
the firm as a social community guided by higher-order principles that are irreducible to
individuals (Kogut and Zander, 1992) spurred significant research efforts linking capabilities
directly to organizational innovative outcomes (Kogut and Zander, 1992; Henderson and
Cockburn, 1994; Teece, Pisano, and Schuen, 1997; Zollo and Winter, 2002). However, early
research in the knowledge-based paradigm emphasized the importance of accounting for
individuals in order to clearly understand the formation of such organizational capabilities
(Nonaka, 1994; Conner and Prahalad, 1996; Grant, 1996). Macro-level explanations that link
capabilities with outcomes without considering individuals as their microfoundations open the
door for alternative micro-level explanations (Abell, Felin, and Foss, 2008).

8
Theoretical support of individuals as the realistic locus of knowledge (Felin and Hesterly, 2007)
channeled some research towards the role of human capital in driving organizational innovation.
Evidence suggests that firms are generally more innovative when they employ highly productive
individuals with the capacity to generate scientific knowledge. The so-called „star scientists‟ are
instrumental for knowledge sensing (Lacetera, Cockburn, and Henderson, 2004), renewal
(Zucker and Darby, 1997), knowledge capture (Zucker, Darby, and Armstrong, 2002), and
adaptation to radical discontinuities (Rothaermel and Hess, 2007). Therefore, we have a deep
understanding of the innovative benefits provided by individual knowledge productivity.
However, individual creativity has an apparent social side and is affected by the working
environment (Amabile et al. 1996; Perry-Smith and Shalley, 2003). Organizations have an
advantage over individuals because they can internally develop intellectual capital based on
social interactions among their members (Nahapiet and Ghoshal, 1998). Early research on the
emergence of industrial R&D suggested that the advantage of the industrial research laboratory
was that “it could take several men, each lacking the necessary qualifications for successful
independent research, and weld them into a productive team in which each member compensated
for the others‟ shortcomings” (Beer, 1959: 71). Hence, apart from individual productivity there is
a set of social and collaborative skills that is at least as important for fostering innovation. This
importance is even more pronounced in the innovation literature which suggests that innovation
is an outcome of a socially intensive process of knowledge transformation. Individuals innovate
by searching for potential knowledge recombinations between familiar and new components
(Fleming, 2001). Socialization (Fleming, 2002) and intraorganizational persuasion and conflict
(Gavetti and Levinthal, 2000) are important components of successful search outcomes. Firms

9
need to integrate disparate pieces of knowledge (Henderson and Cockburn, 1994) and
dynamically reconfigure their existing knowledge stocks as markets evolve (Galunic and
Eisenhardt, 2001). Knowledge should be reused, recombined, and accumulated to result in
innovation (Murray and O‟Mahony, 2007). To effectively implement these processes,
individuals collaborate within firms and form extensive internal collaborative networks.
The importance of these networks has not been neglected. For instance, there is research
documenting the effect of individual position on a host of meaningful individual outcomes
(Brass, 1984; Ibarra, 1993; Morrison, 2002; Cross and Cummings, 2004) and research supporting
the effect of the network‟s overall structure on network-level outcomes (Tsai, 2002; Argyres and
Silverman, 2004; Lazer and Friedman, 2007; Yayavaram and Ahuja, 2008). However, although
there is some evidence that actors in certain positions may affect organizational outcomes as for
instance, central actors shape their firms‟ future technological capabilities (Nerkar and Paruchuri,
2005), research on the role of individuals in these networks as drivers of network-level outcomes
remains sparse. Authors of recent reviews echo this statement by calling for more research
addressing cross-level network phenomena (Brass et al., 2004; Ibarra, Kilduff, and Tsai, 2005).
In this study, we make an effort to do that by introducing the concept of „relational stars‟.
Relational stars are actors whose patterns of collaborative behavior make them valuable for the
inventive performance of the network as a whole. Their value comes from the structural,
cognitive, and relational benefits associated with their position in the intraorganizational
collaborative network (Inkpen and Tsang, 2005). To identify them, we compare the collaborative
behavior of all individuals across firms in the same industry and select the outliers in three
dimensions that we believe positively affect the inventive performance of the system. Our logic
is quite simple: we argue that if certain patterns of collaboration are more impactful than others

10
for invention, then individuals with the capacity to express these patterns are the best positioned
ones to exploit their positions and explore opportunities for new knowledge of higher quality.
The intraorganizational collaborative network is an instance of a creative collective (Hargadon
and Bechky, 2006) and a social structure characterized by cooperation rather than competition
(Tsai, 2002). Individuals work together to enhance the organization‟s knowledge base. Nodes in
the network are individuals participating in the knowledge co-production process. Ties reflect
instances of direct collaboration with the purpose of knowledge co-creation. They can be viewed
as strong ties (Hansen, 1999), which are necessary for effective knowledge transfer (Singh,
2005) or recombination (Galunic and Rodan, 1998), and play a dual role at they facilitate both
inflows and outflows of knowledge (Borgatti and Foster, 2003). They can also be viewed as
prisms to allow us make inferences about the characteristics of the nodes (Podolny, 2001).
Therefore, we look at both the type of collaborative relations and the utility coming from these
relations to deduce the value of individuals in certain positions (Kilduff and Brass, 2010). We
posit that relational stars are very valuable sources of human capital because they have the
capacity to utilize superior structural, cognitive, and relational benefits associated with their
collaborative behavior (Nahapiet and Ghoshal, 1998).
The main mechanism underlying our hypotheses is the value of human capital. However, we
emphasize the role of social capital in the creation of that necessary human capital (Coleman,
1988). Relational stars are defined as the ones having the „right‟ type and amount of social
capital. However, the acquisition of that social capital reflects unique abilities and skills on their
end (Adler and Kwon, 2002). In addition, relational stars possess unique blends of human and
social capital. Looking at knowledge as both an action and a possibility (Hargadon and Fanelli,
11
2002), these individuals have not only the human capital to co-develop knowledge and be part of
the network but they also have the relationships to explore for future knowledge possibilities.
Further, they rely on social interactions to generate possibilities for knowledge recombination
(Felin and Zenger, 2009). They use their position to shape the network, access and diffuse
knowledge stocks (Borgatti and Foster, 2003). Relational stars emerge because their alters have a
positive representation of their skills; a „star‟ position in the network emerges through
interpersonal collaboration and is the result of continuous adjustments (Kilduff, Tsai, and Hanke,
2006). The previous discussion suggests that relational stars develop superior human capital
through their social capital endowments. In what follows, we link individual behavioral patterns
and organizational outcomes. In reality, a behavioral pattern has two components: what the
individual can do with that position and what the individual is (derived from the position)
although the two are closely intertwined. It is important to note that these patterns have certain
origins beyond individual skills and abilities. Actors emerged in their positions because they
were also appropriately motivated to collaborate and were provided with the opportunity to do so
by their organization‟s structures, incentives, or strategies. These other origins are out of this
paper‟s scope and are briefly addressed in the discussion section. Here, it is important to
emphasize that a network position is an organizational product as much as it is a product of
individual skills. Relational stars have the capacity to alter the organization‟s knowledge base
with high quality inventive output by utilizing their skills and capacity to use the structural,
cognitive, and relational features of their ties.
Integrators
Integrators are individuals with an extraordinary amount of collaborative ties in their

12
organization‟s network; normally, these actors occupy a highly central position in the network.
The positive effect of such a central position on individual level outcomes has been widely
documented. Centrality is associated with an individual‟s promotions (Brass, 1984), exercise of
power (Ibarra, 1993), supervisor ratings (Mehra, Kilduff, Brass, 2001), socialization (Morrison,
2002), innovative performance (Cross and Cummings, 2004), involvement in innovation
(Obstfeld, 2005), and performance bonus (Gargiulo, Ertug, and Galunic, 2009). However, much
less is known with respect to the role of such individuals on the performance of the network as a
whole. Here, we make an effort to link the presence of integrators in an organization‟s
collaborative network with the inventive quality of its output. To do that, we define integrators as
universal outliers; integrators are the individuals whose collaborative behavior involves a
number of alters which is large not relative to their peers in their organization‟s network but
relative to all individuals in all competing organizations. We argue that organizations employing
such collaborative outliers enjoy a quality advantage in their inventive output. The tools through
which integrators drive inventive quality are the knowledge inflows and outflows embedded in
their collaborative ties. The mechanisms through which flows result in quality are three:
conceptualizing invention as recombinant search, integrators rely on knowledge inflows coming
from many different sources to identify not only more potential knowledge recombinations but
also select the most promising ones among them. Outliers have an advantage in this respect
because every additional tie has an exponential effect on the number of potential recombinations.
Second, integrators use their outflows to diffuse a constantly updating knowledge base for
further recombination. Third, the mere presence of these actors creates the conditions for
invention to occur. We choose the term „integrators‟ to illustrate their main knowledge function,
that is, knowledge integration; the term has been previously used to describe actors who bring

13
people together and fill structural holes (Xiao and Tsui, 2007). In addition, we prefer this term
over central actors to emphasize the outlier status of these individuals. Integrators are not just
central in their firm‟s network; their number of collaborative ties puts them at the top of the
distribution when compared with all individuals from all competing organizations.
In particular, integrators through their inflows have the capacity to observe a large number of
alters, understand who knows what (Borgatti and Cross, 2003), and follow the most promising
local recombinations. This view is consistent with evidence that knowledge recombined by
central actors is more likely to be found in their firm‟s future technological capabilities (Nerkar
and Paruchuri, 2005). Their commanding position allows them to scan the environment,
understand where relevant knowledge lies, familiarize themselves with a number of different
knowledge stocks, and experiment with alternative combinations to identify the most valuable
ones. On the other hand, through their outflows integrators have the capacity to effectuate
diffusion of a changing knowledge base to initiate further cycles of knowledge refinement.
Evidence suggests that integrators should be able to diffuse knowledge easier than others as they
exert significant influence on their peers (Brass, 1984). Eventually, integrators become the
organization‟s „enabling bureaucracy‟ (Adler, Goldoftas, and Levine, 1999).
As importantly, the presence of integrators creates some necessary conditions for invention to
occur. They operate as the glue that increases the network‟s density and makes it promising for
knowledge sharing and learning. Centralized R&D structures have been shown to generate more
impactful innovations (Argyres and Silverman, 2004) and cohesive structures positively affect
individual motivations for knowledge sharing (Reagans and McEvily, 2003) and knowledge
transfer (Reagans, Zuckerman, McEvily, 2004). In addition, integrators play the role of a

14
coordinating mechanism. Their collaborative behavior results in strong ties, shared norms,
communication codes, trust, and clan-fostering initiatives which are all necessary conditions for
invention and learning to occur (Tsai and Ghoshal, 1998, Kang, Morris, and Snell, 2007).
Finally, invention includes significant levels of uncertainty for the individuals involved and
central actors are the ones sought after by peers under uncertainty (Tushman and Romanelli,
1983). Arguably, that is because their position also exists at the minds of their peers and signifies
competence (Kilduff, Tsai, and Hanke, 2006). Therefore, integrators take over decision making,
reduce uncertainty for peers, and encourage high quality knowledge creation. Overall, integrators
have the capacity to integrate knowledge locally for high quality recombinations, diffuse the
updated knowledge base, and create the conditions for further high quality invention to occur.
Hypothesis 1: The quality of a firm‟s inventions is a positive function of the number of
integrators in its internal collaborative network.
Connectors
Extensive evidence suggests that individuals who span structural holes in a knowledge network
are more likely to come up with better ideas (Burt, 2004), are more creative (Fleming, Mingo,
and Chen, 2007), and can adapt better to changes in the task environment (Gargiulo and Benassi,
2000). Such knowledge brokers enjoy informational advantages which increase their own social
capital (Burt, 2000) but may hurt the creation of communal social capital under conditions of
competition (Ibarra, Kilduff, and Tsai, 2005). However, in a cooperative structure as is the case
in a firm‟s internal collaborative network (Hargadon and Bechky, 2006), brokers are more likely
to play the role of relational experts who bring together unconnected knowledge stocks to
promote the innovative performance of the system (Obstfeld, 2005, Lingo and O‟Mahony, 2010).
15
In an organization‟s knowledge network, individuals are often organized around their knowledge
domains. As a result, knowledge clusters emerge with their boundaries defined by the nature and
relatedness of knowledge. Such molecular units within firms are expected to form as a
disaggregation effect of recent innovations and high-powered incentives (Zenger and Hesterly,
1997). Bridging ties across these units represent collaboration across knowledge clusters. We
extend current understanding on the role of brokers by introducing the concept of connectors in
the collaborative networks. Connectors are actors who span structural holes but at the same time
connect distant clusters of knowledge. While not necessarily productive or highly collaborative,
connectors operate as the linking pins among otherwise unconnected and distant knowledge
stocks. There are not only rich in structural holes; their spanning of such holes also allows them
to access a large share of the broader collaborative network in which they are embedded. In a
sense, they are very efficient knowledge brokers; their collaborative behavior bridges knowledge
silos within their firm‟s network. Similarly to what we did for integrators, we define connectors
as actors who span structural holes in their network and access the highest share of their network
compared to brokers in all other competing organizations‟ networks. With this term, we capture
individuals who are the best in collaborating across knowledge domains and utilize a very large
share of their organization‟s knowledge base. The main mechanism through which connectors
can increase their organization‟s inventive quality is through novel knowledge combinations of
diverse knowledge stocks.
Research suggests that individuals are more likely to come up with such novel recombinations
when their ego-networks span boundaries across technologies (Fleming, 2002), disciplines
(Henderson and Cockburn, 1994), locations (Singh, 2008), or divisions (Kleinbaum and
Tushman, 2007). Here, we define connectors as actors whose collaborative behavior spans

16
clusters and silos in the knowledge space. Connectors use their ties‟ inflows to access diverse
sources of knowledge and are therefore more likely to identify potentially novel and high quality
recombinations. Their capacity to collaborate across knowledge boundaries allows them access
to heterogeneous knowledge stocks and engagement in high risk inventive trials. In addition,
they have a broad view of the knowledge landscape and are therefore more likely to guide their
experiential learning efforts towards more promising knowledge areas. Through their outflows,
connectors rapidly diffuse new knowledge to distant clusters of knowledge for further quality
recombinations. Although actual transfer of knowledge through brokerage may be hampered
because of several complexities (Obstfeld, 2005; Fleming, Mingo, and Chen, 2007), still the
capacity of connectors to communicate new knowledge across distant knowledge domains
increases the opportunity for others to engage in high quality recombination.
In addition, the presence of connectors in an organization‟s collaborative network creates the
conditions for high quality invention. Connectors promote relaxed structures facilitating
improvisation (Brown and Eisenhardt, 1997), network heterogeneity facilitating learning
(Reagans and Zuckerman, 2001), network range supporting knowledge transfer (Reagans and
McEvily, 2003), and decrease the path length between any two actors in the network thus
improving its overall performance (Cowan and Jonard, 2003). The presence of connectors in an
organization‟s network reflects a knowledge base which is nearly decomposable, a characteristic
which has been linked with inventive quality (Yayavaram and Ahuja, 2008).
Hypothesis 2. The quality of a firm‟s inventions is a positive function of the number of
connectors in its internal collaborative network.

17
Isolates
The process of knowledge recombination, especially within intraorganizational knowledge
networks, can be viewed as a pursuit for local optima (Gavetti and Levinthal, 2000). Actors
collaborate to generate improvements based on a given set of knowledge resources. This process
can be self-sustaining and result in significant similarities of knowledge among the actors of the
collaborative network as recombinations are communicated through diffusion. Therefore,
internal collaborative networks are vulnerable to falling into competency traps (Levitt and
March, 1988), a tendency to rely on inferior knowledge spaces when superior alternatives exist.
As a result, these networks can greatly benefit from individuals who can infuse some knowledge
diversity into the system of knowledge recombination. Such actors should participate in the
development of knowledge but be relatively unconnected from the rest of the network to avoid
overembeddedness and the risk of social capital (Adler and Kwon, 2002). Actors remaining
uncoupled from an organization‟s network have been characterized as isolates (Tichy, Tushman,
and Fombrun, 1979). We build on this notion and in an effort to describe how such actors may
positively affect an organization‟s inventive quality, we define isolates as individuals who are
almost unconnected from the internal network but at the same time are more productive than
their counterparts in all of competing organizations‟ networks.
Organizations with the most productive isolates have an increased opportunity for knowledge
diversity in their system. In turn, this diversity promotes identification of even more promising
knowledge recombinations which are free from risks of competency traps. The most productive
isolates remain unaffected by the knowledge directions of the network and have the capacity to
provide it with additional insights at a high production rate. As importantly, isolates produce that

18
knowledge at minimum coordination costs. Therefore, we shift attention to actors who are
important for their organization not because of their ties but exactly because of the absence of
such collaborative ties. In addition, evidence suggests that isolates are more willing to share their
knowledge (Thomas-Hunt, Ogden, and Neale, 2003). Isolates should not be confused with just
independent inventors who have been shown to generate both more impactful (Dahlin, Taylor,
and Fichman, 2004) and less impactful inventions (Singh and Fleming, 2010). Our isolates
actively participate in their organizations efforts to invent new knowledge and their independent
but productive collaborative behavior protects their organizations from knowledge
homogenization at a steady productive rate, thus increasing the chances for the network to
generate inventions of higher quality.
Hypothesis 3. The quality of a firm‟s inventions is a positive function of the number of
productive isolates in its internal collaborative network.
The three types of relational stars will more than likely coexist in an organization‟s collaborative
network. Although all three have their own direct effects on inventive quality, it is important to
explore for the effect of their interaction on the system‟s output. Existing literature reflects a
debate on whether the types of relational stars should complement or substitute each other in
driving inventive quality. On one hand, the short run performance of the network requires
efficiency in dissemination of information, while the long run performance requires
inefficiencies and knowledge diversity (Lazer and Friedman, 2007). Knowledge of low
complexity diffuses through distant ties, while knowledge of moderate complexity requires
social proximity (Sorenson, Rivkin, and Fleming, 2006). High risk inventive trials should always
be followed by intense socialization (Fleming, 2002). Distant ties enable knowledge search while
local ties facilitate knowledge transfer (Hansen, 1999). Network cohesion and range together
19
encourage knowledge transfer (Reagans and McEvily, 2003). A small world structure
characterized by high clustering and bridging ties is more effective for collective invention
(Cowan and Jonard, 2003). Local ties promote coordination while bridging ties increase
flexibility (Gargiulo and Benassi, 2000). Finally, there is evidence that nearly decomposable
knowledge bases with both dense networks and bridging ties generate more useful inventions
(Yayavaram and Ahuja, 2008). Taken together, these studies suggest that the three types of
relational stars play different but complementary roles in the path towards inventive quality.
On the other hand, researchers have emphasized that knowledge production through
interpersonal collaboration entails significant costs. The presence of different individual roles
with extreme heterogeneity of collaborative behaviors may reflect a serious coordination burden
for their organization. Coordination can become the most important source of knowledge
production costs and inefficiencies (Langlois and Foss, 1999). Gibbons (1999) asserts that firms
are not well-oiled machines and suffer greatly from these coordination costs. Felin, Zenger, and
Tomsik (2009) argue that any social process of knowledge co-creation includes costs and
productivity losses. Further, Lavie (2006) notes that internal reconfiguration of capabilities, a
role that relational stars play, consists of major risks and costs. Finally, O‟Reilly and Tushman
(2007) suggest although the pursuit of knowledge recombination simultaneously through local
and distant ties may be beneficial, it also involves major challenges because of differences
between the respective skill sets. Perhaps, the most illustrative case against complementarity is
evidence by Burt (1997), which suggests that the value of social capital decreases as more people
do the same work. Therefore, if integrators, connectors, and isolates are just alternative paths to
knowledge of increased quality then we should observe a substitute relationship among them.
Taken together, these studies suggest that the three types of relational stars may be inconsistent

20
with each other and greatly increase coordination costs. Therefore, we proceed by juxtaposing
two competing hypotheses:
Hypothesis 4a (b): Integrators, connectors, and isolates complement (substitute) each other in
the invention process and thus their interactions are positively (negatively) associated with their
organization‟s inventive quality.
METHODS
To test the developed hypotheses, we followed a longitudinal research design in the global
pharmaceutical industry. Firms in this industry are under constant pressure to continuously
innovate. In addition, they had to face the emergence of biotechnology as a new paradigm in
product development, a discontinuity that increased existing pressures to keep innovating in
order to survive. As a response, pharmaceutical firms engaged in a wide array of alternative
strategies to remain innovative; they took on alliances, acquisitions, heavy investment in internal
research, and in human capital to build or maintain innovative capabilities (Rothaermel and
Hess, 2007). Therefore, the pharmaceutical industry is an ideal setting for this paper to explore
for the role of relational stars in driving inventive output above and beyond the mentioned
innovation levers. Our observation period is from 1974 to 1998. Our sample consists of 106
pharmaceutical firms that were active in the production of human in-vivo therapeutics and were
founded before 1974. This sample is largely representative of the overall industry as it accounts
for the vast majority of global sales of pharmaceutical products. We tracked these 106 firms
forward until 1998. Horizontal mergers are a common incident in this industry; when a merger
occurs we combine the data of the merging firms into one entity, we continue tracking it forward,
and we create an indicator variable to capture a merged entity.

21
We constructed the key dependent and independent variables relying on patents granted to these
firms by the USPTO. Despite some problems, patents have been extensively used to measure a
firm‟s innovative activities (e.g. Ahuja, 2000; Henderson and Cockburn, 1994). In addition, the
pharmaceutical industry is the industry which relies most on patents when it comes to intellectual
property protection compared to all other manufacturing industries (Cohen, Nelson, Walsh,
2000). We used the NBER patent data file (Hall, Jaffe, and Trajtenberg, 2001) to create the
patent portfolio for each one of our firms from 1974 to 1998. We tracked all different names
under which firms patent (including spelling mistakes in the patent dataset) and collected patent
data for those firms‟ subsidiaries to make sure that we have the full patenting activity for each
firm. From resulting patent portfolios, we kept information regarding dates of applications,
citations received, claims made, inventors listed, and assigned technology classes. Many firms in
our sample are dedicated pharmaceutical firms. However, there is also a number of large
diversified conglomerates that are also active in other industries. We argue that knowledge
possessed by inventors in unrelated industries has little to do with our knowledge-based
arguments. Therefore, we sampled on the resulting patent portfolio for every firm and we relied
on information from technology classes to keep only patents that are assigned to classes with a
clear chemistry or biology component and thus are more likely to be related to the technologies
underlying human therapeutics.
Dependent Variables
To measure the quality of a firm‟s inventions, we used the number of citations that a firm‟s
patents in year t received in subsequent years until 2006. Note that although our sample period
ends in 1998, we track citations until 2006. We relied on the application date for the patents

22
because it is much closer to the actual time of invention than the granting date. Evidence
suggests that citations received by a patent is a significant predictor of its market value (Hall,
Jaffe, and Trajtenberg, 2005) and has already been used to measure the usefulness of inventions
(Yayavaram and Ahuja, 2008). In addition, we used the number of claims made by a firm‟s
patents to capture a different dimension of their quality. Claims are arguably a measure of a
patent‟s technical quality and have been used in prior research to measure the quality of a firm‟s
inventive activities (Singh, 2008). As a robustness check, we also used simple patent counts to
see if our independent variables have an effect on quantity of inventive output.
Intrafirm collaborative networks and independent variables
To identify relational stars and create the independent variables for this paper, we developed
intrafirm co-inventing networks for each firm from 1974 to 1998. We relied on the NBER
database inventor file and assigned a unique ID to each individual inventor based on a
combination of last name, first name, and middle name. When there was still a conflict, we
expanded our matching criteria to include city and state of residence for each inventor. The
resulting dataset was a file for each firm with unique inventors IDs assigned to each patent from
1974 to 1998. As a next step, we used UCINET 6 to develop intrafirm co-inventing networks.
Nodes of our networks were individual inventors and ties were co-patenting events among them.
Our main argument is that these ties involve knowledge flows and thus, we proceeded by
characterizing knowledge through a tie which is older than five years as obsolete. Therefore, we
developed the knowledge networks using a five-year rolling window and assigned the resulting
values to the last year of each time window (e.g. 1982-1986 values to 1986, 83-87 values to 87,
etc.). We analyzed our network and kept a wide array of ego-network metrics to define the three
types of relational stars. Then, we developed three variables at the inventor level:

23
Integrator. This is an indicator variable with a value one if the inventor‟s direct collaborative ties
are two standard deviations more than the mean number of direct ties of all inventors of all firms
during the same 5-year window and the inventor has more than two patents in the same period
(to avoid one-time inventors that contribute little to their firm). Therefore, we captured inventors
with a great number of alters as collaborators.2
Connector. In the theoretical part of the paper, we emphasized that connectors are not only
knowledge brokers in terms of spanning many structural holes, but they are also individuals who
connect distant clusters of knowledge and therefore have access to a large share of their firm‟s
collaborative network. Therefore, to capture connectors we relied on a combination of two
network metrics. First, we selected inventors with more than two patents and more than the mean
number of collaborative ties in the firm‟s network. In this way, we retained only inventors who
were not one-time inventors and who had enough ties to have a meaningful connecting impact.
Second, we kept inventors whose ego-network density was lower than .333. Hence, we sampled
on inventors who span structural holes; this cutoff point suggests that existing ties among a
connector‟s alters were less than one third of all potential ties among them. Third, among the
remaining inventors, we characterized as connectors those whose two-step reach in the network
was higher than the mean. Therefore, among the inventors who spanned structural holes, we
selected those whose ties allowed them to reach a larger share of the firm‟s internal collaborative
network. The two step reach measure captures the percentage of the network‟s nodes that a node
has access to through its direct and indirect ties. Hence, we combined density with reach in order
2 We also experimented with a number of alternative empirical definitions for integrators. We used the number of
direct ties that are both one and three standard deviations above the mean. Results remained robust. We strongly
prefer these ego network-based metrics over alternative ones like bonanich or betweenness centrality because our
theory is developed using the benefits of direct ties (and knowledge flows through these ties) without taking into
account the structure of the overall network.

24
to identify inventors who span structural holes and at the same time have access to a broader
share of the network.3 An indicator variable with a value of one was assigned to inventors whose
ego-networks passed all of the above mentioned cutoff points.
Isolate. This is an indicator variable with a value one if the inventor has patents that are three
standard deviations above the mean number of patents of all inventors with fewer than three
collaborative ties during the same five-year window. We chose to accept this low level of
connections for isolates to support our claim that they have an opportunity to somehow affect the
knowledge directions of their organization. However, having two or fewer ties still makes these
inventors relatively isolated from their firm‟s network. At the same time, isolates are the most
productive inventors among those with a small number of collaborative ties. 4
Using these indicator variables at the inventor level, we developed our independent variables at
the firm level using counts of integrators, connectors, and isolates, that each firm possesses in
each year from 1974 to 1998 (again counts from time window 74-78 go to 1978, counts from 75-
79 go to 79, etc.).5
3 We also experimented with a number of alternative empirical definitions for connectors. We used initial cutoff
points of more than two patents and only more than two ties. We also defined connectors using the broker and
nbroker measures from UCINET. The broker measure captures the absolute number of pairs in an actor‟s network
which remain unconnected. The nbroker measure is the broker metric normalized by the size of the network. Also,
we used only density metrics to define connectors as knowledge brokers. We stayed with the combination of two
metrics to better reflect the conceptual definitions of connectors. 4 We also experimented with a number of alternative empirical definitions for isolates. First, allowing for no ties
(complete isolation) resulted in very few inventors with more than two patents. Second, we altered the size cutoff
point from three to five to the mean number of collaborative ties to relax the conditions of isolation. Results
remained unchanged. We kept the strong cutoff point of three ties for the final measure to make a conservative test
and stay closer to our claims of relative isolation of these inventors. 5 When empirically defining our three individual roles, we follow two approaches: first, we allow individuals to be
characterized as integrators, connectors, and isolates while they may at the same time be productivity stars. Second,
we add the restriction of them not being productivity stars to capture the ones who play these roles without being
necessarily very productive. We report results from the second approach to present a very conservative test of our
hypotheses. In any case, not many individuals were at the same time productivity and relational stars. Evidence
suggests that increased interaction for knowledge co-creation negatively affects individual productivity and that
individual productive capacities are negatively associated with increased teamwork (McFadyen and Cannella, 2004;
Jones, 2009).
25
Control Variables
We included a series of control variables to control for other factors that have shown to affect a
firm‟s inventive output. First, in every model we included the dependent variable (citations,
claims, or counts) lagged as a right hand side variable to make a very conservative test of our
hypotheses, address any remaining endogeneity concerns, and possibly control for a specification
bias. Further, we controlled for the number of biotech patents and the ratio of biotech to all
patents to capture the performance and focus of firms in the emerging biotechnology paradigm
which may also affect their overall inventive output. To identify biotech patents, we relied on the
definition of a biotech patent provided by the Patent Technology Monitoring Division (PTMD)
of the U.S. PTO. We also included the number of all patents (complete patent portfolio of each
firm without sampling) assigned to each firm to rule out the effect of overall inventive
performance or increased propensity to patent on the inventive output related to human
therapeutics. In addition, we included the number of total alliances and the number of
exploration alliances (upstream knowledge-oriented alliances) in our models to control for the
effect of alliance activity on inventive output. We collected data on every firm‟s alliances
portfolio from the BioScan directory and the ReCap database, data sources that are the arguably
the most comprehensive of alliance activities. We also included the number of biotech-related
acquisitions in our model to control for the effect of rapid talent infusion on inventive output.
We relied on the SDC Platinum database for data on acquisitions. Finally, we used controls for
merged entities (merged) as horizontal mergers are very common in the industry, for national
origin (US and EU), and for the main industry of each firm‟s activities as there are many firms
that are large diversified corporations with a presence in human therapeutics (Pharma).

26
We included in our models the number of star inventors (stars) that each firm possesses. We
followed prior research and defined stars based on their above average productivity. At the
inventor level, a star is an indicator variable with a value one if the inventor has patents that are
three standard deviations above the mean number of patents of every other inventor in the same
five-year time window. At the firm level, stars is a variable counting the number of star
inventors for every five year window. Hence, we controlled for the impact of star inventors on
their firm‟s inventive output. More importantly, we controlled for network size which is arguably
one of the main drivers of the development of integrators, connectors, and isolates. The larger the
network the more the opportunities for individuals to establish connections and become
integrators or connectors and the greater the probability to find more isolates. Hence, by
controlling for network size we were able to run very conservative tests for our hypotheses as we
were able to show that integrators, connectors, and isolates all affect innovative output above and
beyond any effect of the overall network size. By including network size which is the number of
inventors in every five-year window, we also controlled for the size of each firm and we had a
fine-grained measure of research investment in inventive activities.
Estimation
Our three dependent variables (patent citations, claims, counts) are all nonnegative overdispersed
count variables. Therefore, we used the negative binomial estimation method which provides a
better fit for the data than the restrictive Poisson. Both fixed- and random- effects specifications
would allow us to control for any remaining unobserved heterogeneity (Greene, 2003). We run a
Hausman test which suggested that there are no significant differences between the two
estimation methods. Therefore, we chose to rely on a random-effects specification, which is
preferable in our case because we want to include time invariant covariates as control variables

27
(Hsiao, 2003). However, as a robustness check, we also used the fixed-effects specification and
our results remained the same. Overall, we included the dependent variable lagged as a control,
and we constructed our independent variables using 5-year rolling windows. Therefore, along
with the rich set of control variables we believe that we did our best to address any endogeneity
concerns (Hamilton and Nickerson, 2003). For better interpretation of the results and in order to
create our interaction terms for hypothesis four, we standardized all independent variables before
entering them in the regressions (Cohen et al. 2003). To further alleviate simultaneity concerns
and enhance any causality claims, we lagged the control variables related to innovative
performance, alliances, and acquisitions by one year.
RESULTS
Table 1 depicts descriptive statistics and bivariate correlations for our variables. Correlations
among our independent variables are well below the recommended ceiling of 0.70. To further
evaluate the threat of collinearity, we estimated the variance inflation factors (VIFs) for each
coefficient, with the maximum estimated VIF being 3.44, which is again well below the
recommended threshold of 10 (Cohen et al. 2003). However, we observe that correlations among
our types of relational stars, although below the recommended threshold, are still slightly
elevated. This is the result of aggregation of roles at the firm level and does not reflect
similarities at the individual level. To support this claim, we submit the correlation table at the
individual level (Table 2), which shows that for our 550,000 individual observations, correlations
among our independent variables are very close to zero showing that the three types of relational
stars capture strongly different individual roles in a firm‟s network. A second observation that is
worth noting from the bivariate correlations is the role of network size as a significant driver of

28
relational stars. Hence, we are confident that by including it as a control variable we are able to
account for a strong firm-level driver of our independent variables and establish their importance
above and beyond any effect coming from the size of network and the number of inventors in
any firm‟s network.
„Place Tables 1-2 about here‟
Tables 3-4 depict the regression results for our two alternative measures of inventive quality:
citations and claims. Table 5 reports the regression results for inventive quantity using our
independent variables to predict simple patent counts. For every dependent variable we follow a
similar approach. Model 1 includes only control variables. In Model 2, we add the direct effects
of the three types of relational stars. In Model 3, we also include the two-way interactions among
our independent variables and finally in Model 4, we add the three-way interaction among the
relational stars. For every dependent variable, each subsequent model significantly improves the
respective baseline model.
Hypothesis 1 predicts a positive effect of the number of integrators on inventive quality. From
Model 2, integrators are positively and significantly associated with citations (p<0.001) and
claims (p<0.001). This effect remains after inclusion of the various interactions thus providing
support for our first hypothesis. Hypothesis 2 predicts a positive effect of the number of
connectors on inventive quality. Similarly, connectors are positively and significantly associated
with citations (p<0.001) and claims (p<0.001) and their effect remains after the addition of
interactions in models 3 and 4, thus offering support for our second hypothesis. Finally, in
hypothesis 3 we predict a positive effect of isolates on quality. Isolates are positively and
significantly associated with both citations (p<0.001) and claims (p<0.001) and remain positive
after inclusion of interactions, thus supporting our third hypothesis. As can be seen from Table 5,

29
the three types of relational stars also have similar positive and significant effects on quantity of
inventive output.
„Place Tables 3-4 about here‟
Although all three types of relational stars seem to have similarly positive effects on both
inventive quality and quantity, we report here some interesting results from assessing the
magnitudes of these positive effects. A standard deviation increase in the number of integrators
results in a 9 percent increase in the number of citations, a 10 percent increase in claims, and an
8 percent increase in patent counts. A standard deviation increase in the number of connectors
results in a 21 percent increase in citations, 24 percent increase in claims, and 15 percent increase
in patent counts. Finally, a standard deviation increase in the number of isolates results in a 5
percent increase in citations, 9 percent increase in claims, and 6 percent increase in patent counts.
The first important observation comes from identifying a pattern that seems robust for all three
individual roles. Although all three have a positive effect on inventive quantity, their positive
effect is much stronger when it comes to inventive quality. The second important observation
comes from comparing the positive effects of the three roles. Connectors have the strongest
effect on quality and quantity, followed by integrators and isolates. Therefore, we conclude that
relational stars are more important for quality than they are for quantity and that individuals who
span structural holes but at the same time reach out for a larger share of the network have the
strongest effect on inventive quality.
Our results from the interactions among the three roles suggest a substitute relationship between
relational stars. The coefficient of the interaction between integrators and connectors is negative
and significant when predicting citations (p<0.001) and claims (p<0.001). The interaction
between integrators and isolates is negative and significant for citations (p<0.001) but not
30
significant for claims. Finally, the interaction between connectors and isolates is negative and
significant for both citations (p<0.001) and claims (p<0.001). Interestingly, the coefficient of the
triple interaction is positive and significant for both citations (p<0.001) and claims (p<0.001).
These results are similar when predicting inventive quantity and simple patent counts.6 We
conclude that there seems to be a strong substitution between the positive effects on inventive
quality coming from the three types of relational stars. Integrators, connectors, and isolates rely
on various levels and composition of social capital to affect inventive quality for their
organizations. However, the paths taken by the three roles seem to be just alternative paths to the
same outcome: novel recombination of knowledge which may have its source in selecting the
most promising recombinations among a large number of potential ones (integrators), in
experimenting with novel recombinations between distant and unrelated clusters of knowledge
(connectors), or in producing recombinations that remain unaffected by the organization‟s
knowledge directions and therefore provide necessary diversity (isolates). These results are
consistent with Burt‟s (1997) claim that positive effects of social capital are contingent on the
number of individuals doing the same work. Based on this argument, we can also speculate that
the interaction between integrators and isolates is not always significantly negative because these
two roles are the farthest away from each other in their paths to knowledge recombination. From
the results of triple interaction, we can conclude that the combined presence of three relational
stars alleviates some of the negative effects from the two-way interactions.
„Place Figures 1-4 about here‟
To provide a more intuitive and clear understanding of the interaction results, we display them
graphically in Figures 1-4. In Figure 1, we plot the interaction between integrators and
6 Our results for the direct and interaction effects remain robust (sign and significance) even when we include the
squared terms for stars, integrators, connectors, and isolates thus controlling for any non-linear relationships
between relational stars and inventive quality.

31
connectors and predict its effect on citations. We observe that clearly integrators have a much
stronger positive effect on citations when the level of connectors is low. However, the two lines
do not intersect. This is evidence of the very strong positive effect of connectors on citations (the
lowest point of the pink line is still higher than the highest point of the blue line) and of the fact
that the two roles compensate for each other but are not perfect substitutes. In Figure 2, we plot
the interaction between integrators and isolates. We observe that the positive effect of integrators
is slightly bigger when isolates are low than it is when isolates are high. This is further evidence
of these two roles being very far from each other when it comes to their approach to knowledge
recombination. Similarly, the two lines do not intersect showing that although compensating for
each other, the two roles are not perfect substitutes. In Figure 3, we present the interaction
between connectors and isolates. The positive effect of connectors is much stronger for low
levels of isolates. Interestingly, the two lines intersect pointing to a clear substitution effect
between connectors and isolates. A way to interpret this finding is to think that the positive
effects of connectors and isolates both come from novelty and diversity of knowledge
recombinations (albeit using different paths) and therefore are so close to each other that they
substitute for each other‟s effect. Finally, in Figure 4 we plot the results of the triple interaction.
We observe that the positive effect of integrators is the strongest when both connectors and
isolates are low and decreases as the level of connectors and isolates increases. A very interesting
finding is that the highest positive effect on citations comes when integrators and connectors are
high but isolates are low. In fact, even the lowest point of that line is higher than any other line‟s
highest point. This is further evidence of the substitution between connectors and isolates and
provides important insights into the interactions among the three roles and the internal
configuration that seems to be the most positively associated with inventive quality.

32
We also report some interesting results from our control variables. Dedicated pharmaceutical
firms, European firms, and merged entities seem to perform worse in terms of inventive quality
but generally not in terms of quantity. U.S. firms are better in inventive quality but not in
inventive quantity. Alliances (total or only exploration) have no significant effects while
acquisitions are negatively related with both inventive quality and quantity. Overall innovative
performance is positively associated with citations and counts but negatively with claims. The
performance and focus of firms in biotech has no consistent effect on inventive quality. When
including our independent variables in Models 2, 3, and 4, we observe a negative effect of
network size on inventive quality pointing to negative returns of scale on quality and some weak
positive returns of size on inventive quantity. Productivity stars have a weak positive effect on
inventive quality in Models 4 of citations and claims and a negative effect on inventive quantity
in Model 2. Therefore, if productivity stars have a positive effect, it holds only for quality of
inventive output. However, the results for stars should be interpreted with caution as we define
them as star inventors and not as star scientists as prior literature does. In addition, the results for
both network size and stars should be treated with caution because of elevated correlations
between network size, stars, and our independent variables.
DISCUSSION
In this study, we extended current research on the role of individuals as origins of organizational
innovative outcomes. In particular, we developed a theory on some of invention‟s structural
individual microfoundations. We moved beyond existing research focus on individual
productivity which may have obscured the importance of other critical individual skills for
successful invention. Invention is increasingly a team-based endeavor (Wuchty, Jones, and Uzzi,

33
2007) and is often an outcome of knowledge recombination from existing knowledge stocks
(Fleming, 2001). Therefore, there is a set of collaborative and social skills that individuals need
to possess to facilitate invention process. To identify these individual roles more likely to drive
quality of invention, we applied social network thinking to intraorganizational collaborative
networks emerging through co-patenting individual efforts. Conceptualizing invention as a
process of recombinant search, we argued for the critical role of three individual types:
integrators, connectors, and isolates. Integrators are the individuals who have a very large
network of collaborative ties. Sourcing knowledge from many alters, integrators have the
capacity to explore for a great number of alternative knowledge combinations and select the most
promising among them. Connectors are the individuals whose collaborative ties span structural
holes in their organization‟s knowledge network and at the same time link not only unconnected
but also distant clusters of knowledge. Their broad view of the knowledge network allows them
to experiment with novel and diverse knowledge recombinations and therefore affect the quality
of inventive output. Isolates are productive individuals who remain relatively unconnected from
the collaborative network; they are independent producers of knowledge. Isolates are important
because of the absence of collaborative ties. They can infuse the knowledge base with diversity
as their knowledge remains unaffected by the organization‟s knowledge directions and therefore
help avoid competence traps. Apparently, all three individual roles become important for the
quality of inventive output not necessarily because they are extremely productive but mainly
because their collaborative behavior facilitates effective recombinant search and high quality
invention. We used the term „relational stars‟ to emphasize the social nature of these critical
individual capacities.
Our results show that all three types of relational stars have strong positive effects on the

34
inventive quality of their organizations. They are also positively associated with simple quantity
of inventive output. Interestingly, they all appear to be much more impactful for inventive
quality than quantity, suggesting that their collaborative behavior is even more important for
generating inventions of higher quality rather than just more inventions. Comparing the
magnitude of the positive effect on quality between the three types, we found that connectors
have the largest positive impact on inventive quality, followed by integrators and isolates.
Therefore, although all three are positive quality drivers, if one wants to prioritize one over
others then connectors appear to be the most important individuals for invention. In addition, we
found robust negative interaction effects between the individual roles. These results suggest that
the ways in which relational stars affect quality of invention may just be alternative paths to the
same outcome: a novel recombination of knowledge which may have its source in a number of
different collaborative behaviors. However, the plots of these interactions revealed that two of
our three interactions were simple compensating effects and not perfect substitutions. Although
the positive effect of integrators was even stronger when connectors were low, still having many
integrators and many connectors was better than having few connectors. We found the same
result for integrators and isolates. Only connectors and isolates exhibited clear substitution
effects. The three way interaction results provided very important insights for the most effective
internal configuration of roles. The presence of many integrators combined with many
connectors and few isolates had the most positive effects on inventive quality.
Our arguments and findings have several significant theoretical implications. First, we make an
important contribution to the emerging literature on individuals as the microfoundations of
organizational capabilities (Felin and Foss, 2005). We were able to show that at least when it
comes to invention, certain individuals exhibit patterns of collaborative behavior which make

35
them really valuable as sources of organizational capabilities to generate high quality inventions.
With our findings, we echo early research on the promise of the industrial research laboratory to
bring together “intuitive minds”, “experimenters”, and “observers” to result in successful
inventions (Beer, 1959: 71), roles which arguably correspond to isolates, connectors, and
integrators, respectively. More importantly, these individuals affect inventive quality without
being necessarily extremely productive; instead, it is their collaborative behavior which provides
them with opportunities for novel invention. We were able to show that relational stars positively
affect inventive outcomes. Relying on a large sample of incumbent firms in the
biopharmaceutical industry, we also showed that relational stars can make incumbent firms the
origins of innovation under conditions of technological change in the industry (Tushman and
Anderson, 1986; Anderson and Tushman, 1990). This finding opens the door for many research
questions. Productivity stars are arguably driven solely by individual intellect and are a resource
of given supply. Therefore, firms can either identify them ex ante or just try to hire them away
from competition. On the other hand, relational stars can be an organizational product as well.
What can firms do to identify or internally develop them? Which are the origins of relational
stars? These are individuals who had both the ability and opportunity to become relational stars.
Therefore, future research can follow the „ability‟ path and build on existing evidence that such
stars are often more educated, professional, read the literature more, and make greater use of
individuals that are outside the organization (Allen and Cohen, 1969). Communication stars are
generally technically competent (Tushman and Scanlan, 1981), are perceived by others as a
source of work-related expertise (Kilduff, Tsai, and Hanke, 2006), become relational stars
because of their prior performance (Lee, 2010) and of strong technical contributions (Fleming
and Waguespack, 2007). Alternatively, future research can follow the „opportunity‟ path and

36
identify contexts which create opportunities for internal development of relational stars by
training (Hatch and Dyer, 2004), incentives (Kaplan and Henderson, 2005), alliances or
acquisitions (Paruchuri, Nerkar, and Hambrick, 2006; Paruchuri, 2010), human resource
practices (Adler, Goldoftas, and Levine, 1999), or corporate culture logics (Felin, Zenger, and
Tomsik, 2009).
Second, our study has important implications for research on intrafirm knowledge networks.
Prior research has been able to document that position of individuals in these networks matters
for their own individual outcomes and that the structure of the network affects network
outcomes. Here, we showed how micro-level network phenomena can translate into macro-level
network outcomes and how the presence of individual nodes in a network (relational stars)
affects network level outcomes (inventive quality of the organization). Two recent reviews in the
topic suggested that such efforts are necessary (Brass et al. 2004; Ibarra, Kilduff, and Tsai,
2005). To do that, we theoretically and empirically defined our relational stars as outliers in
some meaningful network metrics not relatively to their peers in the same network but relatively
to all individuals in every competing organization‟s network. Therefore, we were able to capture
the best individuals from every category and suggest that firms with some of the best in their
network will have an inventive quality advantage. For example, when it came to defining
integrators we looked at the number of collaborative ties that every individual from every firm
had during a certain five year time window. We argued that individuals at the top of that
distribution were positioned to have the greatest opportunity to identify promising knowledge
combinations. By definition, every additional tie resulted in an exponential increase in the
number of alternative combinations. To be sure, our approach assumes that we can compare
relational stars that had the position because of their own ability and relational stars who became

37
that because of firm-specific structures or incentives. Combined with the issues outlined in the
previous paragraph, future research should attempt to understand whether the two types of
relational stars have similar positive effects.
Third, our study has significant implications for research in social capital. Our overarching idea
was that knowledge co-creation and collaboration behavior, which is a strong form of social
capital, results in the creation of human capital (Coleman, 1988). We were able to show that
individuals with the right type and amount of collaborative ties had a superior capacity for
knowledge recombination that resulted in quality of inventive output. To do that, we relied on a
context where the network is not characterized by competitive relationships; rather, it is a
structure that mostly resembles a creative collective (Hargadon and Bechky, 2006). In such a
cooperative context, centrality seems to uncover the tertius iungens orientation (Obstfeld, 2005)
in our integrators and they become sources of high quality invention. In addition, we extend
current understanding on the positive role of knowledge brokers as experts fostering system-level
innovation (Lingo and O‟Mahony, 2010) by defining connectors as individuals who are
knowledge brokers but at the same time link distant clusters of knowledge and access a wide
range of the network. Connectors have the capacity to not only be more creative themselves
(Fleming, Mingo, and Chen, 2007) but also uncover promising links by bridging knowledge
silos. Our findings on isolates highlight the fact that even a lack of social capital can be very
important in cooperative contexts like collaboration networks. We emphasized the need for
diversity which can be provided by the often neglected role of productive isolates. Finally, our
findings on interaction among the three types of relational stars provide additional evidence to
support a contingent view of social capital (Burt, 1997), where its importance depends on the
number of other individuals with similar levels of social capital. We submit here an additional

38
limitation of our study: we relied on co-patenting to build internal knowledge networks and
assume the creation of social capital from these ties. Although there is research supporting our
claim that co-patenting involves significant knowledge flows (Singh, 2005), we were only able
to observe co-patenting and assume knowledge flows. Hence, future research can exploit other
sources of individual collaboration to extract information about individual social capital.
We conclude with our study‟s implications for managerial practice. Received wisdom suggests
that individual productivity is the most important skill for innovation and therefore managerial
incentive structures are often built to maximize effort and productivity. Our study suggests that
the sole focus on productivity, effort, and star knowledge workers may be misleading. First,
innovation is a deeply social process of knowledge recombination and collaborative skills are
required for effective execution. Second, star workers are in limited supply and therefore come
with important caveats: they may appropriate all of the value they create, leave the organization
and transfer their knowledge to competitors (Almeida and Kogut, 1999), and they are pretty
visible to the market and therefore more likely to be hired away (Gardner, 2005). In addition,
except for their ex ante identification, there is no other straightforward way for managers to
internally build them. On the other hand, relational stars are free from those weaknesses. First,
they are not in limited supply: relational stars can be identified ex ante or developed internally
through encouragement of collaboration. Individuals whose performance depends on interactions
with others cannot transfer easily their performance to other organizations (Groysberg, Lee, and
Nanda, 2008) and are therefore also less likely to leave. Individual collaboration generates
spillovers (Oettl, 2009) and therefore firms can internalize these externalities and avoid full value
appropriation by the individuals involved. In addition, they are less visible to the market because
of their embedded nature in the organization‟s knowledge networks that it becomes less likely

39
for them to become the target of competition. More importantly, managers can design practices,
incentives, structures, or reward schemes to internally develop relational stars. Managers can do
that by incentivizing the right type of collaboration among employees and develop internally the
skills of their intellectual capital resources which may remain untapped.

40
REFERENCES
Abell P, T. Felin , and N. Foss. 2008. Building micro-foundations for the routines, capabilities,
and performance links. Managerial and Decision Economics, 29: 489-502.
Adler, P. S., B. Goldoftas, and D.I. Levine. 1999. Flexibility versus efficiency? A case study of
model changeovers in the Toyota production system. Organization Science, 10: 43-68.
Adler, P. S., and S.W. Kwon. 2002. Social capital: Prospects for a new concept. Academy of
Management Review, 27: 17-40.
Ahuja, G. 2000. Collaboration networks, structural holes, and innovation: A longitudinal study.
Administrative Science Quarterly, 45: 425-455.
Allen T.J., and S.I. Cohen. 1969. Information flow in research and development laboratories.
Administrative Science Quarterly, 14: 12-19.
Almeida, P., and B. Kogut. 1999. Localization of knowledge and the mobility of engineers in
regional networks. Management Science, 45: 905-917.
Amabile, T. M., R. Conti, H. Coon, J. Lazenby, and M. Herron. 1996. Assessing the work
environment for creativity. Academy of Management Journal, 39: 1154-1184.
Anderson, P., and M.L. Tushman. 1990. Technological discontinuities and dominant designs: a
cyclical model of technological change. Administrative Science Quarterly, 35: 604-633.
Argyres, N., and B.S. Silverman. 2004. R&D, organization structure, and the development of
corporate technological knowledge. Strategic Management Journal, 25: 929-958.
Beer, J. J. 1959. The emergence of the German Dye Industry. Urbana, IL: University of Illinois
Press.
Borgatti, S. P., and R. Cross. 2003. A relational view of information seeking and learning in
social networks. Management Science, 49: 432-445.
Borgatti, S. P., and P.C. Foster. 2003. The network paradigm in organizational research: A
review and typology. Journal of Management, 29: 991-1013.
Brass, D.J. 1984. Being in the right place: A structural analysis of individual influence in an
organization. Administrative Science Quarterly, 29: 518-539.
Brass, D. J., J. Galaskiewicz, H.R. Greve, and W. Tsai. 2004. Taking stock of networks and
organizations: A multilevel perspective. Academy of Management Journal, 47: 795-817.

41
Brown, S. L., and K.M. Eisenhardt. 1997. The art of continuous change: Linking complexity
theory and time-paced evolution in relentlessly shifting organizations. Administrative
Science Quarterly, 42: 1-34.
Burt R.S. 1997. The contingent value of social capital. Administrative Science Quarterly, 42:
339-365.
Burt R.S. 2000. The network structure of social capital.” In R.I. Sutton and B.M. Staw (eds.),
Research in Organizational Behavior, 22: 345-423. New York: Elsevier/JAI.
Burt R.S. 2004. Structural holes and good ideas. American Journal of Sociology, 110:349-399.
Cohen P., J. Cohen, S.G. West, and L.S. Aiken. 2003. Applied Multiple Regression/Correlation
Analysis for the Behavioral Sciences, 3rd
ed. Erlbaum, Hillsdale, NJ.
Cohen W.M., R.R. Nelson, and J.P. Walsh. 2000. Protecting their intellectual assets:
Appropriability conditions and why U.S. manufacturing firms patent (or not). NBER
Working Paper No.w7552.
Coleman, J.S. 1988. Social capital in the creation of human capital. American Journal of
Sociology, 94: S95-S120.
Conner K.R., and C.K. Prahalad. 1996. A resource-based theory of the firm: knowledge versus
opportunism. Organization Science, 7: 477-501.
Cowan, R., and N. Jonard. 2003. The dynamics of collective invention. Journal of Economic
Behavior & Organization, 52: 513-532.
Cross, R. and J.M. Cummings. 2004. Tie and network correlates of individual performance in
knowledge-intensive work. Academy of Management Journal, 47: 928-937.
Dahlin, K., M. Taylor, and M. Fichman. 2004. Today‟s Edisons or weekend hobbyists: technical
merit and success of inventions by independent inventors. Research Policy, 33: 1167-
1183.
Felin, T., and N.J. Foss. 2005. Strategic organization: a field in search of micro-foundations.
Strategic Organization, 3: 441-455.
Felin, T., and W.S. Hesterly. 2007. The knowledge based view, nested heterogeneity, and new
value creation: Philosophical considerations on the locus of knowledge. Academy of
Management Review, 32: 195-218.
Felin, T., T.R. Zenger, and J.Tomsik. 2009. The knowledge economy: emerging organizational
forms, missing microfoundations, and key considerations for managing human capital.
Human Resource Management, 48: 555-570.
42
Felin, T. and T.R. Zenger. 2009. Entrepreneurs as theorists: on the origins of collective beliefs
and novel strategies. Strategic Entrepreneurship Journal, 3: 127-146.
Fleming, L. 2001. Recombinant uncertainty in technological search.” Management Science, 47:
117-132.
Fleming, L. 2002. Finding the organizational sources of technological breakthroughs: the story
of Hewlett-Packard's thermal ink-jet. Industrial and Corporate Change, 11: 1059-
1084.
Fleming, L., S. Mingo, and D. Chen. 2007. Collaborative brokerage, generative creativity, and
creative success. Administrative Science Quarterly, 52: 443-475.
Fleming, L. and D.M. Waguespack. 2007. Brokerage, boundary spanning, and leadership in open
innovation communities. Organization Science, 18: 165-180.
Galunic, C., and K.M. Eisenhardt. 2001. Architectural innovation and modular corporate
forms.Academy of Management Journal, 44: 1229-1249.
Galunic, C., and S. Rodan. 1998. Resource recombinations in the firm: knowledge structures and
the potential for Schumpeterian innovation. Strategic Management Journal, 19: 1193-
1201.
Gardner, T.M. 2005. Interfirm competition for human resources: Evidence from the software
industry. Academy of Management Journal, 48: 237-256.
Gargiulo, M. and M. Benassi. 2000. Trapped in your own net? Network cohesion, structural
holes, and the adaptation of social capital. Organization Science, 11: 183-196.
Gargiulo, M., G. Ertug, and C. Galunic. 2009. The two faces of control: network closure and
individual performance among knowledge workers. Administrative Science Quarterly,
54: 299-333.
Gavetti, G., and D. Levinthal. 2000. Looking forward and looking backward: Cognitive and
experiential search. Administrative Science Quarterly, 45: 113-137.
Gibbons R. 1999. Taking Coase seriously. Administrative Science Quarterly, 44: 145-157.
Grant, R.M. 1996. Toward a knowledge-based theory of the firm. Strategic Management Journal,
17: 109-122.
Greene, W.H. 2003. Econometric Analysis, 5th
ed. Prentice Hall, Upper Saddle River, NJ.
Groysberg, B., L-E. Lee, and A. Nanda. 2008. Can they take it with them? The portability of star
knowledge workers' performance. Management Science, 54: 1213-1230.

43
Hall, B.H., A.B. Jaffe, and M. Trajtenberg. 2001. The NBER patent citation data file: lessons,
insights and methodological tools. NBER Working Paper No. 8498.
Hall, B.H., A.B. Jaffe, and M. Trajtenberg. 2005. Market value and patent citations. RAND
Journal of Economics, 36: 16-38.
Hamilton, B.J., and J.A. Nickerson. 2003. Correcting for endogeneity in strategic management
research. Strategic Organization, 1: 51-78.
Hansen, M.T. 1999. The search-transfer problem: The role of weak ties in sharing knowledge
across organization subunits. Administrative Science Quarterly, 44: 82-111.
Hargadon, A.B., and B.A. Bechky. 2006. When collections of individuals become creative
collectives: A field study of problem solving at work. Organization Science, 17: 484-500.
Hargadon,A.B., and A. Fanelli. Action and possibility: Reconciling dual perspectives of
knowledge in organizations. Organization Science, 13: 290-302.
Hatch, N. W., and J.H. Dyer. 2004. Human capital and learning as a source of sustainable
competitive advantage. Strategic Management Journal, 25: 1155-1178.
Henderson, R., and I. Cockburn. 1994. Measuring competence? Exploring firm effects in
pharmaceutical research. Strategic Management Journal, 15: 63-84.
Hsiao, C. 2003. Analysis of Panel Data, 2nd
ed. Cambridge University Press, Cambridge, UK.
Ibarra, H. 1993. Network centrality, power, and innovation involvement: Determinants of
administrative roles. Academy of Management Journal, 36: 471:501.
Ibarra, H., M. Kilduff, and W.Tsai. 2005. Zooming in and out: Connecting individuals and
collectivities at the frontiers of organizational network research. Organization Science,
16: 359-371.
Inkpen, A., and E. Tsang. 2005. Social capital, networks and knowledge transfer. Academy of
Management Review, 30: 146-165.
Jones, B. F. 2009. The Burden of knowledge and the "death of the renaissance man": Is
innovation getting harder? Review of Economic Studies, 76: 283-317.
Kang, S., S.S. Morris, and S.A. Snell. 2007. Relational archetypes, organizational learning, and
value creation: Extending the human resource architecture. Academy of Management
Review, 32: 236-256
Kaplan, S., and R. Henderson. 2005. Inertia and incentives: Bridging organizational economics
and organizational theory. Organization Science, 16: 509-521.

44
Katila, R., and G. Ahuja. 2002. Something old, something new: A longitudinal study of search
behavior and new product introduction. Academy of Management Journal, 45: 1183-
1194.
Kilduff, M., and D.J. Brass. 2010. Organizational social network research: Core ideas and key
debates. Academy of Management Annals, 4: 317-357.
Kilduff, M, W. Tsai, and R. Hanke. 2006. A paradigm too far? A dynamic stability
reconsideration of the social network research program. Academy of Management
Review, 31: 1031-1048.
Kleinbaum, A.M., and M.L. Tushman. 2007. Building bridges: the social structure of
interdependent innovation. Strategic Entrepreneurship Journal, 1: 103-122.
Kogut, B., and U. Zander. 1992. Knowledge of the firm, combinative capabilities, and the
replication of technology. Organization Science, 3: 383-397.
Lacetera, N., I.M. Cockburn, and R. Henderson. 2004. Do firms change capabilities by hiring
new people? A study of the adoption of science-based drug discovery. In Baum J.A.C., &
A. M. McGahan (Eds.), Business Strategy over the Industry Lifecycle: Advances in
Strategic Management Vol.21. Boston, MA: Elsevier.
Langlois, R.N., and N. Foss. 1999. Capabilities and governance: the rebirth of production in the
theory of economic organization. KYKLOS, 52: 201-218.
Lavie, D. 2006. Capability reconfiguration: An analysis of incumbent responses to technological
change. Academy of Management Review, 31:153-174.
Lazer, D., and A. Friedman. 2007. The network structure of exploration and exploitation.
Administrative Science Quarterly, 52: 667-694.
Lee, J. 2010. Heterogeneity, brokerage and innovative performance: endogenous formation of
collaborative inventor networks. Organization Science: forthcoming.
Levitt, B., and J.G. March. 1988. Organizational learning. Annual Review of Sociology, 14: 319-
338.
Lingo, E.L., and S. O‟Mahony. 2010. Nexus work: Brokerage on creative projects.
Administrative Science Quarterly, 55:47-81.
McFadyen, M. A., and A.A. Canella. 2004. Social capital and knowledge creation: Diminishing
returns to the number and strength of exchange relationships. Academy of Management
Journal, 47: 735-746.
45
Mehra, A., M. Kilduff, and D.J. Brass. 2001. The social networks of self-monitors: Implications
for workplace performance. Administrative Science Quarterly, 46: 121-146.
Morrison, E.W. 2002. Newcomers‟s relationships: The role of social network ties during
socialization. Academy of Management Journal, 45: 1149-1160.
Murray, F. and S. O‟Mahony. 2007. Exploring the foundations of cumulative innovation:
Implications for organization science. Organization Science, 18: 1006-1021.
Nelson, R.R., and S. Winter. 1982. An Evolutionary Theory of Economic Change. Harvard
University Press: Cambridge, MA.
Nahapiet, J., and S. Ghoshal. 1998. Social capital, intellectual capital, and the organizational
advantage. Academy of Management Review, 23: 242-266.
Nerkar, A., S. Paruchuri. 2005. Evolution of R&D capabilities: The role of knowledge networks
within a firm. Management Science, 51: 771-785.
Nonaka, I. 1994. A dynamic theory of organizational knowledge creation. Organization Science,
5: 14-37.
Obstfeld, D. 2005. Social networks, the tertius iungens orientation, and involvement in
innovation. Administrative Science Quarterly, 50: 100-130.
Oettl, A. 2009. Productivity and helpfulness: Implications of a new taxonomy for star
scientists. Georgia Institute of Technology Working Paper.
O'Reilly, C., and M.L. Tushman. 2007. Ambidexterity as a dynamic capability: Resolving the
innovator‟s dilemma. Harvard Business School Working Paper 07-088.
Paruchuri, S. 2010. Intraorganizational networks, interorganizational networks, and the impact of
central inventors: A longitudinal study of pharmaceutical firms. Organization Science,
21: 63-80.
Paruchuri, S., A. Nerkar, and D.C. Hambrick. 2006. Acquisition integration and productivity
losses in the technical core: Disruption of inventors in acquired companies. Organization
Science, 17: 545-562.
Perry-Smith, J. E., and C.E. Shalley. 2003. The social side of creativity: a static and dynamic
social network perspective. Academy of Management Review, 28: 89-106.
Podolny, J.M. 2001. Networks as the pipes and prisms of the market. American Journal of
Sociology 107: 33-60.
Reagans, R., and B. McEvily. 2003. Network structure and knowledge transfer: The effects of
cohesion and range. Administrative Science Quarterly, 48: 240-267.

46
Reagans, R., and E.W. Zuckerman. 2001. Networks, diversity, and productivity: The social
capital of corporate R&D teams. Organization Science, 12: 502-517.
Reagans, R., E.W. Zuckerman, and B. McEvily. 2004. How to make the team: Social networks
vs. demography as criteria for designing effective team. Administrative Science
Quarterly, 49: 101-133.
Rothaermel, F. T., and A.M. Hess. 2007. Building dynamic capabilities: Innovation driven by
individual-, firm-, and network-level effects. Organization Science, 18: 898-921.
Schumpeter, J.A. 1942. Capitalism, Socialism, and Democracy. New York: Harper and Brothers.
Singh, J. 2005. Collaborative networks as determinants of knowledge diffusion patterns.
Management Science, 51: 756-770.
Singh, J. 2008. Distributed R&D, cross-regional knowledge integration and quality of innovative
output. Research Policy, 37: 77-96.
Singh, J. and L. Fleming. 2010. Lone inventors as sources of breakthrough: Myth or reality?
Management Science, 56: 41-56.
Sorenson, O., J.W. Rivkin, and L. Fleming. 2006. Complexity, networks and knowledge flow.
Research Policy, 35: 994-1017.
Teece, D., G. Pisano, and A. Shuen. 1997. Dynamic capabilities and strategic management.
Strategic Management Journal, 18: 509-533.
Thomas-Hunt, M.C., T.Y. Ogden, and M.A. Neale. 2002. Who's really sharing? Effects of social
and expert status on knowledge exchange within groups. Management Science, 49: 464-
477.
Tichy, N. M., M.L. Tushman, and C. Fombrun. 1979. Social network analysis for organizations.
Academy of Management Review, 4: 507-519.
Tsai, W. 2002. Social structure of “coopetition” within a multiunit organization: coordination,
competition, and intraorganizational knowledge sharing. Organization Science,
13: 179-190.
Tsai, W., and S. Ghoshal. 1998. Social capital and value creation: The role of interfirm networks.
Academy of Management Journal, 41: 464-476.
Tushman, M.L., and P. Anderson. 1986. Technological discontinuities and organizational
environments. Administrative Science Quarterly, 31: 439-465.
Tushman, M.L., and E. Romanelli. 1983. Uncertainty, social location, and influence in decision
making: A sociometric analysis. Management Science, 29: 12-23.

47
Tushman, M.L., and T.J. Scanlan. 1981. Boundary spanning individuals: Their role in
information transfer and their antecedents. Academy of Management Journal, 24: 289-
305.
Wuchty, S., B.F. Jones, and B. Uzzi. 2007. The increasing dominance of teams in production of
knowledge. Science, 316: 1036-1039.
Xiao, Z., and A.S. Tsui. 2007. When brokers may not work: the cultural contingency of social
capital in Chinese high-tech firms. Administrative Science Quarterly, 52:1-31.
Yayavaram, S., and G. Ahuja. 2008. Decomposability in knowledge structures and its impact on
the usefulness of inventions and knowledge-base malleability. Administrative Science
Quarterly, 53: 333-362.
Zenger, T.R., and W.S. Hesterly. 1997. The disaggregation of corporations: selective
intervention, high-powered incentives, and molecular units. Organization Science, 8:
209-222.
Zollo, M. and S. Winter. 2002. Deliberate learning and the evolution of dynamic capabilities.
Organization Science, 13: 339-351.
Zucker, L. G., and M.R. Darby. 1997. Present at the biotechnological revolution: transformation
of technological identity for a large incumbent pharmaceutical firm. Research Policy, 26:
429-446.
Zucker, L. G., M.R. Darby, and J.S. Armstrong. 2002. Commercializing knowledge: University
science, knowledge capture, and firm performance in biotechnology. Management
Science, 48: 138-153.
Zucker, L.G., M.R. Darby, and M. Brewer. 1998. Intellectual human capital and the birth of US
biotechnology enterprises. The American Economic Review, 88: 290-306.

48
Table 1
Descriptive Statistics and Bivariate Correlation Matrix
Variable Mean S.D. 1 2 3 4 5 6 7 8 9 10 11 12 13 14 15 16 17
1 Patent citations 323.26 476.90
2 Patent claims 523.10 767.36 0.89
3 Patent counts 46.73 67.70 0.88 0.94
4 Firm merged 0.12 0.33 0.14 0.15 0.18
5 European firm 0.30 0.46 0.06 0.13 0.18 0.08
6 US firm 0.34 0.47 0.31 0.23 0.17 0.16 -0.47
7 Pharma firm 0.46 0.50 -0.23 -0.24 -0.24 0.01 0.03 -0.06
8 Biotech patents 18.30 26.66 0.58 0.63 0.68 0.36 0.13 0.18 0.04
9 Biotech ratio 0.42 0.45 -0.15 -0.13 -0.13 0.16 0.07 -0.13 0.35 0.18
10 All patents 67.90 96.84 0.80 0.85 0.88 0.10 0.13 0.22 -0.30 0.58 -0.24
11 Alliances 1.64 3.47 0.14 0.16 0.20 0.27 0.02 0.13 0.06 0.42 0.16 0.14
12 Exploration alliances 0.72 1.62 0.17 0.21 0.23 0.28 0.04 0.12 0.02 0.43 0.13 0.18 0.88
13 Acquisitions 0.25 1.04 0.13 0.14 0.16 0.30 0.03 0.12 0.08 0.35 0.13 0.12 0.33 0.38
14 Stars 4.26 11.01 0.51 0.57 0.72 0.22 0.18 0.03 -0.12 0.60 -0.04 0.62 0.26 0.26 0.18
15 Network size 237.38 292.67 0.74 0.79 0.87 0.26 0.18 0.06 -0.28 0.61 -0.11 0.79 0.25 0.28 0.19 0.76
16 Integrators 2.69 8.25 0.25 0.26 0.40 0.08 0.14 -0.13 -0.03 0.34 0.03 0.33 0.14 0.14 0.07 0.65 0.51
17 Connectors 4.06 4.25 0.31 0.31 0.44 0.12 0.10 0.01 -0.08 0.41 0.00 0.38 0.19 0.17 0.08 0.63 0.49 0.51
18 Isolates 2.97 3.80 0.65 0.69 0.66 0.13 0.07 0.30 -0.16 0.42 -0.10 0.58 0.12 0.14 0.13 0.33 0.56 0.01 0.07
Note: N = 2442 firm-year observations

49
Table 2
Descriptive Statistics - Correlation Matrix At the Individual Level
Mean S.D. 1 2 3
1 Star 0.019 0.136
2 Integrator 0.012 0.108 -0.02
3 Connector 0.010 0.099 -0.01 -0.01
4 Isolate 0.009 0.092 0.03 -0.01 -0.01
Note: N = 550921 individual-level observations

50
Table 3
Results of Random-Effects Negative Binomial Regression Predicting Number of Citations
Variable Model 1 Model 2 Model 3 Model 4
Constant 0.456●●●
0.556●●●
0.624●●●
0.644●●●
(0.064) (0.065) (0.066) (0.066)
Firm merged - 0.219●●● - 0.191●●● - 0.163●●● - 0.165●●●
(0.051) (0.051) (0.052) (0.051)
European firm - 0.146●● - 0.163●● - 0.130●● - 0.117●
(0.073) (0.073) (0.073) (0.073)
US firm 0.274●●●
0.274●●●
0.271●●●
0.268●●●
(0.074) (0.074) (0.074) (0.074)
Pharma - 0.222●●● - 0.232●●● - 0.250●●● - 0.261●●●
(0.062) (0.062) (0.062) (0.061)
Citations lagged 6.7E-04●●●
6.2E-04●●●
6.1E-04●●●
6.0E-04●●●
(4.6E-05) (4.9E-05) (5.0E-05) (4.9E-05)
Alliances 3.7E-03 4.4E-03 5.0E-03 3.0E-03
(7.4E-03) (7.4E-03) (7.5E-03) (7.5E-03)
Acquisitions - 0.026●● - 0.009 - 0.014 - 0.014
(0.016) (0.015) (0.015) (0.015)
Exploration alliances - 0.018 - 0.015 - 0.017 - 0.017
(0.017) (0.017) (0.017) (0.017)
All patents 6.0E-04●●
7.5E-04●●●
1.0E-03●●●
1.3E-03●●●
(3.0E-04) (3.0E-04) (3.0E-04) (2.9E-04)
Biotech patents - 3.8E-04 - 1.3E-03●●●
- 1.8E-03●●
- 1.4E-03●●
(7.9E-04) (8.2E-04) (8.5E-04) (8.4E-04)
Biotech ratio 0.025 0.024 0.020 0.019
(0.043) (0.043) (0.044) (0.044)
Network size 1.1E-04 - 1.4E-04 - 3.1E-04●●●
- 4.1E-04●●●
(1.1E-04) (1.2E-04) (1.2E-04) (1.2E-04)
Stars 0.008 - 0.027 0.033 0.046●
(0.024) (0.024) (0.029) (0.027)
Integrators 0.059●●● 0.092●●● 0.091●●●
(0.019) (0.019) (0.019)
Connectors 0.105●●● 0.179●●● 0.198●●●
(0.017) (0.020) (0.020)
Isolates 0.084●●● 0.072●●● 0.056●●●
(0.015) (0.017) (0.017)
Integrators x Connectors - 0.039●●● - 0.041●●●
(0.007) (0.007)
Integrators x Isolates - 0.007 - 0.018●●
(0.009) (0.012)
Connectors x Isolates - 0.069●●● - 0.120●●●
(0.015) (0.018)
Triple Interaction 0.031●●●
(0.006)
No. of observations / groups 2414 / 106 2414 / 106 2414 / 106 2414 / 106
Log likelihood -14377.75 -14349.79 -14705.61 -14628.84
Chi square 1044.97 1117.87 1167.81 1214.54
Δ chi square 72.90●●● 122.84●●● 169.57●●●
Notes: ● p < 0.1; ●● p < 0.05; ●●● p < 0.01; standard errors in parentheses
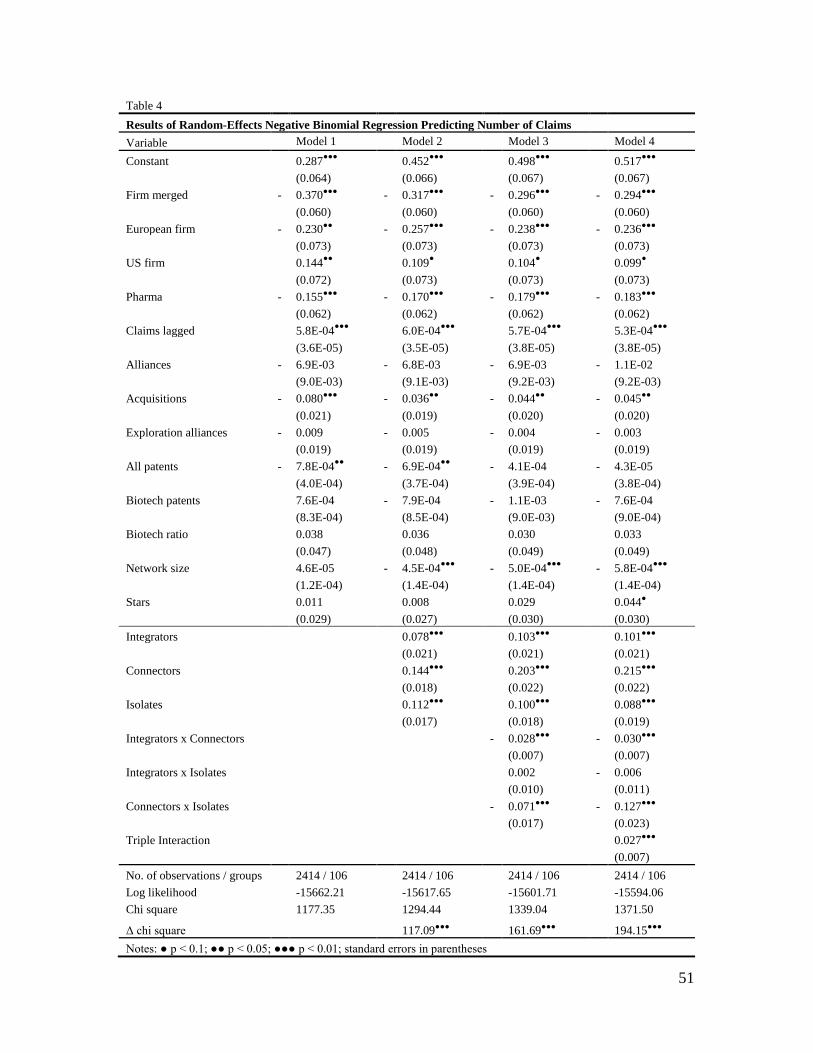
51
Table 4
Results of Random-Effects Negative Binomial Regression Predicting Number of Claims
Variable Model 1 Model 2 Model 3 Model 4
Constant 0.287●●●
0.452●●●
0.498●●●
0.517●●●
(0.064) (0.066) (0.067) (0.067)
Firm merged - 0.370●●● - 0.317●●● - 0.296●●● - 0.294●●●
(0.060) (0.060) (0.060) (0.060)
European firm - 0.230●● - 0.257●●● - 0.238●●● - 0.236●●●
(0.073) (0.073) (0.073) (0.073)
US firm 0.144●●
0.109● 0.104
● 0.099
●
(0.072) (0.073) (0.073) (0.073)
Pharma - 0.155●●● - 0.170●●● - 0.179●●● - 0.183●●●
(0.062) (0.062) (0.062) (0.062)
Claims lagged 5.8E-04●●●
6.0E-04●●●
5.7E-04●●●
5.3E-04●●●
(3.6E-05) (3.5E-05) (3.8E-05) (3.8E-05)
Alliances - 6.9E-03 - 6.8E-03 - 6.9E-03 - 1.1E-02
(9.0E-03) (9.1E-03) (9.2E-03) (9.2E-03)
Acquisitions - 0.080●●● - 0.036●● - 0.044●● - 0.045●●
(0.021) (0.019) (0.020) (0.020)
Exploration alliances - 0.009 - 0.005 - 0.004 - 0.003
(0.019) (0.019) (0.019) (0.019)
All patents - 7.8E-04●●
- 6.9E-04●●
- 4.1E-04 - 4.3E-05
(4.0E-04) (3.7E-04) (3.9E-04) (3.8E-04)
Biotech patents 7.6E-04 - 7.9E-04 - 1.1E-03 - 7.6E-04
(8.3E-04) (8.5E-04) (9.0E-03) (9.0E-04)
Biotech ratio 0.038 0.036 0.030 0.033
(0.047) (0.048) (0.049) (0.049)
Network size 4.6E-05 - 4.5E-04●●●
- 5.0E-04●●●
- 5.8E-04●●●
(1.2E-04) (1.4E-04) (1.4E-04) (1.4E-04)
Stars 0.011 0.008 0.029 0.044●
(0.029) (0.027) (0.030) (0.030)
Integrators 0.078●●● 0.103●●● 0.101●●●
(0.021) (0.021) (0.021)
Connectors 0.144●●● 0.203●●● 0.215●●●
(0.018) (0.022) (0.022)
Isolates 0.112●●● 0.100●●● 0.088●●●
(0.017) (0.018) (0.019)
Integrators x Connectors - 0.028●●● - 0.030●●●
(0.007) (0.007)
Integrators x Isolates 0.002 - 0.006
(0.010) (0.011)
Connectors x Isolates - 0.071●●● - 0.127●●●
(0.017) (0.023)
Triple Interaction 0.027●●●
(0.007)
No. of observations / groups 2414 / 106 2414 / 106 2414 / 106 2414 / 106
Log likelihood -15662.21 -15617.65 -15601.71 -15594.06
Chi square 1177.35 1294.44 1339.04 1371.50
Δ chi square 117.09●●● 161.69●●● 194.15●●●
Notes: ● p < 0.1; ●● p < 0.05; ●●● p < 0.01; standard errors in parentheses

52
Table 5
Results of Random-Effects Negative Binomial Regression Predicting Number of Patents
Variable Model 1 Model 2 Model 3 Model 4
Constant 1.347●●●
1.441●●●
1.517●●●
1.536●●●
(0.077) (0.077) (0.078) (0.078)
Firm merged - 0.072●● - 0.051● - 0.043 - 0.046
(0.040) (0.040) (0.040) (0.040)
European firm - 0.494●●● - 0.500●●● - 0.467●●● - 0.452●●●
(0.093) (0.093) (0.092) (0.092)
US firm 0.068 0.041 0.022 0.020
(0.091) (0.091) (0.091) (0.091)
Pharma - 0.081 - 0.091 - 0.117● - 0.136●●
(0.075) (0.075) (0.074) (0.074)
Patents lagged 2.9E-03●●●
2.8E-03●●●
2.5E-03●●●
2.2E-03●●●
(5.3E-04) (5.2E-04) (5.3E-04) (5.2E-04)
Alliances 6.5E-03 7.4E-03● 7.6E-03
● 5.6E-03
(5.4E-03) (5.3E-03) (5.4E-03) (5.4E-03)
Acquisitions - 0.045●●● - 0.028●●● - 0.032●●● - 0.033●●●
(0.012) (0.012) (0.012) (0.012)
Exploration alliances - 0.018● - 0.016● - 0.016● - 0.015
(0.012) (0.012) (0.012) (0.012)
All patents 1.3E-03●●●
1.3E-03●●●
1.4E-03●●●
1.7E-03●●●
(3.0E-04) (2.9E-04) (3.0E-04) (3.0E-04)
Biotech patents - 1.1E-03●●
- 1.5E-03●●●
- 1.9E-03●●●
- 1.5E-03●●
(6.6E-04) (6.6E-04) (6.8E-04) (6.8E-04)
Biotech ratio 0.140●●● 0.139●●● 0.141●●● 0.142●●●
(0.026) (0.026) (0.025) (0.025)
Network size 3.5E-04●●●
1.3E-04●●
4.2E-05 - 6.2E-06
(9.0E-05) (9.5E-05) (9.5E-05) (9.6E-05)
Stars - 0.026● - 0.043●●● 0.008 0.014
(0.018) (0.018) (0.020) (0.020)
Integrators 0.053●●● 0.084●●● 0.086●●●
(0.015) (0.015) (0.015)
Connectors 0.073●●● 0.131●●● 0.145●●●
(0.014) (0.016) (0.016)
Isolates 0.077●●● 0.078●●● 0.067●●●
(0.011) (0.013) (0.013)
Integrators x Connectors - 0.031●●● - 0.035●●●
(0.005) (0.005)
Integrators x Isolates - 0.013●● - 0.019●●
(0.007) (0.008)
Connectors x Isolates - 0.045●●● - 0.086●●●
(0.011) (0.015)
Triple Interaction 0.020●●●
(0.004)
No. of observations / groups 2414 / 106 2414 / 106 2414 / 106 2414 / 106
Log likelihood -9490.39 -9458.37 -9431.04 -9421.45
Chi square 826.29 901.45 967.37 996.14
Δ chi square 75.16●●● 141.08●●● 169.85●●●
Notes: ● p < 0.1; ●● p < 0.05; ●●● p < 0.01; standard errors in parentheses
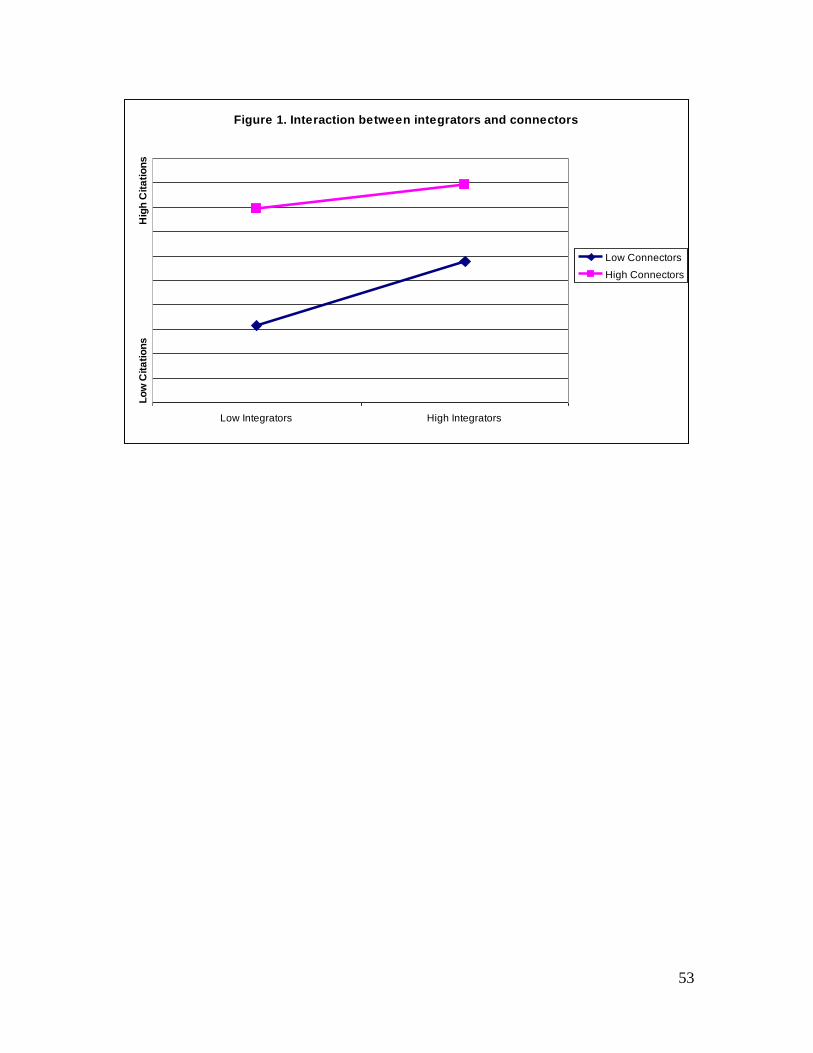
53
Figure 1. Interaction between integrators and connectors
Low Integrators High Integrators
Lo
w C
ita
tio
ns
H
igh
Cit
ati
on
s
Low Connectors
High Connectors

54
Figure 2. Interaction between integrators and isolates
Low Integrators High Integrators
Lo
w C
ita
tio
ns
H
igh
Cit
ati
on
s
Low Isolates
High Isolates

55
Figure 3. Interaction between connectors and isolates
Low Connectors High Connectors
Lo
w C
ita
tio
ns
H
igh
Cit
ati
on
s
Low Isolates
High Isolates

56
Figure 4. Triple interaction among individual roles
Low Integrators High Integrators
Lo
w C
ita
tio
ns
H
igh
Cit
ati
on
s
(1) High Connectors, High Isolates
(2) High Connectors, Low Isolates
(3) Low Connectors, High Isolates
(4) Low Connectors, Low Isolates