structural origins of phdependent chemical shifts in the b1 domain …/file/gb1_ph... · shifts in...
TRANSCRIPT

proteinsSTRUCTURE O FUNCTION O BIOINFORMATICS
Structural origins of pH-dependent chemicalshifts in the B1 domain of protein GJennifer H. Tomlinson, Victoria L. Green, Patrick J. Baker, and Mike P. Williamson*
Department of Molecular Biology and Biotechnology, University of Sheffield, Firth Court, Western Bank, Sheffield,
S10 2TN, United Kingdom
INTRODUCTION
Chemical shifts have long been of interest to structural biologists
because their dependence on the chemical environment of the atom
means they contain a wealth of structural information. However, the
complex nature of the influences on chemical shifts has limited their use
historically for structure determination, leading to a greater dependence
on the NOE and other measurements. Knowledge of chemical shifts has
advanced over recent years, with programs such as SHIFTX1 and total2
allowing fairly accurate calculations of chemical shifts from known struc-
tures. This and further elucidation of the influences on chemical shifts
have led in recent years to a resurgence in interest in chemical shifts,
with several groups investigating the use of chemical shifts directly in
structure determination.3–6 Nevertheless, the detail of the relationship
between structure and shift has not yet been determined well enough for
direct structure determination from chemical shifts.
Although chemical shifts remain too complex for detailed structural
analysis, changes in chemical shifts can provide useful information on
changes in structure upon changes in the environmental conditions of
a protein and can often be meaningfully interpreted.7,8 We have there-
fore focused on changes in chemical shift and their relationship to
structure.
pH-dependent changes in chemical shift can provide a lot of informa-
tion, particularly with regard to hydrogen bonding involving charged side
chains.9–12 Amides that form hydrogen bonds to carboxylate side chains
show large pH-dependent changes in proton shift in response to the proto-
nation of that side chain of up to 1 ppm.9 Such an effect has also been
observed in bull seminal inhibitor IIA10 and Bacillus agaradhaerens xyla-
nase12 as well as Sac7d and Sso7d.11 Betz et al.12 also found evidence of
the titration of one side chain influencing the chemical shifts of another
titrating side chain via an intermediate residue that forms hydrogen bonds
with both side chains. This indicates that the effect of such titrations on
chemical shifts can be propagated through hydrogen bond networks.
Amide proton shifts have been shown to shift upfield upon deprotona-
tion of a carboxylate (i.e., with increased pH) when the amide in ques-
tion is affected by interactions mediated through covalent bonds13:
this is what Bundi and Wuthrich9 called an ‘‘intrinsic titration shift.’’ In
addition, the chemical shift of amide protons that hydrogen bond to
*Correspondence to: Mike P. Williamson, Department of Molecular Biology and Biotechnology, University
of Sheffield, Firth Court, Western Bank, Sheffield, S10 2TN, UK. E-mail: [email protected]
Received 27 April 2010; Revised 28 June 2010; Accepted 6 July 2010
Published online 23 July 2010 in Wiley Online Library (wileyonlinelibrary.com).
DOI: 10.1002/prot.22825
ABSTRACT
We report chemical shifts for HN, N, and C0
nuclei in the His-tagged B1 domain of pro-
tein G (GB1) over a range of pH values
from pH 2.0 to 9.0, which fit well to stand-
ard pH-dependent equations. We also
report a 1.2 A resolution crystal structure
of GB1 at pH 3.0. Comparison of this crys-
tal structure with published crystal struc-
tures at higher pHs provides details of the
structural changes in GB1 associated with
protonation of the carboxylate groups, in
particular a conformational change in the
C-terminus of the protein at low pH. An
additional change described recently is not
seen in the crystal structure because
of crystal contacts. We show that the
pH-dependent changes in chemical shifts
can be almost entirely understood based
on structural changes, thereby providing
insight into the relationship between struc-
ture and chemical shift. In particular, we
describe through-bond effects extending up
to five bonds, affecting N and C0 but not
HN; through-space effects of carboxylates,
which fit well to a simple electric field
model; and effects due to conformational
change, which have a similar magnitude to
many of the direct effects. Finally, we dis-
cuss cooperative effects, demonstrating a
lack of cooperative unfolding in the helix,
and the existence of a b-sheet ‘‘iceberg’’
extending over three of the four strands.
This study therefore extends the application
of chemical shifts to understanding protein
structure.
Proteins 2010; 78:3000–3016.VVC 2010 Wiley-Liss, Inc.
Key words: NMR chemical shift; structural
change; protonation; electric field effect;
conformational change; cooperative hydro-
gen bonding; Staphylococcal protein G.
3000 PROTEINS VVC 2010 WILEY-LISS, INC.

carboxylate side chains has been observed to shift upfield
with reduced pH, whereas those that are affected by
through-space electrostatic interactions shift downfield.11
The magnitude of the pH-dependent chemical shift
change for these amides has been related to the hydrogen
bond strength, stronger hydrogen bonds causing a greater
chemical shift change.14
The pH dependence of amide nitrogen chemical shifts
in the backbone of Bacillus agaradhaerens xylanase, some
of which did not form hydrogen bonds with titrating
side chains, were found to be dependent on nearby
aspartate and glutamate side chains,12 some of which
were rationalized in terms of side chain rearrangements
and alterations in the hydrogen bonding network.12 This
implies that pH-dependent chemical shift changes can
provide information about long-range interactions.
Studies of the changes in carbon chemical shifts in
amino acids with pH have identified a through-bond
effect, which decreases with increased separation from
the protonation site in the titrating side chain.15–18
However, the magnitude of the protonation shift also
depends on the polarizability of the atom, and is there-
fore larger at the carbonyl carbon than expected by this
trend, because carbonyl carbons are more polarizable.
The analysis of chemical shift changes with pH is often
hampered by a lack of detailed structural information at
different pHs that can then be related to the chemical
shift changes observed. In this study, the structure of an
N-terminally His-tagged form of the Staphylococcal pro-
tein G B1 domain (GB1) at pH 3.0 was determined at
1.2 A resolution by X-ray crystallography, allowing a
comparison between this model and previously published
crystal structures19 determined at pH 4.0 and 4.5 (PDB
IDs 1pgb and 1pga, respectively). In a recent publication
(Tomlinson et al., 2010),20 we have also characterized a
pH-dependent structural change at the C-terminus of the
helix, which is not seen in the crystal structure because
of crystal contacts. Together, these details of the low-pH
structure allow chemical shift changes to be related to
changes in structure in response to the titration of car-
boxylate side chains.
We have previously reported pKa values for all the ly-
sine, aspartate, and glutamate residues in GB121 (except
E50, the pKa of which was previously determined by
Khare et al.22) and these are reproduced in Table I.
These pKas are used here to identify the titrating groups
that are the origins of the pH-dependent chemical shift
changes reported here.
Here, we analyze the pH-dependent chemical shift
changes in GB1, and relate them to specific titrating
groups. We show how chemical shifts are affected by
through-bond effects, by direct through-space electro-
static effects, and by conformational change, all of which
are significant. We also show that chemical shifts can be
used to characterize cooperative changes in structure,
and therefore provide information on dynamic behavior.
MATERIALS AND METHODS
Protein expression and purification andsample preparation
The protein G B1 domain (GB1) was expressed as a
His-tagged construct with the sequence MH6AMD pre-
ceding the normal N-terminal sequence from a gene
inserted into a pET-15b vector. Residues are numbered
from 1 at the first histidine, making the C-terminus (res-
idue 324 of the mature protein) residue 64. This is the
same numbering scheme as in our previous work,20,21
and is 8 larger than the most common numbering
scheme. The protein was expressed in Escherichia coli
BL21 (DE3) pLysS cells grown at 37 8C either in M9
minimal medium containing 1.5 g/L 13C-glucose, 1 g/L15N-amonium sulfate as described previously,21,23 or in
LB medium. Expression was induced with 1 mM IPTG
overnight at 25 8C after an OD280 nm of 0.6 was reached.
The protein was purified using a nickel affinity column
(HIS-select nickel affinity gel, Sigma-Aldrich) followed by
gel filtration in 50 mM potassium phosphate buffer plus
150 mM NaCl and 1 mM sodium azide, pH 6.0. Buffer
exchange and protein concentration was carried out in
vivaspin centrifugal concentrators (Sartorius).
GB1 samples for NMR experiments (1 mM and
310 lM) were produced in a buffer containing 33 mM so-
Table IThe pKas of the Carboxylate and Lysine Residues in GB1 Reported
Previously in 100 mM Salt, 90% H2O, 10% D2O, 298 K21,22
Residue pKa determined in previous study21
D9 3.24 � 0.01E23 4.37 � 0.01E27 4.16 � 0.01D30 2.78 � 0.01E35 4.56 � 0.04a
D44 3.75 � 0.01D48 4.03 � 0.01E50 4.4 � 0.1b
D54 3.93 � 0.01D55 3.24 � 0.01E64/C-terminusc 3.23 � 0.03 and 4.51 � 0.04c
K12 10.7 � 0.04K18 11.1 � 0.1K21 11.4 � 0.1K36 10.8 � 0.1K39 11.1 � 0.1K58 11.4 � 0.1
The uncertainties reported here are the uncertainties in the fitting of the experi-
mental data to a single pKa value. The error in the pKa value is larger because of
errors in pH meter calibration etc, but probably by no more than 0.03.aWith a Hill coefficient of 0.84. For all other residues the Hill coefficient was 1.0.bNot determined by Tomlinson et al.21 as the peak became broad and overlapped at low
pH and could not be identified accurately but determined previously by Khare et al.22
cThe data do not unambiguously permit a distinction between these two since E64
is the C-terminal residue. However, magnitudes of shifts at different nuclei suggest
that the side chain has the pKa of 3.23.
The lysine pKas are only determined approximately as the unfolding of the pro-
tein at high pH prevented the observation of complete titrations. GB1 does not
contain any histidines except that the construct used in this study retained an
N-terminal histidine tag, MH6AMD. The N-terminus is expected to have a pKa
of �8, based on literature values.
pH-Dependent Shifts in Protein GB1
PROTEINS 3001

dium phosphate, 33 mM deuterated sodium acetate, 33
mM orthoboric acid (which was substituted with 33 mM
sodium citrate for samples below pH 4.0), 1 mM sodium
azide, and 10% deuterium oxide. Sample pH was altered
by buffer exchange with freshly prepared buffer at the
desired pH to prevent an increase in salt concentration
during the titration. GB1 samples (1 mM 13C, 15N) were
used for all spectra except the CBCA(CO)NH for which a
310 lM 13C, 15N protein sample was used.
For crystallization trials, a protein stock solution of 20
mg/mL unlabelled GB1 in 50 mM tris-HCl, pH 6.0 was
prepared.
NMR experiments and data processing
All spectra except the HSQC-NOESY and HSQC-
TOCSY spectra were acquired using a Bruker DRX 600
MHz spectrometer fitted with a cryoprobe and were
recorded at 298 K. The HSQC-NOESY and HSQC-TOCSY
spectra were acquired using a Bruker DRX 600 MHz spec-
trometer at 298 K without a cryoprobe. Spectra were proc-
essed using Felix (Felix NMR Inc.) and data were analyzed
using home written scripts running under Linux.
Amide proton and nitrogen chemical shifts were meas-
ured using HSQC spectra recorded every 0.25 pH units
from pH 2.0 to 6.0 and every 0.5 pH units from pH 6.0
to 9.0. Carbonyl carbon chemical shifts were measured
using 2D HNCO spectra in which the nitrogen frequency
labeling was omitted. These spectra were acquired at the
same pHs as the HSQC spectra above.
HSQC spectra at pH 5.0 were assigned by comparison
with previously published assignments23 and subsequent
spectra were assigned by tracking the movement of peaks
between spectra. HSQC spectra at pH 3.0, however, could
not be assigned unambiguously using this method so
HSQC-NOESY and HSQC-TOCSY spectra were acquired
and used to assign resonances at pH 3.0 by comparison
with the previously published side chain assignments.23
The HSQC-TOCSY spectrum was acquired using a 300
lM 15N-labeled GB1 sample with a mixing time of 35
ms, whereas the HSQC-NOESY spectrum was acquired
using the same sample with a mixing time of 150 ms.
Finally, these pH 3.0 assignments were confirmed using a
CBCA(CO)NH spectrum recorded on a 500 MHz Bruker
DRX spectrometer with a 1 mM 13C and 15N labeled
GB1 sample at pH 3.0 with reference to previously pub-
lished assignments.23
HNCO spectra were assigned at pH 5.0 by reference to
the previously published assignments23 and spectra at
subsequent pHs were assigned by tracking the move-
ments of these peaks. Because of large shift changes at
low pH, some assignments in crowded regions required
comparison with reassigned signals at pH 3.0.
pH dependent chemical shift fitting
Chemical shift changes with pH were fitted to the fol-
lowing equations describing dependence on one,22 two,
or three24 pKas, or one pKa and a Hill coefficient differ-
ent from unity25 [Eqs. (1–4), respectively].
d ¼ dacid þ dbase10ðpH�pKaÞ
1þ 10ðpH�pKaÞ ð1Þ
d ¼ da10�2pH þ db10�ðpH�pKa1Þ þ dc10�ðpKa1�pKa2Þ
10�2pH þ 10�ðpH�pKa1Þ þ 10�ðpKa1�pKa2Þ ð2Þ
d ¼ da10�3pH þ db10�ðpKa3þ2pHÞ þ dc10�ðpKa2þpKa3þpHÞ þ dd10�ðpKa1þpKa2þpKa3Þ
10�3pH þ 10�ðpKa3þ2pHÞ þ 10�ðpKa2þpKa3þpHÞ þ 10�ðpKa1þpKa2þpKa3Þ ð3Þ
d ¼ dacid þ dbase10nðpH�pKaÞ
1þ 10nðpH�pKaÞ ð4Þ
Fitting was carried out using a Levenberg-Marquardt
least squares routine. F tests were carried out to deter-
mine which equation gave the best fit to the data, the
simplest equation that gave a good fit to the data being
chosen. Models with larger numbers of variables were
only used if the improvement in fit was statistically sig-
nificant.
The pKas influencing these chemical shift changes
(described below as pKapp) were then compared with the
pKas of the aspartate and glutamate residues in GB1,
determined previously.21,22 To aid analysis, total chemi-
cal shift changes of 0.1 (proton), 0.5 (nitrogen), and 0.2
ppm (carbonyl carbon) were applied as cut-offs below
which any change in chemical shift with pH was consid-
ered insignificant for the purpose of this study.
Crystallization and crystal structuredetermination
Crystals were grown by suspending 1 lL drops of 20
mg/mL GB1 in 50 mM tris-HCl and 1 lL mother liquor
over 1 mL wells of 50 mM sodium citrate buffer, 3.8M
sodium formate, and 8% v/v isopropanol, pH 5.5. Crys-
tals were obtained after 2 weeks with the approximate
dimensions 100 lm by 150 lm. A single crystal was sub-
sequently soaked in a solution of 50 mM sodium citrate
buffer, 3.8M sodium formate, and 8 % v/v isopropanol,
pH 3.0 for 90 minutes to adjust the pH of the crystal to
pH 3.0. When compared with ligand binding studies,
J.H. Tomlinson et al.
3002 PROTEINS

such a length of time should be more than sufficient to
allow for buffer diffusion into the crystal.26,27 We can
be confident that the crystal was at pH 3.0 during the
diffraction experiment.
X-ray diffraction data were collected at the Diamond syn-
chrotron to 1.2 A resolution. Data were indexed using
MOSFLM28 to the space group P32 with the unit cell dimen-
sions shown in Table II with two molecules in the asymmet-
ric unit and subsequently processed using the CCP4 suite of
programs.29 The data were scaled and merged using
SCALA30 and the structure was solved using molecular
replacement with the program AMoRe31 and using the pub-
lished pH 4.5 crystal structure19 (PDB ID 1pga) as the initial
search model. Refinement was performed using Refmac532
and model building using Coot,33 to produce a final model
with an R factor of 0.15 and Rfree of 0.18 (Table III).
RESULTS
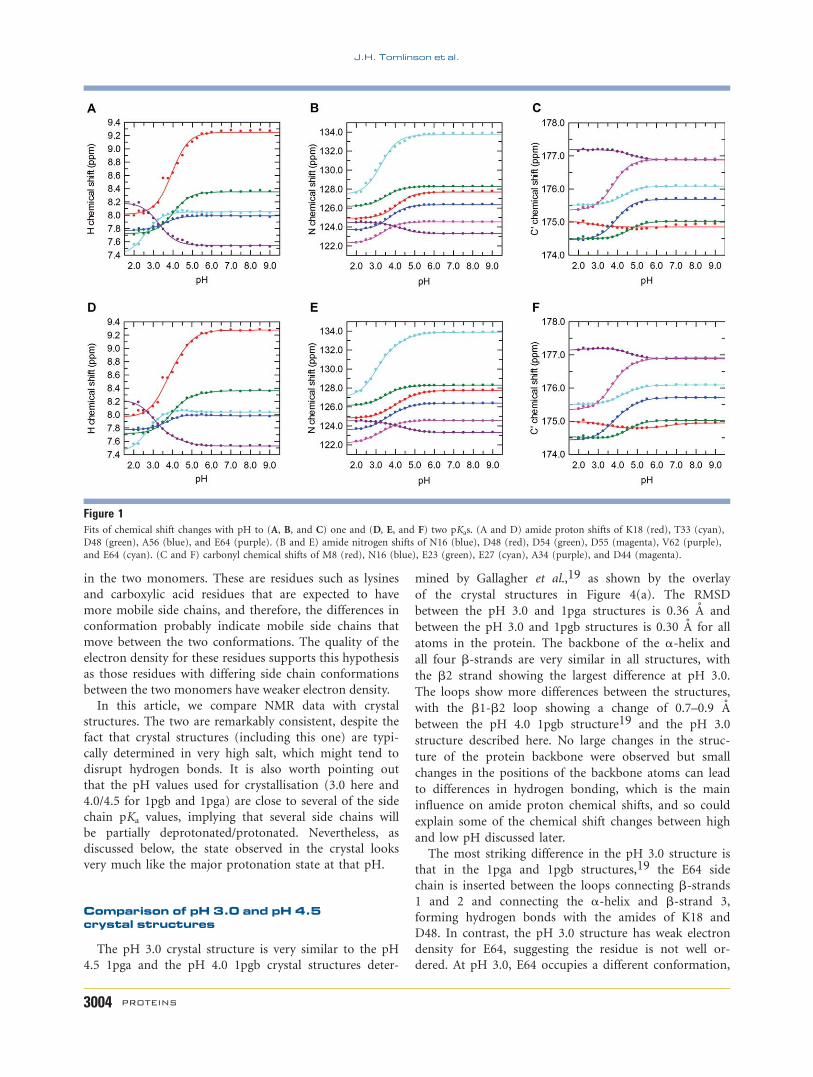
pH-dependent chemical shift changes
Changes in backbone amide proton, nitrogen, and car-
bonyl carbon chemical shifts over the pH range 2.0–9.0
were fitted to equations describing the influence of 1, 2,
or 3 pKas or 1 pKa plus a Hill coefficient different from
1.0 (Fig. 1), to yield values of apparent pK, described
here as pKapp, for each nucleus with a significant pH-de-
pendent shift. Table IV shows the significant pH-depend-
ent changes in amide proton and nitrogen and carbonyl
carbon chemical shifts of each residue in His-tagged
GB1. Throughout this article, amide nitrogen and pro-
ton, and carbonyl carbon, always refer to backbone
atoms unless specifically indicated otherwise. Titration
shifts have been added to the TitrationDB database
(http://enzyme.ucd.ie/Titration_DB).
Crystal structure at pH 3.0
Overall, the electron density map shows strong, clear
density for most residues, as shown in Figure 2, allowing
the determination of a clear structure model to a resolu-
tion of 1.2 A, which has been deposited with the Protein
Data Bank, www.rcsb.org, with code 3MP9. As in the
previously published structures of GB1,19,34–39 the
monomer consists of a four stranded b-sheet composed
of two central parallel strands and two outer antiparallel
strands packed against an a-helix. The histidine tag,
which was not removed from the protein before crystalli-
zation, is partially visible in the crystal structure, extend-
ing from the N-terminus of the protein in a similar ori-
entation to b-strand 1, as shown in Figure 3.
Some regions, such as the b1-b2 loop, have weaker elec-
tron density than the remainder of the molecule, indicating
more disordered regions of the protein. These disordered
areas are found in places in the structure where more flexi-
bility is expected, such as the N-terminus of the histidine
tag, the flexible loops between b-strands 1 and 2 and
between the a-helix and the b-strand 3, and the tips of long
and flexible side chains, such as those of lysine and carbox-
ylic acid side chains, and probably indicate real areas of dis-
order rather than deficiency in the data. Indeed, previous15N relaxation data have shown these two loops to be the
most flexible regions of the molecule.40 However, although
weaker, the electron density is sufficient to allow the loops
to be modeled accurately into the electron density.
The pH 3.0 structure contains two monomers in the
asymmetric unit, packed together through contacts involv-
ing the final turn of the a-helix in each chain, as shown in
Figure 3. This packing involves an interaction between the
D44 side chains in each monomer (see inset in Fig. 3),
which would not normally be expected to occur because of
repulsion between the two negative charges. However, the
pKa of D44 is 3.75,21,22 showing that at pH 3.0, the D44
side chain is expected to be protonated so this repulsion
would not occur, allowing the formation of a hydrogen
bond. This observation therefore further supports our con-
tention that the crystallization pH was genuinely 3.
There are very few differences between the structures of
the two chains in the asymmetric unit. No significant dif-
ferences are observed in backbone conformation and only
a small number of side chains have different orientations
Table IIData Collection Statistics for the 1.2 A pH 3.0 Crystal Structure
Data collection statistics
Resolution (�) 30.15–1.20 (1.26–1.20 �)a
Unit cell dimensions:a 34.8 �b 34.8 �c 71.8 �a 908b 908g 1208
Number of observations 108199 (8705)Number of unique reflections 29246 (3333)Redundancy 3.7 (2.6)I/r 18.5 (2.8)Rmerge 0.04 (0.32)Completeness (%) 96.0 (75.0)
aNumbers in parentheses indicate values in the highest resolution shell.
Table IIIRefinement Statistics for the 1.2 A Crystal Structure Determined
at pH 3.0
Refinement statisticsResolution (�) 30.15–1.20Unique Reflections 27757Rcryst 0.15Rfree 0.18RMS bond length (�) 0.010RMS bond angle (degrees) 1.2Number of protein atoms 985Number of water molecules 192Average temperature factor:Protein atoms 20.6Water molecules 15.0
pH-Dependent Shifts in Protein GB1
PROTEINS 3003
in the two monomers. These are residues such as lysines
and carboxylic acid residues that are expected to have
more mobile side chains, and therefore, the differences in
conformation probably indicate mobile side chains that
move between the two conformations. The quality of the
electron density for these residues supports this hypothesis
as those residues with differing side chain conformations
between the two monomers have weaker electron density.
In this article, we compare NMR data with crystal
structures. The two are remarkably consistent, despite the
fact that crystal structures (including this one) are typi-
cally determined in very high salt, which might tend to
disrupt hydrogen bonds. It is also worth pointing out
that the pH values used for crystallisation (3.0 here and
4.0/4.5 for 1pgb and 1pga) are close to several of the side
chain pKa values, implying that several side chains will
be partially deprotonated/protonated. Nevertheless, as
discussed below, the state observed in the crystal looks
very much like the major protonation state at that pH.
Comparison of pH 3.0 and pH 4.5crystal structures
The pH 3.0 crystal structure is very similar to the pH
4.5 1pga and the pH 4.0 1pgb crystal structures deter-
mined by Gallagher et al.,19 as shown by the overlay
of the crystal structures in Figure 4(a). The RMSD
between the pH 3.0 and 1pga structures is 0.36 A and
between the pH 3.0 and 1pgb structures is 0.30 A for all
atoms in the protein. The backbone of the a-helix and
all four b-strands are very similar in all structures, with
the b2 strand showing the largest difference at pH 3.0.
The loops show more differences between the structures,
with the b1-b2 loop showing a change of 0.7–0.9 A
between the pH 4.0 1pgb structure19 and the pH 3.0
structure described here. No large changes in the struc-
ture of the protein backbone were observed but small
changes in the positions of the backbone atoms can lead
to differences in hydrogen bonding, which is the main
influence on amide proton chemical shifts, and so could
explain some of the chemical shift changes between high
and low pH discussed later.
The most striking difference in the pH 3.0 structure is
that in the 1pga and 1pgb structures,19 the E64 side
chain is inserted between the loops connecting b-strands1 and 2 and connecting the a-helix and b-strand 3,
forming hydrogen bonds with the amides of K18 and
D48. In contrast, the pH 3.0 structure has weak electron
density for E64, suggesting the residue is not well or-
dered. At pH 3.0, E64 occupies a different conformation,
Figure 1Fits of chemical shift changes with pH to (A, B, and C) one and (D, E, and F) two pKas. (A and D) amide proton shifts of K18 (red), T33 (cyan),
D48 (green), A56 (blue), and E64 (purple). (B and E) amide nitrogen shifts of N16 (blue), D48 (red), D54 (green), D55 (magenta), V62 (purple),
and E64 (cyan). (C and F) carbonyl chemical shifts of M8 (red), N16 (blue), E23 (green), E27 (cyan), A34 (purple), and D44 (magenta).
J.H. Tomlinson et al.
3004 PROTEINS

TableIV
ThepH-D
ependentChangesin
AmideProtonandNitrogenandCarbonyl
CarbonChem
ical
Shiftsin
His-TaggedGB1within
thepH
Range
2.0–9.0
Residue
HnSh
iftCh
ange
pKapp
HnSh
iftCh
ange
HillCo
efficient
HnSh
iftCh
ange
Mag
nitude
a(ppm
)NhSh
iftCh
ange
pKapp
NhSh
iftCh
ange
HillCo
efficient
NhSh
iftCh
ange
Mag
nitude
(ppm
)C0
Shift
Change
pKapp
C0Sh
iftCh
ange
Hill
Coefficient
C0Sh
iftCh
ange
Mag
nitude
(ppm
)
A7
6.58
�0.42
b0.43
�0.12
20.29
4.17
�0.05
b0.48
�0.03
21.78
7.00
�0.22
c1
20.21
M8
3.63
�0.16
d1
20.19
6.43
�0.04,3.86�
0.13,
and2.73
�0.25
e1
20.57,1
0.85,a
nd11.02
3.37
�0.14
d1
20.20
D9
––
––
––
3.18
�0.04
d1
10.91
T10
3.17
�0.18
d1
10.18
––
–3.85
�0.10
b0.62
�0.07
10.48
Y11
3.86
�0.17
f1
10.13
3.46
�0.08
b0.67
�0.05
10.77
4.10
�0.06
b1.42
�0.24
20.29
K12
––
–4.19
�0.10
f1
11.13
4.24
�0.05
f1
20.42
L13
––
–4.37
�0.01
f1
11.51
––
–L15
4.04
�0.15
f1
10.15
––
–3.50
�0.15
g0.73
�0.14
20.31
N16
3.70
�0.12
f1
10.19
3.63
�0.01
b0.77
�0.01
12.90
3.86
�0.03
b0.76
�0.03
11.31
G17
––
–4.35
�0.05
f1
10.50
3.77
�0.08
b0.68
�0.07
10.55
K18
3.48
�0.09
and4.69
�0.13
h1
10.82
and10.50
3.67
�0.04
and4.83
�0.07
i1
11.85
and11.06
3.70
�0.04
b0.72
�0.04
11.02
T19
3.52
�0.29
and4.56
�0.55
h1
10.37
and10.18
––
––
––
L20
––
–3.73
�0.08
and4.82
�0.16
j–
11.16
and10.53
3.35
�0.06
b0.67
�0.04
21.02
K21
3.75
�0.31
b0.61
�0.20
20.18
3.85
�0.07
b0.72
�0.07
20.54
3.96
�0.11
f1
10.21
G22
––
––
––
3.46
�0.18
b0.56
�0.08
20.45
E23
––
–4.51
�0.03
f1
20.70
4.57
�0.04
f1
10.58
T24
––
–4.40
�0.02
f1
21.31
––
–T26
––
––
––
4.08
�0.22
b0.51
�0.11
10.30
E27
––
–4.15
�0.02
b0.85
�0.03
11.51
4.26
�0.04
f1
10.56
V29
––
––
––
2.66
�0.21
g0.72
�0.11
20.67
D30
––
–2.79
�0.02
f1
12.89
2.38
�0.05
f1
11.11
A31
2.53
�0.29
f1
20.15
2.56
�0.04
f1
21.05
2.74
�0.14
f1
20.26
A32
2.98
�0.36
d1
10.14
4.29
�0.03
b0.70
�0.03
11.29
2.66
�1.16
b0.43
�0.19
20.27
T33
2.72
�0.09
d1
10.65
2.64
�0.03
b0.81
�0.02
13.13
2.93
�0.24
d1
10.21
A34
2.55
�0.62
and4.86
�0.25
h1
10.10
and20.12
––
–4.68
�0.07
f1
20.30
E35
––
–4.37
�0.03
b0.74
�0.03
10.99
4.28
�0.15
b0.53
�0.08
10.35
K36
––
–4.60
�0.03
f1
20.79
3.86
�0.20
b0.48
�0.08
10.41
Q40
––
––
––
3.55
�0.03
f1
20.67
Y41
––
––
––
4.29
�0.13
b0.62
�0.11
10.30
A42
––
––
––
3.87
�0.05
f1
20.43
N43
3.24
�0.40
f1
20.14
––
–3.99
�0.16
f1
10.14
k
D44
3.77
�0.07
f1
10.35
3.65
�0.01
f1
12.45
3.71
�0.02
l1
11.48
V47
––
–4.19
�0.04
f1
10.51
4.06
�0.09
f1
10.26
D48
4.00
�0.04
m0.87
�0.06
10.65
4.03
�0.01
b0.74
�0.01
13.01
3.92
�0.05
n1
10.67
G49
2.76
�0.54
and4.66
�0.15
h1
20.11
and20.24
––
–2.93
�0.10
d1
10.38
E50
2.70
�0.29
d1
20.18
2.50
�0.29
b0.53
�0.07
20.63
4.16
�0.05
m0.72
�0.05
10.66
W51
––
–4.35
�0.09
m0.82
�0.04
11.06
––
–T52
––
–4.65
�0.04
f1
20.53
––
–Y53
3.68
�0.46
m0.57
�0.25
20.11
––
––
––
(Continued)
pH-Dependent Shifts in Protein GB1
PROTEINS 3005

TableIV
(Coninued)
Residue
HnSh
iftCh
ange
pKapp
HnSh
iftCh
ange
HillCo
efficient
HnSh
iftCh
ange
Mag
nitude
a(ppm
)NhSh
iftCh
ange
pKapp
NhSh
iftCh
ange
HillCo
efficient
NhSh
iftCh
ange
Mag
nitude
(ppm
)C0
Shift
Change
pKapp
C0Sh
iftCh
ange
Hill
Coefficient
C0Sh
iftCh
ange
Mag
nitude
(ppm
)
D54
––
–3.47
�0.02
b0.89
�0.02
12.18
3.80
�0.06
f1
10.41
D55
3.07
�0.28
d1
20.12
3.29
�0.02
b0.87
�0.02
12.37
3.15
�0.04
b0.85
�0.04
11.44
A56
3.68
�0.15
d1
10.23
3.20
�0.02
f1
–1.57
3.28
�0.09
d1
10.33
T57
3.62
�0.14
f1
10.17
3.21
�0.06
b0.77
�0.05
10.98
3.43
�0.15
b0.66
�0.10
–0.42
T59
3.04
�0.22
d1
10.15
––
––
––
F60
4.57
�0.23
f1
10.10
––
––
––
T61
––
––
––
3.91
�0.18
c0.59
�0.11
20.29
V62
4.19
�0.14
f1
20.15
3.57
�0.19
and4.64
�0.12
j1
20.51
and20.72
3.37
�0.11
c0.71
�0.08
20.52
T63
––
–3.17
�0.09
b0.66
�0.06
10.85
2.73
�0.05
f1
20.67
E64
3.03
�0.12
and4.55
�0.39
h1
20.56
and20.13
2.99
�0.01
and4.55
�0.04
h1
15.53
and11.32
––
–
AfixedHillcoefficientvalueof1was
usedin
each
fitunless
thefitwas
significantlybetterwithavaluedifferentfrom
1.
aFrom
low
tohighpH.
bThe1pKaplusHillcoefficientmodelwas
chosen.Thiswas
significantto
P<
0.01.
c The3pKasmodelwas
chosen.Thiswas
significantto
P<
0.01.Theadditional
pKasarenotshownas
they
arebelow
theminim
um
shiftchange
cut-off.
dThe2pKasmodelwas
chosen.Thiswas
significantto
P<
0.01.ThesecondpKaisnotshownas
itisbelow
theminim
um
shiftchange
cut-off.
e The3pKasmodelwas
chosen.Thiswas
significantto
P<
0.05.
f The1pKamodelwas
chosen.Noother
modelwas
significantto
P<
0.05.
gThe1pKaplusHillcoefficientmodelwas
chosen.Thiswas
significantto
P<
0.05.
hThe2pKasmodelwas
chosen.Thiswas
significantto
P<
0.01.
i The2pKasmodelwas
chosen.Thiswas
significantto
P<
0.05.
j The2pKasmodelwas
chosen.Thiswas
significantto
P<
0.025.
kThetotalchem
ical
shiftchange
isbelow
thecut-offvalueforconsiderationin
thisstudybutthechem
ical
shiftdoes
show
asm
allpH-dependentchange
affected
bythetitrationoftheD44sidechain.
l The2pKasmodelwas
chosen.Thiswas
significantto
P<
0.05.ThesecondpKaisnotshownas
itisbelow
theminim
um
shiftchange
cut-off.
mThe1pKaplusHillcoefficientmodelwas
chosen.Thiswas
significantto
P<
0.025.
nThe2pKasmodelwas
chosen.Thiswas
significantto
P<
0.025.ThesecondpKaisnotshownas
itisbelow
theminim
um
shiftchange
cut-off.
J.H. Tomlinson et al.
3006 PROTEINS

as shown in Figure 4(b). This conformation consists of
the C-terminus occupying a similar position to that of
the side chain in the high pH structures, whereas the
side chain at pH 3.0 extends out into solution in the ori-
entation in which the C-terminus is found at pH 4.0 and
above, although the electron density around the side
chain COOH group is weak at pH 3.0, suggesting disor-
der. In this conformation, the side chain is not able to
form hydrogen bonds with K18 and D48, as it does at
higher pH.
The loop between b-strands 1 and 2 (residues 17–19)
also differs slightly in the pH 3.0 structure from the pub-
lished structures, moving 0.7–0.9 A closer to the centre
of the protein compared with the 1pga structure, as
shown in Figure 4(c), probably because of the movement
of the E64 side chain out of this space. Other than this
difference in loop position, no large changes in confor-
mation are seen for K18, as expected from NMR data
discussed later, which indicate the presence of different
HSQC peaks at high and low pHs, suggesting a pH-de-
pendent conformational change. However, the change in
conformation observed for the E64 side chain results in
the loss of a hydrogen bonding interaction involving the
amide of K18, which could explain the major change
observed in the K18 amide HSQC peak, particularly as
K18 itself undergoes only a small conformational change
between pH 3.0 and 4.0.
The NMR chemical shift data discussed later also show
different peaks for D44 at high and low pHs, which sug-
gests a conformational change for this residue. As dis-
cussed in a previous article,20 this conformational
change is also identified using relaxation dispersion data
and is due to the loss of the final two residues of the a-helix upon protonation of the D44 side chain and the
loss of the D44–Q40 side chain-side chain hydrogen
bond, resulting in a shortening of the helix by two resi-
dues and some structural rearrangement of residues 43–
47. This results in weak dimerisation at low pH. This
structural change is not observed in the pH 3.0 crystal
structure by comparison with the 1pga and 1pgb struc-
tures,19 as shown in Figure 4(d). However, the two GB1
monomers in the asymmetric unit pack together via the
last turn of the a-helix in both chains (residues Q40–
N45). The D44 side chains of the two monomers
approach close to each other in this packing, with 2.3 A
separating the carboxylate oxygens, which form a likely
hydrogen bond (see inset of Fig. 3). As the crystals were
formed at pH 5.5 and then soaked in a pH 3.0 buffer to
effect a change in conformation to the pH 3.0 structure,
D44 may have been prevented from undergoing a change
in conformation, such as the solution data suggest,
by these crystal packing contacts which could fix the
residues in the conformation occupied at pH 5.5. The
orientation of D44 may not, therefore, reflect that at
pH 3.0 in solution, hence explaining the lack of a con-
formational change in this region in the pH 3.0 crystal
structure.
Structural analysis of chemical shift changes
Our previous study21 identified pKa values for almost
all of the titrating groups in GB1. In this study, we have
identified a large number of pH-dependent chemical shift
changes, and have been able to characterize them in
Figure 2An example of the quality of the electron density for b-strands 3 and 4of the 1.2 A resolution pH 3.0 structure. Electron density from the
2|Fo-Fc| map is contoured at 1.0 sigma. This figure was produced
using PyMOL.41
Figure 3The packing of the two monomers of protein G within the asymmetric
unit. The inset figure shows an expanded view of the final turns of the
helices with the interaction between D44 side chains marked. This
figure was produced using PyMOL.41
pH-Dependent Shifts in Protein GB1
PROTEINS 3007

terms of pKapp values plus the associated high and low
pH shifts. Comparison of the pKapp values measured here
with the previously identified side chain pKas allows a
confident assignment of pH-dependent shift changes to
specific side chain protonation events in most cases, sup-
ported by comparison of the pH 3.0 structure with the
published pH 4.0 and 4.5 crystal structures.19 In this sec-
tion, we analyze the structural correlations that can be
made.
Through-bond effects on chemical shifts
Titration of aspartate and glutamate side chains has a
significant effect on the amide nitrogen and carbonyl car-
bon chemical shifts of the same residue, demonstrated by
the observation that the shift changes have the same
pKapp value as the side chain. The shift changes are 0.7–
3.0 ppm in nitrogen shifts (excluding E64 which under-
goes a conformational change and therefore has a larger
shift change) and 0.3–1.5 ppm in carbon shifts, all of
which are downfield shifts with increased pH, as previ-
ously observed for carbon shifts by Lindman et al.42 and
for nitrogen shifts by Betz et al.,12 except for the nitro-
gen shift of E23 which moves upfield with increased pH.
Large changes in the carbonyl carbon shifts of all aspar-
tate and glutamate residues and the nitrogen chemical
shifts of E23, E27, D30, E35, D44, D48, and E64 that fit
to the pKas of those residues’ side chains21,22 were
observed, as shown in Figure 5, although D9, E50, and
D54 do not show this effect on amide nitrogen shift.
Similar changes are also observed in the carbonyl carbon
shifts of residues preceding carboxylates and amide nitro-
gen shifts of residues following carboxylates in response
to the titrating side chain, as shown by the carbonyl car-
bon shifts of M8, T26, V29, A34, and V47 (Fig. 6). N43
also shows a small change in carbonyl carbon shift that
reflects the titration of D44 but this is below the cut-off
imposed by this study. This change in chemical shift of
the following or preceding residue is likely to be due to
the nature of the amide bond, the change in chemical
Figure 4Overlays of the pH 3.0 structure with those determined by Gallagher et al.19 Chain A of the pH 3.0 structure is shown in green, chain B of the pH
3.0 structure is shown in cyan, the 1pga structure is shown in yellow and the 1pgb structure is shown in pink.19 The RMSD between the pH 3 and1pga structures is 0.36 A and the RMSD between the pH 3 and 1pgb structures is 0.30 A. Chains were overlaid by minimization of the RMSD
between aligned residues throughout the protein chain. Nitrogen atoms are shown in blue and oxygen atoms in red. This figure was produced
using PyMOL.41 (A) An overlay of the backbone of GB1 (side chains are omitted for clarity). (B) An enlargement of the C-terminal region
showing the conformational change involving E64 and the loss of hydrogen bonds between the amides of K18 and D48 and the E64 side chain at
pH 3.0. The residues with chemical shifts affected by the conformational change are shown as sticks while the main chain of the protein extending
from this region is shown as lines. Hydrogen bonds to the E64 side chain at pH 4.0 and above are shown as dashed lines. (C) An enlargement of
the b1-b2 loop viewed from within the protein, showing the movement of the loop at pH 3.0. (D) An enlargement of the C-terminal region
of the a-helix, showing very little change in the structure between pH 4.5 and pH 3.0.
J.H. Tomlinson et al.
3008 PROTEINS

shift of one atom in that bond having a large influence
on the other. Indeed, the chemical shifts of amide nitro-
gens and the preceding carbonyl carbon often share the
same influence (Fig. 7), reflecting this relationship.
Where the residue preceding a carboxylate is itself a car-
boxylate residue, however, this transmission is not
observed in the carbonyl carbon shift, the effect of the ti-
tration of the side chain within the same residue being
greater.
Through-space effects
The greatest pH-dependent effect on the amide proton
chemical shift is through direct hydrogen bonding to car-
boxylate side chains. Four residues in GB1 form hydrogen
bonds to carboxylates in the high pH crystal structure
(K18, T33, D48, and A56 hydrogen bond to the side chains
of E64, D30, E64, and D54 respectively, as shown in
Fig. 8). The amide proton shifts of these residues show
large upfield shifts in the range of 0.23–1.32 ppm with
reduced pH. The magnitude of the change is related to the
hydrogen bonding distance, with shorter hydrogen bonds
causing a greater shift change as shown in Figure 9,
although it is unclear how general this result is because the
data are limited.
Bundi and Wuthrich9 found that amide proton chemi-
cal shifts for residues that form hydrogen bonds to car-
boxylate side chains show marked changes with pH in
Figure 5A comparison between the pKapps affecting amide nitrogen chemical
shifts and the pKas of the side chains of the same or the preceding
residues. Filled circles are the nitrogen shifts of carboxylate residues
while open circles are the nitrogen shifts of residues following
carboxylates. Circles on the x axis are titrating amino acids where the
amide nitrogen of the amino acid following does not have a significant
pH dependence. The ringed point shows that the nitrogen shift of E50
is affected by a low pH titration that does not match the pKa of the
side chain but is due to a chemical shift change in the C-terminal
region of the b-sheet, discussed later in the context of cooperative
effects. All residues had only one pKa except for E64, where both pKas
were used, taking the pairs with closer values. Error bars are in most
cases smaller than the circles.
Figure 6A comparison between the pKapps affecting carbonyl carbon chemical
shifts and the pKas of the side chains of the same or following residues.The filled circles represent the carbonyl carbon shifts of carboxylate
residues while the open circles represent the carbonyl carbon shifts of
residues preceding carboxylates. The circle on the x axis is D54, for which
Y53 C0 does not have a significant pH-dependent shift. The circled point
is due to a chemical shift change in G49 at the C-terminal region of the b-sheet, discussed later in the context of cooperative effects. All residues had
only one pKapp/pKa except for E64, where the larger shift change was
used. Error bars are in most cases smaller than the circles.
Figure 7A comparison of the pKapp affecting the carbonyl carbon chemical shift of
residue i with that affecting the amide nitrogen chemical shift of residue i
1 1 for all cases in which a significant change in chemical shift is observed
for both atoms. In cases where the chemical shift changes fit to multiple
pKapps, the larger magnitude shift was used unless both C0 and N had two
pKapps in which case both were used and the closer values were compared.
pH-Dependent Shifts in Protein GB1
PROTEINS 3009

response to the titration of the carboxylate as the hydro-
gen bond becomes weaker, and therefore the bond length
becomes greater, upon protonation of the carboxylate.
This is due to the protonation making the carboxylate
oxygen less electronegative. The large change in amide
proton shift in response to the titration of hydrogen
bonded carboxylate side chains has also been previously
noted by Khare et al.22
The nitrogen shifts of these amides also show large
changes in response to the titration of the hydrogen
bonded carboxylate, as would be expected, but a similar
dependence on the hydrogen bond length is not observed
in the magnitude of these changes. In contrast to amide
proton shifts nitrogen shifts show a greater dependence
on through-bond effects than through-space effects, the
chemical shift change of the amide nitrogen of D48
reflecting the titration of the D48 side chain rather than
the hydrogen bonding to the E64 side chain. Likewise,
the amide nitrogen shift of A56 is principally affected by
the through-bond effect from D55 rather than the hydro-
gen bonding interaction with D54. However, the angle
between the carboxylate oxygen and the N��C peptide
bond for the D48–E64 hydrogen bond is 1168 and that
between the carboxylate oxygen of D54 and the C��N
peptide bond for the D54–A56 hydrogen bond is 1298 in
the 1pga crystal structure. These angles are not particu-
larly favorable for a large electrostatic effect from the side
chain on the nitrogen shifts, possibly explaining the
dominance of the through-bond effect observed in the
pH-dependent shift changes.
Smaller but still large changes in proton shifts can also
indicate the gain of a hydrogen bond interaction with
carboxylic acid side chains at low pH, as seen for T57
and T10 due to changes in the positions of aspartate resi-
dues A56 and D9, respectively, in the pH 3.0 crystal
structure that place them within hydrogen bonding dis-
tance of the amides.
In this context, it is worth noting that hydrogen bond-
ing interactions can be observed directly by measurement
of scalar couplings across the hydrogen bond. Such meas-
urements have been made for protein G, and indicate
that the four hydrogen bonds to carboxylates indicated
in Figure 9 are present43; they do not however correlate
well in magnitude with either the shift change or the
hydrogen bond distance. Further studies on this topic are
merited.
Through-space effects from His tag
Several residues show small changes in amide proton
and nitrogen and carbonyl carbon chemical shifts that
reflect titrations with pKapps in the range 5.0–7.0. These
pKapps are too high to be related to the titration of car-
boxylate side chains but are in the range in which histi-
dines titrate. The only histidines present in the protein
are within the N-terminal histidine tag (MH6AMD), sug-
gesting these residues interact with the histidine tag in
solution. The affected residues are found in the region of
the protein close to the N-terminus (the affected shifts
being the amide protons of D9, E27, V29, D55, and A56,
the amide nitrogens of T33 and K58 and the carbonyl
carbons of M8, D9, T10, and A56), as shown in Figure 10
and Table V. Most of these changes are below the cut-off
values applied during this study, the exceptions being the
amide proton and carbonyl carbon shifts of A7 and
the amide nitrogen shift of M8, both residues from the
N-terminal tag rather than the native protein sequence.
Figure 8The amides that form hydrogen bonds to carboxylate side chains. This
figure was produced using PyMOL41 and the crystal structure of
protein G determined by Gallagher et al.19 (PDB ID: 1pga).
Carboxylate side chains are shown as sticks. Amides forming hydrogen
bonds to carboxylate side chains are shown as balls.
Figure 9The relationship between the amide proton shift change and the
distance to the carboxylate O atom for amides forming hydrogen bonds
to carboxylate side chains.
J.H. Tomlinson et al.
3010 PROTEINS

The nature of the interaction between these residues and
the histidines in the tag cannot be determined as in the
pH 3.0 structure only the last three histidines of the tag
can be observed but the electron density is weak for these
residues, indicating disorder, and the remaining three
histidines are not visible, whereas there is no tag in the
other crystal structures. Given the disorder apparent
from the crystal structure and the small change in chemi-
cal shift, it is likely that these interactions are transient,
possibly explaining the low magnitude of the changes.
However, significantly it is clear that tag residues do
interact with residues from the native protein sequence
and can therefore complicate analysis of chemical shift
changes if the tag is not removed after purification.
Comparison of the results reported in this section with
those reported in the previous section suggests that the
chemical shift effect of the weak and transient hydrogen
bonds formed to the histidines is between 5 and 20 times
less than that from the almost 100% populated hydrogen
bonds to carboxylates. Interestingly, this provides some
indication of the aggregate population of the hydrogen
bonds to histidines, that is, that hydrogen bonds are
likely to be present �10% of the time.
Conformation-dependent effects
Comparison of the pH 3.0 crystal structure to the pre-
viously published structures19 identified a pH-dependent
conformational change in the C-terminal E64 residue, as
discussed previously. Large changes in amide proton
chemical shifts reflecting this conformational change are
also observed in the b1-b2 loop (K18–L20) and the loop
linking the C-terminus of the a-helix with b-strand 3
(D48–G49) that flank the E64 residue [Fig. 4(b)].
Changes in hydrogen bonding directly cannot explain the
effects on T19, L20, and G49; however, as these residues
do not form hydrogen bonds to E64 in either the pH 3.0
or the higher pH crystal structures as the distances visible
in the pH 4.5 and 4.0 crystal structures are too long for
hydrogen bonding to T19, and the G49 amide extends
from the opposite side of the protein chain from E64
and so cannot hydrogen bond to it. In addition, the con-
formation of E64 at pH 3.0 makes hydrogen bonding
between E64 and the amides of T19 and G49 even less
likely. Therefore, the large change in amide chemical
shifts for these residues is likely to be due to the change
in conformation in this region. The chemical shift
changes for the amides of T19 and G49 are smaller than
those of K18 and D48, implying that the conformational
change has less effect on amide proton shifts than direct
hydrogen bonding to the E64 side chain.
The nitrogen chemical shifts of G17 and L20 both
show pH-dependent changes that fit to the pKa of the
E64 side chain, providing further evidence that the pH-
dependent conformational change in E64 induces a
change in the loop G17–L20.
As discussed in an earlier publication20 based on both
chemical shift and relaxation dispersion information, the
C-terminal turn of the a-helix undergoes a conformational
change in response to the protonation of D44 and the
Figure 10The pH 3.0 structure of protein G with those residues that show pH-
dependent changes in amide nitrogen or proton or carbonyl carbon
chemical shifts that fit to pKapps expected to relate to the titration of
histidine residues within the tag shaded black with side chains shown as
sticks. These residues cluster in the region of the protein close to thehistidine tag. This figure was produced using PyMOL.41
Table VThe Small Changes in Chemical Shifts due to the Titration of Histidine
Residues in the Tag
Residue
Atom Undergoinga pH-DependentShift Change
pKapp Influencingthe Changein Shift
Magnitude ofthe Change in
Shift from Low toHigh pH (ppm)
M8 C0 6.58 � 0.19 10.16D9 HN 5.14 � 0.55 20.04D9 C0 6.25 � 0.16 10.19T10 C0 6.20 � 0.51 10.07E27 HN 5.55 � 0.37 20.06V29 HN 5.72 � 1.57 20.02T33 NH 5.99 � 0.19 10.14D55 HN 6.20 � 1.41 20.02A56 HN 5.64 � 1.24 20.03A56 C0 7.16 � 1.00 20.03K58 NH 5.11 � 0.45 10.23
pH-Dependent Shifts in Protein GB1
PROTEINS 3011
consequent loss of the D44–Q40 side chain-side chain
hydrogen bond. Although not observed in the pH 3.0 crys-
tal structure because of crystal packing contacts, evidence
of this conformational change is seen in the pH-dependent
chemical shift changes. The side chain Ne and He1 chemi-
cal shifts of Q40 both undergo large pH-dependent
changes that fit to the pKa of D44, indicating a hydrogen
bond between the two side chains that is lost upon proto-
nation of D44. Such a hydrogen bond is visible in approxi-
mately half of the published crystal structures of GB1. The
amide proton and nitrogen shifts of D44 also show a large
pH-dependent change fitting to the pKa of D44. The
change in proton as well as nitrogen shifts in this case indi-
cate that the change is not a through-bond effect with no
conformational change as no other proton shifts of resi-
dues that have no conformational change show such an
effect in GB1. Also affected are Q40 C0 (shift change 20.67
ppm, pKapp 3.55 � 0.03), A42 C0 (shift change 20.43 ppm,
pKapp 3.87 � 0.05), N43 NH (shift change 20.14 ppm,
pKapp 3.24 � 0.40), N43 Nd (shift change 20.59 ppm,
pKapp 3.70 � 0.03) and D44 C0 (shift change 1 1.48 ppm,
pKapp 3.71 � 0.02). Of these, the changes in D44 N and C0
shifts are most likely a through-bond effect from their own
side chain. However, the others clearly reflect a pH-de-
pendent event related to the protonation of D44 and weak-
ening of the hydrogen bond to Q40. The very large chemi-
cal shift changes of D44 H and N and of Q40 C0 stronglyindicate that the hydrogen bond between D44 HN and
Q40 O is broken at lower pH: both the sign and the magni-
tude of the shift changes are consistent with hydrogen
bonding as the origin of the change.44,45
The large conformation-dependent changes in chemical
shifts are often of a similar magnitude to the through-
space effects caused by direct hydrogen bonding to titrat-
ing side chains. Importantly, this indicates that care must
be taken when analyzing such data as the different effects
cannot be distinguished on the basis of magnitude.
Cooperative effects
The effects described above account for most of the
nuclei that have significant pH-dependent chemical shift
changes. Most of the remaining pH-dependent changes
can be accounted for by two interesting cooperative effects.
The amide proton and nitrogen and the carbonyl carbon
chemical shifts of residues 30–33 (excluding the amide
nitrogen shift of A32) in the N-terminus of the a-helix all
show small changes in response to the titration of the D30
side chain. The amides of these residues, with the exception
of T33, are unlikely to form hydrogen bonds to the side
chain of D30. D30, however, forms an a-helix cap in the
crystal structure, forming a hydrogen bond to the amide of
T33 to stabilize the N-terminus of the a-helix. Such capping
interactions are well documented.46,47 Protonation of the
D30 side chain would be expected to weaken this hydrogen
bond, possibly causing the N-terminus of the helix to
become less stable. The change in chemical shift of these
first a-helix residues, therefore, is likely to reflect a slight
‘‘fraying’’ of the N-terminus of the a-helix upon protona-
tion of this capping residue as the N-terminus of the helix
becomes less stable. ‘‘Fraying’’ of the helix upon protonation
of the capping D30 side chain would be expected to affect
the chemical shifts of all three atoms as the structure of the
N-terminus of the helix would be altered. Therefore, the
identification of the same effect upon amide proton, nitro-
gen and carbonyl carbon chemical shifts suggests that the
weakening of the D30 carboxylate-T33 amide hydrogen
bond by protonation of the D30 side chain causes some dis-
turbance in the structure of the first turn of the a-helix at
low pH. This helix ‘‘fraying’’ is not visible in the pH 3.0
crystal structure because this is above the pKa of D30 and so
the side chain is >50% deprotonated at pH 3.0. It is there-
fore not unreasonable that it should remain hydrogen
bonded to the amide of T33 in the crystal structure, as at
pH 4.5.
An a-helix is thought to be a cooperative unit, altera-
tions in one part of the helix affecting the whole struc-
ture. However, these data suggest that the effect on the
N-terminus of the helix upon protonation of the D30
side chain is not propagated further than the first turn,
the remainder of the helix structure being completely
unaffected as suggested by the lack of pH-dependent
chemical shift changes. This implies that the hydrogen
bond network in an a-helix does not necessarily function
as a completely cooperative unit, and indeed in this case
there seems to be a break in the cooperativity at T33,
because residues beyond here show very little effect.
Another example of chemical shift changes in a coopera-
tive network is seen in the b-sheet. The carbonyl carbon shift
of G49, the amide proton and nitrogen shifts of E50 and the
carbonyl carbon shift of T63 show pH-dependent changes
that fit to a pKapp of 2.7 � 0.2 (Fig. 11). These changes in
E50 and G49 chemical shifts are those ringed in Figures 5
and 6 above. These residues are clustered in the b-sheet nearthe C-terminus of GB1, the amide of E50 forming a hydro-
gen bond with the carbonyl of T63. The cause of this chemi-
cal shift change is not known as the only residue that titrates
with a pKa close to 2.7 is D30, in the N-terminus of the a-helix but this is too far from the affected residues in the crys-
tal structure to be likely to affect them, particularly without
causing any effect on the intervening residues. However, the
close similarity of the pKapp of all these residues strongly sug-
gests a common origin of the effect.
There is also a second cluster of residues adjacent to this
with a pKapp of 3.8 � 0.2, comprising the amide proton of
L15, amide nitrogen and proton and carbonyl carbon of
N16, amide nitrogen and proton of K21, carbonyl carbon
of T61, and amide nitrogen and proton of V62 (Fig. 11).
Although the pKapps of these residues are slightly variable,
their close proximity and similar pKapps suggests again a
common origin. Thus approximately one-third of the resi-
dues within the four-stranded sheet form two contiguous
J.H. Tomlinson et al.
3012 PROTEINS

cooperative networks in which the pH-dependent confor-
mational change is propagated throughout the network.
DISCUSSION
GB1 is a small and rather simple protein domain,
which makes it a useful model with which to study the
relationship between structural changes and pH-depend-
ent chemical shifts. Unlike the proteins used in previous
studies,12 GB1 is not an enzyme and has no unusual
pKas or complex hydrogen bond networks, making the
analysis of chemical shift data simpler.
Through-bond effects
The titration of an aspartate or glutamate side chain
affects the chemical shifts of both the amide nitrogen and
carbonyl carbon in the amide groups on both sides of it.
Because the chemical shift is an indicator of the electron
density and distribution around a nucleus, this reinforces
the point that a backbone amide group is a single p-electronsystem. It also shows that significant changes to electron
density can be passed on through up to six chemical bonds.
The titration of an aspartate or glutamate residue had
effects of <0.1 ppm on the amide proton shift of that res-
idue, consistent with the size of intrinsic titration shifts
observed by Bundi and Wuthrich.9 The two exceptions are
the C-terminal glutamate and D44, where in both cases
the larger shift changes are due to conformational change.
The pH-dependent changes in amide proton chemical
shifts in the B1 domain of protein G have been previously
studied by Khare et al.22 They observed large changes in
amide proton shift for K18, T33, and D48, all of which are
involved in hydrogen bonds to carboxylate side chains in
the crystal structure,22 in agreement with the results of this
study. A smaller pH-dependent change in proton chemical
shift was observed for T19 which was explained as due to its
proximity to the K18–E64 hydrogen bond. In light of the
crystal structure of GB1 at pH 3.0, however, we suggest that
this pH-dependent change in shift is due to the effects of
the structural rearrangement of the E64 residue with
reduced pH. In addition, the He proton chemical shift of
Q40 was found to titrate with a pH midpoint that corre-
sponds to the pKa of the D44 side chain to which the side
chain of Q40 forms a hydrogen bond in the crystal struc-
ture,22 an effect also observed in this study and discussed in
relation to a structural change in the C-terminus of the helix
in a previous publication.20 The Khare et al.22 study, how-
ever, did not have a low pH structure available to compare
changes directly to observed changes in structure.
Changes in carbonyl chemical shifts with pH have also
been studied for a limited number of residues in a mutant of
GB1.42 Carbonyl chemical shift changes with pH were studied
for 28 of the 56 residues, 21 of these showing pH-dependent
changes in chemical shift.42 Backbone carbonyls of aspartate
and glutamate residues showed large shift changes on titration
of the carboxylate, in agreement with the present study. Some
residues that precede or follow a carboxylate in the protein
sequence were also shown to exhibit a pH-dependent change
in chemical shift reporting the pKa of the neighboring carbox-
ylate.42 Lindman et al.42 suggested that the effect of the titra-
tion of acidic side chains on carbonyls separated from the side
chain by a small number of covalent bonds, such as the car-
boxyl of the same residue, is due to a through-bond effect.
This is supported by this study which found similar effects for
both nitrogen and carbonyl carbon shifts of titrating residues,
but not the amide proton shifts. In summary, although
through-bond effects on 13C and 15N shifts are reasonably pre-
dictable and occur over up to six bonds, local effects can
sometimes cause unusual titration behavior.
Through-space effects
Amide proton and nitrogen shifts for the same amide
group are expected to be influenced predominantly by the
same effects as both are expected to be influenced signifi-
cantly by hydrogen bonding. However, it is apparent that
many residues show effects on amide proton but not nitro-
gen shifts or vice versa, suggesting a significant influence
of differing effects. Upon closer inspection, however, those
residues that show changes in both amide nitrogen and
proton shifts do report the influence of the same pKapp as
shown in Figure 12, but do not show a correlation in the
Figure 11The b-sheet region of GB1. Cross-strand hydrogen bonds are indicated
by dashed lines. Nuclei showing otherwise unexplained pH-dependentchemical shift changes with a pKapp of 3.8 � 0.2 are indicated by
spheres; those titrating with a pKapp of 2.8 � 0.2 are also indicated by
spheres within the dashed region close to the C-terminus. These
residues each form a contiguous unit, which is suggested to indicate the
presence of a cooperative pH-dependent change. For comparison, the
colors on backbone amide units denote the magnitude of the oscillation
in amide plane (g-GAF) determined by Bouvignies et al.,48 ranging
from zero (blue) through green, yellow and orange to �308 (red). Thetwo arrows indicate the dynamic barrier discussed in the text.
pH-Dependent Shifts in Protein GB1
PROTEINS 3013

magnitude of the change. The difference in the response of
the amide nitrogen and proton shifts to the titration of
carboxylate residues can be explained by the geometry of
the through-space interaction with the carboxylate side
chain. One would expect carboxylates to affect the chemi-
cal shift of H-bonded HN by an electric field effect2,49: the
negative charge pushes electron density away from the pro-
ton down the HN bond. The magnitude of the chemical
shift change is therefore proportional to cosy, where y is
the angle between the CO22��H and H��N vectors. The
chemical shift change of N is also produced by an electric
field effect, but in this case it depends on the angle between
the CO22��N and N��C0 vectors, which is of course a com-
pletely different geometry. Therefore, the interaction of an
amide with a titrating side chain can have effects of differ-
ing magnitude on the amide proton and nitrogen because
of the different relative orientations of these two bonds to
the titrating side chain, explaining the differing effects on
amide proton and nitrogen shifts observed in this study. A
greater understanding of such effects is clearly important.
First, because when studying chemical shift changes, for
example by chemical shift mapping/chemically induced
shifts, the amide proton and nitrogen shifts changes are of-
ten combined.50,51 This difference in the magnitude of
the effect however, suggests more information may be
obtained if the proton and nitrogen shifts were analyzed
separately. Second, because improved calculations of
through-space titration effects allow other effects, such as
pH-induced conformational change, to be more clearly
identified.52
Conformational effects
Large changes in amide proton chemical shifts in
response to conformational changes in GB1 were observed
in the C-terminal region of the protein and in the last turn
of the a-helix, particularly in D44. In the case of E64, such
changes are observed in the amide proton shifts of residues
surrounding the conformational change but without a
direct hydrogen bonding interaction with E64. A similar
effect is not seen in the amide nitrogen shifts of these resi-
dues This suggests that through-space effects due to the
conformational change have a greater influence on the am-
ide proton shift than on the amide nitrogen, although this
could be a consequence of the different angles between the
charged side chain and the polarisable bond. This does,
however, indicate that large pH-dependent changes in am-
ide proton shifts (of up to 0.5 ppm) do not necessarily
indicate residues that form direct hydrogen bonds with
titrating side chains.
Cooperative effects
pH-dependent chemical shifts are potentially well suited
to the study of cooperative effects propagated throughout
hydrogen bond networks because the transmission of
effects can be followed by comparison of the pKapps affect-
ing chemical shift changes. Such transmission of shifts
through a hydrogen bonding network has been described
previously.53,54 Parker et al.53 found that hydrogen bond-
ing to the carbonyl of the same residue as the amide of in-
terest (secondary hydrogen bonding) and hydrogen bond-
ing that does not directly involve the amide of interest but
that forms a network around it can affect the amide proton
chemical shift. This ‘‘cooperative’’ hydrogen bonding can
have effects on the amide proton chemical shift of up to
1.3 ppm (secondary hydrogen bonding) or 1.1 ppm (terti-
ary hydrogen bonding).53 They found that the key deter-
minants of the chemical shifts of amide protons involved
in hydrogen bonds are a through-bond effect caused by the
primary hydrogen bond and the nature and number of sec-
ondary and tertiary hydrogen bonding partners.53 The
chemical shifts of amide protons that form hydrogen
bonds with charged side chains, however, could not be pre-
dicted as accurately as amides involved in main chain-
main chain hydrogen bonds.53 Because of the fact that
hydrogen bonding has major effects on amide proton
shifts, one interpretation of this observation is that cooper-
ative networks alter the strength of the hydrogen bonds;
the direction of the effect noted by Parker et al.53 suggest-
ing that hydrogen bonds within a network are stronger
than isolated hydrogen bonds.
Studies of amide chemical shift changes in adipocyte
lipid-binding protein upon binding to R- and S-ibupro-
fen54 showed changes throughout the backbone that
occur in a regular pattern and seem to indicate that the
chemical shift changes are passed on from b-strand to b-strand, propagating throughout the b-sheet. This sug-
gested a concerted change in the hydrogen bond network
in the protein to accommodate ligand binding.54
The correlated change in amide proton, nitrogen and
carbonyl carbon chemical shifts in the first turn of the
Figure 12A comparison of the pKapp affecting the amide proton chemical shiftwith that affecting the amide nitrogen shift of the same residue. Only
those residues for which both the proton and nitrogen shifts undergo
pH-dependent changes are shown.
J.H. Tomlinson et al.
3014 PROTEINS

a-helix indicate a fraying of the a-helix in response to
the protonation of D30. The limiting of this effect to the
first turn of the helix, however, indicates that the a-helixis not a single cooperative unit. Instead there appears to
be a break in the cooperativity of the helix at T33, resi-
dues beyond this showing no effects of this fraying.
A very interesting set of correlated shift changes occursat one end of the b-sheet, and involves three of the fourstrands (Fig. 11). The pKapp of 3.8 � 0.2 does not corre-spond to any single neighboring residue, and may there-fore reflect a cooperative structural change involvingmore than one titratable group. There is an interestingrelationship between these residues and the backboneoscillations described by Bouvignies et al.48 Theseauthors used NMR measurements to characterize oscilla-tions of the amide plane, described by a Gaussian axialfluctuation (GAF). They describe slow-timescale corre-lated motions across b-strands, which form a ‘‘standingwave’’ across the sheet. A particularly noticeable oneinvolves the set of four amides marked by arrows in Fig-ure 11, forming a line of fluctuating hydrogen bondsacross the sheet. The interesting relationship is that thesefour amides appear to form a natural barrier to the cor-related pH-dependent shift change seen here: in otherwords, the boundary of the correlated unit is dictated byslow motional fluctuations, which place a limit on corre-lated hydrogen bonding. Bouvignies et al.48 suggest thatthe regions of the protein with restricted motion (theblue/green regions of Figure 11, which include the resi-dues found here to have a correlated pH-dependentchange) are motionally restricted because their largehydrophobic side chains tether them together. In otherwords, their data imply that correlated hydrogen bondingunits are most stable within the hydrophobic core. Thismatches nicely with the expected lower dielectric constantin such regions, which may be expected to strengthenhydrogen bonding interactions. We have therefore labeledthis region an ‘‘iceberg’’: the name recalls the standardmodel of liquid water, which consists of regions of ice-like regular hydrogen bonds, bounded by disorderedregions. The icebergs are stabilized by the enthalpy offormation of hydrogen bonds, while the disorderedregions have less favorable hydrogen bonds but havemore favorable entropy. We suggest that the same balanceoccurs within the interior of the protein, with the inter-esting difference that the iceberg regions are stabilized bythe hydrophobic core.
In summary, a detailed analysis of pH-dependent
chemical shift changes in GB1 has found that almost all
chemical shift changes can be understood on the basis of
the change in structure with pH. They demonstrate that
the protein undergoes a range of structural and dynamic
changes, some of which are limited to the immediate vi-
cinity of titrating groups and others of which are trans-
mitted further, even across several strands of the b-sheet.The result gives an insight into the complexity and sub-
tlety of protein structure and dynamics.
ACKNOWLEDGMENTS
The authors thank the Biotechnology and Biological
Sciences Research Council for studentships (to JHT and
VLG), and Diamond IO2 beamline staff for station align-
ment and helping with data collection.
REFERENCES
1. Neal S, Nip AM, Zhang H, Wishart DS. Rapid and accurate calcula-
tion of protein 1H, 13C and 15N chemical shifts. J Biomol NMR
2003;26:215–240.
2. Williamson MP, Asakura T. Empirical comparisons of models for
chemical-shift calculation in proteins. J Magn Reson B 1993;
101:63–71.
3. Montalvao RW, Cavalli A, Salvatella X, Blundell TL, Vendruscolo
M. Structure determination of protein-protein complexes using
NMR chemical shifts: case of an endonuclease colicin-immunity
protein complex. J Am Chem Soc 2008;130:15990–15996.
4. Cavalli A, Salvatella X, Dobson CM, Vendruscolo M. Protein struc-
ture determination from NMR chemical shifts. Proc Natl Acad Sci
USA 2007;104:9615–9620.
5. Shen Y, Lange OF, Delaglio F, Rossi P, Aramini JM, Lui G, Eletsky
A, Wu Y, Singarapu KK, Lemak A, Ignatchenko A, Arrowsmith CH,
Szyperski T, Montelione GT, Baker D, Bax A. Consistent blind pro-
tein structure generation from NMR chemical shift data. Proc Natl
Acad Sci USA 2008;105:4685–4690.
6. Wishart DS, Arndt D, Berjanskii M, Tang P, Zhou J, Lin G. CS23D:
a web server for rapid protein structure generation using NMR
chemical shifts and sequence data. Nucleic Acids Res 2008;
36:W496–W502.
7. Wilton DJ, Kitahara R, Akasaka K, Williamson MP. Pressure-de-
pendent 13C chemical shifts in proteins: origins and applications. J
Biomol NMR 2009;44:25–33.
8. Wilton DJ, Tunnicliffe RB, Kamatari YO, Akasaka K, Williamson
MP. Pressure-induced changes in the solution structure of the GB1
domain of protein G. Proteins 2008;71:1432–1440.
9. Bundi A, Wuthrich K. Use of amide 1H-NMR titration shifts for
studies of polypeptide conformation. Biopolymers 1979;18:299–311.
10. Ebina S, Wuthrich K. Amide proton titration shifts in bull seminal
inhibitor IIA by two-dimensional correlated 1H nuclear magnetic
resonance (COSY). Manifestation of conformational equilibria
involving carboxylate groups. J Mol Biol 1984;179:283–288.
11. Clark AT, Smith K, Muhandiram R, Edmondson SP, Shriver JW.
Carboxyl pKa values, ion pairs, hydrogen bonding, and the pH-de-
pendence of folding in the hyperthermophile proteins Sac7d and
Sso7d. J Mol Biol 2007;372:992–1008.
12. Betz M, Lohr F, Weink H, Ruterjans H. Long-range nature of the
interactions between titratable groups in Bacillus agaradhaerens
family 11 xylanase: pH titration of B. agaradhaerens xylanase. Bio-
chemistry 2004;43:5820–5831.
13. Haruyama H, Qian Y-Q, Wuthrich K. Static and transient hydro-
gen-bonding interactions in recombinant desulfatohirudin studied
by 1H nuclear magnetic resonance measurements of amide proton
exchange rates and pH-dependent chemical shifts. Biochemistry
1989;28:4312–4317.
14. Schaller W, Robertson AD. pH, ionic strength and temperature
dependence of ionization equilibria for the carboxyl groups
in turkey ovomucoid third domain. Biochemistry 1995;34:
4714–4723.
15. Quirt AR, Lyyerla JR, Jr, Peat IR, Cohen JS, Reynolds WF, Freed-
man MH. Carbon-13 nuclear magnetic resonance titration shifts in
amino acids. J Am Chem Soc 1974;96:570–574.
16. Surprenant HL, Sarneski JE, Key RR, Byrd JT, Reilley CN. Carbon-
13 NMR studies of amino acids: chemical shifts, protonation shifts,
microscopic protonation behavior. J Magn Reson 1980;40:231–243.
pH-Dependent Shifts in Protein GB1
PROTEINS 3015

17. Rabenstein DL, Sayer TL. Carbon-13 chemical shift parameters for
amines, carboxylic acids, and amino acids. J Magn Reson 1976;24:27–39.
18. Batchelor JG, Feeney J, Roberts GCK. Carbon-13 NMR protonation
shifts of amines, carboxylic acids and amino acids. J Magn Reson
1975;20:19–38.
19. Gallagher T, Alexander P, Bryan P, Gilliland GL. Two crystal
structures of the B1 immunoglobulin-binding domain of Strepto-
coccal Protein G and comparison with NMR. Biochemistry 1994;
33:4721–4729.
20. Tomlinson JH, Craven CJ, Williamson MP, Pandya MJ. Dimeriza-
tion of protein G B1 domain at low pH: a conformational
switch caused by loss of a single hydrogen bond. Proteins 2010;
78:1652–1661.
21. Tomlinson JH, Ullah S, Hansen PE, Williamson MP. Characterisa-
tion of salt bridges to lysines in the Protein G B1 domain. J Am
Chem Soc 2009;131:4674–4684.
22. Khare D, Alexander P, Antosiewicz J, Bryan P, Gilson M, Orban J.
pKa measurements from nuclear magnetic resonance for the B1 and
B2 immunoglobulin G-binding domains of protein G: comparison
with calculated values for nuclear magnetic resonance and x-ray
structures. Biochemistry 1997;36:3580–3589.
23. Tunnicliffe RB, Waby JL, Williams RJ, Williamson MP. An experi-
mental investigation of conformational fluctuations in proteins G
and L. Structure 2005;13:1677–1684.
24. Joshi MD, Sidhu G, Nielsen JE, Brayer GD, Withers SG, McIn-
tosh LP. Dissecting the electrostatic interactions and pH-depend-
ent activity of a family 11 glycosidase. Biochemistry 2001;40:
10115–10139.
25. Sundd M, Iverson N, Ibarra-Molero B, Sanchez-Ruiz JM, Robertson
AD. Electrostatic interactions in ubiquitin: stabilization of carboxy-
lates by lysine amino groups. Biochemistry 2002;41:7586–7596.
26. Crennell SJ, Cook D, Minns A, Svergun D, Andersen RL, Nordberg-
Karlsson E. Dimerisation and increase in active site aromatic groups
as adaptations to high temperatures: x-ray solution scattering and
substrate-bound crystal structures of Rhodothermus marinus endo-
glucanase. J Mol Biol 2006;356:57–71.
27. Krengel U, Dey R, Sasso S, Okvist M, Ramakrishnan C, Kast P. Pre-
liminary x-ray crystallographic analysis of the secreted chorismate
mutase from Mycobacterium tuberculosis: a tricky crystallization
problem solved. Acta Crystallogr Sect F Struct Biol Cryst Commun
2006;62:441–445.
28. Leslie AGW. Recent changes to the MOSFLM package for process-
ing film and image plate data. Joint CCP4 and ESF-EAMCB News-
lett Protein Crystallogr 1992;26.
29. CCP4. The CCP4 suite: programs for protein crystallography. Acta
Crystallogr D Biol Crystallogr 1994;50:760–763.
30. Evans PR. Scaling and assessment of data quality. Acta Crystallogr
D Biol Crystallogr 2005;2:72–82.
31. Navaza J. AMoRe: an automated package for molecular replace-
ment. Acta Crystallogr A 1994;50:157–163.
32. Murshudov GN, Vagin AA, Dodson EJ. Refinement of macromolec-
ular structures by the maximum-likelihood method. Acta Crystal-
logr D Biol Crystallogr 1997;53:240–255.
33. Emsley P, Cowtan K. Coot: model-building tools for molecular
graphics. Acta Crystallogr D Biol Crystallogr 2004;60:2126–2132.
34. Gronenborn AM, Filpula DR, Essig NZ, Achari A, Whitlow M,
Wingfield PT, Clore GM. A novel, highly stable fold of the immuno-
globulin binding domain of Streptococcal Protein G. Science 1991;
253:657–661.
35. Strop P, Marinescu AM, Mayo SL. Structure of a protein G helix
variant suggests the importance of helix propensity and helix dipole
interactions in protein design. Protein Sci 2000;9:1391–1394.
36. Frericks Schmidt HL, Sperling LJ, Gao YG, Wylie BJ, Boettcher JM,
Wilson SR, Reinstra CM. Crystal polymorphism of protein GB1
examined by solid-state NMR spectroscopy and X-ray diffraction.
J Phys Chem B 2007;111:14362–14369.
37. Nauli S, Kuhlman B, Le Trong I, Stenkamp RE, Teller DC, Baker D.
Crystal structures and increased stabilization of the protein G var-
iants with switched folding pathways NuG1 and NuG2. Protein Sci
2002;11:2924–2931.
38. Wunderlich M, Max KE, Roske Y, Mueller U, Heinemann U,
Schmid FX. Optimization of the gbeta1 domain by computational
design and by in vitro evolution: structural and energetic basis of
stabilization. J Mol Biol 2007;373:775–784.
39. Frank MK, Dyda F, Dobrodumov A, Gronenborn AM. Core muta-
tions switch monomeric protein GB1 into an intertwined tetramer.
Nat Struct Biol 2002;9:877–885.
40. Seewald MJ, Pichumani K, Stowell C, Tibbals BV, Regan L, Stone
MJ. The role of backbone conformational heat capacity in protein
stability: temperature dependent dynamics of the B1 domain of
Streptococcal protein G. Protein Sci 2000;9:1177–1193.
41. DeLano WL. The PyMOL molecular graphics system. Palo Alto,
CA, USA: DeLano Scientific; 2002.
42. Lindman S, Linse S, Mulder FAA, Andre I. pKa values for side-
chain carboxyl groups of a PGB1 variant explain salt and pH-de-
pendent stability. Biophys J 2007;92:257–266.
43. Cornilescu G, Ramirez BE, Frank MK, Clore GM, Gronenborn AM,
Bax A. Correlation between 3hJNC0 and hydrogen bond length in
proteins. J Am Chem Soc 1999;121;6275–6279.
44. Xu XP, Case DA. Probing multiple effects on 15N, 13Ca, 13Cb, and13C0 chemical shifts in peptides using density functional theory.
Biopolymers 2002;65:408–423.
45. Asakura T, Taoka K, Demura M, Williamson MP. The relationship
between amide proton chemical shifts and secondary structure in
proteins. J Biomol NMR 1995;6:227–236.
46. Penel S, Hughes E, Doig AJ. Side-chain structures in the first turn
of the a-helix. J Mol Biol 1999;287:127–143.
47. Doig AJ, Baldwin RL. N- and C-capping preferences for all 20
amino acids in a-helical peptides. Protein Sci 1995;4:1325–1336.
48. Bouvignies G, Bernardo P, Meier S, Cho K, Grzesiek S, Bruschweiler
R, Blackledge M. Identification of slow correlated motions in pro-
teins using residual dipolar and hydrogen-bond scalar couplings.
Proc Natl Acad Sci USA 2005;102:13885–13890.
49. Hass MA, Jensen RM, Led JJ. Probing electric fields in proteins in
solution by NMR spectroscopy. Proteins 2008;72:333–343.
50. Deakin JA, Blaum B, Gallagher JT, Uhrin D, Lyon M. The binding
properties of minimal oligosaccharides reveal a common heparan
sulfate/dermatan sulfate-binding site in hepatocyte growth factor/
scatter factor that can accommodate a wide variety of sulfation pat-
terns. J Biol Chem 2009;284:6311–6321.
51. Friberg A, Corsini L, Mourao A, Sattler M. Structure and ligand
binding of the extended tudor domain of D. melanogaster. J Mol
Biol 2009;387:921–934.
52. Kukic P, Farrell D, Søndergaard CR, Bjarnadottir U, Bradley J, Pol-
lastri G, Nielsen JE. Improving the analysis of NMR spectra track-
ing pH-induced conformational changes: removing artefacts of the
electric field in the NMR chemical shift. Proteins 2010;78:971–984.
53. Parker LL, Houk AR, Jensen JH. Cooperative hydrogen bonding
effects are key determinants of backbone amide proton chemical
shifts in proteins. J Am Chem Soc 2006;128:9863–9872.
54. Bai G, Mo H, Shapiro M. NMR evaluation of adipocyte fatty acid
binding protein (aP2) with R- and S-ibuprofen. Bioorg Med Chem
2008;16:4323–4330.
J.H. Tomlinson et al.
3016 PROTEINS