structural studies of metalloproteins using x-ray absorption
TRANSCRIPT

STRUCTURAL STUDIES OF METALLOPROTEINSUSING X-RAY ABSORPTION SPECTROSCOPY
AND X-RAY DIFFRACTION
by
Paul Joseph Ellis
A thesis submitted in partial fulfilment of
the requirements for the degree of
Doctor of Philosophy
School of Chemistry
University of Sydney
August, 1995

ii
Contents
Page
Acknowledgments ix
Preface x
List of Abbreviations xii
List of Figures xiii
List of Tables xviii
Summary xxi
Chapter 1: X-ray Absorption Fine Structure (EXAFS) 1-12
1.1 What is EXAFS? 11.2 The origin of the EXAFS oscillations 21.3 Multiple-scattering 41.4 Data collection 5
1.4.1 Generating monochromatic X-rays 51.4.2 Transmission XAS measurements 61.4.3 Fluorescence XAS measurements 71.4.4 Polarised XAS measurements 81.4.5 Low-temperature XAS measurements 8
1.5 Data reduction (extracting the EXAFS) 91.5.1 Removing the underlying background absorbance 91.5.2 Normalisation 101.5.3 Removing the smooth edge background 101.5.4 Compensating for decreasing µ0 11
Chapter 2: EXAFS structure analysis using the program XFIT 13-29
2.1 Introduction 132.2 The model 142.3 Calculation of the theoretical EXAFS 152.4 Empirical EXAFS calculation 162.5 Ab initio EXAFS calculation 162.6 Polarised EXAFS 18

iii
2.7 Fourier filtering 182.8 Refinement algorithm 202.9 Constraints and restraints 21
2.10 Refinement using more than one EXAFS data set 222.11 Multiple absorbing atom sites 232.12 Goodness-of-fit (residual) 232.13 Monte-Carlo error analysis 242.14 User-friendly interface 262.15 Examples 272.16 Data 282.17 Some recent XFIT analyses 28
Chapter 3: Plastocyanin 30-35
3.1 Introduction 303.2 X-ray diffraction studies of plastocyanin 313.3 Implications for oxidation and reduction 333.4 Variation with pH of the ratio of the low- and high-pH 34
forms of reduced Pc3.5 Other "blue" copper proteins: why do EXAFS? 35
Chapter 4: Collection of EXAFS data from oxidised and reduced 36-40plastocyanin
4.1 Preferred crystal orientations for collecting polarised 36EXAFS from poplar Pc.
4.2 Polarised EXAFS from oriented single crystals of oxidised Pc 364.3 Unpolarised EXAFS from frozen solutions of reduced Pc at 37
pH 4.8 and 7.24.4 Polarised EXAFS from oriented single crystals of reduced Pc 38
at pH 4.5 and 7.24.5 Data reduction 39

iv
Chapter 5: General description of the EXAFS analyses of plastocyanin 41-51
5.1 Criteria for the analyses 415.2 The X-ray crystal structures 41
5.2.1 Constructing the EXAFS models 415.2.2 XRD restraints 43
5.3 Typical geometry of the ligand sidechains 435.3.1 Changes in the starting model due to the ligand geometry 45
restraints5.4 Typical values of E0, S0
2, and the Debye-Waller factors 465.4.1 A note on E0 465.4.2 E0 and S0
2 restraints 465.4.3 Debye-Waller factors restraints 47
5.5 The observed EXAFS 475.5.1 Weighting of the EXAFS curves relative to each other 475.5.2 Weighting of the EXAFS relative to the restraints 485.5.3 Choosing the Fourier-filtering windows 48
5.5.3.1 EXAFS windows 495.5.3.2 Fourier-transform window 50
Chapter 6: EXAFS analysis of oxidised plastocyanin 52-64
6.1 Original analysis 526.2 Reanalysis 536.3 Analysing the refinements 58
6.3.1 Refinement with the atoms fixed at the XRD coordinates 586.3.2 The refinements included in the final average 596.3.3 The average Cu-ligand distances 59
6.4 Estimating the uncertainty in the Cu-ligand distances 606.4.1 Monte-Carlo error analysis 606.4.2 Cu-ligand bond distances from the crystal 2 EXAFS 616.4.3 Uncertainty in the crystal orientations 616.4.4 EXAFS analysis of model compounds 616.4.5 Uncertainty in E0 636.4.6 Estimates of uncertainty 63
6.5 Empirical analysis 636.6 Conclusion 64

v
Chapter 7: EXAFS analysis of reduced plastocyanin 65-83
7.1 General note on the analysis of EXAFS from reduced Pc 657.1.1 Estimating the [L]:[H] ratio in crystals of reduced Pc at 295 K 657.1.2 Reduced Pc solutions at 10 K 687.1.3 Potential errors resulting from the uncertain [L]:[H] ratios 68
7.2 The final analysis 687.3 Analysing the refinements 78
7.3.1 Refinement with the atoms fixed at the XRD coordinates 787.3.2 The refinements included in the final average 797.3.3 The average Cu-ligand distances 79
7.4 Estimating the uncertainty in the Cu-ligand distances 807.4.1 Uncertainty in the Cu-ligand distances due to uncertainty 80
in the [L]:[H] ratios7.4.2 Uncertainty in E0 807.4.3 Estimates of uncertainty 81
7.5 Independent analyses of polarised and unpolarised EXAFS 82data
7.6 Conclusion 83
Chapter 8: EXAFS analyses of plastocyanin: discussion 84-89
8.1 Cu-ligand distances determined by EXAFS 848.2 Changes with oxidation state and pH 848.3 Implications for oxidation/reduction 858.4 Comparison of the EXAFS and XRD Cu-ligand distances 858.5 Comparison with other EXAFS analyses of Pc 878.6 Conclusion 888.7 Future work 88
Chapter 9: The crystal structure of leghemoglobin 90-108
9.1 Introduction: nitrogen fixation 909.2 Leghemoglobin 919.3 Crystallographic studies of leghemoglobin 939.4 Crystallographic studies of ferric soybean leghemoglobin a 93
nicotinate

vi
9.5 Rerefinement of the ferric soybean leghemoglobin a 94nicotinate model
9.5.1 Protocol for the new refinement 959.5.2 Generating the initial model 969.5.3 Refinement 97
9.6 Estimates of precision 1069.7 Ramachandran plots 107
Chapter 10: The structure of ferric soybean leghemoglobin a nicotinate 109-120
10.1 Gross structure of the molecule 10910.2 Secondary and tertiary structure 11410.3 Temperature factors 11510.4 The heme pocket 11510.5 Hydrogen-bonding to the heme ligands 119
Chapter 11: The structure of lupin Lb II in relation to its properties 121-148
11.1 Identifying the key features of lupin Lb II 12111.2 Basic ligand association and dissociation processes in 123
monomeric hemoglobins11.3 Structural factors influencing association and dissociation 123
in sperm whale Mb11.3.1 Key residues in sperm whale Mb 12411.3.2 Heme accessibility 12511.3.3 Stabilisation of water and ligand molecules by hydrogen 127
bonding11.3.3.1 Obstruction of the binding site by water 12711.3.3.2 Stabilisation of a bound ligand 127
11.3.4 Sidechains potentially hindering the binding site 12811.3.4.1 Phenylalanine CD1 12811.3.4.2 The distal valine E11 12811.3.4.3 The distal histidine E7 129
11.3.5 Heme pocket size 12911.3.6 Heme reactivity and the orientation of the proximal 130
histidine imidazole
vii
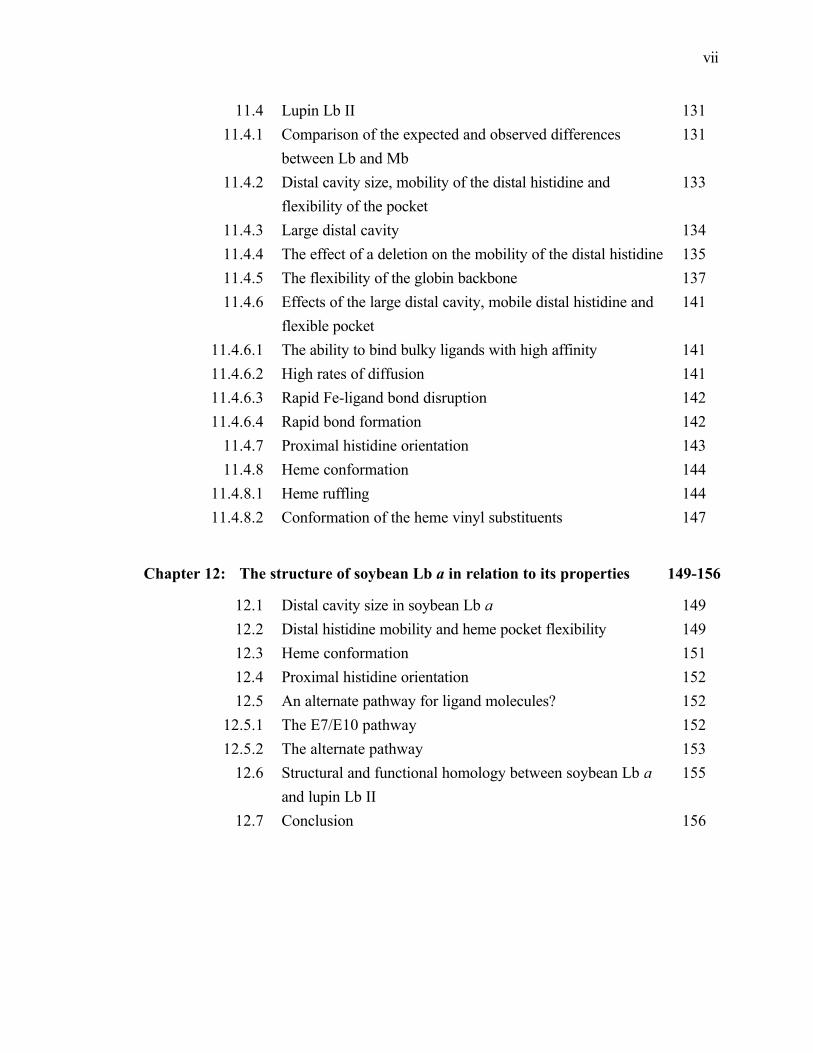
11.4 Lupin Lb II 13111.4.1 Comparison of the expected and observed differences 131
between Lb and Mb11.4.2 Distal cavity size, mobility of the distal histidine and 133
flexibility of the pocket11.4.3 Large distal cavity 13411.4.4 The effect of a deletion on the mobility of the distal histidine 13511.4.5 The flexibility of the globin backbone 13711.4.6 Effects of the large distal cavity, mobile distal histidine and 141
flexible pocket11.4.6.1 The ability to bind bulky ligands with high affinity 14111.4.6.2 High rates of diffusion 14111.4.6.3 Rapid Fe-ligand bond disruption 14211.4.6.4 Rapid bond formation 142
11.4.7 Proximal histidine orientation 14311.4.8 Heme conformation 144
11.4.8.1 Heme ruffling 14411.4.8.2 Conformation of the heme vinyl substituents 147
Chapter 12: The structure of soybean Lb a in relation to its properties 149-156
12.1 Distal cavity size in soybean Lb a 14912.2 Distal histidine mobility and heme pocket flexibility 14912.3 Heme conformation 15112.4 Proximal histidine orientation 15212.5 An alternate pathway for ligand molecules? 152
12.5.1 The E7/E10 pathway 15212.5.2 The alternate pathway 153
12.6 Structural and functional homology between soybean Lb a 155and lupin Lb II
12.7 Conclusion 156

viii
Appendices: Contents
Appendix A: EXAFS Evidence that the CuCl64- Ion in (3-chloroanilinium)8(CuCl6)Cl4Has an Elongated Rather than Compressed Tetragonal Geometry.
Appendix B: Extended X-Ray Absorption Fine Structure, Crystal Structures at 295 and 173 K, and Electron Paramagnetic Resonance andElectronic Spectra of Bis[tris(2-pyridyl)-methane]copper(II)Dinitrate.
References

ix
Acknowledgements
It is impossible to properly thank in this limited space the many people who havecontributed to the work described herein and so I can only offer here my gratitude to afew whose contribution has been particularly conspicuous.
I must first thank my supervisor, Prof. Hans Freeman, both for his invaluable guidanceover the past several years, and for his practical help in conducting the experiments. Hischaracteristic attention to detail has been especially valuable to me during the preparationof this thesis and no other colleague has made a greater contribution to its final form.
My next thanks go to Prof. Keith Hodgson, Dr. Britt Hedman and the members of theHodgson group, both past and present, who not only played a major role in the collectionof the XAS data, but have also been a valuable source of instruction and advice.
My gratitude is extended to the members of the Crystal Structure Group, particularly toDrs. Trevor Hambley and J. Mitchell Guss for their kind and generous help.
Thanks also to my postgraduate colleagues, especially Dr. Thomas Maschmeyer,Dr. Barry Fields, and Emma Proudfoot for their assistance and encouragement.
I gratefully acknowledge helpful discussions with Drs. Graham George, andIngrid Pickering, and Cyril Appleby, and Prof. James Penner-Hahn.
For their support I gratefully acknowledge: (i) The Department of Employment,Education and Training for the award of an APRA scholarship, (ii) The StanfordSynchrotron Radiation Laboratory, which is supported by the U.S. Department of Energy,for providing synchrotron beam time, (iii) The Australian Nuclear Science andTechnology Organisation for providing travel funding, (iv) The Australian ResearchCouncil and the Dr. Joan R. Clark Research Fund for funding supporting the research, and(v) The staff of the Visualisation Laboratory, VisLab, in the School of Physics at theUniversity of Sydney for their unstinting help and generous access to their computers.
Finally, it is my pleasure to thank my parents, brothers and sister for their help,encouragement and inspiration. Without them, none of this would have been possible.

x
Preface
This thesis is a report of original research undertaken by the author and is submitted forthe degree of Doctor of Philosophy at the University of Sydney.
The research comprised three projects. The first was concerned with the technique ofstructural determination by the analysis of X-ray absorption fine structure (EXAFS). Thesecond was concerned with the application of this technique to the "blue" copper proteinplastocyanin. The third concerned the refinement of the X-ray diffraction crystal structureof the plant O2-binding protein leghemoglobin.
All of the work detailed in this thesis was conducted by the candidate except where notedin this preface.
Structure of the thesis:
Chapter 1 Is a brief review of the nature and measurement of EXAFS.
Chapter 2 Describes the interactive EXAFS analysis program XFIT. This program,developed solely by the candidate, has been described in a published paperupon which Chapter 2 draws heavily:
Ellis, P. J., and Freeman, H. C. (1995)XFIT - an Interactive EXAFS Analysis Program.Journal of Synchrotron Radiation, 2, in press.
The original version, drafted by the candidate, was similar in form andcontent to the published paper, completed in collaboration withProf. H. C. Freeman and incorporating comments by Dr. J. Penner-Hahn.
Chapter 3 Is a brief review of the structure and function of the "blue" copper proteinplastocyanin and the motivation behind the use of EXAFS.
Chapter 4 Describes the retrieval of published polarised EXAFS data from oxidisedpoplar (Populus nigra var. italica) plastocyanin and collection of unpolarisedand polarised EXAFS data from reduced poplar plastocyanin at low and high

xi
pH. The candidate was responsible for the preparation of the samples. Thecrystals were oriented with the assistance ofProf. H. C. Freeman, and the XAS data was collected with the assistance ofProf. H. C. Freeman, Prof. K. O. Hodgson, Dr. Britt Hedman, and membersof the Hodgson group at Stanford University.
Chapter 5 Is a general description of the analysis of the plastocyanin EXAFS data.
Chapter 6 Completes the description of the analysis of the polarised EXAFS data fromoxidised plastocyanin.
Chapter 7 Completes the description of the analysis of the polarised and unpolarisedEXAFS data from reduced plastocyanin at low and high pH.
Chapter 8 Is a discussion of the Cu-site dimensions obtained from the EXAFS analyses.These dimensions are also compared to those obtained previously by X-raydiffraction and EXAFS analysis.
Chapter 9 After a brief review of the function and properties of the monomeric planthemoglobin "leghemoglobin", Chapter 9 describes the refinement of theX-ray diffraction crystal structure of soybean (Glycine max) leghemoglobin anicotinate. As detailed in this chapter, the refinement used data collected byprevious investigators and drew on an earlier, unsuccessful, refinement.
Chapter 10 Describes the refined structure of soybean leghemoglobin a nicotinate.
Chapter 11 Is an analysis of the major structural differences between sperm whale(Physeter catodon) myoglobin, a model for monomeric hemoglobins, andlupin (Lupinus luteus) leghemoglobin II, the only other leghemoglobin tohave been crystallographically characterised.
Chapter 12 Is an examination of the soybean leghemoglobin a structure in the light of thekey features of lupin leghemoglobin II identified in the previous chapter.

xii
List of Abbreviations
ADP adenosine diphosphateATP adenosine triphosphateB temperature factorCuIPc high-pH form of reduced plastocyaninCuIIPc oxidised plastocyaninDAFS diffraction anomalous fine structureEPR electron paramagnetic resonancee.s.d. estimated standard deviationEXAFS X-ray absorption fine structureHCuIPc low-pH form of reduced plastocyaninLb leghemoglobinMb myoglobinMIR multiple isomorphous replacementNMR nuclear magnetic resonancePc plastocyaninPi inorganic phosphate (PO4
3-)r.m.s. root mean squareSSRL Stanford Synchrotron Radiation LaboratoryXAFS X-ray absorption fine structureXAS X-ray absorption spectroscopyXRD X-ray diffraction

xiii
List of FiguresPage
Figure 1.1 The K X-ray absorption edge of CuO. 1
Figure 1.2 K-edge EXAFS from CuO. 2
Figure 1.3 A photoelectron wave emitted from the absorbing atom is 3
back-scattered by a scattering atom.
Figure 1.4 Generation of the monochromatic X-ray beam. 5
Figure 1.5 Typical apparatus for a transmission XAS experiment. 6
Figure 1.6 Typical apparatus for a fluorescence XAS experiment. 7
Figure 1.7 Typical apparatus used in collecting polarised XAS data from oriented 8
single crystals.
Figure 1.8 The K X-ray absorption edge of CuO and the background absorbance 9
estimated by fitting a quadratic curve to the absorbance between
8479 eV and 8928 eV.
Figure 1.9 Normalised K X-ray absorption edge of CuO and the featureless 10
background edge absorbance estimated using a polynomial spline curve.
Figure 1.10 Difference between the normalised K-edge absorption from CuO and 11
the featureless background edge absorbance estimated using a
polynomial spline curve.
Figure 1.11 Normalised absorbance calculated using expression (1.13) compared to 12
the normalised K-edge absorbance of CuO.
Figure 1.12 K-edge EXAFS from CuO. 12
Figure 2.1 Fourier filtering in XFIT. 19

xiv
Figure 2.2 Schematic representation of the Monte-Carlo error analysis of 25
three parameters.
Figure 3.1 Schematic representation of photosynthetic electron transport at the 30
thylakoid membrane.
Figure 3.2 Stereo α-carbon diagram of Pc. 31
Figure 3.3 The Cu site of CuIIPc as determined by XRD at 1.33 Å. 32
Figure 3.4 The Cu site of HCuIPc at pH 3.8 as determined by XRD at 1.9 Å. 32
Figure 3.5 Cu-ligand distances in Pc as determined by X-ray diffraction plotted 34
as functions of pH and oxidation state.
Figure 5.1 Models used in the multiple-scattering EXAFS analyses of Pc. 43
Figure 5.2 Ideal geometry of the ligand sidechains. 44
Figure 5.3 EXAFS window used with the ê//c-polarised EXAFS from 49
reduced Pc at pH 7.2.
Figure 5.4 The Fourier-transform window used with every data set. 50
Figure 6.1 Cu-ligand distances from the multiple-scattering analyses of EXAFS 55
from an oriented single crystal of CuIIPc as functions of the EXAFS
weighting factor.
Figure 6.2 R-factors for the fit between the calculated EXAFS and the observed 55
EXAFS from an oriented single crystal of CuIIPc as functions of the
EXAFS weighting factor.
Figure 6.3 ê//b-polarised EXAFS from CuIIPc and the difference between the 56
observed and calculated EXAFS for each refinement.
xv
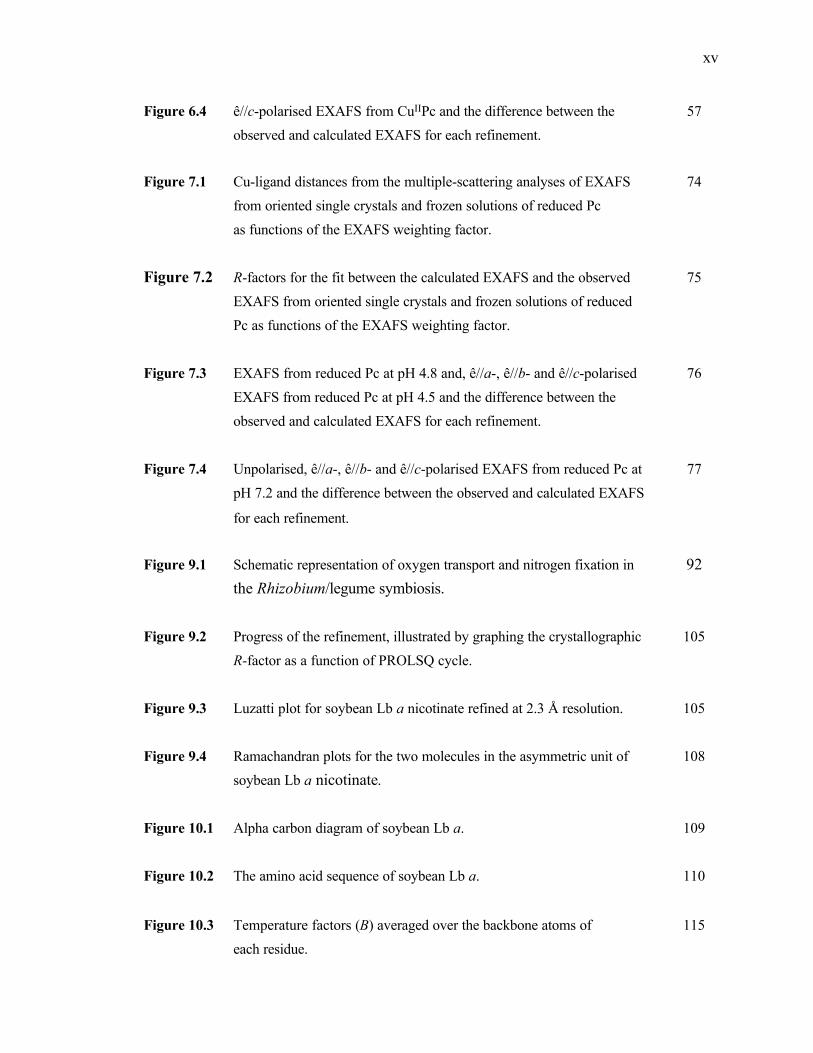
Figure 6.4 ê//c-polarised EXAFS from CuIIPc and the difference between the 57
observed and calculated EXAFS for each refinement.
Figure 7.1 Cu-ligand distances from the multiple-scattering analyses of EXAFS 74
from oriented single crystals and frozen solutions of reduced Pc
as functions of the EXAFS weighting factor.
Figure 7.2 R-factors for the fit between the calculated EXAFS and the observed 75
EXAFS from oriented single crystals and frozen solutions of reduced
Pc as functions of the EXAFS weighting factor.
Figure 7.3 EXAFS from reduced Pc at pH 4.8 and, ê//a-, ê//b- and ê//c-polarised 76
EXAFS from reduced Pc at pH 4.5 and the difference between the
observed and calculated EXAFS for each refinement.
Figure 7.4 Unpolarised, ê//a-, ê//b- and ê//c-polarised EXAFS from reduced Pc at 77
pH 7.2 and the difference between the observed and calculated EXAFS
for each refinement.
Figure 9.1 Schematic representation of oxygen transport and nitrogen fixation in 92the Rhizobium/legume symbiosis.
Figure 9.2 Progress of the refinement, illustrated by graphing the crystallographic 105
R-factor as a function of PROLSQ cycle.
Figure 9.3 Luzatti plot for soybean Lb a nicotinate refined at 2.3 Å resolution. 105
Figure 9.4 Ramachandran plots for the two molecules in the asymmetric unit of 108
soybean Lb a nicotinate.
Figure 10.1 Alpha carbon diagram of soybean Lb a. 109
Figure 10.2 The amino acid sequence of soybean Lb a. 110
Figure 10.3 Temperature factors (B) averaged over the backbone atoms of 115
each residue.

xvi
Figure 10.4 Protoporphyrin IX, viewed from the distal side of the heme pocket. 116
Figure 10.5 Nicotinate ligand. 116
Figure 10.6 The heme pocket of molecule A. 118
Figure 10.7 The heme pocket of molecule A showing all residues with 118
contacts ≤ 4.0 Å with the heme or nicotinate.
Figure 10.8 Superposed heme pockets of molecules A and B. 119
Figure 10.9 Hydrogen bonding to the heme ligands in molecule A. 120
Figure 11.1 The three residues within 4.0 Å of the bound O2 in sperm whale MbO2. 125
Figure 11.2 The E7/E10 pathway in Mb imidazole. 126
Figure 11.3 Hindrance of the heme NA and NC atoms by proximal histidine 130
imidazole Hε1 and Hδ2 atoms resulting from eclipsing of NA−NC by
the imidazole plane.
Figure 11.4 Superposition of lupin Lb II and sperm whale Mb. 135
Figure 11.5 Effect of the deletion of Arg CD3 on the mobility of the distal histidine. 136
Figure 11.6 The sidechain of the distal histidine relative to the heme in lupin Lb II 137
nicotinate and lupin deoxyLb II.
Figure 11.7 Superposed backbones of lupin deoxyLb II and lupin Lb II nicotinate. 138
Figure 11.8 Distance from Cα atoms of lupin FeIII Lb II nicotinate to the 138
corresponding atoms in the deoxy structure.
Figure 11.9 Distances from the Cα atoms of MbO2 and LbO2 to the corresponding 139
atoms in the deoxy structures.

xvii
Figure 11.10 Superposition of the residues potentially contacting an O2 ligand in 142
lupin Lb II and sperm whale Mb.
Figure 11.11 Heme ruffling in lupin Lb II nicotinate. 145
Figure 11.12 Vinyl groups of the heme in lupin Lb II and nearby sidechains. 147
Figure 12.1 Superposition of soybean Lb a nicotinate and sperm whale Mb 150
imidazole.
Figure 12.2 Imidazole positions required for hydrogen bonding between the distal 150
histidine and a nicotinate or fluoride ligand in soybean Lb a.
Figure 12.3 Superposed heme groups of soybean Lb a nicotinate and 151
lupin Lb II nicotinate.
Figure 12.4 Vinyl groups of the heme in soybean Lb a and nearby sidechains. 152
Figure 12.5 The E7/E10 and alternate pathways in soybean Lb a nicotinate. 154
Figure 12.6 Superposition of soybean Lb a nicotinate and lupin Lb II nicotinate. 155
xviii
List of TablesPage
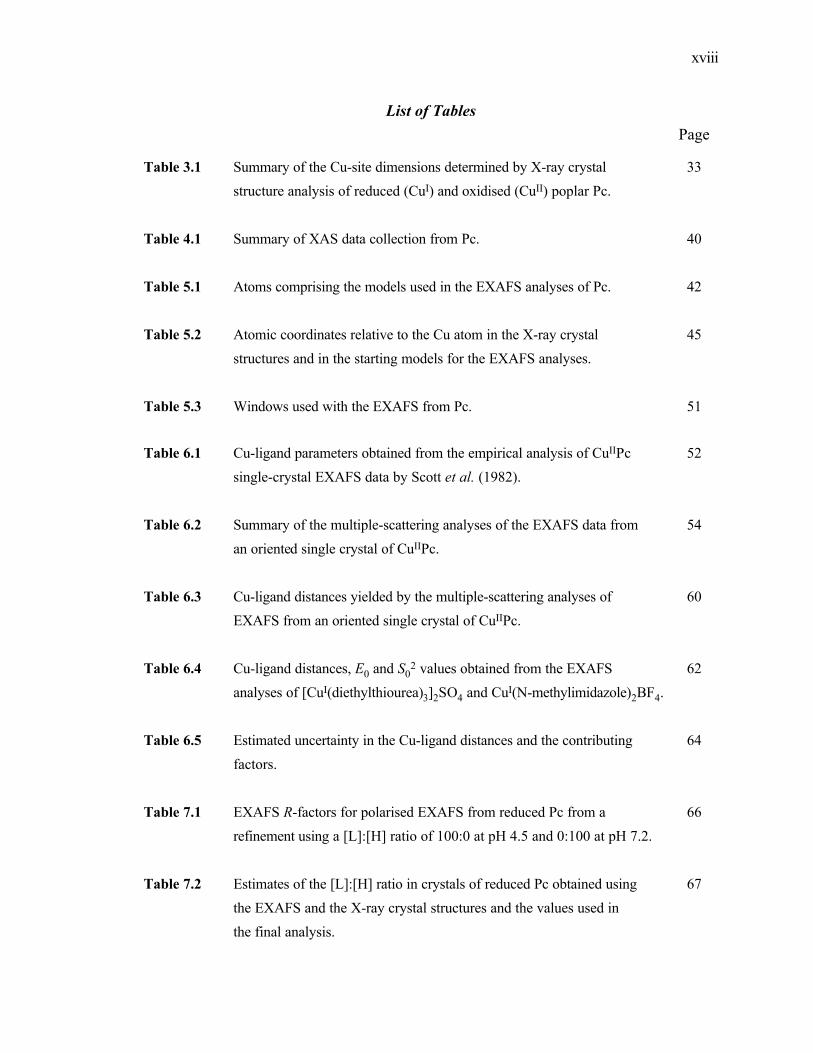
Table 3.1 Summary of the Cu-site dimensions determined by X-ray crystal 33
structure analysis of reduced (CuI) and oxidised (CuII) poplar Pc.
Table 4.1 Summary of XAS data collection from Pc. 40
Table 5.1 Atoms comprising the models used in the EXAFS analyses of Pc. 42
Table 5.2 Atomic coordinates relative to the Cu atom in the X-ray crystal 45
structures and in the starting models for the EXAFS analyses.
Table 5.3 Windows used with the EXAFS from Pc. 51
Table 6.1 Cu-ligand parameters obtained from the empirical analysis of CuIIPc 52
single-crystal EXAFS data by Scott et al. (1982).
Table 6.2 Summary of the multiple-scattering analyses of the EXAFS data from 54
an oriented single crystal of CuIIPc.
Table 6.3 Cu-ligand distances yielded by the multiple-scattering analyses of 60
EXAFS from an oriented single crystal of CuIIPc.
Table 6.4 Cu-ligand distances, E0 and S02 values obtained from the EXAFS 62
analyses of [CuI(diethylthiourea)3]2SO4 and CuI(N-methylimidazole)2BF4.
Table 6.5 Estimated uncertainty in the Cu-ligand distances and the contributing 64
factors.
Table 7.1 EXAFS R-factors for polarised EXAFS from reduced Pc from a 66
refinement using a [L]:[H] ratio of 100:0 at pH 4.5 and 0:100 at pH 7.2.
Table 7.2 Estimates of the [L]:[H] ratio in crystals of reduced Pc obtained using 67
the EXAFS and the X-ray crystal structures and the values used in
the final analysis.
xix
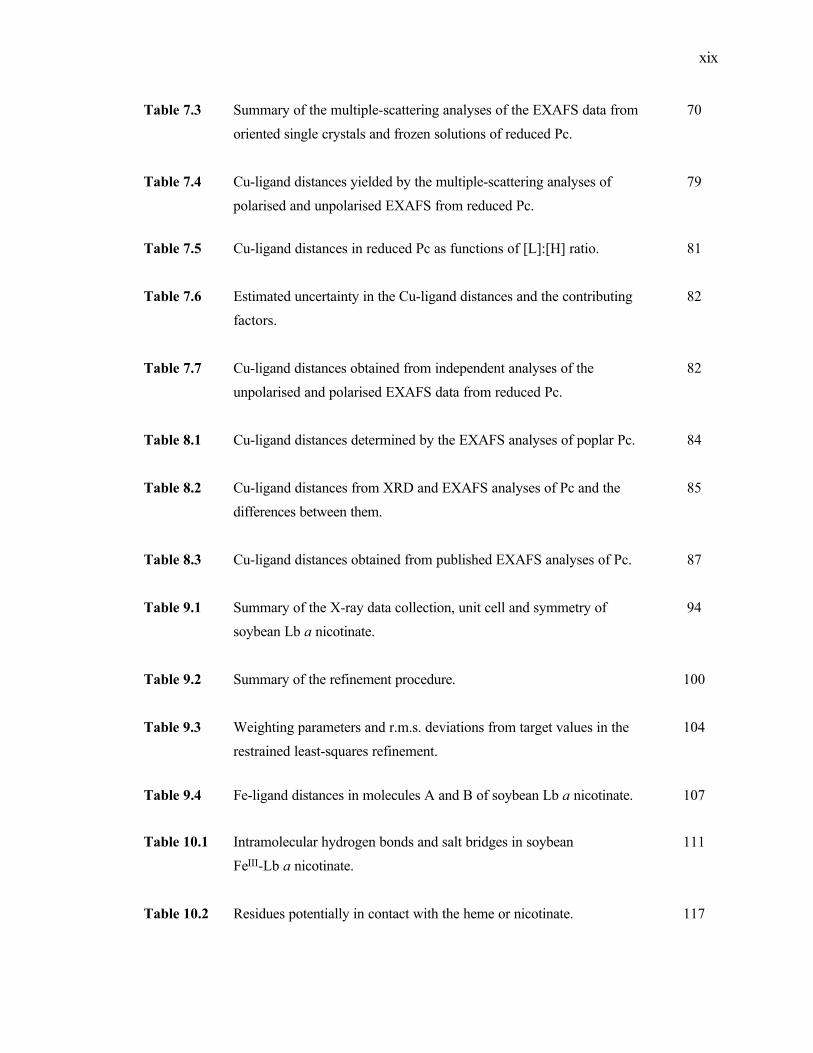
Table 7.3 Summary of the multiple-scattering analyses of the EXAFS data from 70
oriented single crystals and frozen solutions of reduced Pc.
Table 7.4 Cu-ligand distances yielded by the multiple-scattering analyses of 79
polarised and unpolarised EXAFS from reduced Pc.
Table 7.5 Cu-ligand distances in reduced Pc as functions of [L]:[H] ratio. 81
Table 7.6 Estimated uncertainty in the Cu-ligand distances and the contributing 82
factors.
Table 7.7 Cu-ligand distances obtained from independent analyses of the 82
unpolarised and polarised EXAFS data from reduced Pc.
Table 8.1 Cu-ligand distances determined by the EXAFS analyses of poplar Pc. 84
Table 8.2 Cu-ligand distances from XRD and EXAFS analyses of Pc and the 85
differences between them.
Table 8.3 Cu-ligand distances obtained from published EXAFS analyses of Pc. 87
Table 9.1 Summary of the X-ray data collection, unit cell and symmetry of 94
soybean Lb a nicotinate.
Table 9.2 Summary of the refinement procedure. 100
Table 9.3 Weighting parameters and r.m.s. deviations from target values in the 104
restrained least-squares refinement.
Table 9.4 Fe-ligand distances in molecules A and B of soybean Lb a nicotinate. 107
Table 10.1 Intramolecular hydrogen bonds and salt bridges in soybean 111
FeIII-Lb a nicotinate.
Table 10.2 Residues potentially in contact with the heme or nicotinate. 117

xx
Table 11.1 Crystallographically-characterised derivatives of lupin Lb II and 122
sperm whale Mb deposited in the Protein Data Bank.
Table 11.2 The effects of specific structural changes on the rate constants for 124
O2 binding and diffusion in sperm whale Mb.
Table 11.3 Expected effects of the structural differences between sperm whale 132
Mb and lupin Lb II on the rate constants for O2 diffusion and binding.
Table 11.4 Volume of the distal cavities of lupin Lb II and sperm whale Mb. 134
Table 11.5 Difference between the distance from the Cα atom of the proximal 140
histidine to the Cα atom of the distal histidine and the corresponding
distance in the deoxy state for derivatives of lupin Lb II and sperm
whale Mb.
Table 11.6 Distance from the terminal methyl atom Cγ2 of Val E11 to the binding 143
site in lupin Lb II and sperm whale Mb for the FeII deoxy, O2 and CO
derivatives.
Table 11.7 Displacement of FeII and proximal histidine Nε2 from the heme plane 145
in the deoxy, O2 and CO forms of Mb and Lb.
Table 11.8 Monomeric hemoglobins with ruffled hemes. 146
Table 12.1 Overall association (k'O2) and dissociation (kO2) rate constants, and 155
dissociation constant (KO2) for O2 binding to soybean Lb a,
lupin Lb II and sperm whale Mb at pH 7.0.

xxi
Summary
EXAFS analysis using the program XFIT
XFIT is an interactive and user-friendly program for the analysis of X-ray absorption finestructure (EXAFS) curves. XFIT incorporates in a single package a number of featuresavailable in other existing programs: ab initio EXAFS calculation (using FEFF4.06/6.01), empirical EXAFS calculation (as in XFPAKG), allowance for polarisation, useof Fourier filtering and the application of constraints and restraints. Additional featuresnot previously available are: simultaneous refinement with respect to several data sets,simultaneous refinement of several absorber sites and Monte-Carlo error analysis.Applications including the analysis of EXAFS data from mixtures and the analysis ofDAFS (diffraction anomalous fine structure) data are indicated.
Analysis of polarised and unpolarised EXAFS from poplar plastocyanin
Poplar plastocyanin (Pc) is a small (99 amino acid, 10 kDa) Cu protein involved in thephotosynthetic electron-transfer chain. The Cu-ligand distances in oxidised Pc (CuIIPc)and reduced Pc at high and low pH (CuIPc and HCuIPc) have been determined bymultiple-scattering analysis of EXAFS from oriented single crystals of oxidised Pc, fromoriented single crystals of reduced Pc at pH 4.5 and 7.2, and from frozen solutions ofreduced Pc at pH 4.8 and 7.2:
Cu-ligand bond length (Å)
Cu-ligand bond CuIIPc CuIPc HCuIPc
Cu-Nδ(His37) not determined 1.96 ± 0.02 1.95 ± 0.02Cu-Nδ(His87) 1.93 ± 0.02 2.01 ± 0.04 -Cu-Sγ(Cys84) 2.13 ± 0.02 2.19 ± 0.01 2.16 ± 0.01Cu-Sδ(Met92) 2.70 ± 0.10 2.86 ± 0.10 2.33 ± 0.04
The distances obtained are internally consistent (i.e. the differences between CuIIPc, CuIPcand HCuIPc are consistent with expectation). Although the CuIIPc distances differsignificantly from the crystallographic values, a detailed investigation of possible errors inthe EXAFS analysis failed to find any explanation for the discrepancy.

xxii
Crystal structure of soybean leghemoglobin a nicotinate
Soybean leghemoglobin (Lb) a is a small (143 amino acid, 16 kDa) protein facilitating thetransport of O2 to respiring N2-fixing bacteria at low free-O2 tension. The crystalstructure of soybean Lb a nicotinate has been refined at 2.3 Å resolution. The finalcrystallographic R factor is 15.8%. This structure provides strong support for theconclusion drawn from a comparison of lupin Lb II with sperm whale myoglobin that theunique properties of Lb arise principally from a heme pocket considerably larger and moreflexible than that of myoglobin, a strongly ruffled heme group, and a proximal histidineorientation more favourable to ligand binding.