structural, thermal and optical properties of pure and mn doped poly… · 2018-12-05 ·...
TRANSCRIPT
DOI: http://dx.doi.org/10.1590/1980-5373-MR-2016-0239Materials Research. 2016; 19(5): 1167-1175 © 2016
Structural, Thermal and Optical Properties of Pure and Mn2+ Doped Poly(Vinyl Chloride) Films
Bhagyasree Kayyarapua, Madhava Kumar Y.a, Hussain Basha Mohommada, Gopal Neeruganti O.a,
Ramu Chekuria*
Received: March 22, 2016; Revised: July 20, 2016; Accepted: August 11, 2016
Pure and Mn2+ doped poly(vinyl chloride) (PVC) polymer films were prepared using the solution cast technique. The prepared samples have been characterized by X-ray diffraction (XRD), UV-Vis Spectroscopy (UV-Vis), Fourier transform infrared (FTIR) Spectroscopy, Thermogravimetric analysis (TGA), Differential Scanning Calorimetry (DSC), Electron Paramagnetic Resonance (EPR) and Scanning Electron Microscopy (SEM) studies. TGA/DSC analysis reveals that the sample is thermally stable upto 350 0C. The morphology of the polymer films was studied by SEM. The optical absorbance of the polymer films was measured in the 200-900 nm wavelength range. The absorption edge, direct band gap and indirect band gap have been evaluated. The FTIR spectrum exhibits several bands characteristics of stretching and bending vibrations of C - Cl, C - H, C = C and O - H groups. The EPR Spectra at room temperature were used to calculate the number of spins and paramagnetic susceptibility as a function of dopant concentration. All the Mn2+ doped PVC samples exhibit a signal centred at geff = 1.9. The observed variation in the EPR signal intensity is due to the variation in the dopant concentration. The complexation of Mn2+ ion with the polymer was confirmed by XRD studies.
Keywords: Poly(vinyl chloride), Differential scanning calorimetry, Thermogravimetric analysis
* e-mail: [email protected]
1. IntroductionRecent developments in solid state ionic conductors such
as insertion compounds, polymer electrolytes, superionic conductors, and the development of new solid state materials for electrodes have drawn keen interest from the researchers working in the area of electrical power generation and storage systems. Among these, the most recent ones are the polymer electrolytes, also known as poly electrolytes1. Polymer electrolytes are promising materials because of their wide applications in electro chromic windows, modified electrodes, sensors, super capacitors, electric vehicles, high vacuum electrochemistry, thermoelectric generators and fuel cells2,3.
Poly(vinyl chloride) (PVC) is one of the most important commercial polymers that have wide range of applications. PVC is a linear, thermoplastic and substantially amorphous polymer, with a huge commercial interest due to the accessibility to basic raw materials and its properties. It is used as thermoplastic due to its many valuable properties like low price, good process ability, chemical resistance, good mechanical strength, thermal stability and low flammability4. Currently, PVC is one of the world’s leading synthetic polymers with global consumption of above 40 million tonnes per annum5.
Chlorine – Containing polymers such as PVC are widely used in many fields, namely, water pipes, cable
insulation, floor and roof tiles, packing films and sheets due to their advantages such as non-flammable nature, good performance and low price6. However, under the influence of elevated temperature and UV radiation, PVC undergoes an autocatalytic dehydrochlorination reaction, which results in severe discoloration and loss of some propertie7. Stabilizers can inhibit the degradation or removal of HCl due to their capacity for HCl-adsorption. Although the main used thermal stabilizers are lead salts, metal soaps, organo-tin compounds and rare earth compounds8,9. These stabilizers have some drawbacks like toxicity, environmental pollution and high cost. Hence, it is necessary to explore an environmental friendly stabilizer with non-toxicity, economical interest and high efficiency.
Recently, particular attention has been devoted to introduce some structural modification in polymer electrolytes in order to increase their electrical conductivity and improve their thermal, mechanical and electrochemical properties to provide commercial acceptability in electrochemical devices10. Several researchers have reported doped polymer electrolytes with enhanced ionic conductivity in PVC based polymer electrolytes11-18. As a result, a variety of Polymer electrolytes such as Polymer-salt complexes, gel polymer electrolytes, composite polymer electrolytes and blend based polymer electrolytes have emerged. The change in the structure of polymers can be studied by doping the transition metal ions. PVC is a commercially available, inexpensive polymer and
aDepartment of Physics, Vikrama Simhapuri University PG Centre, Kavali 524201, India
kayyarapu et al.1168 Materials Research
is compatible to a large number of transition metals. We have directed our attention to PVC as a host polymer of polymer electrolytes as it is possible to achieve impressive enhancement of material properties such as increased thermal stability and improved mechanical properties compared to the pure polymers, especially when these properties depends on dopant concentration. Manganese is well known magneto-active multivalent element; thus its halides can be used as fillers to modify the electric conduction and optical absorption of polymer matrix. However, no work has been reported so far on Mn2+ doped PVC films. Hence, the authors have taken up the investigation. The major aim of this study is to investigate a wide range of the physical properties of PVC films by doping with different concentrations of Mn2+.
2. Experimental Part
Poly(vinyl chloride) (PVC) has a mean relative molecular mass of about 534,000 g/mol. PVC polymer films doped with MnSO4 in various concentrations were prepared at room temperature by solution cast method. The desired concentration of MnSO4 solutions (1, 2, 3, 4 and 5 mol%) were prepared by using distilled water. 1gram of PVC polymer is dissolved in 10 ml of tetrahydrofuran (THF) separately. Different amounts of MnSo4 solution (1, 2, 3, 4 and 5 mol%) were added into the polymer solution. The mixture solution was magnetically stirred for 10-12 hours to get homogeneous mixture and then cast onto poly propylene dishes. The film was slowly evaporated at room temperature to obtain free standing polymer film at the bottom of the dishes.
In order to investigate the nature of the polymer films, differential scanning calorimetry (DSC) measurement was carried out by a SIEKO calorimeter (DSC-220) a continuous heating rate of 10 oC/min under nitrogen atmosphere from 50 to 400 oC. The thermogravimetric analysis (TGA) was done using the SEIKO thermal analysis (TGA-20) system in the presence of nitrogen flow from 50 to 500 oC, at the heating rate of 10 oC/min. X-ray diffraction measurements were carried out using a BRUKER D8 ADVANCE diffractometer with CuKα radiation (1.5406 Å). The films were scanned at 2θ angles between 10o and 80o with a step size of 0.02o. FTIR spectra of these films were recorded using the NICOLET 5700 FTIR spectrophotometer. The spectra were taken over a wavenumber range of 400-4000 cm-1. EPR spectra were recorded at room temperature on a JEOL FEIX ESR Spectrometer operating in X-band frequency of 9.86 GHz with a field modulation of 100 KHz. The magnetic field was scanned from 0 to 5000 G. UV-Vis absorption spectra of prepared samples were recorded in the range 200-900 nm at room temperature using JASCO UV-VIS-NIR spectrophotometer (model- V.700). From the optical absorption data, the optical constants such as band edge, optical band gap (both direct and indirect) were calculated.
The morphology of the polymer films was characterized by the JEOL JSM 840A electron microscope (SEM)
3. Results and Discussions
3.1. Differential scanning calorimetry
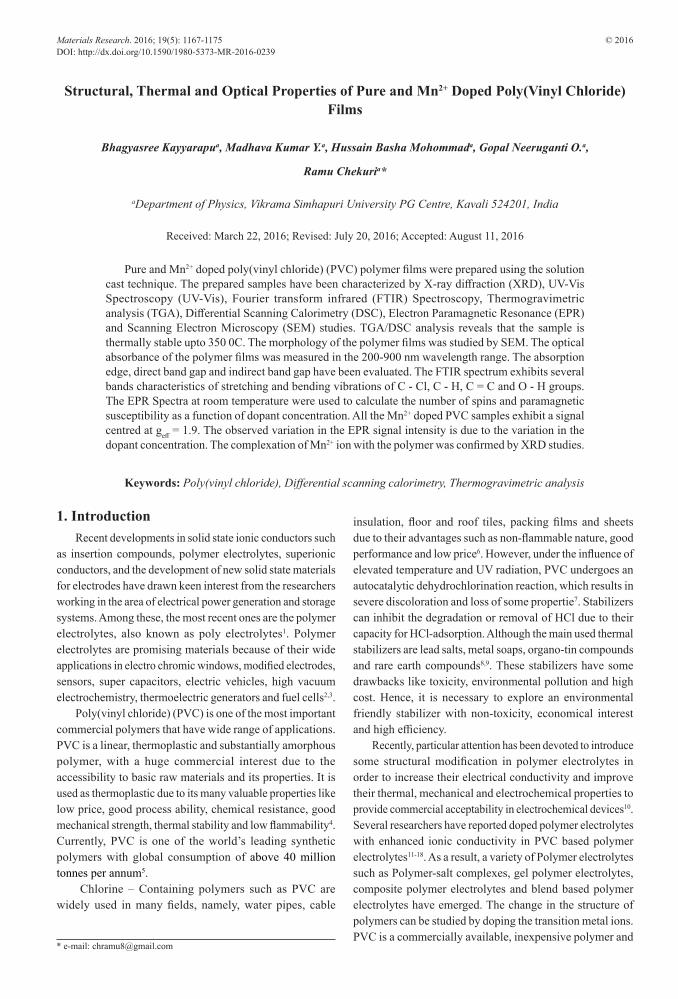
DSC is used to measure the enthalpy changes that occur in a sample as a function of temperature. Using this technique, the glass transition temperature (Tg) as well as melting temperature (Tm) and degree of crystallinity of the material can be identified. Figure 1 shows the DSC thermograms of pure and Mn2+ doped PVC films, showing a glass transition temperature at 80 oC. Louise – Anne. F et al.19 reported glass transition temperature of pure PVC around 80 oC. Earlier Janaki Rami Reddy et al20. reported glass transition temperature of 81 oC for pure PVC films. The endothermic peak observed in the samples (Figure 1 (a), (b), (c) & (d)) at 51 oC may be due to the presence of small traces of THF.
Figure 1: DSC curves of PVC polymer films containing Mn2+ (a) pure (b) 1mol% (c) 2 mol% (d) 3 mol% (e) 4 mol% (f) 5 mol%.
From Figure 1 it can be seen that all the samples exhibit only one Tg which indicates the homogeneous behaviour of polymer film21. An endothermic peak has been observed around 280 oC and 300 oC for pure, and Mn2+ doped PVC films respectively, which corresponds to the dehydrochlorination of PVC. A slight shift of Tm towards higher temperature on the addition of Mn2+ ions to the polymer reveals the disruption of crystallinity of the polymer21. On increasing doping concentration, the broadening of the melting endothermic peak is a clear indication of decrease in the degree of crystallinity and dominant presence of amorphous phase22. This clearly indicates that the micro movement of the PVC chain becomes easier by the addition of the Mn2+ ions, presumably owing to the decrease in crystallinity of these polymers. This establishes polar attractive forces between the ions and the chain segments thereby increasing the

1169Structural, Thermal and Optical Properties of Pure and Mn2+ Doped Poly(Vinyl Chloride) Films
segmental mobility. The melting temperature (Tm) is taken at the apex of the melting endothermic peak as shown in Figure 1 the point where the polymer gets completely melted. The melting temperature (Tm) of Mn2+ doped (1 and 2 mol%) PVC shifted to higher temperatures. The highering of Tm upon Mn2+ addition is due to the increase in spherulite sizes and their surface free energy. When Mn2+ concentration further increases Tm is lowered, due to the suppression of crystallites, there by increasing the amorphous content in the polymer. As a result of more flexible amorphous environment getting trapped in or adjacent to the crystalline matrix, the suppressed crystalline portion of the Mn2+ doped PVC melts probably at lower temperatures. The smaller crystallites, due to the presence of Mn2+, are less stiff to give a low Tm and consequently the amorphous phase become more flexible23.
3.2. Thermogravimetric Analysis
Thermogravimetric analysis (TGA) is one of the powerful tools in determining the stability of polymer and its dopants. TGA is the most widely used thermal method. It is based on the measurement of mass loss of material as a function of temperature or time in a controlled atmosphere. In thermogravimetric a continuous graph of mass change against temperature is obtained when a substance is heated at a uniform rate or kept at constant temperature. Two types of thermal decomposition processes are usually recognized in polymers, chain de-polymerization and random decomposition. Chain de-polymerization is the release of monomer units from a chain end or at a weak link and is essentially the reverse process of polymerization. It is often called de-propagation or unzipping. Random degradation occurs by chain rupture at random points along the chain, giving a disperse mixture of fragments. Both processes cause sample mass losses at certain high temperatures.
Figure 2 shows the TGA curves of pure and Mn2+ doped PVC films at different concentrations (1, 2, 3, 4 and 5 mol%). Thermal stability is represented by the weight loss of the sample after heating over the temperature range 40-400 oC. Analysis of TGA curves reveals that there are three distinct steps of degradation. A first degradation was observed from 60 to 90 oC with a weight loss of 5% which may be due to THF evaporation. The weight loss curves showed degradation of samples above 260 oC in two steps. The major degradation in the temperature range 260-310 oC is attributed to dehydrochlorination24. Molecular reaction and radical propagation reactions become more probable and contribute to the cleavage of C - Cl bond. At temperature higher than 310 oC the chain radical mechanism becomes relevant and the melting of C - C or C - H bonds takes place. The degradation temperature increases with increasing dopant concentration. Probably, the presence of manganese strengthens the van der waals interactions between the PVC chains, which leads to increased decomposition temperature. The source of the incomplete decomposition at high dopant content is not clear, but is believed to be associated with the Cl ̶ anion containing backbone25,26.
Figure 2: dTG curves of PVC polymer films containing Mn2+ (a) pure (b) 1mol% (c) 2 mol% (d) 3 mol% (e) 4 mol% (f) 5 mol%.
3.3. X-ray diffraction analysis
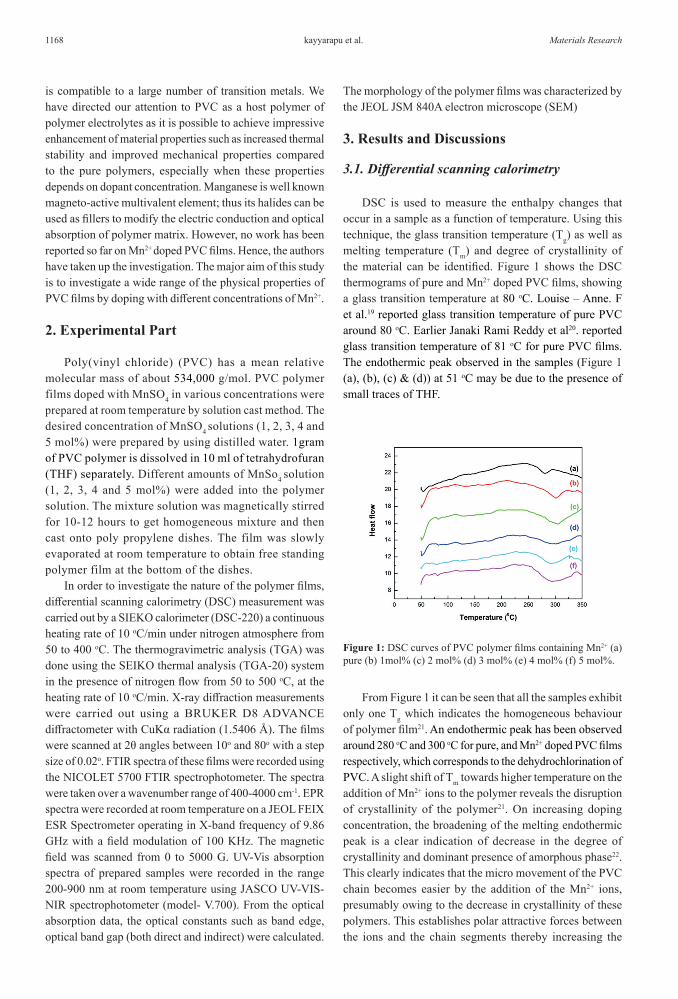
XRD patterns of pure PVC and Mn2+ doped films are shown in Figure 3. PVC exhibits a maximum intensity peak at 12o, next peak at 25o and a relatively less intense peak at 41o respectively. Peak at 12o for pure PVC has slightly shifted in doped polymer films. This indicates that the addition of Mn2+causes a decrease in the degree of crystallinity and a simultaneous increase in the amorphicity of the doped films. The comparative study reveals that the intensity of all crystalline peaks of PVC decreases gradually upon the addition of Mn2+ ions to the polymer. But in 5 mol% Mn2+ ion doped film, the intensity has decreased compared to values from 1 to 4 mol%. This could be due to the disruption of the semi crystalline structure of the film by Mn2+ ions. When MnSo4 dissolves in the polymer, the interaction between PVC and Mn2+ leads to a decrease of the intermolecular interaction among the polymer chains which reduces the crystalline phase and hence increases the amorphous region. The relative intensities of peaks of PVC at around 15o and 25o with 5 mol% Mn2+ are different from those of pure PVC, which indicates that the dopant inhibits the orientation of PVC crystallites preferentially in certain directions27. Hence 5 mol% is considered to be optimum value with the concentration. This amorphous nature results in greater ionic diffusivity with a high ionic conductivity which can be obtained in amorphous polymer that have flexible back bone28. The low intensity broad peaks observed around 25o
and 41o which are attributed to the amorphous nature of PVC29-31. The sample with 1 mol% Mn2+, the intensity of the peak observed at 12o has been increased, which may be due to increased crystallanity. These observation confirm that the present polymer possesses both crystalline and amorphous regions.
3.4. Fourier Transform Infrared Spectroscopy
FTIR is a technique used to obtain information about the chemical bonding in a material. It is used to identify the elemental constituents of a material. FTIR spectra of pure
kayyarapu et al.1170 Materials Research
Figure 3: XRD patterns of PVC polymer films containing Mn2+
(a) pure (b) 1mol% (c) 2mol% (d) 3 mol% (e) 4 mol% (f) 5 mol%.
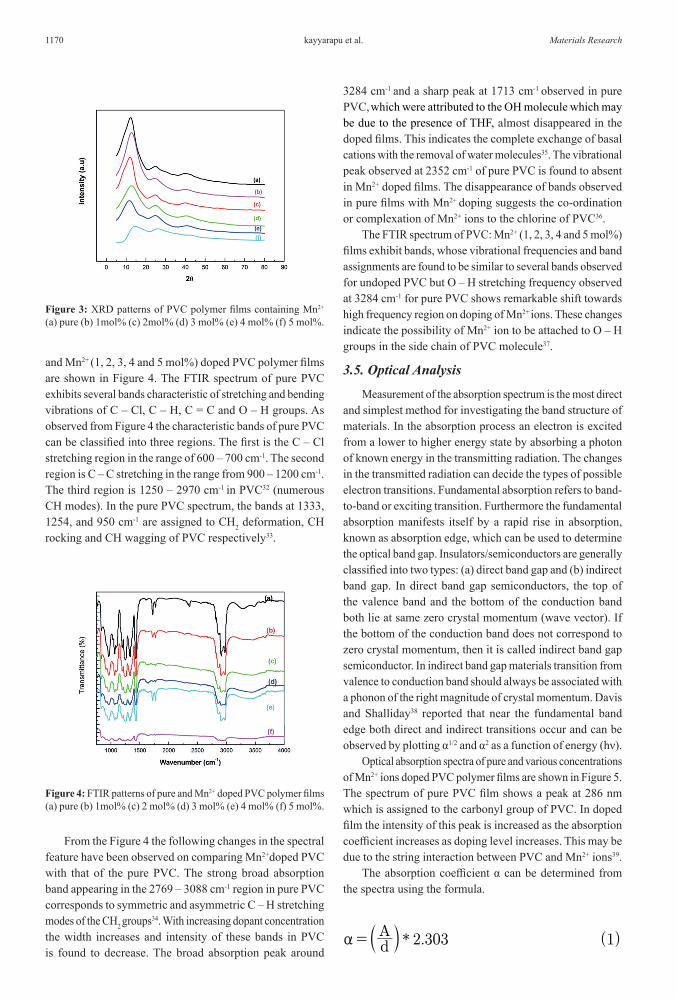
and Mn2+ (1, 2, 3, 4 and 5 mol%) doped PVC polymer films are shown in Figure 4. The FTIR spectrum of pure PVC exhibits several bands characteristic of stretching and bending vibrations of C – Cl, C – H, C = C and O – H groups. As observed from Figure 4 the characteristic bands of pure PVC can be classified into three regions. The first is the C – Cl stretching region in the range of 600 – 700 cm-1. The second region is C – C stretching in the range from 900 – 1200 cm-1. The third region is 1250 – 2970 cm-1 in PVC32 (numerous CH modes). In the pure PVC spectrum, the bands at 1333, 1254, and 950 cm-1 are assigned to CH2 deformation, CH rocking and CH wagging of PVC respectively33.
Figure 4: FTIR patterns of pure and Mn2+ doped PVC polymer films (a) pure (b) 1mol% (c) 2 mol% (d) 3 mol% (e) 4 mol% (f) 5 mol%.
From the Figure 4 the following changes in the spectral feature have been observed on comparing Mn2+doped PVC with that of the pure PVC. The strong broad absorption band appearing in the 2769 – 3088 cm-1 region in pure PVC corresponds to symmetric and asymmetric C – H stretching modes of the CH2 groups34. With increasing dopant concentration the width increases and intensity of these bands in PVC is found to decrease. The broad absorption peak around
3284 cm-1 and a sharp peak at 1713 cm-1 observed in pure PVC, which were attributed to the OH molecule which may be due to the presence of THF, almost disappeared in the doped films. This indicates the complete exchange of basal cations with the removal of water molecules35. The vibrational peak observed at 2352 cm-1 of pure PVC is found to absent in Mn2+ doped films. The disappearance of bands observed in pure films with Mn2+ doping suggests the co-ordination or complexation of Mn2+ ions to the chlorine of PVC36.
The FTIR spectrum of PVC: Mn2+ (1, 2, 3, 4 and 5 mol%) films exhibit bands, whose vibrational frequencies and band assignments are found to be similar to several bands observed for undoped PVC but O – H stretching frequency observed at 3284 cm-1 for pure PVC shows remarkable shift towards high frequency region on doping of Mn2+ ions. These changes indicate the possibility of Mn2+ ion to be attached to O – H groups in the side chain of PVC molecule37.
3.5. Optical Analysis
Measurement of the absorption spectrum is the most direct and simplest method for investigating the band structure of materials. In the absorption process an electron is excited from a lower to higher energy state by absorbing a photon of known energy in the transmitting radiation. The changes in the transmitted radiation can decide the types of possible electron transitions. Fundamental absorption refers to band-to-band or exciting transition. Furthermore the fundamental absorption manifests itself by a rapid rise in absorption, known as absorption edge, which can be used to determine the optical band gap. Insulators/semiconductors are generally classified into two types: (a) direct band gap and (b) indirect band gap. In direct band gap semiconductors, the top of the valence band and the bottom of the conduction band both lie at same zero crystal momentum (wave vector). If the bottom of the conduction band does not correspond to zero crystal momentum, then it is called indirect band gap semiconductor. In indirect band gap materials transition from valence to conduction band should always be associated with a phonon of the right magnitude of crystal momentum. Davis and Shalliday38 reported that near the fundamental band edge both direct and indirect transitions occur and can be observed by plotting α1/2 and α2 as a function of energy (hν).
Optical absorption spectra of pure and various concentrations of Mn2+ ions doped PVC polymer films are shown in Figure 5. The spectrum of pure PVC film shows a peak at 286 nm which is assigned to the carbonyl group of PVC. In doped film the intensity of this peak is increased as the absorption coefficient increases as doping level increases. This may be due to the string interaction between PVC and Mn2+ ions39.
The absorption coefficient α can be determined from the spectra using the formula.
* . ( )dA 2 303 1a = S X
1171Structural, Thermal and Optical Properties of Pure and Mn2+ Doped Poly(Vinyl Chloride) Films
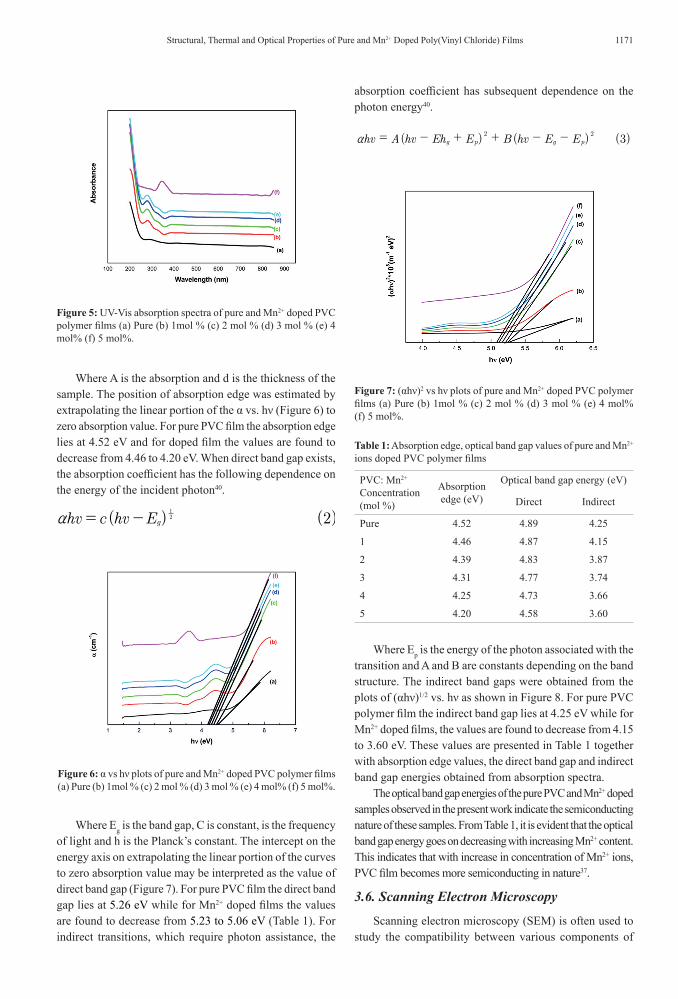
Figure 5: UV-Vis absorption spectra of pure and Mn2+ doped PVC polymer films (a) Pure (b) 1mol % (c) 2 mol % (d) 3 mol % (e) 4 mol% (f) 5 mol%.
Where A is the absorption and d is the thickness of the sample. The position of absorption edge was estimated by extrapolating the linear portion of the α vs. hν (Figure 6) to zero absorption value. For pure PVC film the absorption edge lies at 4.52 eV and for doped film the values are found to decrease from 4.46 to 4.20 eV. When direct band gap exists, the absorption coefficient has the following dependence on the energy of the incident photon40.
( ) ( )hv c hv E 2g21
a = -
Figure 6: α vs hν plots of pure and Mn2+ doped PVC polymer films (a) Pure (b) 1mol % (c) 2 mol % (d) 3 mol % (e) 4 mol% (f) 5 mol%.
Where Eg is the band gap, C is constant, is the frequency of light and h is the Planck’s constant. The intercept on the energy axis on extrapolating the linear portion of the curves to zero absorption value may be interpreted as the value of direct band gap (Figure 7). For pure PVC film the direct band gap lies at 5.26 eV while for Mn2+ doped films the values are found to decrease from 5.23 to 5.06 eV (Table 1). For indirect transitions, which require photon assistance, the
absorption coefficient has subsequent dependence on the photon energy40.
( ) ( ) ( )hv A hv Eh E B hv E E 3g p g p2 2
a = - + + - -
Figure 7: (αhν)2 vs hν plots of pure and Mn2+ doped PVC polymer films (a) Pure (b) 1mol % (c) 2 mol % (d) 3 mol % (e) 4 mol% (f) 5 mol%.
Table 1: Absorption edge, optical band gap values of pure and Mn2+ ions doped PVC polymer films
PVC: Mn2+ Concentration (mol %)
Absorption edge (eV)
Optical band gap energy (eV)
Direct Indirect
Pure 4.52 4.89 4.25
1 4.46 4.87 4.15
2 4.39 4.83 3.87
3 4.31 4.77 3.74
4 4.25 4.73 3.66
5 4.20 4.58 3.60
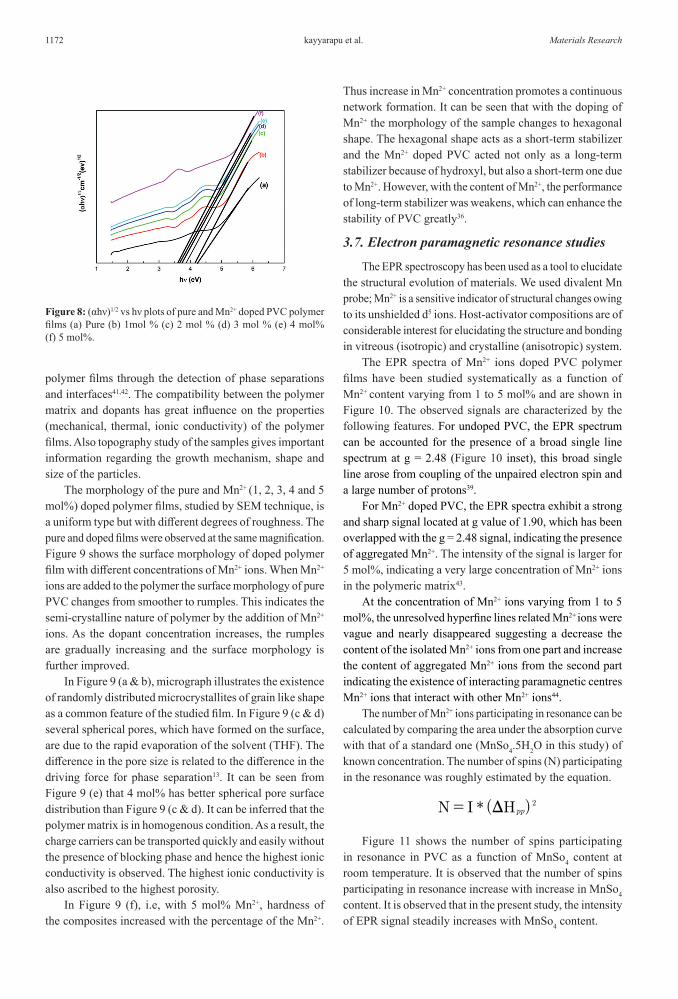
Where Ep is the energy of the photon associated with the transition and A and B are constants depending on the band structure. The indirect band gaps were obtained from the plots of (αhν)1/2 vs. hν as shown in Figure 8. For pure PVC polymer film the indirect band gap lies at 4.25 eV while for Mn2+ doped films, the values are found to decrease from 4.15 to 3.60 eV. These values are presented in Table 1 together with absorption edge values, the direct band gap and indirect band gap energies obtained from absorption spectra.
The optical band gap energies of the pure PVC and Mn2+ doped samples observed in the present work indicate the semiconducting nature of these samples. From Table 1, it is evident that the optical band gap energy goes on decreasing with increasing Mn2+ content. This indicates that with increase in concentration of Mn2+ ions, PVC film becomes more semiconducting in nature37.
3.6. Scanning Electron Microscopy
Scanning electron microscopy (SEM) is often used to study the compatibility between various components of
kayyarapu et al.1172 Materials Research
Figure 8: (αhν)1/2 vs hν plots of pure and Mn2+ doped PVC polymer films (a) Pure (b) 1mol % (c) 2 mol % (d) 3 mol % (e) 4 mol% (f) 5 mol%.
polymer films through the detection of phase separations and interfaces41,42. The compatibility between the polymer matrix and dopants has great influence on the properties (mechanical, thermal, ionic conductivity) of the polymer films. Also topography study of the samples gives important information regarding the growth mechanism, shape and size of the particles.
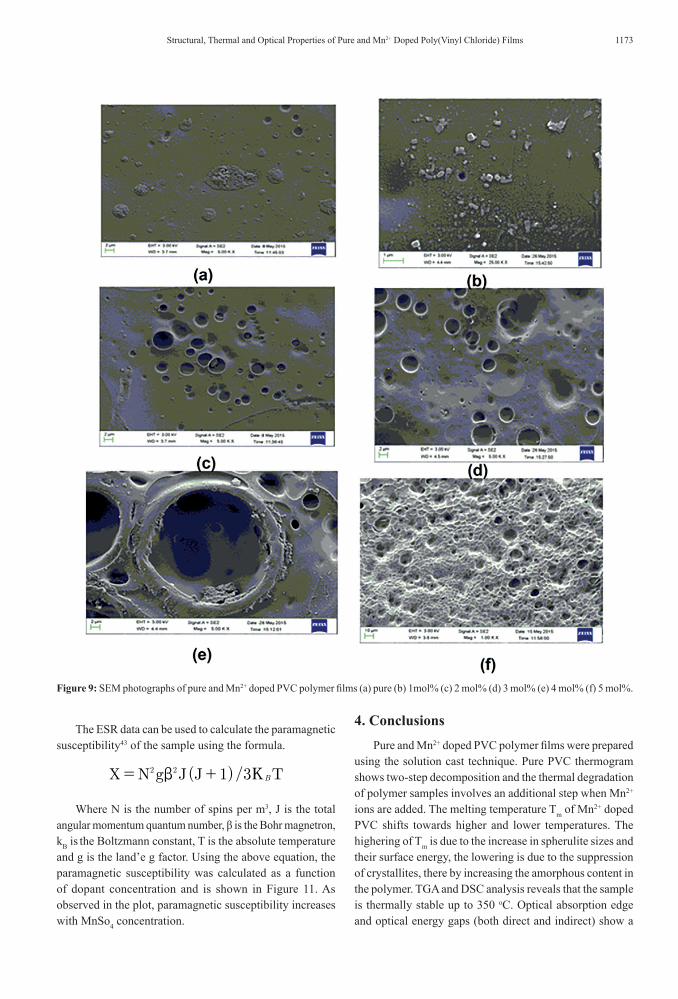
The morphology of the pure and Mn2+ (1, 2, 3, 4 and 5 mol%) doped polymer films, studied by SEM technique, is a uniform type but with different degrees of roughness. The pure and doped films were observed at the same magnification. Figure 9 shows the surface morphology of doped polymer film with different concentrations of Mn2+ ions. When Mn2+ ions are added to the polymer the surface morphology of pure PVC changes from smoother to rumples. This indicates the semi-crystalline nature of polymer by the addition of Mn2+ ions. As the dopant concentration increases, the rumples are gradually increasing and the surface morphology is further improved.
In Figure 9 (a & b), micrograph illustrates the existence of randomly distributed microcrystallites of grain like shape as a common feature of the studied film. In Figure 9 (c & d) several spherical pores, which have formed on the surface, are due to the rapid evaporation of the solvent (THF). The difference in the pore size is related to the difference in the driving force for phase separation13. It can be seen from Figure 9 (e) that 4 mol% has better spherical pore surface distribution than Figure 9 (c & d). It can be inferred that the polymer matrix is in homogenous condition. As a result, the charge carriers can be transported quickly and easily without the presence of blocking phase and hence the highest ionic conductivity is observed. The highest ionic conductivity is also ascribed to the highest porosity.
In Figure 9 (f), i.e, with 5 mol% Mn2+, hardness of the composites increased with the percentage of the Mn2+.
Thus increase in Mn2+ concentration promotes a continuous network formation. It can be seen that with the doping of Mn2+ the morphology of the sample changes to hexagonal shape. The hexagonal shape acts as a short-term stabilizer and the Mn2+ doped PVC acted not only as a long-term stabilizer because of hydroxyl, but also a short-term one due to Mn2+. However, with the content of Mn2+, the performance of long-term stabilizer was weakens, which can enhance the stability of PVC greatly36.
3.7. Electron paramagnetic resonance studies
The EPR spectroscopy has been used as a tool to elucidate the structural evolution of materials. We used divalent Mn probe; Mn2+ is a sensitive indicator of structural changes owing to its unshielded d5 ions. Host-activator compositions are of considerable interest for elucidating the structure and bonding in vitreous (isotropic) and crystalline (anisotropic) system.
The EPR spectra of Mn2+ ions doped PVC polymer films have been studied systematically as a function of Mn2+ content varying from 1 to 5 mol% and are shown in Figure 10. The observed signals are characterized by the following features. For undoped PVC, the EPR spectrum can be accounted for the presence of a broad single line spectrum at g = 2.48 (Figure 10 inset), this broad single line arose from coupling of the unpaired electron spin and a large number of protons39.
For Mn2+ doped PVC, the EPR spectra exhibit a strong and sharp signal located at g value of 1.90, which has been overlapped with the g = 2.48 signal, indicating the presence of aggregated Mn2+. The intensity of the signal is larger for 5 mol%, indicating a very large concentration of Mn2+ ions in the polymeric matrix43.
At the concentration of Mn2+ ions varying from 1 to 5 mol%, the unresolved hyperfine lines related Mn2+ ions were vague and nearly disappeared suggesting a decrease the content of the isolated Mn2+ ions from one part and increase the content of aggregated Mn2+ ions from the second part indicating the existence of interacting paramagnetic centres Mn2+ ions that interact with other Mn2+ ions44.
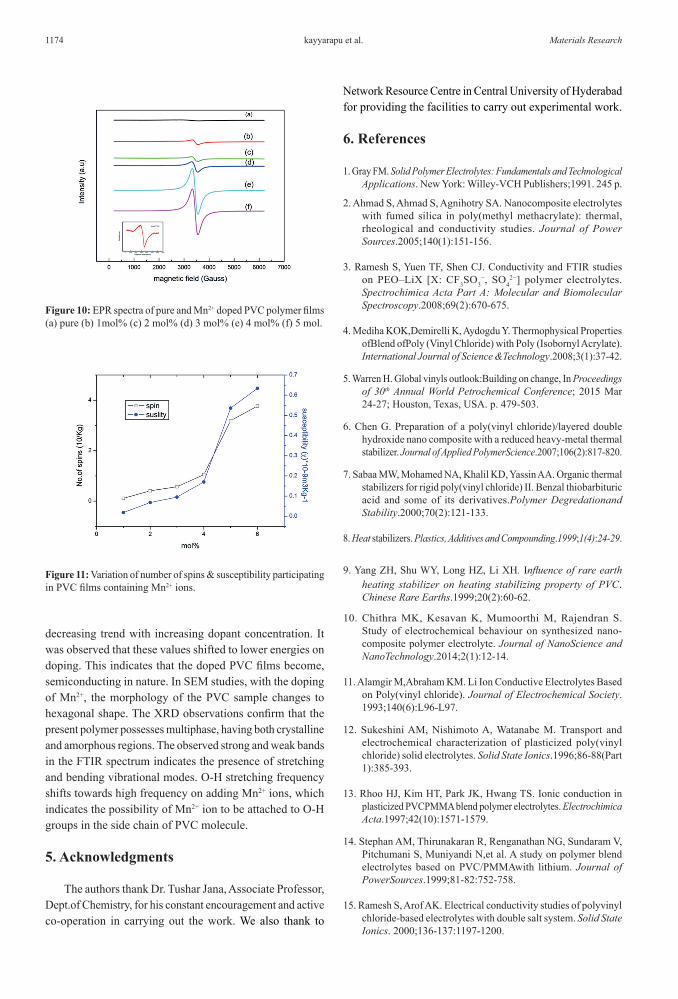
The number of Mn2+ ions participating in resonance can be calculated by comparing the area under the absorption curve with that of a standard one (MnSo4.5H2O in this study) of known concentration. The number of spins (N) participating in the resonance was roughly estimated by the equation.
* ( )N I H pp2D=
Figure 11 shows the number of spins participating in resonance in PVC as a function of MnSo4 content at room temperature. It is observed that the number of spins participating in resonance increase with increase in MnSo4 content. It is observed that in the present study, the intensity of EPR signal steadily increases with MnSo4 content.
1173Structural, Thermal and Optical Properties of Pure and Mn2+ Doped Poly(Vinyl Chloride) Films
Figure 9: SEM photographs of pure and Mn2+ doped PVC polymer films (a) pure (b) 1mol% (c) 2 mol% (d) 3 mol% (e) 4 mol% (f) 5 mol%.
The ESR data can be used to calculate the paramagnetic susceptibility43 of the sample using the formula.
( )/X N g J J T1 3 B2 2b J= +
Where N is the number of spins per m3, J is the total angular momentum quantum number, β is the Bohr magnetron, kB is the Boltzmann constant, T is the absolute temperature and g is the land’e g factor. Using the above equation, the paramagnetic susceptibility was calculated as a function of dopant concentration and is shown in Figure 11. As observed in the plot, paramagnetic susceptibility increases with MnSo4 concentration.
4. ConclusionsPure and Mn2+ doped PVC polymer films were prepared
using the solution cast technique. Pure PVC thermogram shows two-step decomposition and the thermal degradation of polymer samples involves an additional step when Mn2+ ions are added. The melting temperature Tm of Mn2+ doped PVC shifts towards higher and lower temperatures. The highering of Tm is due to the increase in spherulite sizes and their surface energy, the lowering is due to the suppression of crystallites, there by increasing the amorphous content in the polymer. TGA and DSC analysis reveals that the sample is thermally stable up to 350 oC. Optical absorption edge and optical energy gaps (both direct and indirect) show a
kayyarapu et al.1174 Materials Research
Figure 10: EPR spectra of pure and Mn2+ doped PVC polymer films (a) pure (b) 1mol% (c) 2 mol% (d) 3 mol% (e) 4 mol% (f) 5 mol.
Figure 11: Variation of number of spins & susceptibility participating in PVC films containing Mn2+ ions.
decreasing trend with increasing dopant concentration. It was observed that these values shifted to lower energies on doping. This indicates that the doped PVC films become, semiconducting in nature. In SEM studies, with the doping of Mn2+, the morphology of the PVC sample changes to hexagonal shape. The XRD observations confirm that the present polymer possesses multiphase, having both crystalline and amorphous regions. The observed strong and weak bands in the FTIR spectrum indicates the presence of stretching and bending vibrational modes. O-H stretching frequency shifts towards high frequency on adding Mn2+ ions, which indicates the possibility of Mn2+ ion to be attached to O-H groups in the side chain of PVC molecule.
5. Acknowledgments
The authors thank Dr. Tushar Jana, Associate Professor, Dept.of Chemistry, for his constant encouragement and active co-operation in carrying out the work. We also thank to
Network Resource Centre in Central University of Hyderabad for providing the facilities to carry out experimental work.
6. References
1. Gray FM. Solid Polymer Electrolytes: Fundamentals and Technological Applications. New York: Willey-VCH Publishers;1991. 245 p.
2. Ahmad S, Ahmad S, Agnihotry SA. Nanocomposite electrolytes with fumed silica in poly(methyl methacrylate): thermal, rheological and conductivity studies. Journal of Power Sources.2005;140(1):151-156.
3. Ramesh S, Yuen TF, Shen CJ. Conductivity and FTIR studies on PEO–LiX [X: CF3SO3
−, SO42−] polymer electrolytes.
Spectrochimica Acta Part A: Molecular and Biomolecular Spectroscopy.2008;69(2):670-675.
4. Mediha KOK,Demirelli K, Aydogdu Y. Thermophysical Properties ofBlend ofPoly (Vinyl Chloride) with Poly (Isobornyl Acrylate). International Journal of Science &Technology.2008;3(1):37-42.
5. Warren H. Global vinyls outlook:Building on change, In Proceedings of 30th Annual World Petrochemical Conference; 2015 Mar 24-27; Houston, Texas, USA. p. 479-503.
6. Chen G. Preparation of a poly(vinyl chloride)/layered double hydroxide nano composite with a reduced heavy-metal thermal stabilizer. Journal of Applied PolymerScience.2007;106(2):817-820.
7. Sabaa MW, Mohamed NA, Khalil KD, Yassin AA. Organic thermal stabilizers for rigid poly(vinyl chloride) II. Benzal thiobarbituric acid and some of its derivatives.Polymer Degredationand Stability.2000;70(2):121-133.
8. Heat stabilizers. Plastics, Additives and Compounding.1999;1(4):24-29.
9. Yang ZH, Shu WY, Long HZ, Li XH. Influence of rare earth heating stabilizer on heating stabilizing property of PVC. Chinese Rare Earths.1999;20(2):60-62.
10. Chithra MK, Kesavan K, Mumoorthi M, Rajendran S. Study of electrochemical behaviour on synthesized nano-composite polymer electrolyte. Journal of NanoScience and NanoTechnology.2014;2(1):12-14.
11. Alamgir M,Abraham KM. Li Ion Conductive Electrolytes Based on Poly(vinyl chloride). Journal of Electrochemical Society. 1993;140(6):L96-L97.
12. Sukeshini AM, Nishimoto A, Watanabe M. Transport and electrochemical characterization of plasticized poly(vinyl chloride) solid electrolytes. Solid State Ionics.1996;86-88(Part 1):385-393.
13. Rhoo HJ, Kim HT, Park JK, Hwang TS. Ionic conduction in plasticized PVCPMMA blend polymer electrolytes. Electrochimica Acta.1997;42(10):1571-1579.
14. Stephan AM, Thirunakaran R, Renganathan NG, Sundaram V, Pitchumani S, Muniyandi N,et al. A study on polymer blend electrolytes based on PVC/PMMAwith lithium. Journal of PowerSources.1999;81-82:752-758.
15. Ramesh S, Arof AK. Electrical conductivity studies of polyvinyl chloride-based electrolytes with double salt system. Solid State Ionics. 2000;136-137:1197-1200.

1175Structural, Thermal and Optical Properties of Pure and Mn2+ Doped Poly(Vinyl Chloride) Films
16. Manuel Stephan A, Prem Kumar T, Renganathan NG, Pitchumani S, Thirunkara R, Muniyandi N. Ionic conductivity and FT-IR studies on plasticized PVC/PMMA blend polymer electrolytes. Journal of Power Sources.2000;89(1):80-87.
17. Ramesh S, Yahaya AH, Arof AK. Dielectric behaviour of PVC-based polymer electrolytes. Solid State Ionics.2002;152-153:291-294.
18. Subba Reddy CV, Han X, Zhu QY, Mai LQ,Chen W. Conductivity and discharge characteristics of (PVC+NaClO4) polymer electrolyte systems. European PolymerJournal.2006;42(11):3114 -3120.
19. Fillot LA, Hajji P, Gauthier C, Masenelli-Varlot K. U-PVC gelation level assessment, part 1: Comparison of different techniques. Journal of Vinyl & Additive Technology. 2006;12(3):98-107.
20. Janaki Rami Reddy T, Achari VBS, Shrama AK,Narasimha RaoVVR. Effect of plasticizer on electrical conductivity and cell parameters of (PVC+KBrO3) polymer electrolyte system. Ionics.2007;13(1):55-59.
21. Pavani Y,Ravi M, Bhavani S,Sharma AK,Narasimha Rao VVR. Characterization of Poly(vinyl alcohol)/potassium chloride polymer electrolytes for electrochemical cell applications. Polymer Engineering andScience.2012;52(8):1685-1692.
22. Reddeppa N, Sharma AK, Narasimha Rao VVR, Chen W. Preparation and characterization of pure and KBr doped polymer blend (PVC/PEO) electrolyte thin films. MicroelectronicEngineering.2013;112:57-62.
23. Ramesh Prabhu M, Sudalaimuthu K, Rajendran S. Investigations on PVC/PMMA blends with various lithium salts. Indian Journal of Research. 2013;2(3):307-309.
24. Marongiu A, Faravelli T, Bozzano G, Dente M, Ranzi E. Thermal degradation of poly(vinyl chloride). Journal of Analytical and Applied Pyrolysis. 2003;70(2):519-553.
25. Baskaran R, Selvasekarapandian S, Kuwata N, Kawamura J, Hattori T. Structure, thermal and transport properties of PVAc–LiClO4 solid polymer electrolytes. Journal of Physics and Chemistry of Solids.2007;68(3)407-412.
26. Barbosa PC, Rodrigues LC, Silva MM, Smith MJ. Characterization of pTMCnLiPF6solid polymer electrolytes. SolidState Ionics.2011;193(1):39-42.
27. Dey A, Karan S, De SK. Effect of nanofillers on thermal and transport properties of potassium iodide–polyethylene oxide solid polymer electrolyte. Solid State Communications.2009;149(31-32):1282-1287.
28. Mohamad AA, Mohamad NS, Yahya MZA, Othman R, Ramesh S, Alias Y, et al. Ionic conductivity studies of poly(vinyl alcohol) alkaline solid polymer electrolyte and its use in nickel–zinc cells. Solid State Ionics.2003;156(1-2):171-177.
29. Morita M, Araki F, Yoshimoto N, Ishikawa M, Tsutsumi H. Ionic conductance of polymeric electrolytes containing lithium salts mixed with rare earth salts. Solid State Ionics. 2000;136-137:1167-1173.
30. Li XG, KresseI, Spinger J, Nissen J,Yang YL. Morphology and gaspermselectivity of blend membranes of poly vinyl pyridine with ethyl cellulose. Polymer.2001;42(16):6859-6869.
31. Liu C, Xiao C, Liang H. Properties and structure of PVP–lignin “blend films”. Journal of Applied PolymerScience.2005;95(6):1405-1411.
32. Rajendran S, Ramesh Prabhu M, Usha Rani M. Characterization of PVC/PEMA Based Polymer Blend Electrolytes. International Journal of ElectrochemicalScience.2008;3(3):282-290.
33. Reddeppa N, Sharma AK, Narasimha Rao VVR, Chen W.AC conduction mechanism and battery discharge characteristics of (PVC/PEO) polyblend films complexed with potassium chloride. Measurement.2014;47:33-41.
34. Mohan VM, Raja V, Sharma AK,Narasimha Rao VVR. Ion transport and battery discharge characteristics of polymer electrolyte based on PEO complexed with NaFeF4 salt. Ionics.2006;12(3):219-226.
35. Abulyazied DE, Mokhtar SM, Motawie AM. Nanoindentation behaviorand physical properties of polyvinyl chloride/styrene co-maleic anhydride blend reinforced by nano-bentonite.IOSR Journal ofAppliedChemistry.2015;7(12):32-44.
36. Rahman MYA, Ahmad A, Lee TK, Farina Y, Dahlan HD.Effect of ethylene carbonate(EC) plasticizer on poly(vinyl chloride)-liquid 50% epoxidised natural rubber (LENR50) based polymer electrolyte. Material Sciences and Applications.2011;2(7):817-825.
37. Hemantha Kumar GN,Lakshmana Rao J,Gopal NO,Narasimhulu KV,Chakradhar RPS,Varada RajuluA. Spectroscopic investigations of Mn2+ions doped polyvinylalcohol films.Polymer.2004;45(16):5407-5415.
38. Davis PW, Shilliday TS. Some Optical Properties of Cadmium Telluride. PhysicalReview.1960;118(4):1020-1022.
39. Abdelaziz M. Electron spin resonance and optical studies of poly(methylmethacrylate) doped with CuCl2. Journal of Applied Polymer Science.2008;108(2):1013-1020.
40. Thutupalli GKM, Tomlin SG. The optical properties of thin films of cadmium and zinc selenides and tellurides. Journal of Physics D: AppliedPhysics.1976;9(11):1639-1646.
41. Zhang S, Lee JY, Hong L. Visualization of particle distribution in composite polymer electrolyte systems. Journal of Power Sources.2004;126(1-2):125-133.
42. Chu PP, Reddy MJ.Sm2O3 Composite PEO solid polymer electrolyte. Journal of Power Sources. 2003;115(2):288-294.
43. El-Khodary A. Evolution of the optical, magnetic and morphological properties of PVA films filled with CuSO4. Physica B: Condensed Matter.2010;405(16):3401-3408.
44. Linga Raju Ch, Rao JL, Gopal NO, Reddy BCV. Electron paramagnetic resonance and optical absorption studies of Cu2+ ion doped polyvinyl alcohol films. Materials Chemistry and Physics. 2007;101(2-3):423-427.