structure and function of the mesopelagic microbial loop ... · sistent barrier to deep vertical...
TRANSCRIPT
AQUATIC MICROBIAL ECOLOGYAquat Microb Ecol
Vol. 57: 351–362, 2009doi: 10.3354/ame01370
Printed December 2009Published online October 23, 2009
INTRODUCTION
The biological carbon pump, consisting of a suite ofbiologically mediated processes, plays an importantrole in the global carbon cycle (Volk & Hoffert 1985).The processes include conversion of inorganic carbonto organic carbon by phytoplankton, transport oforganic carbon from the surface to deep waters viasinking of particles, water mixing, and active transportby animals. One can assume that an efficient biologicalcarbon pump requires a condition in which the extentof mineralization of organic carbon (i.e. conversion oforganic carbon back to inorganic CO2) is reducedbefore the organic carbon is sequestered into oceaninteriors. The general view in the field of marine bio-geochemistry is that a large portion of organic carbon
exported from the epipelagic layer is remineralized toCO2 in the mesopelagic layer (e.g. Fowler & Knauer1986). It has been demonstrated that a large portion ofsinking particulate organic carbon (POC) is consumedby both zooplankton (e.g. Banse 1990, Steinberg et al.1994) and prokaryotes during the sinking process (e.g.Cho & Azam 1988, Smith et al. 1992, Ducklow 1993,Turley & Mackie 1994).
The decrease in sinking POC flux in themesopelagic layer, however, appears to be insufficientto support the carbon demand of prokaryotes in theopen Arabian Sea (Ducklow 1993), the NE Atlantic(Turley & Mackie 1994), and the subarctic Pacific(Nagata et al. 2001), as well as the carbon demand ofboth prokaryotes and zooplankton in the oligotrophicsubtropical Pacific gyre and the northwest subarctic
© Inter-Research 2009 · www.int-res.com*Email: [email protected]
Structure and function of the mesopelagicmicrobial loop in the NW Mediterranean Sea
Tsuneo Tanaka*
Aix-Marseille University, CNRS, LOPB-UMR 6535, OSU/Centre d’Océanologie de Marseille, Campus de Luminy-Case 901,13288 Marseille Cedex 09, France
ABSTRACT: The mesopelagic layer is where the majority of the particulate organic carbon exportedfrom the epipelagic layer is remineralized to CO2. Recent studies at the DYFAMED time-series sta-tion in the NW Mediterranean Sea have shown that dominance of prokaryotes (Bacteria andArchaea) within the microbial community represented by biomass data increases with depth. Thestudies have also shown that the depth-integrated biomass of protists (heterotrophic flagellates andciliates) in the mesopelagic layer is as great as that in the epipelagic layer, and that biomass ofmesopelagic prokaryotes is controlled by both substrate availability (bottom-up control) and preda-tion and viral infection (top-down control). Data on prokaryotic growth efficiency (derived from theprokaryotic heterotrophic production and the loss of organic carbon flux in the mesopelagic layer onan annual scale) suggest that mesopelagic prokaryotes are not simply remineralizers of organic car-bon, but also play an important role in supporting the production of organisms belonging to highertrophic levels. Analysis using a simple food chain model suggests that heterotrophic nanoflagellatesmay be important remineralizers of organic carbon produced by prokaryotes, and that the viral loopmay enhance remineralization of organic carbon in the mesopelagic layer. There are, however,uncertain elements in measuring organic carbon flux and biomass and activity of the microbial com-ponents in the mesopelagic layer. By comparing the results obtained at the DYFAMED station withthose obtained from other environments, this study summarizes our current knowledge on the struc-ture and function of the mesopelagic microbial loop in the NW Mediterranean Sea as well as in otheroceanic regions.
KEY WORDS: Mesopelagic microbial loop · Protists · Carbon flux · NW Mediterranean Sea
Resale or republication not permitted without written consent of the publisher
Contribution to AME Special 3 ‘Rassoulzadegan at Villefranche-sur-Mer: 3 decades of aquatic microbial ecology’ OPENPEN ACCESSCCESS
Aquat Microb Ecol 57: 351–362, 2009
Pacific (Steinberg et al. 2008). These studies collec-tively suggest the presence of additional mechanismsfor supplying organic carbon to the mesopelagic layer,such as the lateral and vertical transport of dissolvedorganic carbon (DOC) and diel vertical migration ofzooplankton feeding in the surface waters. Suchorganic carbon deficits are also suggested from thecomparison between prokaryotic carbon demand andthe amount of potentially available POC at givendepths in the bathypelagic layer: Prokaryotic carbondemand is up to an order of magnitude higher in thesubtropical North Atlantic (Baltar et al. 2009) and 2 to3 orders of magnitude higher in the North Atlanticbasin (Reinthaler et al. 2006) than POC. It should benoted that DOC, produced in or supplied to themesopelagic layer, is accessible only to prokaryotes.Regardless of the spatial and/or temporal variations inthe contribution of sinking POC and exported DOC insupplying organic carbon to the mesopelagic layer,previous studies strongly suggest the necessity to bet-ter understand the role of prokaryotes in the loss oforganic carbon in the mesopelagic layer.
In the epipelagic layer, a significant portion of car-bon fixed by photosynthesis is lost to the DOC poolthrough a multitude of processes, which can be rein-corporated into the food web via prokaryotes (Cole etal. 1988). Reincorporation of DOC via microbial organ-isms is referred to as the microbial loop (Azam et al.1983). Growth of prokaryotes through the consumptionof degradable DOC can be controlled by the availabil-ity of inorganic nutrients (bottom-up control) (e.g.Havskum et al. 2003, Thingstad et al. 2008), while thebiomass of prokaryotes is controlled by predation andviral infection (top-down control). The function of thefood web in terms of material cycling is therefore inti-mately linked to the food web structure, that is, the(functional) types of organisms that are present, theextent of their interactions, and the external (physicaland chemical) driving forces that potentially affect thestructure (Thingstad & Rassoulzadegan 1999). It is,therefore, important to elucidate the factors controllingthe food web structure and their effects on prokaryotes(e.g. substrate availability and trophic interactions) forbetter understanding of the biogeochemical role ofprokaryotes, especially those that are present in themesopelagic layers.
In this review, previous studies performed in themesopelagic layer of the NW Mediterranean Sea willbe compared with other published works conductedin other regions. Moreover, our current knowledgeon the structure and function of the mesopelagicmicrobial loop in the NW Mediterranean Sea as wellas in other oceanic regions will be summarized inorder to identify which areas of study require futureattention.
THE DYFAMED TIME-SERIES STATION
The Mediterranean Sea is a unique oceanic regimein terms of its hydrography and biogeochemistry(reviewed by Krom et al. 2003). Nutrient concentra-tions, the integrated chlorophyll and primary produc-tion in the epipelagic layer, and the POC export fromthe epipelagic layer all decrease in the MediterraneanSea from west to east (Moutin & Raimbault 2002). Inthe Levantine Basin of the eastern Mediterranean Sea,the surface waters above the chlorophyll maximumcontain very low nutrient and low chlorophyll concen-trations (30 to 80 nM ammonia, <1 to 10 nM nitrate, <2to 4 nM phosphate, 20 to 50 ng l–1 chlorophyll) duringthe summer (Krom et al. 2005). The low nutrient statusis caused by anti-estuarine circulation in which nutri-ent-poor surface water flows eastward through thestraits of Gibraltar and Sicily becoming progressivelymore saline to the east, while a counter-current of (rel-atively) nutrient-rich water flows out of the basin. Thedeep waters have a nitrate:phosphate ratio of 22:1 inthe western Mediterranean Sea (Béthoux et al. 1992)and 25:1 to 28:1 in the Eastern Mediterranean Sea(Krom et al. 1991, Kress & Herut 2001). In other words,these waters are P-starved compared to other oceanicregions whose ratios of nitrate to phosphate conform towhat is known as the Redfield ratio of 16. Many studiesreport that Mediterranean surface waters become P-limited for prokaryotes and phytoplankton during thestratified period (e.g. Zweifel et al. 1993, Vaulot et al.1996, Thingstad et al. 1998, Zohary et al. 2005). Onetheoretical consideration suggests that the carbonaccumulated in deep waters due to the sinking of par-ticles (i.e. one of the processes constituting the biolog-ical carbon pump) is stored more stably in a P-limitedsystem than in an N-limited system (Thingstad & Ras-soulzadegan 1995). The Mediterranean Sea thus offersa unique set of conditions as a natural laboratory tostudy the interplay among biological, biogeochemical,and hydrographical processes (Thingstad & Rassoul-zadegan 1999).
In the NW Mediterranean Sea, a multidisciplinarystudy has been performed since 1987 at theDYFAMED time-series station (43° 25.2’ N, 07° 51.8’ E;2350 m max depth) as a part of the French Joint GlobalOcean Flux Study (JGOFS) and in the framework ofmany French national programs (Marty 2002). TheDYFAMED site is characterized by different watertypes (water masses), i.e. surface water with seasonallyvariable temperature, intermediate water of Levantineorigin (LIW) which is present between 300 and 500 mdepths and exhibits the maxima of temperature andsalinity, and deep water which is colder and less salinethan LIW. It should be noted that water temperature isalways ca. 13°C below the seasonal thermocline down
352
Tanaka: NW Mediterranean mesopelagic microbial loop
to the bottom and throughout the water column duringthe winter mixing period (e.g. Marty 2003). This sitedoes not receive significant anthropogenic or naturaldust inputs (Marty et al. 1994, Ridame & Guieu 2002)and receives very weak lateral flows (Béthoux et al.1988, Andersen & Prieur 2000). Seasonal patterns inthe water column structure and biological productionin the epipelagic layer (Marty & Chiavérini 2002) resultin sinking POC fluxes that are higher from January toJune and lower from July to December (Miquel et al.1993, 1994). DOC accumulates in the surface mixedlayer during the stratified period and is exported to thedeeper layer during the winter mixing period (Copin-Montégut & Avril 1993, Avril 2002). The dissolved oxy-gen minimum is 170 µmol kg–1 around 200 to 300 mdepth (Copin-Montégut & Bégovic 2002), which is fartoo low to allow nitrate reduction to occur. Themesopelagic layer is usually referred to as the layerbelow the epipelagic layer down to either ca. 1000 m,where a permanent pycnocline usually exists as a per-sistent barrier to deep vertical mixing, or the maximumdepth of winter mixing where the permanent pycno-cline is absent (Legendre & Rivkin 2002). At theDYFAMED site, the pycnocline in deep water does notexist and the depth of water column homogenizationduring the winter is variable between years but hasalways been <1000 m (Copin-Montégut & Bégovic2002). Hereafter, the 5 to 110, 110 to 1000, and 1000 to2000 m layers of this site will be referred to as theepipelagic, mesopelagic, and bathypelagic layers,respectively.
DISTRIBUTION OF MICROBIAL PROKARYOTESAND EUKARYOTES IN DEEP WATERS
Abundance and biomass of 9 microbial groups col-lected from the DYFAMED site at 13 depths, rangingfrom 5 to 2000 m, were measured 10 times betweenMay 1999 and March 2000 (Tanaka & Rassoulzadegan2002 unpubl. data). It is known that Archaea’s contri-bution to the prokaryotic community in terms of abun-dance and biomass increases in the dark ocean(Fuhrman & Davis 1997, Karner et al. 2001). Bothcounting of prokaryotes based on DNA-staining dyessuch as DAPI and SYBR Green (Porter & Feig 1980,Jacquet et al. 1998) and measurement of radioisotope-labeled leucine incorporation by prokaryotes (Kirch-man 1992) in the aphotic layer result in the measure-ment of the total abundance and heterotrophic activityof both Bacteria and Archaea combined. It should alsobe noted here that the abundance of cyanobacteriacontaining phycoerythrin pigments has generally beenmeasured separately from their heterotrophic counter-parts, and thus the term ‘prokaryotes’ used herein does
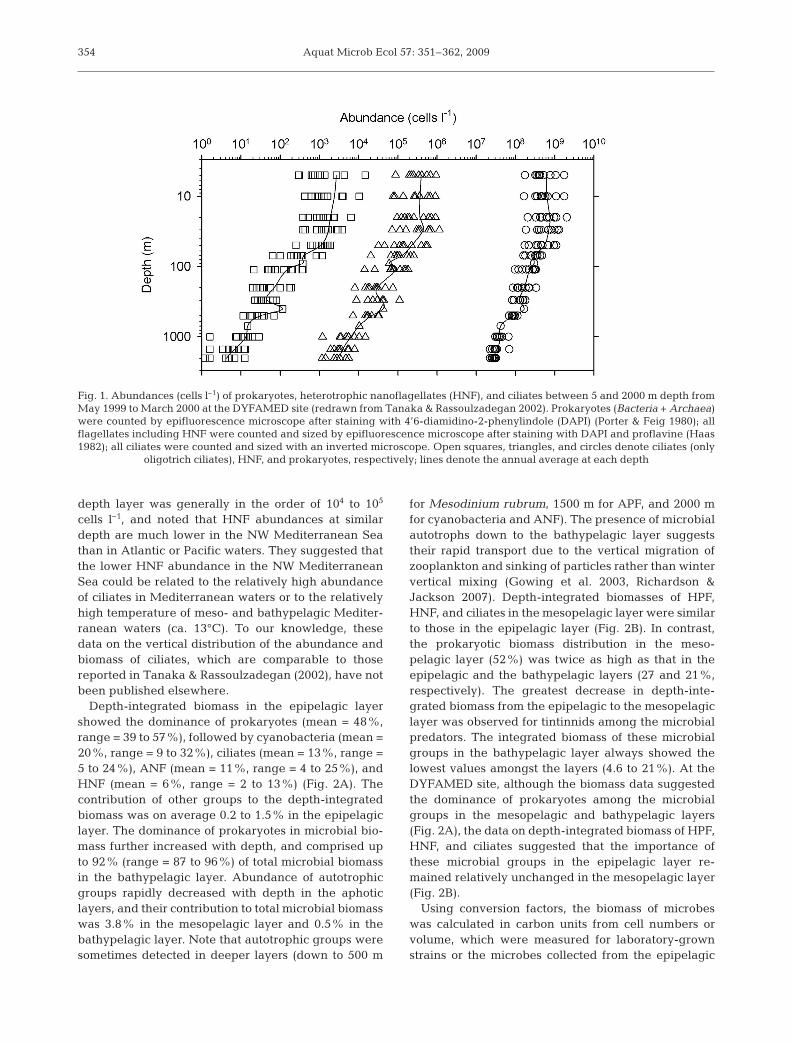
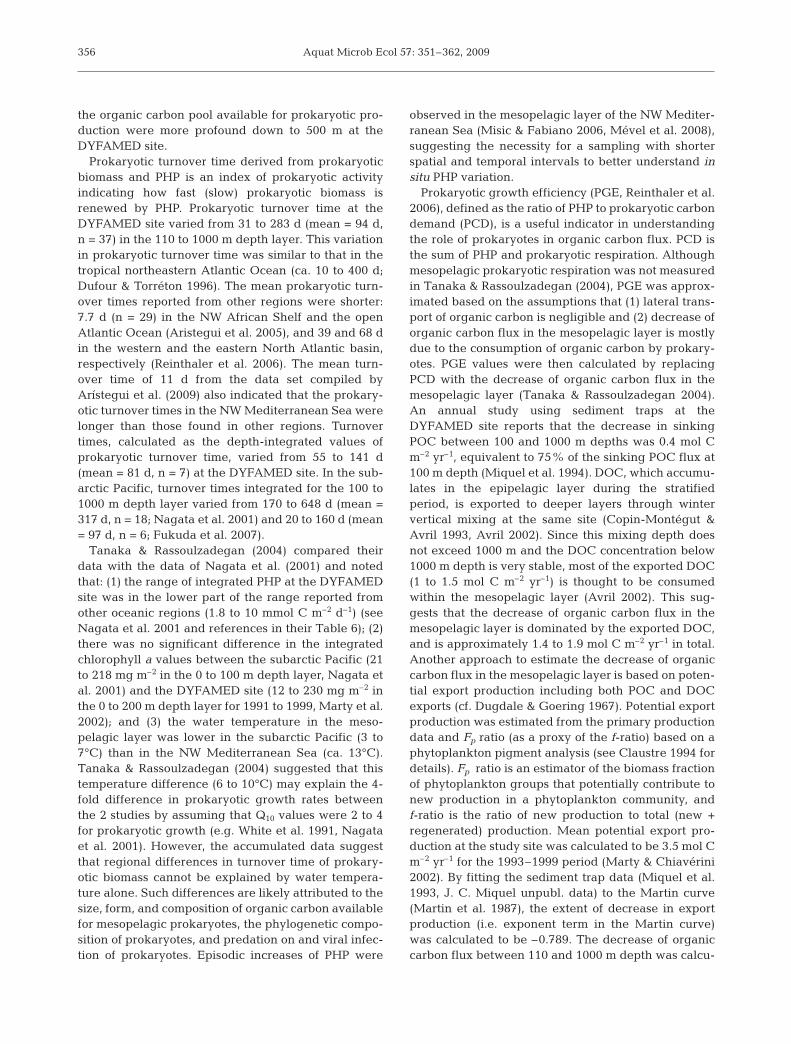
not include the cyanobacterial cells containing phyco-erythrin. Nine microbial groups consisted of 2 pro-karyotic groups, i.e. cyanobacterial cells containingphycoerythrin pigments (hereafter referred to as cy-anobacteria) and prokaryotes including both Bacteriaand Archaea but excluding cyanobacteria (hereafterreferred to as prokaryotes), and 7 eukaryotic groups,i.e. heterotrophic pico- and nanoflagellates (HPF,HNF), ciliates, tintinnids, cyanobacteria, autotrophicpico- and nanoflagellates (APF, ANF), and Meso-dinium rubrum Lohmann 1908 (=Myrionecta rubraJankowski 1976). Tanaka & Rassoulzadegan (2002)reported that prokaryotes, HNF, and ciliates werealways detected throughout the water column. Abun-dances of prokaryotes, HNF, and ciliates all decreasedwith depth, from 2.1 × 10⁹ to 2.2 × 10⁷, 1.2 × 10⁶ to 1.2 ×10³, and 1.5 × 10⁴ to 1 cells l–1 for prokaryotes, HNF,and ciliates, representing 1, 2, and 3 orders of magni-tude of decrease (5 to 2000 m), respectively (Fig. 1).The log-log linear regression analysis for abundanceversus depth showed that the regression slope valuesindicating the magnitude of depth-dependent de-crease in microbial abundance were relatively con-stant (mean ± SD = –0.557 ± 0.125 for prokaryotes,–0.886 ± 0.125 for HNF, and –1.102 ± 0.246 for ciliates).The analysis also showed that the magnitude of depth-dependent decreases in abundance was significantlysmaller for prokaryotes than for protists. Under theassumption that the food web is close to steady-state,the results suggest that the balance between processrates (i.e. growth versus mortality rates) is less variablewith depth for prokaryotes than for protists, and thatthe density-dependent predator–prey relationshipbetween the 3 microbial components becomes lesscoupled with depth down to 2000 m.
In the mesopelagic layer of the NW MediterraneanSea, abundance and biomass were respectively in therange of 3.1 × 10⁷ to 3.4 × 10⁸ cells l–1 and 42 to4200 nmol C l–1 for prokaryotes, 1.2 × 10³ to 1.8 ×10⁵ cells l–1 and 0.83 to 49 nmol C l–1 for HNF, and 1.6to 376 cells l–1 and 0.33 to 100 nmol C l–1 for ciliates(Fig. 1; Tanaka & Rassoulzadegan 2002). A similarrange of abundance is reported for prokaryotes (2.4 ×10⁷ to 4.1 × 10⁸ cells l–1) and HNF (8.3 × 10² to 2.8 ×10⁵ cells l–1) in the 100 to 1000 m depth layer in theeastern Mediterranean Sea (Tanaka et al. 2007). Thiswas in contrast to the known longitudinal difference ofepipelagic productivity across the Mediterranean (Tur-ley et al. 2000, Moutin & Raimbault 2002). A compari-son of data on prokaryotic abundance compiled fromdifferent oceanic areas showed that the prokaryoticabundance was in the order of 107 to 108 cells l–1 in the200 to 1000 m depth layer (Koppelmann et al. 2005,Arístegui et al. 2009). Arístegui et al. (2009) alsoshowed that HNF abundance in the 100 to 1000 m
353
Aquat Microb Ecol 57: 351–362, 2009
depth layer was generally in the order of 104 to 105
cells l–1, and noted that HNF abundances at similardepth are much lower in the NW Mediterranean Seathan in Atlantic or Pacific waters. They suggested thatthe lower HNF abundance in the NW MediterraneanSea could be related to the relatively high abundanceof ciliates in Mediterranean waters or to the relativelyhigh temperature of meso- and bathypelagic Mediter-ranean waters (ca. 13°C). To our knowledge, thesedata on the vertical distribution of the abundance andbiomass of ciliates, which are comparable to thosereported in Tanaka & Rassoulzadegan (2002), have notbeen published elsewhere.
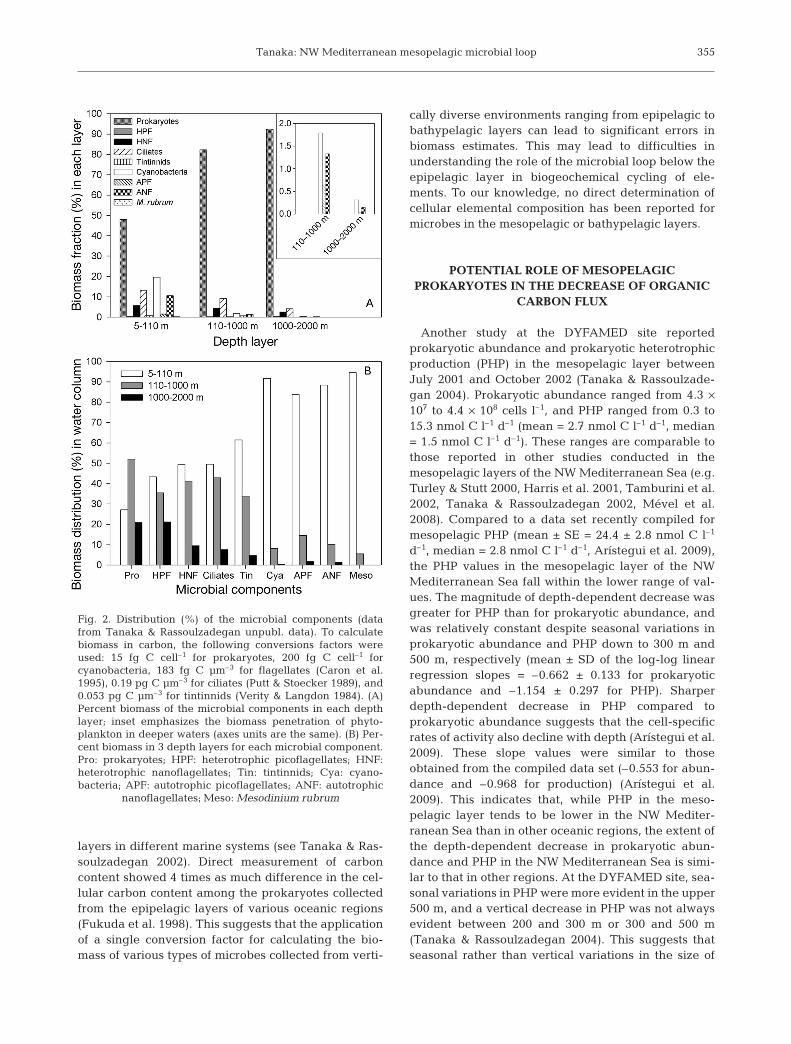
Depth-integrated biomass in the epipelagic layershowed the dominance of prokaryotes (mean = 48%,range = 39 to 57%), followed by cyanobacteria (mean =20%, range = 9 to 32%), ciliates (mean = 13%, range =5 to 24%), ANF (mean = 11%, range = 4 to 25%), andHNF (mean = 6%, range = 2 to 13%) (Fig. 2A). Thecontribution of other groups to the depth-integratedbiomass was on average 0.2 to 1.5% in the epipelagiclayer. The dominance of prokaryotes in microbial bio-mass further increased with depth, and comprised upto 92% (range = 87 to 96%) of total microbial biomassin the bathypelagic layer. Abundance of autotrophicgroups rapidly decreased with depth in the aphoticlayers, and their contribution to total microbial biomasswas 3.8% in the mesopelagic layer and 0.5% in thebathypelagic layer. Note that autotrophic groups weresometimes detected in deeper layers (down to 500 m
for Mesodinium rubrum, 1500 m for APF, and 2000 mfor cyanobacteria and ANF). The presence of microbialautotrophs down to the bathypelagic layer suggeststheir rapid transport due to the vertical migration ofzooplankton and sinking of particles rather than wintervertical mixing (Gowing et al. 2003, Richardson &Jackson 2007). Depth-integrated biomasses of HPF,HNF, and ciliates in the mesopelagic layer were similarto those in the epipelagic layer (Fig. 2B). In contrast,the prokaryotic biomass distribution in the meso-pelagic layer (52%) was twice as high as that in theepipelagic and the bathypelagic layers (27 and 21%,respectively). The greatest decrease in depth-inte-grated biomass from the epipelagic to the mesopelagiclayer was observed for tintinnids among the microbialpredators. The integrated biomass of these microbialgroups in the bathypelagic layer always showed thelowest values amongst the layers (4.6 to 21%). At theDYFAMED site, although the biomass data suggestedthe dominance of prokaryotes among the microbialgroups in the mesopelagic and bathypelagic layers(Fig. 2A), the data on depth-integrated biomass of HPF,HNF, and ciliates suggested that the importance ofthese microbial groups in the epipelagic layer re-mained relatively unchanged in the mesopelagic layer(Fig. 2B).
Using conversion factors, the biomass of microbeswas calculated in carbon units from cell numbers orvolume, which were measured for laboratory-grownstrains or the microbes collected from the epipelagic
354
Fig. 1. Abundances (cells l–1) of prokaryotes, heterotrophic nanoflagellates (HNF), and ciliates between 5 and 2000 m depth fromMay 1999 to March 2000 at the DYFAMED site (redrawn from Tanaka & Rassoulzadegan 2002). Prokaryotes (Bacteria + Archaea)were counted by epifluorescence microscope after staining with 4’6-diamidino-2-phenylindole (DAPI) (Porter & Feig 1980); allflagellates including HNF were counted and sized by epifluorescence microscope after staining with DAPI and proflavine (Haas1982); all ciliates were counted and sized with an inverted microscope. Open squares, triangles, and circles denote ciliates (only
oligotrich ciliates), HNF, and prokaryotes, respectively; lines denote the annual average at each depth
Tanaka: NW Mediterranean mesopelagic microbial loop
layers in different marine systems (see Tanaka & Ras-soulzadegan 2002). Direct measurement of carboncontent showed 4 times as much difference in the cel-lular carbon content among the prokaryotes collectedfrom the epipelagic layers of various oceanic regions(Fukuda et al. 1998). This suggests that the applicationof a single conversion factor for calculating the bio-mass of various types of microbes collected from verti-
cally diverse environments ranging from epipelagic tobathypelagic layers can lead to significant errors inbiomass estimates. This may lead to difficulties inunderstanding the role of the microbial loop below theepipelagic layer in biogeochemical cycling of ele-ments. To our knowledge, no direct determination ofcellular elemental composition has been reported formicrobes in the mesopelagic or bathypelagic layers.
POTENTIAL ROLE OF MESOPELAGICPROKARYOTES IN THE DECREASE OF ORGANIC
CARBON FLUX
Another study at the DYFAMED site reportedprokaryotic abundance and prokaryotic heterotrophicproduction (PHP) in the mesopelagic layer betweenJuly 2001 and October 2002 (Tanaka & Rassoulzade-gan 2004). Prokaryotic abundance ranged from 4.3 ×10⁷ to 4.4 × 10⁸ cells l–1, and PHP ranged from 0.3 to15.3 nmol C l–1 d–1 (mean = 2.7 nmol C l–1 d–1, median= 1.5 nmol C l–1 d–1). These ranges are comparable tothose reported in other studies conducted in themesopelagic layers of the NW Mediterranean Sea (e.g.Turley & Stutt 2000, Harris et al. 2001, Tamburini et al.2002, Tanaka & Rassoulzadegan 2002, Mével et al.2008). Compared to a data set recently compiled formesopelagic PHP (mean ± SE = 24.4 ± 2.8 nmol C l–1
d–1, median = 2.8 nmol C l–1 d–1, Arístegui et al. 2009),the PHP values in the mesopelagic layer of the NWMediterranean Sea fall within the lower range of val-ues. The magnitude of depth-dependent decrease wasgreater for PHP than for prokaryotic abundance, andwas relatively constant despite seasonal variations inprokaryotic abundance and PHP down to 300 m and500 m, respectively (mean ± SD of the log-log linearregression slopes = –0.662 ± 0.133 for prokaryoticabundance and –1.154 ± 0.297 for PHP). Sharperdepth-dependent decrease in PHP compared toprokaryotic abundance suggests that the cell-specificrates of activity also decline with depth (Arístegui et al.2009). These slope values were similar to thoseobtained from the compiled data set (–0.553 for abun-dance and –0.968 for production) (Arístegui et al.2009). This indicates that, while PHP in the meso-pelagic layer tends to be lower in the NW Mediter-ranean Sea than in other oceanic regions, the extent ofthe depth-dependent decrease in prokaryotic abun-dance and PHP in the NW Mediterranean Sea is simi-lar to that in other regions. At the DYFAMED site, sea-sonal variations in PHP were more evident in the upper500 m, and a vertical decrease in PHP was not alwaysevident between 200 and 300 m or 300 and 500 m(Tanaka & Rassoulzadegan 2004). This suggests thatseasonal rather than vertical variations in the size of
355
Fig. 2. Distribution (%) of the microbial components (datafrom Tanaka & Rassoulzadegan unpubl. data). To calculatebiomass in carbon, the following conversions factors wereused: 15 fg C cell–1 for prokaryotes, 200 fg C cell–1 forcyanobacteria, 183 fg C µm–3 for flagellates (Caron et al.1995), 0.19 pg C µm–3 for ciliates (Putt & Stoecker 1989), and0.053 pg C µm–3 for tintinnids (Verity & Langdon 1984). (A)Percent biomass of the microbial components in each depthlayer; inset emphasizes the biomass penetration of phyto-plankton in deeper waters (axes units are the same). (B) Per-cent biomass in 3 depth layers for each microbial component.Pro: prokaryotes; HPF: heterotrophic picoflagellates; HNF:heterotrophic nanoflagellates; Tin: tintinnids; Cya: cyano-bacteria; APF: autotrophic picoflagellates; ANF: autotrophic
nanoflagellates; Meso: Mesodinium rubrum
Aquat Microb Ecol 57: 351–362, 2009
the organic carbon pool available for prokaryotic pro-duction were more profound down to 500 m at theDYFAMED site.
Prokaryotic turnover time derived from prokaryoticbiomass and PHP is an index of prokaryotic activityindicating how fast (slow) prokaryotic biomass isrenewed by PHP. Prokaryotic turnover time at theDYFAMED site varied from 31 to 283 d (mean = 94 d,n = 37) in the 110 to 1000 m depth layer. This variationin prokaryotic turnover time was similar to that in thetropical northeastern Atlantic Ocean (ca. 10 to 400 d;Dufour & Torréton 1996). The mean prokaryotic turn-over times reported from other regions were shorter:7.7 d (n = 29) in the NW African Shelf and the openAtlantic Ocean (Aristegui et al. 2005), and 39 and 68 din the western and the eastern North Atlantic basin,respectively (Reinthaler et al. 2006). The mean turn-over time of 11 d from the data set compiled byArístegui et al. (2009) also indicated that the prokary-otic turnover times in the NW Mediterranean Sea werelonger than those found in other regions. Turnovertimes, calculated as the depth-integrated values ofprokaryotic turnover time, varied from 55 to 141 d(mean = 81 d, n = 7) at the DYFAMED site. In the sub-arctic Pacific, turnover times integrated for the 100 to1000 m depth layer varied from 170 to 648 d (mean =317 d, n = 18; Nagata et al. 2001) and 20 to 160 d (mean= 97 d, n = 6; Fukuda et al. 2007).
Tanaka & Rassoulzadegan (2004) compared theirdata with the data of Nagata et al. (2001) and notedthat: (1) the range of integrated PHP at the DYFAMEDsite was in the lower part of the range reported fromother oceanic regions (1.8 to 10 mmol C m–2 d–1) (seeNagata et al. 2001 and references in their Table 6); (2)there was no significant difference in the integratedchlorophyll a values between the subarctic Pacific (21to 218 mg m–2 in the 0 to 100 m depth layer, Nagata etal. 2001) and the DYFAMED site (12 to 230 mg m–2 inthe 0 to 200 m depth layer for 1991 to 1999, Marty et al.2002); and (3) the water temperature in the meso-pelagic layer was lower in the subarctic Pacific (3 to7°C) than in the NW Mediterranean Sea (ca. 13°C).Tanaka & Rassoulzadegan (2004) suggested that thistemperature difference (6 to 10°C) may explain the 4-fold difference in prokaryotic growth rates betweenthe 2 studies by assuming that Q10 values were 2 to 4for prokaryotic growth (e.g. White et al. 1991, Nagataet al. 2001). However, the accumulated data suggestthat regional differences in turnover time of prokary-otic biomass cannot be explained by water tempera-ture alone. Such differences are likely attributed to thesize, form, and composition of organic carbon availablefor mesopelagic prokaryotes, the phylogenetic compo-sition of prokaryotes, and predation on and viral infec-tion of prokaryotes. Episodic increases of PHP were
observed in the mesopelagic layer of the NW Mediter-ranean Sea (Misic & Fabiano 2006, Mével et al. 2008),suggesting the necessity for a sampling with shorterspatial and temporal intervals to better understand insitu PHP variation.
Prokaryotic growth efficiency (PGE, Reinthaler et al.2006), defined as the ratio of PHP to prokaryotic carbondemand (PCD), is a useful indicator in understandingthe role of prokaryotes in organic carbon flux. PCD isthe sum of PHP and prokaryotic respiration. Althoughmesopelagic prokaryotic respiration was not measuredin Tanaka & Rassoulzadegan (2004), PGE was approx-imated based on the assumptions that (1) lateral trans-port of organic carbon is negligible and (2) decrease oforganic carbon flux in the mesopelagic layer is mostlydue to the consumption of organic carbon by prokary-otes. PGE values were then calculated by replacingPCD with the decrease of organic carbon flux in themesopelagic layer (Tanaka & Rassoulzadegan 2004).An annual study using sediment traps at theDYFAMED site reports that the decrease in sinkingPOC between 100 and 1000 m depths was 0.4 mol Cm–2 yr–1, equivalent to 75% of the sinking POC flux at100 m depth (Miquel et al. 1994). DOC, which accumu-lates in the epipelagic layer during the stratifiedperiod, is exported to deeper layers through wintervertical mixing at the same site (Copin-Montégut &Avril 1993, Avril 2002). Since this mixing depth doesnot exceed 1000 m and the DOC concentration below1000 m depth is very stable, most of the exported DOC(1 to 1.5 mol C m–2 yr–1) is thought to be consumedwithin the mesopelagic layer (Avril 2002). This sug-gests that the decrease of organic carbon flux in themesopelagic layer is dominated by the exported DOC,and is approximately 1.4 to 1.9 mol C m–2 yr–1 in total.Another approach to estimate the decrease of organiccarbon flux in the mesopelagic layer is based on poten-tial export production including both POC and DOCexports (cf. Dugdale & Goering 1967). Potential exportproduction was estimated from the primary productiondata and Fp ratio (as a proxy of the f-ratio) based on aphytoplankton pigment analysis (see Claustre 1994 fordetails). Fp ratio is an estimator of the biomass fractionof phytoplankton groups that potentially contribute tonew production in a phytoplankton community, and f-ratio is the ratio of new production to total (new +regenerated) production. Mean potential export pro-duction at the study site was calculated to be 3.5 mol Cm–2 yr–1 for the 1993–1999 period (Marty & Chiavérini2002). By fitting the sediment trap data (Miquel et al.1993, J. C. Miquel unpubl. data) to the Martin curve(Martin et al. 1987), the extent of decrease in exportproduction (i.e. exponent term in the Martin curve)was calculated to be –0.789. The decrease of organiccarbon flux between 110 and 1000 m depth was calcu-
356
Tanaka: NW Mediterranean mesopelagic microbial loop
lated to be 2.9 mol C m–2 yr–1. Using a trapezoidalequation, the annual PHP integrated for themesopelagic layer was estimated to be 0.55 mol C m–2
yr–1. PGE was then estimated to be 19 to 39% in themesopelagic layer on an annual scale (Tanaka & Ras-soulzadegan 2004).
In the ocean epipelagic layer, the compiled data onPHP and prokaryotic respiration show that the medianPGE is 9% (mean ± SD = 15 ± 12%) (del Giorgio & Cole2000). The concentration of organic matter availablefor prokaryotes is generally lower in deeper waters(Williams 2000), and thus one may expect that the PGEvalue is smaller in the mesopelagic layer than in theepipelagic layer. In this context, our PGE values in themesopelagic layer seem unrealistically high. However,since sinking POC is consumed not only by prokary-otes (Turley & Stutt 2000) but also by detritivorous zoo-plankton (Carroll et al. 1998) at the study site, theextrapolated PCD values (Tanaka & Rassoulzadegan2004) are, to an extent, overestimated and thereforeshould be regarded as conservative. It should be notedthat the time scale is different between the PGE valuesbased on the data compiled by del Giorgio & Cole(2000) and the PGE values from Tanaka & Rassoul-zadegan (2004). The former are mostly based on thevolumetric values of PHP and prokaryotic respirationmeasured for relatively short periods (hours and days,respectively) in the epipelagic layer. The reliability ofour PGE estimates depends on the extent of uncer-tainty associated with the measurement of PHP andsinking POC flux by a sediment trap, the extrapolationof PHP to an annual scale, and an estimate of DOCexported to the mesopelagic layer. The coefficient ofvariation in PHP measurement by 3H-leucine incorpo-ration was approximately 20% (T. Tanaka & F. Ras-soulzadegan unpubl. data). The use of a sediment trapmay underestimate the downward flux of POC by afactor of 2 (Buesseler et al. 2007). It is difficult to evalu-ate the extent of uncertainty associated with the mea-surement of exported DOC flux or the determination ofdepth ranges where the exported DOC is mostly con-sumed by prokaryotes. At the Bermuda Atlantic Time-series study site in the NW Sargasso Sea, DOC, accu-mulated during the stratified period and exportedduring winter vertical mixing, is consumed only in theupper part of the mesopelagic layer after winter verti-cal mixing (Carlson et al. 1994). Even if the decrease ofsinking POC flux were underestimated by a factor of 2(i.e. 0.8 mol C m–2 yr–1) and PHP was 20% overesti-mated (i.e. 0.44 mol C m–2 yr–1), PGE would have been19%. Further studies are needed to reduce the degreeof uncertainty regarding the PGE estimate.
The PGE values calculated from the data obtainedby the 3H-thymidine incorporation method and theelectron transport system assay ranged from 1 to 36%
in the 100 to 700 m depth layer at the DYFAMED site(Martin et al. 1994). The yield of 14C-glutamic acidassimilation measured under in situ hydrostatic pres-sure was 36% in the spring and 13% in the fall for the200 to 1000 m depth layer at the same site (Tamburiniet al. 2002). Reinthaler et al. (2006) measured 3H-leucine incorporation and oxygen consumption, andreported on average a PGE value of 2% in the 180 to1030 m depth layer (oxygen minimum zone) in theNorth Atlantic Basin. In the NW African shelf and theopen Atlantic Ocean, PGE, which was estimated fromPHP using the 3H-thymidine/3H-leucine incorporationmethod and the back-scaled prokaryotic respirationderived from the prokaryotic abundance, was 18 ± 3%at 600 m and 13 ± 2% at 1000 m (Arístegui et al. 2005).These results suggest that the PGE estimates fromTanaka & Rassoulzadegan (2004) are not complete out-liers; otherwise, significant errors have been involvedin the studies in the NW Mediterranean Sea. Uncer-tainties regarding the PGE estimate aside, not verysmall PGE values in Tanaka & Rassoulzadegan (2004)suggest that mesopelagic prokaryotes are not merelyremineralizers of organic carbon but also supporthigher trophic levels of the mesopelagic plankton foodweb in the NW Mediterranean Sea. In other words, thePGE estimates suggest that the prokaryotic biomass inthe mesopelagic layer is not simply controlled by sub-strate availability (bottom-up control) but also by pre-dation and virus infection (top-down control).
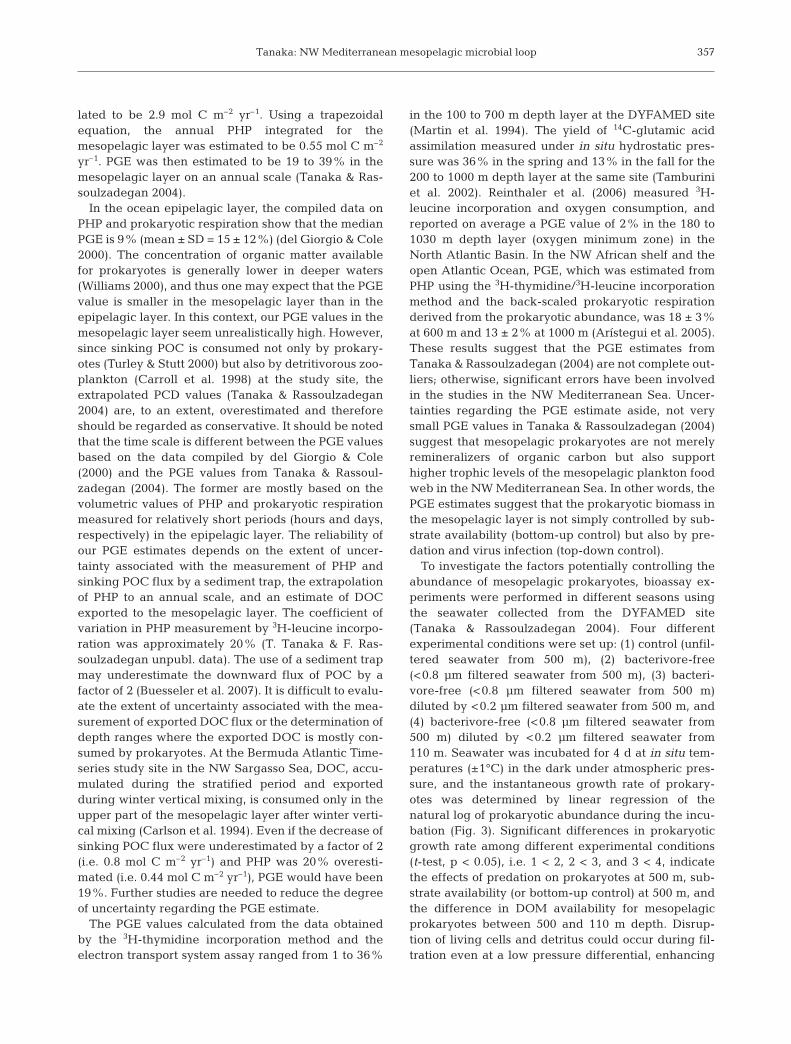
To investigate the factors potentially controlling theabundance of mesopelagic prokaryotes, bioassay ex-periments were performed in different seasons usingthe seawater collected from the DYFAMED site(Tanaka & Rassoulzadegan 2004). Four differentexperimental conditions were set up: (1) control (unfil-tered seawater from 500 m), (2) bacterivore-free(<0.8 µm filtered seawater from 500 m), (3) bacteri-vore-free (<0.8 µm filtered seawater from 500 m)diluted by <0.2 µm filtered seawater from 500 m, and(4) bacterivore-free (<0.8 µm filtered seawater from500 m) diluted by <0.2 µm filtered seawater from110 m. Seawater was incubated for 4 d at in situ tem-peratures (±1°C) in the dark under atmospheric pres-sure, and the instantaneous growth rate of prokary-otes was determined by linear regression of thenatural log of prokaryotic abundance during the incu-bation (Fig. 3). Significant differences in prokaryoticgrowth rate among different experimental conditions(t-test, p < 0.05), i.e. 1 < 2, 2 < 3, and 3 < 4, indicatethe effects of predation on prokaryotes at 500 m, sub-strate availability (or bottom-up control) at 500 m, andthe difference in DOM availability for mesopelagicprokaryotes between 500 and 110 m depth. Disrup-tion of living cells and detritus could occur during fil-tration even at a low pressure differential, enhancing
357
Aquat Microb Ecol 57: 351–362, 2009
the concentration of DOM in filtrates. If the extent ofthis disruption was significant, there should havebeen a systematic difference in instantaneous growthrate of prokaryotes among different experimentalconditions (i.e. 1 < 2 < 3 < 4). However, such a system-atic difference was not evident (Fig. 3), indicating thatthe enhancement of DOM concentration in the fil-trates was not a significant artifact in this bioassay.The results suggest that both predation and substrateavailability were generally affecting the prokaryoticabundance significantly at 500 m. A significant preda-tion on mesopelagic prokaryotes indicated by our
study at the DYFAMED site supports the previousmeasurement of the HNF predation rate on prokary-otes down to 500 m in the Sea of Japan (Cho et al.2000). Also, Tanaka & Rassoulzadegan (2002) sug-gested that the concentration of DOM available formesopelagic prokaryotes at 110 m was, compared tothat at 500 m, at a high level in January, at similarlevels in July, September, and October, and at a lowlevel in June. The water column structure at theDYFAMED site was characterized by the mixingperiod from December to March, the stratified periodfrom June to September, and the semi-stratifiedperiod in May and October (see Tanaka & Ras-soulzadegan 2002). Seasonal variations in sinkingPOC fluxes and DOC export are related to the watercolumn structure (Copin-Montégut & Avril 1993,Miquel et al. 1994). Seasonal variations in the avail-ability of semi-labile DOC, which is resistant to rapidmicrobial degradation in the epipelagic layer butavailable for the mesopelagic prokaryotes (Carlson etal. 2004), may explain the differences in the prokary-otic growth rates obtained from experimental condi-tions 3 and 4. Overall, the bioassay experiments sug-gest that the abundance of mesopelagic prokaryotesis governed by both bottom-up and top-down con-trols.
POTENTIAL ROLE OF THE MESOPELAGICMICROBIAL LOOP IN CARBON FLOW
If one assumes a food chain structure in an approxi-mate steady state over different depths and time scalesfor carbon flow (e.g. Thingstad 2000), the data onmicrobial biomass and PHP can be used to estimate thecarbon flow between microbial components and zoo-
358
Fig. 3. Instantaneous growth rates (±SE; d–1) of prokaryotes in4 different treatments during 4 d incubation at in situ temper-ature in the dark (data from Tanaka & Rassoulzadegan 2004).Values are means of 3 replicate experimental bottles exceptfor ‘<0.8 µm (500 m) + <0.2 µm (110 m)’ in January (n = 5).Mean values were compared using a t-test. Different lettersindicate significant difference (p < 0.05). NS: not significant
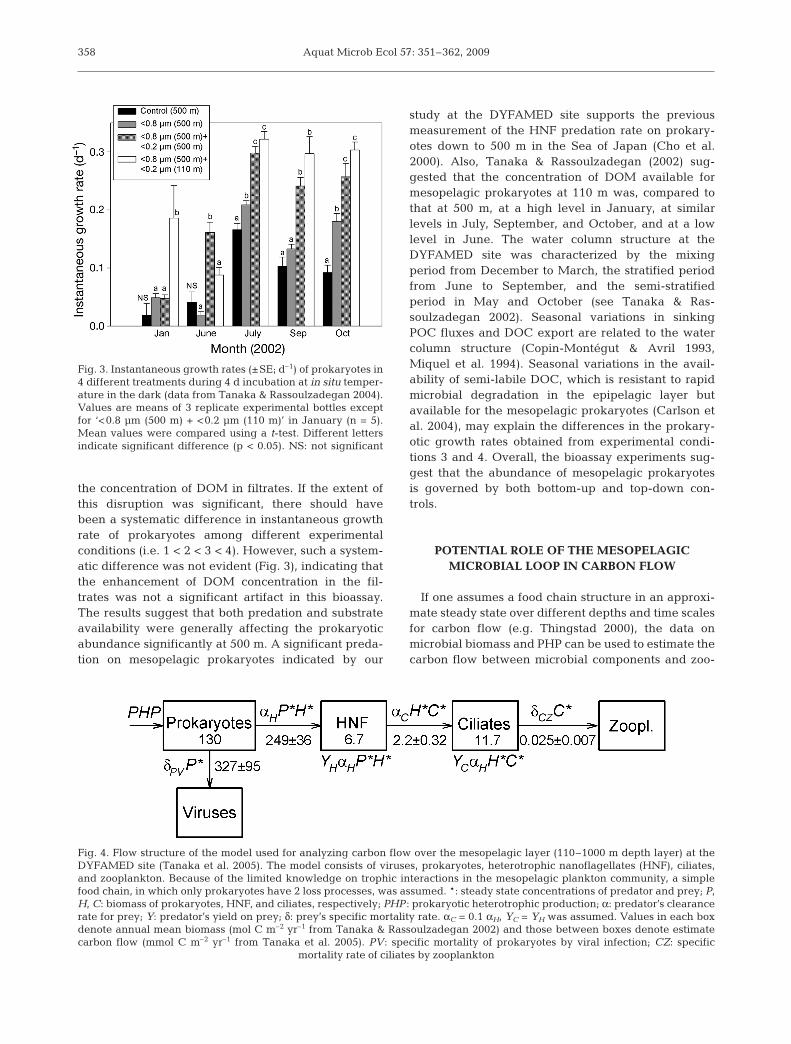
Fig. 4. Flow structure of the model used for analyzing carbon flow over the mesopelagic layer (110–1000 m depth layer) at theDYFAMED site (Tanaka et al. 2005). The model consists of viruses, prokaryotes, heterotrophic nanoflagellates (HNF), ciliates,and zooplankton. Because of the limited knowledge on trophic interactions in the mesopelagic plankton community, a simplefood chain, in which only prokaryotes have 2 loss processes, was assumed. *: steady state concentrations of predator and prey; P,H, C: biomass of prokaryotes, HNF, and ciliates, respectively; PHP : prokaryotic heterotrophic production; α: predator’s clearancerate for prey; Y: predator’s yield on prey; δ: prey’s specific mortality rate. αC = 0.1 αH, YC = YH was assumed. Values in each boxdenote annual mean biomass (mol C m–2 yr–1 from Tanaka & Rassoulzadegan 2002) and those between boxes denote estimatecarbon flow (mmol C m–2 yr–1 from Tanaka et al. 2005). PV: specific mortality of prokaryotes by viral infection; CZ: specific
mortality rate of ciliates by zooplankton
Tanaka: NW Mediterranean mesopelagic microbial loop
plankton in the mesopelagic layer (Tanaka et al. 2005).In the idealized food chain (Fig. 4), the number ofequations required for describing the steady state canbe narrowed down to 2, in which the data on microbialbiomass and PHP were used to estimate 3 processparameters by linear regression analysis. Estimatedspecific clearance rate (±SE) of HNF for prokaryotes inthe mesopelagic depth layer (0.0007 ± 0.0001 l nmolC–1 d–1) was equivalent to 8.9 ± 1.3 nl HNF–1 h–1, usingthe mean cell volume at the DYFAMED site (Tanaka &Rassoulzadegan 2002) and the carbon to volume con-version factor of 183 fg C µm–3 (Caron et al. 1995). Theresult falls within the upper part of the range (1 to 11 nlHNF–1 h–1) reported from the Sea of Japan based onthe measurement of uptake rates of fluorescentlylabeled prokaryotes by HNF down to 500 m (Cho et al.2000). HNF growth efficiency on prokaryotes was esti-mated to be 1.12 ± 0.15% (Tanaka et al. 2005). Thisestimate is below the reported range (4 to 49%) for fla-gellates under variable experimental conditions (e.g.temperature and prey concentration) (reviewed byCaron & Goldman 1990) and much lower than the esti-mated PGE values (19 to 39%) in the mesopelagiclayer. This suggests that the prokaryotic ingestion byHNF functions as a remineralization rather than anenergy transferring process to higher trophic levels inthe mesopelagic layer at the DYFAMED site.
A back-calculation, using the estimated parametersand the annual mean of integrated biomass, suggeststhat 40 to 48% of prokaryotic mortality is due to HNFingestion and the rest is due to viral lyses in themesopelagic layer (Fig. 4). This, however, may be con-trary to a suggestion that virus-induced mortality ofprokaryotes is low (3 to 6%) in the mesopelagic andbathypelagic layers at the same site (Weinbauer et al.2003). A similar magnitude of vertical decrease be-tween HNF and viruses (Tanaka & Rassoulzadegan2002, Weinbauer et al. 2003) may suggest that theprokaryotic mortality by HNF and viruses decreasessimilarly over the mesopelagic layer at the DYFAMEDsite. PHP transferred to ciliates and zooplankton wasestimated to be low (0.36 to 0.43% and 0.039 to0.0046%, respectively). This suggests a distance with-in the trophic link between the group of microbialcomponents including viruses, prokaryotes, and HNFand that including ciliates and zooplankton over themesopelagic layer at the DYFAMED site.
Increase in the number of trophic levels generallyresults in less efficient material transfer from a lowertrophic level to a higher trophic level or more efficientremineralization of organic carbon in the food web, theoutcome of which has been addressed as a function ofthe microbial loop in the epipelagic layer (Azam et al.1983, but see also Thingstad et al. 2005). A similar gen-eralization may be applied to the case found in the
mesopelagic layer, where viruses, prokaryotes, HNF,ciliates, and zooplankton are all present to constitutethe mesopelagic plankton food web. The model analy-sis by Tanaka et al. (2005) suggests that mesopelagicPHP is allocated either almost equally to aDOC–prokaryote–virus circuit (cf. viral loop: Bratbaket al. 1990) and a DOC–microbial loop circuit, or 1.5times greater to the former than the latter, and thatHNF are potentially important remineralizers of theorganic carbon produced by mesopelagic prokaryotes.
CONCLUSIONS
In the NW Mediterranean Sea, it has been shownthat: (1) the depth-dependent decrease in abundanceand biomass is greater for protists than for prokaryotes;(2) the dominance of prokaryotes in terms of microbialbiomass increases with depth; (3) the integrated bio-mass of protists in the mesopelagic layer is as great asthat in the epipelagic layer; (4) turnover times ofprokaryotic biomass at the DYFAMED site are longerthan those in most other oceanic regions; (5) produc-tion of mesopelagic prokaryotes is governed by bothbottom-up and top-down controls; (6) the currentlyapproximated PGE values suggest that mesopelagicprokaryotes are not simply remineralizers of organiccarbon, and that PHP supports the production oforganisms in higher trophic levels; and (7) the analysisusing a simple food chain model suggests that HNFmay be important remineralizers consuming theorganic carbon produced by prokaryotes, and that theviral loop may enhance remineralization of organiccarbon by reducing the transfer of POC from prokary-otes to higher trophic levels in the mesopelagic layer.
Future studies, however, need to clarify a multitudeof uncertainties associated with the parameters usedfor estimating organic carbon flux and biomass andactivity of the microbial components in the meso-pelagic layer. Compared to the data on distribution,diversity, and activity of prokaryotes in the meso-pelagic layer, data on viruses and protists in themesopelagic layer are currently very limited. More-over, very little is known about predator–prey andvirus–host relationships among the microbial compo-nents constituting the mesopelagic plankton food web.Although the importance of sinking particles and theactivity of particle-attached microbial community inthe organic carbon flux is known (e.g. Alldredge & Sil-ver 1988, Cho & Azam 1988, Turley & Mackie 1994),the structure and function of the microbial food web inand around such hot spots remains unclear (cf. Azam1998). The simple food chain model used by Tanaka etal. (2005) (see Fig. 4) does not take particle-attachedmicrobial communities into account because of the
359
Aquat Microb Ecol 57: 351–362, 2009
lack of such data. Zooplankton (e.g. appendiculariansand salps) that can specifically consume particles assmall as prokaryotes may reduce the distance betweenthe microbial loop and zooplankton within the concep-tual food web by making a shortcut between the two.The observation of pellet fluxes at 500 m at theDYFAMED site suggests the presence of mesopelagicappendicularians (Carroll et al. 1998), which were thedominant macrozooplankton around 400 m near theDYFAMED site (Laval et al. 1989). The biogeochemicalcycling of elements is the result of element transfersbetween biological and non-biological compartments.To better to understand the structure and function ofthe mesopelagic plankton food web and its contribu-tion to the biogeochemical cycling of elements in themesopelagic layer, one of the great challenges is toquantify the interactions (e.g. predator– prey andvirus–host relationships) among the microbial compo-nents constituting the mesopelagic plankton food web.
Acknowledgements. F. Rassoulzadegan gave me an opportu-nity to extend my study of the microbial loop to deeperwaters. The modeling analysis was done through collabora-tion with F. Thingstad. I thank J.-C. Marty for the DYFAMEDprogram, and the captains and crews of RV ‘Téthys II’ and A.Stock for generous assistance at sea. During the field andmodeling studies, T.T. was supported by the EC through con-tracts EVK3-CT-1999-00009 (Cycling of Phosphorus in theMediterranean) and EVK3-CT-2001-00049 (Detection andAnalysis of Nutrient Limitation) and by the EU through con-tract HPRI-1999-CT-00056 (Bergen Marine Food ChainResearch Infrastructure). Constructive comments by the edi-tor and 3 anonymous reviewers improved the manuscript.
LITERATURE CITED
Alldredge AL, Silver MW (1988) Characteristics, dynamicsand significance of marine snow. Prog Oceanogr 20:41–82
Andersen V, Prieur L (2000) One-month study in the open NWMediterranean Sea (DYNAPROC experiment, May 1995):overview of the hydrobiogeochemical structures andeffects of wind events. Deep-Sea Res I 47:397–422
Arístegui J, Duarte CM, Gasol JM, Alonso-Saez L (2005)Active mesopelagic prokaryotes support high respirationin the subtropical northeast Atlantic Ocean. Geophys ResLett 32:L03608
Arístegui J, Gasol JM, Duarte CM, Herndl GJ (2009) Micro-bial oceanography of the dark ocean’s pelagic realm. Lim-nol Oceanogr 54:1501–1529
Avril B (2002) DOC dynamics in the northwestern Mediter-ranean Sea (DYFAMED site). Deep-Sea Res II 49:2163–2182
Azam F (1998) Microbial control of oceanic carbon flux: theplot thickens. Science 280:694–696
Azam F, Fenchel T, Field JG, Gray JS, Meyer-Reil LA,Thingstad TF (1983) The ecological role of water-columnmicrobes in the sea. Mar Ecol Prog Ser 10:257–263
Baltar F, Arístegui J, Gasol JM, Sintes E, Herndl GJ (2009)Evidence of prokaryotic metabolism on suspended partic-ulate organic matter in the dark waters of the subtropicalNorth Atlantic. Limnol Oceanogr 54:182–193
Banse K (1990) New views on the degradation and dispositionof organic particles as collected by sediment traps in theopen sea. Deep-Sea Res A 37:1177–1195
Béthoux JP, Prieur L, Bong JH (1988) The Ligurian current offthe French Riviera. Oceanol Acta 9:59–67
Béthoux JP, Morin P, Madec C, Gentili B (1992) Phosphorusand nitrogen behaviour in the Mediterranean Sea. Deep-Sea Res A 39:1641–1654
Bratbak G, Heldal M, Norland S, Thingstad TF (1990) Virusesas partners in spring bloom microbial trophodynamics.Appl Environ Microbiol 56:1400–1405
Buesseler KO, Anita AN, Chen M, Fowler SW and others(2007) An assessment of the use of sediment traps for esti-mating upper ocean particle fluxes. J Mar Res 65:345–416
Carlson CA, Ducklow HW, Michaels AF (1994) Annual flux ofdissolved organic carbon from the euphotic zone in thenorthwestern Sargasso Sea. Nature 371:405–408
Carlson CA, Giovannoni SJ, Hansell DA, Goldberg SJ, Par-sons R, Vergin K (2004) Interactions among dissolvedorganic carbon, microbial processes, and communitystructure in the mesopelagic zone of the northwestern Sar-gasso Sea. Limnol Oceanogr 49:1073–1083
Caron DA, Goldman JC (1990) Protozoan nutrient regenera-tion. In: Capriulo GM (ed) Ecolog of marine protozoa.Oxford Univeristy Press, New York, p 283–306
Caron DA, Dam HG, Kremer P, Lessard EJ and others (1995)The contribution of microorganisms to particulate carbonand nitrogen in surface waters of the Sargasso Sea nearBermuda. Deep-Sea Res I 42:943–972
Carroll ML, Miquel JC, Fowler SW (1998) Seasonal patternsand depth-specific trends of zooplankton fecal pelletsfluxes in the Northwestern Mediterranean Sea. Deep-SeaRes I 45:1303–1318
Cho BC, Azam F (1988) Major role of bacteria in biogeochem-ical fluxes in the ocean’s interior. Nature 332:441–443
Cho BC, Na SC, Choi DH (2000) Active ingestion of fluores-cently labeled bacteria by mesopelagic heterotrophicnanoflagellates in the East Sea, Korea. Mar Ecol Prog Ser206:23–32
Claustre H (1994) The trophic status of various oceanicprovinces as revealed by phytoplankton pigment signa-tures. Limnol Oceanogr 39:1206–1210
Cole JJ, Findlay S, Pace ML (1988) Bacterial production infresh and saltwater ecosystems: a cross-system overview.Mar Ecol Prog Ser 43:1–10
Copin-Montégut G, Avril B (1993) Vertical distribution andtemporal variation of dissolved organic carbon in thenorth-western Mediterranean Sea. Deep-Sea Res I 40:1963–1972
Copin-Montégut C, Bégovic M (2002) Distributions of carbon-ate properties and oxygen along the water column(0–2000 m) in the central part of the NW MediterraneanSea (Dyfamed site): influence of winter vertical mixing onair–sea CO2 and O2 exchanges. Deep-Sea Res II 49:2049–2066
del Giorgio PA, Cole JJ (2000) Bacterial energetics andgrowth efficiency. In: Kirchman DL (ed) Ecology of theoceans. John Wiley & Sons, New York, p 289–325
Ducklow HW (1993) Bacterioplankton distributions and pro-duction in the northwestern Indian Ocean and Gulf ofOman, September 1986. Deep-Sea Res II 40:753–771
Dufour P, Torréton JP (1996) Bottom-up and top-down controlof bacterioplankton from eutrophic to oligotrophic sites inthe tropical northeastern Atlantic Ocean. Deep-Sea Res I43:1305–1320
Dugdale RC, Goering JI (1967) Uptake of new and regener-ated forms of nitrogen in primary productivity. Limnol
360
Tanaka: NW Mediterranean mesopelagic microbial loop
Oceanogr 12:196–206Fowler SW, Knauer GA (1986) Role of large particles in the
transport of elements and organic compounds through theoceanic water column. Prog Oceanogr 16:147–194
Fuhrman JA, Davis AA (1997) Widespread Archaea and novelBacteria from the deep sea as shown by 16S rRNA genesequences. Mar Ecol Prog Ser 150:275–285
Fukuda R, Ogawa H, Nagata T, Koike I (1998) Direct determi-nation of carbon and nitrogen contents of natural bacterialassemblages in marine environments. Appl EnvironMicrobiol 64:3352–3358
Fukuda H, Sohrin R, Nagata T, Koike I (2007) Size distributionand biomass of nanoflagellates in meso- and bathypelagiclayers of the subarctic Pacific. Aquat Microb Ecol 46:203–207
Gowing MM, Garrison DL, Wishner KF, Gelfman C (2003)Mesopelagic microplankton of the Arabian Sea. Deep-SeaRes I 50:1205–1234
Haas LW (1982) Improved epifluorescence microscopyfor observing planktonic micro-organisms. Ann InstOceanogr 58(Suppl):261–266
Harris JRW, Stutt ED, Turley CM (2001) Carbon flux in thenorthwest Mediterranean estimated from microbial pro-duction. Deep-Sea Res I 48:2631–2644
Havskum H, Thingstad TF, Scharek R, Peters F and others(2003) Silicate and labile DOC interfere in structuring themicrobial food web via algal-bacterial competition formineral nutrients: results of a mesocosm experiment. Lim-nol Oceanogr 48:129–140
Jacquet S, Lennon JF, Marie D, Vaulot D (1998) Picoplanktonpopulation dyanamics in coastal waters of the northwest-ern Mediterranean Sea. Limnol Oceanogr 43:1916–1931
Karner MB, DeLong EF, Karl DM (2001) Archaeal dominancein the mesopelagic zone of the Pacific Ocean. Nature 409:507–510
Kirchman DL (1992) Incorporation of thymidine and leucinein the subarctic Pacific: application to estimating bacterialproduction. Mar Ecol Prog Ser 82:301–309
Koppelmann R, Zimmermann-Timm H, Weikert H (2005) Bac-terial and zooplankton distribution in deep waters of theArabian Sea. Deep-Sea Res I 52:2184–2192
Kress N, Herut B (2001) Spatial and seasonal evolution of dis-solved oxygen and nutrients in the Southern LevantineBasin (Eastern Mediterranean Sea): chemical characteri-zation of the water masses and inferences on the N: Pratios. Deep-Sea Res I 48:2347–2372
Krom MD, Kress N, Brenner S, Gordon LI (1991) Phosphoruslimitation of primary productivity in the eastern Mediter-ranean Sea. Limnol Oceanogr 36:424–432
Krom MD, Groom S, Zohary T (2003) The eastern Mediter-ranean. In: Black KD, Shimmield GB (eds) Biogeochem-istry of marine systems. Blackwell, Oxford, p 91–126
Krom MD, Woodward EMS, Herut B, Kress N and others(2005) Nutrient cycling in the south east Levantine basinof the eastern Mediterranean: results from a phosphorusstarved system. Deep-Sea Res II 52:2879–2896
Laval P, Braconnot JC, Carre C, Goy J, Morand P, Mills CE(1989) Small-scale distribution of macroplankton andmicronekton in the Ligurian Sea (Mediterranean Sea) asobserved from the manned submersible Cyana. J PlanktonRes 11:665–685
Legendre L, Rivkin RB (2002) Fluxes of carbon in the upperocean: regulation by food-web control nodes. Mar EcolProg Ser 242:95–109
Martin JH, Knauer GA, Karl DM, Broenkow WW (1987) VER-TEX: carbon cycling in the northeast Pacific. Deep-SeaRes A 34:267–285
Martin V, van Wambeke F, Bianchi A, Denis M (1994) A new
way to estimate bacterial growth efficiency in the watercolumn by determining simultaneously ETS activity andbacterial production. In: Canals M, Lipiatoa E (eds) FirstWorkshop of the Mediterranean Targeted Project, p 95–99
Marty JC (2002) The DYFAMED time-series program(French-JGOFS). Deep-Sea Res II 49:1963–1964
Marty JC (2003) DYFAMED observation service. Available atwww.obs-vlfr.fr/sodyf (in French)
Marty JC, Chiavérini J (2002) Seasonal and interannual vari-ations in phytoplankton production at DYFAMED time-series station, Northwestern Mediterranean Sea. Deep-Sea Res II 49:2017–2030
Marty JC, Nicolas E, Miquel JC, Fowler SW (1994) Particulatefluxes of organic compounds and their relationship to zoo-plankton fecal pellets in the northwestern MediterraneanSea. Mar Chem 46:387–405
Marty JC, Chiaverini J, Pizay MD, Avril B (2002) Seasonaland interannual dynamics of nutrients and phytoplanktonpigments in the western Mediterranean Sea at theDYFAMED time-series station (1991–1999). Deep-Sea ResII 49:1965–1985
Mével G, Vernet M, Goutx M, Ghiglione JF (2008) Seasonal tohour variation scales in abundance and production of totaland particle-attached bacteria in the open NW Mediter-ranean Sea (0–1000 m). Biogeosciences 5:1573–1586
Miquel JC, Fowler SW, La Rosa J (1993) Vertical particlefluxes in the Ligurian Sea. Ann Inst Oceanogr 69:107–110
Miquel JC, Fowler SW, La Rosa J, Buat-Menard P (1994)Dynamics of the downward flux of particles and carbon inthe open northwestern Mediterranean Sea. Deep-Sea ResI 41:243–261
Misic C, Fabiano M (2006) Ectoenzymatic activity and its rela-tionship to chlorophyll-a and bacteria in the Gulf of Genoa(Ligurian Sea, NW Mediterranean). J Mar Syst 60:193–206
Moutin T, Raimbault P (2002) Primary production, carbonexport and nutrients availability in western and easternMediterranean Sea in early summer 1996 (MINOS cruise).J Mar Syst 33-34:273–288
Nagata T, Fukuda R, Fukuda H, Koike I (2001) Basin-scalegeographic patterns of bacterioplankton biomass and pro-duction in the subarctic Pacific, July–September 1997.J Oceanogr 57:301–313
Porter KG, Feig YS (1980) The use of DAPI for identifying andcounting aquatic microflora. Limnol Oceanogr 25:943–948
Putt M, Stoecker DK (1989) An experimentally determinedcarbon: Volume ratio for marine ‘oligotrichous’ ciliatesfrom estuarine and coastal waters. Limnol Oceanogr 34:1097–1103
Reinthaler T, van Aken H, Veth C, Arístegui J and others(2006) Prokaryotic respiration and production in the meso-and bathypelagic realm of the eastern and western NorthAtlantic basin. Limnol Oceanogr 51:1262–1273
Richardson TL, Jackson GA (2007) Small phytoplankton andcarbon export from the surface ocean. Science 315:838–840
Ridame C, Guieu C (2002) Saharan input of phosphate to theoligotrophic water of the open western MediterraneanSea. Limnol Oceanogr 47:856–869
Smith DC, Simon M, Alldredge AL, Azam F (1992) Intensehydrolytic enzyme activity on marine aggregates and impli-cations for rapid particle dissolution. Nature 359:139–142
Steinberg DK, Silver MW, Pilskaln CH, Coale SL, Paduan JB(1994) Midwater zooplankton communities on pelagicdetritus (giant larvacean houses) in Monterey Bay, Cali-fornia. Limnol Oceanogr 39:1606–1620
Steinberg DK, van Mooy BAS, Buesseler KO, Boyd PW,
361
Aquat Microb Ecol 57: 351–362, 2009
Kobari T, Karl DM (2008) Bacterial vs. zooplankton controlof sinking particle flux in the ocean’s twilight zone. LimnolOceanogr 53:1327–1338
Tamburini C, Garcin J, Ragot M, Bianchi A (2002) Biopolymerhydrolysis and bacterial production under ambient hydro-static pressure through a 2000 m water column in the NWMediterranean. Deep-Sea Res II 49:2109–2123
Tanaka T, Rassoulzadegan F (2002) Full-depth profile(0–2000 m) of bacteria, heterotrophic nanoflagellates andciliates in the NW Mediterranean Sea: vertical partition-ing of microbial trophic structures. Deep-Sea Res II 49:2093–2107
Tanaka T, Rassoulzadegan F (2004) Vertical and seasonalvariations of bacterial abundance and production in themesopelagic layer of the NW Mediterranean Sea: bottom-up and top-down controls. Deep-Sea Res I 51:531–544
Tanaka T, Rassoulzadegan F, Thingstad TF (2005) Analyzingthe trophic link between the mesopelagic microbial loopand zooplankton from observed depth profiles of bacteriaand protozoa. Biogeosciences 2:9–13
Tanaka T, Zohary T, Krom MD, Law CS and others (2007)Microbial community structure and function in the East-ern Mediterranean with reference to the Cyprus warm-core eddy. Deep-Sea Res I 54:1721–1743
Thingstad FT (2000) Control of bacterial growth in idealisedfood web. In: Kirchman DL (ed) Microbial ecology of theocean. John Wiley & Sons, New York, p 229–259
Thingstad TF, Rassoulzadegan F (1995) Nutrient limitations,microbial food webs, and ‘biological C-pumps’: suggestedinteractions in a P-limited Mediterranean. Mar Ecol ProgSer 117:299–306
Thingstad TF, Rassoulzadegan F (1999) Conceptual modelsfor the biogeochemical role of the photic zone microbialfood web, with particular reference to the MediterraneanSea. Prog Oceanogr 44:271–286
Thingstad TF, Zweifel UL, Rassoulzadegan F (1998) P limita-tion of heterotrophic bacteria and phytoplankton in thenorthwest Mediterranean. Limnol Oceanogr 43:88–94
Thingstad TF, Krom MD, Mantoura RFC, Flaten GAF and oth-ers (2005) Nature of phosphorus limitation in the ultraolig-otrophic eastern Mediterranean. Science 309:1068–1071
Thingstad TF, Bellerby RGJ, Bratbak G, Børsheim KY andothers (2008) Counterintuitive carbon-to-nutrient cou-
pling in an Arctic pelagic ecosystem. Nature 455:387–391 Turley CM, Mackie PJ (1994) Biogeochemical significance of
attached and free-living bacteria and the flux of particlesin the NE Atlantic Ocean. Mar Ecol Prog Ser 115:191–203
Turley CM, Stutt ED (2000) Depth-related cell-specific bacte-rial leucine incorporation rates on particles and its biogeo-chemical significance in the northwest Mediterranean.Limnol Oceanogr 45:419–425
Turley CM, Bianchi M, Christaki U, Conan P and others(2000) Relationship between primary producers andbacteria in an oligotrophic sea — the Mediterraneanand biogeochemical implications. Mar Ecol Prog Ser193:11–18
Vaulot D, LeBot N, Marie D, Fukai E (1996) Effects of phos-phorus on the Synechococcus cell cycle in surfaceMediterranean waters during summer. Appl EnvironMicrobiol 62:2527–2533
Verity PG, Langdon C (1984) Relationships between loricavolume, carbon, nitrogen, and ATP content of tintinnids inNarragansett Bay. J Plankton Res 6:859–868
Volk T, Hoffert MI (1985) Ocean carbon pumps: analysis ofrelative strengths and efficiencies in ocean-driven atmos-pheric CO2 changes. American Geophysical Union, Wash-ington, DC
Weinbauer MG, Brettar I, Höfle MG (2003) Lysogeny andvirus-induced mortality of bacterioplankton in surface,deep, and anoxic marine waters. Limnol Oceanogr 48:1457–1465
White PA, Kalff J, Rasmussen JB, Gasol JM (1991) The effectof temperature and algal biomass on bacterial productionand specific growth rate in freshwater and marine habi-tats. Microb Ecol 21:99–118
Williams PJLB (2000) Heterotrophic bacteria and the dynam-ics of dissolved organic material. In: Kirchman DL (ed)Microbial ecology of the oceans. John Wiley & Sons, NewYork, p 153–200
Zohary T, Herut B, Krom MD, Mantoura RFC and others(2005) P-limited bacteria but N and P co-limited phyto-plankton in the Eastern Mediterranean — a microcosmexperiment. Deep-Sea Res II 52:3011–3023
Zweifel UL, Norrman B, Hagström A (1993) Consumption ofdissolved organic carbon by marine bacteria and demandfor inorganic nutrients. Mar Ecol Prog Ser 101:23–32
362
Submitted: April 1, 2009; Accepted: September 3, 2009 Proofs received from author(s): October 10, 2009