structure and properties of clay ceramics for thermal
TRANSCRIPT

HAL Id: hal-01630902https://hal-mines-albi.archives-ouvertes.fr/hal-01630902
Submitted on 16 Jan 2019
HAL is a multi-disciplinary open accessarchive for the deposit and dissemination of sci-entific research documents, whether they are pub-lished or not. The documents may come fromteaching and research institutions in France orabroad, or from public or private research centers.
L’archive ouverte pluridisciplinaire HAL, estdestinée au dépôt et à la diffusion de documentsscientifiques de niveau recherche, publiés ou non,émanant des établissements d’enseignement et derecherche français ou étrangers, des laboratoirespublics ou privés.
Structure and properties of clay ceramics for thermalenergy storage
Pierre-Marie Nigay, Ange Nzihou, Claire E. White, Winston O. Soboyejo
To cite this version:Pierre-Marie Nigay, Ange Nzihou, Claire E. White, Winston O. Soboyejo. Structure and propertiesof clay ceramics for thermal energy storage. Journal of the American Ceramic Society, Wiley, 2017,100 (10), pp.4748-4759. �10.1111/jace.15014�. �hal-01630902�

Structure and properties of clay ceramics for thermal energystorage
Pierre-Marie Nigay1,2 | Ange Nzihou1 | Claire E. White3,4 | Winston O. Soboyejo2,5
1Centre RAPSODEE, Ecole des Minesd’Albi, Albi, France2Department of Mechanical Engineering,Worcester Polytechnic Institute,Worcester, Massachusetts3Department of Civil and EnvironmentalEngineering, Princeton University,Princeton, New Jersey4Andlinger Center for Energy and theEnvironment, Princeton University,Princeton, New Jersey5Department of Mechanical andAerospace Engineering, PrincetonUniversity, Princeton, New Jersey
CorrespondencePierre-Marie Nigay, Centre RAPSODEE,Ecole des Mines d’Albi, Albi, France.Email: [email protected]
Funding InformationThis study was funded by InstitutCARNOT Mines (CARNOT 2013).
AbstractIn this paper, the structure-property relationships of a clay ceramic with organicadditives (biomass and biochar) are investigated to develop an alternative materialfor thermal energy storage. The firing transformations were elucidated usingX-ray pair distribution function analysis, differential scanning calorimetry, andscanning electron microscopy. It was found that the biomass increased the poros-ity, which resulted in a decrease of the specific heat capacity. On the other hand,the biochar remained in the clay ceramic without any interaction with the claymatrix up to 950°C. The specific heat capacity of the clay ceramic increased from1.20 to 1.49 kJ/kg!K for a 30 wt% addition of biochar. The clay ceramic with a30 wt% addition of biochar also conserved a high flexural strength of 11.1 MPacompared to that of the clay ceramic without organic additives (i.e., 18.9 MPa).Furthermore, the flexural strength only decreased by 23% after 100 thermalcycles. The crack growth associated with the thermal fatigue was limited by crackbridging and crack trapping. Hence, the current results suggest that clay/biocharceramics can be as efficient as molten salts in thermal energy storage with theadded benefit of an ease of use in the physical form of bricks.
KEYWORD Senergy conversion, fatigue, phase transformations, R-curve, thermal properties
1 | INTRODUCTION
The production of electricity from renewable energysources is expected to grow in the years ahead. The con-version of solar, wind, or biomass power is a sustainableway of reducing our modern dependency on fossil fuels.However, the use of renewables is still limited by the inter-mittency of the renewable energy sources.1 For instance,solar-powered systems generate electricity during the day-time, while electricity is needed over 24 hours in a day.
Energy storage technologies have emerged to level theintermittent production of electricity from renewable energysources. These technologies include electrochemical,2
mechanical,3 or thermal energy storage.4 Thermal energystorage is based on a reversible transfer of heat, in the sen-sible or latent form,5 that does not require any production
of electricity. This makes thermal energy storage a low costtechnology which is appropriate for many systems in theproduction of thermal energy.6
For sensible heat storage, materials are introduced in acontainer and heated. The amount of energy stored is propor-tional to the mass (i.e., porosity), the specific heat capacity,and the temperature increase of the storage materials. Thetemperature increase (charging) is usually performed by thecirculation of warm air through the storage materials. Subse-quently, energy can be reused (discharging) to warm a circu-lating flow of cool air. The charging/discharging rates arecontrolled by the shape of the storage materials in the case ofa solid medium. In fact, a reduction of the thickness resultsin a greater exchange at the surfaces of the materials.7
Molten salts are widely used in thermal energy storagesystems for their high specific heat capacities between 1.10

and 1.50 kJ/kg!K in liquid form.8 However, the utilizationof liquid forms requires infrastructure with a complex sys-tem of tanks. Concrete is another attractive material forthermal energy storage. It has a low cost and relevantspecific heat capacities of 0.95 kJ/kg!K.9 Nevertheless, thethermal degradation of concrete at temperatures greaterthan 500°C limits the utilization of concrete to low-tem-perature storage solutions.10
In contrast, many ceramic materials are stable up totemperatures of 1000°C.11 The ceramic materials are alsoprocessed in the form of bricks that makes them convenientfor thermal energy storage. However, most of the ceramicmaterials have low specific heat capacities in comparisonwith concrete or molten salts (0.87 kJ/kg!K).12 The ceramicmaterials also remain expensive to produce compared tothe other materials. Hence, the objective of this study is toinvestigate the structure-property relationship of a clayceramic with organic additives (biomass and biochar) todevelop an alternative material with a high specific heatcapacity.
2 | MATERIALS ANDEXPERIMENTAL METHODS
2.1 | Raw materials
The clay that was used in this study was extracted in theform of lumps from a clay quarry in the Toulouse area(France). The lumps of clay were ground into smallerlumps of around 3 mm using a rolling mill (LA 1527;Vicentini, Vicenza, Italy). The elemental composition ofthe clay, measured via X-ray fluorescence analysis (Epsilon3-XL; PanAlytical, Almelo, the Netherlands), is given inTable 1. Note the predominance of silicon and aluminumoxides, with smaller amounts of calcium, iron, potassiumand magnesium oxides.
The organic additives that were used in this study con-sisted of biomass and biochar. The biomass was producedby grinding a hard wood with a knife mill (Pulverisette 15,Fritsch, Idar-Oberstein, Germany), while the biochar wasproduced by pyrolysis of the biomass at 500°C. The ele-mental composition was measured using organic elementalanalysis (Flash 2000; Thermo Fisher Scientific, Waltham,MA). The results of the organic elemental analyses aregiven in Table 2. They show that the organic additives are
composed of carbon, oxygen, and hydrogen with low con-centrations of oxygen in the biochar compared to the bio-mass. The particle size of the organic additives wasmeasured using laser granulometry (Mastersizer 3000; Mal-vern, Orsay, France). The results indicated that the biomasshas an average particle size of 60 lm while the biocharhas a smaller average particle size of 20 lm.
2.2 | Processing of the clay ceramic
The clay ceramic that was investigated in this study wasproduced from mixtures of clay, organic additives, andwater. The mixtures were made in a kneading bowl by themixing of clay with 5, 10, and 15 wt% of organic addi-tives. The mixtures were kneaded for 5 minutes with agradual addition of water up to 28 wt%. The mixtures werethen extruded using a bench extruder (Reber, Correg-gioverde di Dosolo, Italy) composed of a pipe and a crankactivated piston. The mixtures were pushed into the pipeand released across a die as clay blocks of 60 mm9
30 mm910 mm.The clay blocks were subsequently dried at 25°C, 65°C,
and 105°C for 24 hours in an electric oven (Memmert,Schwabach, Germany). Samples were then prepared fromthe dried blocks by polishing with P80, P120, P180, andP280 SiC abrasive papers (CarbiMet, Buehler, Uzwil,Switzerland). Finally, the samples were fired in a sealedbox, with a nitrogen flow of 5 L/min, inside of a mufflefurnace (K1253; Heraeus, Hanau, Germany). The samplesthat were used for the X-ray diffraction and pair distribu-tion function analyses were fired at 30°C, 600°C, 800°C,or 1000°C. The other samples were fired under the sameconditions at 950°C.
2.3 | Characterization of structure
The atomic structure of the clay ceramic was investigatedusing X-ray diffraction (XRD) analysis. The samples inpowder form were loaded in a 1 mm diameter polyimidecapillary, which was sealed at both ends with modelingclay. The capillaries were aligned on the capillary stage ofthe diffractometer (D8 Discover; Bruker, Madison, WI) andtested while spinning. The data were collected over a 2hrange of 2°-130°, with a step size of 0.05°, using a silver
TABLE 1 Elemental composition of the clay with theconcentrations in silicon, aluminum, calcium, iron, potassium, andmagnesium oxides
Sample
Concentration (wt%)
SiO2 Al2O3 CaO Fe2O3 K2O MgO
Clay 57.1 14.5 8.9 6.2 3.0 2.2
TABLE 2 Elemental composition of the organic additives withthe concentrations in carbon, hydrogen, oxygen, nitrogen, and sulfurelements
Sample
Concentration (wt%)
C H O N S
Biomass 49.5 6.8 42.4 0.2 0.0
Biochar 84.9 4.0 9.8 0.5 0.0

(Ag) radiation source (k=0.56 !A). The scattering of thepolyimide and modeling clay was subsequently removedby subtracting a baseline that was produced from the test-ing of an empty capillary which was yet sealed with mod-eling clay. Finally, the pair distribution functions of thesamples were obtained by the application of a sine Fouriertransform (Equation 1) to those total scattering functionsS(Q) in the PDFgetX2 software13 using a momentum trans-fer Qmax of 15 !A"1.
GðrÞ ¼ 2p
Z Qmax
Qmin
Q S ðQÞ"1½ ' sin ðQrÞdQ: (1)
The weight loss of the clay ceramic was measured as afunction of temperature, using thermogravimetric analyses(TGA). Unfired samples were analyzed in the form of200 mg cylinders with a Q600 apparatus (TA Instruments,New Castle, DE). The data were collected from 30°C to1100°C under a nitrogen flow at a heating rate of 5°C/min.The percentage of organic additives was determined bysubtracting the weight loss of the clay ceramic withoutorganic additives. This was done since the thermal behav-ior of the organic additives within the clay ceramic is dif-ferent from that out of the clay ceramic.
The porosity of the clay ceramic was determined fromthe measurement of the bulk density and of the true density(e=1"qBulk/qtrue). The bulk density was measured using abalance and a caliper while the true density was measuredby helium pycnometry analysis (Accupyc 1330; Micromerit-ics, Norcross, GA) after firing at the maximum temperatureof 1100°C and grinding to eliminate the porosity.
The morphology of the organic additives and of theporosity within the clay ceramic was observed using scan-ning electron microscopy (XL30; Philips, Amsterdam, theNetherlands). The samples were embedded in a solidifyingepoxy resin and polished before the imaging underbackscattered imaging conditions.
2.4 | Determination of the thermal properties
The thermal properties of the clay ceramic were determinedusing a transitory plane source method (TPS 2500, Hot DiskAB, Gothenburg, Sweden). Duplicate samples of30 mm930 mm95 mm were analyzed with a mica probe(3.189 mm radius) at 500°C. It involved the introduction ofthe facility in an electrical furnace (AET Technologies, Mey-lan, France). Following the test, an algorithm of the ThermalConstants Analyzer software (Hot Disk AB, Gothenburg,Sweden) was used to determine the volumetric heat capacityof the clay ceramic. The specific heat capacity was subse-quently determined by dividing the volumetric heat capacityby the bulk density. The bulk density of the clay ceramicwas obtained from measurements of the weight and of thedimensions using a balance and a caliper.
2.5 | Determination of the mechanicalproperties
The mechanical properties of the clay ceramic were mea-sured by three-point bending. The measurements were per-formed using an Instron 8548 microtester (Instron,Norwood, MA) with a 50 mm span and a 500 N load cell.The specimens of 60 mm910 mm95 mm were loaded at aconstant displacement rate of 1 mm/min until the onset ofthe fracture. The flexural strength (rf) was estimated fromEquation 2, where FMax is the maximum force, L is theloading span, B is the breadth, and H is the height of thespecimens.14.
rf ¼3FMaxL2BH2 : (2)
The fracture toughness/resistance-curve behavior of theclay ceramic was investigated using single edge notchbend (SENB) specimens. The SENB specimens withdimensions of 60 mm910 mm95 mm and notch depths of2 mm (0.40-0.45 length-to-width ratio) were tested in thesame Instron 8548 microtester (Instron, Norwood, MA)that was used for the measurements of the flexuralstrength. The specimens were loaded at a displacement rateof approximately 0.1 mm/min until pop-in was observed atthe notch.
In-situ observations of cracking were carried out duringthe fracture experiments, using a microscope with a 59magnification (MZ 8; Leica, Wetzlar, Germany). The loadswere then increased in incremental stages to determine theresistance curves with procedures from the literature.15 Thestress intensity factors (KI) were obtained from Equation 3,where rf is the stress at the peak load, a is the cracklength, and (f(a/w)) is a compliance function.16
KI ¼ f ða=WÞ ( rf (ffiffiffiffiffiffipa
p: (3)
The underlying crack/microstructure interactions of theresistance-curve behavior were elucidated via in-situ opti-cal microscopy (MZ 8, Leica) and ex-situ scanning elec-tron microscopy (XL30, Philips) to guide the developmentof small/large-scale crack bridging and crack trappingmodels.
2.6 | Thermal reliability
The thermal reliability of the clay ceramic was investigatedvia three-point bending. The specimens with dimensions of60 mm910 mm95 mm were tested after 0, 1, 10, and 100thermal cycles. In fact, the thermal cycles were simulatedby introduction and withdrawal of the specimens in a muf-fle furnace (K1253, Heraeus, Hanau, Germany) at 500°C.The residual strength of the specimens was determined, asdescribed in Section 2.5.

The reason of the dependence of the residual strengthon the number of thermal cycles was elucidated via scan-ning electron microscopy (XL30, Philips). The observationsof the fracture surfaces of the three-point bending speci-mens were performed under secondary electrons (SE)imaging conditions. In this way, the lengths of the effectivecracks could be measured to predict the residual strengthsafter thermal cycles.
3 | MODELING
3.1 | Structure
The modeling of the structure was based on the thermalbehavior of the organic additives in the clay ceramic. Thethermal behavior was modeled from the Van Krevelen dia-gram17 by reduction of the different domains in a tempera-ture-based equation. The concentrations of carbon, oxygen,and hydrogen after the firing process were calculated as:C+O+H=1 with O=x.C and H=y.C. These were also mea-sured prior to the firing process using elemental analysis.
In this way, the weight percentages of each element thatwere released during the firing process were calculated asthe differences between the concentrations before and afterthe firing process. The sum of the different weight percent-ages provided the weight loss of the organic additives at agiven temperature. Hence, the percentage of organic addi-tives in the clay ceramic (%T) was obtained from Equa-tion 4, using the percentage of addition (%addition) and theweight loss (Dm(T)) of the organic additives.
%ðTÞ ¼ %addition " ð%addition ( DmðTÞÞ (4)
e Tð Þ ¼ eClay þ %Addition " % Tð Þ" #
: (5)
The porosity increase associated with the thermal degrada-tion of the organic additives was regarded as equal to thedifference between the percentage of organic additivesbefore and after the firing process. In this way, the percent-age of porosity at a given temperature (e(T)) was calculatedby summing the porosity from the clay (eClay in Table 3)and the porosity increase from the organic additives asshown in Equation 5.
3.2 | Specific heat capacity
The specific heat capacity (c) of the clay ceramic was pre-dicted using a rule-of-mixture approach (Equation 6). Thepredictions were obtained from the concentration (%Elements)and the intrinsic properties (CElements) of each element. Theconcentrations were measured by X-ray fluorescence analy-sis. On the other hand, the intrinsic properties of silicon,aluminum, calcium, iron, potassium, and magnesium ele-ments of the clay were collected from the literature (given
in Table 3).18 A multiplicative factor of 2.16 was also usedto transpose the intrinsic properties to the temperature of500°C.19.
c ¼X
%Elements ( cElements: (6)
For the organic additives, the concentrations were obtainedfrom the estimates of the model described in the previoussection. The intrinsic properties of carbon, oxygen, andhydrogen elements were also collected from the literature.They were subsequently transposed to the temperature of500°C using a multiplicative factor of 1.14.20 Finally, thesevalues of the solid fraction were adapted to the clay cera-mic using the previous estimates of the porosity.
3.3 | Mechanical strength
The mechanical strength of the clay ceramic was predictedusing the damage model21 in Equation 7. The model deter-mines the mechanical strength under a flexural loading (rf)from the damage of the clay ceramic (D) and the intrinsicstrength of the clay (rClay).
rf ¼ 1 " Dð Þ rClay: (7)
The intrinsic strength of the clay was regarded as equal to37.0 MPa. This value was obtained from the mechanicalstrength of the clay ceramic without organic additives. Onthe other hand, the damage of the clay ceramic was esti-mated from Equation 8,22 where %Defects is the sum of thepercentages of porosity and organic additives and / is themedian defect size.
D ¼ 2/
2/"11 " 1
1 þ %Defectsð Þ/
" #
: (8)
The median defect size relates the percentage of defects totheir effective impact on the damage. In fact, the impact ofthe large pores was regarded as equal to that of a greater vol-ume fraction of small pores. It was obtained from the particlesize distribution of the organic additives with the estimatesof the structure described in Section 3.1 (see Table 3).
3.4 | Fracture toughness
The fracture toughness/resistance curve (KR) estimates ofthe clay ceramic were obtained from the sum of the initia-tion fracture toughness (KI) and the toughening due to theobserved crack-tip shielding mechanisms.23 The crack-tipshielding mechanisms included small/large-scale bridging(KB) and crack trapping (KT) as shown in Equation 9.
KR ¼ KI þ DKB þ DKT : (9)
The toughening due to crack bridging was predicted by asmall-scale approach24 for crack extensions smaller than

0.5 mm and by a large-scale approach25 for crack exten-sions larger than 0.5 mm. The predictions of the small-scale bridging contribution (DKSSB) were obtained fromEquation 10, where VB is the fraction of bridging liga-ments, L is the distance from the crack-tip to the lastunfractured ligament, x is the distance from the crack-tip,and rf is the strength of the bridging ligaments. The pre-dictions of the large-scale bridging contribution (DKLSB)were obtained from Equation 11, where h(a,x) is a weightfunction (see Table 3).26
DKSSB ¼ VB
ffiffiffiffiffi2p
r Z L
0
rfffiffiffix
p dx (10)
DKLSB ¼ VB
Z L
0rf h a; xð Þdx (11)
DKT ¼ KI 1 " 2RL
$ %þ 2:1 þ 4:8
RL
$ %2 2R% Tð Þ
" #
(12)
The toughening due to crack trapping corresponds to theaction of the particles of organic additives on crack propa-gation. The predictions of the crack trapping contributionwere then obtained using the model27 in Equation 12,where R is the radius of the particles, L is the distancebetween the particles, and %(T) is the percentage of parti-cles. It is important to note that the parameters of thecrack-tip shielding models were all estimated from the opti-cal and SEM images of the underlying crack/microstructureinteractions.
3.5 | Thermal reliability
The residual strengths of the clay ceramics were predictedfrom observations of the cracks in the fractured three-pointbending specimens after thermal cycles. The estimates wereobtained using Equation 13, where rr is the residualstrength of the clay ceramic, Kc is the critical fracture
TABLE 3 Inputs of the model equations for the specific heat capacity, the mechanical strength, the fracture toughness, and the thermalreliability
Model Equations Inputs Origin
Specific heat capacity 6 cSi=0.71 kJ/kg!KcAl=0.90 kJ/kg!KcCa=0.65 kJ/kg!KcFe=0.45 kJ/kg!KcK=0.76 kJ/kg!KcMg=1.02 kJ/kg!KcC=0.71 kJ/kg!KcO=0.92 kJ/kg!KcH=14.30 kJ/kg!K
Literature
Mechanical strength 7, 8 rClay=37.0 MPaeClay=23 vol%/Clay=50 lm
Experiments
Fracture toughness 9–12 h[0;0]=0.4980h[0;1]=2.4463h[0;2]=0.0700h[0;3]=1.3187h[0;4]="3.0670h[1;0]=0.5416h[1;1]="5.0806h[1;2]=24.3447
h[1;3]="32.7208h[1;4]=18.1214h[2;0]="0.1927h[2;1]=2.55863h[2;2]="12.6415h[2;3]=19.7630h[2;4]="10.9860
Literature
VB=5 vol%rf=8.7 MPaRBiomass=30 lmLBiomass=150 lmRBiochar=10 lmLBiochar=50 lm
Experiments
Thermalreliability
13, 14 KC=2.0 MPa√m (Clay)KC=1.3 MPa√m (Biomass)KC=1.6 MPa√m (Biochar)aBiochar=0.7 mm (1 cycle)aBiochar=0.9 mm (10 cycles)aBiochar=2.3 mm (100 cycles)
Experiments
toughness of the clay ceramic, F is the boundary correctionfactor of the effective crack, Q is the shape factor of theeffective crack, and a is the length of the effective crack(see Table 3).28
rr ¼Kc
Fffiffiffiffiffiffiffiffiffip aQ
q (13)
The boundary correction factor that was used is a specificfactor for semielliptical surface cracks. It is given by Equa-tion 14, where M1, M2, M3, and g are curve fitting func-tions, f/ is an angular function, fW is a finite-widthcorrection factor, t is the thickness of the plan, and a is thelength of the effective crack.29
F ¼ M1 þ M2at
& '2þ M3
at
& '4( )
g f / fW (14)
The curve fitting functions that are used in Equation 14were estimated from the ratio of the crack depth to thecrack length (a/c). The estimates were all obtained for aratio smaller than one. The determination of the curve fit-ting functions also included the parametric angle of theellipse (/). Note that the a/c ratio and the parametric angleof the ellipse were both estimated from the observations ofthe effective cracks.
4 | RESULTS AND DISCUSSION
4.1 | Structure
4.1.1 | Atomic structure
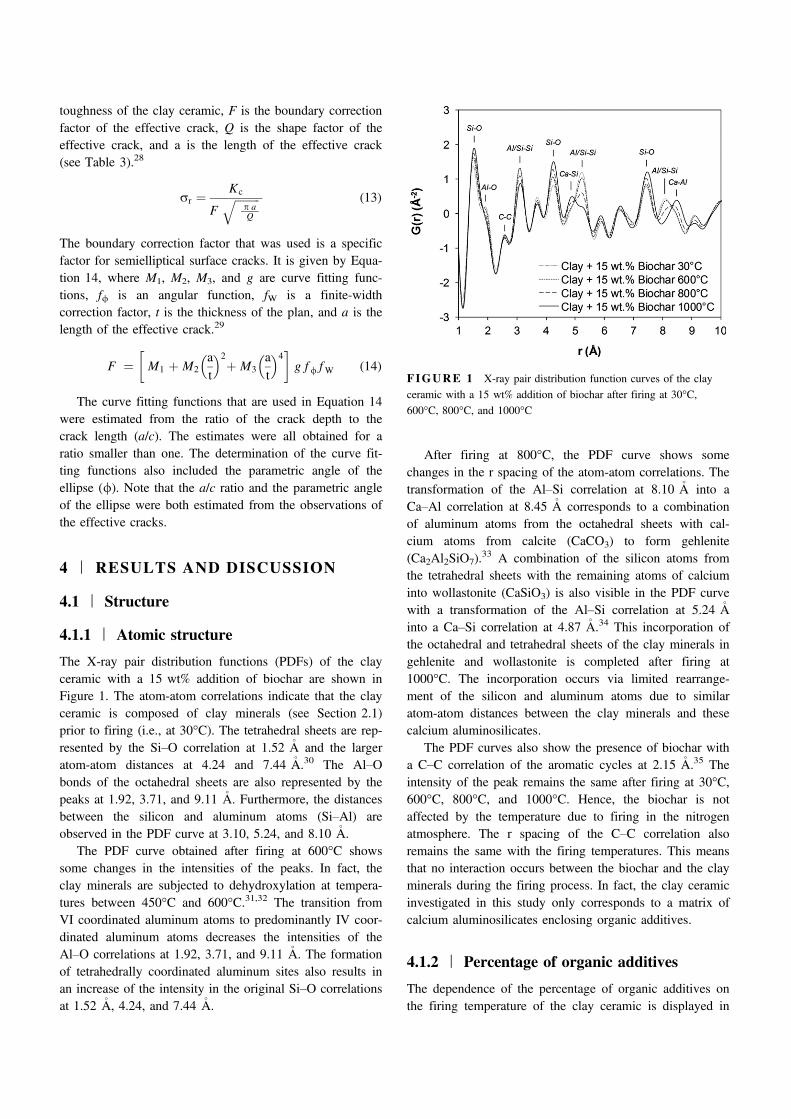
The X-ray pair distribution functions (PDFs) of the clayceramic with a 15 wt% addition of biochar are shown inFigure 1. The atom-atom correlations indicate that the clayceramic is composed of clay minerals (see Section 2.1)prior to firing (i.e., at 30°C). The tetrahedral sheets are rep-resented by the Si–O correlation at 1.52 !A and the largeratom-atom distances at 4.24 and 7.44 !A.30 The Al–Obonds of the octahedral sheets are also represented by thepeaks at 1.92, 3.71, and 9.11 !A. Furthermore, the distancesbetween the silicon and aluminum atoms (Si–Al) areobserved in the PDF curve at 3.10, 5.24, and 8.10 !A.
The PDF curve obtained after firing at 600°C showssome changes in the intensities of the peaks. In fact, theclay minerals are subjected to dehydroxylation at tempera-tures between 450°C and 600°C.31,32 The transition fromVI coordinated aluminum atoms to predominantly IV coor-dinated aluminum atoms decreases the intensities of theAl–O correlations at 1.92, 3.71, and 9.11 !A. The formationof tetrahedrally coordinated aluminum sites also results inan increase of the intensity in the original Si–O correlationsat 1.52 !A, 4.24, and 7.44 !A.
After firing at 800°C, the PDF curve shows somechanges in the r spacing of the atom-atom correlations. Thetransformation of the Al–Si correlation at 8.10 !A into aCa–Al correlation at 8.45 !A corresponds to a combinationof aluminum atoms from the octahedral sheets with cal-cium atoms from calcite (CaCO3) to form gehlenite(Ca2Al2SiO7).33 A combination of the silicon atoms fromthe tetrahedral sheets with the remaining atoms of calciuminto wollastonite (CaSiO3) is also visible in the PDF curvewith a transformation of the Al–Si correlation at 5.24 !Ainto a Ca–Si correlation at 4.87 !A.34 This incorporation ofthe octahedral and tetrahedral sheets of the clay minerals ingehlenite and wollastonite is completed after firing at1000°C. The incorporation occurs via limited rearrange-ment of the silicon and aluminum atoms due to similaratom-atom distances between the clay minerals and thesecalcium aluminosilicates.
The PDF curves also show the presence of biochar witha C–C correlation of the aromatic cycles at 2.15 !A.35 Theintensity of the peak remains the same after firing at 30°C,600°C, 800°C, and 1000°C. Hence, the biochar is notaffected by the temperature due to firing in the nitrogenatmosphere. The r spacing of the C–C correlation alsoremains the same with the firing temperatures. This meansthat no interaction occurs between the biochar and the clayminerals during the firing process. In fact, the clay ceramicinvestigated in this study only corresponds to a matrix ofcalcium aluminosilicates enclosing organic additives.
4.1.2 | Percentage of organic additives
The dependence of the percentage of organic additives onthe firing temperature of the clay ceramic is displayed in
FIGURE 1 X-ray pair distribution function curves of the clayceramic with a 15 wt% addition of biochar after firing at 30°C,600°C, 800°C, and 1000°C

Figure 2. The biomass, composed of carbon, oxygen, andhydrogen elements transforms by pyrolysis36 into CO,CO2, CH4, and H2, whose release induces a porosityincrease of the clay ceramic. But the biochar, which iscomposed of carbon and hydrogen elements, only trans-forms into CH4 and H2 at high temperatures. The clayceramic with a 15 wt% addition of biochar has then a highpercentage of organic additives of 14 wt% and a lowporosity increase of 1 vol% after firing at the temperatureof 950°C.
The thermal behavior of other organic additives, such aswood, peat, and coal is predicted from the Van KrevelenDiagram. The predictions obtained from the modeling alsoprovide information for a larger addition of organic addi-tives. In fact, the clay ceramic with a 30 wt% addition ofbiochar should contain up to 27 wt% of organic additivesafter firing at the temperature of 950°C.
4.1.3 | Morphology of organic additives
The SEM micrographs of the clay ceramic obtained afterfiring at 950°C are presented in Figure 3. The clay cera-mic without organic additives has a heterogeneous struc-ture of clay with pores and quartz particles. The porescorrespond to the air retained in the clay ceramic duringthe extrusion process. These 10*2 lm pores are minordefects in the structure of the clay ceramic. In fact, themajor defects of the structure remain the decohesionsaround the quartz particles with dimensions of 50*20 lmthat are equivalent to the dimensions of the particles.These decohesions result from the larger shrinkage ofquartz than that of the clay matrix during the b?a quartzinversion of the cooling.
The clay ceramic with a 15 wt% addition of biomasshas a greater heterogeneity than that of the clay ceramicwithout organic additives. The 60 lm particles of the bio-mass appear as the largest defects of the clay ceramicafter firing at a temperature of 950°C. However, the clayceramic with a 15 wt% addition of biochar has a lower
FIGURE 2 Dependence of the percentage of organic additive onthe firing temperature of the clay ceramic with a 15 wt% addition ofbiomass and biochar in a nitrogen atmosphere
(A)
(B)
(C)
FIGURE 3 SEM micrographs of the clay ceramic (A), clayceramic with a 15 wt% addition of biomass (B), clay ceramic with a15 wt% addition of biochar (C), after firing at 950°C
heterogeneity than that of the clay ceramic withoutorganic additives. The biochar particles are minor defectscompared to the 50 lm decohesions around the quartzparticles.
4.2 | Specific heat capacity
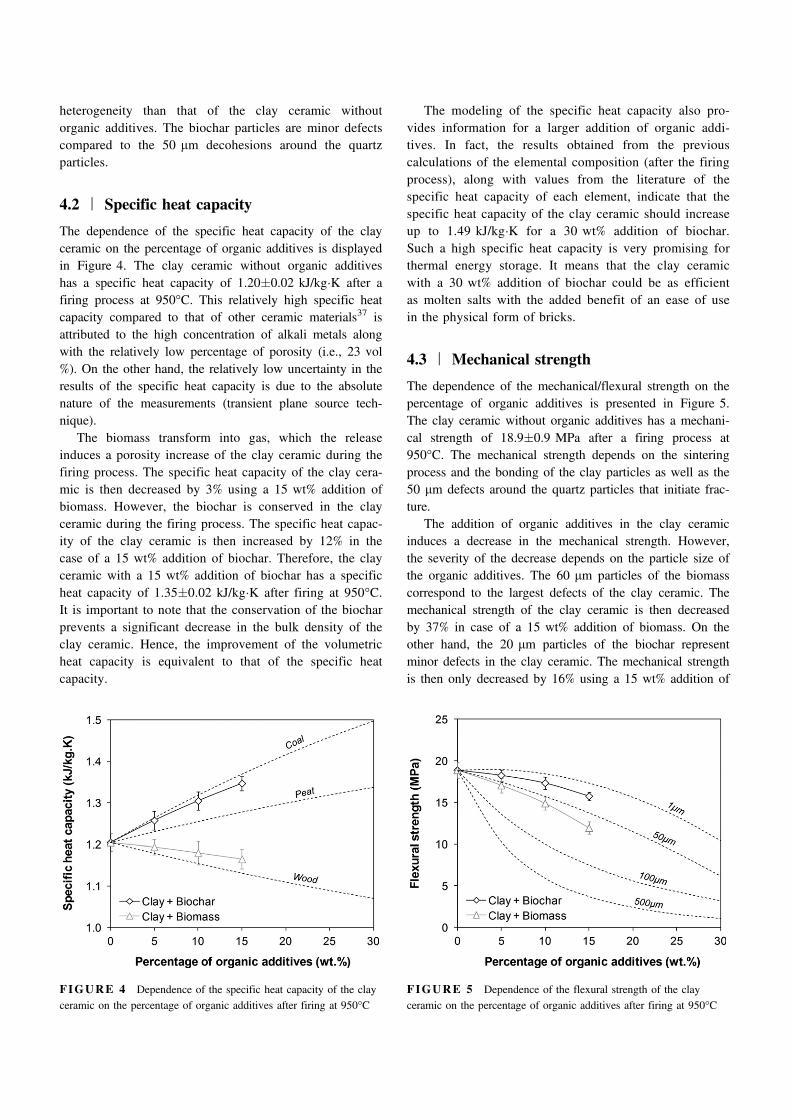
The dependence of the specific heat capacity of the clayceramic on the percentage of organic additives is displayedin Figure 4. The clay ceramic without organic additiveshas a specific heat capacity of 1.20*0.02 kJ/kg!K after afiring process at 950°C. This relatively high specific heatcapacity compared to that of other ceramic materials37 isattributed to the high concentration of alkali metals alongwith the relatively low percentage of porosity (i.e., 23 vol%). On the other hand, the relatively low uncertainty in theresults of the specific heat capacity is due to the absolutenature of the measurements (transient plane source tech-nique).
The biomass transform into gas, which the releaseinduces a porosity increase of the clay ceramic during thefiring process. The specific heat capacity of the clay cera-mic is then decreased by 3% using a 15 wt% addition ofbiomass. However, the biochar is conserved in the clayceramic during the firing process. The specific heat capac-ity of the clay ceramic is then increased by 12% in thecase of a 15 wt% addition of biochar. Therefore, the clayceramic with a 15 wt% addition of biochar has a specificheat capacity of 1.35*0.02 kJ/kg!K after firing at 950°C.It is important to note that the conservation of the biocharprevents a significant decrease in the bulk density of theclay ceramic. Hence, the improvement of the volumetricheat capacity is equivalent to that of the specific heatcapacity.
The modeling of the specific heat capacity also pro-vides information for a larger addition of organic addi-tives. In fact, the results obtained from the previouscalculations of the elemental composition (after the firingprocess), along with values from the literature of thespecific heat capacity of each element, indicate that thespecific heat capacity of the clay ceramic should increaseup to 1.49 kJ/kg!K for a 30 wt% addition of biochar.Such a high specific heat capacity is very promising forthermal energy storage. It means that the clay ceramicwith a 30 wt% addition of biochar could be as efficientas molten salts with the added benefit of an ease of usein the physical form of bricks.
4.3 | Mechanical strength
The dependence of the mechanical/flexural strength on thepercentage of organic additives is presented in Figure 5.The clay ceramic without organic additives has a mechani-cal strength of 18.9*0.9 MPa after a firing process at950°C. The mechanical strength depends on the sinteringprocess and the bonding of the clay particles as well as the50 lm defects around the quartz particles that initiate frac-ture.
The addition of organic additives in the clay ceramicinduces a decrease in the mechanical strength. However,the severity of the decrease depends on the particle size ofthe organic additives. The 60 lm particles of the biomasscorrespond to the largest defects of the clay ceramic. Themechanical strength of the clay ceramic is then decreasedby 37% in case of a 15 wt% addition of biomass. On theother hand, the 20 lm particles of the biochar representminor defects in the clay ceramic. The mechanical strengthis then only decreased by 16% using a 15 wt% addition of
FIGURE 4 Dependence of the specific heat capacity of the clayceramic on the percentage of organic additives after firing at 950°C
FIGURE 5 Dependence of the flexural strength of the clayceramic on the percentage of organic additives after firing at 950°C
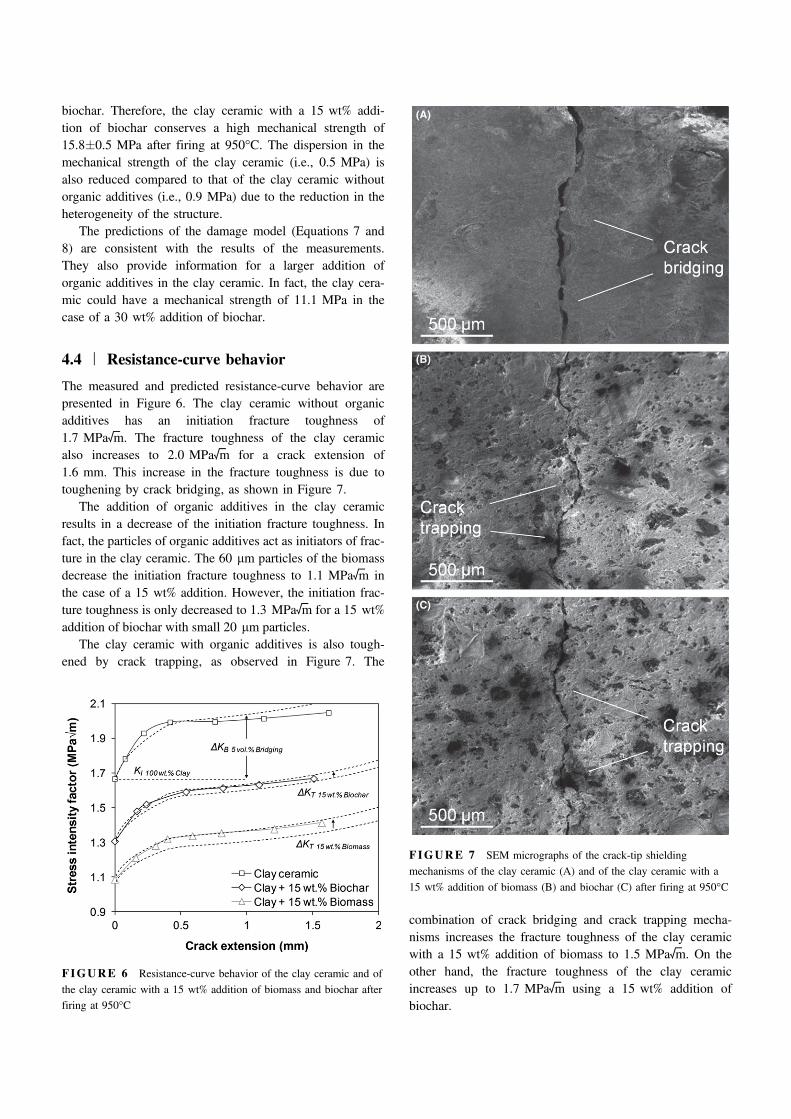
biochar. Therefore, the clay ceramic with a 15 wt% addi-tion of biochar conserves a high mechanical strength of15.8*0.5 MPa after firing at 950°C. The dispersion in themechanical strength of the clay ceramic (i.e., 0.5 MPa) isalso reduced compared to that of the clay ceramic withoutorganic additives (i.e., 0.9 MPa) due to the reduction in theheterogeneity of the structure.
The predictions of the damage model (Equations 7 and8) are consistent with the results of the measurements.They also provide information for a larger addition oforganic additives in the clay ceramic. In fact, the clay cera-mic could have a mechanical strength of 11.1 MPa in thecase of a 30 wt% addition of biochar.
4.4 | Resistance-curve behavior
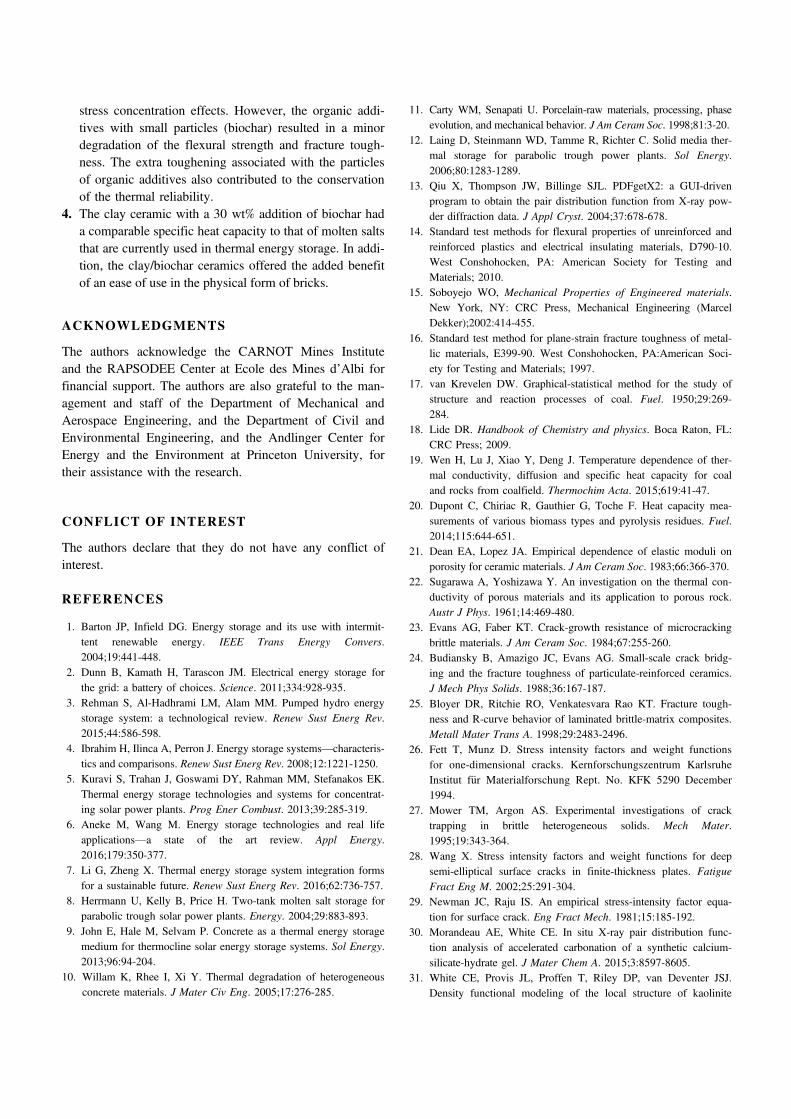
The measured and predicted resistance-curve behavior arepresented in Figure 6. The clay ceramic without organicadditives has an initiation fracture toughness of1.7 MPa√m. The fracture toughness of the clay ceramicalso increases to 2.0 MPa√m for a crack extension of1.6 mm. This increase in the fracture toughness is due totoughening by crack bridging, as shown in Figure 7.
The addition of organic additives in the clay ceramicresults in a decrease of the initiation fracture toughness. Infact, the particles of organic additives act as initiators of frac-ture in the clay ceramic. The 60 lm particles of the biomassdecrease the initiation fracture toughness to 1.1 MPa√m inthe case of a 15 wt% addition. However, the initiation frac-ture toughness is only decreased to 1.3 MPa√m for a 15 wt%addition of biochar with small 20 lm particles.
The clay ceramic with organic additives is also tough-ened by crack trapping, as observed in Figure 7. The
combination of crack bridging and crack trapping mecha-nisms increases the fracture toughness of the clay ceramicwith a 15 wt% addition of biomass to 1.5 MPa√m. On theother hand, the fracture toughness of the clay ceramicincreases up to 1.7 MPa√m using a 15 wt% addition ofbiochar.
FIGURE 6 Resistance-curve behavior of the clay ceramic and ofthe clay ceramic with a 15 wt% addition of biomass and biochar afterfiring at 950°C
(A)
(B)
(C)
FIGURE 7 SEM micrographs of the crack-tip shieldingmechanisms of the clay ceramic (A) and of the clay ceramic with a15 wt% addition of biomass (B) and biochar (C) after firing at 950°C

4.5 | Thermal reliability
The dependence of the flexural strength on the number ofthermal cycles is presented in Figure 8. The clay ceramicwithout organic additives has a flexural strength of18.9 MPa after 0 thermal cycles. The flexural strength alsodecreases to 19.1, 17.6, and 14.8 MPa after 1, 10 and 100thermal cycles. The decrease in the flexural strength is dueto thermal fatigue. In fact, the thermal expansion mismatchbetween the constituents generates some cyclic stress con-centration that lead to crack extension and fracture. Thisresults in a 21% decrease of the flexural strength after 100thermal cycles.
The addition of organic additives decreases the flexuralstrength before thermal cycling (see Section 4.3). The flex-ural strength also decreases with the thermal cycles, com-pared to that of the clay ceramic without organic additives,due to a lower initiation fracture toughness (see Sec-tion 4.4). However, the extra toughening (i.e., crack trap-ping) associated with the particles of organic additives alsolimits the crack extension, which contributes to a conserva-tion of the flexural strength with the thermal cycles. Theflexural strength only decreases by 26% after 100 thermalcycles in case of a 15 wt% addition of biomass. Similarly,the crack extension for the clay ceramic with a 15 wt%addition of biochar only results in a 23% decrease of theflexural strength after 100 thermal cycles.
It is important to note that the measured and predictedstrengths of the clay ceramics are comparable after differentthermal cycles. In fact, the results of both the measure-ments and the modeling indicate that the clay ceramic witha 15 wt% addition of biochar conserves a high residualstrength of 12.1 MPa after 100 thermal cycles. This means
that the clay/biochar ceramics can be considered as ther-mally reliable materials for a use in thermal energy storage.
4.6 | Implications
The implications of this research are significant for the useof ceramic materials in thermal energy storage. Thermalenergy storage can be performed using ceramic materialsor molten salts. However, molten salts remain the mostwidely used medium in thermal energy storage due to theirhigh specific heat capacities between 1.10 and 1.50 kJ/kg!K.
This work shows that the specific heat capacities ofceramic materials can be improved up to 1.49 kJ/kg!K bythe control of structure, via the addition of biochar. Thismeans that 24% more energy can be stored in clay/biocharceramics than in the same mass of conventional ceramics.The specific heat capacities of such ceramic materials arethen comparable to the specific heat capacities of moltensalts that are currently used in thermal energy storage.
Moreover, the clay/biochar ceramics in the physicalform of bricks are much easier to use than molten salts.The clay/biochar ceramics are also thermally reliable mate-rials with a significant strength after thermal cycles. Thiscombination of specific heat capacity and flexural strengthmakes the clay/biochar ceramics one of the most appropri-ate materials for thermal energy storage. The valorizationof biochar, which is a byproduct from the thermal conver-sion of wood, also minimizes the economical and environ-mental cost of the materials.
5 | CONCLUSIONS
In this paper, the structure-property relationship of a clayceramic with organic additives (biomass and biochar) isinvestigated to develop an alternative material for thermalenergy storage. Salient conclusions arising from this studyare summarized below.
1. The atomic structure of the clay ceramic with organicadditives transformed into calcium aluminosilicates dur-ing the firing process. However, the organic additivesremained at the macroscopic scale without any interac-tion with the matrix at temperatures up to 1000°C.
2. The specific heat capacity decreased in the case oforganic additives with high oxygen concentrations (bio-mass) due to a porosity formation. However, the conser-vation of the organic additives with low oxygenconcentrations (biochar) resulted in an increase of thespecific heat capacity up to 1.49 kJ/kg!K.
3. The flexural strength decreased in the case of organicadditives with a large particle size (biomass) due to
FIGURE 8 Dependence of the residual strength of the clayceramic and of the clay ceramic with a 15 wt% addition of biomassand biochar on the number of thermal cycles at 500°C
stress concentration effects. However, the organic addi-tives with small particles (biochar) resulted in a minordegradation of the flexural strength and fracture tough-ness. The extra toughening associated with the particlesof organic additives also contributed to the conservationof the thermal reliability.
4. The clay ceramic with a 30 wt% addition of biochar hada comparable specific heat capacity to that of molten saltsthat are currently used in thermal energy storage. In addi-tion, the clay/biochar ceramics offered the added benefitof an ease of use in the physical form of bricks.
ACKNOWLEDGMENTS
The authors acknowledge the CARNOT Mines Instituteand the RAPSODEE Center at Ecole des Mines d’Albi forfinancial support. The authors are also grateful to the man-agement and staff of the Department of Mechanical andAerospace Engineering, and the Department of Civil andEnvironmental Engineering, and the Andlinger Center forEnergy and the Environment at Princeton University, fortheir assistance with the research.
CONFLICT OF INTEREST
The authors declare that they do not have any conflict ofinterest.
REFERENCES
1. Barton JP, Infield DG. Energy storage and its use with intermit-tent renewable energy. IEEE Trans Energy Convers.2004;19:441-448.
2. Dunn B, Kamath H, Tarascon JM. Electrical energy storage forthe grid: a battery of choices. Science. 2011;334:928-935.
3. Rehman S, Al-Hadhrami LM, Alam MM. Pumped hydro energystorage system: a technological review. Renew Sust Energ Rev.2015;44:586-598.
4. Ibrahim H, Ilinca A, Perron J. Energy storage systems—characteris-tics and comparisons. Renew Sust Energ Rev. 2008;12:1221-1250.
5. Kuravi S, Trahan J, Goswami DY, Rahman MM, Stefanakos EK.Thermal energy storage technologies and systems for concentrat-ing solar power plants. Prog Ener Combust. 2013;39:285-319.
6. Aneke M, Wang M. Energy storage technologies and real lifeapplications—a state of the art review. Appl Energy.2016;179:350-377.
7. Li G, Zheng X. Thermal energy storage system integration formsfor a sustainable future. Renew Sust Energ Rev. 2016;62:736-757.
8. Herrmann U, Kelly B, Price H. Two-tank molten salt storage forparabolic trough solar power plants. Energy. 2004;29:883-893.
9. John E, Hale M, Selvam P. Concrete as a thermal energy storagemedium for thermocline solar energy storage systems. Sol Energy.2013;96:94-204.
10. Willam K, Rhee I, Xi Y. Thermal degradation of heterogeneousconcrete materials. J Mater Civ Eng. 2005;17:276-285.
11. Carty WM, Senapati U. Porcelain-raw materials, processing, phaseevolution, and mechanical behavior. J Am Ceram Soc. 1998;81:3-20.
12. Laing D, Steinmann WD, Tamme R, Richter C. Solid media ther-mal storage for parabolic trough power plants. Sol Energy.2006;80:1283-1289.
13. Qiu X, Thompson JW, Billinge SJL. PDFgetX2: a GUI-drivenprogram to obtain the pair distribution function from X-ray pow-der diffraction data. J Appl Cryst. 2004;37:678-678.
14. Standard test methods for flexural properties of unreinforced andreinforced plastics and electrical insulating materials, D790-10.West Conshohocken, PA: American Society for Testing andMaterials; 2010.
15. Soboyejo WO, Mechanical Properties of Engineered materials.New York, NY: CRC Press, Mechanical Engineering (MarcelDekker);2002:414-455.
16. Standard test method for plane-strain fracture toughness of metal-lic materials, E399-90. West Conshohocken, PA:American Soci-ety for Testing and Materials; 1997.
17. van Krevelen DW. Graphical-statistical method for the study ofstructure and reaction processes of coal. Fuel. 1950;29:269-284.
18. Lide DR. Handbook of Chemistry and physics. Boca Raton, FL:CRC Press; 2009.
19. Wen H, Lu J, Xiao Y, Deng J. Temperature dependence of ther-mal conductivity, diffusion and specific heat capacity for coaland rocks from coalfield. Thermochim Acta. 2015;619:41-47.
20. Dupont C, Chiriac R, Gauthier G, Toche F. Heat capacity mea-surements of various biomass types and pyrolysis residues. Fuel.2014;115:644-651.
21. Dean EA, Lopez JA. Empirical dependence of elastic moduli onporosity for ceramic materials. J Am Ceram Soc. 1983;66:366-370.
22. Sugarawa A, Yoshizawa Y. An investigation on the thermal con-ductivity of porous materials and its application to porous rock.Austr J Phys. 1961;14:469-480.
23. Evans AG, Faber KT. Crack-growth resistance of microcrackingbrittle materials. J Am Ceram Soc. 1984;67:255-260.
24. Budiansky B, Amazigo JC, Evans AG. Small-scale crack bridg-ing and the fracture toughness of particulate-reinforced ceramics.J Mech Phys Solids. 1988;36:167-187.
25. Bloyer DR, Ritchie RO, Venkatesvara Rao KT. Fracture tough-ness and R-curve behavior of laminated brittle-matrix composites.Metall Mater Trans A. 1998;29:2483-2496.
26. Fett T, Munz D. Stress intensity factors and weight functionsfor one-dimensional cracks. Kernforschungszentrum KarlsruheInstitut f€ur Materialforschung Rept. No. KFK 5290 December1994.
27. Mower TM, Argon AS. Experimental investigations of cracktrapping in brittle heterogeneous solids. Mech Mater.1995;19:343-364.
28. Wang X. Stress intensity factors and weight functions for deepsemi-elliptical surface cracks in finite-thickness plates. FatigueFract Eng M. 2002;25:291-304.
29. Newman JC, Raju IS. An empirical stress-intensity factor equa-tion for surface crack. Eng Fract Mech. 1981;15:185-192.
30. Morandeau AE, White CE. In situ X-ray pair distribution func-tion analysis of accelerated carbonation of a synthetic calcium-silicate-hydrate gel. J Mater Chem A. 2015;3:8597-8605.
31. White CE, Provis JL, Proffen T, Riley DP, van Deventer JSJ.Density functional modeling of the local structure of kaolinite

subjected to thermal dehydroxylation. J Phys Chem A.2010;114:4988-4996.
32. Fernandez R, Martirena F, Scrivener KL. The origin of the pozzolanicactivity of calcined clay minerals: a comparison between kaolinite,illite and montmorillonite. Cem Concr Res. 2011;41:113-122.
33. Peters T, Iberg R. Mineralogical changes during firing of cal-cium-rich brick clays. Am Ceram Soc Bull. 1978;57:503-509.
34. Cultrone G, Rodriguez-Navarro C, Sebastian E, Cazalla O, De LaTorre MJ. Carbonate and silicate phase reactions during ceramicfiring. Eur J Miner. 2001;13:621-634.
35. Petkov V, Ren Y, Kabekkodu S, Murphy D. Atomic pair distri-bution functions analysis of disordered low-Z materials. PhysChem Chem Phys. 2013;15:8544-8554.
36. Di Blasi C. Modeling chemical and physical processes of woodand biomass pyrolysis. Prog Energy Combust Sci. 2008;34:47-90.
37. Meffre A, Py X, Olives R, Bessada C, Veron E, Echegut P.High-temperature sensible heat-based thermal energy storagematerials made of vitrified MSWI fly ashes. Waste BiomassValor. 2015;6:1003-1014.