structure assignment and h/d-exchange behavior of several
TRANSCRIPT

General Papers ARKIVOC 2014 (v) 94-122
Page 94 ©ARKAT-USA, Inc.
Structure assignment and H/D-exchange behavior of several glycosylated polyphenols
Andreas H. Franz,a* Ilona Serebnitskaya,a Gurbir Gudial,a and Christopher Wallisb
a Department of Chemistry, University of the Pacific, 3601 Pacific Avenue, Stockton,
CA 95211, USA b Crop Diseases, Pests, and Genetics Research Unit, USDA-ARS San Joaquin Valley Agricultural
Sciences Center, 9611 S. Riverbend Ave, Parlier, CA 93648, USA E-mail: [email protected]
DOI: http://dx.doi.org/10.3998/ark.5550190.p008.583
Abstract The NMR-structures of six polyphenols, resveratrol (1), (-)-epicatechin (2), pelargonidin chloride (3), cyanidin chloride (4), cyanin chloride (5), and keracyanin chloride (6), were fully assigned. For the glycosylated polyphenols 5 and 6, the three-dimensional solution structure and long-range 1H-13C-coupling constants across the glycosidic bond were measured. Satisfactory fit to standard Karplus-equations was achieved for glycosides directly attached to the aromatic core in cyanin chloride. Molecular dynamics simulation data in vacuum at the AM1-level of theory were shown to approximate the NMR-solution data reasonably well. Selective HCl-catalyzed H/D-exchange was observed for aromatic protons H6 and H8 in flavonoid structures containing a 5,7-meta-disubstituted chromelynium core with free OH-groups. The exchange took place readily in compounds 3, 4, and 6, whereas 1, 2, and 5 did not exchange. Keywords: Glycosylated polyphenol, NMR spectroscopy, J-HMBC, Karplus relation, conformational analysis, H/D-exchange
Introduction Polyhydroxylated aromatics, so-called polyphenols, have long been recognized as important secondary metabolites produced by plants. Among the polyphenolic natural products are several different classes of compounds, for example phenolic acids, coumarins, tannins, chalcones, aurones, flavanones, flavones, isoflavones, flavonols, proanthocyanidins, and anthocyanins. Frequently these compounds are found present with varying degrees of glycosylation. Their occurrence in nature and their applications have been reviewed.1,2
Polyphenols serve a variety of roles for plants. Among others, anthocyanidins are primary red or blue pigments responsible for the coloring of plant blossoms. Other polyphenols, such as tannins
General Papers ARKIVOC 2014 (v) 94-122
Page 95 ©ARKAT-USA, Inc.
(proanthocyanidins) deter animal herbivory due to astringent properties. Polyphenols also may act as phytoanticipans (produced before infection/herbivory) or phytoalexins (produced after infection/herbivory) to act as antimicrobials or antifeedants. As such, polyphenols enable the plant to resist or fight infections by a variety of pathogens, such as fungi and bacteria,3 as well as fend off feeding by insects and other animals. Polyphenols also are produced during the hypersensitive response (programmed cell death) that plants utilize to isolate and eliminate infections and to provide relief against oxidative stress.4 Finally, polyphenol compounds have a variety of other roles, such as protection from drought stress, serving as phytohormones, protection from photo-oxidation, and regulating relationships with mutualists.
Besides the roles polyphenols serve in plants, polyphenols have been implicated in a plethora of possible medical applications for humans as antimicrobials,5 antioxidants,6 anti-inflammatory,7 vasodilators, anti-angiogenic,6 and as compounds with significant anti-cancer potential6 and boosters of neuronal and cognitive brain function.6 For example, flavonols in general and especially quercetin affect multiple biochemical pathways associated with blood circulation.2 Consequently, mounting evidence suggests that flavonols from fruit and vegetables have beneficial effects with respect to hypertension, atherosclerosis, insulin resistance (type 2 diabetes),8 myocardic ischemia, and stroke.
Despite all of the benefits that polyphenols provide for plant and animal/human health, little is known about how they function or even how enzymes assemble them. Exact description of the chemical structures of polyphenols is a necessity if the biochemical formation of these compounds and their myriad functions in nature is to be elucidated. In addition, accurate structural information can aid in synthetic manufacture of these compounds for potential human health purposes. The isolation of polyphenolic compounds is typically based on extractions, capillary electrophoresis,1 and chromatography such as ion exchange,9 supercritical fluid, reverse-phase HPLC,9 and regular-phase HPLC. The chemical structures of polyphenols have been elucidated by mass spectrometry1 and numerous spectroscopic techniques including Nuclear Magnetic Resonance,1 ultraviolet-visible (UV-VIS),10 infrared (IR),10 fluorescence,10 and X-Ray.11 With close to 600 structures reported to date, anthocyanins are particularly abundant in berries with increasing amounts paralleling depth of berry color. For example, it has been reported that 100g of fresh fruit contain the following approximate amounts of anthocyanins: strawberry 200 mg,12 red raspberry 360 mg, black currant 500 mg, blueberry 560 mg,12 black raspberry 580 mg,12 elderberry 1,300 mg,12 and black chokeberry 1,400 mg.12 However, the isolation of sufficient material for biochemical studies is complicated by the great structural diversity of compounds from berries. Specific synthesis of polyphenols can be accomplished by total synthesis,13 by semi-synthetic modifications of natural polyphenols,13 and by metabolic engineering of microorganisms.14
Among many other techniques, NMR spectroscopy is particularly powerful to determine the structure of molecules in solution. Not only can atom connnectivities be established (molecular constitution), but also stereochemical information (configuration) and three-dimensional geometry (conformation). The observation that NMR spectra exhibited spectral “fine structure” and hence coupling information,15,16 and that the magnitude of the coupling constant appeared to be dependent on molecular geometry,17 accelerated the efforts to find satisfactory theoretical models to describe

General Papers ARKIVOC 2014 (v) 94-122
Page 96 ©ARKAT-USA, Inc.
molecular structure in solution. Today, experimental NMR data in conjunction with theoretical calculations and fitting procedures can provide a complete picture of a molecule’s solution geometry. A particularly useful tool to determine a molecule’s geometry is the Karplus relation between the coupling constant and dihedral angle of the coupled atoms.
The empirical Karplus relationship18,19 was based originally on the Fermi-Contact (FC) contribution in the early theories of NMR coupling phenomena.20 It describes quantitatively the correlation of experimental coupling constant to the dihedral angle between the coupled nuclei and has been used very successfully to derive molecular structures. The limitation of the mathematical equation based exclusively on FC has been pointed out by Karplus himself.18 Many different Karplus equations have been developed and refined over the decades.21 Nowadays, such equations are based on a multitude of experimental data and extensive Density Functional Theory (DFT) calculations at different levels of theory, which take bond lengths, electron densities, electron orbital terms, and dipolar electron spin terms into account. The observation of geometry-dependent coupling constants in six-membered rings and carbohydrates22 has made Karplus equations especially useful to establish the conformation of the ring and the glycosidic bond.23 Specifically, the glycosidic bond provides flexibility to the oligosaccharide and has great influence on the time-averaged solution conformation of the glycan. The glycosidic bond between the sugar units (i) and (i-1) is characterized by the two angles = O5(i)-CX(i)-OX(i-1)-CX(i-1)) and = CX(i-1)-OX(i-1)-CX(i)-CX-1(i) (Figure 1).24 One additional angle = OX-CX-CX-1-CX-2 is required to describe the glycosylated hydroxymethyl group in 1,6-linkages. Many NMR experiments and molecular modeling techniques in the literature have demonstrated that most conformations of the -angle of (1→6)-linked glucopyranoses (O5-C1-O1-C6’) are governed by the exo-anomeric effect (Figure 1). On the other hand, while the -angle (C1-O1-C6’-C5’) also shows a conformational preference in many cases, namely for the antiperiplanar (s-trans) conformation, it often is found to be more flexible permitting conformations deviating significantly from a 180º-angle. The same increase in flexibility applies to the -angle (O6-C6-C5-C4).
The angle connecting the glycosidic oxygen with the aromatic core was defined by C1-O-CXarom-CX+1
arom, i.e. the two -angles are defined as C1’’-O-C3-C4 and C1’’’-O-C5-C6 for both cyanin chloride (5) and keracyanin chloride (6) (Figure 1). We noted that there is some deviation in the literature from IUPAC recommendations for carbohydrate nomenclature (“Symbols for Specifying the Conformation of Polysaccharide Chains”, section 2.2) 24 as far as the definition of the dihedral angle is concerned. In papers, where is defined with the endo-cylic oxygen O5 as a reference, the angle is described by O6-C6-C5-O5 and the conformations are defined by the spatial relationship of O6 to O5 first and then by O6 and C4. Many calculations in the literature indicate the preference of the so-defined gg and gt-conformations often are the most populated in (1→6)-linked glucose derivatives. However, IUPAC recommendations for the dihedral angle are for an “OCCC” fragment as opposed to an “OCCO” fragment as above.

General Papers ARKIVOC 2014 (v) 94-122
Page 97 ©ARKAT-USA, Inc.
O
OH
OH
OH
Pelargonidin Chloride (3)
Cl
O
O
O
OHCl
OH
O
OH
HO OH
HO OOH
OH
OH
OH
Cyanin Chloride (5)
HO
OH
OH
Resveratrol (1)
Keracyanin Chloride (6)
O
O
OH
Cl
O
OO
HO
OH
OH
H3C
OH
OH
OH
HO
HO
OH
OH
HO
O
OH
OH
OH
Cyanidin Chloride (4)
Cl
HOOH
1
23
4
56
1'2'
3'
4'5'
6'
2
3
456
78
9
10
1'2'
3'
4'
2
3
4
56
78
9
10
2
3
456
78
9
10
2
3
456
78
9
10
56
78
9
10
1'2'
3'
4'5'
1'2'
3'
4'5'
1'2'
3'
4'5'
1'' 2''
3''4''
5''6''
1'''2'''
3'''4'''
5'''6''' 1''
2''
3''4''
5''
6''
1'''2'''
3'''4'''
5'''6'''
O
OH
OH
OH
HOOH
2
3
456
78
9
10
1'2'
3'
4'5'
(-)-Epicatechin (2)
yj
yj
q/y
j
wHRHS
yj
H5
O5 C4O6
H6pro-RH6pro-S
g+ (gg)
= + 60o
H5
O5 C4H6pro-R
H6pro-SO6
g- (tg)
= - 60o
H5
O5 C4H6pro-S
O6H6pro-R
s-trans (gt)
= 180o
H6pro-R
H6pro-S C5O6H
g+
= + 60o
H6pro-R
H6pro-S C5
O6H
g-
= - 60o
H6pro-R
H6pro-S C5
H6O
s-trans
= 180o
(1 ) ( 6)
H1
C2 O5R'
g+
= + 60o
H1
C2 O5
R'
g-
= - 60o
H5
C2 O5
R'
s-trans
= 180o
H6pro-R
H6pro-S C5R
g+
= + 60o
H6pro-R
H6pro-S C5
R
g-
= - 60o
H6pro-R
H6pro-S C5
R
s-trans
= 180o
OO R
O
O R
O
O R
exo-anomericeffect
exo-anomericeffect
endo-anomericeffect
Figure 1. Chemical structures of polyphenols from plants (numbering is shown according to IUPAC (black) and for comparative purposes (red). Definitions of dihedral angles in carbohydrates

General Papers ARKIVOC 2014 (v) 94-122
Page 98 ©ARKAT-USA, Inc.
according to IUPAC recommendations.24 A 1,4-linkage is shown as an example. The designations “pro-R” and pro-S” for the diastereotopic hydrogen atoms on C6 in the glucopyranose are made assuming the replacement of the respective hydrogen with a substituent of “lowest priority” resulting in a stereogenic carbon.
In the IUPAC system, includes the next lowest carbon atom in the sugar glycosylated ring as a reference, i.e. OX-CX-CX-1-CX-2 where X is the number of the carbon atom whose hydroxyl group is glycosylated; therefore, the -angle in 6 is O6-C6-C5-C4 and the definition of the gt conformation and the tg conformation are reversed. With four unambiguous atoms of the OCCC fragment, the symbols for the three conformations of could even be simplified to sc+ or g+ (gg before) and sc- or g- (gt before) and ap or trans (tg before). In this paper, the IUPAC carbohydrate recommendations apply (Figure 1).
Multiple papers have been published in which the angles and (non-glycosylated hydroxymethyl) of glucopyranose components of oligosaccharides were investigated and described by computations and Karplus-relations. All of those papers consider structures that feature the hydroxymethyl group with a free OH-group. In those cases, Karplus-relations for the two different diastereotopic protons H6pro-R and H6pro-S and their coupling to C4 and H5 have been developed.25-30 However, to the best of our knowledge, there do not seem to be any publications that propose a quantitative description of dihedral angles and (i.e. ’) for 6-O-substituted sugars based on a Karplus-relation for coupling of H6-C4. Papers in the literature that describe glucopyranoses with (1→6)-linkages provide computational results and derive quantitative results for from relaxed-residue Ramachandran plots, extensive NOE studies, or from 3JC,C in 13C-enriched sugars.31 Additional literature to all of the topics discussed above can be found in the Supplemental Materials.
Exact structure elucidation and assignment of compounds is critical for any subsequent study of biochemical effects. In our study, we selected structurally related resveratrol (1), (-)-epicatechin (2), pelargoinidin chloride (3), cyanidin chloride (4), cyanin chloride (5), and keracyanin chloride (6) (Figure 1). For the latter two compounds, we investigated the solution conformation of the sugars. The glycan modification of keracyanin (6) is a 6-(-L-rhamno-pyranosyl)--D-gluco-pyranose. Results and Discussion General NMR Analysis The 1H-NMR spectrum of resveratrol (1) was assigned in straightforward fashion (Table 1 and Supplemental Materials). We gave compound 1 an adjusted nomenclature different from the IUPAC nomenclature to allow structural NMR data comparison among all compounds discussed. The two vinylic protons were assigned based on long-range HMBC-correlations with the resonance at 6.9 ppm corresponding to the proton neighboring the primed phenyl ring. The aromatic protons H6 and H8 (Figure 1, red, IUPAC nomenclature H2 and H6) were unusually strongly shielded with chemical shifts of 6.14 ppm and 6.43 ppm in the 1H-dimension, respectively, and 101.3 ppm and 104.4 ppm in the 13C-dimension, respectively.
General Papers ARKIVOC 2014 (v) 94-122
Page 99 ©ARKAT-USA, Inc.
Table 1. 1H-NMR chemical shifts for polyphenol standards in MeOD at rt (1H/13C IUPAC assignment in parentheses; see Figure 1), as, bd,ct, ddd, eddd, fdq, gAB-mixing, hn. det. Coupling constants are listed in Supplementary Material
1 2 3 4 5 6
1H 13C 1H 13C 1H 13C 1H 13C 1H 13C 1H 13C
1 6.79b
(Hvinyl)
125.7
(Cvinyl)
- -
- - - - - - -
2 6.94b
(Hvinyl)
128.0
(Cvinyl)
4.79a 78.5 - 160.9 1J h
- 161.0 1J h
- 164.2 - 162.9
3 - - 4.15e 66.2 - 145.1 - 146.0 - 145.7 - 144.3
4 - - 2.71d/2.84d 27.9 8.59b 133.2 8.56b 132.9 9.14b 134.7 8.92a 134.8
5 - 158.3(C3) - 156.0 - 155.8 - 156.2 - 157.0 - 156.8
6 6.14c(H2) 101.3(C2) 5.92b,g 95.1 6.88d 93.6 6.86d 93.7 7.08d,g 96.0 6.87d 93.8
7 - 158.3(C1) - 156.7 - 167.8 - 168.3 - 168.5 - h
8 6.43b(H6) 104.4(C6) 5.90b,g 94.6 6.61b 101.8 6.61b 102.0 7.06b,g 104.4 6.65b 102.0
9 - 140.0(C5) - 156.3 - 156.8 - 156.2 - 155.9 - h
10 6.43b(H4) 104.4(C4) - 98.7 - 112.5 - 112.9 - 112.3 - 111.9
1’ - - - 131.0 - 120.2 - 121.0 - 120.3 - 119.9
2’ 7.34b 127.5 6.95b 114.0 8.57b,g 133.6 8.11b 117.4 8.07b 117.2 8.00b 117.0
3’ 6.75b 115.1 - 144.6 7.03b,g 116.4 - 147.0 - 146.9 - 146.2
4’ - 157.0 - 144.4 - 164.8 - 154.5 - 155.5 - 154.6
5’ 6.75b 115.1 6.74b 118.1 7.03b,g 116.4 7.00b 116.4 7.03b 116.2 6.99b 116.1
6’ 7.34b 127.5 - 114.6 8.57b,g 133.6 8.22d 126.4 8.37d 127.8 8.26d 126.9
1’’ - - - - - - 5.28b 102.7 5.27b 102.1
2’’ - - - - - - 3.67d 73.3 3.64d 73.3
3’’ - - - - - - 3.51c 77.5 3.52c 68.3
4’’ - - - - - - 3.38d 70.1 3.39d 69.9
5’’ - - - - - - 3.60e 77.7 3.70e 76.1
6S’’ - - - - - - 3.68d 61.3 3.57d 66.3
6R’’ - - - - - - 3.95d - 4.04d
1’’’ - - - - - - 5.14b 101.4 4.62b 100.8
2’’’ - - - - - - 3.65d 73.0 3.77d 70.6
3’’’ - - - - - - 3.52c 77.1 3.60d 71.1
4’’’ - - - - - - 3.43d 70.0 3.30c 72.6
5’’’ - - - - - - 3.55e 77.4 3.53f 66.3
6S’’’ - - - - - - 3.72d 61.1 - -
6R’’’ - - - - - - 3.93d - - -
CH3 - - - - - - - - - 1.15b 16.5

General Papers ARKIVOC 2014 (v) 94-122
Page 100 ©ARKAT-USA, Inc.
(-)-Epicatechin (2) displayed similarly shielded signals for H6 and H8. Aside from similar aromatic resonance compared to resveratrol (1), additional signals for the aliphatic ring were observed between 2.7-4.8 ppm for the aliphatic methylene H4a/H4e, for the hydroxymethine H3, and for the endocyclic ether methine H2. The coupling constants clearly indicated that the major conformational population of the C3-C4 bond positioned the C3-H3 bond gauche to both H4a and H4e effectively bisecting the H4a-C-H4e bond angle. Both methylene protons displayed small vicinal coupling constants of 2.9 Hz and 4.6 Hz, respectively, besides the large geminal constant of 2J 16.7 Hz. Therefore, the conformation of the saturated ring was assigned as 2H3 with possibly minor contributions of the opposite half-chair because of the slightly larger coupling constant of 4.6 Hz.
The NMR resonances in pelargonidin chloride (3) and cyanidin chloride (4) were assigned in similar fashion. Strong shielding of H6 and H8 was observed here as well. All correlations were confirmed with HMQC and HMBC experiments (see Supplemental Materials). For cyanin chloride (5), we used a 1D-pfg-TOCSY experiment to differentiate the spin systems of the aromatic core and the two sugar rings (Figure 2). The signals of both glucose units showed large coupling constants consistent with the 4C1-chair conformation (3J ~ 8-9 Hz) and a -linkage (3J1,2 7.8 Hz) to the aromatic core (see Supplemental Materials). Long-range correlations between protons and carbons were observed in a standard HMBC spectrum (Figure 2). Cross-peaks in the aromatic core were well developed for full assignment whereas correlations in the sugar rings were less intense. However, the identification of the individual spin systems of both sugar rings through 1D-pfg-TOCSY and subsequent one-bond correlations from a standard HMQC experiment allowed us to fully assign all carbons in both rings. The structure of keracyanin chloride (6) was assigned in analogous fashion and the results are shown in Table 1.
In addition to the general structure determination of compounds 1-6, we investigated the three-dimensional shape of 5 and 6 more closely. Specifically, we determined the position of the sugar rings relative to the aromatic core in 5. While a 1D-pfg-NOESY experiment did not give any visible enhancements, a spinlock 1D-pfg-ROESY experiment provided evidence of close time-averaged spatial proximity between the irradiated anomeric proton H1’’ in the glucopyranose ring and the aromatic proton H4 (Figure 3, top).
General Papers ARKIVOC 2014 (v) 94-122
Page 101 ©ARKAT-USA, Inc.
Figure 2. Top: 1D-pfg-TOCSY spectrum of 5 (1 mg, MeOD, tmix = 200ms, 7s relaxation delay); bottom: HMBC spectrum of 5 (1 mg, MeOD, inverse-geometry probe, 1J 140 Hz, long-range J 8 Hz, 2s relaxation delay).
General Papers ARKIVOC 2014 (v) 94-122
Page 102 ©ARKAT-USA, Inc.
Figure 3. Top: 1D-pfg-rOe spectrum of 5 (1 mg, MeOD, inverse-geometry probe, tmix = 250 ms, 7 s relaxation delay); bottom: 1D-pfg-rOe spectrum of 6 (2 mg, MeOD, inverse-geometry probe, tmix = 250 ms, 7 s relaxation delay).

General Papers ARKIVOC 2014 (v) 94-122
Page 103 ©ARKAT-USA, Inc.
In addition, expected enhancements of trans-annular protons H3’’ and H5’’ were apparent, consistent with the 4C1-conformation of the -D-glucopyranoside ring. Likewise, when we irradiated H1’’’, a very strong enhancement of H6 suggested that both sugar rings were positioned on the aromatic core with very similar conformation. The intensity of the rOe in both cases was remarkable.
For keracyanin chloride (6), the D-gluco-pyranoside is attached to the aromatic core at C3 through a -linkage and is itself connected to the L-rhamno-pyranoside through a 1,6--linakge. The similarity between the - and -angles in cyanin chloride (5) and keracyanin chloride (6) at the glycosidic bond on the aromatic core was further corroborated by the observed rOe-enhancement at H4 of 6 upon irradiation of H1’’ in analogy to 5. In the 1,6--linkage between D-gluco-pyranose and L-rhamno-pyranose, the designation of “pro-R” and “pro-S” for the two diastereotopic hydrogens at C6 are made assuming the replacement of the respective hydrogen with a substituent of “lowest priority” resulting in a stereogenic carbon (Figure 1). The -angle (O6-C6-C5-C4)’’ appeared to populate the g- or trans-conformation preferentially, which was apparent from the small and mid-size experimental coupling values of 3JH5,H6pro-S
exp 1.7 Hz and 3JH5,H6pro-Rexp 6.6 Hz.
The conformation of and across the glycosidic bond placed H1’’’ into close proximity of H6a’’ and H6b’’. This was confirmed by an rOe-experiment with observed signal enhancement of the two diastereotopic protons of the methylene group in the D-gluco-pyranose (Figure 3, bottom). Upon irradiation of H1’’’, the resulting enhancement was stronger for H6pro-R’’ as opposed to H6pro-
S’’. With all structures fully assigned and the three-dimensional shape of 5 and 6 established
qualitatively, we turned our attention to the measurement of long-range vicinal 1H-13C-3J constants between protons and carbons. Especially of interest were the coupling constants across the glycosidic bonds, i.e. between the anomeric proton and the aromatic carbon. 1H-13C-J-HMBC analysis The coupling constants between protons and carbons over multiple bonds can be quantitatively determined through J-modulated HMBC experiments. Several such approaches have been described in the literature.32 When arraying the mixing times for spin density to develop at remote locations a pseudo-three-dimensional experiment results in which the volumes of the correlation cross-peaks are modulated by sin(*JH,C*x).32 Hence, when the experimental cross-peak volumes are fitted by a least-square approach to the above equation, the coupling constant between the nuclei can be determined quantitatively. If the periodicity of the modulation reaches at least 2 or more with sufficient data points, the fit can reach satisfactory quality of r2 > 0.98. Figure 4 shows several examples of J-modulated cross-peaks from the HMBC spectrum of 5. Coupling constants greater than 5 Hz were least-squares fitted with excellent r2-values, whereas J-modulations of less than 5 Hz yielded acceptable yet less satisfactory fits. The observed 2-bond 2J1H,13C values in the aromatic core were on the order of 7-9 Hz whereas the 3-bond 3J1H,13C values within or outside the aromatic core were 3-7 Hz (Table 2). It needs to be pointed out that the strength of coupling, i.e. the magnitude of the coupling constant, is not necessarily correlated with distance between the nuclei. While distance is one factor for decrease in coupling strength, lack of electron density along the

General Papers ARKIVOC 2014 (v) 94-122
Page 104 ©ARKAT-USA, Inc.
coupling pathway due to electron-withdrawing features and conformational averaging in flexible portions of the molecule’s structure are contributing as well. Such effects are well-established.33 We subsequently compared the experimentally determined 1H-13C coupling constants with those calculated from published Karplus equations. We used several different equations (1) 3JHCOC = 5.7*cos2() - 0.6*cos() + 0.534 (2) 3JHCOC = 6.68*cos2() - 0.89*cos() + 0.1129 (3) 3JHCOC = 6.3cos2() - 1.2cos() + 0.135 (4) 3JHCOC = 7.49cos2() - 0.96cos() + 0.1536 (5) 3JHCOC = 8.14cos2() - 0.61cos() - 0.1537 (6) 3JHCCC = 8.06*cos2() - 0.87*cos() + 0.4738 (7) 3JC4,H6 = 5.8*cos2() - 1.6 cos() - 0.02 sin() + 0.28 sin(2) + 0.5225,39 (8) 3JH6proR,C4 = 0.11*cos2() - 3.5 cos() + 0.35 sin() - 0.57 sin(2) + 3.5830 (9) 3JH6proS,C4 = 0.5*cos() + 0.06 cos(2) - 0.13 sin() - 3.46 sin(2) + 3.6030 (10) 3JH6proR,C4 = 0.1*cos2() - 3.17 cos() + 0.27 sin() - 0.55 sin(2) + 3.3429 (11) 3JH6proS,C4 = 0.49*cos() + 0.11 cos(2) - 0.13 sin() - 3.54 sin(2) + 3.6429
Equations (1) - (4) provide generic relations for glycosidic HCOC-fragments derived from crystal structures and extensive DFT-calculations, respectively. Equation (5) has been proposed for endocyclic HCOC fragments, e.g. H5-C1 in pyranoses or H4-C1 in furanoses. In addition expressions have been developed for HCCC dihedrals (eq. 6) with specific adjustments for H6-C4 (eq. 7) and the diastereotopic protons of the hydroxymethyl group in carbohydrates, i.e. H6proR/H6proS-C4 (eqs. 8-11). Alternative Karplus equations have been reviewed.23 Coupling constants calculated from Karplus equations must take molecular motion into account and must be derived from time-dependent populations of angles. Molecular motion and conformational averaging over all structure ensembles can be taken into account by molecular dynamics simulations at different levels of theory. The theoretically determined coupling constants from equation (1) - (6) were within the experimental error of the instrument for most angles in our study. Molecular modeling We modeled all structures by a preliminary minimization with molecular mechanics (MM2) followed by the semi-empirical AM1 method and finally with DFT-B3LYP (6-31G). The initial steps in the MM2-minimization were carried out with exhaustive dihedral angle searches to sample the conformational space of the glycosidic bonds. We also included information from rOe-experiments described above to develop a preliminary minimum structure. The structure that was thus obtained was subjected to several heating-cooling cycles over 200 ps between 0K to 300K with 10 ps heating and 10 ps cooling to give AM1 molecular dynamics trajectories. The 0K-structure after cooling the structure from its 300K equilibrium was used for the DFT-calculations. The final structures of the cations 5 and 6 are shown as ball-stick models in Figure 6. Coupling constants and inter-atomic distances were taken from the 180 ps of the thermally equilibrated molecule. The statistical distribution of dihedral angles along the trajectory was analyzed in form of histograms

General Papers ARKIVOC 2014 (v) 94-122
Page 105 ©ARKAT-USA, Inc.
and weighted NMR-coupling constants were calculated from the appropriate Karplus equations. The overall fit of calculated coupling constants to the experimental J-values from HMBC experiments was acceptable within the error of the experiment (Figure 5a). All averaged values from four consecutive MD-runs were assumed to have an error of ± (standard deviation). The typical error asociated with theoretical 1H-13C-J-values was ± 0.2-0.5 Hz. However, for more poorly-fitted theoretical data, the error could be as high as ± 1.5 Hz. For experimental 1H-13C-J-values, the error was assumed at ± 0.5 Hz. Figure 5a shows that the MD-simulation achieved good to excellent fit to the experimental data. Out of four different Karplus equations for the glycosidic fragment HOCO in the literature, three29,34,35 resulted in a satisfactory fit, whereas one36 tended to over-estimate the coupling constants by 0.5-1.5 Hz. The over-estimation resulted presumably from the fact that carbohydrate mimics were used in the study and that the developed Karplus relation does not fully reflect conditions found in real carbohydrates.
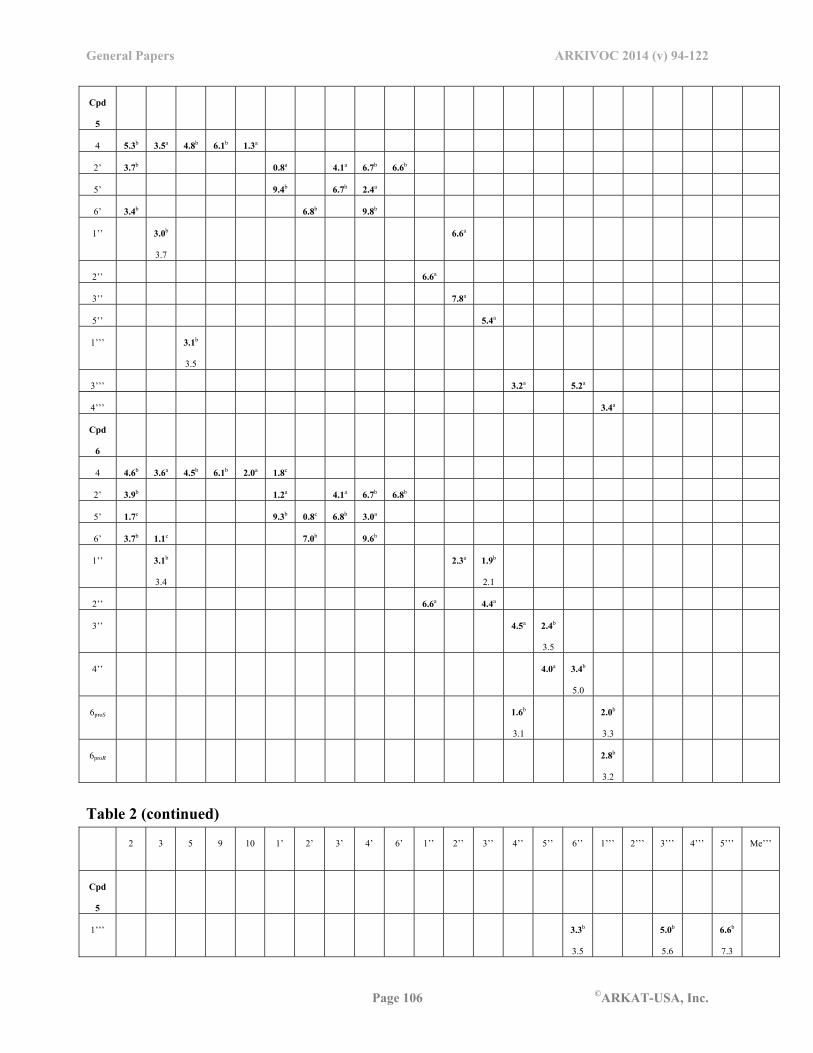
Figure 4. J-HMBC analysis of cross-peaks in the spectrum of cyanin chloride (5). Satisfactory least-square fitting of the data to y = sin(*JH,C*x) was achieved. Table 2. Comparative J1H13C coupling constants in Hz for cyanin chloride (5) and keracyanin chloride (6) in MeOD at rt (Jexp/Jcomput,MD-AM1). The computational J-value is an average of four separate MD-trajectories and was calculated from appropriate Karplus relations from the literature (equations 1-11). a2-bond, b3-bond, c4-bond
13C
→
2 3 5 9 10 1’ 2’ 3’ 4’ 6’ 1’’ 2’’ 3’’ 4’’ 5’’ 6’’ 1’’’ 2’’’ 3’’’ 4’’’ 5’’’ Me’’’
General Papers ARKIVOC 2014 (v) 94-122
Page 106 ©ARKAT-USA, Inc.
Cpd
5
4 5.3b 3.5a 4.8b 6.1b 1.3a
2’ 3.7b 0.8a 4.1a 6.7b 6.6b
5’ 9.4b 6.7b 2.4a
6’ 3.4b 6.8b 9.8b
1’’ 3.0b
3.7
6.6a
2’’ 6.6a
3’’ 7.8a
5’’ 5.4a
1’’’ 3.1b
3.5
3’’’ 3.2a 5.2a
4’’’ 3.4a
Cpd
6
4 4.6b 3.6a 4.5b 6.1b 2.0a 1.8c
2’ 3.9b 1.2a 4.1a 6.7b 6.8b
5’ 1.7c 9.3b 0.8c 6.8b 3.0a
6’ 3.7b 1.1c 7.0b 9.6b
1’’ 3.1b
3.4
2.3a 1.9b
2.1
2’’ 6.6a 4.4a
3’’ 4.5a 2.4b
3.5
4’’ 4.0a 3.4b
5.0
6proS 1.6b
3.1
2.0b
3.3
6proR 2.8b
3.2
Table 2 (continued)
13C
→
2 3 5 9 10 1’ 2’ 3’ 4’ 6’ 1’’ 2’’ 3’’ 4’’ 5’’ 6’’ 1’’’ 2’’’ 3’’’ 4’’’ 5’’’ Me’’’
Cpd
5
1’’’ 3.3b
3.5
5.0b
5.6
6.6b
7.3

General Papers ARKIVOC 2014 (v) 94-122
Page 107 ©ARKAT-USA, Inc.
2’’’ 4.4a 4.4b
6.0
3’’’ 2.8b
4.0
4.3a
4’’’ 3.2b
3.4
4.1a 3.3a 3.8b
4.1
5’’’ 2.8b
1.7
5.0a
Me’’’ 3.9b
3.4
4.4a
a)
Cpd. 5
0.0
0.5
1.0
1.5
2.0
2.5
3.0
3.5
4.0
4.5
5.0
H1''C3 H1'''C5
J [Hz]
Cpd. 6
‐1.0
0.0
1.0
2.0
3.0
4.0
5.0
6.0
7.0
8.0
9.0
10.0
H1''C3
H1''C3''
H3''C5''
H4''C6''
H6S''C4''
H6S''C1'''
H6R''C1'''
H1'''C6''
H1'''C3'''
H1'''C5'''
H2'''C4'''
H3'''C1'''
H4'''C2'''
H4'''C6'''
H5'''C1'''
H6abc'''C4'''
J [Hz]

General Papers ARKIVOC 2014 (v) 94-122
Page 108 ©ARKAT-USA, Inc.
b)
0
50
100
150
200
250
300
350
400
‐180
‐160
‐140
‐120
‐100
‐80
‐60
‐40
‐20 0
20
40
60
80
100
120
140
160
180
Dihedral Angle [o]
Abundance
0
1
2
3
4
5
6
7
8
9
J [Hz]
'''(C5''‐C6''‐O‐C1''')
H6proS ‐C6''‐O‐C1'''
J w,calc = 3.4 Hz
J exp = 2.0 Hz
Cpd. 6
0
50
100
150
200
250
300
350
400
‐180
‐160
‐140
‐120
‐100
‐80
‐60
‐40
‐20 0
20
40
60
80
100
120
140
160
180
Dihedral Angle [o]
Abundance
0
1
2
3
4
5
6
7
8
9
J [Hz]
''(O‐C6''C5''C4'')
H6proS ‐C6''C5''C4''
J w,calc = 3.1 Hz
J exp = 1.6 Hz
Cpd. 6
Figure 5. Nomenclature as in Figure 1: a) Comparison of experimental (circles) and theoretical34 (bars, four repeated 200s AM1-MD-trajectories) 1H-13C-J-values in 5 and 6 (left, top + bottom) as well as average theoretical values calculated from four different Karplus relations for glycosidic bonds (solid)29,34-36 (right, top + bottom). b) Histograms of AM1-MD-trajectories of different glycosidic bonds at 300K of 5 and 6. Theoretical coupling constants (Table 2) are shown at 300K from different Karplus relationships for HCOC in the literature.29,34
Both glycosidic dihedral angles in 5 were fairly rigid and did not show substantial contribution
from multiple angle populations at 300 K. The two -angles (C3-O-C1’’-O5’’ and C5-O-C1’’’O5’’’) were dominated by the exo-anomeric effect across the -configured linkage with majority of all populations around -80º in the g--conformation and only minor contributios from the trans-conformation. For ’’, 88% of all geometries over four MD-trajectories had an average angle of around -80º with the remainder at around -146º. The corresponding distribution for ’’’ was g- around -82º (80%) and trans around -145º (20%). The theoretical coupling constants determined from Karplus equation (1) of 3JH1’’C3 3.4 Hz and 3JH1’’’C5 3.6 Hz matched the experimental values of 3.0 Hz and 3.1 Hz, respectively, very well (J 0.3-0.5 Hz). The statistical angle distribution was also consistent with the rOe-enhancements between H1’’/H4 and H1’’’/H6. A bimodal distribution of angles with two distinct populations of g+ (66% around +65º) and g- (34% around -55º) was observed for the ’’-angle of the glucopyranose attached to C3. The weighted average angle for the two populations was around +25º. The average angle of +25º resulted in an inter-proton distance between H1’’ and H4 of 2.3 Å in full agreement with the strong rOe observed experimentally (Figure 3). The two distinct dihedral angle populations might be the result of the presence of one

General Papers ARKIVOC 2014 (v) 94-122
Page 109 ©ARKAT-USA, Inc.
sugar to one side (at C5) and the catechol ring to the other side (at C2). On the other hand, the ’’’-angle across the glycosidic bond at C5 in 5 was found preferentially in only one single distribution of conformations with an average angle of -3º and an average spread from -26º to +23º. In the weighted average conformation, protons H1’’’ and H6 were found at a distance of 1.9 Å, which matched the experimentally observed rOe very well.
In compound 6, the ’’-angle in the glycosidic bond on the aromatic core was very similar to that in 5 and populated primarily the g--conformation (88% at around -79º) and the trans-conformation (12% at around -143º) consistent with the observed rOe-enhancement at H6 upon irradiation of H1’’’. The average inter-proton distance between H1’’’ and H6 was 3.1 Å. The vicinal coupling constant between H1’’-C3 in the 300K MD-simulation of 6 was calculated to be 3.4 Hz, which was close to the experimentally determined J-value of 3.1 Hz (Figure 5b). The ’’-angle (C1’’-O-C3-C4) was not experimentally determined. However, the MD-simulations revealed a strong preference for the g+-conformation at 93% around +64º, whereas the g--conformation around -38º was very infrequently populated with only 7%. The trans-conformation was completely absent for both ’’ and ’’ (Figure 5b). Experimentally, we detected the J-modulated cross peak for H1’’’/C6’’ to define the -angle of the other glycosidic bond with a resulting coupling constant of 3JH1’’’C6’’ 3.3 Hz. In the 300K MD-simulation of 6, the calculated coupling constant of 3JH1’’’C6’’ 3.5 Hz (94% of all angles around +42º) was in excellent agreement with the experiment. Therefore, the ’’’-angle (C6’’-O-C1’’’-O5’’’) strongly preferred the g--conformation (around -81º) as consistent with the exo-anomeric effect. The ’’’-angle (C1’’’-O-C6’’-C5’’) was characterized by more flexibility (Figure 5b). By experiment, the ’’’-angle is indirectly defined by 3JH6proS’’C1’’’ 2.0 Hz and 3JH6proR’’C1’’’ 2.8 Hz. Whereas the latter matched the MD-simulations well (3.2 Hz, 76% around -83º and 24% around +40º), the correlation between H6proS’’ and C1’’’ did not match the MD-data very well despite an acceptable fitting to sin(*J*x) with r2 = 0.96. Therefore, the error of 3JH6proS’’C1’’’ can be assumed to be significantly higher than only ± 0.5 Hz. Unlike the two glycosidic angles ’’ and ’’ at the aromatic core with narrow histograms (vide supra), the histogram for ’’’ showed significantly broadened angle distributions. Nevertheless, during dynamics simulation, the average distances between H6proS’’/H1’’’ and H6proR’’/H1’’’ were 2.9 Å and 2.4 Å, respectively. The closer proximity of H6proR’’ to H1’’ in comparison to H6proS’’ matched the difference in observed rOe enhancement.
The -angle (O-C6’’-C5’’-C4’’) of the (1→6)-glycosidic bond was indirectly characterized by coupling between H6proR’’/H6proS’’ and C4’’. However, only the 3JH6proS’’C4’’ coupling was observed at 1.6 Hz (r2 = 0.92). From MD-data, it was obvious that the -angle was much more flexible than either of the two -angles discussed above in which the exo-anomeric effect was dominant. For , the trans-conformation was the primary geometry as determined by molecular dynamics simulation. However, a notable number of g+ and g--conformations was observed as well. The fit of the H6proS’’/C4’’ MD-data was only marginal (1.6 Hz experimentally and 3.0 Hz by MD). The poor fit of the 1H-13C-data is a consequence of the absence of suitable Karplus relations for substituted (1→6)-glycosidic bonds in the literature and the relation for free hydroxymethyl systems was used instead. However, we achieved excellent statistical fit of the proton pairs H6proS’’H5’’ and H6proR’’H5’’ to published Karplus equations (Jexp 1.8 Hz versus 3JH5,H6pro-S
theor 1.7 Hz and Jexp 6.6

General Papers ARKIVOC 2014 (v) 94-122
Page 110 ©ARKAT-USA, Inc.
Hz versus 3JH5,H6pro-Rtheor 7.0 Hz), namely 3JH5,H6pro-S
theor = -1.29cos() + 4.58cos(2) + 0.05sin() + 0.07sin(2) + 4.92 and 3JH5,H6pro-R = 0.47cos2() - 0.12cos() + 0.90sin() + 4.86sin(2) + 5.08.30
The statistical distributions of the dihedral angles ’’, ’’’, ’’’, and ’’ for 6 are shown in Figure 5b. The MD-histograms for the experimentally determined coupling constants are shown in solid color and the corresponding glycosidic angles as defined by IUPAC are shown in grey. Narrow distributions indicated well-defined geometries without major contributions from alternative dihedral angle populations, which was the case for ’’ at the aromatic core and ’’’ between the D-glucopyranose and the L-rhamnopyranose. Significantly higher flexibility was observed for the dihedral angles ’’’ and ’’ that displayed much broader distributions.
Figure 6a shows the 0K DFT-B3LYP 6-31G structures of 5 and 6 that were obtained after preliminary force field (MM2) and semi-empirical minimization (AM1) in vacuo. The dihedral angles of the two glycosidic bonds in 5 (’’/’’, green and ’’’/’’’, blue) are close to the average geometry during MD at the semi-empirical AM1-level. For 6, only angles ’’, ’’, and ’’’ were close to the 0K structure whereas ’’ and ’’’ were more flexible. The average overlay of the dihedral angle distributions as well as the major conformations (dark grey) and minor conformations (light grey) (Figure 6b, c) were in excellent agreement with inter-proton distances from the AM1-MD trajectories and the experimental rOe-enhancements. Generally, any pair of protons whose average distance was significantly below 3.0 Å did display an rOe enhancement. a)

General Papers ARKIVOC 2014 (v) 94-122
Page 111 ©ARKAT-USA, Inc.
b)
c)
Figure 6. a) Molecular models (DFT B3LYP 6-31G) at 0K of 5 and 6; Overlay of glycosidic bond angle fragments (major: dark grey, minor: light grey) b) of 5 and c) of 6 with percentages of structures along the trajectory with H-H-distances below certain values. For proton pairs with a significant percentage below 3 Å in the trajectory consistent nOe-enhancements were observed (Figure 3).
A few examples are shown in Figure 6b and c. Of all trans-annular distances between H1’’ and H4’’ in 5 over four MD-simulations for example, only 5-8 % were below 4.5 Å and 0 % below 3.0 Å in the MD-trajectory (no experimental rOe observed) whereas the pairs H1’’/H5’’ (diaxial), H1’’/H4, H6proR’’/H1’’’, and H6proS’’/H1’’’ had substantially higher average percentages of distances below 3.0 Å across all four MD-trajectories, namely 55% of all, 55% of all, 66% of all, and 51% of all, respectively.
H4
H1’’
H6R’’ H6S’’
H1’’’
H4 H1’’
H6
H1’’’
General Papers ARKIVOC 2014 (v) 94-122
Page 112 ©ARKAT-USA, Inc.
H-/D-Exchange in NMR solvent Interestingly, after several months in deuterated NMR solvent, compounds 3, 4, and 6 substituted deuterium for hydrogen at H6 and H8, whereas resveratrol (1), (-)-epicatechin (2), and cyanin chloride (5) remained unchanged. The exchange in 3, 4, and 6 was already noticeable after as little as one month. This was surprising because the samples were warmed to room temperature only for the required NMR experiments and otherwise were stored at -20 ºC. The unusual experimental observation prompted us to investigate the structures by molecular modeling to find a possible explanation.
It is known from the literature that phenolic structures in which hydroxyl groups are present in meta-position to each other can undergo H-/D-exchange but require elaborate transition metal catalysis or other catalysis,40 unusual reaction conditions such as sub-/super-critical solvents41or rather harsh reaction conditions.42 Scheme 1 shows a few of such reactions. Our observation of H/D-exchange at H6 and H8 in the chromenylium core of 2, 3, and 5 is very similar to the previously reported H/D-exchange in hydroxylated flavones.42 It has been shown that substitutions in ortho- and meta-position relative to the hydroxyl group can have great influence on the rate of H/D-exchange in phenols.43 Meta-alkyl- and meta-alkyloxy substituents had rate-accelerating effects on the aqueous acid-catalyzed H/D-exchange of the neighboring proton in phenol, whereas electron-withdrawing substituents such as chlorine appeared to have the opposite effect. In 3, 4, 5, and 6, however, the electron density distribution is more complicated because of resonant delocalization. Several publications describe H/D-exchange in substituted arenes,44 aromatic heterocycles,40 and phenols42 and one publication reports quantitiative secondary isotope effects in extended aromatic systems that feature keto-enol structures.45 The terms “primary isotope effect” (PIE) and “secondary isotope effect” (SIE) are used in two different contexts in the literature. For mechanistic studies, the PIE refers to reactions directly at the isotopic site, whereas the SIE refers to reactions that take place at a remote site relative to the isotope substitution. An IE exists if the isotope substitution has a marked effect on the rate constant of the reaction. Such measurements have been used for many decades and have provided methods to investigate compounds’ acidities46 and basicities.47 In NMR spectroscopy, the IE terminology refers to differences in chemical shift for nuclei that are directly attached to the isotope or that are neighbors to the site of isotope substitution. In NMR spectroscopy, IEs have been generally reported for different classes of nuclei and substances,48 have been used to describe conformational changes49 and hydrogen-bonded systems,50 and have been applied successfully to the structural description of small proteins in solution and in solid-state.48
The absence of H/D-exchange at H6 and H8 for 5 and the progressing exchange of H6 and H8 in 5 is shown in Figure 7. Increased deshielding in 5 shifted the resonances to over 7.0 ppm whereas they were shielded to below 7.0 ppm in 6. The same extent of shielding was apparent in 3 and 4 in which H6 and H8 were exchanged as well. Obviously, the glycosylation of the hydroxyl group at C5 in 5 is significant in suppressing the H/D-exchange.

General Papers ARKIVOC 2014 (v) 94-122
Page 113 ©ARKAT-USA, Inc.
OL
HX
+ DL2O
OL
DX
+ HL2O
H H
D
R R
R = H, CH3
N Rh
P(t-Bu)2
P(t-Bu)2
OPh
+ H2O + HDO
O
O
X
H
O
O
X
D
NaODD2O
Scheme 1. H-/D-Exchange in substituted phenols. Rate constant substituent parameters can be found in the literature and a Hammett correlation with + for ortho-, meta-, and para-substituents has been described.43 Exchange reactions between phenol and sub- and super-critical D2O
41 as well as polyphenols and aqueous base and acid have been described also.42
In the 13C-NMR spectrum of 6, the complete H/D-exchange resulted in the disappearance of the C6 and C8 signals because of +1, 0, -1 splitting as neighbors to deuterium. The signal-to-noise was not sufficient to observe the three-line pattern (Figure 8). In addition, we observed moderate secondary isotope effects on the adjacent carbons, namely C5, C7, and C9. With only one exchanged site as neighbors each, the signals of C5 and C9 were deshielded by 0.04-0.05 ppm. On the other hand, C7 was located between two exchanged sites and showed slightly more pronounced deshielding of 0.06 ppm. These values were comparable to values that have previously been reported for perylene quinone systems.45
Although resveratrol (1) shares similar structural features with 3, 4, and 6 and similar strong magnetic shielding for the protons in the meta-disubstituted phenol ring, compound 1 did not show any sign of H/D-exchange. Apparently, the magnetic shielding of protons and the presence of two hydroxyl groups meta to each other on the aromatic ring was not sufficient to cause H/D-exchange at room temperature.

General Papers ARKIVOC 2014 (v) 94-122
Page 114 ©ARKAT-USA, Inc.
Figure 7. Top: H/D-exchange for cyanin chloride (5) in the NMR tube (MeOD). No change was observed even after prolonged time periods at rt over several months; bottom: H/D-exchange for keracyanin chloride (6) in the NMR tube (MeOD). Almost complete exchange was observed for both H6 and H8 selectively after about 8 months (bottom to top trace).

General Papers ARKIVOC 2014 (v) 94-122
Page 115 ©ARKAT-USA, Inc.
Figure 8. Both panels top: 13C-NMR spectrum (detail) of keracyanin chloride (6) after complete H/D-exchange in MeOD. Exchange at C6 and C8 resulted in splitting (2H: m = +1, 0, -1) and disappearance of the signal into the baseline. Both panels bottom: 13C-NMR spectrum (detail) during H/D-exchange in MeOD at C6 and C8. The IE of the neighboring C5, C7, and C9 is clearly evident.

General Papers ARKIVOC 2014 (v) 94-122
Page 116 ©ARKAT-USA, Inc.
Scheme 2. Proton/Deuteron-catalyzed isotope exchange for 3, 4, and 6. The non-aromatic keto-form of the structure is responsible for free D-Cl, which catalyzes the isotope exchange at the -position of the carbonyl. NMR chemical shifts indicated more significant aromaticity for 5 in which H6 and H8 were more deshielded and, thus, not exchanged (see Supplemental Materials).
A possible explanation might be that 3, 4, and 6 are able to liberate a catalytic quantity of free DCl from their chloride salt form. The free DCl must have resulted from abstraction of deuteroxyl

General Papers ARKIVOC 2014 (v) 94-122
Page 117 ©ARKAT-USA, Inc.
deuterons because all hydroxyl groups exchanged freely and instantly with deutero-methanol. H/D-exchange for keracyanin chloride (6) in the NMR tube (MeOD). Exchange at C6 and C8 resulted in secondary isotope chemical shift effects at C5, C7, and C9.
Scheme 2 shows a possible mechanism in which the aromaticity of the ring carrying H6 and H8 is affected by chloride-promoted abstraction of a deuteron from position 7 or 5. The resonant delocalization of the resulting negative charge is favored by the conjugated enonium substituent at the ortho/para-position 10 relative to position 5 and 7. The keto-form of 5, while most likely not significant in concentration, must have existed to a sufficient extent to allow subsequent acid-catalyzed H/D-exchange at the -carbon of the ketone by a well-documented mechanism. The 1H-NMR signals observed for H6 and H8 in 3, 4, and 6 are slightly more deshielded in comparison with known values for vinylic protons in Michael-type systems, i.e. the -proton (H6 or H8, Table 1) around 6.2 ppm. However, H6 and H8 do not display typical aromatic chemical shifts either. Therefore, the abstraction of the deuteron from position 5 or 7 was apparently fast and reversible, which imparted partial keto-character onto the aromatic ring and caused an averaged chemical shift for H6 and H8 between true aromatic and Michael-vinylic -values. Keto-enol tautomerization of phenols have been reviewed in the literature.51 Conclusions NMR analysis of several polyphenol structures provided full structural details including glycosidic bond conformations. The glycosidic bond conformation in cyanin chloride (5) and keracyanin chloride (6) between the gluco-pyranoside and the aromatic core was very similar and was confirmed by pseudo-3D J-modulated 1H-13C-HMBC experiments and by 1D-pfg-ROESY experiments. Molecular dynamics simulations at the semi-empirical AM1-level gave statistical glycosidic HCOC-dihedral angle distributions from which 1H-13C-coupling constants were calculated. The overall match to experimental coupling constants and inter-proton distances was very good. We assume that higher-level calculations will improve the fit. Compounds 3, 4, and 6 were observed to exchange deuterium for protons at C6 and C8 of the chromelynium core. While keto-enol tautomerizations of phenols and concomitant H/D-exchange at various aromatic locations under elaborate catalysis have been described in the literature, such exchange was easily possible for 3, 4, and 6 in methanol-d4 near room temperature and with very high structural selectivity. Structures that lacked acid-catalysis or had alkyloxy substitutents such as 1, 2, and 5 did not show any such H/D-exchange even after prolonged periods of time at room temperature.

General Papers ARKIVOC 2014 (v) 94-122
Page 118 ©ARKAT-USA, Inc.
Experimental Section NMR analysis. NMR samples were dissolved into methanol-d4 (Cambridge Isotope Company, Massachusetts, USA) in high-precision NMR glass tubes (5mm OD) and spectra were recorded at rt on a JEOL ECA-600MHz instrument with a dual-channel normal-geometry probe or inverse-geometry probe. The 1H-, 13C-, 1H-1H-COSY, 1H-1H-TOCSY, and 1H-13C-HMQC experiments were carried with spinning (15 Hz). The 1H-pfg-rOe, 1H-13C-HMBC, and 1H-13C-J-HMBC spectra were recorded non-spinning. Nuclear Overhauser effect experiments included a mixing time of tmix = 250 ms, a 7 s relaxation delay, and a spin lock pulse of 49.4 s at 21 dB. The HMBC experiments were run with a one-bond coupling constant of 140 Hz and a 2,3-bond constant of 6-8 Hz. The relaxation delay was set at 5s. In J-HMBC experiments, the constant time window was 0.29 s in 20-30 ms increments, the relaxation delay was 5 s, and the one-bond coupling constant was 140-160 Hz. The pseudo-3D-data from the J-HMBC experiments were sliced along the variable time axis and the projections of cross-peak modulation was used for sinusoidal fitting. The projections displayed only absolute-value peak intensities so that the intensity values for every second lobe were multiplied by (-1) to result in a sinusoidal curve for fitting. The fitting was carried out in PSI-Plot (Ver. 8.02a, Poly Software International, Inc., New York, USA). The time increments (column 1) and the cross-peak intensity-values in arbitrary units (column 2) were entered into the spreadsheet and were subsequently fitted to the user-defined model of [INDVAR]: Column1, [DEPVAR]: Column2, [PARAMS]: A,B, [EQUATIONS]: Column2=B*SIN(PI*A*Column1), [INIT PARAMS]: A=3, B=1, ENDMODEL. The initial guess for parameters A and B was adjusted depending on the tightness of the sinusoidal modulation in each case. The program was executed and converged to least-square residual error for the best fit of y = sin(*JH,C*x). While the parameter A provided the best value for the coupling constant (fit along the x-axis), the parameter B allowed optimal fit of the data with different intensity amplitudes along the y-axis. Molecular modeling. Molecular models were constructed with conformations based on NMR scalar coupling information and nOe/rOe restraints. The models were initially minimized in the MM+ or MM2 force field (block-diagonal Newton-Raphson). Subsequently, the molecule was further minimized by the semi-empirical AM1 method and at higher DFT-B3LYP 6-31G level to give 0K structures. Dihedral angles for which J-HMBC data were available were defined in the molecule as well as intramolecular H-H distances for which nOe/rOe information had been collected. The dihedral angles and inter-proton distances of interest were defined in the molecular structure. Initial molecular dynamics trajectories were generated with heating in vacuo to 300K over 10 ps, maintaining 300K for 190 ps and then cooling to 0K over 10 ps for a total simulation time of 200 ps. Snapshots of all dihedral angles and intramolecular distances were recorded every 20 fs for overall 10,000 data points. Only time-dependent values from 10-190 ps at thermal equilibrium were used and were evaluated in histograms. Weighted average values were used for distance-correlation and dihedral angle analysis by Karplus equations (Supplemental Material). For discussion of the general geometry of the structure and for the calculation of the dihedral angle coupling constant via

General Papers ARKIVOC 2014 (v) 94-122
Page 119 ©ARKAT-USA, Inc.
the Karplus equation, phase-dependent angles or their weighted contributions were used, i.e. positive and negative inclination (0º to + 180º and 0º to - 180º). Supplementary Material Available Supplementary material is available for this publication. Acknowledgements The authors thank the Department of Chemistry for support. This work was made possible by funding from the National Science Foundation under grant NSF-MRI-0722654. Mention of trade names or commercial products in this publication is solely for the purpose of providing specific information and does not imply recommendation or endorsement by the U.S. Department of Agriculture. USDA is an equal opportunity provider and employer. References 1. Castaneda-Ovando, A.; Pacheco-Hernandez, M. d. L.; Paez-Hernandez, M. E.; Rodriguez, J. A.;
Galan-Vidal, C. A. Food Chem. 2009, 113, 859. http://dx.doi.org/10.1016/j.foodchem.2008.09.001
2. Perez-Vizcaino, F.; Duarte, J. Mol. Aspects Med. Phytochem. Cardiovasc. Prot. 2010, 31, 478. http://dx.doi.org/10.1016/j.mam.2010.09.002
3. Pourcel, L.; Routaboul, J.-M.; Cheynier, V.; Lepiniec, L.; Debeaujon, I. Trends Plant Sci. 2007, 12, 29. http://dx.doi.org/10.1016/j.tplants.2006.11.006
4. Silva, J. P.; Coutinho, O. P. Drug Disc. Therap. 2010, 4, 144. 5. Daglia, M. Curr. Opin. Biotechnol. 2012, 23, 174.
http://dx.doi.org/10.1016/j.copbio.2011.08.007 6. Zafra-Stone, S.; Yasmin, T.; Bagchi, M.; Chatterjee, A.; Vinson, J. A.; Bagchi, D. Mol. Nutr.
Food Res. 2007, 51, 675. http://dx.doi.org/10.1002/mnfr.200700002
7. Longo, L.; Vasapollo, G. Recent Prog. Med. Plants 2006, 14, 31. 8. Sancho, R. A. S.; Pastore, G. M. Food Res. Int. 2012, 46, 378.
http://dx.doi.org/10.1016/j.foodres.2011.11.021 9. Schwarz, M.; Winterhalter, P. ACS Symp. Ser. 2004, 886, 179.
http://dx.doi.org/10.1021/bk-2004-0886.ch011 10. 10. Dembitsky, V. M.; Poovarodom, S.; Leontowicz, H.; Leontowicz, M.; Vearasilp, S.;
Trakhtenberg, S.; Gorinstein, S. Food Res. Int. 2011, 44, 1671.

General Papers ARKIVOC 2014 (v) 94-122
Page 120 ©ARKAT-USA, Inc.
http://dx.doi.org/10.1016/j.foodres.2011.03.003 11. Takeda, K. Proc. Jap. Acad., Ser. B 2006, 82, 142. 12. See Suppemental Materials. 13. Li, X.; Ma, H.; Huang, H.; Li, D.; Yao, S. Nat. Prod. Res. 2013, 27, 456.
http://dx.doi.org/10.1080/14786419.2012.706299 14. Marienhagen, J.; Bott, M. J. Biotechnol. 2013, 163, 166. 15. Gutowsky, H. S.; McCall, D. W. Phys. Rev. 1951, 82, 748.
http://dx.doi.org/10.1103/PhysRev.82.748 16. Gutowsky, H. S.; McCall, D. W.; Slichter, C. P. Phys. Rev. 1951, 84, 589.
http://dx.doi.org/10.1103/PhysRev.84.589.2 17. Glick, R. E.; Bothner-By, A. A. J. Chem. Phys. 1956, 25, 362.
http://dx.doi.org/10.1063/1.1742895 18. Karplus, M. J. Am. Chem. Soc. 1963, 85, 2870.
http://dx.doi.org/10.1021/ja00901a059 19. Karplus, M.; Anderson, D. H.; Farrar, T. C.; Gutowsky, H. S. J. Chem. Phys. 1957, 27, 597.
http://dx.doi.org/10.1063/1.1743784 20. Ramsey, N. F. Phys. Rev. 1953, 91, 303.
http://dx.doi.org/10.1103/PhysRev.91.303 21. Toukach, F. V.; Ananikov, V. P. Chem. Soc. Rev. 2013, 42, 8376.
http://dx.doi.org/10.1039/c3cs60073d 22. Lemieux, R. U.; Kullnig, R. K.; Bernstein, H. J.; Schneider, W. G. J. Am. Chem. Soc. 1957, 79,
1005. http://dx.doi.org/10.1021/ja01561a069
23. Coxon, B. Adv. Carbohydr. Chem. Biochem. 2009, 62, 17. http://dx.doi.org/10.1016/S0065-2318(09)00003-1
24. McNaught, A. D. IUPAC Nomenclature of carbohydrates 2001, 3, 2753. 25. Tvaroska, I.; Gajdos, J. Carbohydr. Res. 1995, 271, 151.
http://dx.doi.org/10.1016/0008-6215(95)00046-V 26. Tvaroska, I.; Taravel, F. R. Adv. Carbohydr. Chem. Biochem. 1995, 51, 15.
http://dx.doi.org/10.1016/S0065-2318(08)60191-2 27. Saewen, E.; Massad, T.; Landersjoe, C.; Damberg, P.; Widmalm, G. Org. Biomol. Chem. 2010,
8, 3684 http://dx.doi.org/10.1039/c003958f
28. Pendrill, R.; Saewen, E.; Widmalm, G. J. Phys. Chem. B 2013, 117, 14709-14722. http://dx.doi.org/10.1021/jp409985h

General Papers ARKIVOC 2014 (v) 94-122
Page 121 ©ARKAT-USA, Inc.
29. Tafazzoli, M.; Ghiasi, M. Carbohydr. Res. 2007, 342, 2086. http://dx.doi.org/10.1016/j.carres.2007.05.032
30. Thibaudeau, C.; Stenutz, R.; Hertz, B.; Klepach, T.; Zhao, S.; Wu, Q.; Carmichael, I.; Serianni, A. S. J. Am. Chem. Soc. 2004, 126, 15668. http://dx.doi.org/10.1021/ja0306718
31. Peric-Hassler, L.; Hansen, H. S.; Baron, R.; Huenenberger, P. H. Carbohydr. Res. 2010, 345, 1781. http://dx.doi.org/10.1016/j.carres.2010.05.026
32. Schoefberger, W.; Schlagnitweit, J.; Mueller, N. Annu. Reports NMR Spectr. 2011, 72, 1. http://dx.doi.org/10.1016/B978-0-12-385857-3.00001-3
33. Serianni, A. S.; Carmichael, I. Polymer Preprints 2001, 42, 80. 34. Tvaroska, I.; Hricovini, M.; Petrakova, E. Carbohydr. Res. 1989, 189, 359.
http://dx.doi.org/10.1016/0008-6215(89)84112-6 35. Tvaroška, I. Carbohydr. Res. 1990, 206, 55.
http://dx.doi.org/10.1016/0008-6215(90)84005-F 36. Cloran, F.; Carmichael, I.; Serianni, A. S. J. Am. Chem. Soc. 1999, 121, 9843.
http://dx.doi.org/10.1021/ja984384t 37. Houseknecht, J. B.; Lowary, T. L.; Hadad, C. M. J. Phys. Chem. A 2003, 107, 372.
http://dx.doi.org/10.1021/jp026610y 38. Aydin, R.; Guenther, H. Magn. Reson. Chem. 1990, 28, 448.
http://dx.doi.org/10.1002/mrc.1260280513 39. Taravel, F. R.; Durier, V.; Gouvion, C.; Mazeau, K.; Tvaroska, I. J. Chim. Phys. Physico-Chim.
Biol. 1994, 91, 798. 40. Guy, K. A.; Shapley, J. R. Organometallics 2009, 28, 4020.
http://dx.doi.org/10.1021/om9001796 41. Kubo, M.; Takizawa, T.; Wakai, C.; Matubayasi, N.; Nakahara, M. J. Chem. Phys. 2004, 121,
960. http://dx.doi.org/10.1063/1.1753551
42. Massicot, J. Bull. Soc. Chim. Fr. 1967, 12, 2204. 43. Yoshino, A.; Nakashima, Y.; Takahashi, K. Bull. Chem. Soc. Jap. 1988, 61, 3393.
http://dx.doi.org/10.1246/bcsj.61.3393 44. Davis, K.; Garnett, J. L.; Hoa, K.; Kenyon, R. S.; Long, M. Catal., Proc. Int. Congr. 1973, 1,
491. 45. Mazzini, S.; Merlini, L.; Mondelli, R.; Nasini, G.; Ragg, E.; Scalioni, L. J. Chem. Soc., Perkin
Trans. 2 1997, 2013. 46. Perrin, C. L.; Flach, A. Angew. Chem., Int. Ed. 2011, 50, 7674.
http://dx.doi.org/10.1002/anie.201102125 47. Perrin, C. L.; Karri, P. J. Am. Chem. Soc. 2010, 132, 12145.
http://dx.doi.org/10.1021/ja105331g

General Papers ARKIVOC 2014 (v) 94-122
Page 122 ©ARKAT-USA, Inc.
48. Abildgaard, J.; Hansen, P. E.; Manalo, M. N.; Wang, A. L. J. Biomol. NMR 2009, 44, 119. http://dx.doi.org/10.1007/s10858-009-9316-0
49. Aydin, R.; Guenther, H. Angew. Chem. 1981, 93, 1000. http://dx.doi.org/10.1002/ange.19810931108
50. Guo, J.; Tolstoy, P. M.; Koeppe, B.; Golubev, N. S.; Denisov, G. S.; Smirnov, S. N.; Limbach, H.-H. J. Phys. Chem. A 2012, 116, 11180. http://dx.doi.org/10.1021/jp304943h
51. Kresge, A. J. Chemtracts 2002, 15, 212.