structured products - kaist business school
TRANSCRIPT

MAY 2010
We would like to thank Jim Davis, Bryan Harris, Marlena Lee, Bryan McClune, and Gerard O’Reilly for their useful comments.
1. Larry Light, “Twice Shy on Structured Products?” Wall Street Journal, May 28, 2009.2. For example, a report of a 47% increase in the UK retail structured product sales is found in the
following website: http://advancequities.com/en/the-latest-news/headlines/88-headlines/227-77.html.
Structured Products
INMOO LEE AND EDUARDO REPETTO
Structured productS are SecuritieS that pay investors a return based on the performance of an underlying asset, such as a stock, index, or commodity, according to a pre-set rule. Packaged and offered by investment banks, these products can be useful to investors who desire a specific payoff structure linked to the performance of the underlying assets. Structured products gained popularity in Europe and Asia starting in the late 1990s, and among retail investors in the US in the mid-2000s. According to a report from the Wall Street Journal,1 sales of structured products surged from $62 billion in 2006 to $105 billion in 2007, before the financial crisis. Sales dropped to $70 billion in 2008, but some sources report a rebound in structured product sales in 2009.2 Since structured products can provide a multitude of complex payoff structures, investors may struggle to understand how these securities are designed and priced, and more importantly, whether the payoff structures are appropriate for them. This complexity leads many retail investors to buy the products based on recommendations from perceived financial experts. The above-mentioned Wall Street Journal article describes cases in which investors claimed they were misled by brokers and were not well informed of the payoff structures linked to the performance of other securities. In addition, some investors equate complex instruments with higher expected returns without realizing the fact that the products are simply repackaged versions of portfolios combining multiple securities to generate a certain type of payoff. Consequently, investors may not pay sufficient attention to the possibly high cost of these instruments.
©2010 DFA Securities Inc. All rights reserved. The material in this publication is provided solely as background information for registered investment advisors and institutional investors and is not intended for public use. Unauthorized copying, reproducing, duplicating, or transmitting of this material is prohibited.
Dimensional Fund Advisors is an investment advisor registered with the Securities and Exchange Commission.

Dimensional Fund Advisors2
Overview
In this paper, we explain the key features of structured products and show that there is no magic behind their payoff structures. We illustrate how the payoff of a structured product can be replicated in a portfolio composed of underlying securities, and derivatives written on those securities. We also emphasize that investors will not benefit from structured products unless they need a specific payoff structure in the future. In addition, we discuss whether structured products are useful for long-term investors and point out potential problems with the use of these products. Finally, we address other important issues to consider before investing.
Payoff Structure
The European Structured Investment Products Association (ESIPA) categorizes investment structured products into capital protection, yield enhancement, and participation products. The payoffs of these securities vary according to design.
For example, a reverse convertible bond, which is a yield enhancement product, pays investors a higher coupon rate than other comparable bonds as compensation for the issuer having the option to pay off the bond not with cash, but with a pre-specified number of common stock shares at maturity. This is the opposite of a convertible bond, which gives investors the option to convert the bond into common stock. The option provided to issuers of a reverse convertible bond is equivalent to a put option in that issuers can sell a pre-specified number of common stock shares to investors at the face value of the bond.3
Assume that an issuer offers reverse convertible discount bonds at an 8% yield with a face value of $1,000 (e.g., price = $1,000/(1 + 0.08) = $925.93), which mature in one year. Alternatively, this issuer can offer equivalent straight discount bonds at the yield of 5% (e.g., price = $1,000/(1+ 0.05) = $952.38).4 The issuing company’s current stock price is $100 per share. On the maturity date, the issuer could either pay $1,000 or give ten shares of common stock to reverse convertible bond holders. Given this structure, the issuer will certainly give ten shares of its common stock on the maturity day if the stock price is less than $100. However, if the stock price is above $100 by the maturity date, the issuer will pay $1,000, instead of giving ten shares that are worth more than $1,000. The issuing company is willing to receive $26.45
3. A call option provides option holders with rights (but not obligations) to buy the underlying security at a pre-specified price (a strike price) at or before a certain time in the future (a maturity date). Similarly, a put option provides option holders with rights to sell the underlying security at a strike price on or before the maturity date. For those who are not familiar with options, it may be useful to read the introduction to options provided in Appendix A.1. 4. In most cases, reverse convertible bonds are issued by investment banks, and put options are written on a different company’s stock. For example, an issuing bank can either pay principal in cash or give a certain number of shares of another company at maturity. In this example, for simplicity, it is assumed that the option is written on the issuer’s stock.

Structured Products 3
($952.38 - $925.93) less from investors today in return for receiving the option to give ten shares, instead of $1,000 cash, on the maturity date. Investors, on the other hand, are willing to take downside risk in return for receiving a 3% higher yield when stock prices at maturity remain above the current level. Table 1 shows the payoff of the reverse convertible bond at maturity, together with the payoff of two alternative investments at maturity—a comparable straight discount bond investment at a lower yield and an investment in the issuing company’s stock. It also shows the payoff of the option held by the issuing company.
Reverse convertible bondholders will fully benefit from this arrangement as long as stock prices remain above $100 on the maturity day since they can pay $26.45 less than they would pay for equivalent bonds without put options. However, investors will start to lose once the stock price drops below $100 since they will receive stocks that are worth less than the $1,000 face-value of the bond. If the stock price drops below $97.36, investors will lose more than the reduced payment of $26.45 and will realize negative returns from the investment once the stock price drops even further to a level below $92.60. Figure 1 shows profits and losses on the maturity date, depending on the issuing company’s stock price. Throughout the paper, the payoff of a product refers to the value of the product before any costs are subtracted, whereas profits/losses refer to the net payoffs of a product after subtracting initial costs.
Investor Alternatives Investment Yield ST ≥ $100 ST < $100
Reverse Convertible Bond (RCB) $925.93 8% $1,000 10 Shares x ST
Straight Discount Bond (SDB) $925.93 5% $972.23 $972.23
Stock (9.25 Shares @ $100 per) $925.93 – 9.2593 Shares x ST 9.2593 Shares x ST
Issuer's Benefit and Cost ST ≥ $100 ST < $100
Amount Saved by Paying with Stock Rather Than $1,000 Cash $0 $1,000 – (10 x ST)
Cost of RBC Option to Issuer ($952.38 – $925.23) $26.45 $26.45
Note: ST stands for the stock price at maturity.
Table 1
Investment Payoffs and Issuer's Cost and Benefit

Dimensional Fund Advisors4
Although reverse convertibles might be categorized as fixed income products, investors must be aware of the downside risk exposure and avoid being lulled into a false sense of security. Investors who file arbitration complaints regarding structured fixed income products often contend that the broker did not provide enough information to make them aware of the downside risks. However, investors who know that there is no free lunch and no magic will intuitively understand that a fixed income product that pays higher yields and offers an additional upside potential must carry some form of downside risk. An issuer does not offer more benefit without getting something in return.
Another example is a capped capital protected product, which guarantees principal protection. Investors can also capture some upside potential, although to a lesser degree than the upside potential of the underlying security. In return for receiving downside protection, investors have to give up returns above a certain level, known as the “cap.” Figure 2 shows typical profits and losses from an investment in capped capital protected products on the maturity date as a function of the underlying asset value. Investors should recognize that in return for downside protection, they are giving up part of the return of the underlying securities, as well as the potential returns above a cap.
Investment banks continue to invent new structured products with complex payoff structures. ESIPA nicely summarizes various types of payoff structures in its “Derivative Map.”5 It is essential to understand that the payoff structures of these
5. http://www.eusipa.org/images/grafiken/Ansicht_european_map_140809.pdf.
-1,000
-800
-600
-400
-200
0
200
400
140 120 100 80 60 40 20
Prof
it/Lo
ss ($
)
Stock Price at Maturity
Reverse Convertible
Profits Profits from Stock Profits from Bond
Figure 1
Profits and Losses from Reverse Convertibles on the Maturity Date

Structured Products 5
products can be replicated by forming portfolios composed of underlying securities and derivative securities written on them. The packaging of various instruments is not likely to provide any value added to investors unless they need specific payoffs delivered by each structured product. Rather, the packaging will probably result in higher costs and additional liquidity risks. In the next section, we show how an investor can replicate the payoff structure of one structured product issued by JPMorgan Chase.
Replicating Structured Payoffs in a Portfolio
On May 20, 2009, JPMorgan Chase filed a term sheet with the Securities and Exchange Commission (SEC) for the “Buffered Return Enhanced Notes Linked to iShares® MSCI Emerging Markets Index Fund” (the notes), which mature on June 25, 2010.6 According to the document, the commission/fee of this note is 1.25%, and the notes will pay 1.5 times the price return (not including dividend income) of the iShares® MSCI Emerging Markets Index Fund (the fund), an exchange-traded fund (ETF) traded on the NYSE. The notes will pay this specified return between the issuing date and June 22, 2010 if the return is positive, with a maximum total return of 25.85%. If the fund earns a negative return up to -10%, the notes will pay the principal amount
6. http://www.sec.gov/Archives/edgar/data/19617/000089109209002082/0000891092-09-002082-index.htm
0
CapUn
derly
ing
Stock Price at Maturity
Prof
it/Lo
ss ($
)
Figure 2
Profits and Losses from Capped Capital Protected Products on the Maturity Date
Dimensional Fund Advisors6
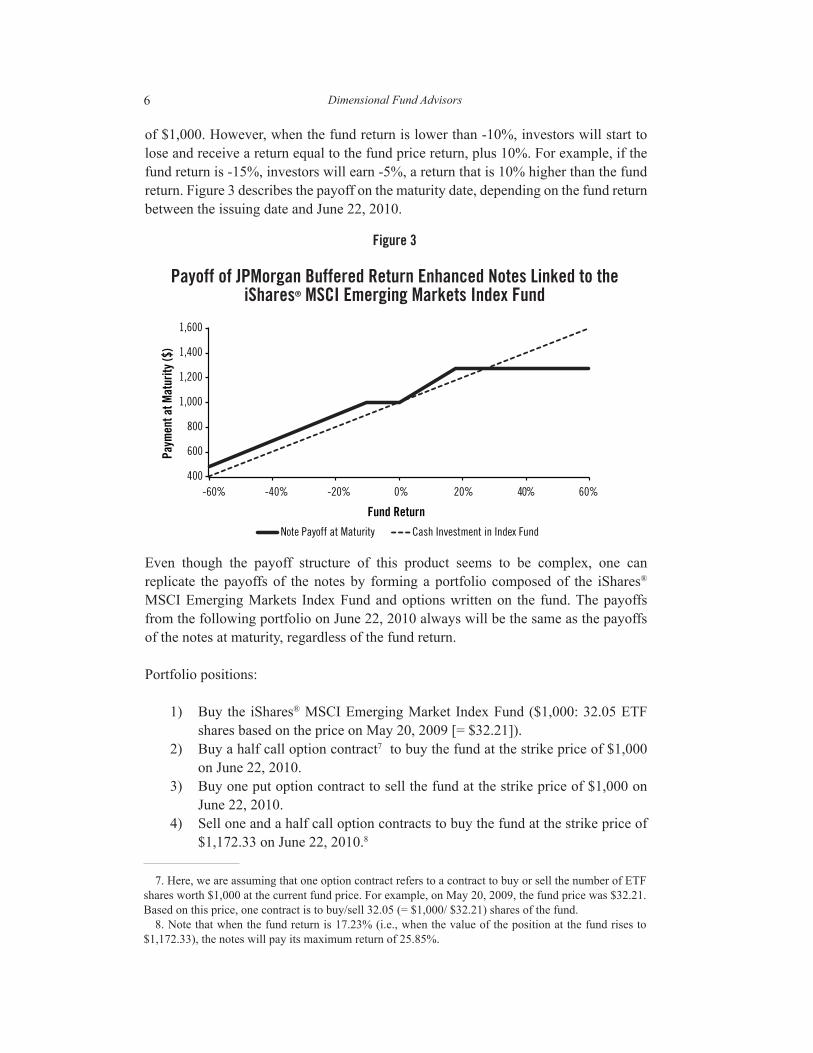
of $1,000. However, when the fund return is lower than -10%, investors will start to lose and receive a return equal to the fund price return, plus 10%. For example, if the fund return is -15%, investors will earn -5%, a return that is 10% higher than the fund return. Figure 3 describes the payoff on the maturity date, depending on the fund return between the issuing date and June 22, 2010.
Even though the payoff structure of this product seems to be complex, one can replicate the payoffs of the notes by forming a portfolio composed of the iShares® MSCI Emerging Markets Index Fund and options written on the fund. The payoffs from the following portfolio on June 22, 2010 always will be the same as the payoffs of the notes at maturity, regardless of the fund return.
Portfolio positions:
1) Buy the iShares® MSCI Emerging Market Index Fund ($1,000: 32.05 ETF shares based on the price on May 20, 2009 [= $32.21]).
2) Buy a half call option contract7 to buy the fund at the strike price of $1,000 on June 22, 2010.
3) Buy one put option contract to sell the fund at the strike price of $1,000 on June 22, 2010.
4) Sell one and a half call option contracts to buy the fund at the strike price of $1,172.33 on June 22, 2010.8
400
600
800
1,000
1,200
1,400
1,600
60% 40% 20% 0% -20% -40% -60%
Paym
ent a
t Mat
urity
($)
Fund Return
Note Payoff at Maturity Cash Investment in Index Fund
7. Here, we are assuming that one option contract refers to a contract to buy or sell the number of ETF shares worth $1,000 at the current fund price. For example, on May 20, 2009, the fund price was $32.21. Based on this price, one contract is to buy/sell 32.05 (= $1,000/ $32.21) shares of the fund. 8. Note that when the fund return is 17.23% (i.e., when the value of the position at the fund rises to $1,172.33), the notes will pay its maximum return of 25.85%.
Figure 3
Payoff of JPMorgan Buffered Return Enhanced Notes Linked to the iShares® MSCI Emerging Markets Index Fund

Structured Products 7
5) Sell one put option contract to sell the fund at the strike price of $900 on June 22, 2010.
Note that the first two positions will provide investors with returns that are 1.5 times the fund return when the fund return is positive. The third position will provide full protection against the downside risk of the first position. The fourth position will enable investors to save costs of forming this portfolio since investors will receive prices of options (called option premiums) when they sell option contracts, but will take away any returns above the maximum level of 25.85%. The last position will lower costs of forming the portfolio but will expose investors to downside risks when the fund return is lower than -10%. Table 2 shows the payoff of each position, together with the total payoff of the portfolio at maturity, depending on the value of the iShares® MSCI Emerging Market Index Fund purchased for $1,000 on May 20, 2009.
Figure 4 shows the payoffs of the notes (indicated by the bold line) and the replicating portfolio (indicated by a nonvisible line beneath the target payoff line) on the maturity date, based on the value of the first position in the fund on the maturity date and payoffs of the options used to form the replicating portfolio. Since the payoffs of the replicating portfolio are always the same as the payoffs of the notes, investors may prefer this portfolio over the notes as long as the cost of forming it is less than $1,000, which is the price an investor has to pay to purchase the notes. Appendix A.2 details a cost estimate using the Black-Scholes option pricing model and discusses the difficulties of estimating some parameter values used in the pricing model and their impact on estimates.
The example shows that the payoff of virtually any structured product can be replicated by forming a portfolio. In fact, investment banks that offer structured products try to identify a way to replicate the payoff of their product and sell the product at a price greater than the cost of forming the replicating portfolio. This is how they ensure profits from their structured product sales. As discussed in Appendix A.2, even when
Share Price at Maturity (ST)
ST ≥ $1,172.33 $1,172.33 > ST ≥ $1,000
$1,000 > ST ≥ $900
ST < $900
1) Underlying ST ST ST ST
2) Long 0.5 Call 0.5 × (ST – $1,000) 0.5 × (ST – $1,000) $0 $0
3) Long 1.0 Put $0 $0 $1,000 – ST $1,000 – ST
4) Short 1.5 Call -1.5 × (ST – $1,172.33) $0 $0 $0
5) Short 1.0 Put $0 $0 $0 -($900 – ST)
Total $1,258.50 1.5 × ST – $500 $1,000 ST + $10
*Depending on the value of the iShares® MSCI Emerging Market Index Fund purchased for $1,000 on May 20, 2009. Note: ST stands for the value of the iShares® MSCI Emerging Market Index Fund on June 22, 2010, which was purchased for $1,000 on May 20, 2009.
Table 2
Payoff of Replicating Portfolio on June 22, 2010*

1) Underlying Stock Purchased at $1,0002) Call 1 = 0.5 (K = $1,000)3) Put 1 = 1 (K = $1,000)4) Call 2 = -1.5 (K = $1,172.33)5) Put 2 = -1 (K = $900)
Dimensional Fund Advisors8
9. As of May 20, 2009, the average yield spread between short-term JPMorgan Chase bonds and Treasury notes was around 170 basis points.
0
200
400
600
800
1,000
1,200
1,400
1,600
1,500 1,400 1,300 1,200 1,100 1,000 900 800 700 600 500
Payoff of Replicating Portfolio Call 1 = 0.5 (K=$1000) & Put 1 = 1 (K=$1000)
Call 2 = -1.5 (K=$1172.33) & Put 2 = -1 (K=$900) Stock Purchased at $1000
Value of the iShares® MSCI EM Index Fund Value on June 22, 2010Purchased for $1,000 on May 9, 2009
Underlying Payoff Put 1 Payoff Call 1 Payoff
Put 2 Payoff Call 2 Payoff Target and Portfolio Payoff
Payment at M
aturity ($)
Figure 4
Payoffs of JPMorgan Buffered Return Enhanced Notes Linked to the iShares® MSCI Emerging Markets Index Fund and the Replicating Portfolio
Replicating Portfolio Components
simple derivatives are used (i.e., plain European options), the structured product can have different cost estimates. Therefore, when more complex forms of derivative securities are involved in the replication, estimating costs can be even more of a challenge, and the estimated prices can vary more widely, depending on the model and the parameter values used in the estimation. As will be discussed in more detail later, issuers have incentives to increase the complexity of these products to make pricing analysis, and thus, estimation of their profits, more difficult. Appendix A.3 reviews some academic studies to help readers better understand how investment banks price their products at issuance.
Perhaps a more interesting question is who should buy this replicating portfolio or structured product. An investor who has taken an active view on the future value of the index may want the unusual payoff structure. If he/she thinks the index will not appreciate more than 17.23% (in this case, the note will pay the maximum of 25.85%) and is willing to take the credit risk of JPMorgan Chase,9 then he/she may want to protect against downside risks since the cost of protection (i.e., giving up an upside potential above 25.85%) is close to zero according to his/her active view. Of course, he/she will not regret this choice only if the bet pays off.

Structured Products 9
Investor Needs and Product Suitability Certain structured products are designed to meet very specific investor needs. Keep in mind that the issuing company applies its expertise in product design, not in management of the assets. After issuance, the performance of the underlying asset and creditworthiness of the issuer are what matter. Therefore, structured products are passive investment vehicles in nature. Depending on the needs of an investor, a certain type of structured product may or may not be suitable as an investment choice.
Structured products can be useful to investors who want a particular payoff at a certain time in the future, depending on the performance of the underlying assets. For example, let’s consider an investor who currently holds restricted company stock that will be vested in one year. The stock value represents a significant portion of her total wealth, and although she wants to diversify, she cannot sell her stock yet. She may find benefit in a structured product that provides protection against the downside risk of her company’s stock (even though this might mean giving up the upside potential of the stock), and at the same time, provides exposure to an equity index, such as the S&P 500.10
Structured products have long been associated with principal protection, a feature that everyone would love to have. For investors with long investment horizons, however, structured products may not be so ideal. Let’s assume that this type of investor wants to put $1 million in an equity index but is afraid of downside risk. He uses put options written on the same index to protect against downside risks. Although he does not know when he will need the money, he wants to make sure that at least $1 million will always be available.11 Therefore, he buys one-year put options now and will buy new options as the existing ones expire. He invests $1 million in the index and spends an additional $10,000 to buy put options that will provide rights to sell the index for $1 million in one year.12 Two outcomes are possible at the end of the first year. First, if the index return is higher than 1%, the investor can roll over enough put options to fully protect his investment during the following year since he will be able to invest at least $1 million in the index after spending $10,000 for put options.13 However, if the index return is less than 1%, he will not have enough cash to purchase additional put options to fully protect the $1 million investment.
10. One example is a structured product that combines a collar written on her company’s stock and an S&P 500 index investment. A collar is an option strategy that buys a put option and sells a call option written on the same underlying security with different strike prices. As shown in Appendix A.1, the payoff of this strategy is similar to the payoff from a short position in the underlying security. 11. For simplicity, it is assumed that the need to spend $1 million may occur only at the end of each year. 12. When a risk free rate is 3.5%, time to maturity is one year and standard deviation of the underlying stock is 30%, the price of a put option that provides holders the right to sell the underlying stock at the current value of $1 million is about $100,000, according to the Black-Scholes option pricing model. We use a smaller cost just to emphasize that the dynamics of principal protection with put options do not work in the way many investors think they do. 13. For simplicity, it is assumed that parameters do not change, and therefore, put option prices remain at the same level in the future.

Dimensional Fund Advisors10
For example, if the index return is 0.5%, then the value of his index position will be $1,005,000, and put options will expire with zero payoffs. Therefore, unless he reduces his investment in the index below $1 million, he cannot purchase enough put options to fully protect against the risk of having less than $1 million in one year. When the index return is negative, the options preserve his $1 million investment (e.g., if the value of the index position decreases to $800,000, then the payoff from put options will be $200,000 [$1 million – $800,000], and his total wealth will be $1 million), but he will not have excess cash to buy put options for the next year. In this case, the only way to make sure he has at least $1 million at the end of each following year is to buy safe assets such as Treasuries, and forfeit the upside potential of the index investment. Even though he has a long investment horizon, he has to leave equities after one year. This simple example shows that a dynamic downside protection plan may not work effectively without a target date. If the investor has a time frame for protection, such as twenty years, and a twenty-year put option is available for him to purchase (albeit at a much higher cost) he can capture the upside potential of index investments over the next twenty years without taking any downside risk at the maturity. Since simple capital protected structured products that guard against downside risks are basically a package of an underlying asset and a put option written on the underlying asset, similar problems can exist when investors implement a hedging strategy using a structured product with maturities shorter than their investment horizon.14 Even if there is a structured product with desired maturities and payoff structures, investors might be better off by purchasing a zero-coupon Treasury bond together with call options, or taking alternative equity exposures specific to the desired payoff, especially in light of the high fees associated with structured products.
What Investors Should Know
Before investing in a structured product, investors should understand the payoff structure and consider how it may help them achieve their investment goals. Compared to directly investing in the underlying stock, there may be some advantages to investing in structured products. These may include higher returns or coupons. But investors should remember that the tradeoff requires them to give up something, such as upside potential above a cap, or accept lower returns. Therefore, unless an investor wants the payoff structure for a special reason, such as to offset pre-existing risk exposure to underlying securities, a structured product investment may not be the best option.
14. Most structured products have shorter maturities around one to three years, and the longest maturity structured products are typically the ones with around six years of time to maturity. By giving up upside potential above a certain level and being willing to take lower returns than the return of underlying security when returns are positive, investors can lower hedging costs and reduce potential problems described in the example. However, it is important to recognize that in return for lower hedging costs, investors are giving up something. This is similar to automobile insurance coverage decisions where you can lower your insurance premium by lowering the maximum liabilities coverage or increasing deductibles.

Structured Products 11
There is neither a free lunch nor the magic of earning higher returns by investing in a security with complex payoff structures.
As shown earlier, the payoff structures of almost all structured products can be replicated by forming a portfolio of the underlying security and derivative securities written on it. Therefore, even though it might be impossible for retail investors to estimate the cost of forming the replicating portfolio, it is always a good idea for them to ask a financial expert about the cost effectiveness of using structured products versus replicating portfolios, and to consider simpler and perhaps more effective ways to achieve their investment goals.
Structured products are typically issued by investment banks, and not by the issuers of the underlying securities. So, in many cases, investors face the full credit risk of the bank since there may not be segregated assets used as collateral for structured products. Therefore, it is important to check the creditworthiness and risk exposure of issuing investment banks. The recent global financial crisis demonstrated that excessive risk-taking in the investment banking arm of a financial institution can force the entire company into distress. Investors who purchased structured products issued by Lehman Brothers, which sold at least $900 million worth of structured products in 2008, experienced a large loss and became creditors when the company filed for bankruptcy in September 2008.15 Therefore, investors should check the risk exposures and creditworthiness of the issuing investment bank before purchasing its structured product.
Lack of liquidity is yet another risk to consider. Even though many structured products are listed and traded in organized exchanges, the liquidity is typically low. Investors who must close a position before the maturity date are likely to lose significant amounts as they struggle to raise cash. This risk should be even larger for products not listed on the exchanges.
It is also important to check tax consequences. There are some instruments that may be appealing under the current tax rule. But, often, tax consequences differ according to the investment situation (e.g., whether one buys at the issuance or in the secondary market), and therefore, it is a good idea to discuss the tax implications with tax experts before making a decision.
Finally, consider that an investment bank’s incentives may influence its product structure. In a recent academic paper, Carlin (2009) shows that investment banks are motivated to make products more complex to preserve their market power and to charge a higher markup. Even though the paper derives the results in a theoretical model framework, it is not hard to intuitively understand the incentives. Naïve investors often think that securities with complex payoff structures may provide higher
15. Larry Light, Wall Street Journal, “Twice Shy on Structured Products?” May 28, 2009.

Dimensional Fund Advisors12
risk-adjusted returns. But as discussed earlier, complexity does not necessarily mean higher returns. Instead, it is more likely to mean lower expected returns since investors probably will pay more than they should.
Moreover, investment banks sometimes offer structured products to eliminate risks taken in other parts of their business, such as proprietary desks or other investment banking ventures. Therefore, as emphasized earlier, unless an investor has a good reason to prefer the payoff structure provided by a structured product, it may not be a right choice for him/her to invest in these products, especially those with complex payoff structures that are hard to digest.
Conclusion
As investment banks introduce more products with complex structures, investors may have an expanding list of alternatives to consider. However, having a greater number of alternatives may not result in better investment decisions. In fact, this complexity can make analysis even more challenging for investors and possibly lead to a wrong decision. Without access to qualified technical guidance, investors are at risk of making a purchasing decision without sufficient knowledge of the product’s purpose or their own suitability.
We have attempted to explain the general design of structured products and to explore the potential benefits, setbacks, and risks in using these products. The following points summarize this analysis:
• Many structured products have complex designs that are hard to evaluate in terms of pricing, risk exposure, and potential outcome. Investors should not equate complexity with higher expected returns or other enhanced features.
• The payoff of virtually any structured product can be replicated by forming a portfolio that is composed of underlying securities and derivatives written on those securities. Investment banks that offer structured products will try to create replicating portfolios, at lower costs than prices received from investors, as a way to ensure that the sale of the products provide a sure profit to them. There is no magic behind complex securities.
• An investment bank’s own objectives, rather than client demands, may influence product design. For example, the firm may offer the products in a broader strategy to diversify risks from other lines of business. A firm also may design more sophisticated products to earn a higher markup or protect its market positions.
• Structured products may be helpful for an investor who wants a specifically defined payoff at a certain point in the future. Conversely, investors lacking well-defined objectives and a specific time frame may not find the vehicles useful.

Structured Products 13
• In return for receiving a pre-set payoff structure, investors must accept a tradeoff in the form of a lower return and/or limited upside potential. There is no free lunch. They are also likely to pay higher fees charged by the issuing institution.
• Structured products are issued by investment banks, and therefore, investors are exposed to the credit risk of issuing firms.
• Investors are also exposed to liquidity risk. Although many structured products are
listed and traded on exchanges, their liquidity is typically low. Of course, unlisted products are exposed to far greater liquidity risk.
• Investors should also evaluate the potential tax consequences of the product since tax treatment may vary according to the nature of the structured products.
Simply put, structured products offer neither a free lunch nor magic solution to any investor’s future performance objective. Before buying one of these products, investors should make sure that they understand the payoff structure and have a compelling reason to pay possibly high costs to obtain the specific payoff structure provided by the structured product.
References
Bernard, Carole, Phelim Boyle and William Gornall. 2009. Locally-capped investment products and the retail investor. University of Waterloo working paper (January).
Carlin, Bruce. 2009. Strategic price complexity in retail financial markets. Journal of Financial Economics 91: 278-287.
Henderson, Brian and Neil Pearson. 2009. The dark side of financial innovation. University of Illinois working paper (February).

Dimensional Fund Advisors14
Appendix
A.1 A Brief Introduction to Options
As explained earlier, a call option provides option holders with rights (but not obligations) to buy the underlying security at a pre-specified price (a strike price) at or before a certain time in the future (a maturity date). Similarly, a put option provides option holders with rights to sell the underlying security at a strike price on or before the maturity date. American-style options can be exercised any time before or on the maturity date, whereas European-style options can be exercised only on the maturity date.
Since option holders do not have to exercise options, they will do so only when it is beneficial to them. Therefore, options are exercised only when the payoff from option exercises is positive, and this is why the payoff of an option at maturity cannot be negative and options are always valuable.
Let’s assume that there is a call (put) option written on a stock, the current price of which is $100. The option will mature in one year, and the strike price (K) is also $100. What will be the payoff of the option on the maturity day? The payoff will depend on the price of the stock on the maturity date. A call (put) option holder will exercise his/her option and buy (sell) the stock at the strike price only when the stock price on the maturity day is above (below) the strike price. Otherwise, the option will expire without being exercised. For example, if the stock price on the maturity day (St) is $150, a call option holder will be happy to exercise the option, buy the stock for $100, and take a $50 profit right away by selling the stock in the secondary market. However, a put option holder will not exercise the option since he/she can receive $50 more by selling the stock in the market, rather than selling it through the exercise of the put option. Likewise, if the stock price on the maturity day is $80, then a call option holder will not exercise his/her option, whereas a put option holder will be happy to exercise the option and take a $20 profit (if the put option holder does not own the stock, he/she can buy it at $80 in the secondary market and sell it for $100 by exercising the put option). Table A.1 shows the payoff of each option, depending on the underlying stock price on the maturity day of options.
ST > $100 = K(e.g., when ST = $150)
ST < $100 = K(e.g., when ST = $80)
CallST – $100
($150 – $100 = $50)$0
Put $0$100 – ST
($100 – $80 = $20)
Table A.1
Payoff of Options on the Maturity Day

Structured Products 15
Options can be purchased or sold by any investors. When an investor buys (sells) an option, he/she takes a long (short) position in the option. Different from the spot market where the underlying security is traded and where both buyers and sellers could make profits (or lose); in option markets, any profits made by an investor is taken from the pockets of other investors who took an opposite position. In other words, when an investor who bought the option exercises the option and takes profits, the money will be paid by the investor who sold the option to the profit-making investor. Therefore, the option market is called a “zero-sum” game market, because if we sum over prof-its and losses of all market participants, the sum always will be zero (similar to what happens in a poker game).
When an investor takes a long position in a call (put) option (the option buyer), he/she has to pay a price (premium). If the option expires unexercised, then the option buyer loses the amount paid for the option. The option buyer will make net profits only when the payoff on the maturity day is greater than the premium he/she paid. Exactly the opposite result applies to the investor who takes a short position in the call (put) option (the option writer). When the option writer sells the option, he/she receives the premium. On the maturity day, if options are not exercised, nothing will happen to the option writer and he/she will keep the premiums received, resulting in a net profit equal to the premiums. If options are exercised, however, the option writer has to pay the counterparty (the option buyer) out of his/her own pocket. Therefore, the option
Prof
it ($
)
-5
Terminal Stock Price
100
Long Call(K = $100 and Premium = $5)
5 Terminal
Stock Price100
Short Call(K = $100 and Premium = $5)
Prof
it ($
)
-7
Terminal Stock Price
70
Long Put(K = $70 and Premium = $7)
Prof
it ($
)
7 Terminal
Stock Price
70
Short Put(K = $70 and Premium = $7)
Prof
it ($
)
Figure A.1
Profits (net payoffs) of Various Option Positions on the Maturity Day

Dimensional Fund Advisors16
Options are used both by speculators, who are betting on the future direction of underlying stock price movements, and by hedgers, who are trying to reduce risks from the existing positions in underlying securities. For example, when an investor is currently investing in an index, he/she can eliminate the downside risk by purchasing a put option written on the same index (floors). Likewise, an investor who is currently holding a short position can eliminate the risk of losing when the index price increases by buying a call option written on the same index (caps). Figure A.2 shows the combined payoffs and profits of floors and caps. It is interesting to note that the combined payoff of floors is similar to the payoff of a long call, and the payoff of caps is similar to that of a long put.
Payo
ffPa
yoff
Payo
ffPr
ofit
Index at Expiration
A. Long Index
Index at Expiration
C. Combined Payoff
Index at Expiration
0
B. Long Put
Index at Expiration
D. Combined Profit
0 0
0
Figure A.2
Payoffs and Profits of Floor and Cap Positions Floors (long in underlying index and long in put)

Structured Products 17
One of the key variables that significantly affects the value of an option is the volatility of underlying securities. High volatility is good for option holders since large swings in underlying security prices suggest greater potential profits without increasing downside risks. As explained earlier, the worst-case scenario for option holders is “not exercising options on the maturity date.” Therefore, large swings in underlying security prices will not change the downside risk. On the other hand, the upside potential can significantly increase as underlying securities’ prices become very volatile. Therefore, both call and put option prices increase as volatilities of underlying securities increase. There are speculators who bet on the direction of volatilities and buy/sell options based on their evaluation of current volatilities in the market. For example, for those who think that current volatilities are too high (low) and expect volatilities to go down (increase) in the near future, selling (purchasing) options can be considered as an attractive strategy.
Investors can create different types of payoff structures by combining different option positions. Figure A.3 shows profits of various option strategies used by practitioners.
Payo
ffPa
yoff
Payo
ffPr
ofit
Index at Expiration
0
A. Short Index
Index at Expiration
0
C. Combined Payoff
0
B. Long Call
Index at Expiration
0
D. Combined Profit
Index at Expiration
Caps (short in underlying index and long in call)

Dimensional Fund Advisors18
Stock Price
Bull Spread
Stock Price
Collar
Stock Price
Butterfly
Stock Price
Straddle
Stock Price
Strangle
Stock Price
Ratio Spread
A.2 Cost Estimates of the Replicating Portfolio of JPMorgan Chase Buffered Returns Enhanced Notes Linked to the iShares® MSCI Emerging Markets Index Fund
To estimate the cost of forming the replicating portfolio, one has to estimate prices of options used in the portfolio. Options written on the iShares® MSCI Emerging Markets Index Fund are traded on the Chicago Board Options Exchange (CBOE).16 Therefore, as far as options with desired strike prices and maturities are available to trade at the CBOE, one can easily estimate the cost. Unfortunately, however, options with maturities longer than one year are not actively traded, and options that mature on June 22, 2010 do not exist at the CBOE (options written on ETFs mature on the Saturday following the third Friday of a maturing month). In addition, options on ETFs traded at the CBOE are American-style options that can be exercised at any time before and on the maturity date, whereas options used in the replicating portfolio are European-style options that can be exercised only on the maturity date.
Therefore, cost estimates of forming the replicating portfolio are not readily available. One has to theoretically estimate the prices of various options used in the portfolio.
16. Current price information is available at the CBOE web site: http://www.cboe.com/DelayedQuote/QuoteTable.aspx?TICKER=EEM&ALL=2.
Figure A.3
Profits of Various Option Strategies

Structured Products 19
For simple European-style options used in the portfolio, one can use the Black-Scholes option pricing model to estimate prices.17 Based on that model, the cost of forming the replicating portfolio is estimated to be $979.74, before commissions. Therefore, if commissions do not exceed $20.26 ($1,000 – $979.74), investors will be better off by forming the replicating portfolio.
There are a few caveats to keep in mind, though. The cost estimation depends on the parameter values used to estimate option prices. One of the key input variables used is the standard deviation of the fund return. The estimation used is 38.82%, the implied volatility of the fund return calculated by Bloomberg on May 20, 2009. As will be discussed later, the cost estimation can significantly change under different volatility assumptions. Second, it is very likely that a retail investor will have a hard time finding counterparties who are willing to trade those options used in the replicating portfolio against him/her. However, for institutional investors, it may not be that difficult to engage in such transactions in the OTC market at prices that are not that different from theoretical option prices.18
The estimate of $979.74, is based on the following parameter values used to calculate option values: 1) current fund price (S0) = $1,000; 2) risk-free rate (rf) = 0.44 % (which is the 52-week Treasury bill rate on May 20, 2009); 3) standard deviation of the fund return (σ) = 38.82% (which is the implied volatility of the fund return on May 20, 2009 from Bloomberg); 4) dividend yield = 0; and 5) time to maturity (T) = 13 months (from May 20, 2009 through June 22, 2010).
There are a couple of issues to note regarding parameter values used. First of all, even though the dividend yield was assumed to be zero, it is not correct. The ETF actually pays dividends, and therefore, the dividend yield is positive. When the underlying asset pays dividends, call options are less valuable to call option holders since underlying stock prices decline as firms pay dividends that call option holders are not entitled to receive before exercising the options. On the other hand, put options become more valuable since put option holders can sell those stocks, which are worth less after dividend payments, for the same strike price. In addition, since the replicating portfolio has a long position in the ETF, any dividends paid to the ETF holders will increase the value of the replicating portfolio. Here, a zero-dividend yield is used for simplicity.
Current fund price, risk-free rate, strike price, and time to maturity are relatively straightforward to estimate. However, the estimation of standard deviation of the fund
17. To use this pricing model, we have to know five parameter values used in the model: current underlying security price, strike price of an option, risk-free rate, time to maturity, and standard deviation of the underlying security return. 18. The beauty of theoretical derivative prices is that actual prices cannot be very different from theoretical option prices. If actual prices are quite different from theoretical option prices, there will be opportunities to make arbitrage profits, meaning guaranteed profits without any uncertainties.

Dimensional Fund Advisors20
return is not so straightforward. When we estimate the standard deviation of a random variable, we can use the past realized values of the random variable. In this case, we can use the realized returns of the fund and calculate the standard deviation. However, depending on the time period used to estimate standard deviations, we can have very different estimates. For example, given the high volatilities experienced in 2008 and early 2009, including or excluding this period from the calculation will render very different estimates of volatilities.
Due to the difficulty of estimating standard deviations, many use implied volatilities from option markets as their estimates. Implied volatilities are volatilities that make the market price equal to the model price, and therefore, they are interpreted as the market consensus estimate of volatilities.19 This is why we use the implied volatility in the example. However, given difficulties of volatility estimation, there is always room for dispute. For example, if one uses past sixty-day daily returns to estimate the volatility, the volatility estimate will be 51.19% on May 20, 2009. If we use this number, the cost estimate changes to $931.92 from $979.74. On the other hand, if one uses a longer period covering the pre-financial crisis period, volatility estimates can be much lower and the cost estimate can significantly increase. For example, if we use 26%,20 then the cost estimate will increase to $1,024.48.
Putting the difficulties of estimating the cost of forming the replicating portfolio aside, one can try to estimate total fees/expenses of purchasing a structured product. For the enhanced notes, the explicit fee explained in the term sheet is 1.25%. However, there is at least one item that can be considered as an additional fee in the example. The difference between the after-fee proceeds and the cost of forming the replicating portfolio can be considered as an additional fee component. In the example, investors pay $1,000, and JPMorgan Chase will have $987.50 to invest after charging the explicit fee of $12.50. If JPMorgan Chase forms the replicating portfolio as suggested earlier, it will not have any risks involved with making payments to investors on the maturity date of the notes as long as there are no counterparty risks from option transactions.
Assuming that the cost estimate of $979.74 is a reasonable approximation of actual costs to JPMorgan Chase, the firm will have $7.80 of leftover proceeds. Given that the cost estimation does not include any brokerage fees to be paid in forming the
19. In reality, however, implied volatilities of options written on the same stock can vary depending on models being used and across options with different strike prices and maturities. 20. Annualized standard deviation (s.d.) based on monthly returns of the iShares® MSCI Emerging Markets Index Fund during May 2003 and April 2009 is 25.9%, whereas annualized standard deviation based on daily returns of the fund is 38.15%. Here, a standard deviation of monthly (daily) returns is annualized by multiplying the square root of 12 (252), assuming zero autocorrelation. This example shows that, in addition to the time period, depending on whether monthly or daily returns are used for annualized standard deviation estimation, the estimates can be quite different due to the autocorrelation of daily returns.

Structured Products 21
replicating portfolio, these leftover proceeds might cover those expenses. In any event, this can be considered additional cost to investors. Therefore, total expenses to investors of the notes are the sum of $12.50 (explicit fee) and the leftover proceeds ($7.80). Total expense is $20.30 per $1,000 investments, and the total percentage expense to investors of the notes is 2.03%, not 1.25%. Of course, this estimation is subject to errors, depending on the validity of parameter values used to estimate option prices. This example shows that actual costs can be different from the explicit fee in the term sheet of a structured product.
A.3 Average Differences in Issuing Prices and Model Prices of Structured Products
As discussed earlier, it is not a straightforward task to estimate the cost of forming a replicating portfolio of a structured product. There are many academic papers that estimate theoretical prices of structured products and compare them with actual issuing prices of those products. Often, the theoretical models used to price those structured products are very complicated. However, the idea behind many theoretical pricing models is simple. As explained earlier, if one can identify a way to replicate the payoff of a structured product, the theoretical price of the structured product will be the same as the cost of forming the replicating portfolio. Otherwise, there would be an arbitrage opportunity to earn sure profits without any uncertainty. Therefore, depending on the types of derivative securities involved, the complexity of the theoretical pricing models will vary.
Henderson and Pearson (2009) document that, on average, sixty-four Stock Participation Accreting Redemption Quarterly-Pay Securities (SPARQS) issued by Morgan Stanley between June 2001 and December 2005 were more than 8% overpriced at the time of issue. In other words, prices paid by investors were on average 8% higher than the costs of forming replicating portfolios. Table 4 in Henderson and Pearson (2009) reports model prices and issue prices of sixty-four SPARQS analyzed in the paper. Premiums of issue prices over model prices range from 0.62% to 23.49%, with the simple average of 8.77%. If model prices estimated in the paper accurately represent actual costs of forming replicating portfolios, the results will suggest that, on average, investment banks take more than 8% fees from investors. As discussed earlier, however, one should be careful in interpreting the results, as model prices are subject to change, depending on the model and parameter estimates used.
In a separate paper, Bernard, Boyle, and Gornall (2009) analyze prices of twenty-nine locally capped investment structured products listed on the AMEX as of April 25, 2008. Here, locally capped investment products refer to those structured products that have pre-set maximum returns (cap) for each periodic payment. These products typically have global floors (i.e., minimum return) applied to the entire life of the con-tract. They conclude that retail investors pay an average of 6.5% above intrinsic values of those products, ignoring the credit risk of issuers.

Dimensional Fund Advisors22
Based on these empirical results, one would wonder why investors are willing to overpay for those structured products. Since many retail investors buy them without understanding how to estimate fair values, it is possible that at least some investors end up paying more than fair value for the securities. Moreover, investors who lack technical skills to understand the pricing model may look to financial experts for analysis and guidance, assuming that an expert can estimate fair values and provide unbiased advice. However, if even those financial experts cannot estimate fair values—or if they have incentives (e.g., higher commissions) to estimate fair values in a systematically biased way—then retail investors will likely pay more than they should for structured products. This is because issuing investment banks have incentives to overprice the securities.