structures and structure descriptions chapter 8 protein bioinformatics
Post on 21-Dec-2015
222 views
TRANSCRIPT

Structures and Structure Descriptions
Chapter 8 Protein Bioinformatics
Protein Classes
1.1. ActiveActive – Mobility and catalysis– soluble and globular in shape
2.2. PassivePassive – structural
3.3. MembraneMembrane – control import and export through membrane

Folding in Globular Proteins
• fold into compact units • 100-1000 nucleotides• Stable fold has minimum energy
– Native state
• Energy loss occurs when bonds are formed:– H-Bonds– disulfide bridges (cysteine)– metallic bonds w/ metal ions

Folding
Formation of H-bonds:• Hydrophilic amino acids are soluble,
hydrophobic are not• To maximize H-bonds, put hydrophilic on
the surface so the whole protein is soluble
• Causes the formation of the two dominant Secondary Structure Elements (SSEs):1. α-helix2. β-strand
Structural Comparison• Fine Level (residue)
– used for finding spatial similarities – active and binding sites
– helpful for determining function– done by specifying coordinates, distances,
or torsion angles
• Coarse Level (SSE)– used for comparing on the global level– helpful for classifying proteins into classes– done by describing SSEs using line
segments or as ellipsoids
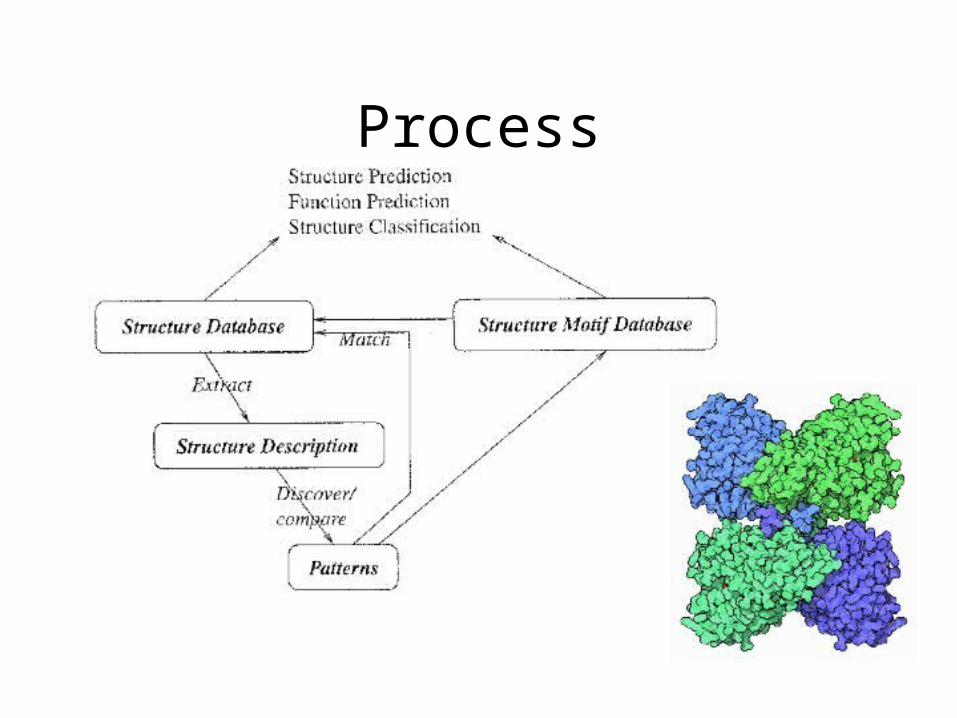
Process

Structure Description
• ArchitectureArchitecture - position of (or Geometry) elements
(atoms or residues)
• TopologyTopology - order of elements along the backbone
• PropertiesProperties - physio-chemical properties and types of SSEs

CoordinatesFrom NMR or X-Ray Crystallography
ATOM 1 N PRO A 2 31.242 3.064 39.284 1.00 39.90 N ATOM 2 CA PRO A 2 31.195 2.392 37.963 1.00 31.96 C ATOM 3 C PRO A 2 29.975 2.923 37.197 1.00 30.23 C ATOM 4 O PRO A 2 29.727 4.132 37.181 1.00 27.03 O ATOM 5 CB PRO A 2 31.063 0.905 38.251 1.00 36.57 C ATOM 6 CG PRO A 2 30.276 0.947 39.549 1.00 35.11 C ATOM 7 CD PRO A 2 30.829 2.121 40.343 1.00 42.06 C ATOM 8 N TYR A 3 29.189 2.020 36.613 1.00 22.83 N ATOM 9 CA TYR A 3 28.011 2.405 35.850 1.00 18.42 C ATOM 10 C TYR A 3 26.711 1.995 36.517 1.00 19.46 C ATOM 11 O TYR A 3 26.629 0.949 37.161 1.00 24.89 O ATOM 12 CB TYR A 3 28.055 1.772 34.459 1.00 17.73 C

Distance Matrices
• Distances can be stored with 3n-6 distances instead of 4n-10 coordinates.
• 2D representation of the 3D structure

Torsion Angles• Angles between two bonds
of each atom in the backbone are approx. equal
• Freedom comes in rotating around single bonds
(-70,-20), (-72,60), (-70,120), (-60,170), (-65, 125), (-100, 45), (-100, -65), (-105, -66), (-100, 60)

Line Segments (sticks)• Fit a line to the Catom of each residue
by least squares
Ellipsoids• Three inertial axes
long axis corresponds to stick representation

Helices
• α-helix 4-turn helix, min. 4 residues310-helix 3-turn helix, min. 3 residuesπ-helix 5-turn helix, min. 5 residues
• Formed by H-Bonds between residues in the same helix
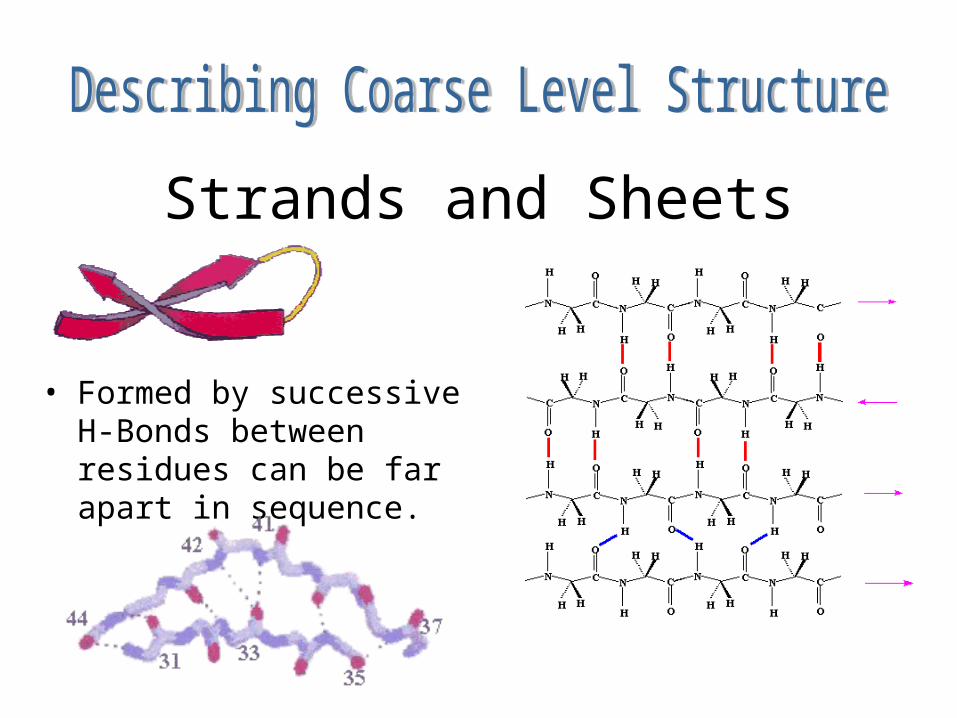
Strands and Sheets
• Formed by successive H-Bonds between residues can be far apart in sequence.

Cartoons for Secondary Structure Elements (SSE)
• Topology of Protein Structure (TOPS)– Triangular symbols represent beta strands– Circular symbols represent helices (alpha and 310)– The peptide chain is divided into a number of
fragments each labelled with an integer (i), beginning at Ni and ending at Ci+1.
– The first fragment is N1->C2 (or N->C).– Each fragment lies in only one structural domain. – Where the chain crosses between domains it leaves
the first at Ci and joins the next at Ni.– Each secondary structure element has a direction (N
to C) which is either "up" ( out of the plane of the diagram ) or "down" (into the plane of the diagram).
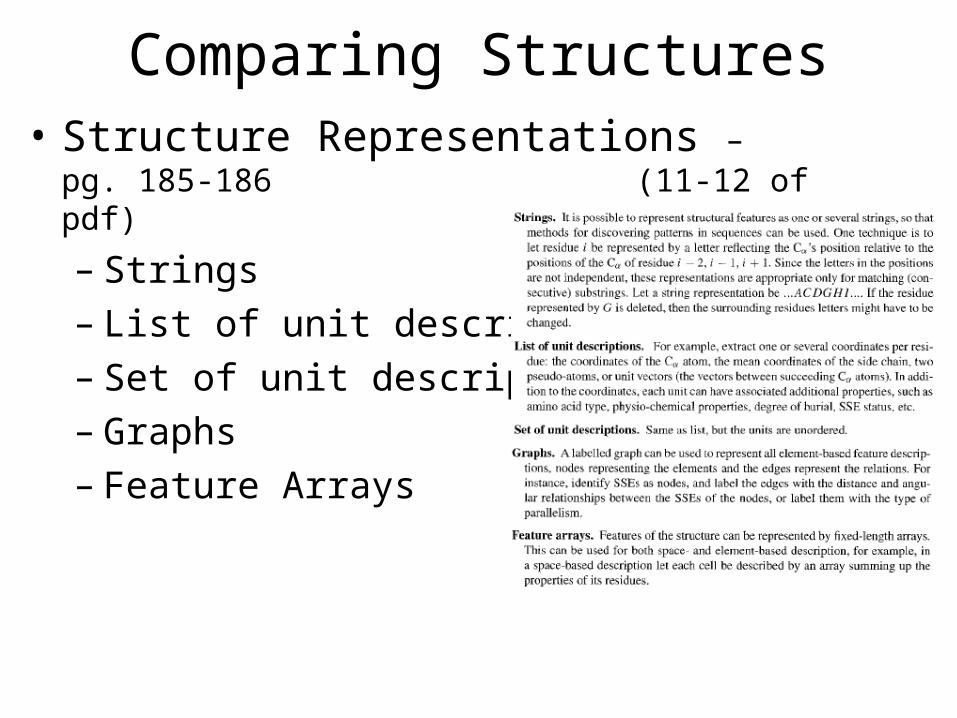
Comparing Structures• Structure Representations – pg. 185-186
(11-12 of pdf)
– Strings– List of unit descriptions– Set of unit descriptions– Graphs– Feature Arrays

Pairwise Comparison
• Finding equivalence or alignment giving highest score is NP-Complete


Example
• Alignment– ACSL-DRTS-IRV– A-TLREKSSLIR-
• Know first 5 residues– ACSL-D– A-TLRE

But not so with structures
Dyn
amic
Pro
gra
mm
ing
can
no
t b
e u
sed
dir
ectl
y fo
r st
ruct
ure
alig
nm
ent
highest score alignment of entire structures
highest score alignment of first five residues
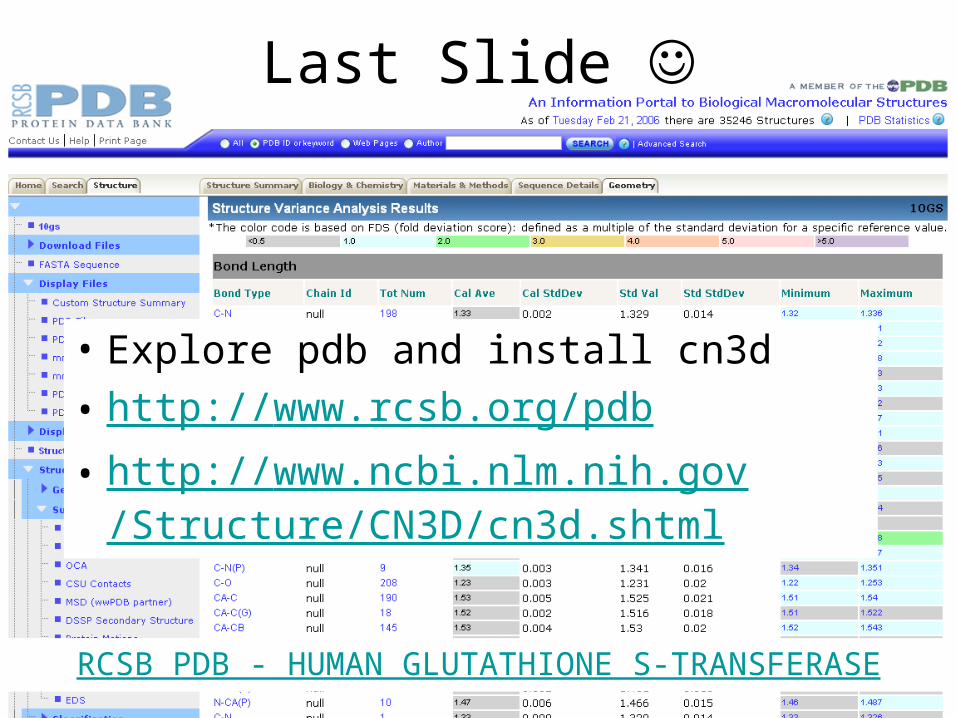
RCSB PDB - HUMAN GLUTATHIONE S-TRANSFERASE
Last Slide
• Explore pdb and install cn3d
• http://www.rcsb.org/pdb
• http://www.ncbi.nlm.nih.gov/Structure/CN3D/cn3d.shtml