struxureware™ power monitoring expert and …€¦ · the function of the extract, transform,...
TRANSCRIPT

StruxureWare™ Power Monitoring Expert and StruxureWare™ Building Operation
Integration Design Guide
7EN42-0112-01 07/2015


PME and SBO - Integration Design Guide Safety precautions
© 2015 Schneider Electric. All rights reserved. Page 1 of 53
Safety information
Important information Read these instructions carefully and look at the equipment to become familiar with the device before trying to install, operate, service or maintain it. The following special messages may appear throughout this manual or on the equipment to warn of potential hazards or to call attention to information that clarifies or simplifies a procedure.
The addition of either symbol to a “Danger” or “Warning” safety label indicates that an electrical hazard exists which will result in personal injury if the instructions are not followed.
This is the safety alert symbol. It is used to alert you to potential personal injury hazards. Obey all safety messages that follow this symbol to avoid possible injury or death.
DANGER DANGER indicates a hazardous situation which, if not avoided, will result in death or serious injury.
WARNING WARNING indicates a hazardous situation which, if not avoided, could result in death or serious injury.
CAUTION CAUTION indicates a hazardous situation which, if not avoided, could result in minor or moderate injury.
NOTICE NOTICE is used to address practices not related to physical injury.
Please note Electrical equipment should be installed, operated, serviced and maintained only by qualified personnel. No responsibility is assumed by Schneider Electric for any consequences arising out of the use of this material.
A qualified person is one who has skills and knowledge related to the construction, installation, and operation of electrical equipment and has received safety training to recognize and avoid the hazards involved.

Safety precautions PME and SBO - Integration Design Guide
Page 2 of 53 © 2015 Schneider Electric. All rights reserved.
Safety precautions During installation or use of this software, pay attention to all safety messages that occur in the software and that are included in the documentation. The following safety messages apply to this software in its entirety.
WARNING UNINTENDED EQUIPMENT OPERATION
• Do not use the software for critical control or protection applications where human or equipment safety relies on the operation of the control action.
• Do not use the software to control time-critical functions because communication delays can occur between when a control is initiated and when that action is applied.
• Do not use the software to control remote equipment without securing it with an authorized access level, and without including a status object to provide feedback about the status of the control operation.
Failure to follow these instructions can result in death or serious injury.
WARNING INACCURATE DATA RESULTS
• Do not incorrectly configure the software, as this can lead to inaccurate reports and/or data results
• Do not base your maintenance or service actions solely on messages and information displayed by the software.
• Do not rely solely on software messages and reports to determine if the system is functioning correctly or meeting all applicable standards and requirements.
• Consider the implications of unanticipated transmission delays or failures of communications links.
Failure to follow these instructions can result in death, serious injury, equipment damage, or permanent loss of data.

Safety precautions PME and SBO - Integration Design Guide
© 2015 Schneider Electric. All rights reserved. Page 3 of 53
NOTICE LOSS OF DATA
• Be sure to activate product and component licenses prior to the expiry of the trial license.
• Ensure that you activate sufficient licenses for the servers and devices in your system.
• Export the existing hierarchy template out of Power Monitoring Expert before importing a new template. The new template can overwrite the existing template, which can permanently remove all information contained in the original.
• Backup or archive any SQL Server database data before adjusting any database memory options.
• Only personnel with advanced knowledge of SQL Server databases should make database parameter changes.
Failure to follow these instructions can result in loss of data.
NOTICE UNAUTHORIZED OR UNINTENDED ACCESS TO CUSTOMER DATA
• Personnel setting up Power Monitoring Expert third-party authentication must be aware that links to data are not secure.
• Do not setup access links to sensitive or secure data.
Failure to follow these instructions can result in unauthorized or unintended access to sensitive or secure customer data.

Safety precautions PME and SBO - Integration Design Guide
Page 4 of 53 © 2015 Schneider Electric. All rights reserved.
Notices ION, ION Enterprise, Modbus, Modicon, Power Measurement, PowerLogic, Schneider Electric, StruxureWare, and System Manager are either trademarks or registered trademarks of Schneider Electric in France, the USA and other countries. All other trademarks are property of their respective owners.
This product must be installed, connected and used in compliance with prevailing standards and/or installation regulations. As standards, specifications and designs change from time to time, always ask for confirmation of the information given in this publication.
Schneider Electric 35 Rue Joseph Monier 92500 Rueil Malmaison – France www.schneider-electric.com

Table of Contents PME and SBO - Integration Design Guide
© 2015 Schneider Electric. All rights reserved. Page 5 of 53
Table of Contents Safety information .............................................................................................1
Important information .................................................................................................. 1 Please note................................................................................................................. 1
Safety precautions ...............................................................................................2
Notices ..............................................................................................................4 Table of Contents .................................................................................................5 Introduction ...........................................................................................................7
About This Document ........................................................................................7
References ........................................................................................................7 Integration Overview ............................................................................................8
Integration Components ....................................................................................8 StruxureWare Building Operation (SBO) .................................................................... 8 Power Monitoring Expert (PME) ................................................................................. 9 EcoStruxure Web Services (EWS) ............................................................................. 9 SmartWidgets ........................................................................................................... 10 Extract Transform Load (ETL) Tool .......................................................................... 10
Integration Architectures .................................................................................. 11
Real-time Data Flow ....................................................................................... 13 Alarms Data Flow ........................................................................................... 14
Historical Data Flow ....................................................................................... 14 Historical Data for Simple Trending in SBO .............................................................. 14 Historical Data for Dashboards and Reports ............................................................ 16
Guidance for Choosing an Architecture ......................................................... 18 Data Collection ......................................................................................................... 18 User Experience ....................................................................................................... 22 Commissioning Time ................................................................................................ 25 IT Considerations ..................................................................................................... 25
Software Compatibility...................................................................................... 26 SBO and PME .......................................................................................................... 26 Windows Operating Systems.................................................................................... 26 SQL Server ............................................................................................................... 27 PME in SBO WebStation .......................................................................................... 27 SBO Report Server ................................................................................................... 27
Port Settings ................................................................................................... 27 IT Infrastructure ................................................................................................. 29

Table of Contents PME and SBO - Integration Design Guide
Page 6 of 53 © 2015 Schneider Electric. All rights reserved.
Server Specification ....................................................................................... 29 Adjustment for Different Architectures ...................................................................... 30
Hard Drive Considerations ............................................................................. 31 Hard Drive Space for Software Components ............................................................ 31
Database Considerations ............................................................................... 32 System Communication Design ...................................................................... 33
Architecture 1 ................................................................................................. 33 Field-level Communication ....................................................................................... 33 Logging Data in SBO ................................................................................................ 33 ETL Jobs .................................................................................................................. 34
Architecture 2 ................................................................................................. 35 Real-time Communication ........................................................................................ 35 Alarm Communication .............................................................................................. 41
Commissioning Time Estimates ...................................................................... 45
Prerequisites .................................................................................................. 45 System Prerequisites ................................................................................................ 45 Competencies ........................................................................................................... 45
Validated Commissioning Time ...................................................................... 45 Architecture 1 ........................................................................................................... 46 Architecture 2 ........................................................................................................... 47
Estimating Guidelines..................................................................................... 48 Appendix ............................................................................................................ 50
Appendix A: Integration Testing Systems ...................................................... 50 25-device System ..................................................................................................... 50 50- and 100-device System ...................................................................................... 52

Introduction PME and SBO - Integration Design Guide
© 2015 Schneider Electric. All rights reserved. Page 7 of 53
Introduction This guide is intended to provide guidelines for application engineers, third-party integrators, or other qualified personnel for designing and quoting of the integration of StruxureWare™ Power Monitoring Expert and StruxureWare™ Building Operation from a technical perspective.
About This Document This document includes the following content:
References • SmartStruxure™ Architecture Guidelines • StruxureWare Power Monitoring Expert Installation Guide • StruxureWare Power Monitoring Expert System Design Guide • StruxureWare Building Operation System Reference Guide • StruxureWare Building Operation Technical Reference Guide • StruxureWare Building Operation Information Technology System Planning
Guide • StruxureWare Building Operation Connector Integration and Configuration
Guide • TVDA: How to Deploy Power Manager for SmartStruxure™ Solution in a Day • TVDA: StruxureWare Power Monitoring Expert with SmartStruxure solution –
Using EcoStruxure Web Services to integrate Power Monitoring Expert with SmartStruxure solution
• TVDA: Power Monitoring with SmartStruxure solution – Using SmartWidgets to integrate power meters with SmartStruxure solution
• TVDA: EcoStruxure Web Services 1.1 DataExchange Serve Performance with SmartStruxure solution
Topic Description
Integration Overview A description of the integration and the major components.
Solution Architecture An explanation of the two architectures (Architecture 1&2) based on real-time, alarm and historical data flow.
Guidance for Choosing an Architecture
Guidance and recommendations for choosing architecture at the design phase.
Software Compatibility Solution compatibility with SBO, Windows operating system, SQL server, etc.
IT Infrastructure IT architectures, server specifications, hard drive and database considerations.
System Communication Design
Communication design guidelines for each architecture of the solution.
Commissioning Time Estimates
Time evidence and estimates for commissioning tasks.

Integration Overview PME and SBO - Integration Design Guide
Page 8 of 53 © 2015 Schneider Electric. All rights reserved.
Integration Overview The integration of StruxureWare Building Operation (SBO) and StruxureWare Power Monitoring Expert (PME) enhances the SmartStruxure solution by providing power monitoring and energy accounting capabilities. The integration allows dashboards, reports, diagrams, alarms, and real-time data from PME to be used by SBO in a seamless user experience, in order to create a complete BEMS (Building and Energy Management System) solution.
StruxureWare™ Building Operation Connector (hereafter referred to as SBO Connector) is designed to fulfill the integration and to accelerate the deployment.
Integration Components StruxureWare Building Operation (SBO)
StruxureWare Building Operation is Schneider Electric’s premier next generation building management system (BMS) software that powers SmartStruxure™ solution. Providing integrated monitoring, control, and management of energy, lighting, HVAC, and fire safety, it turns system data at the automation level into valuable business information at the management level.
StruxureWare Building Operation combines new, state-of-the-art technology with robust functionality that leverages prior investments in our legacy BMS systems, including Andover Continuum™, TAC I/NET™, TAC Vista™, TAC I/A Series™, Satchwell Sigma™, Satchwell MicroNet™, and NETWORK 8000™. It is part of an EcoStruxure™ architecture that unites Schneider Electric’s expertise in power, IT room, process and machine, building control and security management to optimize energy efficiencies across multiple domains of a business.
StruxureWare Building Operation feature highlights include:
• Centralized system with distributed intelligence • State of the art graphics capability • Personalized workspaces • Simple alarms, events, and schedule configuration • Powerful reporting engine • Engineering efficiencies and mobile applications • Native support for BACnet, LON, Modbus, web services and EcoStruxure
Web Services

Integration Overview PME and SBO - Integration Design Guide
© 2015 Schneider Electric. All rights reserved. Page 9 of 53
• Online intelligent help community
Power Monitoring Expert (PME) StruxureWare™ Power Monitoring Expert is a complete, interoperable, and scalable supervisory software dedicated to power monitoring that enables you to maximize operational efficiency, optimize your power distribution system, and improve your bottom-line performance.
Real-time monitoring and alarming helps you to avoid critical conditions that can cause equipment failures and downtime. It also helps you to track consumption and the cost of power, gas, and other resources, and allocate costs by building, department, or process. Using this software, you can uncover energy waste, unused system capacity, and find new ways to extend equipment performance and life span. In addition, cutting edge flexibility allows you to extend your power management system at your own pace, and allows for an open system with the integration of third-party devices and systems saving thousands of engineering hours with ready-to-use device drivers views, and reports dedicated to power and energy management.
EcoStruxure Web Services (EWS) EWS is the Schneider Electric standard for sharing data among various StruxureWare software platforms to facilitate the creation of EcoStruxure solutions. EWS is based on conventional Web Services technology (SOAP, WSDL) and provides a way for solution architects and solution development teams to build solutions that require data to be shared among different StruxureWare software platforms.

Integration Overview PME and SBO - Integration Design Guide
Page 10 of 53 © 2015 Schneider Electric. All rights reserved.
SmartWidgets SmartWidgets are device driver packages for StruxureWare Buildings Operation software (SBO). SmartWidgets make it fast and easy for you to add devices like Power Meters to SBO software. They are easy to install and they provide Modbus register mappings for the common measurements for a given device type. They also provide SBO graphics components for consistent visualization and interaction with devices in SBO software.
Extract Transform Load (ETL) Tool The function of the Extract, Transform, Load (ETL) tool is to connect to the StruxureWare Building Operation EWS server on either Enterprise Server or Application Server, extract select historical data from trend logs, and insert the data into the PME database. This allows trend data from SBO to be available in the PME Dashboards and Reports.

Integration Architectures PME and SBO - Integration Design Guide
© 2015 Schneider Electric. All rights reserved. Page 11 of 53
Integration Architectures The integration supports the following architectures:
WARNING UNINTENDED EQUIPMENT OPERATION
• Do not use the software for critical control or protection applications where human or equipment safety relies on the operation of the control action.
• Do not use the software to control time-critical functions because communication delays can occur between when a control is initiated and when that action is applied.
• Do not use the software to control remote equipment without securing it with an authorized access level, and without including a status object to provide feedback about the status of the control operation.
Failure to follow these instructions can result in death or serious injury.
WARNING INACCURATE DATA RESULTS
• Do not incorrectly configure the software, as this can lead to inaccurate reports and/or data results.
• Do not base your maintenance or service actions solely on messages and information displayed by the software.
• Do not rely solely on software messages and reports to determine if the system is functioning correctly or meeting all applicable standards and requirements.
• Consider the implications of unanticipated transmission delays or failures of communications links.
Failure to follow these instructions can result in death, serious injury, equipment damage, or permanent loss of data.
Architecture 1 – Devices Connected to SBO • Power devices are connected to SBO (Automation Server or Enterprise
Server) • Logging of historical data is done by SBO (Automation Server or
Enterprise Server) • Historical data (Trend Logs) are transferred from SBO to the PME
Database by ETL • PME provides its Web Applications (e.g. Dashboards, Reports, Trends,
etc.) through its secured Web Server
Architecture 2 – Devices Connected to PME • Power devices are connected to PME • Logging of historical data is done by PME • Real-time data, alarm data, and historical data are exposed to SBO via
EWS

Integration Architectures PME and SBO - Integration Design Guide
Page 12 of 53 © 2015 Schneider Electric. All rights reserved.
• PME provides its Web Applications (e.g. Dashboards, Reports, Trends, etc.) through its secured Web Server
Note
These two architectures are not exclusive; they can be combined (used at the same time) in order to support the best possible functionality, performance, reliability and consistency of the system. In fact, many systems will combine both.
The following diagram represents the global view of the system combining both Architectures.
The following sections show how specific features are handled in Architecture 1 and 2.

Integration Architectures PME and SBO - Integration Design Guide
© 2015 Schneider Electric. All rights reserved. Page 13 of 53
Real-time Data Flow
Real-time data, whether being gathered by SBO or by PME, is available via the SBO user interface. This allows the use of the powerful SBO graphic engine as the main user interface.
Architecture 1 Data is gathered by SBO. The devices may be connected to an Automation Server or Enterprise Server.
Architecture 2 Data is gathered by PME and exposed to SBO using EWS. The EWS refresh rate is adjustable to meet specific system requirements.

Integration Architectures PME and SBO - Integration Design Guide
Page 14 of 53 © 2015 Schneider Electric. All rights reserved.
Alarms Data Flow In order to manage all relevant alarms, Alarms must be gathered in one common SBO database, whether they are triggered in SBO or PME. Alarms behave the same way as Real-time data. In Architecture 1, you must manually set alarms in SBO or use any existing alarms in the SmartWidget. In Architecture 2, EWS provides an alarm feed from the PME database to the SBO database. Both “onboard based alarms” and “software based alarms” (excluding VIP alarms) are sent to SBO.
Historical Data Flow Historical Data for Simple Trending in SBO
Although it is not meant to view large amounts of data, SBO has a tool that allows the user to simply create trends and lists.

Integration Architectures PME and SBO - Integration Design Guide
© 2015 Schneider Electric. All rights reserved. Page 15 of 53
Architecture 1 Historical data is gathered and logged by SBO. The Trend objects can be created in the Automation Server or Enterprise Server.
Architecture 2 Historical data is gathered and logged by PME and exposed to SBO using EWS. Data transfer can be set to the PME logging interval (typically 15 min) or to a longer interval (for example, every day) to transfer a larger set of data per connection.

Integration Architectures PME and SBO - Integration Design Guide
Page 16 of 53 © 2015 Schneider Electric. All rights reserved.
Historical Data for Dashboards and Reports
The PME Dashboards and Reports applications utilize logged trend data only from the PME database. Therefore, any data from SBO that is to be displayed in a Dashboard or Report needs to be in the PME database.
Architecture 1 Historical data is gathered and logged by SBO. The ETL connects to the SBO EWS Server, extracts select historical data and inserts it into the PME database.

Integration Architectures PME and SBO - Integration Design Guide
© 2015 Schneider Electric. All rights reserved. Page 17 of 53
Architecture 2 Historical data is directly gathered and logged by PME.

Guidance for Choosing an Architect PME and SBO - Integration Design Guide
Page 18 of 53 © 2015 Schneider Electric. All rights reserved.
Guidance for Choosing an Architecture Note
The architectures for applications where PowerLogic SCADA or other software components are involved in the solution are beyond the scope of this document. The discussion in this chapter is aimed only for PME plus SBO.
There are various aspects to consider when choosing an architecture. This document provides guidance by focusing on the following:
• Data collection • User experience expectation • Commissioning time consideration • IT concerns
Note
The two architectures are not exclusive; they can be combined (used at the same time) in order to support the best possible functionality, performance, reliability, and consistency of the system. In fact, many systems will combine both.
Data Collection Real-time data flow is determined by the data collection design of the system. Refer to “Real-time Data Flow” on page 13 for information about the difference between two the architectures.
In order to choose better data collection or communication for the system based on a specific situation, consider the items below.
The Device type is the most important aspect to be considered when selecting Architectures. The number of registers and device location are additional considerations but less of a factor than the device type. Use the Device Type diagram to assist in your selection, and if in doubt use the number of registers and Device Location to finalize your choice.
Selection considerations Priority
Device type High
Numbers of registers to be requested Low
Device Location Low

Guidance for Choosing an Architect PME and SBO - Integration Design Guide
© 2015 Schneider Electric. All rights reserved. Page 19 of 53
Device Type It is important to understand which power devices the system is connecting to.
The flow chart below provides guidance for decision making:

Guidance for Choosing an Architect PME and SBO - Integration Design Guide
Page 20 of 53 © 2015 Schneider Electric. All rights reserved.
Below are the descriptions for each block:
• Schneider Electric devices Most of the Schneider Electric (SE) meters and circuit breakers are fully supported by PME. This means that PME has built-in drivers to utilize the full functionality of the device and the required commissioning time is minimized. PME also has drivers (translators) developed for 3rd party devices. Note
Check if there is an existing driver for your device in the community at: https://powersolutionscommunity.schneider-electric.com/welcome.
In SBO, SmartWidgets are developed for some of Schneider Electric meters. The commissioning time can be reduced when there is a SmartWidget for your device. If a Modbus device is not from Schneider Electric or not natively supported by PME, a custom device type can be created. If a Modbus device is not from Schneider Electric or not natively supported by SBO, then you must perform manual mapping in order to communicate to the device. If the device uses a protocol other than Modbus, further investigation on gateways may be needed before choosing a communication architecture.
• ION meter ION meters use ION protocol, which is fully supported by PME but not by SBO. Therefore, it is required to connect these meters in PME (Architecture 2). Most of the ION meters also support Modbus protocol. However, for basic functions, you must manually expose values that are not originally exposed. More importantly, most of the advanced functions, such as waveforms, onboard loggings, onboard alarms, etc., are not available for Modbus communication. Therefore, connecting an ION meter through Modbus is not recommended.
• Multi-address device A Multi-address device is a Modbus device that has multiple Modbus IDs, such as Masterpact. In SBO, multiple Modbus devices need to be created because each device can have only one Modbus ID. Creating multiple Modbus devices for one physical device increases the complexity of the system tree structure. Also, much more commissioning effort is required. Therefore, it is recommended to connect these devices in PME (Architecture 2).
• Power Quality functions If your device has Power Quality functions and you want to make use of the functions, it’s better to connect it to PME. PME allows you to see events, waveforms, reports and all other power monitoring related information. By using EWS in Architecture 2, the event is pulled from PME into SBO, and shown in the alarm panel.
• Onboard logging If your device has an onboard logging function, Architecture 2 is recommended because PME retrieves the onboard logging instead of doing PC logging for these devices (like SBO). In this way, you achieve higher reliability and data consistency.

Guidance for Choosing an Architect PME and SBO - Integration Design Guide
© 2015 Schneider Electric. All rights reserved. Page 21 of 53
• Onboard alarming If your device has onboard alarming function, Architecture 2 is recommended because PME retrieves the onboard alarms with their time stamps instead of monitoring the values and generating alarms in the server (like SBO). This is significant for power failure root cause analysis.
Conclusion There are many reasons why Architecture 2 is recommended when there is a power monitoring need. However, when only low-end power meters, energy meters, or pulse meters are used, there is no difference between the two architectures in fulfilling the energy management requirement.
Numbers of Registers to be Requested During the design phase, it is important to plan how many registers are needed for each power device.
If only kWh and a few power measurements are needed, then Architecture 1 is a reasonable choice—as long as the existing Automation Server can handle the Modbus serial loop communication of the power devices.
However, if many measurements are needed for each power device—and to avoid creating significant extra load to the Automation Server—it is recommended to use Architecture 2 to keep communication of the power devices separated.
The topic is also linked to the complexity of the power device because typically the more complex the device is, the more registers need to be requested.
Device Location Consider the device location and communication cable layout when choosing an architecture.
If all power devices are located together in the electrical room, then it is recommended to use EGXs as gateways to connect to them with dedicated daisy chains. However, when a limited number of meters are located close to an Automation Server, it might be cheaper to connect them to the nearby Automation Server.
Since you can always combine the two architectures, choose the most convenient way to connect to the device.

Guidance for Choosing an Architect PME and SBO - Integration Design Guide
Page 22 of 53 © 2015 Schneider Electric. All rights reserved.
User Experience The user experience differs between the two architectures in two ways:
• Graphics for power devices • Update rate for real-time values
Graphics for Power Devices Architecture 1 If there is a SmartWidget for the device, users can use the graphic pre-developed in the SmartWidget. As an example, the picture below is the graphic that comes with the PM750 SmartWidget. If there isn’t a SmartWidget for the device, users must build their own graphics based on their needs.
Architecture 2 Diagrams of PME are integrated into SBO graphics which provides much more detailed electrical views with more electrical information. Users can navigate through typical pages as:
• Volts/Amps • Power Quality • Energy & Dmd • Inputs/Outputs • Alarms • Diagnostic

Guidance for Choosing an Architect PME and SBO - Integration Design Guide
© 2015 Schneider Electric. All rights reserved. Page 23 of 53
Considering that PME supports most of the power devices, while there are not as many SmartWidgets for them, using the diagrams in PME provides electrical views with more detailed information, and also saves commissioning time.

Guidance for Choosing an Architect PME and SBO - Integration Design Guide
Page 24 of 53 © 2015 Schneider Electric. All rights reserved.
If the device is not natively supported by PME, commissioning time is also needed for creating diagrams. Refer to “Commissioning Time Estimates” on page 45 for more information.
When the power device is simple and the few registers are requested, the extended diagrams from PME become less valuable. Refer to “Data Collection” on page 18 for more information.
Even if the user selects Architecture 2, they can choose not to integrate diagrams if they prefer to create their own graphics in SBO for power devices.
Update Rate for Real-time Values For real-time values, in one polling cycle, the number of layers is different for the two architectures. Refer to “Real-time Data Flow” on page 13 for more information.
Architecture 1 In Architecture 1, SBO (either the Automation Server or Enterprise Server) polls the devices (there may be gateway in between) directly. The update rate of the real-time values in a graphic depends on the following:
• Serial communication speed • Number of devices in the serial loop and numbers of registers to be
requested • Capability of the Automation Server or Enterprise Server and its load
Architecture 2 In Architecture 2, PME polls the devices (there might be gateways in between) directly and then exposes the value to SBO via EWS. The update rate of the real-time value in a graphic depends on the following:
• Update rate for EWS communication • Serial communication speed • Number of devices in the serial loop and numbers of registers to be
requested • Capability of the PME server • Bandwidth allocation between real-time and log retrieving of PME
Because of the added layers in the communication, and because PME uses its bandwidth not only for real-time data but also for historical data retrieval, the update rate for a real-time value for architecture 2 is typically slower than Architecture 1. Refer to “System Communication Design” on page 33.
Another reason why Architecture 1 may seem faster is because there are only a few registers that are typically requested from power devices. For example, for the PM800, only 34 Modbus registers are included in the SmartWidget while thousands of registers (all information) are included in the PM800 driver in PME. When a user wants to see some register values from the thousands of registers (e.g., open a graphic), PME might already be pulling onboard logs or onboard alarms at the same time.

Guidance for Choosing an Architect PME and SBO - Integration Design Guide
© 2015 Schneider Electric. All rights reserved. Page 25 of 53
Conclusion If the real-time update rate is your top priority and only a small number of registers are needed, choose Architecture 1. Otherwise, choose Architecture 2 to make use of all the functions of your power devices.
Commissioning Time Validation results show that engineering time required for the integration varies for different architectures (refer to “Commissioning Time Estimates” on page 45). It is faster to deploy Architecture 2 than Architecture 1 for several reasons:
Validation results reveal that when the devices are power devices that are supported by PME, it is faster to configure the devices in PME (Architecture 2) than in SBO (Architecture 1), even when there is SmartWidget available for the devices in SBO. PME natively supports a wide range of power devices, while not as many SmartWidget are available. When no SmartWidget is available, the time for creating the Modbus map in SBO can be considerable. In this scenario, Architecture 2 requires less engineering time. When the device is not supported by PME natively, the time for creating a device translator must also be considered.
Configuring the ETL to setup the historical data transfer from SBO to the PME database is an additional task for Architecture 1, which may require considerable time, depending on the number of devices, device types, and the number of logs and measurement types. You can reduce the time required by using batch editing when configuring the Mapping.
IT Considerations Server Capability The recommended server differs between Architecture 1 and Architecture 2. This is determined by the PME work load in the two architectures. Refer to “Server Specification” on page 29 for more information.

Software Compatibility PME and SBO - Integration Design Guide
Page 26 of 53 © 2015 Schneider Electric. All rights reserved.
Software Compatibility This section describes the software compatibility of the integration of PME and SBO, as well as the supported version of Windows operating system, SQL server, and other software that might be used.
NOTICE LOSS OF DATA
• Be sure to activate product and component licenses prior to the expiry of the trial license.
• Ensure that you activate sufficient licenses for the servers and devices in your system.
• Export the existing hierarchy template out of Power Monitoring Expert before importing a new template. The new template can overwrite the existing template, which can permanently remove all information contained in the original.
• Backup or archive any SQL Server database data before adjusting any database memory options.
• Only personnel with advanced knowledge of SQL Server databases should make database parameter changes.
Failure to follow these instructions can result in loss of data.
NOTICE UNAUTHORIZED OR UNINTENDED ACCESS TO CUSTOMER DATA
• Personnel setting up Power Monitoring Expert third-party authentication must be aware that links to data are not secure.
• Do not setup access links to sensitive or secure data.
Failure to follow these instructions can result in unauthorized or unintended access to sensitive or secure customer data.
SBO and PME The following software versions are supported for SBO and PME integration:
• SBO 1.6.1 • PME 8.0
Windows Operating Systems Following Windows operating systems are supported when PME and SBO are installed on same server:
• Microsoft Windows 7 (32/64-bit, Professional/Enterprise), SP1 • Microsoft Windows 8.1 (32/64-bit, Professional/Enterprise) • Microsoft Windows Server 2008 R2 (64-bit, Standard/Enterprise), SP1

Software Compatibility PME and SBO - Integration Design Guide
© 2015 Schneider Electric. All rights reserved. Page 27 of 53
• Microsoft Windows Server 2012 (64-bit, Standard), SP1 • Microsoft Windows Server 2012 R2 (64-bit, Standard)
Note
PME cannot be installed on domain controllers. If PME is installed on a server that is subsequently changed to a domain controller, the software ceases to function correctly.
Please refer to StruxureWare Building Operation Information Technology System Planning Guide and StruxureWare Power Monitoring Expert System Design Guide for supported operating systems for separate installation.
SQL Server Please refer to StruxureWare Power Monitoring Expert System Design Guide for supported SQL version.
PME in SBO WebStation The following browsers are supported when using PME applications in SBO Webstation:
• Microsoft Internet Explorer 11 • Google Chrome version 42 or later • Mozilla Firefox version 35 or later
Note
Chrome browser support is dependent on its support of the Silverlight plugin.
HTML5 Mode in SBO 1.6 WebStation is not supported.
SBO Report Server Note
Installing PME and SBO Report Server on same machine is NOT supported.
Sharing SQL Server between PME and SBO Report Server is NOT supported.
Port Settings StruxureWare Building Operation The Enterprise Server uses HTTP and TCP protocols to communicate with other servers and clients. In the Software Administrator, you configure the port number

Software Compatibility PME and SBO - Integration Design Guide
Page 28 of 53 © 2015 Schneider Electric. All rights reserved.
of each protocol the Enterprise Server listens to when communicating through a specific protocol. Refer to the StruxureWare Building Operation Information Technology System Planning Guide for a full list of required open ports.
Power Monitoring Expert Refer to “Firewall Configuration” in the StruxureWare Power Monitoring Expert Installation Guide for more information.
Changing Port Settings Because SBO and PME both use the same HTTP (80) and HTTPS (443) ports as default, when installing Enterprise Server and PME on the same operating system the HTTP and HTTPS ports for SBO Enterprise Server must be changed. For example, use 8080 and 446 as shown below.
Therefore, during the design phase, the IT policy needs to be checked to make sure this is acceptable. If it is not, PME and the Enterprise Server should not be installed on the same operating system, and should instead be installed on separate servers.

IT Infrastructure PME and SBO - Integration Design Guide
© 2015 Schneider Electric. All rights reserved. Page 29 of 53
IT Infrastructure For the integration of PME and SBO, the Enterprise Server of SBO and Primary Server of PME can be located on separate physical servers, or located on same physical server. This chapter includes the following topics:
• Server specification • Hard drive contention • Database consideration
Note
Only PME Standalone Architecture is discussed in this document. For the distributed PME installation refer to the StruxureWare Power Monitoring Expert System Design Guide for more information about PME system architectures.
Server Specification PME system can vary in size from a few devices with limited logging to thousands of devices with extensive logging and custom applications. The following system specifications are sufficient for most customers and can be adjusted if needed. Refer to the StruxureWare Power Monitoring Expert System Design Guide for more information.
System1 Devices Users Server Recommendations Years of Logging2
B1 ≤ 50 ≤ 5
Computer Type: Desktop
~4 years(10 GB)
OS: Windows 8.1 (64-bit) SQL: 2014 Express CPU: Intel Core i3 (2 core), or better RAM: 2+ GB HDD: 500+ GB
B2 ≤ 100 ≤ 5
Computer Type: Desktop
~2 years(10 GB)
OS: Windows 8.1 (64-bit) SQL: 2014 Express CPU: Intel Core i3 (2 core), or better RAM: 2+ GB HDD: 500+ GB
B3 ≤ 100 ≤ 5
Computer Type: Desktop
~6 years(30 GB)
OS: Windows 8.1 (64-bit) SQL: 2012 Standard SP1 CPU: Intel Core i3 (2 core), or better RAM: 4+ GB HDD: 500+ GB
A1 ≤ 100 ≤ 15
Computer Type: Workstation
~6 years(30 GB)
OS: Windows 8.1 (64-bit) SQL: 2012 Standard SP1 CPU: Intel Xeon E56xx (4 core), or better RAM: 8+ GB HDD: x2 500+ GB
B4 ≤ 250 ≤ 10
Computer Type: Workstation
~2.5 years(30 GB)
OS: Windows Server 2012 R2 SQL: 2014 Standard CPU: Intel Xeon E56xx (4 core), or better RAM: 8+ GB HDD: x2 500+ GB

IT Infrastructure PME and SBO - Integration Design Guide
Page 30 of 53 © 2015 Schneider Electric. All rights reserved.
System1 Devices Users Server Recommendations Years of Logging2
A2 ≤ 250 ≤ 20
Computer Type: Server
~2.5 years(30 GB)
OS: Windows Server 2012 R2 SQL: 2014 Standard CPU: Intel Xeon E56xx (4 core), or better RAM: 16+ GB HDD: x4 300+ GB
B5 ≤ 600 ≤ 10
Computer Type: Workstation
~1 year(30 GB)
OS: Windows Server 2012 R2 SQL: 2014 Standard CPU: Intel Xeon E56xx (4 core), or better RAM: 16+ GB HDD: x6 300+ GB
A3 ≤ 600 ≤ 35
Computer Type: Server
~1 year(30 GB)
OS: Windows Server 2012 R2 SQL: 2014 Standard CPU: x2 Intel Xeon E56xx (4 core), or better RAM: 24+ GB HDD: x6 300+ GB
B6 ≤ 2500 ≤ 10
Computer Type: Server
~2 years(200 GB)
OS: Windows Server 2012 R2 SQL: 2014 Standard CPU: x2 Intel Xeon E56xx (4 core), or better RAM: 24+ GB HDD: x5 300+ GB x1 1.5+ TB
A4 ≤ 2500 ≤ 50
Computer Type: Server
~2 years(200 GB)
OS: Windows Server 2012 R2 SQL: 2014 Standard CPU: x2 Intel Xeon E5-2xxx (6 core), or better RAM: 32+ GB HDD: x6 300+ GB x2 1.5 TB
1 Basic or Advanced system (for example, B3 denotes the third of the basic systems in a larger order of magnitude). 2 Years of data in the database is calculated based on a 10 GB database for SQL Server Express and 30 GB (or larger) for SQL Server Standard edition.
Adjustment for Different Architectures The server specification for the integrated system can vary for different architectures. For example, in Architecture 1 PME works less than in Architecture 2 (all real-time communication is handled by SBO), and when PME and SBO are on the same server, the server load is higher than if they were separate. After making an adjustment based on the previous specification, the following table is a guide for choosing the PME server.

IT Infrastructure PME and SBO - Integration Design Guide
© 2015 Schneider Electric. All rights reserved. Page 31 of 53
Devices
Arch1 same server
Arch1 separate
Arch2 same server
Arch2 separate
≤ 25 B1 B1 B1 B1 ≤ 50 B2 B1 B3 B2
≤ 100 B3 B2 A1 B3 ≤ 250 B4 B3 A2 B4 ≤ 600 B5 B4 A3 B5
≤ 2500 B6 B5 A4 B6
Further adjustment might be needed based on the size of the BMS system.
Hard Drive Considerations The hard disk drives (HDD) in the Power Monitoring Expert server are critical to the operation of the software. The configuration of the hard drives and distribution of software components can have a significant effect on the performance of the server.
Hard Drive Space for Software Components Component Hard Drive Space Required1
Windows OS2 80 – 100 GB
Power Monitoring Expert3 5 GB
Power Monitoring Expert’s databases4 5 GB
SQL Server 2 GB
SBO 2 GB
Free hard drive space5 10% - 30% of the total hard drive space
TOTAL ~ 100 GB + 30% of Total Hard Drive Space
1. The hard drive space requirements for each component have been rounded up to account
for variations throughout the life of the system. 2. Includes the Windows operating system, page file, temp directory, Windows updates,
restore points, and so on. The initial hard drive space for Windows is between 16 GB and 40 GB, but will grow over time.
3. Accounts for future Power Monitoring Expert updates and service packs. 4. Includes Power Monitoring Expert databases (that is, ION_Network, ION_SystemLog and
ApplicationModules) and database backups. ION_Data is not included. 5. Required for hard disk drive defragmentation and unexpected usage (that is, downloads,
file copying, and so on). Solid state drives (SSD) do not require defragmentation and will require less available space.
Example A server has two 500 GB hard drives configured using RAID 1 (that is, they are exact copies of each other – see Hard Drives and RAID1 below). However, there is only 465 GB of usable space. After all software components are installed on this hard drive group, 223 GB of hard drive space remains for the ION_Data database and its backups, and the SQL Server tempDB.

IT Infrastructure PME and SBO - Integration Design Guide
Page 32 of 53 © 2015 Schneider Electric. All rights reserved.
Refer to the StruxureWare Power Monitoring Expert System Design GuidIe for the following sections:
• Hard drive contention • Hard drive groups • Hard drives and RAID • Recommended hard drive configurations
The recommendations work regardless of whether SBO and PME are installed on the same server. When SBO and PME are installed on the same server, you must forecast the size of the SBO trend files during the design phase.
Database Considerations Please refer to StruxureWare Power Monitoring Expert System Design Guide for the following sections:
• SQL Server Express vs. Standard/Enterprise • Databases in Power Monitoring Expert • Database Growth Calculations • Hard Drive Space Requirements

System Communication Design PME and SBO - Integration Design Guide
© 2015 Schneider Electric. All rights reserved. Page 33 of 53
System Communication Design System Communication Design varies significantly between Architecture 1 and Architecture 2.
Architecture 1 Field-level Communication
In Architecture 1, field-level communication is handled by SBO (Enterprise Server, Automation Server, or any other BMS field-level devices).
Refer to the SmartStruxure Architecture Guideline for more communication design information.
Refer to the relevant documents for the device you are using for guidance on designing the communication network.
Logging Data in SBO In Architecture 1, historical data is gathered in TrendLogs. TrendLogs can be fed by any SBO variables, including BACnet, LON, XML, or Modbus Point.
Note
When logging data in SBO, it is recommended to use interval trend log to log the raw data from meters. The cumulative raw data is then inserted into the PME database by the ETL tool. PME Dashboards and Reports have an aggregation mechanism to make use of the data. Hourly, daily, and monthly usage does not need to be calculated in SBO for PME use.
If both Trendlog and Extended Trendlog are used, it is recommended to send the data in the Trendlog to PME (via ETL) to avoid the lagging between Extended Trendlog and Trendlog.
It is recommended to plan the variables to be logged during the design phase so that the size of the Trendlog files can be forecasted. Also, it is important to plan which Trendlogs are to be transferred to the PME database so that you can forecast the size and growth of the database.

System Communication Design PME and SBO - Integration Design Guide
Page 34 of 53 © 2015 Schneider Electric. All rights reserved.
ETL Jobs An ETL job is essentially a set of task definitions that the ETL engine follows in order to Extract, Transform, and Load data from one data source to another. An ETL job contains an extract task to pull the data, a transform task to manipulate the data, and a load task that applies the data to the new location.
After the job is set up (refer to the StruxureWare™ Building Operation Installation and Configuration Guide to learn about how to set up an ETL job), you can set the job to run as a service. When set to run as a service, a job automatically runs at set times based on the settings you input in the Job tab. The Sleep Time Between Execution value (in seconds) allows you to define the frequency and the default value of 3600 seconds. The value defines when new data can be displayed in the Dashboards and Reports. You can use a smaller value if you desire the job to run closer to instantaneousness. For meter interval data, 900 seconds is usually fast enough for the updates. When increasing this value, consider the SBO Trendlog size to make sure it can be covered before being overwritten in order to prevent missing Trendlogs.
ETL does not use any of the PME processes, so this has little impact on PME performance while loading. SQL supports multi-thread and will serve both ETL and PME needs. If SQL is overloaded, the data buffer handles it.

System Communication Design PME and SBO - Integration Design Guide
© 2015 Schneider Electric. All rights reserved. Page 35 of 53
Architecture 2 Real-time Communication
The following flow chart shows the detail of the real-time data flow in PME when integrating to SBO under Architecture 2.
Field-level Communication The Diagnostics Viewer tool in the PME Management Console is used to diagnose and tune the field-level communication. For a site (serial loop), the Time Util (Time Utilization, as shown in the graphic below) indicates the total utilization for the serial loop. A low percentage implies room for improvements. The user can set the software components (Site Server, LogInserter) to poll more quickly to achieve faster real-time performance, or put more devices on the same serial loop. A value close to 100% indicates that the serial communication is saturated.

System Communication Design PME and SBO - Integration Design Guide
Page 36 of 53 © 2015 Schneider Electric. All rights reserved.
EWS Communication There are two configurable settings that control the EWS communication: Value Poll interval and real-time refresh rate.
Value Poll Interval In the SBO EWS Interface, a user can configure the Value Poll interval, which defines the frequency of the EWS polling, for real-time values. The default value is 20 seconds.

System Communication Design PME and SBO - Integration Design Guide
© 2015 Schneider Electric. All rights reserved. Page 37 of 53
Real-time Refresh Rate The PME EWS server defines the refresh rate (Real-time refresh rate) for its request. The software then uses this rate to communicate with devices. This refresh rate is configurable. (Refer to StruxureWare™ Building Operation Connector Installation and Configuration Guide for how to configure this setting). The default value is 20 seconds.
<appSettings>
<add key="ServiceInventoryEndpoint" value="http://STANDALONE:23102/CoreServicesHost/Inventory/InventoryService" />
<add key="EWSRealTimeTimeout" value="120" />
<add key="ServiceLocation" value="EWS Services" />
<add key="DigestAuthenticationModule_Realm" value="DataExchangeService" />
<add key="EWSEnabled" value="1" />
<add key="EWSAlarmSortOrder" value="0" />
<add key="ContainerItemStructure" value="0" />
<add key="NaNValue" value="" />
<add key="ConcatSourceAlarmEventId" value="1" />
<add key="RealTimeRefreshRate" value="20" />
<add key="RefreshImmediately" value="0" />
<add key="RealTimeSessions" value="10" />
</appSettings>

System Communication Design PME and SBO - Integration Design Guide
Page 38 of 53 © 2015 Schneider Electric. All rights reserved.
Communication Performance A series of performance tests have been conducted on different size of testing systems (25 devices, 50 devices, and 100 devices). Refer to “Appendix A: Integration Testing Systems” on page 50.
The server used for these tests meets the B1 spec (Refer to “Server Specification” on page 29):
Computer Type: Desktop OS: Windows 8.1 64 bit SQL: 2012 Express CPU: Intel Core i3 (2 core) RAM: 2 GB HDD: 232 GB Software: SBO1.6 + PME 7.2.3
The tests use four measurements per device which are pre-defined as follows in SBO Connector graphic components:
• Voltage • Current • Power • Power Factor
Test one The first test scenario uses the system default update rates:
• LI_PollingPeriod_s = 30 seconds • RealTimeRefreshRate = 20 seconds • Value Poll Interval = 20 seconds
Observations while viewing 100 EWS tags (25 devices X 4 values) in a graphic:
• EGX Sites with 10xPM3255 devices each (x2 sites): ~35% utilization total per site
• PM8ECC site with 4xPM820 devices (1 site): ~6% utilization total for the site • PM870 Ethernet device: ~1% utilization • EWS Response Times: AVG = 970 ms; STDEV = 240 ms, MIN = 390 ms,
MAX = 1300 ms
This configuration is also used to determine reliability of updates in SBO when pulling real-time data from PME. Observations are that >99% of all updates were within 21 seconds (20 seconds for SBO Value Poll Interval + 1 second for EWS response time), and 99.9% were within 25 seconds. A few update outliers were observed between 35 and 72 seconds (< 0.03% updates took longer than 35 seconds, and no updates took longer than 72 seconds).This configuration was assessed for 72 hours to gather these statistics.

System Communication Design PME and SBO - Integration Design Guide
© 2015 Schneider Electric. All rights reserved. Page 39 of 53
Test two The second test scenario uses faster polling, “pushing the limits” using 5-second polling for everything:
• LI_PollingPeriod_s = 5 seconds • RealTimeRefreshRate = 5 seconds • Value Poll Interval = 5 seconds
Observations while viewing 100 EWS tags (25 devices X 4 values) in a graphic:
• EGX Sites with 10xPM3255 devices each (x2 sites): ~68% utilization total per site
• PM8ECC site with 4xPM820 devices (1 site): ~15% utilization total for the site
• PM870 Ethernet device: ~2.5% utilization • EWS Response Times were not processed, although they appeared to be
similar to the other test runs (which makes sense because the requests were the same size).
Although this has not been tested, we expect 99% of updates in SBO are within 6 seconds (5 seconds for SBO Value Poll Interval + 1 second for EWS response time).
Conclusions • The communication utilization of devices is affected directly by the number of
Modbus reads required to obtain the desired measurements. • Some devices (such as the PM800 series device) support efficient means for
obtaining data using scattered reads; different sets of measurements, of the same number, had little effect on the serial loop utilization.
• Other devices (such as the PM3255 device) do not support an efficient means for obtaining disparate Modbus registers. If the registers requested are close enough together to obtain them in a single read, PME will do so. If not, PME will send multiple Modbus requests; in theory you could see as many as one Modbus request per measurement, if the chosen measurements are of very different Modbus register addresses. One test showed three separate Modbus reads just to obtain four measurements, and it could have taken longer.
• With the right communication architecture, PME can support 5-second real-time and event log requests without saturating communication channels. This is subject to which devices and measurements are selected, as discussed previously.
Further tests with 50 and 100 devices, connected with the same device-to-gateway ratios, showed little difference in any (user-centric or communications-centric) performance metric. This is partly because PME handles different sites (up to 200 as default) simultaneously. The server CPU capability affects it, however the serial loop utilization is usually what slows real-time communication. Therefore, care must be taken when designing the serial loop to make sure that the serial communication is not saturated.

System Communication Design PME and SBO - Integration Design Guide
Page 40 of 53 © 2015 Schneider Electric. All rights reserved.
The computer category B1 (refer to “Server Specification” on page 29), used for the 25-device systems was adequate for 50 or even 100 devices in the test. However, it is recommended that the B3 and A1 spec be followed instead considering the test was conducted in an ideal scenario.
EWS Response Time (Real-time) Tests are conducted for systems with different numbers of devices and measurements in order to learn how well the PME EWS Server performs when the system is scaled up in size.
The server used for these tests meets the A4 spec (Refer to “Server Specification” on page 29):
Computer Type: Server OS: Windows Server 2012 R2 SQL: 2012 Standard SP1 CPU: x2 Intel Xeon E56xx (4 core) RAM: 24 GB HDD: x6 300 GB Software: SBO1.6 + PME 7.2.3
Number of Devices
Number of Tags per Device
Total Number of Tags
Average Response Time (s)
5 1 5 < 1 5 4 20 < 1 5 10 50 1.25
500 1 500 3 500 4 2000 6 500 10 5000 13.5
1500 1 1500 5.75 1500 4 6000 18 2500 1 2500 6.5
EWS value response times were about equivalent when asking for different measurements/devices, as long as the number of measurements (and possibly the number of devices they were distributed across) remains the same. Therefore, the chart is drawn for EWS response time vs. Number of tags in EWS request based on the above table results.

System Communication Design PME and SBO - Integration Design Guide
© 2015 Schneider Electric. All rights reserved. Page 41 of 53
As discussed previously, the EWS request is sent from SBO only when there is a need (e.g., graphic open). Therefore, typically a EWS request from SBO to PME contains less than 1000 tags. For example, 100 devices are shown in one graphic, each component has four values bound. When a user opens this graphic, a EWS request for the 400 values (tags) is sent to the PME EWS Server. From the graph above, the EWS response time is about three seconds. The communication has plenty of buffer time with a 20-second value polling setting in SBO as the default.
Alarm Communication In Architecture 1, alarms are created in SBO (Automation Server or Enterprise Server). While in Architecture 2, technically the alarms can be created in both systems (PME or SBO). So a proper design of the alarm generation logic and communication is important for a successful solution.
PME Alarms PME alarms are transferred to SBO via EWS if the Alarm Polling is enabled for the EWS interface in SBO. The Polling Interval can be configured (default is 60).

System Communication Design PME and SBO - Integration Design Guide
Page 42 of 53 © 2015 Schneider Electric. All rights reserved.
A filter can be configured to transfer only the alarms that are needed. The priority of events/alarms is from 1 to 255. Typical categories are:
• High priority alarm: 193 - 255 • Med priority alarm: 128 - 192 • Low priority alarm: 64 -127 • Information: 0 - 63
The priority of an alarm/event can be configured in the PME system. Therefore, the user has the ability to configure from both sides to make sure only the desired alarms are transferred into the SBO system.
When a user acknowledges EWS alarms in SBO, the corresponding alarms in the PME system are acknowledged automatically.
The following flow chart shows the detail of the alarm data flow in PME when integrating to SBO under Architecture 2.

System Communication Design PME and SBO - Integration Design Guide
© 2015 Schneider Electric. All rights reserved. Page 43 of 53
PME alarms are transferred to SBO using EWS.
The PME LogInserter checks devices on its polling period and inserts the events/alarms into the database. Although the LogInserter treats physical devices and VIP in the same way, it is important to understand the two possible sources of an alarm in the PME system:
• Onboard alarm – generated and stored in device (meter, circuit breaker, etc.) • PC based alarm – generated by the PME Alarm Configuration tool and
stored in PC cache
Note
VIP alarms are not exposed through EWS.
Onboard Alarms For critical alarms, such as circuit breaker trips, power outage, or over current, try to use the device onboard alarms in circuit breakers or meters because this is the core function of the power devices – to detect a failure and log it with a time stamp. Even for a non-critical alarm, onboard alarms are recommended to use to gain higher system reliability and also to make use of the device functionalities.

System Communication Design PME and SBO - Integration Design Guide
Page 44 of 53 © 2015 Schneider Electric. All rights reserved.
PC-based Alarms If the device does not have onboard alarming, or more alarms need to be created, it is recommended to create the alarm in the PME Alarm Configuration tool, rather than create an alarm in SBO on top of a EWS tag. See the following section for more information.
Performance: Alarm Latency With the default setting, when alarm condition is detected, the delay before seen in SBO is expected to be within 60s + 30s = 90s. It is expected that samples will yield a bell curve between 0 and 90 seconds. The settings can be tuned to achieve faster performance.
When adjusting Alarm Polling interval to be less than 60 seconds, the user needs to evaluate if it affects the overall performance of the SBO system.
When adjusting LI_PollingPeriod_s, consider the real-time data performance and maintain an acceptable level—typically no more than 50%—of the overall serial loop utilization.
SBO Alarms When choosing Architecture 2, it is not recommended to create SBO alarms directly on top of a EWS tag. For real-time values, EWS communication only takes place when there is a need, for instance, a graphic is opened by the user. In contrast, if an SBO alarm is created on top of a EWS tag, then the EWS real-time subscription for this value will be constantly active.
Best Practice for Using EWS Alarms in SBO Although EWS alarms can be acknowledged in SBO, they don’t have the full functionality as a normal SBO alarm. The recommended best practice is to use the SBO Sum Alarm function to create a new Sum Alarm on top of one of multiple EWS alarms. Then the newly created SBO alarm can be managed consistently with other SBO alarms and used for control, sending SMS, and other purposes. Please refer to SBO online help for more information about the Sum Alarm function.

Commissioning Time Estimates PME and SBO - Integration Design Guide
© 2015 Schneider Electric. All rights reserved. Page 45 of 53
Commissioning Time Estimates This section provides evidence and guidelines for commissioning time estimates and planning, in order to help the project team to quote on the engineering hours for the integration.
Prerequisites The discussion of the commissioning time is only valid when the following prerequisites are met.
System Prerequisites • The meters and devices which are to be monitored have already been
installed on the site, i.e. the hardware commissioning is complete. • The communications infrastructure is installed and functional (i.e. Ethernet
and serial loop). • The server is ‘clean’: There is a single machine dedicated to hosting the
software system and it does not have any other database-based applications running on it.
• It is assumed that a supported operating system and service pack has already been installed on the server with the latest windows updates applied.
Competencies The application engineer must:
• Become familiar with StruxureWare Building Operation (SBO) • Become familiar with Microsoft Windows operating systems • Have basic knowledge of power monitoring and energy management
Specifically, for deploying Architecture 2 (See definition in Section 2), the application engineer must:
• Become familiar with StruxureWare Power Monitoring Expert, StruxureWare Power Monitoring or PowerLogic ION Enterprise software systems
Validated Commissioning Time Commissioning time has been validated and documented for deploying the 25-device testing system with basic power/energy management functions (Refer to “Appendix A: Integration Testing Systems” on page 50.). For more information regarding the testing system, configuration steps, validation results and conclusions please refer to TVDA: How to Deploy Power Manager for SmartStruxure™ Solution in a Day.

Commissioning Time Estimates PME and SBO - Integration Design Guide
Page 46 of 53 © 2015 Schneider Electric. All rights reserved.
Architecture 1 Validation results show that the validators spent 387.3 minutes (6.5 hours) in average to deploy the testing system by using Architecture 1. The standard deviation is 116.9 minutes.
Architecture 1 Configuration Workflow Average time (min)
Standard Deviation (min)
1
Installing and licensing SBO
16.7 1.5
1.1 Installing and licensing License Server 1.2 Installing Enterprise Server 1.3 Installing Workstation
1.4 Installing SBO Connector components, snippets, and binding template
1.5 Single-server install only: Changing SBO ports
2
Installing and licensing PME
54.7 18.4 2.1 Installing PME 2.2 Activating PME licenses 2.3 Single-server install only: Changing PME ports
3
Configuring the devices in SBO with SmartWidgets
81.7 36.6
3.1 Configuring Modbus Master Interface 3.2 Importing SmartWidgets 3.3 Modifying SmartWidgets graphic 3.4 Creating trend logs for SmartWidgets 3.5 Copy, paste and edit to have the full system
4
ETL
40.3 30.3
4.1 Installing ETL 4.2 Creating ETL job 4.3 Adding and configuring the tasks 4.4 Configuring the mapping 4.5 Run job once and then register as a service
5
Integration Utility & SBO Import
12.7 15.0 5.1 Setting up the two tabs with "Reports Home
Link" and "Dashboards Home Link" 5.2 Exporting the XML 5.3 Importing the XML
6
Setting up Dashboards and Reports 6.1 Installing Microsoft Silverlight 1.7 0.6 6.2 Configuring Dashboards 18.7 11.0 6.3 Configuring Reports 19.3 9.5

Commissioning Time Estimates PME and SBO - Integration Design Guide
© 2015 Schneider Electric. All rights reserved. Page 47 of 53
7 Setting up Graphics 7.1 Setting up Electrical One Line Diagram 80.0 20.0 7.2 Setting up System Network Health screen 61.7 20.8
Total 387.3 116.9
Architecture 2 Validation results show that the validators spent 261.7 minutes (4.4 hours) in average to deploy the testing system by using Architecture 2. The standard deviation is 11.4 minutes.
Architecture 2 Configuration Workflow Average time (min)
Standard Deviation (min)
1
Installing and licensing SBO
14.0 6.1
1.1 Installing and licensing License Server 1.2 Installing Enterprise Server 1.3 Installing Workstation
1.4 Installing SBO Connector components, snippets, and binding template
1.5 Single-server install only: Changing SBO ports
2
Installing and licensing PME
41.0 8.2 2.1 Installing PME 2.2 Activating PME licenses 2.3 Single-server install only: Changing PME ports
3
Configuring the devices in PME
23.0 9.0 3.1 Adding Devices in PME 3.2 Generating a Vista Network Diagram 3.3 Update EWS Server
4
Integration Utility & SBO Import
15.3 7.8 4.1
Setting up the four tabs with " All Device Diagram Links", "Reports Home Link", "Dashboards Home Link", "EWS Link & All Measurements"
4.2 Exporting the XML 4.3 Importing the XML
5
Setting up Dashboards and Reports 5.1 Installing Microsoft Silverlight 1.3 0.6 5.2 Configuring Dashboards 13.7 5.1 5.3 Configuring Reports 14.7 2.3

Commissioning Time Estimates PME and SBO - Integration Design Guide
Page 48 of 53 © 2015 Schneider Electric. All rights reserved.
6 Setting up Graphics* 6.1 Setting up Electrical One Line Diagram 82.7 16.2 6.2 Setting up System Network Health screen 56.0 11.5
Total 261.7 11.4 * These steps are identical for both Architectures. The timing differences are due to the different speeds of different validators.
Estimating Guidelines Below are some guidelines for estimating the engineering time required for Integrating PME and SBO.
Software Installation The installation and licensing of the solution does not vary based on the size of the system. Therefore, your future estimations can be based on our validation results.
Device Configuration Based on the timing results of the device configuration for a 25 device system, when estimating the engineering hours necessary for larger systems, one should not simply multiply the amount of time necessary by the number of devices. The number of different device types may affect the complexity of the task.
Both Architectures have the benefit of quickly configuring supported devices. As the validation result shows, when the device is supported by both PME and SBO (SmartWidget), it was faster to configure it in PME (Architecture 2) than in SBO (Architecture 1).
ETL Configuring the ETL to setup the historical data transfer from SBO to the PME database is an additional task for Architecture 1, which takes considerable time. It depends on the number of devices, device types, and the number of logs and measurement types. Time also varies heavily depending on how well the batch editing is used, especially for big systems. This is the reason why in validation results the deviation is big on this task.
Integration Utility The Integration Utility shortens days of manual integration work into minutes. The time it takes to integrate PME and SBO by using the Integration Utility does not vary based on the size of the system. The exception being the following:
• The time it takes to populate the list under the EWS tab will vary somewhat based on size of the system.
• The export and import in SBO takes slightly longer for larger systems.

Commissioning Time Estimates PME and SBO - Integration Design Guide
© 2015 Schneider Electric. All rights reserved. Page 49 of 53
Setting up Dashboards and Reports The time for setting up Dashboards and Reports is determined by the customer's needs. The testing system covers basic Dashboards and Reports for the power management of a building.
Setting up Graphics The time for setting up Graphics is also determined by the customer's needs. The testing system covers a One Line Diagram and an Electrical Health Summary Screen which are typically needed in the system.

Appendix PME and SBO - Integration Design Guide
Page 50 of 53 © 2015 Schneider Electric. All rights reserved.
Appendix Appendix A: Integration Testing Systems
The testing systems are built to represent real power monitoring systems for different-sized buildings.
25-device System Architectures The 25-device system has one main meter and four branch meters in the main switchboard and 20 sub-meters located in the panels of the four floors that monitor the different loads.
For the selected architectures shown below, some of the devices are connected to the Enterprise Server via a gateway, and some of the devices are connected to an Automation Server to show in Architecture 1 where the Automation Server is available and a separate gateway is not necessary.
Schematic drawing: 25-device testing system (Architecture 1)
Appendix PME and SBO - Integration Design Guide
© 2015 Schneider Electric. All rights reserved. Page 51 of 53
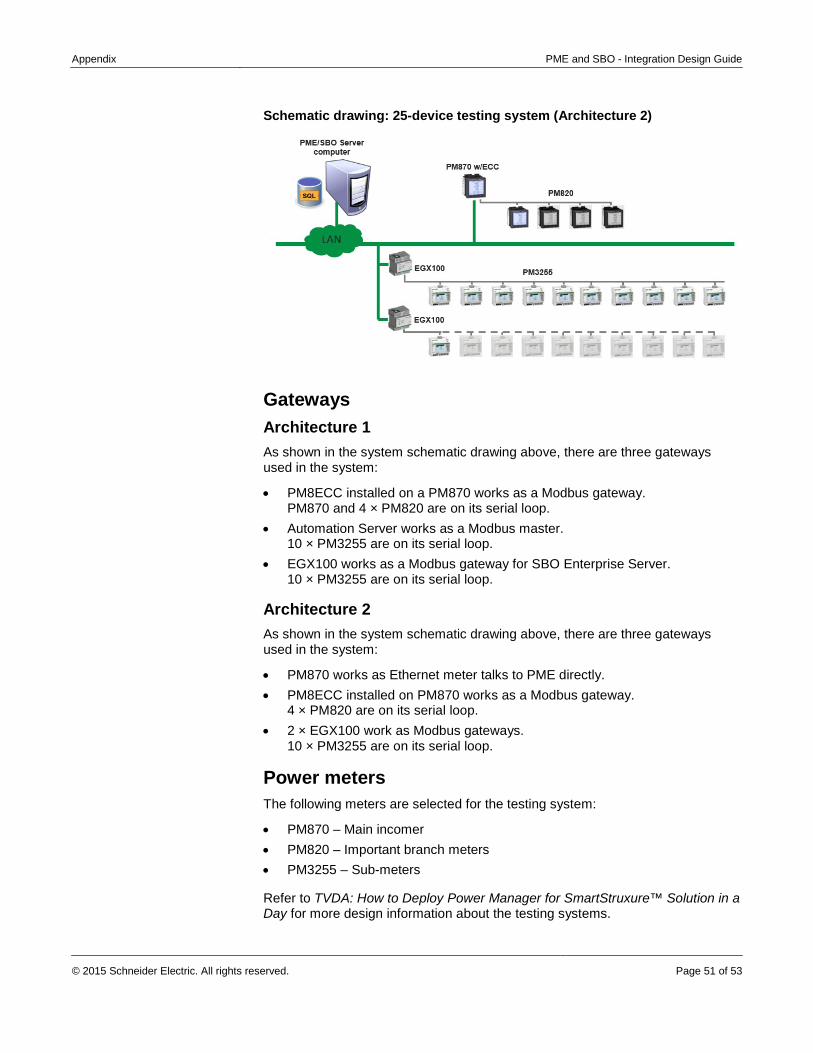
Schematic drawing: 25-device testing system (Architecture 2)
Gateways Architecture 1 As shown in the system schematic drawing above, there are three gateways used in the system:
• PM8ECC installed on a PM870 works as a Modbus gateway. PM870 and 4 × PM820 are on its serial loop.
• Automation Server works as a Modbus master. 10 × PM3255 are on its serial loop.
• EGX100 works as a Modbus gateway for SBO Enterprise Server. 10 × PM3255 are on its serial loop.
Architecture 2 As shown in the system schematic drawing above, there are three gateways used in the system:
• PM870 works as Ethernet meter talks to PME directly. • PM8ECC installed on PM870 works as a Modbus gateway.
4 × PM820 are on its serial loop. • 2 × EGX100 work as Modbus gateways.
10 × PM3255 are on its serial loop.
Power meters The following meters are selected for the testing system:
• PM870 – Main incomer • PM820 – Important branch meters • PM3255 – Sub-meters
Refer to TVDA: How to Deploy Power Manager for SmartStruxure™ Solution in a Day for more design information about the testing systems.

Appendix PME and SBO - Integration Design Guide
Page 52 of 53 © 2015 Schneider Electric. All rights reserved.
50- and 100-device System The 50- and 100-device systems are expansions of the 25-device system. They are built to reflect larger buildings or campuses, and also for testing purposes.
Schematic drawing: 50-device testing system

Appendix PME and SBO - Integration Design Guide
© 2015 Schneider Electric. All rights reserved. Page 53 of 53
Schematic drawing: 100-device testing system