stryker 50015_str04_ar
TRANSCRIPT

Stryker 2004 Annual Report
Celebrating 25 Years as a Public Company
Stryk
er C
orp
ora
tion
20
04 A
nnual R
epo
rt
Stryker Corporation2725 Fairfield RoadKalamazoo, MI 49002
Telephone 269 385 2600
www.stryker.com
CONTENTS
3 Letter to Shareholders5 A Message from Stryker
Chairman John W. Brown 6 Creating the Future
in Orthopaedics18 Creating the Future
in the Hospital29 Financial Review

ORTHOPAEDIC IMPLANTS
Stryker OrthopaedicsOrthopaedic reconstructive productsincluding hip, knee and shoulderimplants and bone cement. Global development and production facilities in New Jersey, Ireland and France.
Stryker SpineSpinal implant products includingcervical, thoracolumbar and interbody systems used in spineinjury, deformity and degenerativetherapies, as well as development of artificial lumbar and cervical discs. Development centers in NewJersey and France; production facilities in France.
Stryker TraumaTrauma-related products includingnailing, plating, hip fracture andexternal fixation systems. Productionfacilities in Germany and Switzerland.
Stryker Leibinger Micro ImplantsMicro plating systems and relatedproducts for craniomaxillofacial, neurological and hand surgery.Production facilities in Germany.
Stryker BiotechOsteogenic protein-1 (OP-1) bonegrowth factor. Production facilities inMassachusetts, New Hampshire and Ireland.
MEDICAL AND SURGICAL EQUIPMENT
Stryker InstrumentsPowered surgical instruments, oper-ating room equipment, surgical navigation systems and interventionalpain products. Production facilities in Michigan, Puerto Rico, Germanyand Ireland.
Stryker EndoscopyMedical video imaging and communi-cations equipment and instrumentsfor arthroscopy and general surgery.Production facilities in California,Texas and Puerto Rico.
Stryker MedicalHospital beds and stretchers andemergency medical service products. Production facilities inMichigan and Canada.
REHABILITATIVE SERVICES
Physiotherapy AssociatesOutpatient rehabilitation servicesfocusing on physical and occupational therapy; 428 locationsthroughout the United States.
INTERNATIONAL SALES
Stryker Europe, Middle East, AfricaSale and distribution of Stryker products throughout Europe, theMiddle East and Africa.
Stryker JapanSale and distribution of Stryker products in Japan.
Stryker PacificSale and distribution of Stryker products throughout Asia and the Pacific, with the exceptionof Japan.
Stryker CanadaSale and distribution of Stryker products in Canada.
Stryker Latin AmericaSale and distribution of Stryker products throughout Central and South America, Mexico and the Caribbean.
Stryker is a global leader in the orthopaedic market with the most broadly based range of products
and services. We have a rapidly growing presence in other healthcare specialties and are at
the forefront of medicine's most promising solutions. We partner with respected medical professionals
to help millions of people lead more active, satisfying lives.
Stryker Divisions
2004 2003 % Change
Net sales $4,262.3 $3,625.3 18
Earnings before income taxes 717.0 652.5 10
Income taxes 251.3 199.0 26
Net earnings 465.7 453.5 3
Adjusted net earnings 1 $586.5 $453.5 29
Diluted net earnings per share of common stock:
Reported $1.14 $1.11 3
Adjusted 1 $1.43 $1.11 29
Financial Highlights(in millions, except per share amounts)
Company Overview
Company Headquarters (also Division Headquarters andManufacturing Locations)
Division Headquarters
Division Headquarters and Manufacturing Locations
Manufacturing Locations
Countries with Sales Operations
*
Stryker Operations
1 Adjusted to exclude the purchased in-process research and development charge recorded in 2004.
Des
ign:
Phi
logr
aphi
ca,
Bro
oklin
e, M
assa
chus
etts
C
opy:
Sus
an G
eib
/Writ
ten
Wor
k, B
osto
n, M
assa
chus
etts
P
hoto
grap
hy:
Am
os C
han,
New
Yor
k, N
ew Y
ork
Board of Directors
Registered TrademarksStryker Corporation or its subsidiaries own the registered trademarks Accolade, CentPillar, Circ-O-Lectric, Duracon, Exeter, Formula, Gamma, Howmedica, i-Suite,Neptune, OP-1, Orthonomics, Osteonics, Reflex, Restoration, Scorpio, NRG, SIDNE, Simplex P, SpineCore, SpinePlex, Stryker, Symax, T2, Triathlon, Trident, Xiaand Zoom; the trademarks 3-chip, Gamma3, Glideaway, NavSuite, OASYS, S2, SMARTLock, SR 90D, SwitchPoint Infinity, and Viper; and the service markPhysiotherapy Associates. The trademark The Institute for Medical Technology Innovation, owned by The Institute for Medical Technology Innovation Corporation,and the service marks Bronson Hospital, owned by Bronson Healthcare Group, Inc., and Curis, owned by Curis, Inc., are also used in this report.
Not all products referenced within this report are approved or cleared for sale, distribution or use in the United States.
Stryker’s Equal Employment Opportunity Policy StatementStryker is committed to providing Equal Employment Opportunity to all employees and applicants for employment on the basis of skills and ability and withoutregard to race, color, creed, religion, sex, age, disability, national origin, ancestry, citizenship, armed forces service, marital or veteran status, sexual orientation, orany other impermissible factor. Our policy of Equal Opportunity and Affirmative Action applies to all phases of the employment process including, but not limited to,recruitment, selection, promotion, transfer, demotion, layoff, termination, compensation, benefits, and other terms and conditions of employment, and furtherrequires maintaining a work atmosphere free of bias, including the prevention of harassment. Harassment includes, but is not limited to, disparaging remarks, innu-endoes, slurs, demeaning written or graphic material, or demeaning physical or verbal confrontations based on race, color, creed, religion, sex, age, disability,national origin, ancestry, citizenship, armed forces service, marital or veteran status, sexual orientation, or any other impermissible factor. Harassment of any natureis expressly prohibited at Stryker.
Seated: Ronda E. Stryker, John W. Brown, Jerome H. Grossman, M.D.Standing: John S. Lillard, Donald M. Engelman, Ph.D., William U. Parfet, Stephen P. MacMillan, Howard E. Cox, Jr.

As a world leader in the medical products and services industry, Stryker has
far more than a vision for the future. We are creating the future through
enduring innovation, constant improvement, intense focus, an ethic of
service and a culture of accountability. In 2004, Stryker marked the 25th
anniversary of our entry into the public markets, where the Company has
earned a reputation for consistently strong financial performance. This year
and throughout the past quarter-century, we have delivered outstanding
results for our shareholders, customers and patients.
In 1979, when Stryker issued its initial public stock offering, the
prospects for a patient were fundamentally different than they are today.
Because of the many advances in medical practice, the future is bright. Today,
patients can look forward to the potential for greater mobility and freedom
from pain, safer surgical procedures and quicker recoveries. In 1979, most
surgeries were highly invasive, knee replacements were unproven technolo-
gies and biologic approaches were mere dreams. Since that time, in each of
these areas and many more, Stryker has played a major role in creating the
future in orthopaedics and in the hospital.
syk25 Years
as a Public Company

To Our Shareholders:
In 2004, Stryker delivered the excellent performance that has made us a leader in the global medical products
and services industry. Our net sales totaled $4,262 million, an 18 percent increase over 2003. Excluding the
$121 million charge resulting from our acquisition of SpineCore, Inc., adjusted net earnings for the year grew
29 percent, to $587 million, and adjusted diluted net earnings per share rose by the same percentage, to $1.43.
Stryker’s achievements in 2004 set the stage for positive long-term results. The future looks promising
because of our broad range of leading products and investments that will yield major benefits during the sec-
ond half of the decade. This year, as we celebrated Stryker’s 25th anniversary as a public company, we reflected
on our accomplishments over the last quarter-century as Stryker has grown into a diversified, top-echelon
business that serves medical needs throughout the world. Now we must continue to drive innovation and
exercise operational discipline to extend our leadership.
A position of financial strength
Operationally, 2004 was an exceptional year. In the second quarter, we fully retired the debt from our land-
mark acquisition of Howmedica in 1998. We now have the freedom and flexibility to make disciplined and
strategic acquisitions as the right opportunities present themselves. During the third quarter, we demon-
strated this capability by acquiring SpineCore, Inc., which is developing artificial discs for use in both the
lumbar and cervical spine. SpineCore is not only a strategic investment, providing entry into an emerging
segment of the spine market, but it is also a highly prudent one. Even with the investment in SpineCore, we
completed the year virtually debt-free. Twenty percent annual growth in earnings per share continues to be a
bedrock commitment for Stryker, and we are positioned once again to deliver our gold standard of profit
growth in 2005.
The innovation imperative
Company-wide, Stryker is intently focused on innovation. Central to this effort is paying close attention to
the needs of customers—surgeons, hospitals and patients—including those who have not yet chosen Stryker.
As important as strategic acquisitions are in bringing breakthrough products to market, Stryker also places
great emphasis on reinvesting in our own research and development programs. In doing so, we build on the
best ideas and capture the full value for growth and continued reinvestment.
Strongly positioned in a robust marketplace
The marketplace we serve is broad and robust, fueled by both demographics and medical advances. The
worldwide orthopaedic market reached nearly $22 billion in 2004, a 15 percent increase over 2003, with con-
tinued growth ahead. Stryker competes in the top tier of all the major segments of this market around the
globe. We have an equally strong presence and dramatic rates of growth in our other medical and surgical
markets. We are continually excited and challenged by the opportunities our marketplace offers, and we are
confident that we will continue to win the right way, through fair and honest dealings. Stryker will expand
and excel by serving the mounting demand for our uncommonly wide range of innovative, high-quality prod-
ucts and services throughout the world.
3
Capitalizing on unique competitive advantages
Stryker is well known for our decentralized structure, which is one of the main sources of our success. In addi-
tion, where it makes sense, Stryker increasingly draws on the strength of our entire enterprise, presenting
comprehensive solutions as one seamless company. For example, we have the ability to provide world-class
orthopaedic implants, powered surgical instruments, integrated operating suites and patient handling equip-
ment to a health-care institution or system—all backed by our unparalleled management experience in an
environment of accountability, metrics and financial controls.
In 2004, we consummated a number of multidivision, “one Stryker” partnership agreements. At the
University of Michigan’s C.S. Mott Children’s Hospital, five of our divisions joined together to provide solu-
tions to one of the nation’s leading pediatric institutions. In Chicago, we helped Northwestern Memorial
Hospital, a preeminent academic medical center, to standardize and leverage its partnership with Stryker in
order to produce long-term cost savings. Such agreements benefit both partners. Our customers gain access
to Stryker’s broad line-up of products and expertise, flexibly tailored to meet their particular needs. Stryker
benefits from having leading partners and opportunities to expand business through an awareness of research
that may point the way to new products.
At this moment of transition
At the end of 2004, we took another step in our ongoing leadership transition as we passed the chief execu-
tive title and day-to-day leadership of the Company from John to Steve, while John continues as Stryker’s
nonexecutive Chairman. At this time, the Company is not only strong, but it is infused with vitality and cre-
ativity. It also has exceptionally talented leadership. Our Group Presidents—Si Johnson, Jamie Kemler and
Ron Lawson—provide clear, well-focused direction in the areas they manage. Our 14 divisions have capable,
experienced managers in all key positions.
We are confident about our transition because we are confident about Stryker—our people, our commit-
ment and our values. Since Dr. Homer Stryker founded the Company with innovative ideas for helping
patients recover faster and better, Stryker has been intent on delivering exceptional results. Because of that
commitment and the unique Stryker culture that surrounds it, we have been able to grow into a global, diver-
sified leader in medical products and services. While the years ahead will bring new challenges and opportu-
nities, we know that Stryker will be ready.
Sincerely,
John W. Brown Stephen P. MacMillan
Chairman President and Chief Executive Officer
4
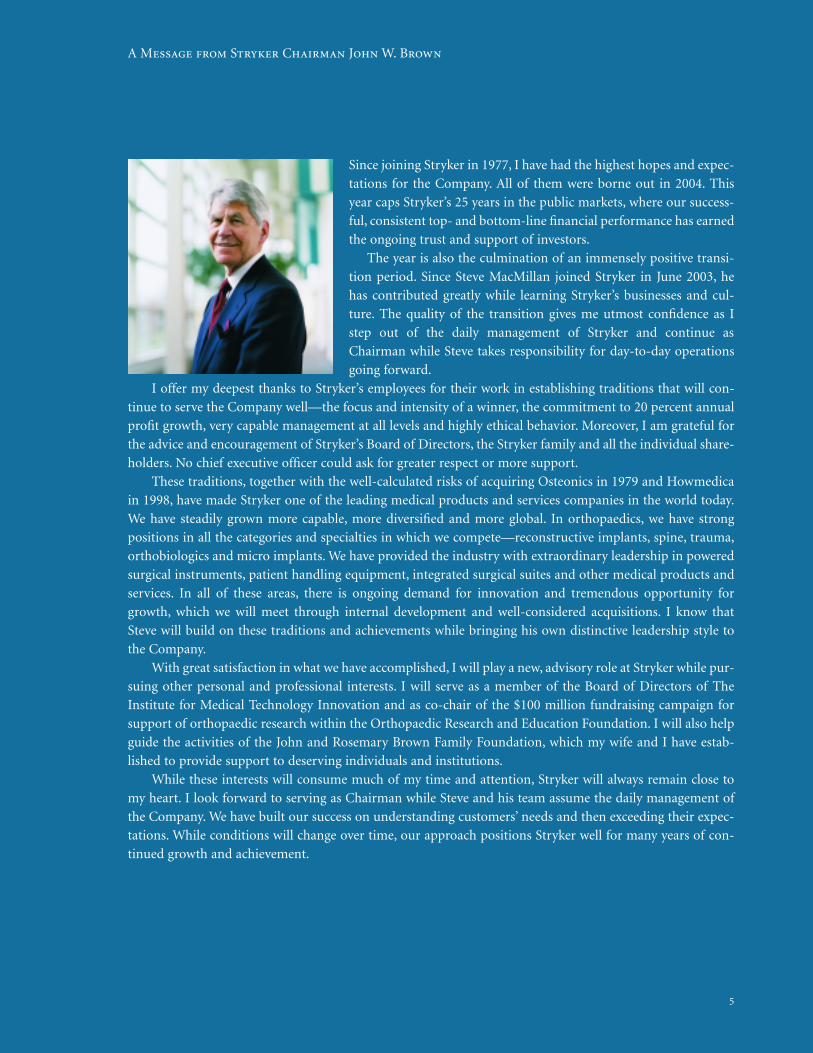
Since joining Stryker in 1977, I have had the highest hopes and expec-
tations for the Company. All of them were borne out in 2004. This
year caps Stryker’s 25 years in the public markets, where our success-
ful, consistent top- and bottom-line financial performance has earned
the ongoing trust and support of investors.
The year is also the culmination of an immensely positive transi-
tion period. Since Steve MacMillan joined Stryker in June 2003, he
has contributed greatly while learning Stryker’s businesses and cul-
ture. The quality of the transition gives me utmost confidence as I
step out of the daily management of Stryker and continue as
Chairman while Steve takes responsibility for day-to-day operations
going forward.
I offer my deepest thanks to Stryker’s employees for their work in establishing traditions that will con-
tinue to serve the Company well—the focus and intensity of a winner, the commitment to 20 percent annual
profit growth, very capable management at all levels and highly ethical behavior. Moreover, I am grateful for
the advice and encouragement of Stryker’s Board of Directors, the Stryker family and all the individual share-
holders. No chief executive officer could ask for greater respect or more support.
These traditions, together with the well-calculated risks of acquiring Osteonics in 1979 and Howmedica
in 1998, have made Stryker one of the leading medical products and services companies in the world today.
We have steadily grown more capable, more diversified and more global. In orthopaedics, we have strong
positions in all the categories and specialties in which we compete—reconstructive implants, spine, trauma,
orthobiologics and micro implants. We have provided the industry with extraordinary leadership in powered
surgical instruments, patient handling equipment, integrated surgical suites and other medical products and
services. In all of these areas, there is ongoing demand for innovation and tremendous opportunity for
growth, which we will meet through internal development and well-considered acquisitions. I know that
Steve will build on these traditions and achievements while bringing his own distinctive leadership style to
the Company.
With great satisfaction in what we have accomplished, I will play a new, advisory role at Stryker while pur-
suing other personal and professional interests. I will serve as a member of the Board of Directors of The
Institute for Medical Technology Innovation and as co-chair of the $100 million fundraising campaign for
support of orthopaedic research within the Orthopaedic Research and Education Foundation. I will also help
guide the activities of the John and Rosemary Brown Family Foundation, which my wife and I have estab-
lished to provide support to deserving individuals and institutions.
While these interests will consume much of my time and attention, Stryker will always remain close to
my heart. I look forward to serving as Chairman while Steve and his team assume the daily management of
the Company. We have built our success on understanding customers’ needs and then exceeding their expec-
tations. While conditions will change over time, our approach positions Stryker well for many years of con-
tinued growth and achievement.
A Message from Stryker Chairman John W. Brown
5
Stryker is creating the future for orthopaedic patients and surgeons through our unwavering focus on the cus-
tomer and accelerated pace of product and procedural innovation. We are building on our strengths in
implant design and manufacturing, orthobiologics and advanced materials. Consequently, we are at the fore-
front of delivering results to an orthopaedic marketplace populated by more demanding, better educated,
often younger patients and by surgeons seeking efficient solutions that provide the best possible outcomes.
Advances in joint replacement
Total joint arthroplasty has changed radically, thanks in large part to Stryker’s leadership. With novel materi-
als, implant designs and wear-reduction technologies, our reconstructive implants have the potential to
improve the longevity and range of motion necessary for younger, more active patients. In addition, new
instrument designs and operative techniques make surgeries shorter and less invasive.
The Triathlon Knee System, which we began selling in late 2004, is a prime example of such progress. The
development process was grounded in market research. Patients emphasized the need for a more natural-
feeling, high-performance implant to meet their expectations for lifestyle recovery. Triathlon features a new
geometry and enhanced mechanics to provide both greater stability and greater range of motion. We paid par-
ticular attention to the ergonomics of the instrumentation, driving operating room efficiency with fewer and
easier-to-use tools of superior quality.
Triathlon joins other advanced knee options in Stryker’s product portfolio, enabling surgeons and their
patients to determine the optimal solution for individual situations. Our established Scorpio and Duracon
knee systems, both offering high-performance insert options, achieved excellent growth in 2004.
Our Trident ceramic-on-ceramic hip system, launched in the United States in 2003, continued its market
expansion in 2004. It has proven itself as the technology of choice for more active, demanding patients
because of the dual benefits of strength and wear resistance. The Accolade hip stem, often paired with the
Trident cup, grew substantially because of its clinical track record in providing joint stability and range of
motion to patients and a simplified procedure to surgeons.
Minimally invasive joint replacement
Stryker’s commitment to responsible science guides our approach to minimally invasive surgery (MIS). In
2004, we continued to train more surgeons on our MIS knee instrumentation and distributed additional
instrument sets throughout the year. With thought-leading surgeons, we are now exploring broad approaches
to MIS hip replacement and developing optimized instrumentation as we await validation from clinical stud-
ies. We are committed to providing implants that will fulfill a variety of approaches to support the right pro-
cedure for each patient.
Creating the Future in Orthopaedics
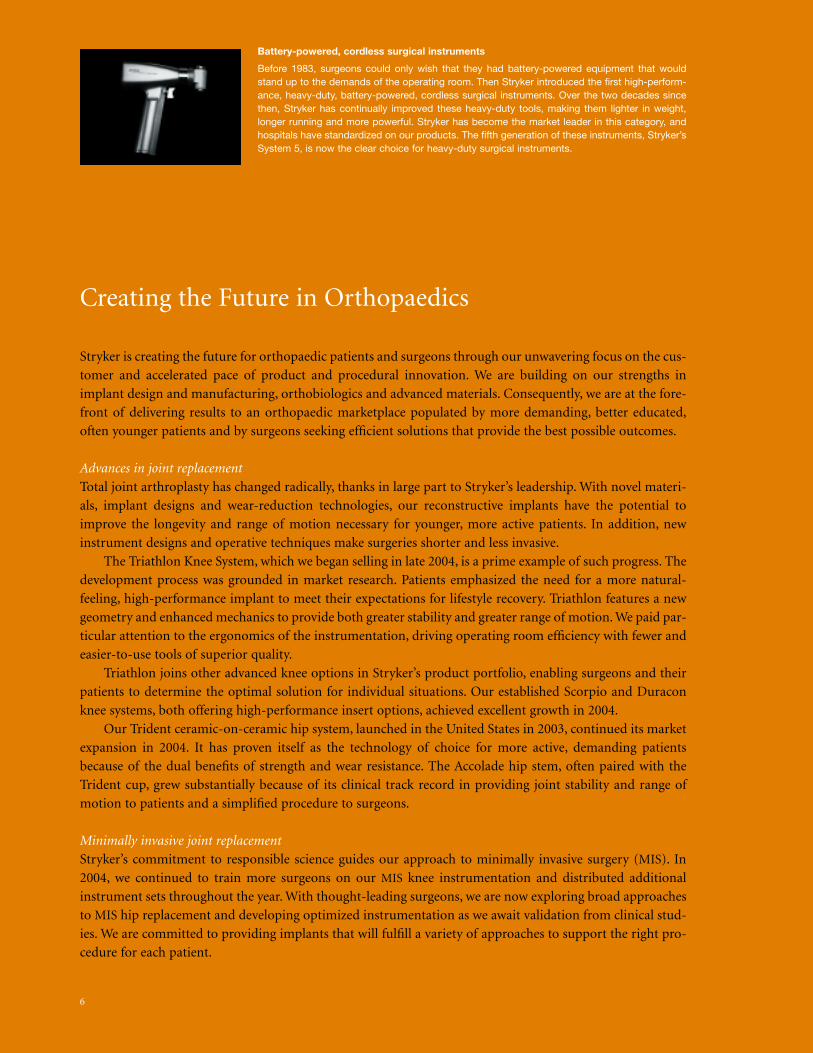
Battery-powered, cordless surgical instruments
Before 1983, surgeons could only wish that they had battery-powered equipment that wouldstand up to the demands of the operating room. Then Stryker introduced the first high-perform-ance, heavy-duty, battery-powered, cordless surgical instruments. Over the two decades sincethen, Stryker has continually improved these heavy-duty tools, making them lighter in weight,longer running and more powerful. Stryker has become the market leader in this category, andhospitals have standardized on our products. The fifth generation of these instruments, Stryker’sSystem 5, is now the clear choice for heavy-duty surgical instruments.
6
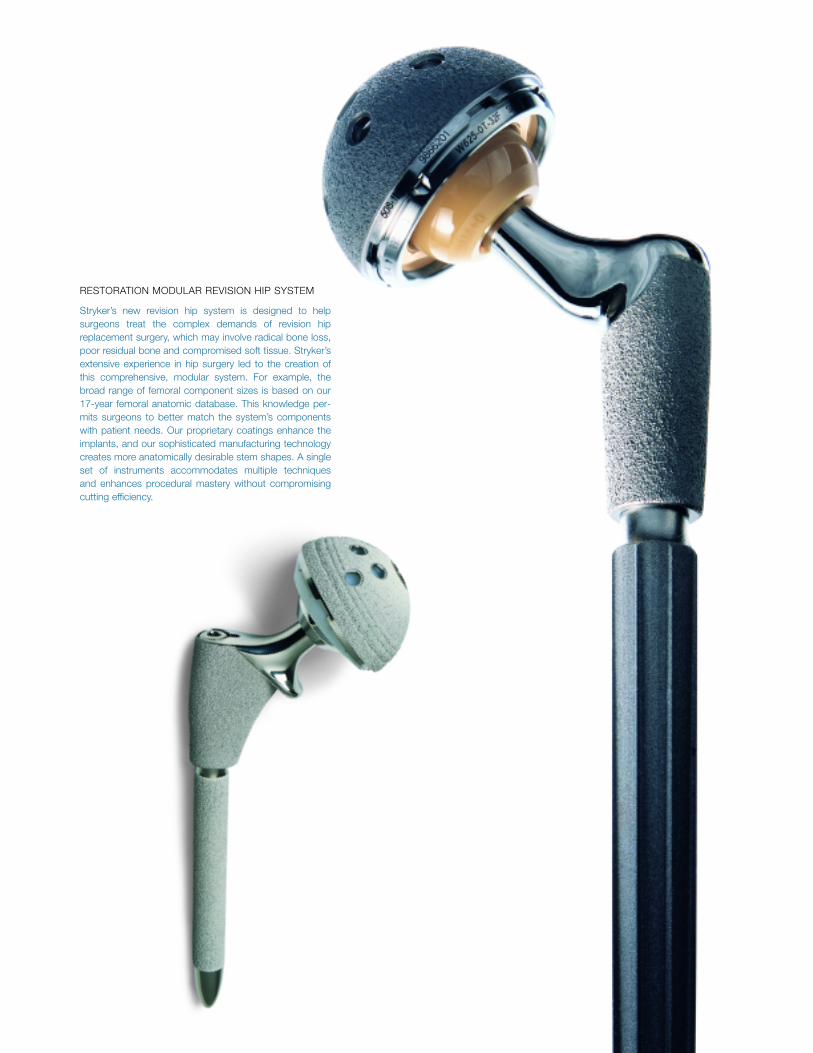
RESTORATION MODULAR REVISION HIP SYSTEM
Stryker’s new revision hip system is designed to help surgeons treat the complex demands of revision hipreplacement surgery, which may involve radical bone loss,poor residual bone and compromised soft tissue. Stryker’sextensive experience in hip surgery led to the creation ofthis comprehensive, modular system. For example, thebroad range of femoral component sizes is based on our17-year femoral anatomic database. This knowledge per-mits surgeons to better match the system’s componentswith patient needs. Our proprietary coatings enhance theimplants, and our sophisticated manufacturing technologycreates more anatomically desirable stem shapes. A singleset of instruments accommodates multiple techniques and enhances procedural mastery without compromisingcutting efficiency.

“I never imagined I would feel this good.”

Always a ChampionKELLY DYER’S STORY
From the very start, Kelly Dyer has been a cham-pion—the first female to play Division I schoolboyhockey, a member of Team USA, and a professionalin men’s minor league hockey. Now 38, she helpsother young women excel in the sport as a sales representative and product manager for ahockey equipment company and as a visiting goaliecoach. When constant hip pain put her on the side-lines, Kelly became a champion patient, conductingonline research and pursuing options with her surgeon in Boston, Massachusetts. “I feel so luckyto have been able to receive Stryker’s Tridentceramic-on-ceramic hip because of its benefits of longevity and range of motion,” Kelly reports. “I’mback to the activities I love—coaching, sailing,yoga—and I can do my job better, too. I never imag-ined I would feel this good.”
Spine surgery
In the late 1970s, those who needed spinal fusion for stability and pain relief faced a major sur-gical procedure without implants, nine days in the hospital and six weeks of bed rest at home.Only 27 percent of patients were able to return to work, compared with the current figure of 75percent. Today, Stryker offers a variety of implant choices for spinal fusion, helping to create better outcomes for patients. In 2004, with the acquisition of SpineCore, Inc., a developer of artificial lumbar and cervical discs, we look forward to providing motion preservation in additionto fusion.
Groundbreaking Surgical Technologies
Stryker has applied innovative thinking to make surgery safer, results more reproducible and outcomes
beyond previous expectations. This drive for improvement has led us to develop breakthrough technologies
to advance surgical specialties and help patients lead healthier, more satisfying lives.
Pioneering surgical navigation
Stryker pioneered the emerging field of image-guided surgical navigation, and we remain the only company
to develop fully integrated navigation hardware and software. Because of unique, two-way communication
between the computer and the surgical instruments, our systems offer the greatest possible precision. In 2004,
we introduced a hip navigation system and an improved knee navigation system. We also furthered the inte-
gration of MIS approaches with navigation for both the knee and the hip.
Commitment to leadership in spine
Spine is the fastest-growing category in orthopaedics, and it is predicted to become the largest by 2008. In
2004, Stryker conclusively demonstrated our commitment to growth and excellence in the spine business.
OASYS, a new posterior cervical fixation system, met with rapid, widespread acceptance among spine sur-
geons. Other successful products, such as Xia, SR 90D and Reflex, continued their strong performance.
Based on the momentum of our spinal fixation products and the high level of interest among leading
spine surgeons, we decided to compete in artificial discs, which hold the promise of motion preservation. This
market is driven by surgeons and patients seeking to restore a normal lifestyle with faster recoveries and less
pain. Artificial discs have a considerable history outside the United States, and we are intent on meeting the
emerging U.S. market with the best of the next-generation products. In 2004, we acquired SpineCore, Inc.,
which is developing what we believe will become leading artificial discs for diseases of both the lumbar and
cervical spine. They incorporate unique features that mimic natural motion and allow surgeons to utilize
improved insertion techniques. We completed enrollment of patients in a pivotal study of the lumbar disc in
2004, and we plan to move the cervical disc into clinical trials in 2005.
Expansion of orthobiologics
OP-1, Stryker’s osteogenic protein product, continues to demonstrate its importance in the regeneration of
bone. During 2004, the 10,000th patient was treated with OP-1. OP-1 Implant, the formulation approved for
difficult-to-heal long-bone fractures in the United States, Europe, Australia and Canada, experienced a dra-
matic increase in sales in 2004. We also expanded into a new application when the U.S. Food and Drug
Administration (FDA) granted Humanitarian Device Exemption (HDE) clearance of the OP-1 Putty formu-
lation for revision spine surgery. This HDE clearance allows us to treat up to 4,000 patients each year and is
a major step toward approval to sell in the broader market. We also completed the first phase of a major
expansion at our Biotech manufacturing plant in New Hampshire to increase the production capacity of both
OP-1 formulations.
10
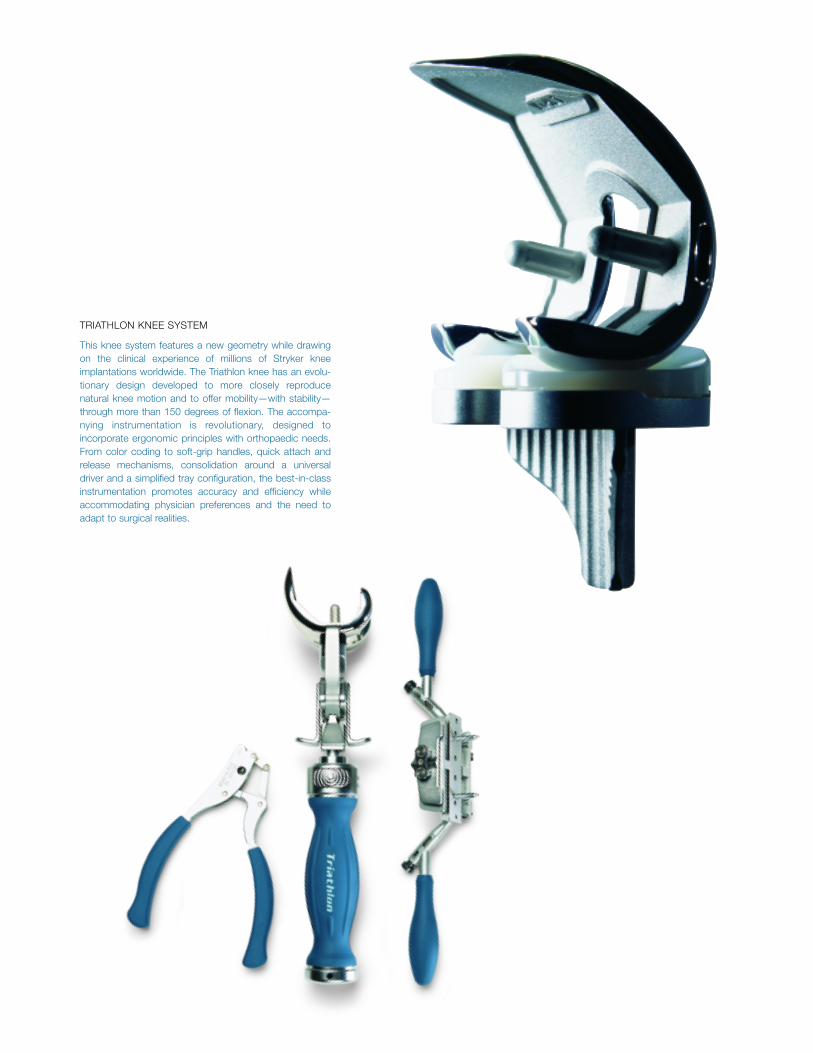
TRIATHLON KNEE SYSTEM
This knee system features a new geometry while drawingon the clinical experience of millions of Stryker kneeimplantations worldwide. The Triathlon knee has an evolu-tionary design developed to more closely reproduce natural knee motion and to offer mobility—with stability—through more than 150 degrees of flexion. The accompa-nying instrumentation is revolutionary, designed toincorporate ergonomic principles with orthopaedic needs.From color coding to soft-grip handles, quick attach andrelease mechanisms, consolidation around a universaldriver and a simplified tray configuration, the best-in-classinstrumentation promotes accuracy and efficiency whileaccommodating physician preferences and the need toadapt to surgical realities.

Reinventing Hip Fracture SurgeryDR. GILBERT TAGLANG’S STORY
Dr. Gilbert Taglang of the Centre de Traumatologieet d’Orthopédie in Strasbourg, France, hasdevoted himself for more than 20 years to chang-ing the paradigm of hip fracture treatment. In theearly 1980s, he collaborated with his mentor, Dr.Arsène Grosse, on the design of Stryker’s Gammanail family. “We were convinced the nailing tech-nique would provide greater stability so that hipfractures could heal more quickly and thoroughly,”says Dr. Taglang. Since the first Gamma nail wasintroduced in 1987, he has conducted an ongoingretrospective study of nearly 4,000 patients whohave received the device. As Dr. Taglang notes,“These long-term studies have helped make theprocedure even more effective and efficient.Traditionally, hip fractures disabled many olderpatients, but now we know they can thrive.”

“We were convinced that hip fractures could heal more quickly and thoroughly.”
Building for Tomorrow
Stryker is always building—developing new products, creating comprehensive systems to fulfill broad needs
and continually improving and extending products. In 2004, we launched the world-class Restoration
Modular Revision Hip System to enthusiastic early feedback. We expect excellent growth to continue for this
product in 2005. Surgeons value this system because it provides a platform for different approaches suited to
various complex situations with one simple implant system and a common set of instruments.
In 2004, we also introduced improved and extended versions of leading products. In trauma, we launched
the Gamma3 Hip Fracture System, a next-generation hip fracture device. Based on 17 years of clinical expe-
rience and more than 900,000 implantations worldwide, the Gamma3 is well suited to MIS procedures. We
also added three components to our T2 Intramedullary Nailing System to address all the key indications for
long-bone nailing. A common instrument platform supports the T2, its stainless steel counterpart S2 and the
Gamma3. Exceptional growth in our nailing segment testifies to the soundness of this approach.
We have taken a similar course with our Universal line of micro implants. Following the success of the
craniomaxillofacial system in 2003, we released the neuro system in the first quarter of 2004 and the distal radius
hand product in the third quarter, both to immediate success. All of these products share core technology.
In 2004, we launched SpinePlex Bone Cement, the first and only cement cleared by the FDA for use in ver-
tebroplasty and other approaches to treat vertebral compression fractures. SpinePlex is based on our indus-
try-leading Simplex P Bone Cement, which has had over 18 million doses implanted during its more than
40-year global clinical history.
Meeting needs worldwide
Long-term success in orthopaedics depends not only on new technologies, but on matching the right products
to the anatomical and lifestyle differences in regional markets. We devote special development efforts to serve
the anatomical and lifestyle requirements in Japan and in 2004 successfully launched the Scorpio NRG knee and
CentPillar hip there. During the past year, we expanded our Exeter hip to new markets, drove sales of OP-1 in
Australia and, in Europe, introduced the Symax V40 hip stem and advanced the use of the Scorpio knee.
Emphasis on execution
Stryker’s executional abilities were demonstrated in many ways in 2004. One special highlight is the European
sales organization, which has achieved outstanding growth for four consecutive years and expanded sales
at several times the market rate in many countries. In the United States, Stryker created dedicated business
units for spine and trauma, resulting in even higher, more rapid growth. Physiotherapy Associates, our U.S.
outpatient rehabilitation services business, grew through both acquisition and start-up and ended the year
with 428 clinics.
Hip fracture surgery
In 1987, when the first generation of Stryker’s Gamma nail was introduced, plates and screwswere the primary method of fixation in hip fracture surgery. The Gamma’s closed-system,intramedullary nailing technology was initially viewed with skepticism, but it soon establisheditself as the gold standard. Now in its third generation, the Gamma system has been widely butunsuccessfully copied. Because it shares an instrumentation platform with our other majortrauma nails, hospitals are able to reduce inventory levels and staff learning time.
14
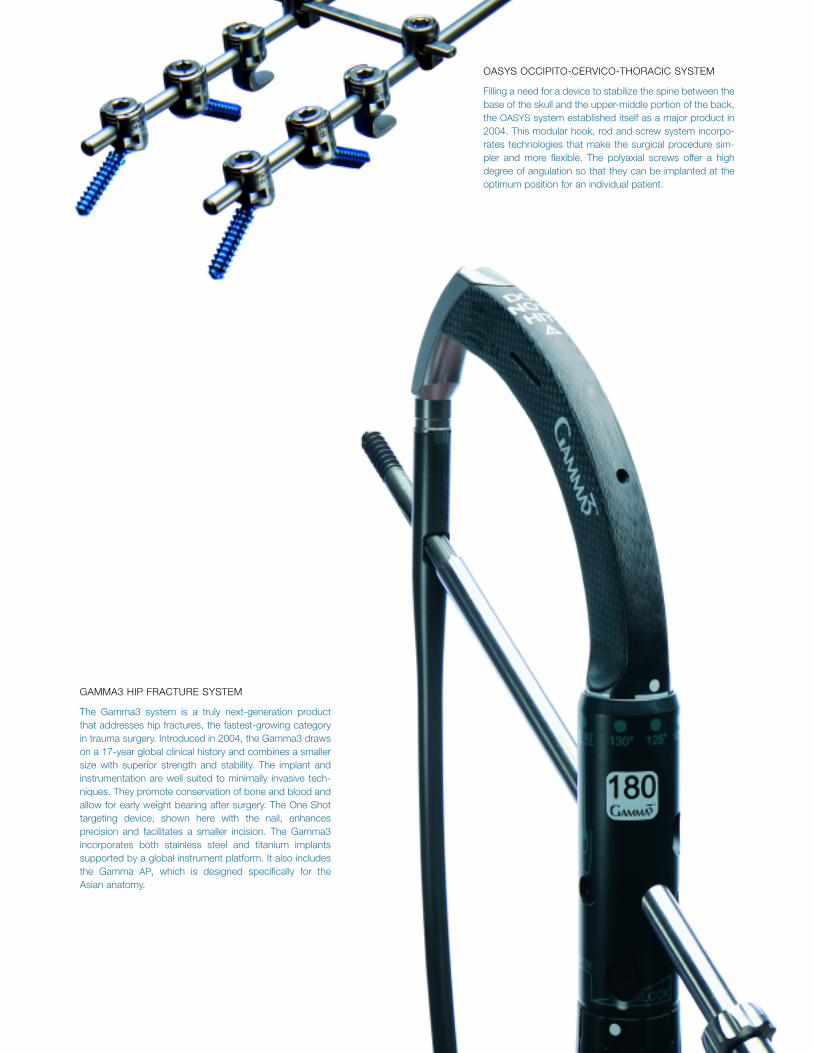
GAMMA3 HIP FRACTURE SYSTEM
The Gamma3 system is a truly next-generation productthat addresses hip fractures, the fastest-growing categoryin trauma surgery. Introduced in 2004, the Gamma3 drawson a 17-year global clinical history and combines a smallersize with superior strength and stability. The implant andinstrumentation are well suited to minimally invasive tech-niques. They promote conservation of bone and blood andallow for early weight bearing after surgery. The One Shottargeting device, shown here with the nail, enhances precision and facilitates a smaller incision. The Gamma3incorporates both stainless steel and titanium implantssupported by a global instrument platform. It also includesthe Gamma AP, which is designed specifically for the Asian anatomy.
OASYS OCCIPITO-CERVICO-THORACIC SYSTEM
Filling a need for a device to stabilize the spine between thebase of the skull and the upper-middle portion of the back,the OASYS system established itself as a major product in2004. This modular hook, rod and screw system incorpo-rates technologies that make the surgical procedure sim-pler and more flexible. The polyaxial screws offer a highdegree of angulation so that they can be implanted at theoptimum position for an individual patient.

“I’m happy to be able to do the things that mean the most to me.”

Making Clinical HistoryAARON WESTON’S STORY
As Aaron Weston walks through the woods nearhis home in rural Louisiana for a day of fishing orhunting, he often thinks how different his lifewould be if he had not received an OP-1 Implant.After his left leg was shattered by a car that hadrun a stop sign, he endured 17 surgeries, includ-ing an unsuccessful bone graft. In 1991, on thevery day he was scheduled to have his leg ampu-tated, Aaron learned that a clinical trial of OP-1was starting, and he became the first patient everto receive the implant. Within a month, his legshowed bone regeneration, and today, more than13 years later, the bone is still strong and healthy.Aaron counts his blessings, saying, “I love life.Whatever happens, it’s an adventure, and I’mhappy to be able to do the things that mean themost to me.”

Today, hospitals must create a sustainable competitive advantage in order to thrive. They must drive efficien-
cies up and costs down. Product and service standardization are becoming common. This is an environment
where Stryker can add immense value because of our broad spectrum of capabilities, our innovation and our
ability to execute. Offering best-in-class medical and surgical products is only one aspect of this process. As
an award-winning manufacturing company, we bring our experience in supply chain management to help our
customers create efficiencies and provide superior services. We also have the ability to approach hospitals as
“one Stryker,” drawing on multiple divisions to meet an institution’s needs and goals. We believe that few
other companies can provide this breadth and depth of resources to hospitals.
Redefining the infrastructure of the OR
We not only provide market-leading powered surgical instruments, but we are fundamentally changing oper-
ating room infrastructures with advanced control and communications platforms. These products enable
hospitals to take a major step in process improvements today and open up new capabilities for the future.
In 2004, Stryker introduced a foundation product—the CORE (Consolidated Operating Room
Equipment) console. This powered instrument console is the centerpiece of our micro-powered instrument
platform, providing an integrated, centrally controlled environment that promotes safe and economical sur-
gical practice. We also launched a highly successful new video platform with the 1088 High Definition
Camera, the first fully digital, high-definition, progressive-scan medical video camera. The latest generation
of our SIDNE Voice Activation System provides centralized control over these and numerous other devices.
Integration and specialization with i-Suites
For over a decade, Stryker has pioneered and refined the concept of the fully integrated operating room,
or i-Suite, which combines centralized control and connectivity within various surgical specialties. Stryker
i-Suites serve the needs of endoscopy, cardiology and orthopaedic specialties. Integration of the Stryker
Navigation system into the suites enhances their capabilities while providing additional functionality for
neurosurgery.
During the past year, we strengthened our position further by entering the boom and light business with
best-in-class products, giving us the ability to control all i-Suite installation processes internally with one
point of contact for our customers. Our surgical lights now contain an internal camera for documenting pro-
cedures for teaching or consultation purposes. Additionally, we further customized our SwitchPoint Infinity
control device and added a remote servicing capability.
Integrating biologics into orthopaedics
Since the discovery that a class of naturally occurring bone morphogenetic proteins (BMPs)induced new bone formation, many hoped that biologics could enhance orthopaedic solutionsand outcomes. But turning that idea into reality required Stryker’s vision and perseverance. In1985, Stryker signed a long-term research agreement with Creative Biomolecules, the only com-pany then pursuing research on recombinant versions of BMPs. In 1991, we started our Biotechdivision to work with Creative Biomolecules and conduct a clinical trial of OP-1, our proprietaryversion of BMP-7. In 1998, we purchased the manufacturing rights and facilities for OP-1. Today,OP-1 has received HDE clearance from the FDA for two indications, and sales of the product areexpanding around the world.
Creating the Future in the Hospital
18
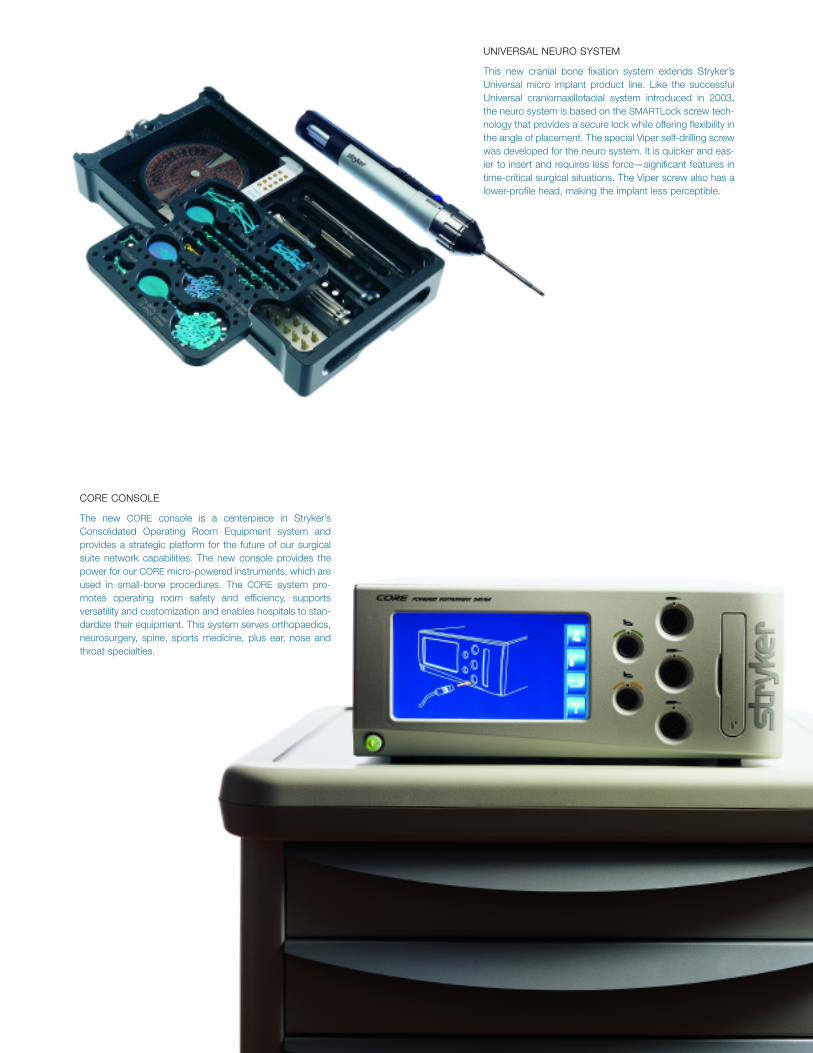
UNIVERSAL NEURO SYSTEM
This new cranial bone fixation system extends Stryker’sUniversal micro implant product line. Like the successfulUniversal craniomaxillofacial system introduced in 2003,the neuro system is based on the SMARTLock screw tech-nology that provides a secure lock while offering flexibility inthe angle of placement. The special Viper self-drilling screwwas developed for the neuro system. It is quicker and eas-ier to insert and requires less force—significant features intime-critical surgical situations. The Viper screw also has alower-profile head, making the implant less perceptible.
CORE CONSOLE
The new CORE console is a centerpiece in Stryker’sConsolidated Operating Room Equipment system and provides a strategic platform for the future of our surgicalsuite network capabilities. The new console provides thepower for our CORE micro-powered instruments, which areused in small-bone procedures. The CORE system pro-motes operating room safety and efficiency, supports versatility and customization and enables hospitals to stan-dardize their equipment. This system serves orthopaedics,neurosurgery, spine, sports medicine, plus ear, nose andthroat specialties.
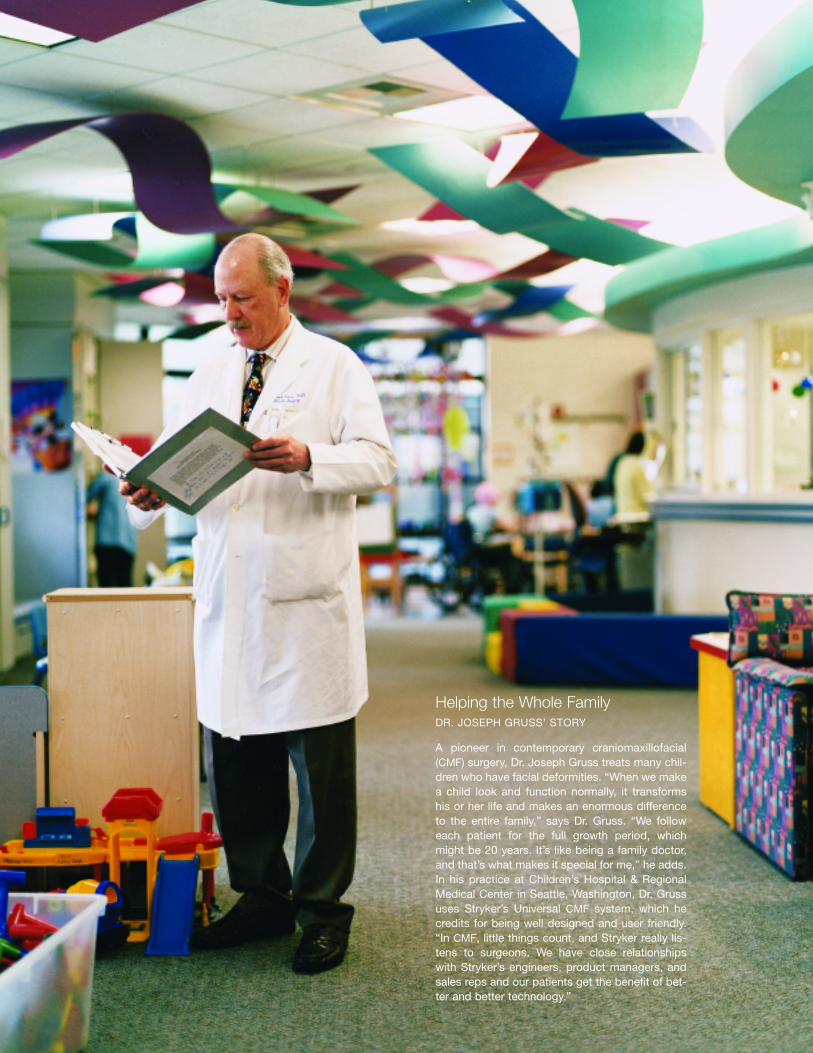
Helping the Whole FamilyDR. JOSEPH GRUSS’ STORY
A pioneer in contemporary craniomaxillofacial(CMF) surgery, Dr. Joseph Gruss treats many chil-dren who have facial deformities. “When we makea child look and function normally, it transformshis or her life and makes an enormous differenceto the entire family,” says Dr. Gruss. “We followeach patient for the full growth period, whichmight be 20 years. It’s like being a family doctor,and that’s what makes it special for me,” he adds.In his practice at Children’s Hospital & RegionalMedical Center in Seattle, Washington, Dr. Grussuses Stryker’s Universal CMF system, which hecredits for being well designed and user friendly.“In CMF, little things count, and Stryker really lis-tens to surgeons. We have close relationshipswith Stryker’s engineers, product managers, andsales reps and our patients get the benefit of bet-ter and better technology.”

“We can transform a child’s life and make an enormous difference to the entire family.”
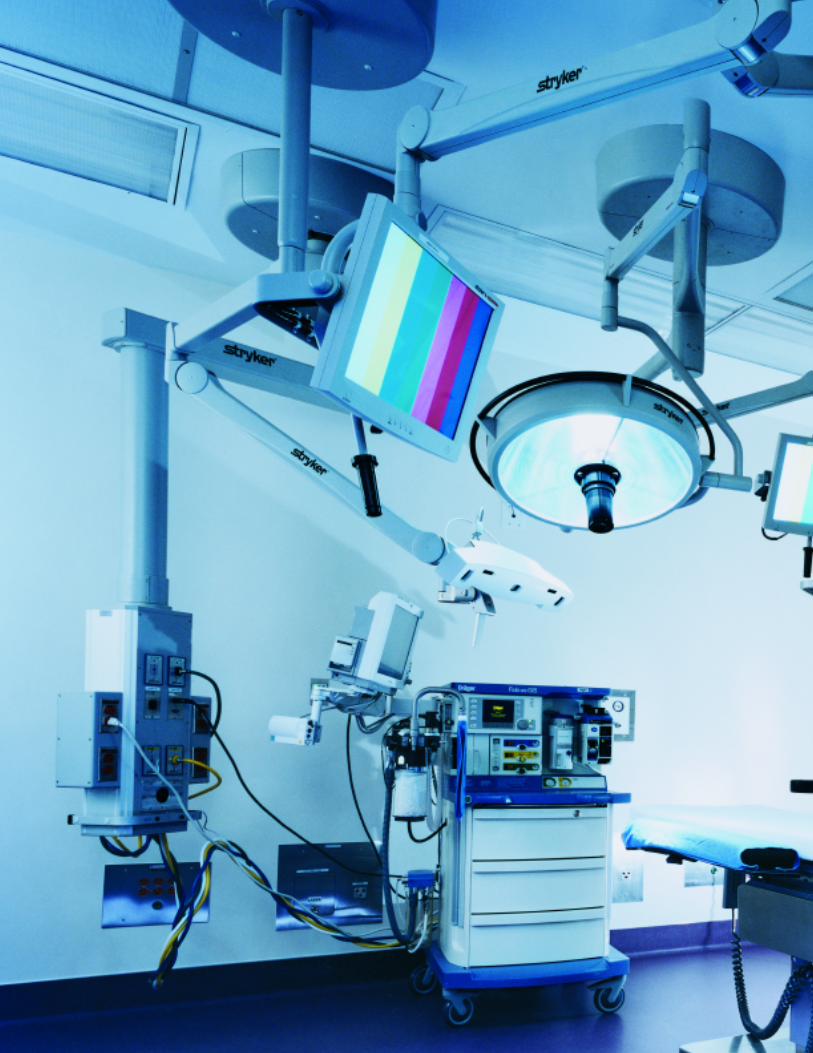
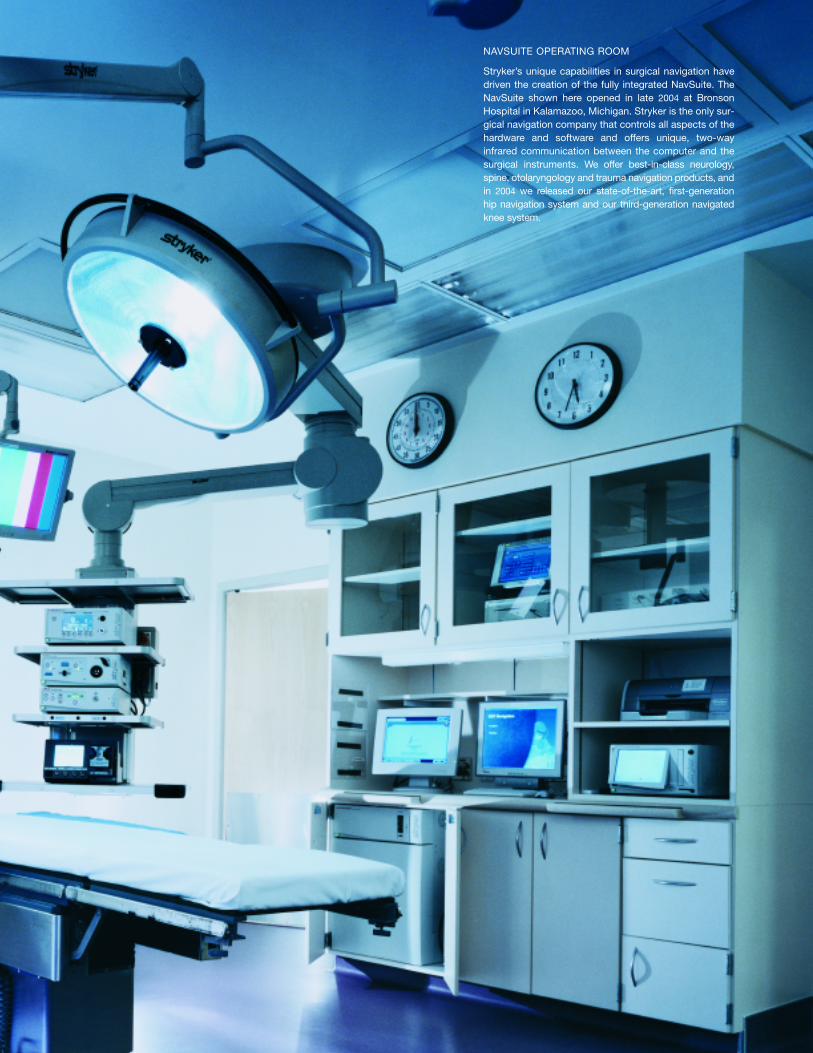
NAVSUITE OPERATING ROOM
Stryker’s unique capabilities in surgical navigation havedriven the creation of the fully integrated NavSuite. TheNavSuite shown here opened in late 2004 at BronsonHospital in Kalamazoo, Michigan. Stryker is the only sur-gical navigation company that controls all aspects of thehardware and software and offers unique, two-wayinfrared communication between the computer and thesurgical instruments. We offer best-in-class neurology,spine, otolaryngology and trauma navigation products, andin 2004 we released our state-of-the-art, first-generationhip navigation system and our third-generation navigatedknee system.
New Ways to Serve Hospitals
In addition to infrastructure projects, Stryker helps hospitals manage more effectively in a multitude of other
ways that cumulatively have a major impact on efficiency, utilization and safety. Ultimately, we enhance staff
satisfaction, long-term institutional success and patient outcomes.
Our orthopaedic implant divisions have focused significant effort toward improving surgical instrumen-
tation. For example, with redesigned instruments, existing implants can be used in minimally invasive proce-
dures. Instrument simplification programs can assist hospitals in making substantial reductions in inventory
and cost. Revolutionary instrumentation supports both the new Triathlon and the established Scorpio knees.
With this instrumentation, Stryker has pioneered Orthonomics—the application of ergonomic principles to
orthopaedic instruments. The resulting tools promote safety and efficiency while making techniques easier to
learn and reproduce.
There are many examples of how Stryker’s products help hospitals reduce inventory, enhance safety and
streamline procedures. Our new Universal Distal Radius hand system can replace three different hand systems
made by three different companies, and it shares several common instruments with our other Universal micro
implant systems. In addition, we now offer three levels of the Neptune Waste Management System for fluid
waste and smoke evacuation to promote OR safety and suit varied requirements. The new Formula Shaver
offers high power with precision cutting to expedite arthroscopy procedures.
Solutions to new patient handling realities
Stryker is a formidable competitor in the patient handling marketplace not only because of our technology,
but because we focus on the patient, the caregiver and the hospital. We have been quick to address new reali-
ties in the health-care environment. The nursing shortage in North America continues, and the average nurse
is now over age 40 and more susceptible to back injury. Patients have grown progressively older and heavier,
and they arrive at the hospital in a less ambulatory state than ever before. Stryker is helping hospitals deal with
these realities with the newly introduced M-Series stretcher, the only hydraulic stretcher in the marketplace
with a 700-pound weight capacity, three options for steering and other features that make it safer and more
efficient. Such products are designed to enable nurses to practice longer and patients to retain their dignity—
qualities that are evident in all segments of our patient handling business, including critical care, maternity
and medical-surgical beds, as well as emergency medical services cots and evacuation chairs.
Looking ahead
Stryker’s commitment to leadership in orthopaedics and in the hospital is backed by the strength of 14 divi-
sions working both individually and together to deliver exceptional results for our customers, patients and
shareholders. We will use our unique combination of assets and talents to create an even better future.
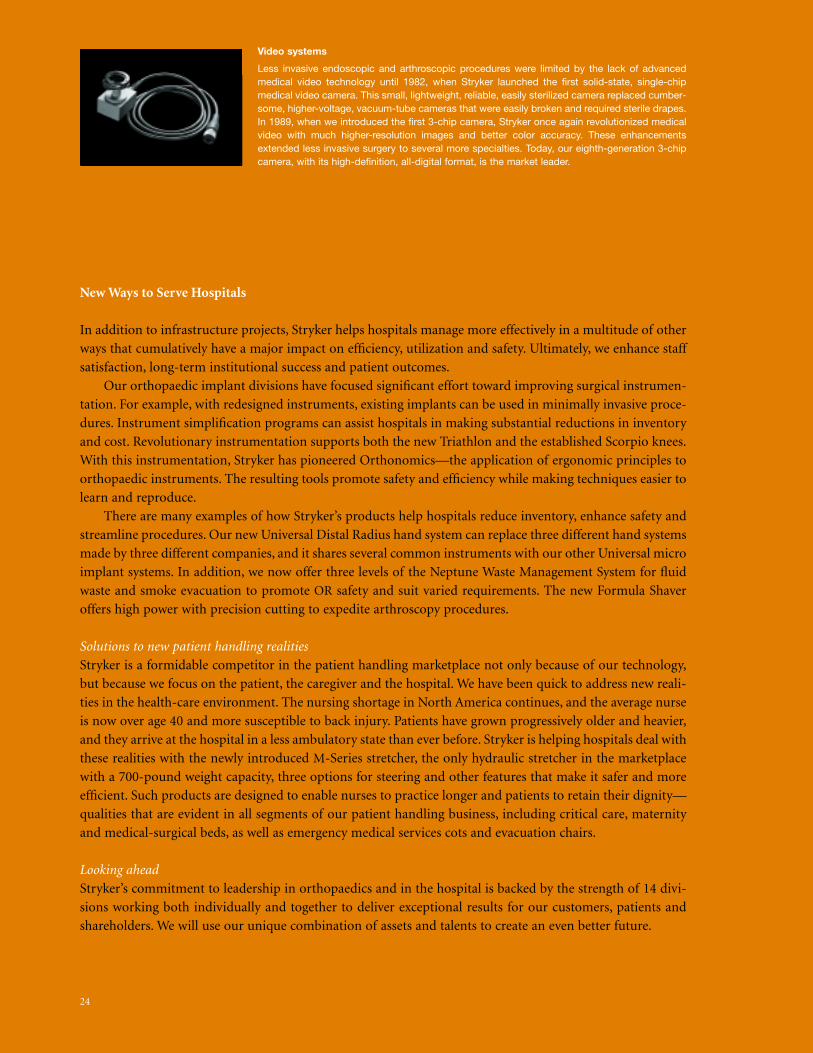
Video systems
Less invasive endoscopic and arthroscopic procedures were limited by the lack of advancedmedical video technology until 1982, when Stryker launched the first solid-state, single-chipmedical video camera. This small, lightweight, reliable, easily sterilized camera replaced cumber-some, higher-voltage, vacuum-tube cameras that were easily broken and required sterile drapes.In 1989, when we introduced the first 3-chip camera, Stryker once again revolutionized medicalvideo with much higher-resolution images and better color accuracy. These enhancementsextended less invasive surgery to several more specialties. Today, our eighth-generation 3-chipcamera, with its high-definition, all-digital format, is the market leader.
24
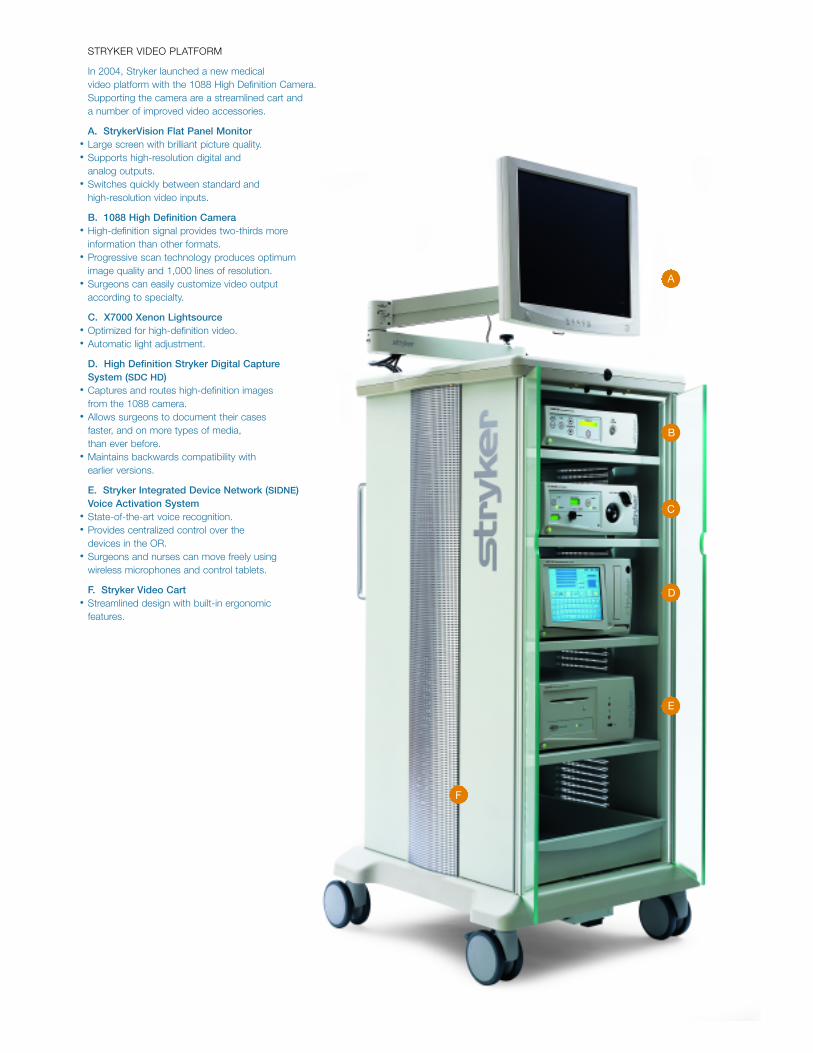
STRYKER VIDEO PLATFORM
In 2004, Stryker launched a new medical video platform with the 1088 High Definition Camera.Supporting the camera are a streamlined cart and a number of improved video accessories.
A. StrykerVision Flat Panel Monitor• Large screen with brilliant picture quality.• Supports high-resolution digital and
analog outputs.• Switches quickly between standard and
high-resolution video inputs.
B. 1088 High Definition Camera• High-definition signal provides two-thirds more
information than other formats.• Progressive scan technology produces optimum
image quality and 1,000 lines of resolution.• Surgeons can easily customize video output
according to specialty.
C. X7000 Xenon Lightsource• Optimized for high-definition video.• Automatic light adjustment.
D. High Definition Stryker Digital Capture System (SDC HD)
• Captures and routes high-definition images from the 1088 camera.
• Allows surgeons to document their cases faster, and on more types of media, than ever before.
• Maintains backwards compatibility with earlier versions.
E. Stryker Integrated Device Network (SIDNE) Voice Activation System
• State-of-the-art voice recognition.• Provides centralized control over the
devices in the OR.• Surgeons and nurses can move freely using
wireless microphones and control tablets.
F. Stryker Video Cart• Streamlined design with built-in ergonomic
features.
B
A
C
D
E
F

“I just want to take care ofmy patients.”
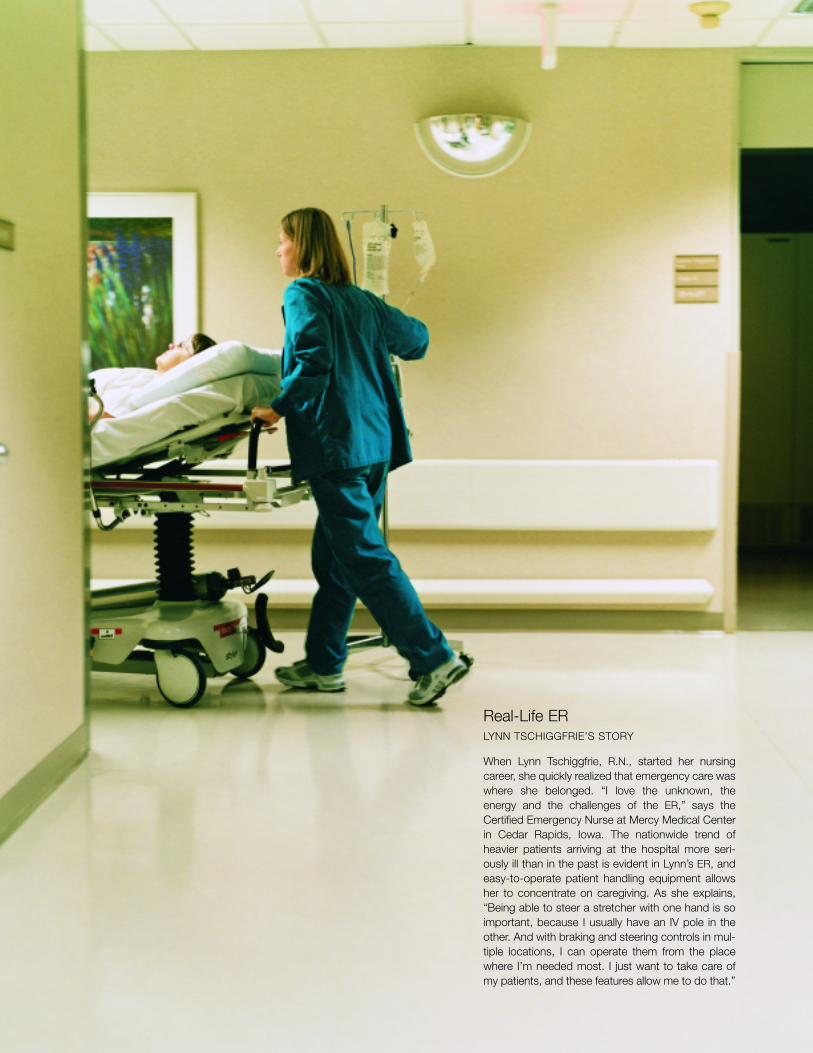
Real-Life ERLYNN TSCHIGGFRIE’S STORY
When Lynn Tschiggfrie, R.N., started her nursingcareer, she quickly realized that emergency care waswhere she belonged. “I love the unknown, theenergy and the challenges of the ER,” says theCertified Emergency Nurse at Mercy Medical Centerin Cedar Rapids, Iowa. The nationwide trend ofheavier patients arriving at the hospital more seri-ously ill than in the past is evident in Lynn’s ER, andeasy-to-operate patient handling equipment allowsher to concentrate on caregiving. As she explains,“Being able to steer a stretcher with one hand is soimportant, because I usually have an IV pole in theother. And with braking and steering controls in mul-tiple locations, I can operate them from the placewhere I’m needed most. I just want to take care ofmy patients, and these features allow me to do that.”
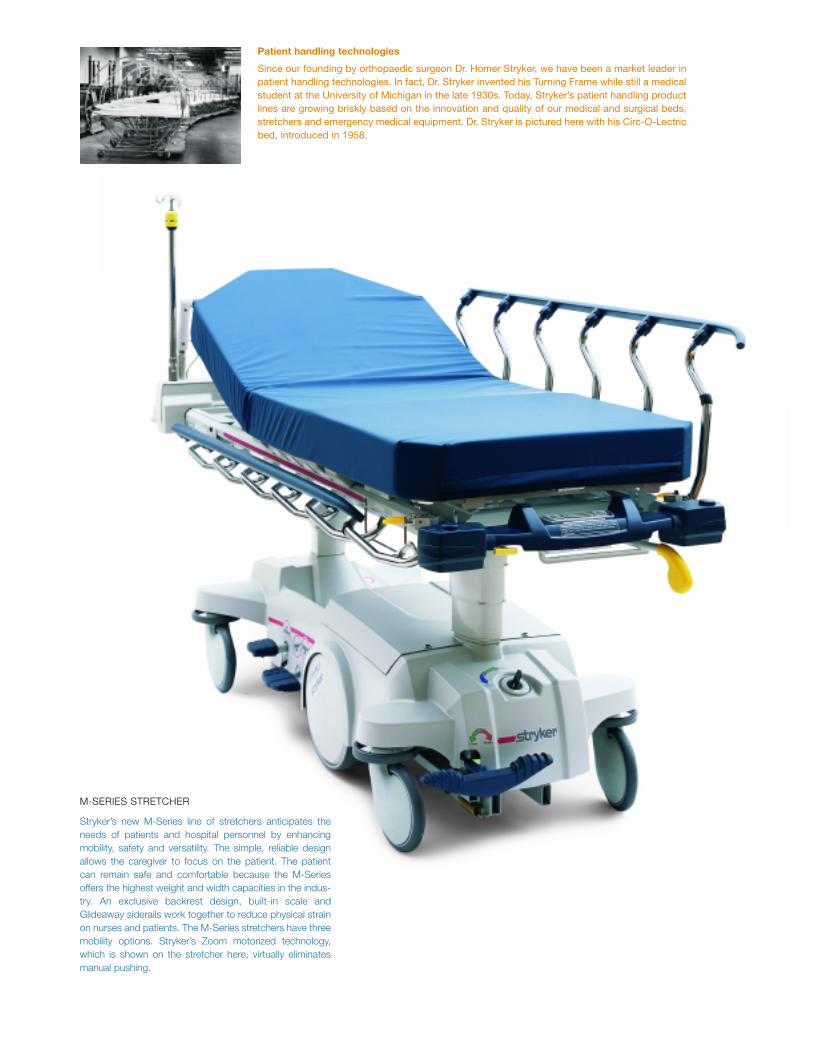
Patient handling technologies
Since our founding by orthopaedic surgeon Dr. Homer Stryker, we have been a market leader inpatient handling technologies. In fact, Dr. Stryker invented his Turning Frame while still a medicalstudent at the University of Michigan in the late 1930s. Today, Stryker’s patient handling productlines are growing briskly based on the innovation and quality of our medical and surgical beds,stretchers and emergency medical equipment. Dr. Stryker is pictured here with his Circ-O-Lectricbed, introduced in 1958.
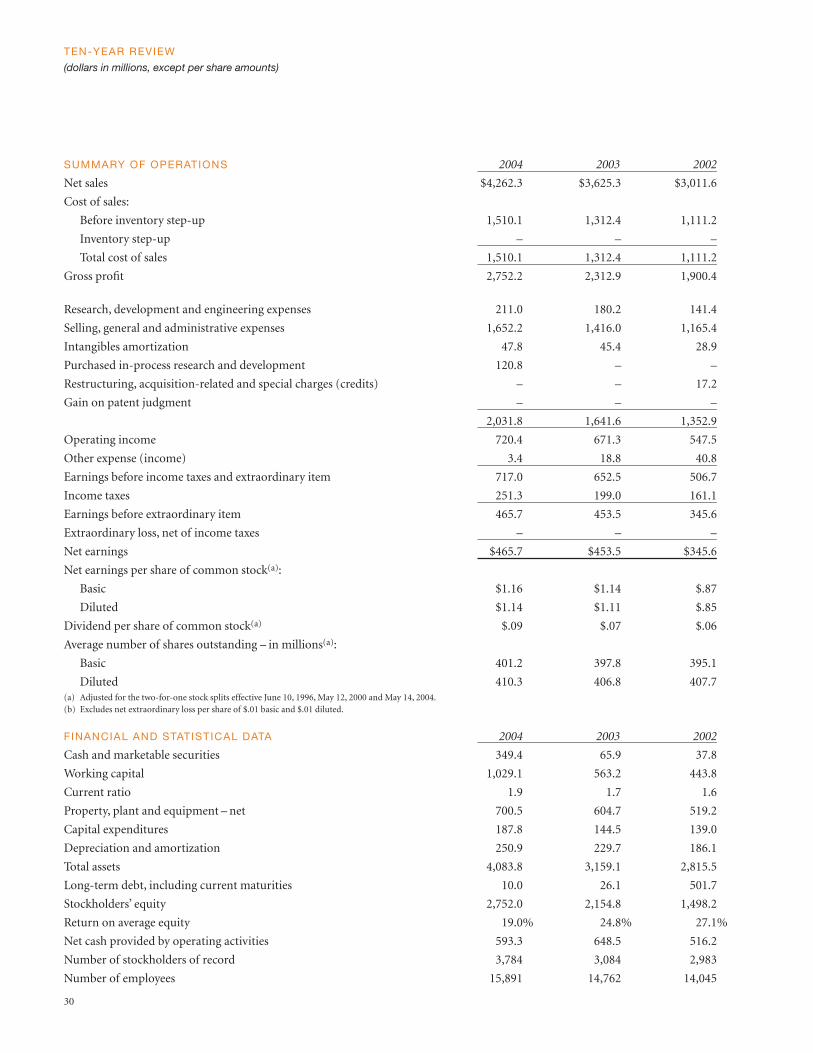
M-SERIES STRETCHER
Stryker’s new M-Series line of stretchers anticipates theneeds of patients and hospital personnel by enhancingmobility, safety and versatility. The simple, reliable designallows the caregiver to focus on the patient. The patientcan remain safe and comfortable because the M-Seriesoffers the highest weight and width capacities in the indus-try. An exclusive backrest design, built-in scale andGlideaway siderails work together to reduce physical strainon nurses and patients. The M-Series stretchers have threemobility options. Stryker’s Zoom motorized technology,which is shown on the stretcher here, virtually eliminatesmanual pushing.

FINANCIAL REVIEW
30 Ten-Year Review
32 Management’s Discussion and Analysis of
Financial Condition and Results of Operations
43 Management Report on Internal Control Over
Financial Reporting
44 Report of Independent Registered Public Accounting Firm
on Internal Control Over Financial Reporting
45 Report of Independent Registered Public Accounting
Firm on Financial Statements
46 Consolidated Balance Sheets
47 Consolidated Statements of Earnings
48 Consolidated Statements of Stockholders’ Equity
49 Consolidated Statements of Cash Flows
50 Notes to Consolidated Financial Statements
70 Summary of Quarterly Data (Unaudited)
71 Board of Directors and Corporate Officers
72 Operating Divisions and Other Information
FINANCIAL REVIEW
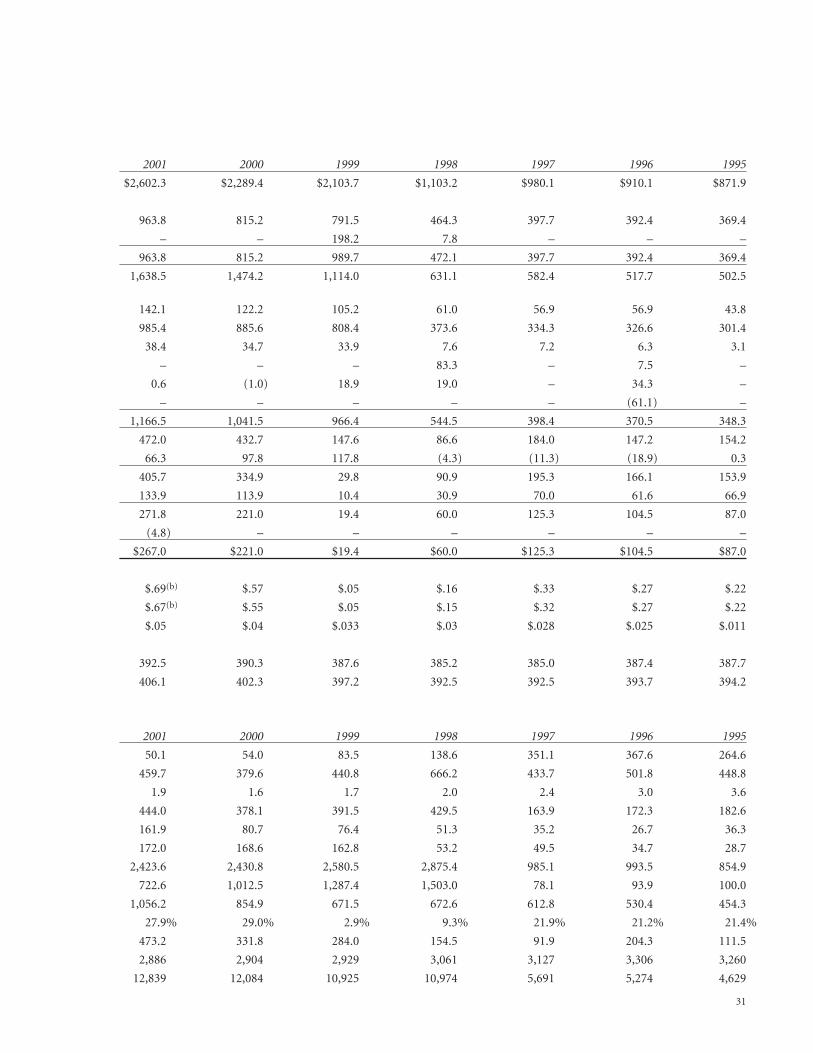
SUMMARY OF OPERATIONS 2004 2003 2002
Net sales $4,262.3 $3,625.3 $3,011.6
Cost of sales:
Before inventory step-up 1,510.1 1,312.4 1,111.2
Inventory step-up – – – – –
Total cost of sales 1,510.1 1,312.4 1,111.2
Gross profit 2,752.2 2,312.9 1,900.4
Research, development and engineering expenses 211.0 180.2 141.4
Selling, general and administrative expenses 1,652.2 1,416.0 1,165.4
Intangibles amortization 47.8 45.4 28.9
Purchased in-process research and development 120.8 – – – – –
Restructuring, acquisition-related and special charges (credits) – – 17.2
Gain on patent judgment – – – – – – – –
2,031.8 1,641.6 1,352.9
Operating income 720.4 671.3 547.5
Other expense (income) 3.4 18.8 40.8
Earnings before income taxes and extraordinary item 717.0 652.5 506.7
Income taxes 251.3 199.0 161.1
Earnings before extraordinary item 465.7 453.5 345.6
Extraordinary loss, net of income taxes – – –
Net earnings $465.7 $453.5 $345.6
Net earnings per share of common stock(a):
Basic $1.16 $1.14 $.87
Diluted $1.14 $1.11 $.85
Dividend per share of common stock(a) $.09 $.07 $.06
Average number of shares outstanding – in millions(a):
Basic 401.2 397.8 395.1
Diluted 410.3 406.8 407.7 (a) Adjusted for the two-for-one stock splits effective June 10, 1996, May 12, 2000 and May 14, 2004.(b) Excludes net extraordinary loss per share of $.01 basic and $.01 diluted.
FINANCIAL AND STATISTICAL DATA 2004 2003 2002
Cash and marketable securities 349.4 65.9 37.8
Working capital 1,029.1 563.2 443.8
Current ratio 1.9 1.7 1.6
Property, plant and equipment – net 700.5 604.7 519.2
Capital expenditures 187.8 144.5 139.0
Depreciation and amortization 250.9 229.7 186.1
Total assets 4,083.8 3,159.1 2,815.5
Long-term debt, including current maturities 10.0 26.1 501.7
Stockholders’ equity 2,752.0 2,154.8 1,498.2
Return on average equity 19.0% 24.8% 27.1%
Net cash provided by operating activities 593.3 648.5 516.2
Number of stockholders of record 3,784 3,084 2,983
Number of employees 15,891 14,762 14,045
TEN-YEAR REVIEW
(dollars in millions, except per share amounts)
30
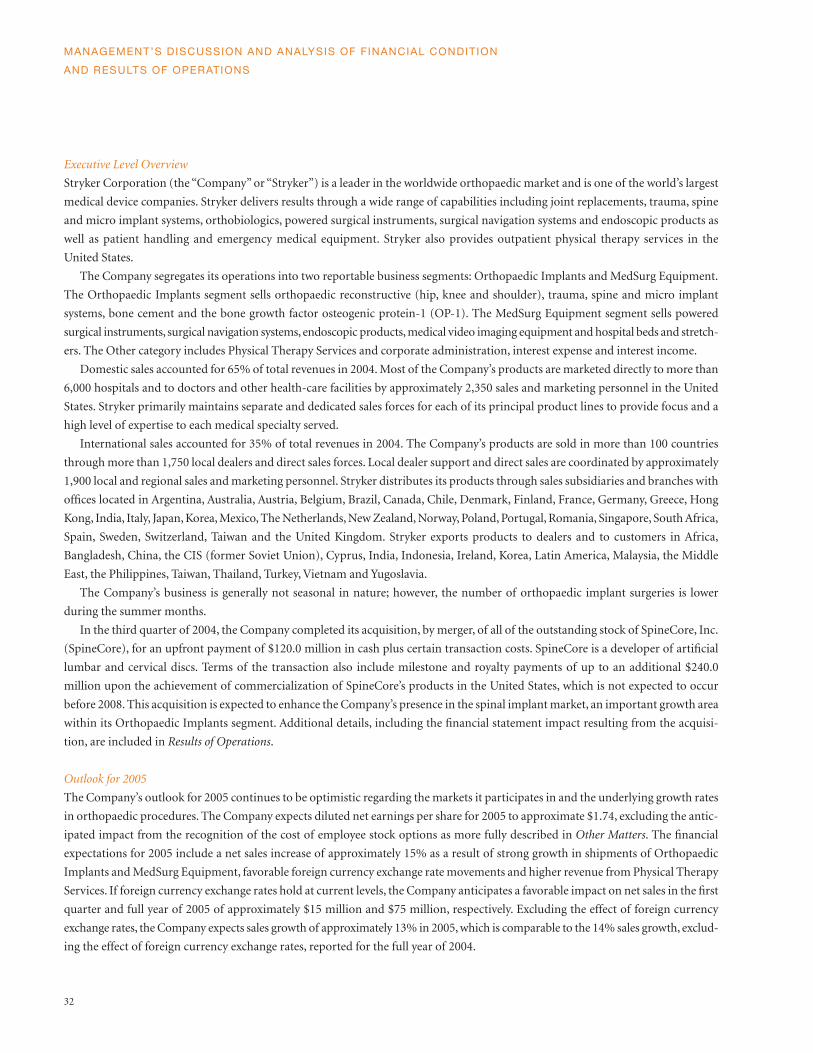
2001 2000 1999 1998 1997 1996 1995
$2,602.3 $2,289.4 $2,103.7 $1,103.2 $980.1 $910.1 $871.9
963.8 815.2 791.5 464.3 397.7 392.4 369.4
– – 198.2 7.8 – – –
963.8 815.2 989.7 472.1 397.7 392.4 369.4
fi 1,638.5 1,474.2 1,114.0 631.1 582.4 517.7 502.5
142.1 122.2 105.2 61.0 56.9 56.9 43.8
985.4 885.6 808.4 373.6 334.3 326.6 301.4
38.4 34.7 33.9 7.6 7.2 6.3 3.1
– – – 83.3 – 7.5 –
0.6 (1.0) 18.9 19.0 – 34.3 –
– – – – – (61.1) –
1,166.5 1,041.5 966.4 544.5 398.4 370.5 348.3
472.0 432.7 147.6 86.6 184.0 147.2 154.2
66.3 97.8 117.8 (4.3) (11.3) (18.9) 0.3
405.7 334.9 29.8 90.9 195.3 166.1 153.9
133.9 113.9 10.4 30.9 70.0 61.6 66.9
271.8 221.0 19.4 60.0 125.3 104.5 87.0
(4.8) – – – – – –
$267.0 $221.0 $19.4 $60.0 $125.3 $104.5 $87.0
$.69(b) $.57 $.05 $.16 $.33 $.27 $.22
$.67(b) $.55 $.05 $.15 $.32 $.27 $.22
$.05 $.04 $.033 $.03 $.028 $.025 $.011
392.5 390.3 387.6 385.2 385.0 387.4 387.7
406.1 402.3 397.2 392.5 392.5 393.7 394.2
2001 2000 1999 1998 1997 1996 1995
50.1 54.0 83.5 138.6 351.1 367.6 264.6
459.7 379.6 440.8 666.2 433.7 501.8 448.8
1.9 1.6 1.7 2.0 2.4 3.0 3.6
444.0 378.1 391.5 429.5 163.9 172.3 182.6
161.9 80.7 76.4 51.3 35.2 26.7 36.3
172.0 168.6 162.8 53.2 49.5 34.7 28.7
2,423.6 2,430.8 2,580.5 2,875.4 985.1 993.5 854.9
722.6 1,012.5 1,287.4 1,503.0 78.1 93.9 100.0
1,056.2 854.9 671.5 672.6 612.8 530.4 454.3
27.9% 29.0% 2.9% 9.3% 21.9% 21.2% 21.4%
473.2 331.8 284.0 154.5 91.9 204.3 111.5
2,886 2,904 2,929 3,061 3,127 3,306 3,260
12,839 12,084 10,925 10,974 5,691 5,274 4,629
31
32
Executive Level Overview
Stryker Corporation (the “Company” or “Stryker”) is a leader in the worldwide orthopaedic market and is one of the world’s largest
medical device companies. Stryker delivers results through a wide range of capabilities including joint replacements, trauma, spine
and micro implant systems, orthobiologics, powered surgical instruments, surgical navigation systems and endoscopic products as
well as patient handling and emergency medical equipment. Stryker also provides outpatient physical therapy services in the
United States.
The Company segregates its operations into two reportable business segments: Orthopaedic Implants and MedSurg Equipment.
The Orthopaedic Implants segment sells orthopaedic reconstructive (hip, knee and shoulder), trauma, spine and micro implant
systems, bone cement and the bone growth factor osteogenic protein-1 (OP-1). The MedSurg Equipment segment sells powered
surgical instruments, surgical navigation systems, endoscopic products, medical video imaging equipment and hospital beds and stretch-
ers. The Other category includes Physical Therapy Services and corporate administration, interest expense and interest income.
Domestic sales accounted for 65% of total revenues in 2004. Most of the Company’s products are marketed directly to more than
6,000 hospitals and to doctors and other health-care facilities by approximately 2,350 sales and marketing personnel in the United
States. Stryker primarily maintains separate and dedicated sales forces for each of its principal product lines to provide focus and a
high level of expertise to each medical specialty served.
International sales accounted for 35% of total revenues in 2004. The Company’s products are sold in more than 100 countries
through more than 1,750 local dealers and direct sales forces. Local dealer support and direct sales are coordinated by approximately
1,900 local and regional sales and marketing personnel. Stryker distributes its products through sales subsidiaries and branches with
offices located in Argentina, Australia, Austria, Belgium, Brazil, Canada, Chile, Denmark, Finland, France, Germany, Greece, Hong
Kong, India, Italy, Japan, Korea, Mexico, The Netherlands, New Zealand, Norway, Poland, Portugal, Romania, Singapore, South Africa,
Spain, Sweden, Switzerland, Taiwan and the United Kingdom. Stryker exports products to dealers and to customers in Africa,
Bangladesh, China, the CIS (former Soviet Union), Cyprus, India, Indonesia, Ireland, Korea, Latin America, Malaysia, the Middle
East, the Philippines, Taiwan, Thailand, Turkey, Vietnam and Yugoslavia.
The Company’s business is generally not seasonal in nature; however, the number of orthopaedic implant surgeries is lower
during the summer months.
In the third quarter of 2004, the Company completed its acquisition, by merger, of all of the outstanding stock of SpineCore, Inc.
(SpineCore), for an upfront payment of $120.0 million in cash plus certain transaction costs. SpineCore is a developer of artificial
lumbar and cervical discs. Terms of the transaction also include milestone and royalty payments of up to an additional $240.0
million upon the achievement of commercialization of SpineCore’s products in the United States, which is not expected to occur
before 2008. This acquisition is expected to enhance the Company’s presence in the spinal implant market, an important growth area
within its Orthopaedic Implants segment. Additional details, including the financial statement impact resulting from the acquisi-
tion, are included in Results of Operations.
Outlook for 2005
The Company’s outlook for 2005 continues to be optimistic regarding the markets it participates in and the underlying growth rates
in orthopaedic procedures. The Company expects diluted net earnings per share for 2005 to approximate $1.74, excluding the antic-
ipated impact from the recognition of the cost of employee stock options as more fully described in Other Matters. The financial
expectations for 2005 include a net sales increase of approximately 15% as a result of strong growth in shipments of Orthopaedic
Implants and MedSurg Equipment, favorable foreign currency exchange rate movements and higher revenue from Physical Therapy
Services. If foreign currency exchange rates hold at current levels, the Company anticipates a favorable impact on net sales in the first
quarter and full year of 2005 of approximately $15 million and $75 million, respectively. Excluding the effect of foreign currency
exchange rates, the Company expects sales growth of approximately 13% in 2005, which is comparable to the 14% sales growth, exclud-
ing the effect of foreign currency exchange rates, reported for the full year of 2004.
MANAGEMENT’S DISCUSSION AND ANALYSIS OF FINANCIAL CONDITION
AND RESULTS OF OPERATIONS
33
The Company has paid off substantially all previously outstanding borrowings under its existing credit facilities and eliminated
the amounts previously outstanding under its accounts receivable securitization facility and expects to generate cash earnings (net
earnings plus noncash adjustments) in excess of its needs to fund future working capital requirements. The Company anticipates
investing in future business growth, including business and product line acquisitions to supplement its current product offerings,
loaner instrumentation for surgical implants in support of new product launches and future building expansions, including manu-
facturing facility expansions for certain divisions.
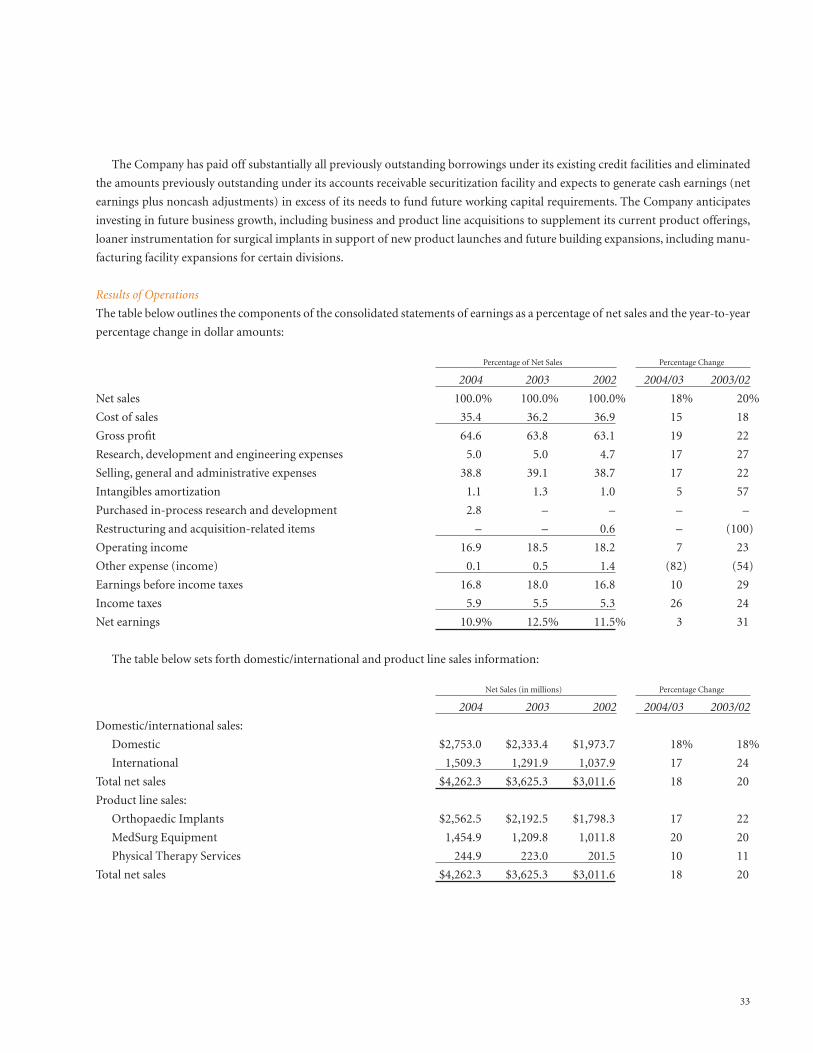
Results of Operations
The table below outlines the components of the consolidated statements of earnings as a percentage of net sales and the year-to-year
percentage change in dollar amounts:
Percentage of Net Sales Percentage Change
2004 2003 2002 2004/03 2003/02
Net sales 100.0% 100.0% 100.0% 18% 20%
Cost of sales 35.4 36.2 36.9 15 18
Gross profit 64.6 63.8 63.1 19 22
Research, development and engineering expenses 5.0 5.0 4.7 17 27
Selling, general and administrative expenses 38.8 39.1 38.7 17 22
Intangibles amortization 1.1 1.3 1.0 5 57
Purchased in-process research and development 2.8 – – – –
Restructuring and acquisition-related items – – 0.6 – (100)
Operating income 16.9 18.5 18.2 7 23
Other expense (income) 0.1 0.5 1.4 (82) (54)
Earnings before income taxes 16.8 18.0 16.8 10 29
Income taxes 5.9 5.5 5.3 26 24
Net earnings 10.9% 12.5% 11.5% 3 31
The table below sets forth domestic/international and product line sales information:
Net Sales (in millions) Percentage Change
2004 2003 2002 2004/03 2003/02
Domestic/international sales:
Domestic $2,753.0 $2,333.4 $1,973.7 18% 18%
International 1,509.3 1,291.9 1,037.9 17 24
Total net sales $4,262.3 $3,625.3 $3,011.6 18 20
Product line sales:
Orthopaedic Implants $2,562.5 $2,192.5 $1,798.3 17 22
MedSurg Equipment 1,454.9 1,209.8 1,011.8 20 20
Physical Therapy Services 244.9 223.0 201.5 10 11
Total net sales $4,262.3 $3,625.3 $3,011.6 18 20
34
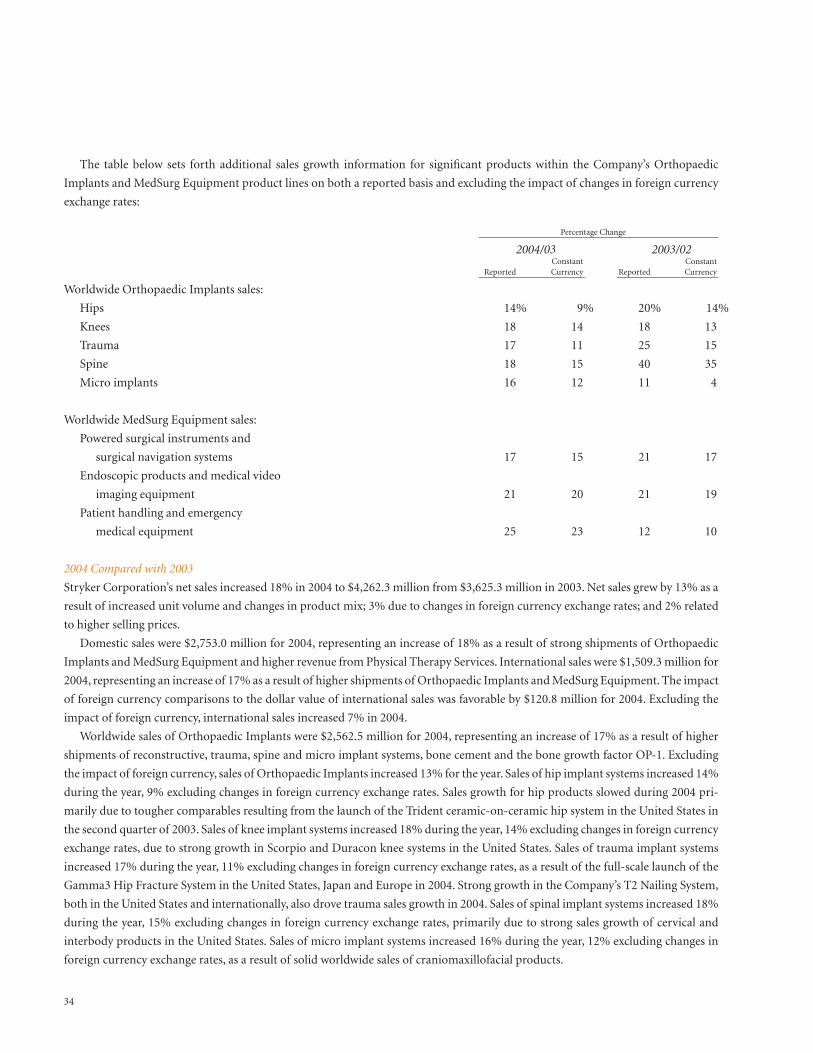
The table below sets forth additional sales growth information for significant products within the Company’s Orthopaedic
Implants and MedSurg Equipment product lines on both a reported basis and excluding the impact of changes in foreign currency
exchange rates:
Percentage Change
2004/03 2003/02Constant Constant
Reported Currency Reported Currency
Worldwide Orthopaedic Implants sales:
Hips 14% 9% 20% 14%
Knees 18 14 18 13
Trauma 17 11 25 15
Spine 18 15 40 35
Micro implants 16 12 11 4
Worldwide MedSurg Equipment sales:
Powered surgical instruments and
surgical navigation systems 17 15 21 17
Endoscopic products and medical video
imaging equipment 21 20 21 19
Patient handling and emergency
medical equipment 25 23 12 10
2004 Compared with 2003
Stryker Corporation’s net sales increased 18% in 2004 to $4,262.3 million from $3,625.3 million in 2003. Net sales grew by 13% as a
result of increased unit volume and changes in product mix; 3% due to changes in foreign currency exchange rates; and 2% related
to higher selling prices.
Domestic sales were $2,753.0 million for 2004, representing an increase of 18% as a result of strong shipments of Orthopaedic
Implants and MedSurg Equipment and higher revenue from Physical Therapy Services. International sales were $1,509.3 million for
2004, representing an increase of 17% as a result of higher shipments of Orthopaedic Implants and MedSurg Equipment. The impact
of foreign currency comparisons to the dollar value of international sales was favorable by $120.8 million for 2004. Excluding the
impact of foreign currency, international sales increased 7% in 2004.
Worldwide sales of Orthopaedic Implants were $2,562.5 million for 2004, representing an increase of 17% as a result of higher
shipments of reconstructive, trauma, spine and micro implant systems, bone cement and the bone growth factor OP-1. Excluding
the impact of foreign currency, sales of Orthopaedic Implants increased 13% for the year. Sales of hip implant systems increased 14%
during the year, 9% excluding changes in foreign currency exchange rates. Sales growth for hip products slowed during 2004 pri-
marily due to tougher comparables resulting from the launch of the Trident ceramic-on-ceramic hip system in the United States in
the second quarter of 2003. Sales of knee implant systems increased 18% during the year, 14% excluding changes in foreign currency
exchange rates, due to strong growth in Scorpio and Duracon knee systems in the United States. Sales of trauma implant systems
increased 17% during the year, 11% excluding changes in foreign currency exchange rates, as a result of the full-scale launch of the
Gamma3 Hip Fracture System in the United States, Japan and Europe in 2004. Strong growth in the Company’s T2 Nailing System,
both in the United States and internationally, also drove trauma sales growth in 2004. Sales of spinal implant systems increased 18%
during the year, 15% excluding changes in foreign currency exchange rates, primarily due to strong sales growth of cervical and
interbody products in the United States. Sales of micro implant systems increased 16% during the year, 12% excluding changes in
foreign currency exchange rates, as a result of solid worldwide sales of craniomaxillofacial products.
35
Worldwide sales of MedSurg Equipment were $1,454.9 million for 2004, representing an increase of 20% as a result of higher ship-
ments of powered surgical instruments and surgical navigation systems, endoscopic products, and patient handling and emergency
medical equipment. Excluding the impact of foreign currency, sales of MedSurg Equipment increased 18% for the year. Sales of pow-
ered surgical instruments and surgical navigation systems increased 17% during the year, 15% excluding changes in foreign currency
exchange rates, due to strong sales growth in heavy-duty powered instruments, interventional pain products and surgical navigation
systems both domestically and in Europe. Sales of endoscopic products increased 21% during the year, 20% excluding changes in
foreign currency exchange rates, as a result of solid growth in medical video imaging equipment and sports medicine products in
the United States. Sales of patient handling and emergency medical equipment increased 25% during the year, 23% excluding changes
in foreign currency exchange rates, due to strong growth in hospital beds and emergency medical equipment both domestically and
in the international markets.
Physical Therapy Services revenues were $244.9 million for 2004, representing an increase of 10% with 6% of the growth result-
ing from new physical therapy centers and 4% of the increase coming from higher revenues at existing centers.
Cost of sales represented 35.4% of sales in 2004 compared with 36.2% in 2003. The lower cost of sales percentage in 2004 is
partially due to increased average selling prices for the Company’s products and improved manufacturing efficiencies at several of
the Company’s manufacturing and distribution facilities, including its recently completed Mahwah, New Jersey, manufacturing and
distribution facility, and lower purchase prices of raw materials, including cobalt chromium and titanium alloys.
Research, development and engineering expenses represented 5.0% of sales in both 2004 and 2003. These expenses increased 17%
in 2004 to $211.0 million. The higher spending level is the result of final development spending in advance of the Company’s prod-
uct launches in 2004 and continued focus on new product development for anticipated future product launches, together with,
beginning in the third quarter of 2004, spending associated with the continued development of products acquired from SpineCore.
New product introductions in 2004 in the Orthopaedic Implants segment included the Restoration Modular Hip System in the United
States and Europe, the Triathlon Knee System in the United States and Europe, the Scorpio NRG knee and CentPillar hip systems in
the Japanese market, a worldwide launch of the OASYS posterior cervical fixation system and a full-scale launch of the Gamma3 Hip
Fracture System in the United States, Japan and Europe. The Triathlon system represents the Company’s evolutionary design devel-
oped to more closely reproduce natural knee motion and to provide mobility with stability through more than 150 degrees of flex-
ion. Within the MedSurg Equipment segment, new product introductions in 2004 included a new video platform with the 1088 High
Definition Camera, the first fully digital, high-definition, progressive-scan medical video camera, and the new M-Series stretcher,
designed to fit the needs of acute care and specialty surgical care facilities.
Selling, general and administrative expenses increased 17% in 2004 and represented 38.8% of sales compared with 39.1% in 2003.
The 17% increase in selling, general and administrative expenses is partially due to an increase in sales commission expense as a result
of the 18% increase in net sales in 2004, increased meeting costs and higher amortization expense associated with loaner instrument
sets. In addition, the Company incurred a $12.1 million increase in insurance costs during 2004 resulting from increased premiums
charged by third-party insurers and its wholly owned captive insurance company established in 2003 as more fully described in
Other Matters.
The purchased in-process research and development charge of $120.8 million recorded in the third quarter of 2004 relates to the
acquisition of SpineCore, a development stage company. At the date of the acquisition, the artificial lumbar and cervical spinal
disc implant technologies acquired were in preliminary stages of clinical studies in the United States and had not yet reached tech-
nological feasibility. The upfront payment of $120.0 million, plus certain transaction costs, was allocated to assets acquired, purchased
in-process research and development and liabilities assumed based on their estimated fair value at the date of acquisition.
Interest expense declined to $6.8 million in 2004 from $22.6 million in 2003, primarily as a result of lower outstanding
debt balances.
36
The effective income tax rate was 35.0% in 2004. The reported effective income tax rate for 2004 reflects the nondeductibility for
U.S. income tax purposes of the purchased in-process research and development charge recognized pursuant to the aforementioned
acquisition of SpineCore. Excluding this nondeductible charge, the Company’s effective income tax rate was reduced to 30.0% in
2004 compared with 30.5% in 2003 primarily as a result of increased manufacturing in lower tax jurisdictions such as Ireland and
Puerto Rico.
Net earnings increased 3% to $465.7 million from $453.5 million in 2003; basic net earnings per share increased 2% to $1.16 in
2004 from $1.14 in 2003; and diluted net earnings per share increased 3% to $1.14 in 2004 from $1.11 in 2003.
Excluding the impact of the $120.8 million purchased in-process research and development charge recorded in the third quarter
of 2004, adjusted net earnings increased 29% from $453.5 million in 2003 to $586.5 million in 2004; adjusted basic net earnings per
share increased 28% from $1.14 in 2003 to $1.46 in 2004; and adjusted diluted net earnings per share increased 29% from $1.11 in
2003 to $1.43 in 2004.
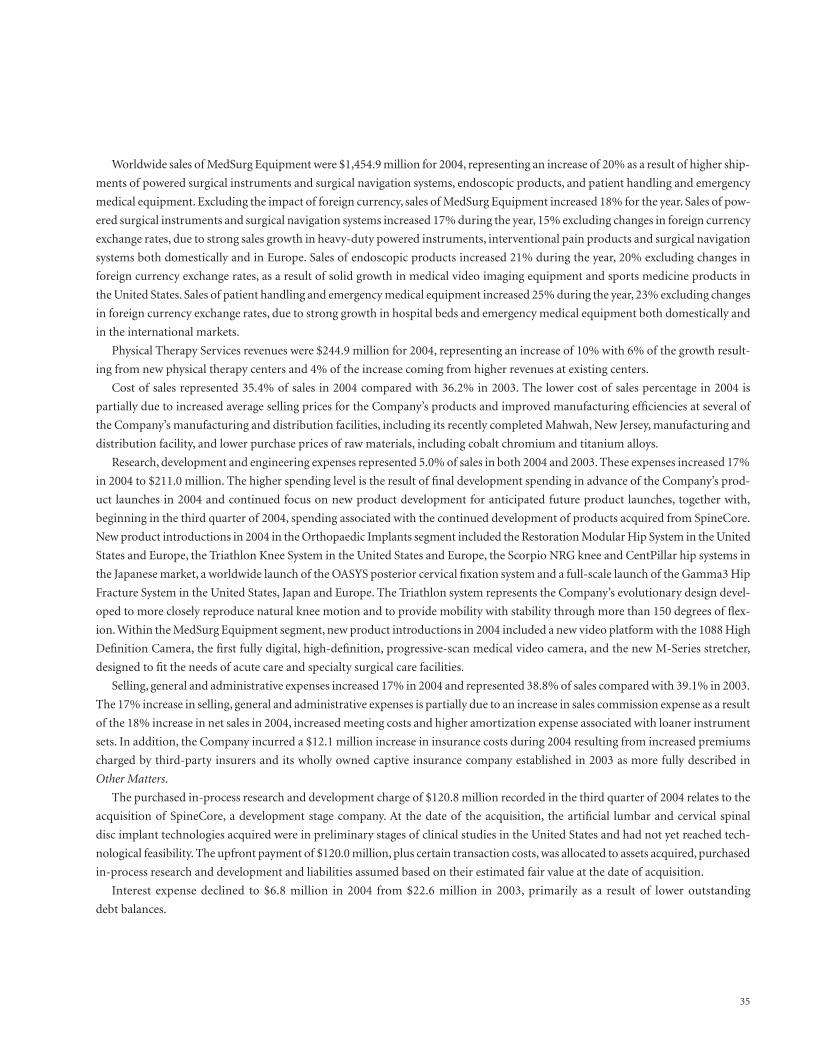
This adjusted financial measure does not replace the presentation of the Company’s reported financial results stated under gen-
erally accepted accounting principles (GAAP). The Company has provided this supplemental non-GAAP financial measure because
it provides meaningful information regarding the Company’s results on a consistent and comparable basis for the periods presented.
Management uses this non-GAAP financial measure for reviewing the operating results of its business segments and for analyzing
potential future business trends in connection with its budget process. In addition, the Company believes investors will utilize this
information to evaluate period-to-period results and to better understand potential future operating results. The Company encour-
ages investors and other users of these financial statements to review its Consolidated Financial Statements and other publicly filed
reports in their entirety and to not rely solely on any single financial measure. The reconciliation of this non-GAAP financial mea-
sure is as follows (in millions):
2004 2003 % Change
Reported net earnings $465.7 $453.5 3%
Purchased in-process research and development 120.8 – –
Adjusted net earnings $586.5 $453.5 29
Basic net earnings per share:
Reported basic net earnings per share $1.16 $1.14 2
Purchased in-process research and development $.30 – –
Adjusted basic net earnings per share $1.46 $1.14 28
Diluted net earnings per share:
Reported diluted net earnings per share $1.14 $1.11 3
Purchased in-process research and development $.29 – –
Adjusted diluted net earnings per share $1.43 $1.11 29
2003 Compared with 2002
Stryker Corporation’s net sales increased 20% in 2003 to $3,625.3 million from $3,011.6 million in 2002. Net sales grew by 12% as a
result of increased unit volume and changes in product mix; 5% due to changes in foreign currency exchange rates; 2% related to
higher selling prices; and 1% as a result of acquired businesses.
Domestic sales were $2,333.4 million for 2003, representing an increase of 18% as a result of strong shipments of Orthopaedic
Implants and MedSurg Equipment and higher revenue from Physical Therapy Services. International sales were $1,291.9 million for
2003, representing an increase of 24% as a result of higher shipments of Orthopaedic Implants and MedSurg Equipment. The impact
of foreign currency comparisons to the dollar value of international sales was favorable by $145.9 million for 2003. Excluding the
impact of foreign currency, international sales increased 10% in 2003.
Worldwide sales of Orthopaedic Implants were $2,192.5 million for 2003, representing an increase of 22% as a result of higher
shipments of reconstructive, trauma, spine and micro implant systems, bone cement and the bone growth factor OP-1. Excluding
the impact of foreign currency, sales of Orthopaedic Implants increased 16% for the year. Sales of hip implant systems increased 20%
during the year, 14% excluding changes in foreign currency exchange rates. Sales growth for hip products was primarily driven by
the launch of the Trident ceramic-on-ceramic hip system in the United States in the second quarter of 2003. Sales of knee implant
systems increased 18% during the year, 13% excluding changes in foreign currency exchange rates, due to strong growth in Scorpio
and Duracon knee systems in the United States and in Scorpio systems in Japan and the Pacific region. Sales of trauma implant
systems increased 25% during the year, 15% excluding changes in foreign currency exchange rates, as a result of strong growth in the
intramedullary nail product portfolio in the United States, led by the T2 Nailing System, and strong growth in hip fracture and exter-
nal fixation products in Japan. Sales of spinal implant systems increased 40% during the year, 35% excluding changes in foreign
currency exchange rates, primarily due to incremental sales of interbody cages resulting from the third quarter 2002 acquisition of
Surgical Dynamics Inc. in the United States and strong domestic and international growth in thoracolumbar implant products.
Worldwide sales of MedSurg Equipment were $1,209.8 million for 2003, representing an increase of 20% as a result of higher
shipments of powered surgical instruments and surgical navigation systems, endoscopic products, and patient handling and
emergency medical equipment. Excluding the impact of foreign currency, sales of MedSurg Equipment increased 16% for the year.
Sales of powered surgical instruments and surgical navigation systems increased 21% during the year, 17% excluding changes in for-
eign currency exchange rates, due to strong sales growth in heavy-duty powered instruments, micro-powered tools and interventional
pain products both domestically and in Europe and domestic sales growth of the DEKOMPRESSOR discectomy probe acquired in
the fourth quarter of 2002. Sales of endoscopic products increased 21% during the year, 19% excluding changes in foreign currency
exchange rates, as a result of strong growth in medical video imaging equipment and arthroscopic products in the United States. Sales
of patient handling and emergency medical equipment increased 12% during the year, 10% excluding changes in foreign currency
exchange rates, due to strong domestic growth in hospital beds and emergency medical equipment.
Physical Therapy Services revenues were $223.0 million for 2003, representing an increase of 11% with 8% of the growth result-
ing from new physical therapy centers and 3% of the increase coming from higher revenues at existing centers.
Cost of sales represented 36.2% of sales compared with 36.9% in 2002. The lower cost of sales percentage in 2003 was due to the
faster sales growth in the higher margin Orthopaedic Implants business and an increase in the absorption of fixed manufacturing
costs caused by increased production at certain of the Company’s manufacturing plants to meet current demand.
Research, development and engineering expenses represented 5.0% of sales in 2003 compared with 4.7% in 2002. The higher spend-
ing level was the result of final development spending in advance of the Company’s product launches in 2003 and continued focus
on new product development for anticipated future product launches. New product introductions in 2003 included the Trident Ceramic
Acetabular System, Simplex P with Tobramycin Bone Cement and the CORE platform of micro-powered surgical instruments in the
United States market and the System 5 heavy-duty, battery-powered surgical instruments in Europe.
37
38
Selling, general and administrative expenses increased 22% in 2003 and represented 39.1% of sales compared with 38.7% in 2002.
The 22% increase in selling, general and administrative expenses was partially due to an increase in sales commission expense as a
result of the 20% increase in net sales in 2003. In addition, the Company incurred a $14.0 million increase in insurance costs during
2003 resulting from increased premiums charged by third-party insurers and a wholly owned captive insurance company established
in 2003 as more fully described in Other Matters. The increase in selling, general and administrative expenses as a percentage of sales
in 2003 was primarily due to higher distribution costs associated with the increased sales mix of Orthopaedic Implants, increased
amortization of loaner instrument sets, the increase in insurance costs and higher advertising costs associated with the Company’s
previously announced patient education campaign.
The increase in intangibles amortization to $45.4 million in 2003 from $28.9 million in 2002 was primarily the result of the increased
intangible assets recorded as a result of the July 1, 2002 acquisition of the Surgical Dynamics Inc. spinal implant business (SDI) from
Tyco International Ltd. In addition, the Company recorded a $6.5 million charge related to a trademark impairment resulting from
a branding initiative adopted by the Company in the fourth quarter of 2003. The branding initiative is intended to improve the
Company’s customers’ and other stakeholders’ overall awareness of Stryker’s capabilities. The charge is included in intangibles
amortization in the consolidated statements of earnings.
The Company recognized charges of $17.2 million ($11.5 million net of income taxes) related to restructuring and acquisition-
related items in the third quarter of 2002. The 2002 restructuring and acquisition-related items included a charge of $21.0 million
($14.1 million net of income taxes) for employment-related costs to close the Company’s Rutherford, New Jersey, manufacturing
facility, partially offset by a credit of $3.8 million ($2.6 million net of income taxes) to reverse certain Howmedica acquisition-related
costs to reflect actual final payments required.
Interest expense declined to $22.6 million in 2003 from $40.3 million in 2002, primarily as a result of lower outstanding debt
balances. Other income was $3.8 million in 2003, compared with $0.5 million of other expense in 2002 due to foreign currency trans-
action gains in the current year compared to losses in the prior year and higher interest income.
The effective income tax rate was 30.5% in 2003 compared with 31.8% in 2002. The Company’s effective income tax rate for 2003
was reduced primarily as a result of increased manufacturing in lower tax jurisdictions such as Ireland and Puerto Rico.
Net earnings increased 31% to $453.5 million from $345.6 million in 2002; basic net earnings per share increased 31% to $1.14
in 2003 from $.87 in 2002; and diluted net earnings per share increased 31% to $1.11 in 2003 from $.85 in 2002.
Excluding the impact of the restructuring and acquisition-related items for the year ended December 31, 2002, adjusted net earn-
ings increased 27% from $357.1 million in 2002 to $453.5 million in 2003. Adjusted basic net earnings per share increased 27% from
$.90 in 2002 to $1.14 in 2003. Adjusted diluted net earnings per share increased 26% from $.88 in 2002 to $1.11 in 2003.
This adjusted financial measure does not replace the presentation of the Company’s reported financial results stated under
GAAP. The Company has provided this supplemental non-GAAP financial measure because it provides meaningful information regard-
ing the Company’s results on a consistent and comparable basis for the periods presented. Management uses this non-GAAP finan-
cial measure for reviewing the operating results of its business segments and for analyzing potential future business trends in
connection with its budget process. In addition, the Company believes investors will utilize this information to evaluate period-to-
period results and to better understand potential future operating results. The Company believes that the economic nature of the
restructuring charge and the acquisition-related credit were sufficiently unique that similar items were not recorded in the prior two
fiscal years, nor were they reasonably likely to recur within two years. In addition, the Company believes that the financial impact of
each of these individual items was insignificant by the end of 2004. The Company encourages investors and other users of these finan-
cial statements to review its Consolidated Financial Statements and other publicly filed reports in their entirety and to not rely solely
on any single financial measure. The reconciliation of this non-GAAP financial measure is as follows (in millions):
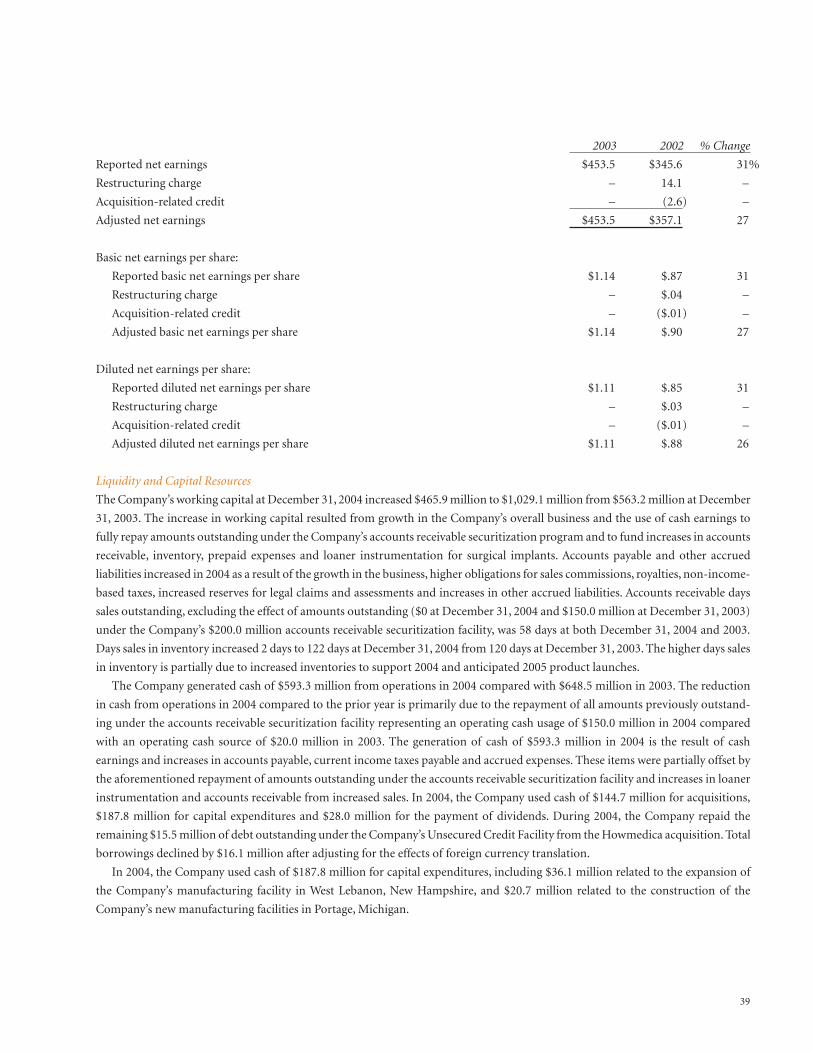
39
2003 2002 % Change
Reported net earnings $453.5 $345.6 31%
Restructuring charge – 14.1 –
Acquisition-related credit – (2.6) –
Adjusted net earnings $453.5 $357.1 27
Basic net earnings per share:
Reported basic net earnings per share $1.14 $.87 31
Restructuring charge – $.04 –
Acquisition-related credit – ($.01) –
Adjusted basic net earnings per share $1.14 $.90 27
Diluted net earnings per share:
Reported diluted net earnings per share $1.11 $.85 31
Restructuring charge – $.03 –
Acquisition-related credit – ($.01) –
Adjusted diluted net earnings per share $1.11 $.88 26
Liquidity and Capital Resources
The Company’s working capital at December 31, 2004 increased $465.9 million to $1,029.1 million from $563.2 million at December
31, 2003. The increase in working capital resulted from growth in the Company’s overall business and the use of cash earnings to
fully repay amounts outstanding under the Company’s accounts receivable securitization program and to fund increases in accounts
receivable, inventory, prepaid expenses and loaner instrumentation for surgical implants. Accounts payable and other accrued
liabilities increased in 2004 as a result of the growth in the business, higher obligations for sales commissions, royalties, non-income-
based taxes, increased reserves for legal claims and assessments and increases in other accrued liabilities. Accounts receivable days
sales outstanding, excluding the effect of amounts outstanding ($0 at December 31, 2004 and $150.0 million at December 31, 2003)
under the Company’s $200.0 million accounts receivable securitization facility, was 58 days at both December 31, 2004 and 2003.
Days sales in inventory increased 2 days to 122 days at December 31, 2004 from 120 days at December 31, 2003. The higher days sales
in inventory is partially due to increased inventories to support 2004 and anticipated 2005 product launches.
The Company generated cash of $593.3 million from operations in 2004 compared with $648.5 million in 2003. The reduction
in cash from operations in 2004 compared to the prior year is primarily due to the repayment of all amounts previously outstand-
ing under the accounts receivable securitization facility representing an operating cash usage of $150.0 million in 2004 compared
with an operating cash source of $20.0 million in 2003. The generation of cash of $593.3 million in 2004 is the result of cash
earnings and increases in accounts payable, current income taxes payable and accrued expenses. These items were partially offset by
the aforementioned repayment of amounts outstanding under the accounts receivable securitization facility and increases in loaner
instrumentation and accounts receivable from increased sales. In 2004, the Company used cash of $144.7 million for acquisitions,
$187.8 million for capital expenditures and $28.0 million for the payment of dividends. During 2004, the Company repaid the
remaining $15.5 million of debt outstanding under the Company’s Unsecured Credit Facility from the Howmedica acquisition. Total
borrowings declined by $16.1 million after adjusting for the effects of foreign currency translation.
In 2004, the Company used cash of $187.8 million for capital expenditures, including $36.1 million related to the expansion of
the Company’s manufacturing facility in West Lebanon, New Hampshire, and $20.7 million related to the construction of the
Company’s new manufacturing facilities in Portage, Michigan.
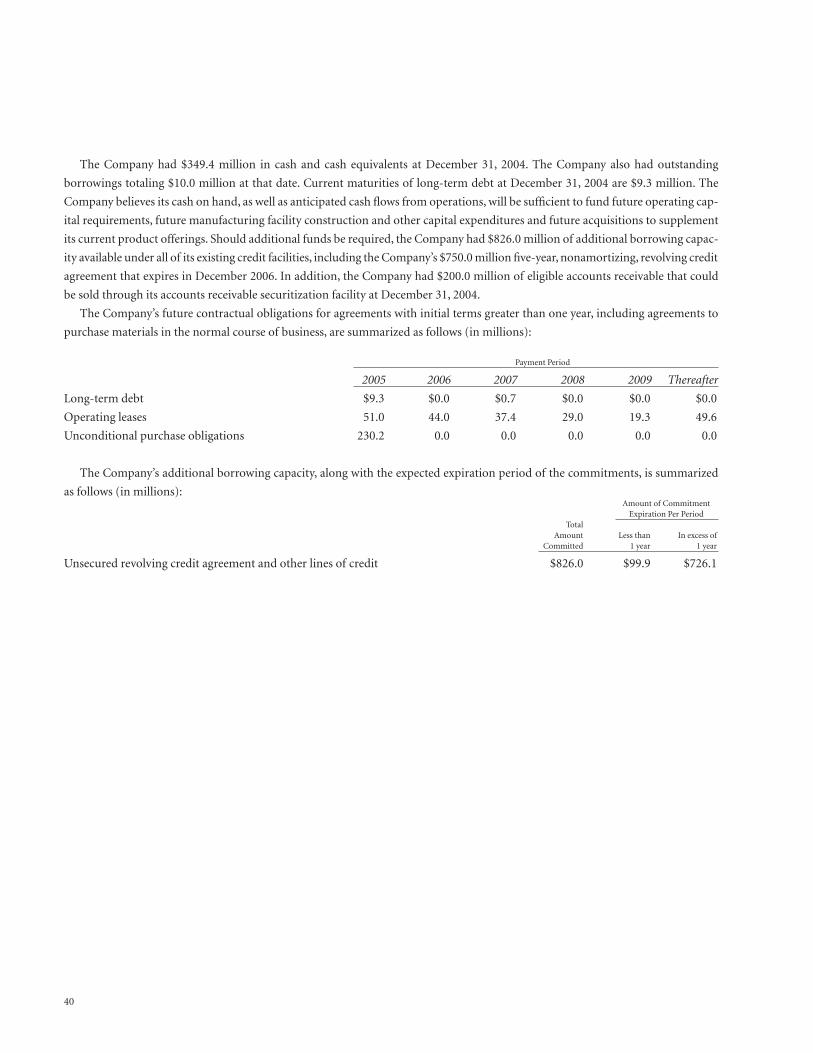
40
The Company had $349.4 million in cash and cash equivalents at December 31, 2004. The Company also had outstanding
borrowings totaling $10.0 million at that date. Current maturities of long-term debt at December 31, 2004 are $9.3 million. The
Company believes its cash on hand, as well as anticipated cash flows from operations, will be sufficient to fund future operating cap-
ital requirements, future manufacturing facility construction and other capital expenditures and future acquisitions to supplement
its current product offerings. Should additional funds be required, the Company had $826.0 million of additional borrowing capac-
ity available under all of its existing credit facilities, including the Company’s $750.0 million five-year, nonamortizing, revolving credit
agreement that expires in December 2006. In addition, the Company had $200.0 million of eligible accounts receivable that could
be sold through its accounts receivable securitization facility at December 31, 2004.
The Company’s future contractual obligations for agreements with initial terms greater than one year, including agreements to
purchase materials in the normal course of business, are summarized as follows (in millions):
Payment Period
2005 2006 2007 2008 2009 Thereafter
Long-term debt $9.3 $0.0 $0.7 $0.0 $0.0 $0.0
Operating leases 51.0 44.0 37.4 29.0 19.3 49.6
Unconditional purchase obligations 230.2 0.0 0.0 0.0 0.0 0.0
The Company’s additional borrowing capacity, along with the expected expiration period of the commitments, is summarized
as follows (in millions):Amount of Commitment
Expiration Per Period Total
Amount Less than In excess ofCommitted 1 year 1 year
Unsecured revolving credit agreement and other lines of credit $826.0 $99.9 $726.1
41
Critical Accounting Policies
The preparation of the Company’s Consolidated Financial Statements requires management to make estimates and assumptions that
affect the amounts reported in the financial statements and accompanying notes. Management evaluates these estimates and assump-
tions on an ongoing basis. Estimates are based on historical experience, when available, and on various other assumptions that are
believed to be reasonable under the circumstances, the results of which form the basis for making judgments about the carrying
values of assets and liabilities that are not readily apparent from other sources. Actual results may differ from these estimates under
different assumptions or conditions.
Management believes that of its significant accounting policies (see Note 1 to the Consolidated Financial Statements), an under-
standing of the following critical accounting policies is important in obtaining an overall understanding of the Consolidated
Financial Statements.
Allowance for Doubtful Accounts: The Company maintains an allowance for doubtful accounts for estimated losses in the collection
of accounts receivable. The Company makes estimates regarding the future ability of its customers to make required payments based
on historical credit experience and expected future trends. If actual customer financial conditions are less favorable than projected by
management, additional accounts receivable write-offs may be necessary, which could unfavorably affect future operating results.
Inventory Reserves: The Company maintains reserves for excess and obsolete inventory resulting from the potential inability to
sell its products at prices in excess of current carrying costs. The markets in which the Company operates are highly competitive,
with new products and surgical procedures introduced on an ongoing basis. Such marketplace changes may cause some of the
Company’s products to become obsolete. The Company makes estimates regarding the future recoverability of the costs of these prod-
ucts and records a provision for excess and obsolete inventories based on historical experience, expiration of sterilization dates
and expected future trends. If actual product life cycles, product demand or acceptance of new product introductions are less favor-
able than projected by management, additional inventory write-downs may be required, which could unfavorably affect future
operating results.
Income Taxes: The Company operates in multiple tax jurisdictions both inside and outside the United States. Accordingly, man-
agement must determine the appropriate allocation of income to each of these jurisdictions. Tax audits associated with the alloca-
tion of this income and other complex issues may require an extended period of time to resolve and may result in income tax
adjustments if changes to the income allocation are required between jurisdictions with different tax rates. Because tax adjustments
in certain jurisdictions can be significant, the Company records accruals representing management’s best estimate of the probable
resolution of these matters. To the extent additional information becomes available, such accruals are adjusted to reflect the revised
estimated probable outcome.
Other Matters
The Company distributes its products throughout the world. As a result, the Company’s financial results could be significantly affected
by factors such as changes in foreign currency exchange rates or weak economic conditions in foreign markets. The Company’s oper-
ating results are primarily exposed to changes in exchange rates among the United States dollar and the Japanese yen and European
currencies, in particular the euro and the British pound. When the United States dollar weakens against foreign currencies, the dol-
lar value of sales denominated in foreign currencies increases.When the United States dollar strengthens, the opposite situation occurs.
The Company manufactures its products in the United States, France, Germany, Ireland, Switzerland, Canada and Puerto Rico and
incurs the costs to manufacture in the applicable local currencies. This worldwide deployment of factories serves to partially
mitigate the impact of currency exchange rate changes on the Company’s cost of sales.
The Company enters into forward currency exchange contracts to mitigate the impact of currency fluctuations on transactions
denominated in nonfunctional currencies, thereby limiting risk to the Company that would otherwise result from changes in
exchange rates. These nonfunctional currency exposures principally relate to intercompany receivables and payables arising from inter-
company purchases of manufactured products. The periods of the forward currency exchange contracts correspond to the periods
of the exposed transactions, with realized gains and losses included in the measurement and recording of transactions denominated
in the nonfunctional currencies.
42
At December 31, 2004, the Company had outstanding forward currency exchange contracts to purchase $137.7 million and sell
$173.1 million of various currencies (principally United States dollars and euros) with maturities ranging principally from 30 to 180
days. The estimated fair value of forward currency exchange contracts represents the measurement of the contracts at month-end
spot rates as adjusted by current forward points. A hypothetical 10% change in exchange rates for these currencies would change
the December 31, 2004 fair value by approximately $6.1 million. The Company is exposed to credit loss in the event of nonperfor-
mance by counterparties on its outstanding forward currency exchange contracts but does not anticipate nonperformance by any of
the counterparties.
The Company has certain investments in net assets in international locations that are not hedged. These investments are subject
to translation gains and losses due to changes in foreign currencies that are deferred and recorded as a separate component of stock-
holders’ equity. For the year ended December 31, 2004, the strengthening of foreign currencies relative to the U.S. dollar increased
the value of these investments in net assets, and the related deferred gain in stockholders’ equity, by $102.2 million to $209.9 million.
The Company is partially self-insured for product liability claims. In 2003, the Company established a wholly owned captive
insurance company in the United States to manage its self-insured retention limits. The captive insurance company provides insur-
ance reserves for estimated liabilities for product claims incurred but not reported based on actuarially determined liabilities. The
actuarial valuations are based on historical information along with certain assumptions about future events.
In December 2003, the Company announced that its subsidiary Physiotherapy Associates, Inc., and Stryker received a subpoena
from the United States Attorney’s Office in Boston, Massachusetts, in connection with a Department of Justice investigation of
Physiotherapy Associates’ billing and coding practices. Physiotherapy Associates provides physical, occupational and speech therapy
services to patients through 428 outpatient centers in the United States as of December 31, 2004 and represented 6% of Stryker’s net
sales for each of the years ended December 31, 2004 and 2003. Revenues derived from billings to U.S. federal health-care programs
approximated 14% of Physiotherapy Associates’ revenues during these periods. The Company is fully cooperating with the Department
of Justice regarding this matter.
On October 22, 2004, the President of the United States signed the American Jobs Creation Act of 2004 (the Act). The Act creates
a temporary incentive for United States corporations to repatriate accumulated income earned in foreign jurisdictions by providing
an 85% dividends-received deduction for certain dividends from controlled foreign corporations. The deduction is subject to a
number of limitations, and significant uncertainty remains about the way to interpret numerous provisions in the Act. Due to these
factors, the Company is not yet in a position to determine whether, and to what extent, it might repatriate foreign earnings that have
not yet been remitted to the United States. Based on its current analysis, the Company may repatriate up to $800 million, with a related
income tax expense and liability of up to $56 million. The Company plans to finalize its assessment after Congress or the Treasury
Department provides additional clarifying language on key elements of the repatriation provision.
In December 2004, the Financial Accounting Standards Board (FASB) issued a revision to Statement No. 123, Share-Based
Payment. This revision supersedes Accounting Principles Board (APB) Opinion No. 25, Accounting for Stock Issued to Employees, and
its related implementation guidance. This revision requires companies to recognize the cost of stock options based on the grant-date
fair value pursuant to their employee stock option plans over the period during which the recipient is required to provide services
in exchange for the options, typically the vesting period. Pursuant to the requirements of the Statement, the Company plans to adopt
the provisions of the standard during the third quarter of 2005 using the modified-retrospective transition method provided in the
Statement. Under this method, the Company will restate all prior periods presented on a consistent basis. The Company does not
believe the adoption of this Statement will have a material impact on the trend of net earnings or net earnings per share.
43
Forward-Looking Statements
The information contained in this report may contain information that includes or is based on forward-looking statements within
the meaning of the federal securities laws that are subject to risks and uncertainties. These statements may be identified by the use of
words such as “anticipates,”“expects,”“estimates,”“projects,”“intends” and “believes” and variations thereof and other terms of simi-
lar meaning. Factors that could cause the Company’s actual results and financial condition to differ from the Company’s expectations
include, but are not limited to: regulatory actions, including cost-containment measures, that could adversely affect the price of or demand
for the Company’s products; unanticipated issues arising in connection with clinical studies and eventual FDA approval of OP-1,
SpineCore’s products or other new product introductions; changes in reimbursement levels from third-party payors; a significant increase
in product liability claims; changes in economic conditions that adversely affect the level of demand for the Company’s products; changes
in foreign exchange markets; changes in financial markets; and changes in the competitive environment.
While the Company believes that the assumptions underlying such forward-looking statements are reasonable, there can be no
assurance that future events or developments will not cause such statements to be inaccurate. All forward-looking statements
contained in this report are qualified in their entirety by this cautionary statement.
MANAGEMENT REPORT ON INTERNAL CONTROL OVER FINANCIAL REPORTING
The Board of Directors and Stockholders of Stryker Corporation:
The management of Stryker Corporation is responsible for establishing and maintaining adequate internal control over financial report-
ing, as such term is defined in Exchange Act Rules 13a-15(f). Stryker Corporation’s internal control system was designed to provide
reasonable assurance to the Company’s management and Board of Directors regarding the preparation and fair presentation of
published financial statements.
Stryker Corporation’s management assessed the effectiveness of the Company’s internal control over financial reporting as of
December 31, 2004 under the supervision and with the participation of the President and Chief Executive Officer and the Vice President
and Chief Financial Officer. In making this assessment, it used the criteria set forth by the Committee of Sponsoring Organizations
of the Treadway Commission in Internal Control-Integrated Framework. Based on that assessment, management believes that, as of
December 31, 2004, the Company’s internal control over financial reporting is effective.
Stryker Corporation’s independent registered public accounting firm, Ernst & Young LLP, has issued an attestation report on
management’s assessment of the Company’s internal control over financial reporting. This report appears on the following page.
44
REPORT OF INDEPENDENT REGISTERED PUBLIC ACCOUNTING FIRM ON INTERNAL CONTROL
OVER FINANCIAL REPORTING
The Board of Directors and Stockholders of Stryker Corporation:
We have audited management’s assessment, included in the accompanying Management Report on Internal Control over Financial
Reporting, that Stryker Corporation and subsidiaries maintained effective internal control over financial reporting as of December
31, 2004, based on criteria established in Internal Control—Integrated Framework issued by the Committee of Sponsoring
Organizations of the Treadway Commission (the COSO criteria). The Company’s management is responsible for maintaining effec-
tive internal control over financial reporting and for its assessment of the effectiveness of internal control over financial reporting.
Our responsibility is to express an opinion on management’s assessment and an opinion on the effectiveness of the Company’s
internal control over financial reporting based on our audit.
We conducted our audit in accordance with the standards of the Public Company Accounting Oversight Board (United States).
Those standards require that we plan and perform the audit to obtain reasonable assurance about whether effective internal control
over financial reporting was maintained in all material respects. Our audit included obtaining an understanding of internal control
over financial reporting, evaluating management’s assessment, testing and evaluating the design and operating effectiveness of
internal control, and performing such other procedures as we considered necessary in the circumstances. We believe that our audit
provides a reasonable basis for our opinion.
A company’s internal control over financial reporting is a process designed to provide reasonable assurance regarding the
reliability of financial reporting and the preparation of financial statements for external purposes in accordance with generally accepted
accounting principles. A company’s internal control over financial reporting includes those policies and procedures that (1) pertain
to the maintenance of records that, in reasonable detail, accurately and fairly reflect the transactions and dispositions of the assets of
the company; (2) provide reasonable assurance that transactions are recorded as necessary to permit preparation of financial state-
ments in accordance with generally accepted accounting principles, and that receipts and expenditures of the company are being made
only in accordance with authorizations of management and directors of the company; and (3) provide reasonable assurance regard-
ing prevention or timely detection of unauthorized acquisition, use, or disposition of the company’s assets that could have a mater-
ial effect on the financial statements.
Because of its inherent limitations, internal control over financial reporting may not prevent or detect misstatements. Also,
projections of any evaluation of effectiveness to future periods are subject to the risk that controls may become inadequate because
of changes in conditions, or that the degree of compliance with the policies or procedures may deteriorate.
In our opinion, management’s assessment that Stryker Corporation and subsidiaries maintained effective internal control over
financial reporting as of December 31, 2004, is fairly stated, in all material respects, based on the COSO criteria. Also, in our opin-
ion, the Company maintained, in all material respects, effective internal control over financial reporting as of December 31, 2004,
based on the COSO criteria.
We also have audited, in accordance with the standards of the Public Company Accounting Oversight Board (United States), the
consolidated balance sheets of Stryker Corporation and subsidiaries as of December 31, 2004 and 2003, and the related consolidated
statements of earnings, stockholders’ equity, and cash flows for each of the three years in the period ended December 31, 2004, and
our report dated February 4, 2005 expressed an unqualified opinion thereon.
Grand Rapids, Michigan
February 4, 2005
45
REPORT OF INDEPENDENT REGISTERED PUBLIC ACCOUNTING FIRM ON FINANCIAL STATEMENTS
The Board of Directors and Stockholders of Stryker Corporation:
We have audited the accompanying consolidated balance sheets of Stryker Corporation and subsidiaries as of December 31, 2004
and 2003, and the related consolidated statements of earnings, stockholders’ equity and cash flows for each of the three years in the
period ended December 31, 2004. These financial statements are the responsibility of the Company’s management. Our responsi-
bility is to express an opinion on these financial statements based on our audits.
We conducted our audits in accordance with standards of the Public Company Accounting Oversight Board (United States). Those
standards require that we plan and perform the audit to obtain reasonable assurance about whether the financial statements are free
of material misstatement. An audit includes examining, on a test basis, evidence supporting the amounts and disclosures in the finan-
cial statements. An audit also includes assessing the accounting principles used and significant estimates made by management, as
well as evaluating the overall financial statement presentation. We believe that our audits provide a reasonable basis for our opinion.
In our opinion, the financial statements referred to above present fairly, in all material respects, the consolidated financial
position of Stryker Corporation and subsidiaries at December 31, 2004 and 2003, and the consolidated results of their operations
and their cash flows for each of the three years in the period ended December 31, 2004, in conformity with United States generally
accepted accounting principles.
We also have audited, in accordance with the standards of the Public Company Accounting Oversight Board (United States), the
effectiveness of Stryker Corporation’s internal control over financial reporting as of December 31, 2004, based on criteria established
in Internal Control—Integrated Framework issued by the Committee of Sponsoring Organizations of the Treadway Commission
and our report dated February 4, 2005 expressed an unqualified opinion thereon.
Grand Rapids, Michigan
February 4, 2005
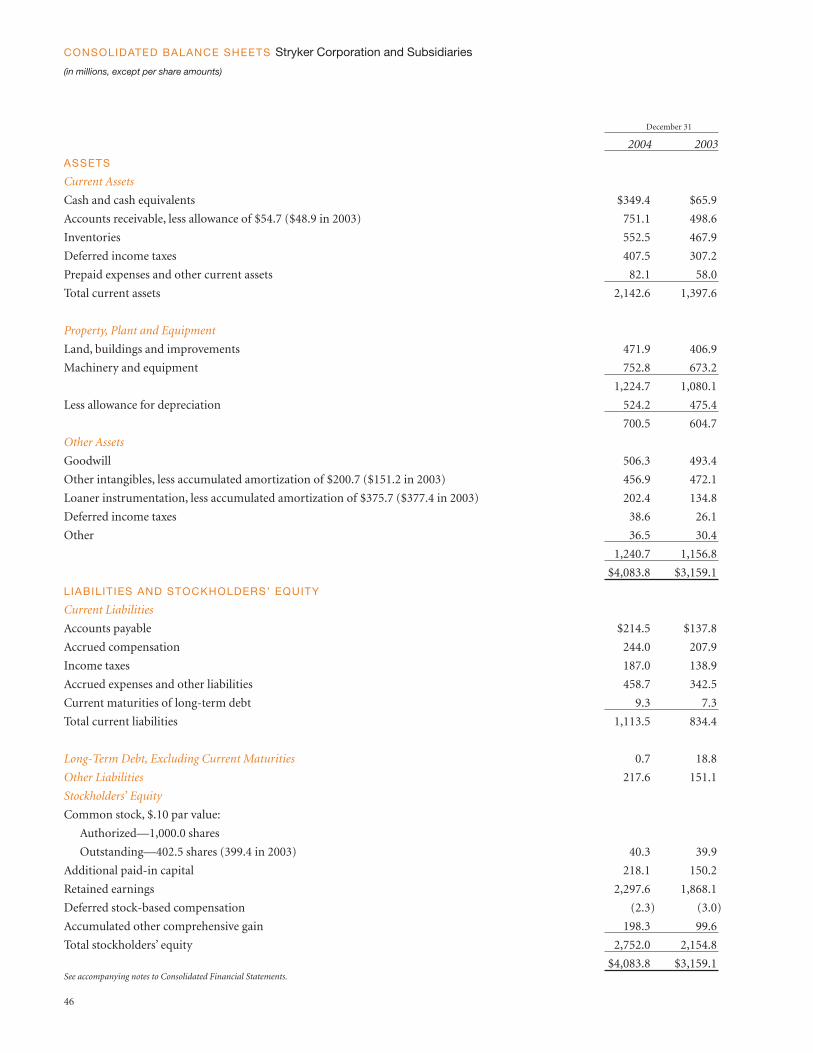
December 31
2004 2003
ASSETS
Current Assets
Cash and cash equivalents $349.4 $65.9
Accounts receivable, less allowance of $54.7 ($48.9 in 2003) 751.1 498.6
Inventories 552.5 467.9
Deferred income taxes 407.5 307.2
Prepaid expenses and other current assets 82.1 58.0
Total current assets 2,142.6 1,397.6
Property, Plant and Equipment
Land, buildings and improvements 471.9 406.9
Machinery and equipment 752.8 673.2
1,224.7 1,080.1
Less allowance for depreciation 524.2 475.4
700.5 604.7
Other Assets
Goodwill 506.3 493.4
Other intangibles, less accumulated amortization of $200.7 ($151.2 in 2003) 456.9 472.1
Loaner instrumentation, less accumulated amortization of $375.7 ($377.4 in 2003) 202.4 134.8
Deferred income taxes 38.6 26.1
Other 36.5 30.4
1,240.7 1,156.8
$4,083.8 $3,159.1
LIABILIT IES AND STOCKHOLDERS’ EQUITY
Current Liabilities
Accounts payable $214.5 $137.8
Accrued compensation 244.0 207.9
Income taxes 187.0 138.9
Accrued expenses and other liabilities 458.7 342.5
Current maturities of long-term debt 9.3 7.3
Total current liabilities 1,113.5 834.4
Long-Term Debt, Excluding Current Maturities 0.7 18.8
Other Liabilities 217.6 151.1
Stockholders’ Equity
Common stock, $.10 par value:
Authorized—1,000.0 shares
Outstanding—402.5 shares (399.4 in 2003) 40.3 39.9
Additional paid-in capital 218.1 150.2
Retained earnings 2,297.6 1,868.1
Deferred stock-based compensation (2.3) (3.0)
Accumulated other comprehensive gain 198.3 99.6
Total stockholders’ equity 2,752.0 2,154.8
$4,083.8 $3,159.1See accompanying notes to Consolidated Financial Statements.
CONSOLIDATED BALANCE SHEETS Stryker Corporation and Subsidiaries
(in millions, except per share amounts)
46
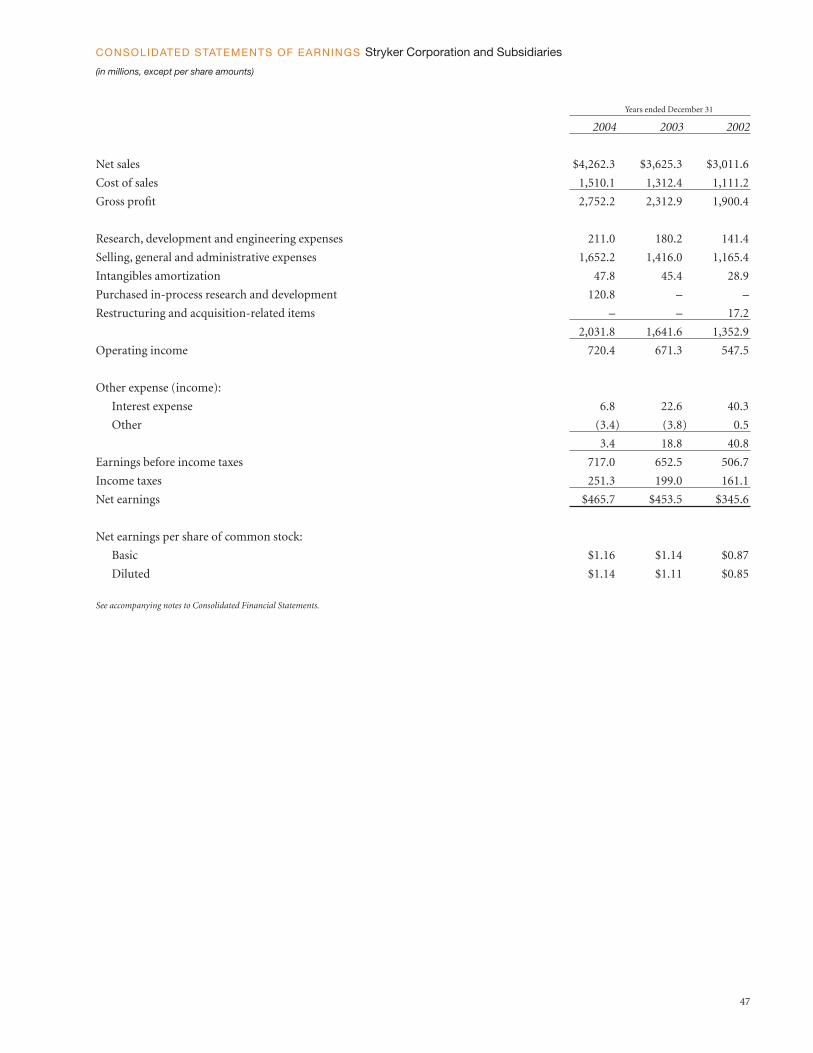
47
Years ended December 31
2004 2003 2002
Net sales $4,262.3 $3,625.3 $3,011.6
Cost of sales 1,510.1 1,312.4 1,111.2
Gross profit 2,752.2 2,312.9 1,900.4
Research, development and engineering expenses 211.0 180.2 141.4
Selling, general and administrative expenses 1,652.2 1,416.0 1,165.4
Intangibles amortization 47.8 45.4 28.9
Purchased in-process research and development 120.8 – –
Restructuring and acquisition-related items – – 17.2
2,031.8 1,641.6 1,352.9
Operating income 720.4 671.3 547.5
Other expense (income):
Interest expense 6.8 22.6 40.3
Other (3.4) (3.8) 0.5
3.4 18.8 40.8
Earnings before income taxes 717.0 652.5 506.7
Income taxes 251.3 199.0 161.1
Net earnings $465.7 $453.5 $345.6
Net earnings per share of common stock:
Basic $1.16 $1.14 $0.87
Diluted $1.14 $1.11 $0.85
See accompanying notes to Consolidated Financial Statements.
CONSOLIDATED STATEMENTS OF EARNINGS Stryker Corporation and Subsidiaries
(in millions, except per share amounts)
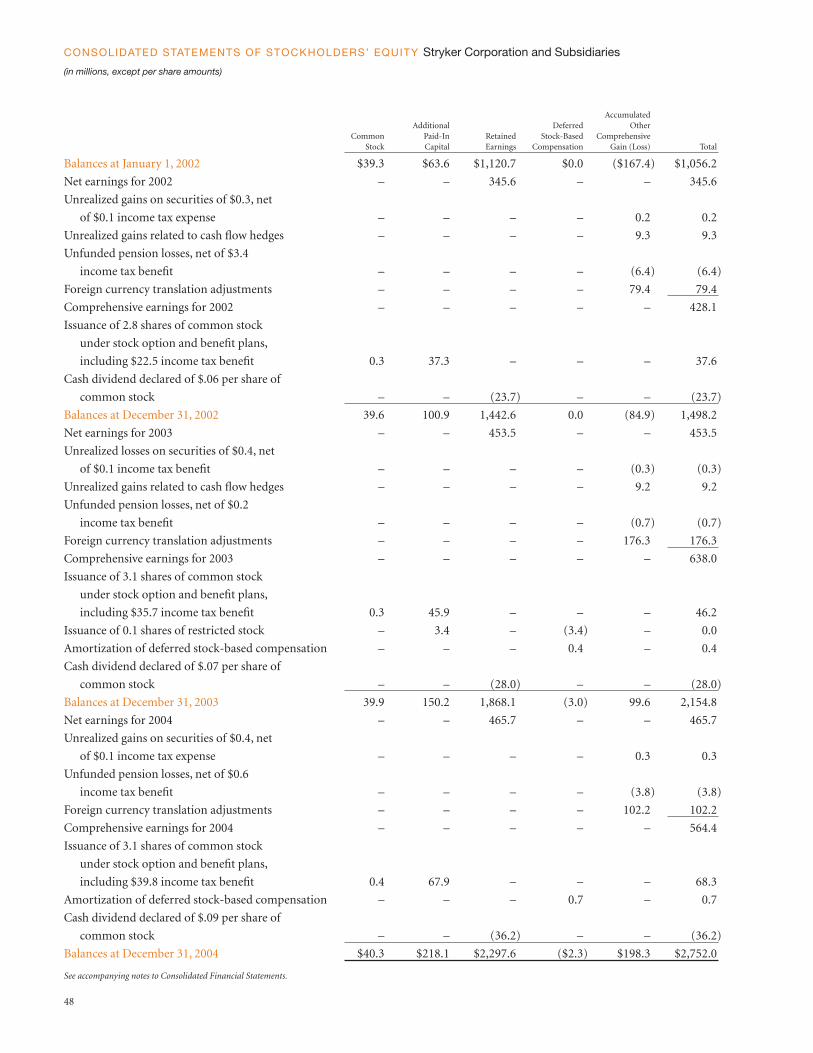
AccumulatedAdditional Deferred Other
Common Paid-In Retained Stock-Based ComprehensiveStock Capital Earnings Compensation Gain (Loss) Total
Balances at January 1, 2002 $39.3 $63.6 $1,120.7 $0.0 ($167.4) $1,056.2
Net earnings for 2002 – – 345.6 – – 345.6
Unrealized gains on securities of $0.3, net
of $0.1 income tax expense – – – – 0.2 0.2
Unrealized gains related to cash flow hedges – – – – 9.3 9.3
Unfunded pension losses, net of $3.4
income tax benefit – – – – (6.4) (6.4)
Foreign currency translation adjustments – – – – 79.4 79.4
Comprehensive earnings for 2002 – – – – – 428.1
Issuance of 2.8 shares of common stock
under stock option and benefit plans,
including $22.5 income tax benefit 0.3 37.3 – – – 37.6
Cash dividend declared of $.06 per share of
common stock – – (23.7) – – (23.7)
Balances at December 31, 2002 39.6 100.9 1,442.6 0.0 (84.9) 1,498.2
Net earnings for 2003 – – 453.5 – – 453.5
Unrealized losses on securities of $0.4, net
of $0.1 income tax benefit – – – – (0.3) (0.3)
Unrealized gains related to cash flow hedges – – – – 9.2 9.2
Unfunded pension losses, net of $0.2
income tax benefit – – – – (0.7) (0.7)
Foreign currency translation adjustments – – – – 176.3 176.3
Comprehensive earnings for 2003 – – – – – 638.0
Issuance of 3.1 shares of common stock
under stock option and benefit plans,
including $35.7 income tax benefit 0.3 45.9 – – – 46.2
Issuance of 0.1 shares of restricted stock – 3.4 – (3.4) – 0.0
Amortization of deferred stock-based compensation – – – 0.4 – 0.4
Cash dividend declared of $.07 per share of
common stock – – (28.0) – – (28.0)
Balances at December 31, 2003 39.9 150.2 1,868.1 (3.0) 99.6 2,154.8
Net earnings for 2004 – – 465.7 – – 465.7
Unrealized gains on securities of $0.4, net
of $0.1 income tax expense – – – – 0.3 0.3
Unfunded pension losses, net of $0.6
income tax benefit – – – – (3.8) (3.8)
Foreign currency translation adjustments – – – – 102.2 102.2
Comprehensive earnings for 2004 – – – – – 564.4
Issuance of 3.1 shares of common stock
under stock option and benefit plans,
including $39.8 income tax benefit 0.4 67.9 – – – 68.3
Amortization of deferred stock-based compensation – – – 0.7 – 0.7
Cash dividend declared of $.09 per share of
common stock – – (36.2) – – (36.2)
Balances at December 31, 2004 $40.3 $218.1 $2,297.6 ($2.3) $198.3 $2,752.0
See accompanying notes to Consolidated Financial Statements.
CONSOLIDATED STATEMENTS OF STOCKHOLDERS’ EQUITY Stryker Corporation and Subsidiaries
(in millions, except per share amounts)
48
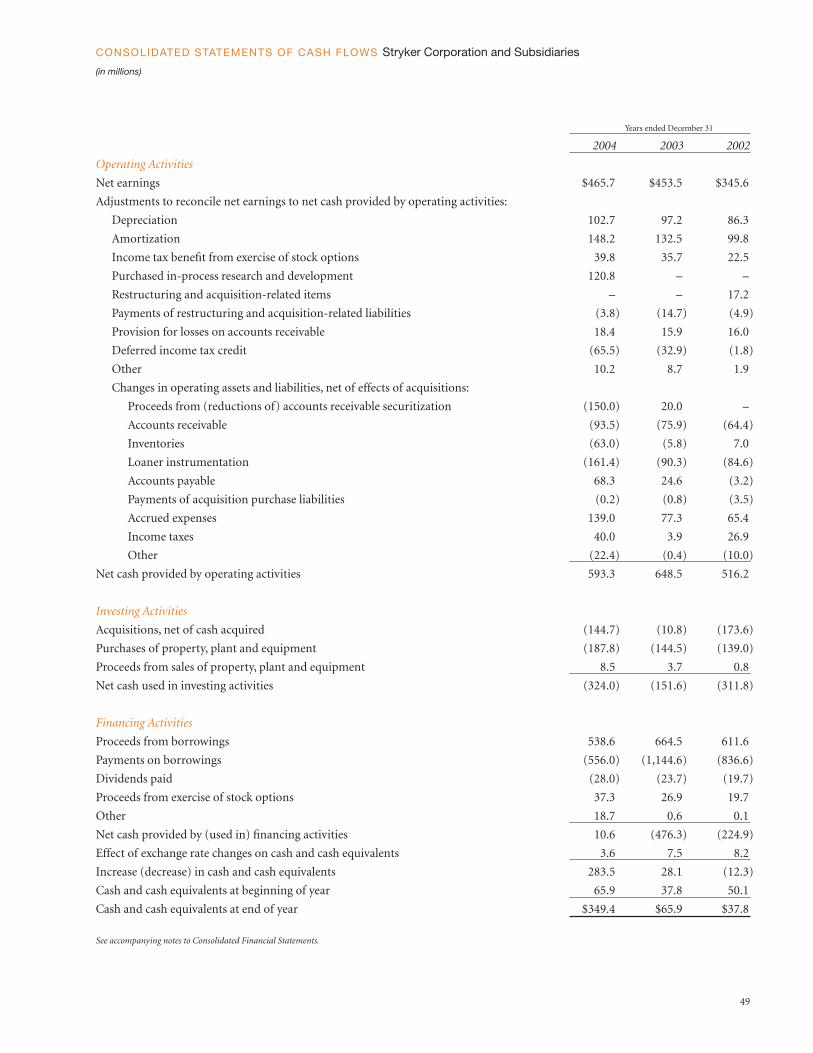
49
Years ended December 31
2004 2003 2002
Operating Activities
Net earnings $465.7 $453.5 $345.6
Adjustments to reconcile net earnings to net cash provided by operating activities:
Depreciation 102.7 97.2 86.3
Amortization 148.2 132.5 99.8
Income tax benefit from exercise of stock options 39.8 35.7 22.5
Purchased in-process research and development 120.8 – –
Restructuring and acquisition-related items – – 17.2
Payments of restructuring and acquisition-related liabilities (3.8) (14.7) (4.9)
Provision for losses on accounts receivable 18.4 15.9 16.0
Deferred income tax credit (65.5) (32.9) (1.8)
Other 10.2 8.7 1.9
Changes in operating assets and liabilities, net of effects of acquisitions:
Proceeds from (reductions of) accounts receivable securitization (150.0) 20.0 –
Accounts receivable (93.5) (75.9) (64.4)
Inventories (63.0) (5.8) 7.0
Loaner instrumentation (161.4) (90.3) (84.6)
Accounts payable 68.3 24.6 (3.2)
Payments of acquisition purchase liabilities (0.2) (0.8) (3.5)
Accrued expenses 139.0 77.3 65.4
Income taxes 40.0 3.9 26.9
Other (22.4) (0.4) (10.0)
Net cash provided by operating activities 593.3 648.5 516.2
Investing Activities
Acquisitions, net of cash acquired (144.7) (10.8) (173.6)
Purchases of property, plant and equipment (187.8) (144.5) (139.0)
Proceeds from sales of property, plant and equipment 8.5 3.7 0.8
Net cash used in investing activities (324.0) (151.6) (311.8)
Financing Activities
Proceeds from borrowings 538.6 664.5 611.6
Payments on borrowings (556.0) (1,144.6) (836.6)
Dividends paid (28.0) (23.7) (19.7)
Proceeds from exercise of stock options 37.3 26.9 19.7
Other 18.7 0.6 0.1
Net cash provided by (used in) financing activities 10.6 (476.3) (224.9)
Effect of exchange rate changes on cash and cash equivalents 3.6 7.5 8.2
Increase (decrease) in cash and cash equivalents 283.5 28.1 (12.3)
Cash and cash equivalents at beginning of year 65.9 37.8 50.1
Cash and cash equivalents at end of year $349.4 $65.9 $37.8
See accompanying notes to Consolidated Financial Statements.
CONSOLIDATED STATEMENTS OF CASH FLOWS Stryker Corporation and Subsidiaries
(in millions)
50
NOTE 1
SIGNIFICANT ACCOUNTING POLICIES
Business: Stryker Corporation (the “Company”or “Stryker”) develops, manufactures and markets joint replacements, trauma, spine
and micro implant systems, orthobiologics, powered surgical instruments, surgical navigation systems and endoscopic products, as well
as patient handling and emergency medical equipment. Stryker also provides outpatient physical therapy services in the United States.
Principles of Consolidation: The Consolidated Financial Statements include the accounts of the Company and its majority-owned
subsidiaries after elimination of intercompany accounts and transactions.
Revenue Recognition: A significant portion of the Company’s Orthopaedic Implants revenue is generated from consigned inven-
tory maintained at hospitals or with field representatives. For these products, revenue is recognized at the time the Company receives
appropriate notification that the product has been used or implanted. The Company records revenue from MedSurg Equipment prod-
uct sales when title and risk of ownership have been transferred to the customer, which is typically upon shipment to the customer. For
its Physical Therapy Services line of business, the Company records revenue when the services have been rendered. The Company records
estimated sales returns, discounts and other applicable adjustments as a reduction of net sales in the same period revenue is recognized.
Shipping and Handling of Products: Amounts billed to customers for shipping and handling of products are included in net sales.
Costs incurred related to shipping and handling of products are included in cost of sales.
Use of Estimates: The preparation of these Consolidated Financial Statements in conformity with accounting principles generally
accepted in the United States requires Company management to make estimates and assumptions that affect the amounts reported
in the Consolidated Financial Statements and accompanying notes. Actual results could differ from those estimates.
Foreign Currency Translation: The functional currencies for substantially all of the Company’s international affiliates are their local
currencies. Accordingly, the financial statements of these international affiliates are translated into United States dollars using cur-
rent exchange rates for balance sheets and average exchange rates for statements of earnings and cash flows. Unrealized translation
adjustments are included in accumulated other comprehensive gain (loss) in stockholders’ equity. Transaction gains and losses, such
as those resulting from the settlement of nonfunctional currency receivables or payables, are included in net earnings.
Cash Equivalents and Investments: Cash equivalents are highly liquid investments with a maturity of three months or less when
purchased. Investments include marketable equity securities and other investments classified in other assets. Other investments
consist primarily of mutual funds that are acquired to offset changes in certain liabilities related to deferred compensation arrange-
ments and are expected to be used to settle these liabilities.
The Company’s investments are stated at fair value based on quoted market prices. Interest, dividends and realized gains and losses
on the sale of cash equivalents and marketable equity securities are included in other expense (income). Adjustments to the fair value
of marketable equity securities and other investments that are classified as available-for-sale are recorded as increases or decreases,
net of income taxes, within accumulated other comprehensive gain (loss) in stockholders’ equity. Adjustments to the fair value of
other investments that are classified as trading are recorded in earnings as offsets to the related changes in liabilities under deferred
compensation arrangements.
Accounts Receivable: Accounts receivable consists of trade and other miscellaneous receivables. The Company maintains an
allowance for doubtful accounts for estimated losses in the collection of accounts receivable. The Company makes estimates regard-
ing the future ability of its customers to make required payments based on historical credit experience and expected future trends.
Accounts Receivable Securitization: As amended and restated on April 24, 2003, the Company has an accounts receivable securiti-
zation facility pursuant to which certain subsidiaries of the Company sell on an ongoing basis all of their domestic accounts
receivable to Stryker Funding Corporation (SFC), a wholly owned special-purpose subsidiary of the Company, which in turn may
sell up to an aggregate of a $200.0 undivided percentage ownership interest in such receivables to bank-administered multiseller
commercial paper conduits. Creditors of SFC have a claim to its assets before any equity becomes available to the Company.
NOTES TO CONSOLIDATED FINANCIAL STATEMENTS Stryker Corporation and Subsidiaries
December 31, 2004
(in millions, except per share amounts)
51
There were no amounts of undivided percentage ownership interests in accounts receivable sold by SFC under the facility as of
December 31, 2004 and $150.0, net of SFC’s retained interest, at December 31, 2003. The accounts receivable sold are reflected in the
consolidated balance sheet at December 31, 2003 as a reduction of accounts receivable. The amount of receivables sold is subject to
change monthly, based on the level of defined eligible receivables less contractual reserves. The Company’s retained interest in accounts
receivable held by SFC, which is in the form of a subordinated note, represents an overcollateralization of the undivided interest sold.
This retained interest totaled $320.3 and $107.1 at December 31, 2004 and 2003, respectively. Discount expense associated with the
securitization facility, including the conduit’s financing cost of issuing its commercial paper, was $1.3 in 2004, $2.6 in 2003 and $2.7
in 2002 and is included in selling, general and administrative expenses.
Inventories: Inventories are stated at the lower of cost or market. Cost for approximately 83% of inventories is determined using
the lower of first-in, first-out (FIFO) cost or market. Cost for certain domestic inventories is determined using the last-in, first-out
(LIFO) cost method. The FIFO cost for all inventories approximates replacement cost.
The Company maintains reserves for excess and obsolete inventory resulting from the potential inability to sell its products at
prices in excess of current carrying costs. The markets in which the Company operates are highly competitive, with new products
and surgical procedures introduced on an ongoing basis. Such marketplace changes may cause the Company’s products to become
obsolete. The Company makes estimates regarding the future recoverability of the cost of these products and records a provision for
excess and obsolete inventories based on historical experience, expiration of sterilization dates and expected future trends.
Property, Plant and Equipment: Property, plant and equipment is stated at cost. Depreciation is computed by either the straight-
line or declining-balance method over the estimated useful lives of 3 to 30 years for buildings and improvements and 3 to 10 years
for machinery and equipment.
Goodwill and Other Intangible Assets: Goodwill represents the excess of purchase price over fair value of tangible net assets of acquired
businesses after amounts allocated to other intangible assets. Other intangible assets include developed technology, which is
amortized on a straight-line basis over 20 years, and customer relationships (which reflect expected continued customer patronage),
trademarks and patents, which are amortized on a straight-line basis over 5 to 40 years (weighted average life of 14 years for other
intangible assets).
Loaner Instrumentation: Loaner instrumentation represents the net book value of loaner instruments for surgical implants
provided to customers by the Company. Loaner instrumentation is amortized on a straight-line basis over a three-year period.
Amortization expense for loaner instrumentation is included in selling, general and administrative expenses.
Income Taxes: The Company accounts for income taxes using the liability method. Under this method, deferred income tax assets
and liabilities are determined based on differences between financial reporting and tax bases of assets and liabilities and are
measured using the enacted tax rates in effect for the years in which the differences are expected to reverse. Deferred income tax credit
represents the change in net deferred tax assets and liabilities during the year.
The Company operates in multiple tax jurisdictions both inside and outside the United States. Accordingly, management must
determine the appropriate allocation of income to each of these jurisdictions. Tax audits associated with the allocation of this income
and other complex issues may require an extended period of time to resolve and may result in income tax adjustments if changes to
the income allocation are required between jurisdictions with different tax rates. Because tax adjustments in certain jurisdictions can
be significant, the Company records accruals representing management’s best estimate of the probable resolution of these matters.
To the extent additional information becomes available, such accruals are adjusted to reflect the revised estimated probable outcome.
Derivative Financial Instruments: The Company uses derivative financial instruments to manage the economic impact of fluctu-
ations in currency exchange rates. The Company enters into forward currency exchange contracts to manage these economic risks.
From 1998 through December 2003, the Company entered into interest rate swap contracts with various maturity dates to manage
the economic impact of fluctuations in interest rates.
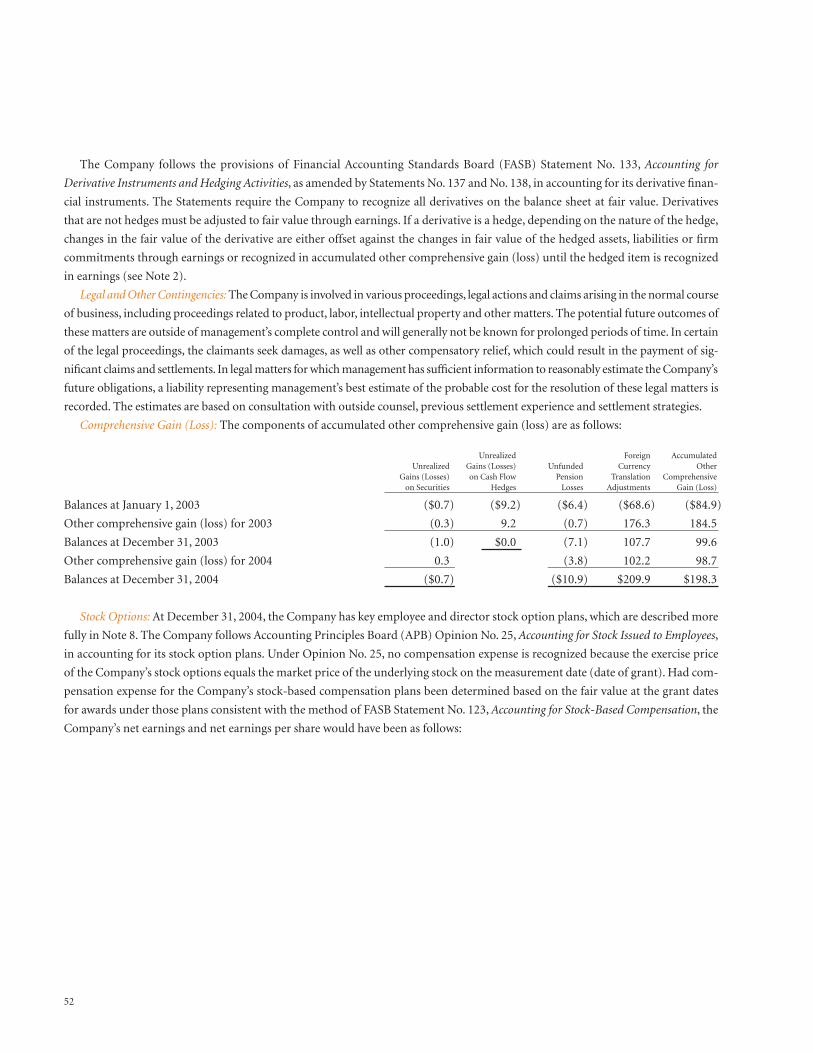
52
The Company follows the provisions of Financial Accounting Standards Board (FASB) Statement No. 133, Accounting for
Derivative Instruments and Hedging Activities, as amended by Statements No. 137 and No. 138, in accounting for its derivative finan-
cial instruments. The Statements require the Company to recognize all derivatives on the balance sheet at fair value. Derivatives
that are not hedges must be adjusted to fair value through earnings. If a derivative is a hedge, depending on the nature of the hedge,
changes in the fair value of the derivative are either offset against the changes in fair value of the hedged assets, liabilities or firm
commitments through earnings or recognized in accumulated other comprehensive gain (loss) until the hedged item is recognized
in earnings (see Note 2).
Legal and Other Contingencies: The Company is involved in various proceedings, legal actions and claims arising in the normal course
of business, including proceedings related to product, labor, intellectual property and other matters. The potential future outcomes of
these matters are outside of management’s complete control and will generally not be known for prolonged periods of time. In certain
of the legal proceedings, the claimants seek damages, as well as other compensatory relief, which could result in the payment of sig-
nificant claims and settlements. In legal matters for which management has sufficient information to reasonably estimate the Company’s
future obligations, a liability representing management’s best estimate of the probable cost for the resolution of these legal matters is
recorded. The estimates are based on consultation with outside counsel, previous settlement experience and settlement strategies.
Comprehensive Gain (Loss): The components of accumulated other comprehensive gain (loss) are as follows:
Unrealized Foreign AccumulatedUnrealized Gains (Losses) Unfunded Currency Other
Gains (Losses) on Cash Flow Pension Translation Comprehensiveon Securities Hedges Losses Adjustments Gain (Loss)
Balances at January 1, 2003 ($0.7) ($9.2) ($6.4) ($68.6) ($84.9)
Other comprehensive gain (loss) for 2003 (0.3) 9.2 (0.7) 176.3 184.5
Balances at December 31, 2003 (1.0) $0.0 (7.1) 107.7 99.6
Other comprehensive gain (loss) for 2004 0.3 (3.8) 102.2 98.7
Balances at December 31, 2004 ($0.7) ($10.9) $209.9 $198.3
Stock Options: At December 31, 2004, the Company has key employee and director stock option plans, which are described more
fully in Note 8. The Company follows Accounting Principles Board (APB) Opinion No. 25, Accounting for Stock Issued to Employees,
in accounting for its stock option plans. Under Opinion No. 25, no compensation expense is recognized because the exercise price
of the Company’s stock options equals the market price of the underlying stock on the measurement date (date of grant). Had com-
pensation expense for the Company’s stock-based compensation plans been determined based on the fair value at the grant dates
for awards under those plans consistent with the method of FASB Statement No. 123, Accounting for Stock-Based Compensation, the
Company’s net earnings and net earnings per share would have been as follows:
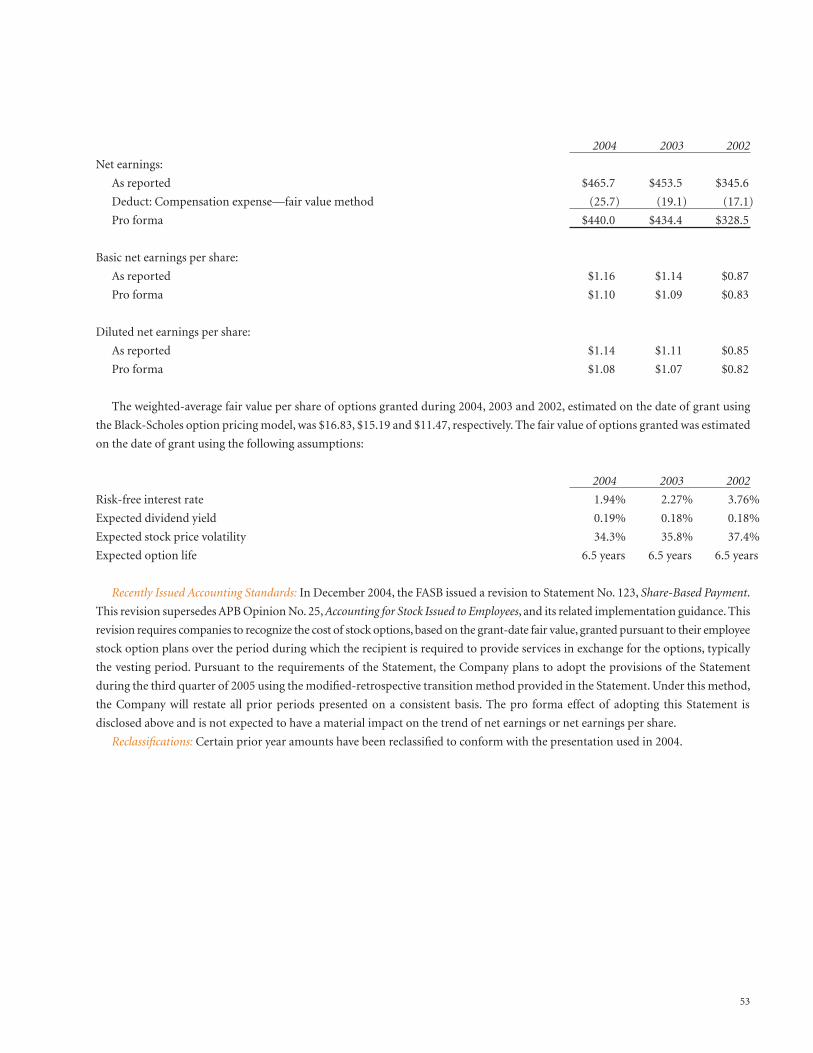
53
2004 2003 2002
Net earnings:
As reported $465.7 $453.5 $345.6
Deduct: Compensation expense—fair value method (25.7) (19.1) (17.1)
Pro forma $440.0 $434.4 $328.5
Basic net earnings per share:
As reported $1.16 $1.14 $0.87
Pro forma $1.10 $1.09 $0.83
Diluted net earnings per share:
As reported $1.14 $1.11 $0.85
Pro forma $1.08 $1.07 $0.82
The weighted-average fair value per share of options granted during 2004, 2003 and 2002, estimated on the date of grant using
the Black-Scholes option pricing model, was $16.83, $15.19 and $11.47, respectively. The fair value of options granted was estimated
on the date of grant using the following assumptions:
2004 2003 2002
Risk-free interest rate 1.94% 2.27% 3.76%
Expected dividend yield 0.19% 0.18% 0.18%
Expected stock price volatility 34.3% 35.8% 37.4%
Expected option life 6.5 years 6.5 years 6.5 years
Recently Issued Accounting Standards: In December 2004, the FASB issued a revision to Statement No. 123, Share-Based Payment.
This revision supersedes APB Opinion No. 25, Accounting for Stock Issued to Employees, and its related implementation guidance. This
revision requires companies to recognize the cost of stock options, based on the grant-date fair value, granted pursuant to their employee
stock option plans over the period during which the recipient is required to provide services in exchange for the options, typically
the vesting period. Pursuant to the requirements of the Statement, the Company plans to adopt the provisions of the Statement
during the third quarter of 2005 using the modified-retrospective transition method provided in the Statement. Under this method,
the Company will restate all prior periods presented on a consistent basis. The pro forma effect of adopting this Statement is
disclosed above and is not expected to have a material impact on the trend of net earnings or net earnings per share.
Reclassifications: Certain prior year amounts have been reclassified to conform with the presentation used in 2004.
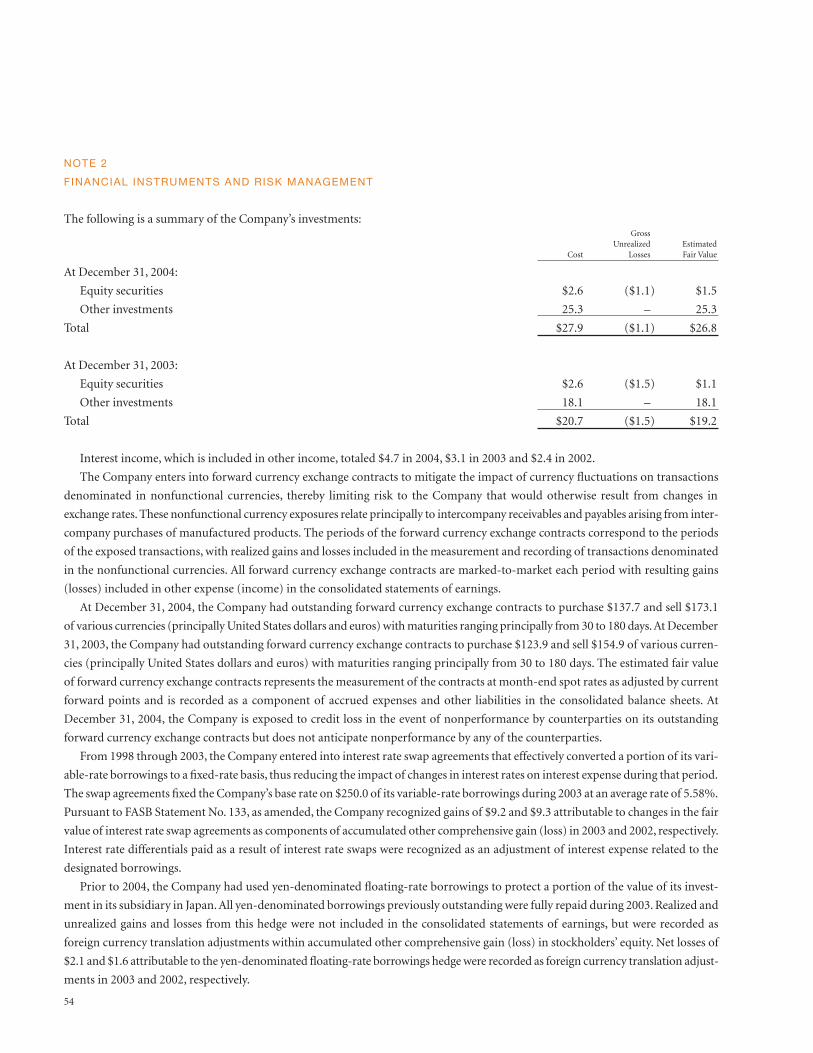
NOTE 2
FINANCIAL INSTRUMENTS AND RISK MANAGEMENT
The following is a summary of the Company’s investments:Gross
Unrealized EstimatedCost Losses Fair Value
At December 31, 2004:
Equity securities $2.6 ($1.1) $1.5
Other investments 25.3 – 25.3
Total $27.9 ($1.1) $26.8
At December 31, 2003:
Equity securities $2.6 ($1.5) $1.1
Other investments 18.1 – 18.1
Total $20.7 ($1.5) $19.2
Interest income, which is included in other income, totaled $4.7 in 2004, $3.1 in 2003 and $2.4 in 2002.
The Company enters into forward currency exchange contracts to mitigate the impact of currency fluctuations on transactions
denominated in nonfunctional currencies, thereby limiting risk to the Company that would otherwise result from changes in
exchange rates. These nonfunctional currency exposures relate principally to intercompany receivables and payables arising from inter-
company purchases of manufactured products. The periods of the forward currency exchange contracts correspond to the periods
of the exposed transactions, with realized gains and losses included in the measurement and recording of transactions denominated
in the nonfunctional currencies. All forward currency exchange contracts are marked-to-market each period with resulting gains
(losses) included in other expense (income) in the consolidated statements of earnings.
At December 31, 2004, the Company had outstanding forward currency exchange contracts to purchase $137.7 and sell $173.1
of various currencies (principally United States dollars and euros) with maturities ranging principally from 30 to 180 days.At December
31, 2003, the Company had outstanding forward currency exchange contracts to purchase $123.9 and sell $154.9 of various curren-
cies (principally United States dollars and euros) with maturities ranging principally from 30 to 180 days. The estimated fair value
of forward currency exchange contracts represents the measurement of the contracts at month-end spot rates as adjusted by current
forward points and is recorded as a component of accrued expenses and other liabilities in the consolidated balance sheets. At
December 31, 2004, the Company is exposed to credit loss in the event of nonperformance by counterparties on its outstanding
forward currency exchange contracts but does not anticipate nonperformance by any of the counterparties.
From 1998 through 2003, the Company entered into interest rate swap agreements that effectively converted a portion of its vari-
able-rate borrowings to a fixed-rate basis, thus reducing the impact of changes in interest rates on interest expense during that period.
The swap agreements fixed the Company’s base rate on $250.0 of its variable-rate borrowings during 2003 at an average rate of 5.58%.
Pursuant to FASB Statement No. 133, as amended, the Company recognized gains of $9.2 and $9.3 attributable to changes in the fair
value of interest rate swap agreements as components of accumulated other comprehensive gain (loss) in 2003 and 2002, respectively.
Interest rate differentials paid as a result of interest rate swaps were recognized as an adjustment of interest expense related to the
designated borrowings.
Prior to 2004, the Company had used yen-denominated floating-rate borrowings to protect a portion of the value of its invest-
ment in its subsidiary in Japan. All yen-denominated borrowings previously outstanding were fully repaid during 2003. Realized and
unrealized gains and losses from this hedge were not included in the consolidated statements of earnings, but were recorded as
foreign currency translation adjustments within accumulated other comprehensive gain (loss) in stockholders’ equity. Net losses of
$2.1 and $1.6 attributable to the yen-denominated floating-rate borrowings hedge were recorded as foreign currency translation adjust-
ments in 2003 and 2002, respectively.
54
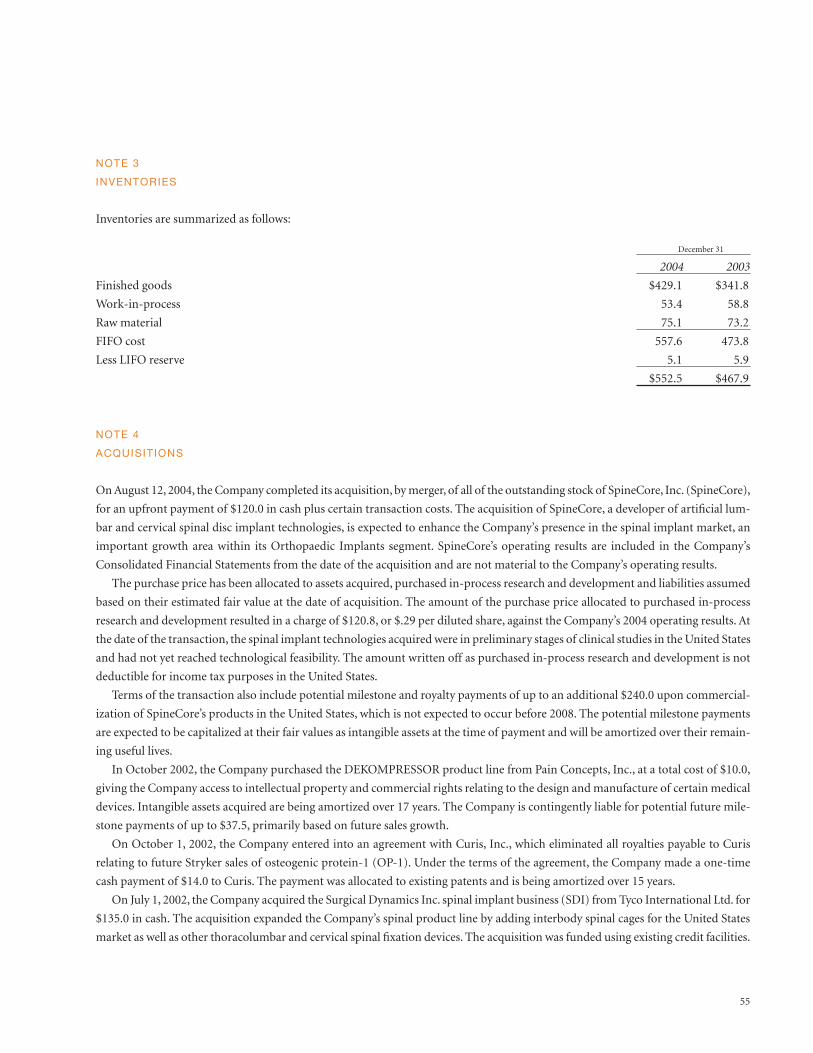
55
NOTE 3
INVENTORIES
Inventories are summarized as follows:
December 31
2004 2003
Finished goods $429.1 $341.8
Work-in-process 53.4 58.8
Raw material 75.1 73.2
FIFO cost 557.6 473.8
Less LIFO reserve 5.1 5.9
$552.5 $467.9
NOTE 4
ACQUISITIONS
On August 12, 2004, the Company completed its acquisition, by merger, of all of the outstanding stock of SpineCore, Inc. (SpineCore),
for an upfront payment of $120.0 in cash plus certain transaction costs. The acquisition of SpineCore, a developer of artificial lum-
bar and cervical spinal disc implant technologies, is expected to enhance the Company’s presence in the spinal implant market, an
important growth area within its Orthopaedic Implants segment. SpineCore’s operating results are included in the Company’s
Consolidated Financial Statements from the date of the acquisition and are not material to the Company’s operating results.
The purchase price has been allocated to assets acquired, purchased in-process research and development and liabilities assumed
based on their estimated fair value at the date of acquisition. The amount of the purchase price allocated to purchased in-process
research and development resulted in a charge of $120.8, or $.29 per diluted share, against the Company’s 2004 operating results. At
the date of the transaction, the spinal implant technologies acquired were in preliminary stages of clinical studies in the United States
and had not yet reached technological feasibility. The amount written off as purchased in-process research and development is not
deductible for income tax purposes in the United States.
Terms of the transaction also include potential milestone and royalty payments of up to an additional $240.0 upon commercial-
ization of SpineCore’s products in the United States, which is not expected to occur before 2008. The potential milestone payments
are expected to be capitalized at their fair values as intangible assets at the time of payment and will be amortized over their remain-
ing useful lives.
In October 2002, the Company purchased the DEKOMPRESSOR product line from Pain Concepts, Inc., at a total cost of $10.0,
giving the Company access to intellectual property and commercial rights relating to the design and manufacture of certain medical
devices. Intangible assets acquired are being amortized over 17 years. The Company is contingently liable for potential future mile-
stone payments of up to $37.5, primarily based on future sales growth.
On October 1, 2002, the Company entered into an agreement with Curis, Inc., which eliminated all royalties payable to Curis
relating to future Stryker sales of osteogenic protein-1 (OP-1). Under the terms of the agreement, the Company made a one-time
cash payment of $14.0 to Curis. The payment was allocated to existing patents and is being amortized over 15 years.
On July 1, 2002, the Company acquired the Surgical Dynamics Inc. spinal implant business (SDI) from Tyco International Ltd. for
$135.0 in cash. The acquisition expanded the Company’s spinal product line by adding interbody spinal cages for the United States
market as well as other thoracolumbar and cervical spinal fixation devices. The acquisition was funded using existing credit facilities.
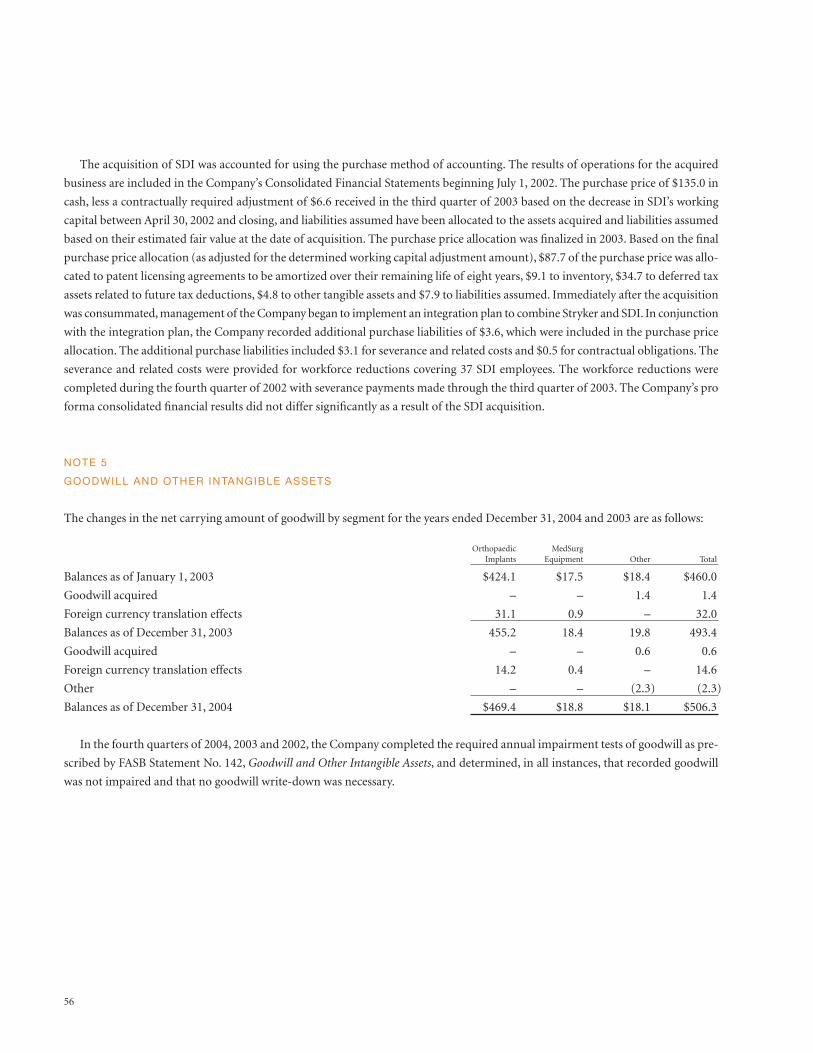
56
The acquisition of SDI was accounted for using the purchase method of accounting. The results of operations for the acquired
business are included in the Company’s Consolidated Financial Statements beginning July 1, 2002. The purchase price of $135.0 in
cash, less a contractually required adjustment of $6.6 received in the third quarter of 2003 based on the decrease in SDI’s working
capital between April 30, 2002 and closing, and liabilities assumed have been allocated to the assets acquired and liabilities assumed
based on their estimated fair value at the date of acquisition. The purchase price allocation was finalized in 2003. Based on the final
purchase price allocation (as adjusted for the determined working capital adjustment amount), $87.7 of the purchase price was allo-
cated to patent licensing agreements to be amortized over their remaining life of eight years, $9.1 to inventory, $34.7 to deferred tax
assets related to future tax deductions, $4.8 to other tangible assets and $7.9 to liabilities assumed. Immediately after the acquisition
was consummated, management of the Company began to implement an integration plan to combine Stryker and SDI. In conjunction
with the integration plan, the Company recorded additional purchase liabilities of $3.6, which were included in the purchase price
allocation. The additional purchase liabilities included $3.1 for severance and related costs and $0.5 for contractual obligations. The
severance and related costs were provided for workforce reductions covering 37 SDI employees. The workforce reductions were
completed during the fourth quarter of 2002 with severance payments made through the third quarter of 2003. The Company’s pro
forma consolidated financial results did not differ significantly as a result of the SDI acquisition.
NOTE 5
GOODWILL AND OTHER INTANGIBLE ASSETS
The changes in the net carrying amount of goodwill by segment for the years ended December 31, 2004 and 2003 are as follows:
Orthopaedic MedSurgImplants Equipment Other Total
Balances as of January 1, 2003 $424.1 $17.5 $18.4 $460.0
Goodwill acquired – – 1.4 1.4
Foreign currency translation effects 31.1 0.9 – 32.0
Balances as of December 31, 2003 455.2 18.4 19.8 493.4
Goodwill acquired – – 0.6 0.6
Foreign currency translation effects 14.2 0.4 – 14.6
Other – – (2.3) (2.3)
Balances as of December 31, 2004 $469.4 $18.8 $18.1 $506.3
In the fourth quarters of 2004, 2003 and 2002, the Company completed the required annual impairment tests of goodwill as pre-
scribed by FASB Statement No. 142, Goodwill and Other Intangible Assets, and determined, in all instances, that recorded goodwill
was not impaired and that no goodwill write-down was necessary.
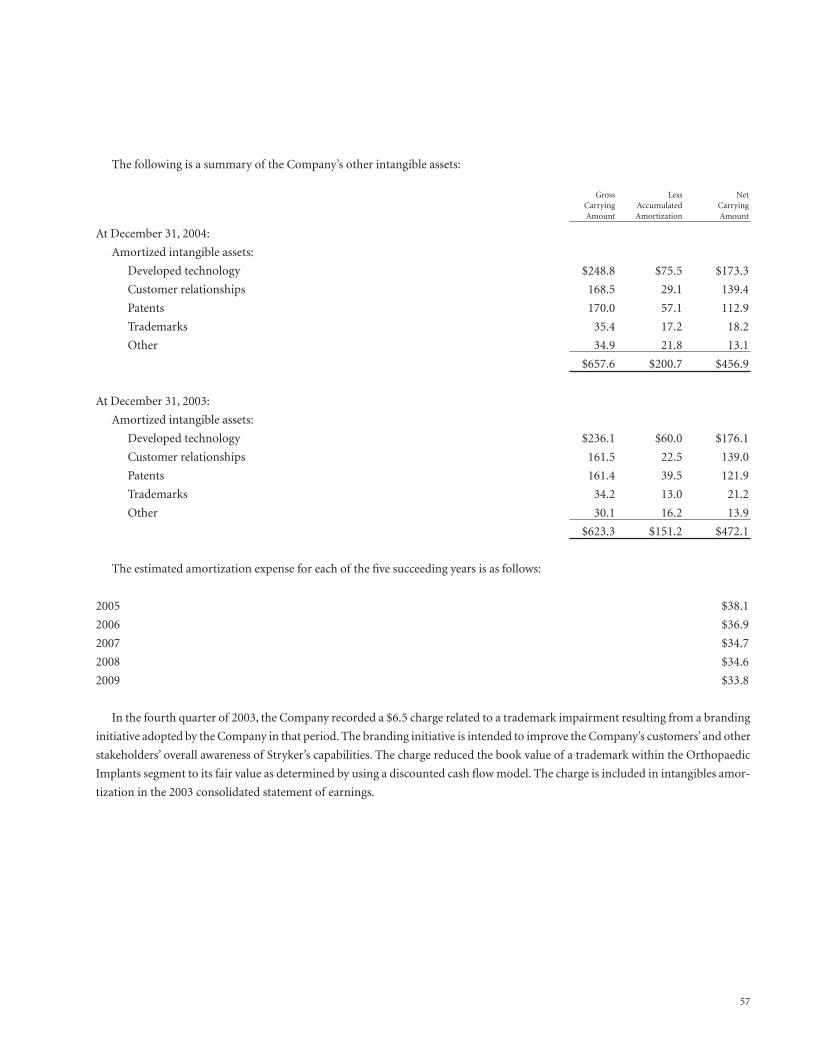
57
The following is a summary of the Company’s other intangible assets:
Gross Less NetCarrying Accumulated CarryingAmount Amortization Amount
At December 31, 2004:
Amortized intangible assets:
Developed technology $248.8 $75.5 $173.3
Customer relationships 168.5 29.1 139.4
Patents 170.0 57.1 112.9
Trademarks 35.4 17.2 18.2
Other 34.9 21.8 13.1
$657.6 $200.7 $456.9
At December 31, 2003:
Amortized intangible assets:
Developed technology $236.1 $60.0 $176.1
Customer relationships 161.5 22.5 139.0
Patents 161.4 39.5 121.9
Trademarks 34.2 13.0 21.2
Other 30.1 16.2 13.9
$623.3 $151.2 $472.1
The estimated amortization expense for each of the five succeeding years is as follows:
2005 $38.1
2006 $36.9
2007 $34.7
2008 $34.6
2009 $33.8
In the fourth quarter of 2003, the Company recorded a $6.5 charge related to a trademark impairment resulting from a branding
initiative adopted by the Company in that period. The branding initiative is intended to improve the Company’s customers’ and other
stakeholders’ overall awareness of Stryker’s capabilities. The charge reduced the book value of a trademark within the Orthopaedic
Implants segment to its fair value as determined by using a discounted cash flow model. The charge is included in intangibles amor-
tization in the 2003 consolidated statement of earnings.
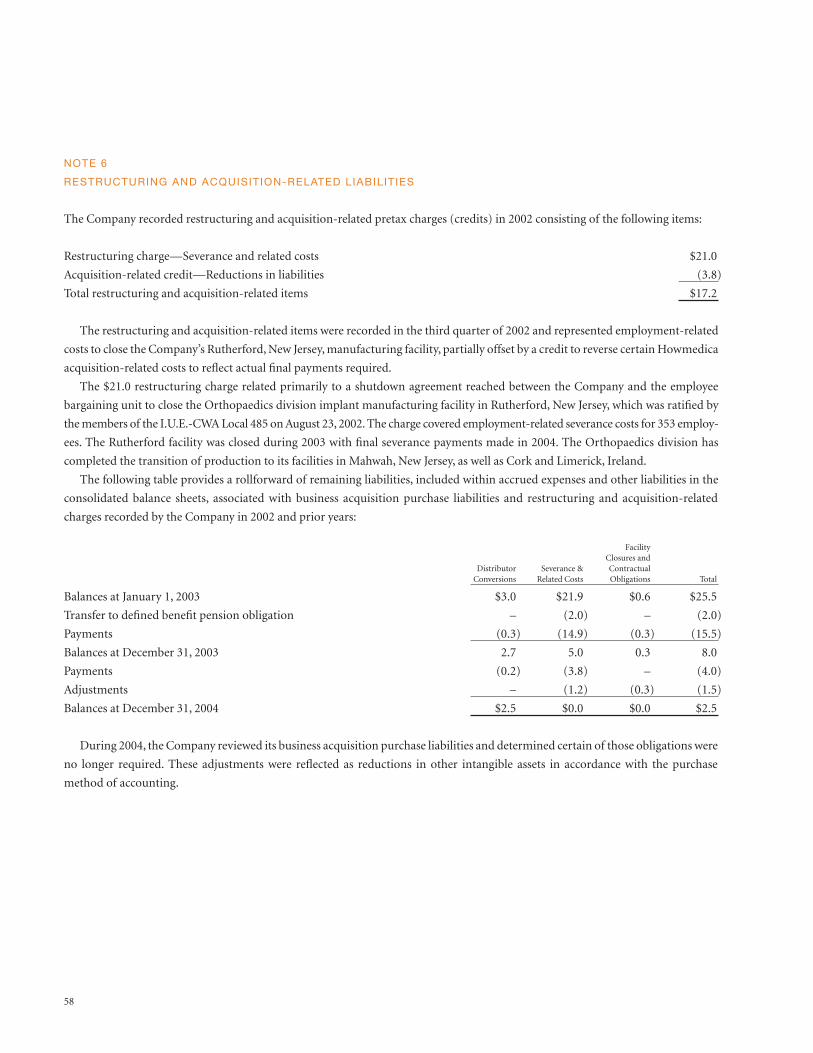
58
NOTE 6
RESTRUCTURING AND ACQUISITION-RELATED LIABILIT IES
The Company recorded restructuring and acquisition-related pretax charges (credits) in 2002 consisting of the following items:
Restructuring charge—Severance and related costs $21.0
Acquisition-related credit—Reductions in liabilities (3.8)
Total restructuring and acquisition-related items $17.2
The restructuring and acquisition-related items were recorded in the third quarter of 2002 and represented employment-related
costs to close the Company’s Rutherford, New Jersey, manufacturing facility, partially offset by a credit to reverse certain Howmedica
acquisition-related costs to reflect actual final payments required.
The $21.0 restructuring charge related primarily to a shutdown agreement reached between the Company and the employee
bargaining unit to close the Orthopaedics division implant manufacturing facility in Rutherford, New Jersey, which was ratified by
the members of the I.U.E.-CWA Local 485 on August 23, 2002. The charge covered employment-related severance costs for 353 employ-
ees. The Rutherford facility was closed during 2003 with final severance payments made in 2004. The Orthopaedics division has
completed the transition of production to its facilities in Mahwah, New Jersey, as well as Cork and Limerick, Ireland.
The following table provides a rollforward of remaining liabilities, included within accrued expenses and other liabilities in the
consolidated balance sheets, associated with business acquisition purchase liabilities and restructuring and acquisition-related
charges recorded by the Company in 2002 and prior years:
FacilityClosures and
Distributor Severance & ContractualConversions Related Costs Obligations Total
Balances at January 1, 2003 $3.0 $21.9 $0.6 $25.5
Transfer to defined benefit pension obligation – (2.0) – (2.0)
Payments (0.3) (14.9) (0.3) (15.5)
Balances at December 31, 2003 2.7 5.0 0.3 8.0
Payments (0.2) (3.8) – (4.0)
Adjustments – (1.2) (0.3) (1.5)
Balances at December 31, 2004 $2.5 $0.0 $0.0 $2.5
During 2004, the Company reviewed its business acquisition purchase liabilities and determined certain of those obligations were
no longer required. These adjustments were reflected as reductions in other intangible assets in accordance with the purchase
method of accounting.
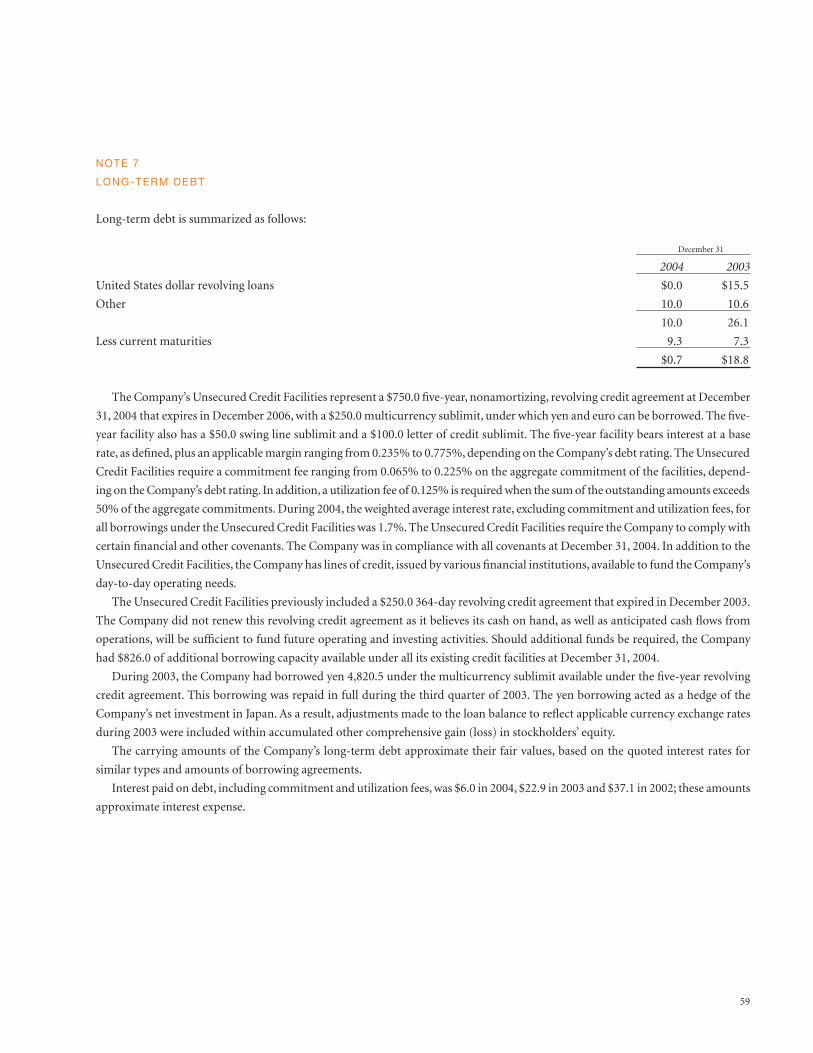
59
NOTE 7
LONG-TERM DEBT
Long-term debt is summarized as follows:
December 31
2004 2003
United States dollar revolving loans $0.0 $15.5
Other 10.0 10.6
10.0 26.1
Less current maturities 9.3 7.3
$0.7 $18.8
The Company’s Unsecured Credit Facilities represent a $750.0 five-year, nonamortizing, revolving credit agreement at December
31, 2004 that expires in December 2006, with a $250.0 multicurrency sublimit, under which yen and euro can be borrowed. The five-
year facility also has a $50.0 swing line sublimit and a $100.0 letter of credit sublimit. The five-year facility bears interest at a base
rate, as defined, plus an applicable margin ranging from 0.235% to 0.775%, depending on the Company’s debt rating. The Unsecured
Credit Facilities require a commitment fee ranging from 0.065% to 0.225% on the aggregate commitment of the facilities, depend-
ing on the Company’s debt rating. In addition, a utilization fee of 0.125% is required when the sum of the outstanding amounts exceeds
50% of the aggregate commitments. During 2004, the weighted average interest rate, excluding commitment and utilization fees, for
all borrowings under the Unsecured Credit Facilities was 1.7%. The Unsecured Credit Facilities require the Company to comply with
certain financial and other covenants. The Company was in compliance with all covenants at December 31, 2004. In addition to the
Unsecured Credit Facilities, the Company has lines of credit, issued by various financial institutions, available to fund the Company’s
day-to-day operating needs.
The Unsecured Credit Facilities previously included a $250.0 364-day revolving credit agreement that expired in December 2003.
The Company did not renew this revolving credit agreement as it believes its cash on hand, as well as anticipated cash flows from
operations, will be sufficient to fund future operating and investing activities. Should additional funds be required, the Company
had $826.0 of additional borrowing capacity available under all its existing credit facilities at December 31, 2004.
During 2003, the Company had borrowed yen 4,820.5 under the multicurrency sublimit available under the five-year revolving
credit agreement. This borrowing was repaid in full during the third quarter of 2003. The yen borrowing acted as a hedge of the
Company’s net investment in Japan. As a result, adjustments made to the loan balance to reflect applicable currency exchange rates
during 2003 were included within accumulated other comprehensive gain (loss) in stockholders’ equity.
The carrying amounts of the Company’s long-term debt approximate their fair values, based on the quoted interest rates for
similar types and amounts of borrowing agreements.
Interest paid on debt, including commitment and utilization fees, was $6.0 in 2004, $22.9 in 2003 and $37.1 in 2002; these amounts
approximate interest expense.
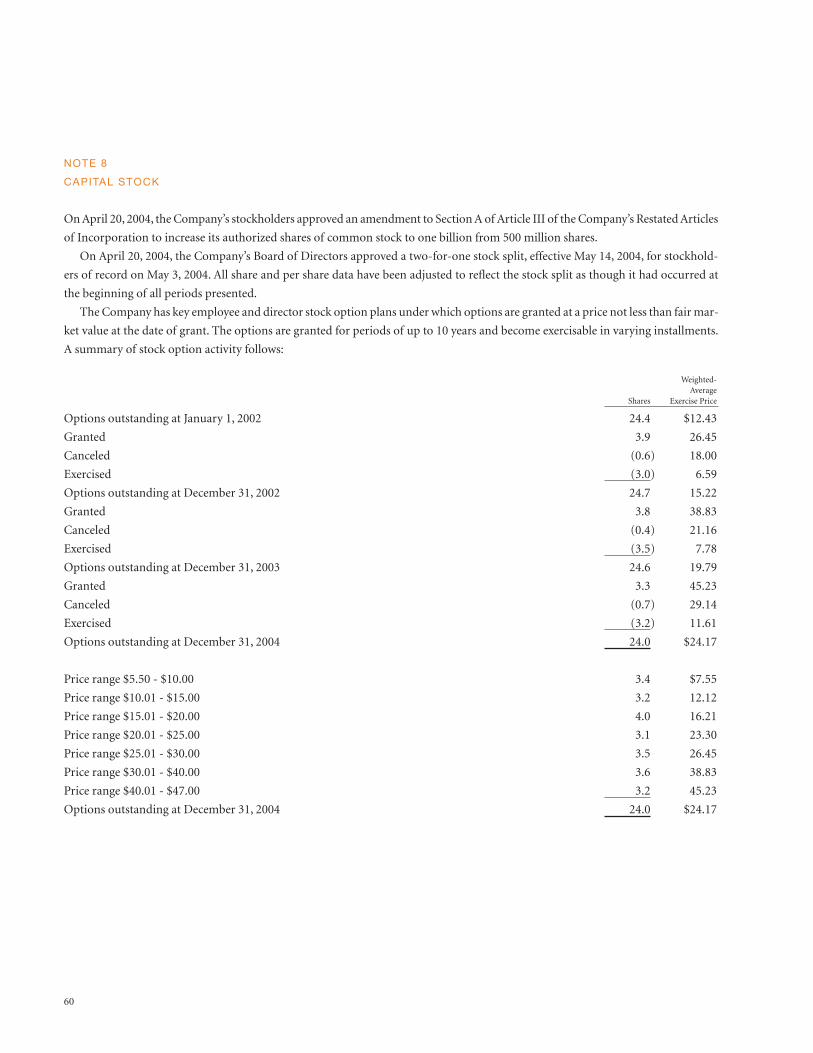
60
NOTE 8
CAPITAL STOCK
On April 20, 2004, the Company’s stockholders approved an amendment to Section A of Article III of the Company’s Restated Articles
of Incorporation to increase its authorized shares of common stock to one billion from 500 million shares.
On April 20, 2004, the Company’s Board of Directors approved a two-for-one stock split, effective May 14, 2004, for stockhold-
ers of record on May 3, 2004. All share and per share data have been adjusted to reflect the stock split as though it had occurred at
the beginning of all periods presented.
The Company has key employee and director stock option plans under which options are granted at a price not less than fair mar-
ket value at the date of grant. The options are granted for periods of up to 10 years and become exercisable in varying installments.
A summary of stock option activity follows:
Weighted-Average
Shares Exercise Price
Options outstanding at January 1, 2002 24.4 $12.43
Granted 3.9 26.45
Canceled (0.6) 18.00
Exercised (3.0) 6.59
Options outstanding at December 31, 2002 24.7 15.22
Granted 3.8 38.83
Canceled (0.4) 21.16
Exercised (3.5) 7.78
Options outstanding at December 31, 2003 24.6 19.79
Granted 3.3 45.23
Canceled (0.7) 29.14
Exercised (3.2) 11.61
Options outstanding at December 31, 2004 24.0 $24.17
Price range $5.50 - $10.00 3.4 $7.55
Price range $10.01 - $15.00 3.2 12.12
Price range $15.01 - $20.00 4.0 16.21
Price range $20.01 - $25.00 3.1 23.30
Price range $25.01 - $30.00 3.5 26.45
Price range $30.01 - $40.00 3.6 38.83
Price range $40.01 - $47.00 3.2 45.23
Options outstanding at December 31, 2004 24.0 $24.17
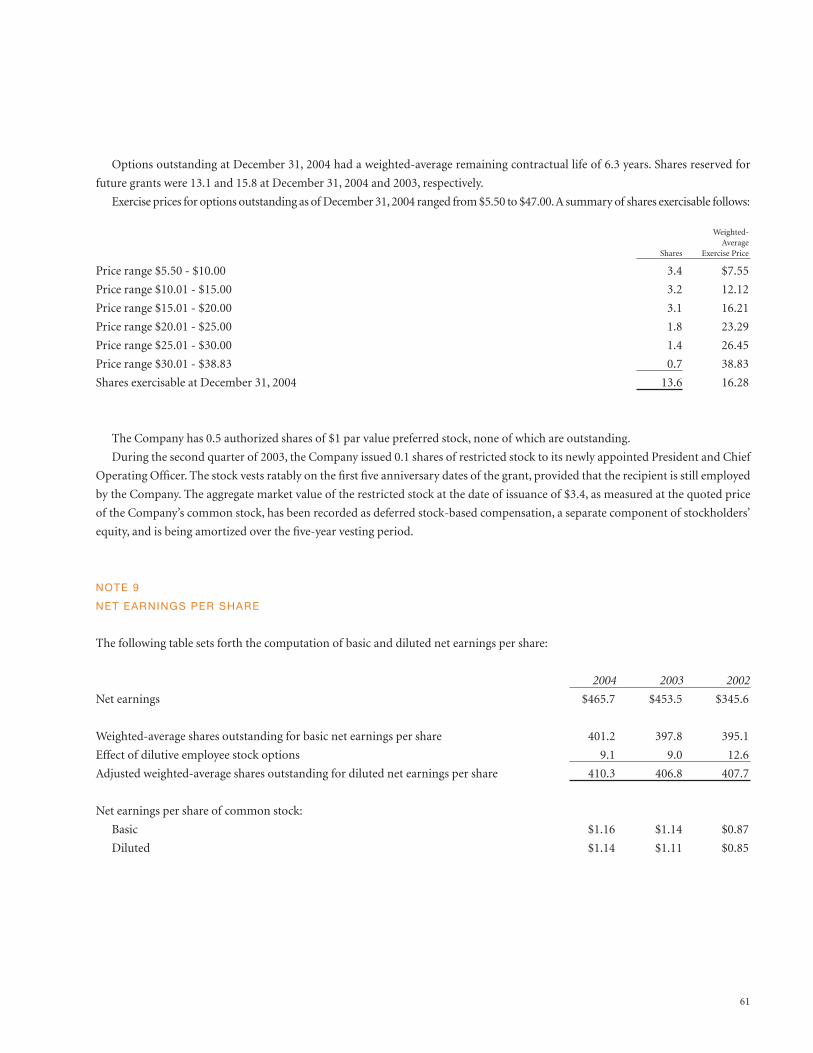
61
Options outstanding at December 31, 2004 had a weighted-average remaining contractual life of 6.3 years. Shares reserved for
future grants were 13.1 and 15.8 at December 31, 2004 and 2003, respectively.
Exercise prices for options outstanding as of December 31, 2004 ranged from $5.50 to $47.00.A summary of shares exercisable follows:
Weighted-Average
Shares Exercise Price
Price range $5.50 - $10.00 3.4 $7.55
Price range $10.01 - $15.00 3.2 12.12
Price range $15.01 - $20.00 3.1 16.21
Price range $20.01 - $25.00 1.8 23.29
Price range $25.01 - $30.00 1.4 26.45
Price range $30.01 - $38.83 0.7 38.83
Shares exercisable at December 31, 2004 13.6 16.28
The Company has 0.5 authorized shares of $1 par value preferred stock, none of which are outstanding.
During the second quarter of 2003, the Company issued 0.1 shares of restricted stock to its newly appointed President and Chief
Operating Officer. The stock vests ratably on the first five anniversary dates of the grant, provided that the recipient is still employed
by the Company. The aggregate market value of the restricted stock at the date of issuance of $3.4, as measured at the quoted price
of the Company’s common stock, has been recorded as deferred stock-based compensation, a separate component of stockholders’
equity, and is being amortized over the five-year vesting period.
NOTE 9
NET EARNINGS PER SHARE
The following table sets forth the computation of basic and diluted net earnings per share:
2004 2003 2002
Net earnings $465.7 $453.5 $345.6
Weighted-average shares outstanding for basic net earnings per share 401.2 397.8 395.1
Effect of dilutive employee stock options 9.1 9.0 12.6
Adjusted weighted-average shares outstanding for diluted net earnings per share 410.3 406.8 407.7
Net earnings per share of common stock:
Basic $1.16 $1.14 $0.87
Diluted $1.14 $1.11 $0.85
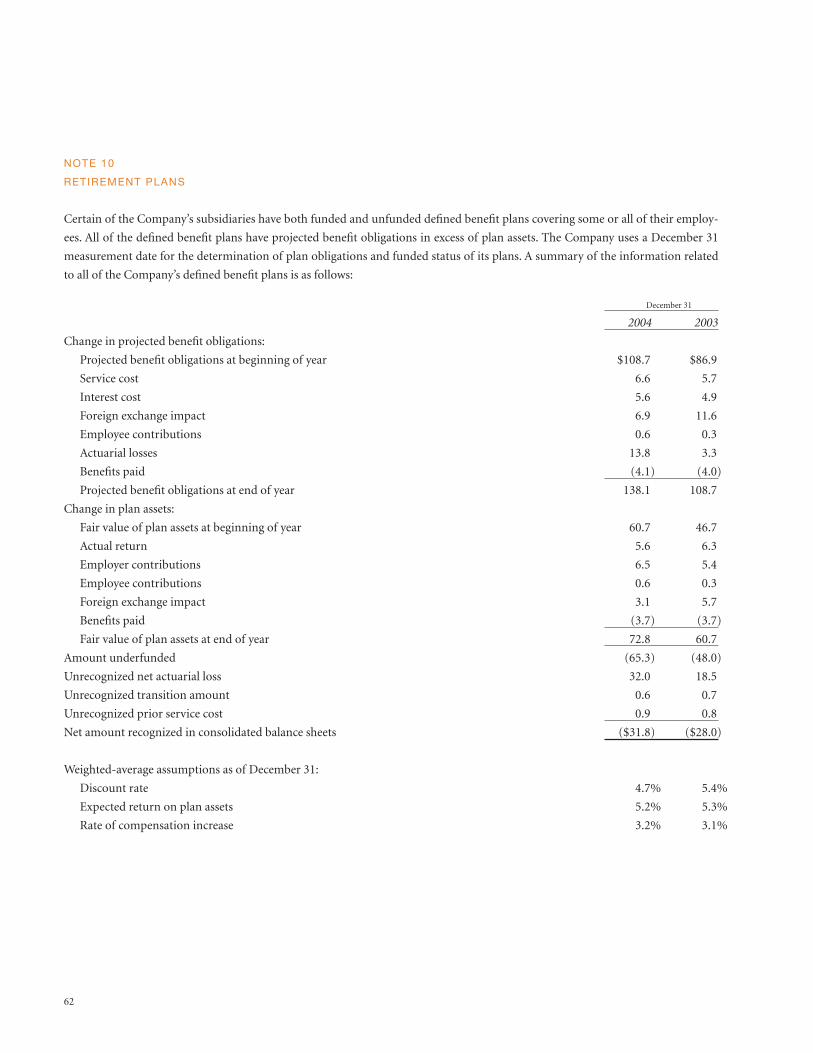
62
NOTE 10
RETIREMENT PLANS
Certain of the Company’s subsidiaries have both funded and unfunded defined benefit plans covering some or all of their employ-
ees. All of the defined benefit plans have projected benefit obligations in excess of plan assets. The Company uses a December 31
measurement date for the determination of plan obligations and funded status of its plans. A summary of the information related
to all of the Company’s defined benefit plans is as follows:
December 31
2004 2003
Change in projected benefit obligations:
Projected benefit obligations at beginning of year $108.7 $86.9
Service cost 6.6 5.7
Interest cost 5.6 4.9
Foreign exchange impact 6.9 11.6
Employee contributions 0.6 0.3
Actuarial losses 13.8 3.3
Benefits paid (4.1) (4.0)
Projected benefit obligations at end of year 138.1 108.7
Change in plan assets:
Fair value of plan assets at beginning of year 60.7 46.7
Actual return 5.6 6.3
Employer contributions 6.5 5.4
Employee contributions 0.6 0.3
Foreign exchange impact 3.1 5.7
Benefits paid (3.7) (3.7)
Fair value of plan assets at end of year 72.8 60.7
Amount underfunded (65.3) (48.0)
Unrecognized net actuarial loss 32.0 18.5
Unrecognized transition amount 0.6 0.7
Unrecognized prior service cost 0.9 0.8
Net amount recognized in consolidated balance sheets ($31.8) ($28.0)
Weighted-average assumptions as of December 31:
Discount rate 4.7% 5.4%
Expected return on plan assets 5.2% 5.3%
Rate of compensation increase 3.2% 3.1%
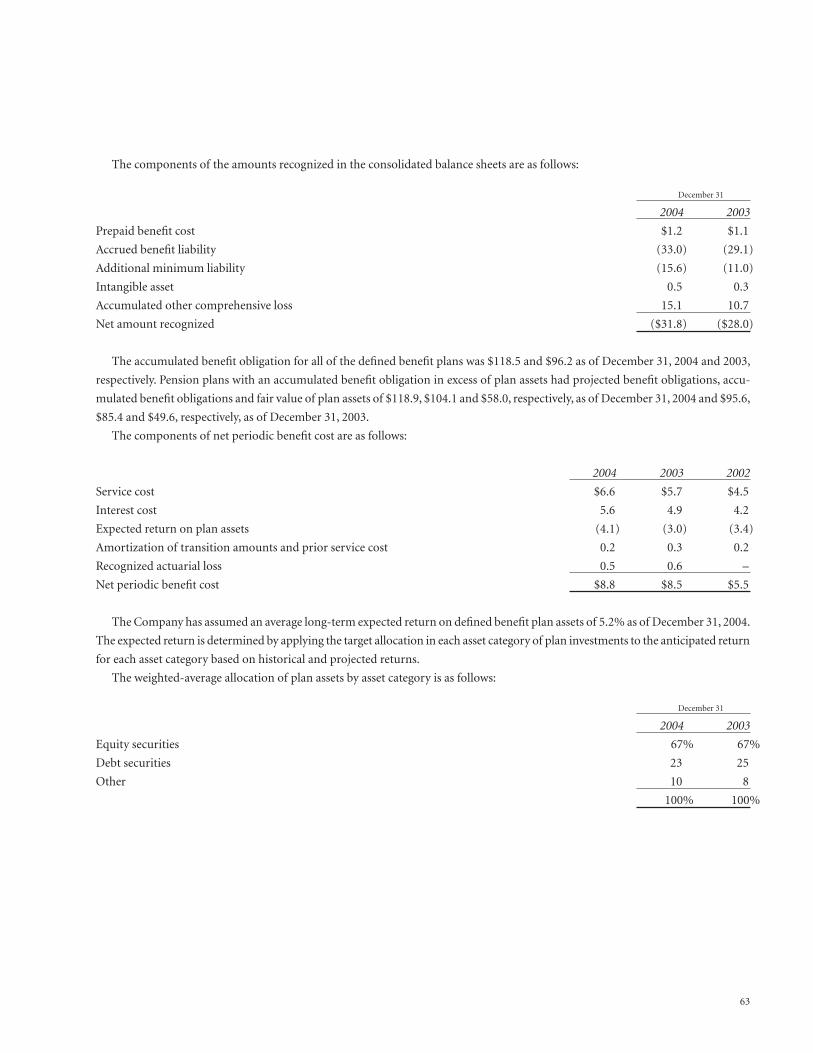
63
The components of the amounts recognized in the consolidated balance sheets are as follows:
December 31
2004 2003
Prepaid benefit cost $1.2 $1.1
Accrued benefit liability (33.0) (29.1)
Additional minimum liability (15.6) (11.0)
Intangible asset 0.5 0.3
Accumulated other comprehensive loss 15.1 10.7
Net amount recognized ($31.8) ($28.0)
The accumulated benefit obligation for all of the defined benefit plans was $118.5 and $96.2 as of December 31, 2004 and 2003,
respectively. Pension plans with an accumulated benefit obligation in excess of plan assets had projected benefit obligations, accu-
mulated benefit obligations and fair value of plan assets of $118.9, $104.1 and $58.0, respectively, as of December 31, 2004 and $95.6,
$85.4 and $49.6, respectively, as of December 31, 2003.
The components of net periodic benefit cost are as follows:
2004 2003 2002
Service cost $6.6 $5.7 $4.5
Interest cost 5.6 4.9 4.2
Expected return on plan assets (4.1) (3.0) (3.4)
Amortization of transition amounts and prior service cost 0.2 0.3 0.2
Recognized actuarial loss 0.5 0.6 –
Net periodic benefit cost $8.8 $8.5 $5.5
The Company has assumed an average long-term expected return on defined benefit plan assets of 5.2% as of December 31, 2004.
The expected return is determined by applying the target allocation in each asset category of plan investments to the anticipated return
for each asset category based on historical and projected returns.
The weighted-average allocation of plan assets by asset category is as follows:
December 31
2004 2003
Equity securities 67% 67%
Debt securities 23 25
Other 10 8
100% 100%
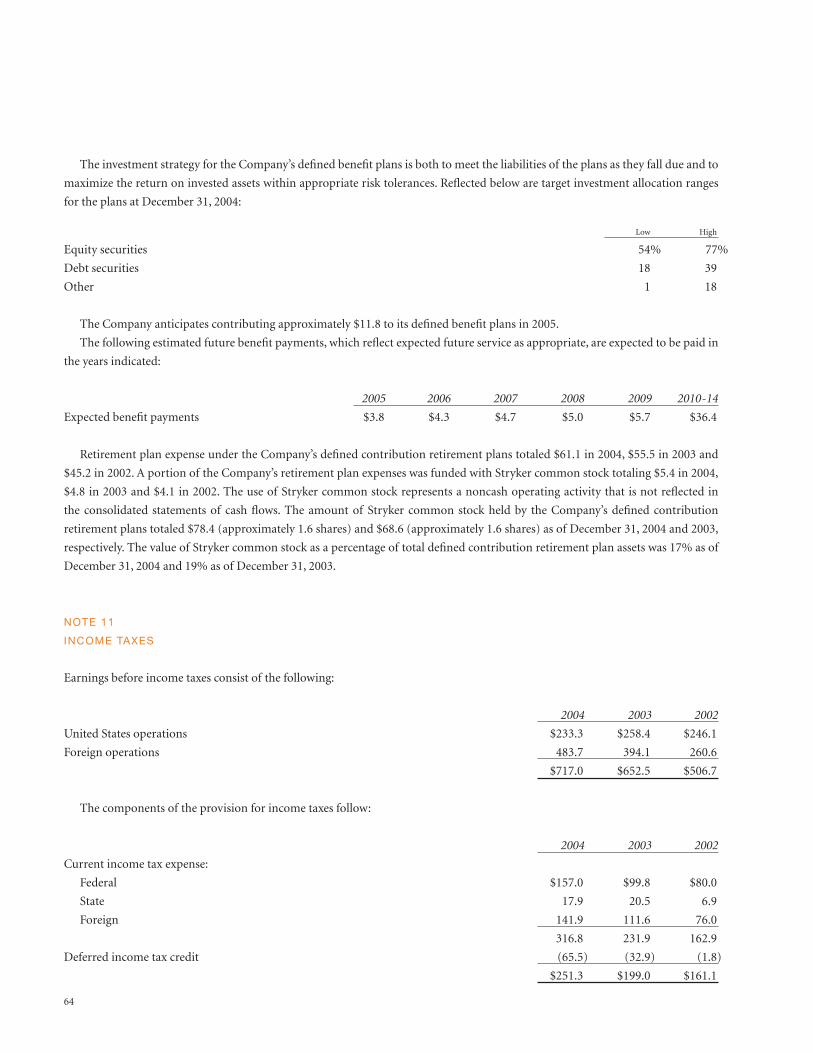
64
The investment strategy for the Company’s defined benefit plans is both to meet the liabilities of the plans as they fall due and to
maximize the return on invested assets within appropriate risk tolerances. Reflected below are target investment allocation ranges
for the plans at December 31, 2004:
Low High
Equity securities 54% 77%
Debt securities 18 39
Other 1 18
The Company anticipates contributing approximately $11.8 to its defined benefit plans in 2005.
The following estimated future benefit payments, which reflect expected future service as appropriate, are expected to be paid in
the years indicated:
2005 2006 2007 2008 2009 2010-14
Expected benefit payments $3.8 $4.3 $4.7 $5.0 $5.7 $36.4
Retirement plan expense under the Company’s defined contribution retirement plans totaled $61.1 in 2004, $55.5 in 2003 and
$45.2 in 2002. A portion of the Company’s retirement plan expenses was funded with Stryker common stock totaling $5.4 in 2004,
$4.8 in 2003 and $4.1 in 2002. The use of Stryker common stock represents a noncash operating activity that is not reflected in
the consolidated statements of cash flows. The amount of Stryker common stock held by the Company’s defined contribution
retirement plans totaled $78.4 (approximately 1.6 shares) and $68.6 (approximately 1.6 shares) as of December 31, 2004 and 2003,
respectively. The value of Stryker common stock as a percentage of total defined contribution retirement plan assets was 17% as of
December 31, 2004 and 19% as of December 31, 2003.
NOTE 11
INCOME TAXES
Earnings before income taxes consist of the following:
2004 2003 2002
United States operations $233.3 $258.4 $246.1
Foreign operations 483.7 394.1 260.6
$717.0 $652.5 $506.7
The components of the provision for income taxes follow:
2004 2003 2002
Current income tax expense:
Federal $157.0 $99.8 $80.0
State 17.9 20.5 6.9
Foreign 141.9 111.6 76.0
316.8 231.9 162.9
Deferred income tax credit (65.5) (32.9) (1.8)
$251.3 $199.0 $161.1
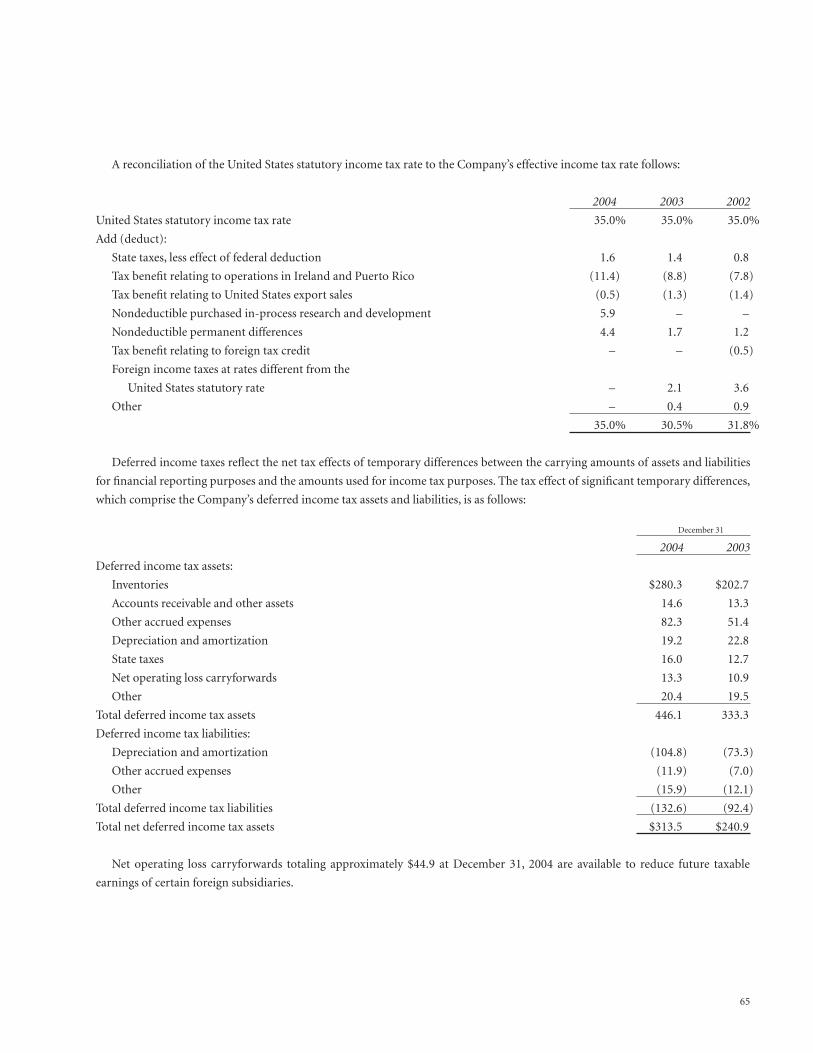
65
A reconciliation of the United States statutory income tax rate to the Company’s effective income tax rate follows:
2004 2003 2002
United States statutory income tax rate 35.0% 35.0% 35.0%
Add (deduct):
State taxes, less effect of federal deduction 1.6 1.4 0.8
Tax benefit relating to operations in Ireland and Puerto Rico (11.4) (8.8) (7.8)
Tax benefit relating to United States export sales (0.5) (1.3) (1.4)
Nondeductible purchased in-process research and development 5.9 – –
Nondeductible permanent differences 4.4 1.7 1.2
Tax benefit relating to foreign tax credit – – (0.5)
Foreign income taxes at rates different from the
United States statutory rate – 2.1 3.6
Other – 0.4 0.9
35.0% 30.5% 31.8%
Deferred income taxes reflect the net tax effects of temporary differences between the carrying amounts of assets and liabilities
for financial reporting purposes and the amounts used for income tax purposes. The tax effect of significant temporary differences,
which comprise the Company’s deferred income tax assets and liabilities, is as follows:
December 31
2004 2003
Deferred income tax assets:
Inventories $280.3 $202.7
Accounts receivable and other assets 14.6 13.3
Other accrued expenses 82.3 51.4
Depreciation and amortization 19.2 22.8
State taxes 16.0 12.7
Net operating loss carryforwards 13.3 10.9
Other 20.4 19.5
Total deferred income tax assets 446.1 333.3
Deferred income tax liabilities:
Depreciation and amortization (104.8) (73.3)
Other accrued expenses (11.9) (7.0)
Other (15.9) (12.1)
Total deferred income tax liabilities (132.6) (92.4)
Total net deferred income tax assets $313.5 $240.9
Net operating loss carryforwards totaling approximately $44.9 at December 31, 2004 are available to reduce future taxable
earnings of certain foreign subsidiaries.
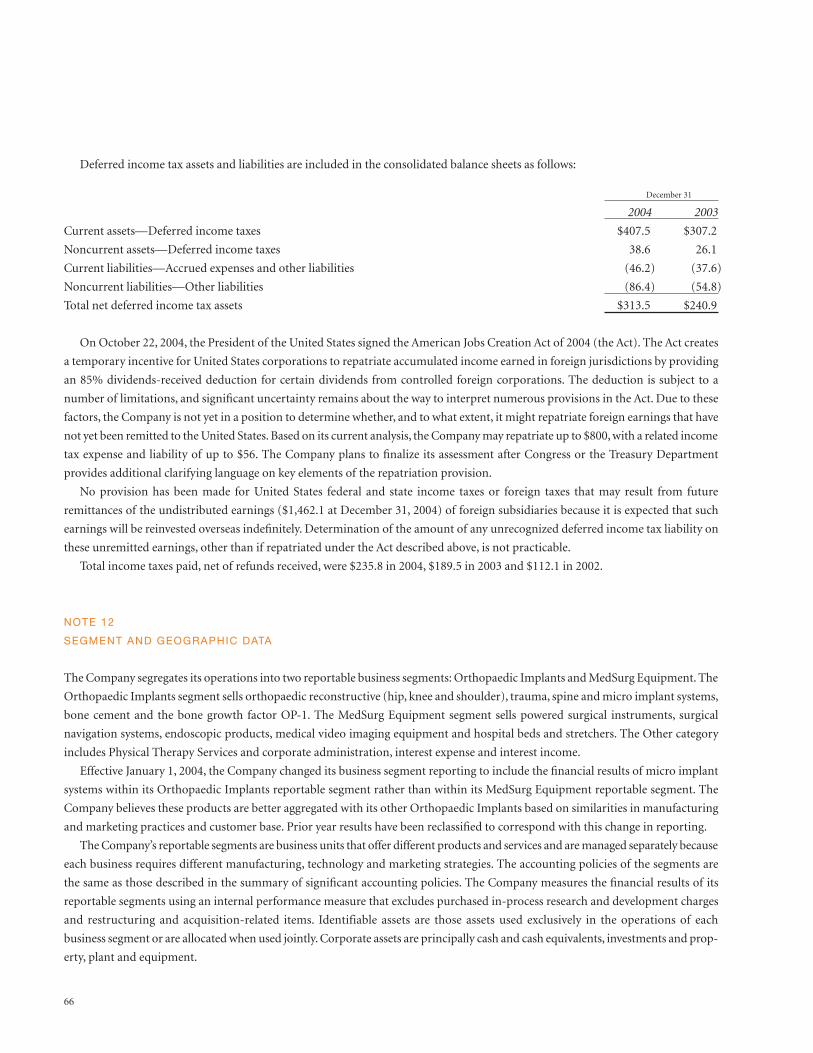
66
Deferred income tax assets and liabilities are included in the consolidated balance sheets as follows:
December 31
2004 2003
Current assets—Deferred income taxes $407.5 $307.2
Noncurrent assets—Deferred income taxes 38.6 26.1
Current liabilities—Accrued expenses and other liabilities (46.2) (37.6)
Noncurrent liabilities—Other liabilities (86.4) (54.8)
Total net deferred income tax assets $313.5 $240.9
On October 22, 2004, the President of the United States signed the American Jobs Creation Act of 2004 (the Act). The Act creates
a temporary incentive for United States corporations to repatriate accumulated income earned in foreign jurisdictions by providing
an 85% dividends-received deduction for certain dividends from controlled foreign corporations. The deduction is subject to a
number of limitations, and significant uncertainty remains about the way to interpret numerous provisions in the Act. Due to these
factors, the Company is not yet in a position to determine whether, and to what extent, it might repatriate foreign earnings that have
not yet been remitted to the United States. Based on its current analysis, the Company may repatriate up to $800, with a related income
tax expense and liability of up to $56. The Company plans to finalize its assessment after Congress or the Treasury Department
provides additional clarifying language on key elements of the repatriation provision.
No provision has been made for United States federal and state income taxes or foreign taxes that may result from future
remittances of the undistributed earnings ($1,462.1 at December 31, 2004) of foreign subsidiaries because it is expected that such
earnings will be reinvested overseas indefinitely. Determination of the amount of any unrecognized deferred income tax liability on
these unremitted earnings, other than if repatriated under the Act described above, is not practicable.
Total income taxes paid, net of refunds received, were $235.8 in 2004, $189.5 in 2003 and $112.1 in 2002.
NOTE 12
SEGMENT AND GEOGRAPHIC DATA
The Company segregates its operations into two reportable business segments: Orthopaedic Implants and MedSurg Equipment. The
Orthopaedic Implants segment sells orthopaedic reconstructive (hip, knee and shoulder), trauma, spine and micro implant systems,
bone cement and the bone growth factor OP-1. The MedSurg Equipment segment sells powered surgical instruments, surgical
navigation systems, endoscopic products, medical video imaging equipment and hospital beds and stretchers. The Other category
includes Physical Therapy Services and corporate administration, interest expense and interest income.
Effective January 1, 2004, the Company changed its business segment reporting to include the financial results of micro implant
systems within its Orthopaedic Implants reportable segment rather than within its MedSurg Equipment reportable segment. The
Company believes these products are better aggregated with its other Orthopaedic Implants based on similarities in manufacturing
and marketing practices and customer base. Prior year results have been reclassified to correspond with this change in reporting.
The Company’s reportable segments are business units that offer different products and services and are managed separately because
each business requires different manufacturing, technology and marketing strategies. The accounting policies of the segments are
the same as those described in the summary of significant accounting policies. The Company measures the financial results of its
reportable segments using an internal performance measure that excludes purchased in-process research and development charges
and restructuring and acquisition-related items. Identifiable assets are those assets used exclusively in the operations of each
business segment or are allocated when used jointly. Corporate assets are principally cash and cash equivalents, investments and prop-
erty, plant and equipment.
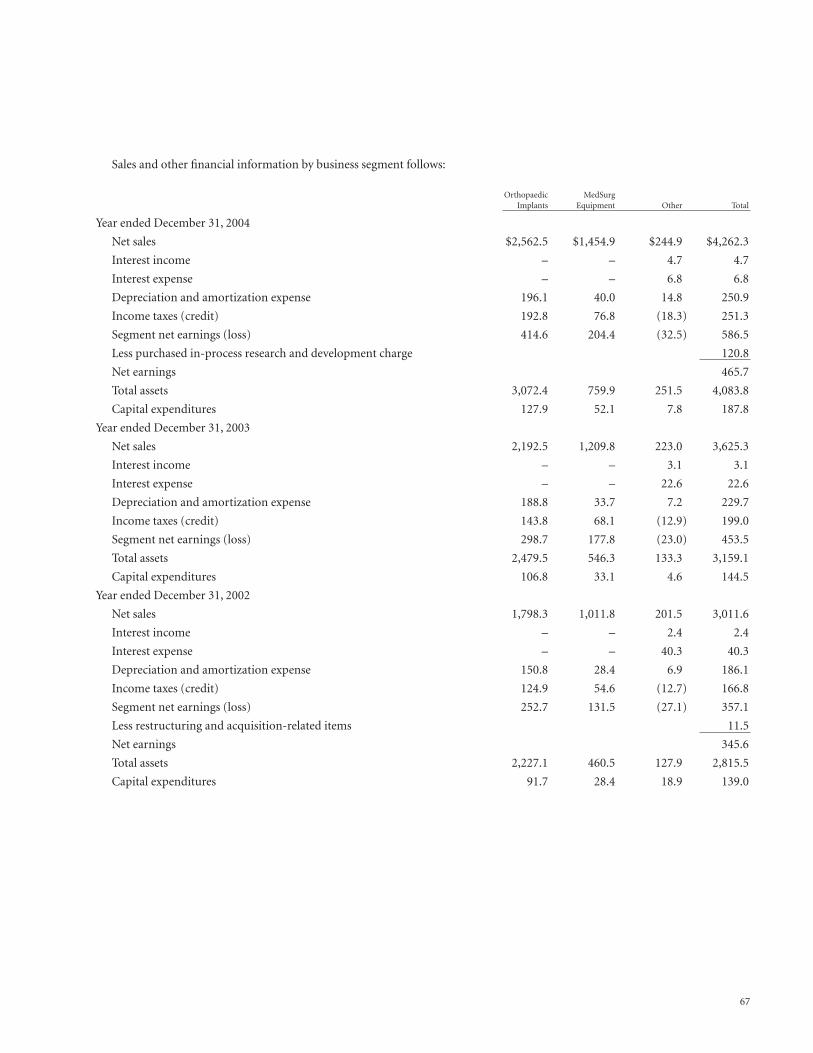
67
Sales and other financial information by business segment follows:
Orthopaedic MedSurgImplants Equipment Other Total
Year ended December 31, 2004
Net sales $2,562.5 $1,454.9 $244.9 $4,262.3
Interest income – – 4.7 4.7
Interest expense – – 6.8 6.8
Depreciation and amortization expense 196.1 40.0 14.8 250.9
Income taxes (credit) 192.8 76.8 (18.3) 251.3
Segment net earnings (loss) 414.6 204.4 (32.5) 586.5
Less purchased in-process research and development charge 120.8
Net earnings 465.7
Total assets 3,072.4 759.9 251.5 4,083.8
Capital expenditures 127.9 52.1 7.8 187.8
Year ended December 31, 2003
Net sales 2,192.5 1,209.8 223.0 3,625.3
Interest income – – 3.1 3.1
Interest expense – – 22.6 22.6
Depreciation and amortization expense 188.8 33.7 7.2 229.7
Income taxes (credit) 143.8 68.1 (12.9) 199.0
Segment net earnings (loss) 298.7 177.8 (23.0) 453.5
Total assets 2,479.5 546.3 133.3 3,159.1
Capital expenditures 106.8 33.1 4.6 144.5
Year ended December 31, 2002
Net sales 1,798.3 1,011.8 201.5 3,011.6
Interest income – – 2.4 2.4
Interest expense – – 40.3 40.3
Depreciation and amortization expense 150.8 28.4 6.9 186.1
Income taxes (credit) 124.9 54.6 (12.7) 166.8
Segment net earnings (loss) 252.7 131.5 (27.1) 357.1
Less restructuring and acquisition-related items 11.5
Net earnings 345.6
Total assets 2,227.1 460.5 127.9 2,815.5
Capital expenditures 91.7 28.4 18.9 139.0
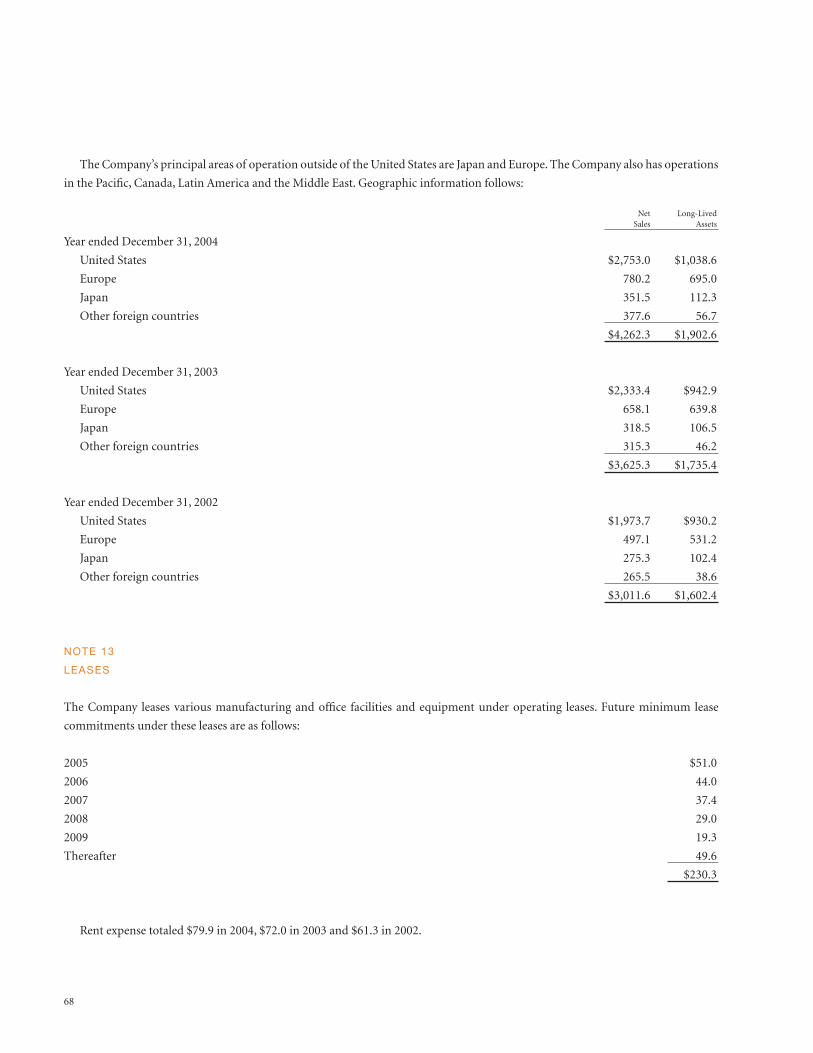
68
The Company’s principal areas of operation outside of the United States are Japan and Europe. The Company also has operations
in the Pacific, Canada, Latin America and the Middle East. Geographic information follows:
Net Long-LivedSales Assets
Year ended December 31, 2004
United States $2,753.0 $1,038.6
Europe 780.2 695.0
Japan 351.5 112.3
Other foreign countries 377.6 56.7
$4,262.3 $1,902.6
Year ended December 31, 2003
United States $2,333.4 $942.9
Europe 658.1 639.8
Japan 318.5 106.5
Other foreign countries 315.3 46.2
$3,625.3 $1,735.4
Year ended December 31, 2002
United States $1,973.7 $930.2
Europe 497.1 531.2
Japan 275.3 102.4
Other foreign countries 265.5 38.6
$3,011.6 $1,602.4
NOTE 13
LEASES
The Company leases various manufacturing and office facilities and equipment under operating leases. Future minimum lease
commitments under these leases are as follows:
2005 $51.0
2006 44.0
2007 37.4
2008 29.0
2009 19.3
Thereafter 49.6
$230.3
Rent expense totaled $79.9 in 2004, $72.0 in 2003 and $61.3 in 2002.
69
NOTE 14
CONTINGENCIES
The Company is involved in various proceedings, legal actions and claims arising in the normal course of business, including pro-
ceedings related to product, labor, intellectual property and other matters. Such matters are subject to many uncertainties, and
outcomes are not predictable with assurance. The Company records amounts for losses that are deemed to be probable and subject
to reasonable estimate. However, the Company does not anticipate material losses as a result of these proceedings beyond amounts
already provided in the accompanying Consolidated Financial Statements.
In December 2003, the Company announced that its subsidiary Physiotherapy Associates, Inc., and Stryker received a subpoena
from the United States Attorney’s Office in Boston, Massachusetts, in connection with a Department of Justice investigation of
Physiotherapy Associates’ billing and coding practices. Physiotherapy Associates provides physical, occupational and speech therapy
services to patients through 428 outpatient centers in the United States as of December 31, 2004 and represented 6% of Stryker’s net
sales for each of the years ended December 31, 2004 and 2003 and 7% of net sales for the year ended December 31, 2002. Revenues
derived from billings to U.S. federal health-care programs approximated 14% of Physiotherapy Associates’ revenues during these
periods. The Company is fully cooperating with the Department of Justice regarding this matter.
Pursuant to certain of the Company’s credit and lease agreements, the Company has provided financial guarantees to third par-
ties in the form of indemnification provisions. These provisions indemnify the third parties for costs, including but not limited to
adverse judgments in lawsuits and the imposition of additional taxes due to either a change in the tax law or an adverse interpreta-
tion of the tax law. The terms of the guarantees are equal to the terms of the related credit or lease agreements. The Company is not
able to calculate the maximum potential amount of future payments it could be required to make under these guarantees, as the
potential payment is dependent on the occurrence of future unknown events (e.g., changes in United States or foreign tax laws).
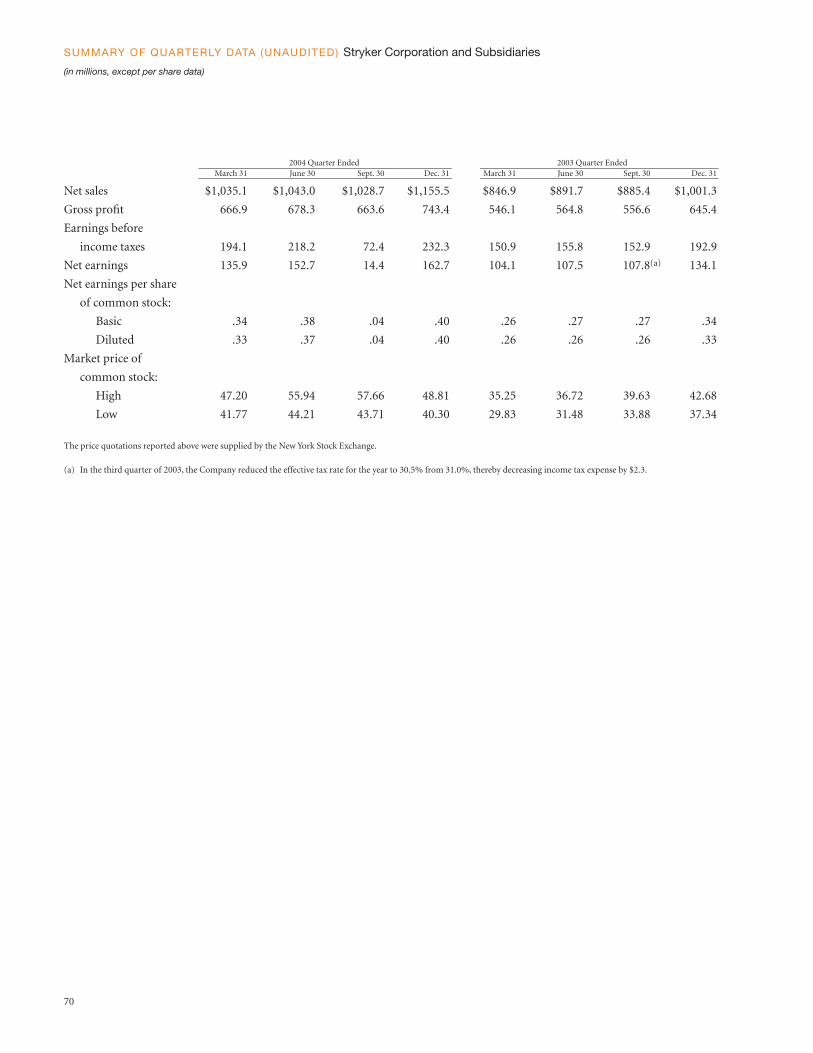
70
2004 Quarter Ended 2003 Quarter EndedMarch 31 June 30 Sept. 30 Dec. 31 March 31 June 30 Sept. 30 Dec. 31
Net sales $1,035.1 $1,043.0 $1,028.7 $1,155.5 $846.9 $891.7 $885.4 $1,001.3
Gross profit 666.9 678.3 663.6 743.4 546.1 564.8 556.6 645.4
Earnings before
income taxes 194.1 218.2 72.4 232.3 150.9 155.8 152.9 192.9
Net earnings 135.9 152.7 14.4 162.7 104.1 107.5 107.8(a) 134.1
Net earnings per share
of common stock:
Basic .34 .38 .04 .40 .26 .27 .27 .34
Diluted .33 .37 .04 .40 .26 .26 .26 .33
Market price of
common stock:
High 47.20 55.94 57.66 48.81 35.25 36.72 39.63 42.68
Low 41.77 44.21 43.71 40.30 29.83 31.48 33.88 37.34
The price quotations reported above were supplied by the New York Stock Exchange.
(a) In the third quarter of 2003, the Company reduced the effective tax rate for the year to 30.5% from 31.0%, thereby decreasing income tax expense by $2.3.
SUMMARY OF QUARTERLY DATA (UNAUDITED) Stryker Corporation and Subsidiaries
(in millions, except per share data)

71
BOARD OF DIRECTORS AND CORPORATE OFFICERS
CORPORATE OFFICERS
Stephen P. MacMillanPresident and Chief Executive Officer
J. Patrick AndersonVice President, Strategy and Communications
Dean H. BergyVice President and Chief Financial Officer
Curtis E. Hall, Esq.Vice President, General Counsel
Jud HoffVice President, General Manager,Physiotherapy Associates
Christopher F. HomrichVice President and Treasurer
Stephen Si JohnsonVice President, Group President, MedSurg
James E. KemlerVice President, Group President,Biotech, Spine, Trauma
James R. LawsonVice President, Group President,Orthopaedics and International
Edward B. LipesExecutive Vice President
Eric LumVice President, Tax
James B. PraegerController
Michael W. RudeVice President, Human Resources
David J. SimpsonExecutive Vice President
Thomas R. WinkelVice President, Administration and Secretary
Jeffrey R. WinterVice President, Internal Audit
Bryant S. ZankoVice President, Business Development
BOARD OF DIRECTORS
John W. BrownChairman of the Board,Stryker Corporation
Howard E. Cox, Jr. * † ‡
Partner, Greylock
Donald M. Engelman, Ph.D.Eugene Higgins Professor of Molecular Biophysics andBiochemistry, Yale University, and Chair of the Science andTechnology Steering Committee of the Brookhaven National Laboratory
Jerome H. Grossman, M.D.* ‡
Director of the Harvard/Kennedy School Health Care DeliveryPolicy Program at Harvard University
John S. Lillard * ‡
Chairman, Wintrust Financial Corporation
Stephen P. MacMillanPresident and Chief Executive Officer,Stryker Corporation
William U. Parfet * † ‡
Chairman and Chief Executive Officer,MPI Research, Inc.
Ronda E. Stryker † ‡
Granddaughter of the founder of the Company and daughterof the former President of the Company, Vice Chairman and Director of Greenleaf Trust, Vice Chairman and Trustee of Kalamazoo College, and Trustee of the Kalamazoo Institute of Arts, the Kalamazoo Community Foundation andSpelman College
* Audit Committee† Compensation Committee‡ Governance and Nominating Committee
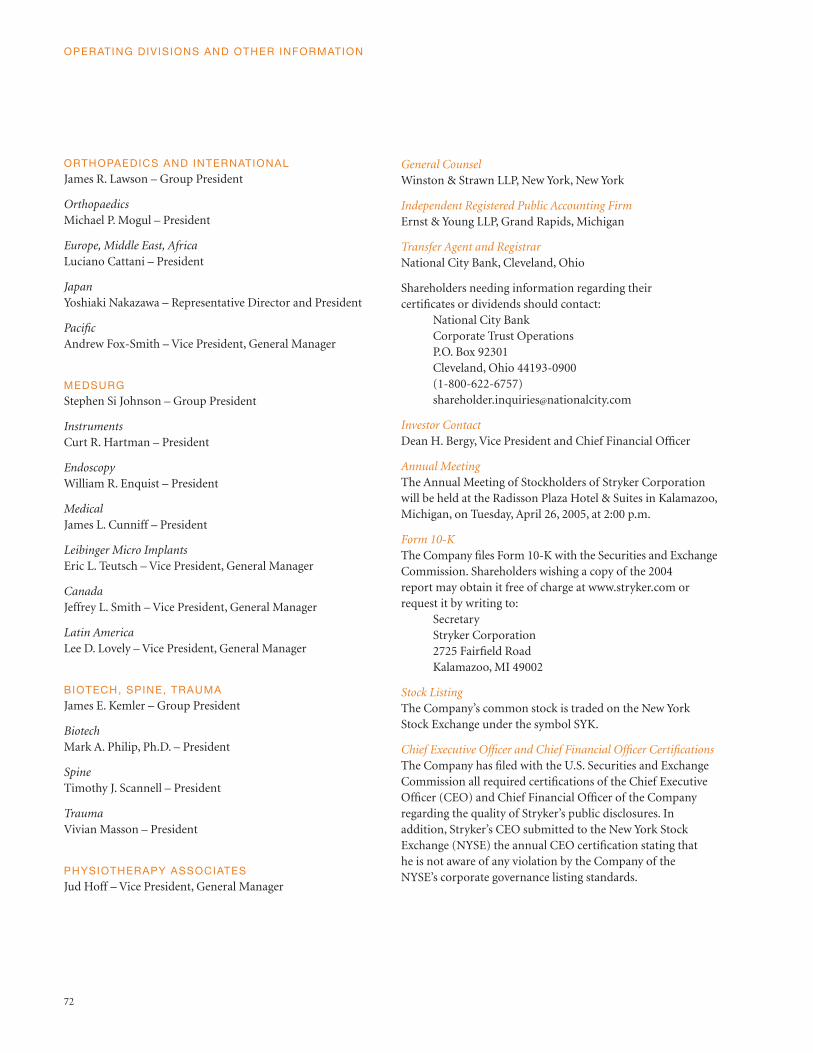
72
OPERATING DIVISIONS AND OTHER INFORMATION
ORTHOPAEDICS AND INTERNATIONAL
James R. Lawson – Group President
OrthopaedicsMichael P. Mogul – President
Europe, Middle East, AfricaLuciano Cattani – President
JapanYoshiaki Nakazawa – Representative Director and President
PacificAndrew Fox-Smith – Vice President, General Manager
MEDSURG
Stephen Si Johnson – Group President
InstrumentsCurt R. Hartman – President
EndoscopyWilliam R. Enquist – President
MedicalJames L. Cunniff – President
Leibinger Micro ImplantsEric L. Teutsch – Vice President, General Manager
CanadaJeffrey L. Smith – Vice President, General Manager
Latin AmericaLee D. Lovely – Vice President, General Manager
BIOTECH, SPINE, TRAUMA
James E. Kemler – Group President
BiotechMark A. Philip, Ph.D. – President
SpineTimothy J. Scannell – President
TraumaVivian Masson – President
PHYSIOTHERAPY ASSOCIATES
Jud Hoff – Vice President, General Manager
General CounselWinston & Strawn LLP, New York, New York
Independent Registered Public Accounting FirmErnst & Young LLP, Grand Rapids, Michigan
Transfer Agent and RegistrarNational City Bank, Cleveland, Ohio
Shareholders needing information regarding their certificates or dividends should contact:
National City BankCorporate Trust OperationsP.O. Box 92301Cleveland, Ohio 44193-0900(1-800-622-6757)[email protected]
Investor ContactDean H. Bergy, Vice President and Chief Financial Officer
Annual MeetingThe Annual Meeting of Stockholders of Stryker Corporationwill be held at the Radisson Plaza Hotel & Suites in Kalamazoo,Michigan, on Tuesday, April 26, 2005, at 2:00 p.m.
Form 10-KThe Company files Form 10-K with the Securities and ExchangeCommission. Shareholders wishing a copy of the 2004 report may obtain it free of charge at www.stryker.com orrequest it by writing to:
SecretaryStryker Corporation2725 Fairfield RoadKalamazoo, MI 49002
Stock ListingThe Company’s common stock is traded on the New YorkStock Exchange under the symbol SYK.
Chief Executive Officer and Chief Financial Officer CertificationsThe Company has filed with the U.S. Securities and ExchangeCommission all required certifications of the Chief ExecutiveOfficer (CEO) and Chief Financial Officer of the Companyregarding the quality of Stryker’s public disclosures. In addition, Stryker’s CEO submitted to the New York StockExchange (NYSE) the annual CEO certification stating that he is not aware of any violation by the Company of the NYSE’s corporate governance listing standards.