stryker corporation · 2010-03-12 · hip implant systems through stryker orthopaedics, the company...
TRANSCRIPT

UNITED STATESSECURITIES AND EXCHANGE COMMISSION
Washington, D.C. 20549
FORM 10-KÈ ANNUAL REPORT PURSUANT TO SECTION 13 OR 15(d) OF THE SECURITIES
EXCHANGE ACT OF 1934For the fiscal year ended December 31, 2009
OR
‘ TRANSITION REPORT PURSUANT TO SECTION 13 OR 15(d) OF THE SECURITIESEXCHANGE ACT OF 1934
For the transition period from toCommission file number: 000-09165
STRYKER CORPORATION(Exact name of registrant as specified in its charter)
Michigan 38-1239739(State or other jurisdiction of
incorporation or organization)(I.R.S. Employer
Identification No.)
2825 Airview Boulevard, Kalamazoo, Michigan 49002(Address of principal executive offices) (Zip Code)
Registrant’s telephone number, including area code: (269) 385-2600
Securities registered pursuant to Section 12(b) of the Act:Title of each class Name of each exchange on which registered
Common Stock, $.10 par value New York Stock ExchangeSecurities registered pursuant to Section 12(g) of the Act: None
Indicate by check mark if the registrant is a well-known seasoned issuer, as defined in Rule 405 of the Securities Act.YES È NO ‘
Indicate by check mark if the registrant is not required to file reports pursuant to Section 13 or 15(d) of the Act.YES ‘ NO È
Indicate by check mark whether the registrant (1) has filed all reports required to be filed by Section 13 or 15(d) of theSecurities and Exchange Act of 1934 during the preceding 12 months (or for such shorter period that the registrant wasrequired to file such reports), and (2) has been subject to such filing requirements for the past 90 days.
YES È NO ‘
Indicate by check mark whether the registrant has submitted electronically and posted on its corporate Web site, if any,every Interactive Data File required to be submitted and posted pursuant to Rule 405 of Regulation S-T (§232.405 of this chapter)during the preceding 12 months (or for such shorter period that the registrant was required to submit and post such files).
YES È NO ‘
Indicate by check mark if disclosure of delinquent filers pursuant to Item 405 of Regulation S-K is not contained herein,and will not be contained, to the best of registrant’s knowledge, in definitive proxy or information statements incorporated byreference in Part III of this Form 10-K or any amendment to this Form 10-K. È
Indicate by check mark whether the registrant is a large accelerated filer, an accelerated filer, a non-accelerated filer, ora smaller reporting company. See definitions of “large accelerated filer,” “accelerated filer” and “smaller reporting company”in Rule 12b-2 of the Exchange Act. (Check one):Large accelerated filer È Accelerated filer ‘Non-accelerated filer ‘ Smaller reporting company ‘
Indicate by check mark whether the registrant is a shell company (as defined in Rule 12b-2 of the Act).YES ‘ NO È
Based on the closing sales price of June 30, 2009, the aggregate market value of the voting stock held by non-affiliatesof the registrant was approximately $13,503,370,084.
The number of shares outstanding of the registrant’s Common Stock, $.10 par value, was 398,051,370 at January 31, 2010.


DOCUMENTS INCORPORATED BY REFERENCE
Portions of the proxy statement to be filed with the U.S. Securities and Exchange Commission relating tothe 2010 Annual Meeting of Shareholders (the “2010 proxy statement”) are incorporated by reference into PartIII.
FORWARD-LOOKING STATEMENTS
This report contains information that includes or is based on forward-looking statements within the meaningof the federal securities law that are subject to various risks and uncertainties that could cause the Company’sactual results to differ materially from those expressed or implied in such statements. Such factors include, butare not limited to: weakening of economic conditions that could adversely affect the level of demand for theCompany’s products; pricing pressures generally, including cost-containment measures that could adverselyaffect the price of or demand for the Company’s products; changes in foreign exchange markets; legislative andregulatory actions; unanticipated issues arising in connection with clinical studies and otherwise that affect U.S.Food and Drug Administration approval of new products; changes in reimbursement levels from third-partypayors; a significant increase in product liability claims; unfavorable resolution of tax audits; changes in financialmarkets; and changes in the competitive environment.
While the Company believes the assumptions underlying such forward-looking statements are reasonable,there can be no assurance that future events or developments will not cause such statements to be inaccurate. Allforward-looking statements contained in this report are qualified in their entirety by this cautionary statement.
REGISTERED TRADEMARKS AND TRADEMARKS
Stryker Corporation or its divisions or other corporate affiliated entities own, use or have applied for thefollowing trademarks in this Report: 3-Chip, ABG, Accolade, Ascent Healthcare Solutions, Asnis, AxSOS, AVS,BackSmart, Big Wheel, CentPillar, CerviCore, Chaperone, Colorado, Cormet, Dall-Miles, Dynatron, Exeter,FlexiCore, Formula, Flyte, Gamma, Gamma3, GMRS, Hoffmann, Howmedica, HydroSet, IDEAL EYES,InterPulse, InTouch, iSuite, LFIT, Maestro, Mantis, Monotube, Neptune, NRG, OASYS, Omnifit, OP-1,PainPump, PneumoSure, Power-PRO, PureFix, Radius, Reflex, Rejuvenate, RemB, Restoration, ReUnion,Revolution, S3, Scorpio, Secur-Fit, Sightline, Simplex, SmartLock, Solar, SpineCore, Stair-PRO, Steri-shield,Stryker, Stryker Orthopaedics, Stryker Precision, Sumex, System 6, SwitchPoint Infinity, T2, TenXor, THOR,TMZF, Triathlon, Trident, Tritanium, UHR, VariAx, VLIFT, X3, Xia and Zoom. All other trademarks or servicemarks are trademarks or service marks of their respective owners or holders.
Not all products referenced in this report are approved or cleared for sale, distribution or use in the UnitedStates.


TABLE OF CONTENTS
PART IItem 1. Business. . . . . . . . . . . . . . . . . . . . . . . . . . . . . . . . . . . . . . . . . . . . . . . . . . . . . . . . . . . . . . . . . . . . . 1Item 1A. Risk Factors. . . . . . . . . . . . . . . . . . . . . . . . . . . . . . . . . . . . . . . . . . . . . . . . . . . . . . . . . . . . . . . . . . 13Item 1B. Unresolved Staff Comments. . . . . . . . . . . . . . . . . . . . . . . . . . . . . . . . . . . . . . . . . . . . . . . . . . . . . 16Item 2. Properties. . . . . . . . . . . . . . . . . . . . . . . . . . . . . . . . . . . . . . . . . . . . . . . . . . . . . . . . . . . . . . . . . . . . 16Item 3. Legal Proceedings. . . . . . . . . . . . . . . . . . . . . . . . . . . . . . . . . . . . . . . . . . . . . . . . . . . . . . . . . . . . . 17Item 4. Submission of Matters to a Vote of Security Holders. . . . . . . . . . . . . . . . . . . . . . . . . . . . . . . . . . 17
PART IIItem 5. Market for the Registrant’s Common Equity, Related Stockholder Matters and Issuer
Purchases of Equity Securities. . . . . . . . . . . . . . . . . . . . . . . . . . . . . . . . . . . . . . . . . . . . . . . . . . 17Item 6. Selected Financial Data. . . . . . . . . . . . . . . . . . . . . . . . . . . . . . . . . . . . . . . . . . . . . . . . . . . . . . . . . 19Item 7. Management’s Discussion and Analysis of Financial Condition and Results of Operations. . . . 20Item 7A. Quantitative and Qualitative Disclosures About Market Risk. . . . . . . . . . . . . . . . . . . . . . . . . . . . 34Item 8. Financial Statements and Supplementary Data. . . . . . . . . . . . . . . . . . . . . . . . . . . . . . . . . . . . . . . 35
Report of Independent Registered Public Accounting Firm on Consolidated FinancialStatements . . . . . . . . . . . . . . . . . . . . . . . . . . . . . . . . . . . . . . . . . . . . . . . . . . . . . . . . . . . . . 35
Consolidated Balance Sheets . . . . . . . . . . . . . . . . . . . . . . . . . . . . . . . . . . . . . . . . . . . . . . . . 36Consolidated Statements of Earnings . . . . . . . . . . . . . . . . . . . . . . . . . . . . . . . . . . . . . . . . . . 37Consolidated Statements of Shareholders’ Equity . . . . . . . . . . . . . . . . . . . . . . . . . . . . . . . . 38Consolidated Statements of Cash Flows . . . . . . . . . . . . . . . . . . . . . . . . . . . . . . . . . . . . . . . . 39Notes to Consolidated Financial Statements . . . . . . . . . . . . . . . . . . . . . . . . . . . . . . . . . . . . . 40Summary of Quarterly Data (Unaudited) . . . . . . . . . . . . . . . . . . . . . . . . . . . . . . . . . . . . . . . 71
Item 9. Changes in and Disagreements With Accountants on Accounting and Financial Disclosure. . . . 72Item 9A. Controls and Procedures. . . . . . . . . . . . . . . . . . . . . . . . . . . . . . . . . . . . . . . . . . . . . . . . . . . . . . . . 72Item 9B. Other Information. . . . . . . . . . . . . . . . . . . . . . . . . . . . . . . . . . . . . . . . . . . . . . . . . . . . . . . . . . . . . 74
PART IIIItem 10. Directors, Executive Officers and Corporate Governance. . . . . . . . . . . . . . . . . . . . . . . . . . . . . . 74Item 11. Executive Compensation. . . . . . . . . . . . . . . . . . . . . . . . . . . . . . . . . . . . . . . . . . . . . . . . . . . . . . . . 75Item 12. Security Ownership of Certain Beneficial Owners and Management and Related Stockholder
Matters. . . . . . . . . . . . . . . . . . . . . . . . . . . . . . . . . . . . . . . . . . . . . . . . . . . . . . . . . . . . . . . . . . . . 76Item 13. Certain Relationships and Related Transactions, and Director Independence. . . . . . . . . . . . . . . 76Item 14. Principal Accounting Fees and Services. . . . . . . . . . . . . . . . . . . . . . . . . . . . . . . . . . . . . . . . . . . . 76
PART IVItem 15. Exhibits, Financial Statement Schedules. . . . . . . . . . . . . . . . . . . . . . . . . . . . . . . . . . . . . . . . . . . 77


PART I
ITEM 1. BUSINESS.
GENERAL
Stryker Corporation (the Company or Stryker) is one of the world’s leading medical technology companieswith the most broadly based range of products in orthopaedics and a significant presence in other medicalspecialties. Stryker works with respected medical professionals to help people lead more active and moresatisfying lives. The Company’s products include implants used in joint replacement, trauma, spinal andcraniomaxillofacial surgeries; surgical equipment and surgical navigation systems, endoscopic andcommunications systems; patient handling and emergency medical equipment as well as other medical deviceproducts used in a variety of medical specialties. Stryker was incorporated in Michigan in 1946 as the successorcompany to a business founded in 1941 by Dr. Homer H. Stryker, a leading orthopaedic surgeon and the inventorof several orthopaedic products.
Stryker’s filings with the U.S. Securities and Exchange Commission (SEC), including its annual report onForm 10-K, quarterly reports on Form 10-Q and current reports on Form 8-K, are accessible free of charge atwww.stryker.com within the “Investor—SEC Filings & Ownership Reports” link.
In 2009 the Company acquired Ascent Healthcare Solutions, Inc. for $525 million in an all cash transaction.In 2007 the Company completed the sale of its outpatient physical therapy business, Physiotherapy Associates,for $150 million in cash less certain indebtedness. Physiotherapy Associates’ operating results are reported asdiscontinued operations for the year ended December 31, 2007.
PRODUCT SALES
The Company segregates its operations into two reportable business segments: Orthopaedic Implants andMedSurg Equipment. The Orthopaedic Implants segment sells orthopaedic reconstructive (hip and knee), traumaand spinal implant systems and other related products. The MedSurg Equipment segment sells surgicalequipment and surgical navigation systems; endoscopic and communications systems; as well as patient handlingand emergency medical equipment. The following amounts and percentages represent domestic/international andbusiness segment net sales during each of the three years ended December 31 (dollars in millions):
2009 2008 2007
$ % $ % $ %
Domestic/international sales:Domestic . . . . . . . . . . . . . . . . . . . . . . . . . . . . . . . . $4,317.4 64% $4,282.2 64% $3,850.3 64%International . . . . . . . . . . . . . . . . . . . . . . . . . . . . . 2,405.7 36% 2,436.0 36% 2,150.2 36%
Total net sales . . . . . . . . . . . . . . . . . . . . . . . . . . . . . . . . $6,723.1 100% $6,718.2 100% $6,000.5 100%
Business segment sales: . . . . . . . . . . . . . . . . . . . . . . . .Orthopaedic Implants . . . . . . . . . . . . . . . . . . . . . . $4,119.7 61% $3,967.5 59% $3,587.3 60%MedSurg Equipment . . . . . . . . . . . . . . . . . . . . . . . 2,603.4 39% 2,750.7 41% 2,413.2 40%
Total net sales . . . . . . . . . . . . . . . . . . . . . . . . . . . . . . . . $6,723.1 100% $6,718.2 100% $6,000.5 100%
Additional financial information regarding the Company’s operating segments and geographic areas can befound under the captions Results of Operations in Item 7 of this report and Note 14 to the Consolidated FinancialStatements in Item 8 of this report.
Approximately 77% of the Company’s sales in 2009 and 74% in both 2008 and 2007 consisted of productswith short lives, such as reconstructive, trauma, craniomaxillofacial and spinal implant systems (while implants
1

have a long useful life to the patient, they have a one-time use to the hospital); disposables and expendable tools;and parts and service revenues, including service and repair charges. The balance of sales in each of the yearscame from products that could be considered capital equipment, having useful lives in excess of one year.
The Company’s backlog of firm orders is not considered material to an understanding of its business.
Orthopaedic Implants
Orthopaedic Implants are designed and manufactured by Stryker Orthopaedics, Stryker Osteosynthesis,Stryker Spine and Stryker Biotech and consist of such products as implants used in joint replacement, trauma,craniomaxillofacial and spinal surgeries; bone cement; and the bone growth factor OP-1. Artificial joints aremade of cobalt chromium, titanium alloys, ceramics or ultrahigh molecular weight polyethylene and areimplanted in patients whose natural joints have been damaged by arthritis, osteoporosis, other diseases or injury.Many of Stryker’s technologically advanced reconstructive implants are suited to minimally invasive surgery(MIS) procedures that are intended to reduce soft-tissue damage and pain while hastening return to function. TheCompany supports surgeons with technology, procedural development and specialized instrumentation as theydevelop new MIS techniques.
Hip Implant Systems
Through Stryker Orthopaedics, the Company offers a variety of hip implant systems for the globalreconstructive market. The ABG Hip System, Partnership Hip System, Secur-Fit Hip System, Omnifit HipSystem, Accolade Hip System, Centpillar Hip System, Trident Acetabular Hip System, ADM Mobile BearingHip System, Rejuvenate Modular Primary Hip System, Cormet Hip Resurfacing System and Restoration HipSystem are all comprehensive systems of hip implants and associated instrumentation designed to providephysicians and patients with reliable clinical results across the continuum of care, while enhancing value andoperating room efficiency for the hospital.
During 2009 significant clinical milestones for the Company were met, including 40 years of clinical historywith the Exeter Hip System, 25 years of clinical history with the Dall-Miles Cable System, more than 20 years ofclinical history with the Omnifit HA stem, and more than 10 years clinical history with Accolade TMZF HipSystem. Stryker is committed to following clinical outcomes and recognizes that long-term clinical results are animportant factor in the Company’s ability to market hip implants.
Stryker was the first company to receive clearance from the FDA to commercially release for sale in theUnited States a hip implant with hydroxylapatite (HA) surface treatment. HA is a naturally occurring calciumphosphate material that demonstrates a high level of biocompatibility due to its resemblance to bone. TheCompany’s global clinical experience with HA-coated hip stems now extends over 20 years, and reported clinicalperformance continues to equal or exceed that of comparable hip stems reported in the scientific literature.
Primary Femoral Hip Systems:
In 2009 Stryker introduced the Rejuvenate Modular Primary Hip System, the latest evolution in theCompany’s OmniFit and Secur-Fit hip systems. The Rejuvenate Modular Primary Hip System offers surgeonsunparalleled options for personalizing the implant to each patient’s anatomy. The Rejuvenate System is designedto optimize anatomic restoration by providing options that offer enhanced stability, proven modularity andintroperative flexibility. The modular design enables the surgeon to independently manage stem size, leg length,version and offset to recreate the patient’s anatomy, restore biomechanics and, consequently, minimize the risk ofdislocation.
The Accolade TMZF Hip System has demonstrated strong clinical results for more than 10 years, with 2009marking the first introduction of the product into Japan. Recognized for simplicity, and flexible to accommodateall surgical approaches and navigation, the Accolade TMZF System is a tapered wedge implant, based on abroach only technique.
2

The ABG II Modular Hip System, released in Europe in 2007, represents the next generation of designbased on the ABG monolithic stem that has had positive clinical experience for more than 10 years. This modularprimary hip stem provides the opportunity to recreate patient anatomy through independent sizing of the stemand neck. Versatile instrumentation also accommodates surgeon preference for a navigated procedure or directanterior surgical approach.
The Company’s Exeter Total Hip System is based on a collarless, highly polished, double-tapered femoraldesign that reduces shear stresses and increases compression at the cement/bone interface.
Primary Acetabular Systems:
The Company’s advanced bearing system, Low Friction Ion Treatment (LFIT) Anatomic Femoral Headswith X3 polyethylene liners represents a significant advance in hip-bearing technology through the combinationof Stryker’s LFIT technology and X3 advanced bearing technology. The femoral heads are anatomically sized formore natural hip performance. In 2007 the Company further expanded its anatomic femoral head offerings withthe introduction of the Biolox Delta Ceramic Anatomic head for even greater options to reduce wear andpotentially increase implant longevity. X3 advanced bearing technology is the Company’s highly crosslinkedpolyethylene, which demonstrates enhanced material characteristics in laboratory testing, including improvedstrength, reduced wear and oxidation resistance. This second generation bearing option offers a significanttechnological advance for both hip and knee replacements.
The Company received premarket approval (PMA) from the FDA in 2003 for its ceramic-on-ceramic hipreplacement system, the Trident Ceramic Acetabular Insert, for patients in the United States. StrykerOrthopaedics has successfully launched the Trident ceramic insert in the United States, Europe, Australia andCanada. The Trident insert has demonstrated low wear clinically, and it is protected and strengthened by apatented titanium sleeve.
In 2009 the Company introduced the Primary Tritanium Shell in Latin America, Australia, and Europefollowing a US launch in 2008. Introduction of this highly porous surface into the primary hip market providesan enhanced fixation acetabular solution that was previously not available for primary use.
Hip Fracture Hip Systems:
Stryker offers a broad array of femoral stem options and bearings to accommodate the hip fracture patientincluding the Accolade HFx stem and the UHR bipolar head.
Revision Hip Systems:
The Restoration Modular Revision Hip System offers surgeons performing revision surgeries flexibility intreating complex hip stem revisions and restoring patient biomechanics. The Restoration Modular Revision HipSystem also takes advantage of Stryker’s long clinical history with HA by incorporating PureFix HA coating onmany components. The Restoration Modular Revision Hip System complements the Company’s existingRestoration HA and Restoration plasma spray (PS) monolithic revision systems.
The Company’s Trident Tritanium Acetabular Shell contains a highly porous surface that closely resemblesthe structure of bone. This shell is designed for revision surgery and contains multiple screw holes to achievebone fixation and initial stability.
Resurfacing Hip Systems:
In 2007 the Company began selling the Cormet Hip Resurfacing System in the United States pursuant to anexclusive 10-year marketing and distribution agreement with Corin Group PLC following the initial launch of
3

another hip resurfacing product in certain international markets. These products represent a less invasive optionfor younger patients who have the potential for enhanced stability and range of motion. In hip resurfacingprocedures, very little bone is removed from the femoral head, the femoral neck is preserved and the femoralcanal is spared.
Knee Implant Systems
The Company offers three major knee implant systems: Triathlon, Scorpio and the Global ModularReplacement System (GMRS).
The Triathlon Knee System represents the Company’s evolutionary design that has been developed to moreclosely reproduce natural knee motion and is designed to provide mobility with stability through more than 150degrees of flexion. The Triathlon Knee instrumentation is designed to improve operating room efficiency througha streamlined, integrated system providing options and flexibility to meet surgeons’ varying preferences andmultiple surgical techniques. In 2008, Stryker continued to expand the Triathlon brand with the Trtiathlon PartialKnee Resurfacing (PKR) offering in the uni-condylar market segment. The PKR incorporates the single radiusdesign to provide the potential for better ligament balancing. PKR also offers value and efficiency in the femoralcomponent design by only requiring one femoral cutting block for preparation of all sizes of femoralcomponents. In 2007 Stryker introduced the condylar stabilizing (CS) ultra-congruent insert for the TriathlonKnee System. The Triathlon CS insert is a high-performance insert designed to provide patients with morenatural motion and the potential for greater implant longevity. The Company also offers the X3 advanced bearingtechnology as well as anterior referencing instruments for use with the Triathlon Knee System. The Companyalso offers a posteriorly stabilized (PS) version of the Triathlon knee and a cruciate-retaining (CR) version.
The GMRS is a global product that offers a comprehensive solution for severe bone loss in oncology,trauma and revision surgery patients. GMRS has tibial and femoral components, including a total femur, and amodular rotating hinge knee. The system employs both titanium and cobalt chrome alloys for strength andlightness of weight, together with the superior flexibility of the hinge. The MRS, the predecessor to the GMRS,was the first modular segmental replacement system when it was introduced in 1988. These system componentshave maintained a leadership position in this market segment since their introduction.
The Scorpio knee implant design is based on the epicondylar axis of the knee. This patented approachaddresses significant clinical issues, such as improved patient rehabilitation and midflexion stability, through anincrease in the patella-femoral moment arm and a single anterior-posterior radius. The Scorpio HA CR product isdesigned to minimize polyethylene wear and the Scorpio HA PS product features a minimally invasive open boxdesign and maximized stability. The ScorpioFlex, which is available for both posterior cruciate-retaining andcruciate-substituting indications, is specifically designed for patients who have the ability and motivation toreturn to high-flexion activities such as gardening and golfing.The Scorpio NRG provides additional kinematicbenefits over ScorpioFlex, including increased rotational allowance, an articulating design for deeper flexion andgreater extension allowance without impingement. In 2007 the Scorpio NRG with X3 advanced bearingtechnology was launched. This new version of the Scorpio NRG is designed to lower wear rates compared withstandard inserts. The Scorpio System is supported by the Passport instrumentation system, which was designed toprovide intraoperative flexibility and precision as well as a simple, cost-effective approach to total kneereplacement surgery.
Other Joint Replacement Products
The Company develops and markets shoulder and elbow replacement implants, as well as associatedinstrumentation. The Solar Shoulder portfolio provides surgeons with increased intra-operative flexibility torestore the patient’s shoulder functionality and pain relief. These products are marketed worldwide under theReUnion and Solar brands.
4

Bone Cement
Simplex bone cement, a material used to secure cemented implants to bone, was first approved fororthopaedic use in the United States in 1971 and is the most widely used bone cement in the world. TheCompany manufactures and provides several variations of Simplex bone cement to meet specific patient needs.Simplex has nearly 50 years of clinical history, the longest of any bone cement, with more than 400 publishedclinical papers.
Trauma Implant Systems
Through Stryker Osteosynthesis, the Company develops, manufactures and markets trauma, extremities anddeformity correction systems. These systems include Intramedullary (IM) and cephlomedullary nails, locked andnon-locked plating, hip fracture solutions and external fixation systems, as well as bone substitutes that are usedprimarily for the treatment of traumatic injuries.
The Company’s internal fixation portfolio includes a full array of IM & cephlomedullary nails; hip fracturesolutions, including compression hip screws, canulated screws, as well as anatomically designed plates andscrews in both titanium and stainless steel. These products provide a restorative option prior to jointreconstruction. These products are marketed worldwide as leading brands such as Gamma3, Asnis III, AxSOS,VariAx, HydroSet, and T2.
The Company’s external fixation portfolio includes products such as Hoffmann II MRI, Hoffmann Xpress,Monotube Triax mono-lateral, as well as the Hoffmann II Hybrid (TenXor) circular fixation systems. Thesesystems are used to construct frames for bone stabilization that are either definitive or as a temporary step in thetreatment process associated with damage control orthopaedics. Hoffmann systems have been defined by theirease of assembly with “snap-fit” couplers. The use of a proprietary Vectran coating on the bars makes HoffmannII MRI an MRI compatible solution.
The Company also offers a product portfolio for the treatment of fractures and injuries of the extremities.These products include fracture specific locked plating for the wrist, shoulder and foot, as well as bonesubstitutes and external fixation systems. These are all designed to treat the unique nature of upper extremityinjuries. These products are marketed worldwide under the brands VariAx, AxSOS, and Hoffmann.
The VariAx Distal Radius System offers surgeons a comprehensive solution for the treatment of wristfractures. These titanium plates are anatomically designed and offer poly-axial SmartLock technology.SmartLock enables surgeons to place either locking or non-locking screws at angles of up to 15-degrees, whichallows the surgeon to target specific bone fragments for fixation. The VariAx Hand Plating and Foot PlatingSystems were launched in 2008 and expanded the treatable indications for the wrist (hand) and for the hind, midand fore foot, all under the same poly-axial SmartLock platform.
Spinal Implant Systems
Through Stryker Spine, the Company develops, manufactures and markets spinal implant products includingcervical, thoracolumbar and interbody systems used in spinal injury, deformity and degenerative therapies. Spinalimplant products include plates, rods, screws, connectors, spacers and cages, along with proprietary implantinstrumentation.
In 2009 the Company introduced the Xia 3 Sacral Iliac system that completes the thoracolumbar system andmakes it one of the most comprehensive platforms on the market. Also in 2009, the Company introduced theDynatran-Dynamic/Translational Anterior Cervical Plate which expands the Company’s presence in thecervical space with its unique locking mechanism. In 2008 the Company introduced the Radius ThoracolumbarSpinal Implant System. The Radius system provides a non-threaded wedgelock locking mechanism designed to
5

reduce the potential for false locking and cross-threading and to increase the speed, ease and reliability ofconnecting rods to screws. Also in 2008, the Company launched Xia 3, the next generation of its thoracolumbarspinal implant system and THOR, its anterior lumbar plating system that incorporates a proprietary screw lockingtechnology. In 2007 the Company introduced the Mantis minimally invasive access system for posteriorinstrumented spinal fusion and the Reflex Zero Profile anterior cervical plating system. The Company also offersthe VLIFT vertebral body replacement system consisting of a preassembled, cylindrically shaped titanium cagewith a distractible or retractable center. The hollow core of the cage allows for packing bone graft. TheCompany’s AVS AS and AL Spacers are used as vertebral body support devices in anterior procedures. Otherproduct lines include the OASYS fixation system that serves the posterior cervical fusion market, the ReflexHybrid anterior cervical plate and the AVS PL and TL vertebral spacer systems.
Craniomaxillofacial (CMF) Implant Systems
Through Stryker Osteosynthesis, the Company develops, manufactures and markets plating systems andrelated implants and products for craniomaxillofacial surgery. These products include plating systems, durasubstitutes, bone substitutes, electrosurgical microdissection needles and surgical instruments. They are primarilyused in the fixation of fractures due to sudden injury as well as in the correction of congenital deformities. Theseproducts are marketed under such names as the Universal Fixation System, Colorado Needle, DuraMatrix-Onlay,Leibinger Instruments and HydroSet.
OP-1/BMP-7
Stryker’s OP-1 Implant is composed of recombinant human OP-1 and a bioresorbable collagen matrix.Stryker has received two approvals for a Humanitarian Device Exemption (HDE) from the FDA. An HDE, asdefined by the FDA, is for a product intended to benefit patients by treating or diagnosing a disease or conditionthat affects fewer than 4,000 individuals per year in the United States. The first is for the use of OP-1 Implant asan alternative to autograft in recalcitrant long-bone nonunions where use of autograft is not feasible andalternative treatments have failed. The second is for revision posterolateral spine fusion using a new formulationof OP-1 known as OP-1 Putty. In March 2009, the FDA Orthopaedic and Rehabilitation Devices Advisory Panelvoted not to recommend that the Company receive broad-based marketing approval for its OP-1 Putty.
Stryker filed a Marketing Authorization Application (MAA) with the European Medicines EvaluationAgency for the posterolateral lumbar spine fusion indication in 2006 under the name Opgenra. In 2008 theCommittee for Medicinal Products for Human Use in Europe recommended this indication for approval. TheOpgenra product has not yet been launched in Europe.
In 2006 Stryker filed an investigational device exemption (IDE) application with the FDA to start a pilotclinical study in transforaminal lumbar interbody fusions using OP-1 Putty. The IDE was approved and patientrecruitment was completed in 2008.
Stryker is also interested in exploring the cartilage regeneration properties of BMP-7 and has successfullycompleted preclinical studies showing that BMP-7 can stimulate new cartilage formation and increase disc heightin animal models of degenerative disc disease. In 2005 Stryker filed its first Investigational New Drug (IND)application with the FDA to treat degenerative disc disease with a new injectable form of BMP-7 in a dose-ranging study in humans. In 2008 the Company completed enrollment in this Phase I dose-ranging clinical safetystudy for the first time use of BMP-7 to treat the disc. In 2006 Stryker filed an IND application with the FDA totreat osteoarthritis in the knee with the injectable form of BMP-7. Following FDA concurrence in 2007, theCompany proceeded with patient enrollment in the Phase I clinical study, which was completed in 2008. Basedon the results of that study, a Phase II protocol has been submitted to the FDA with the intention of beginning aclinical trial in the same indication in 2010.
The Company is in the process of reviewing its strategic alternatives for the use of OP-1.
6

MedSurg Equipment
MedSurg Equipment products include surgical equipment and surgical navigation systems; endoscopic andcommunications systems and patient handling and emergency medical equipment. These products are designedand manufactured by Stryker Instruments, Stryker Endoscopy and Stryker Medical.
Surgical Equipment and Surgical Navigation Systems
Through Stryker Instruments, the Company offers a broad line of surgical, neurologic, ENT andinterventional spine equipment that is used in surgical specialties for drilling, burring, rasping or cutting bone insmall-bone orthopaedics, neurosurgical, spine and ENT procedures; wiring or pinning bone fractures; andpreparing hip or knee surfaces for the placement of artificial implants. Stryker Instruments also manufactures anarray of different attachments and cutting accessories for use by orthopaedic, neurologic and small-bonespecialists.
The System 6 heavy duty, large-bone power system represents the Company’s primary heavy-duty, cordlessproduct offering. This system, which includes several attachments, is more powerful and has a longer battery lifethan its predecessor. The System 6 Rotary Handpieces provide multiple options to surgeons by allowing bothhigh-speed drilling and high-torque reaming in one handpiece. System 6 Heavy Duty Saws provide increasedtorque for a faster and more efficient cut.
In 2009 Stryker introduced the RemB micro electric system, combining the Company’s ConsolidatedOperating Room Equipment (CORE) platform with lightweight, specialized handpieces, allowing surgeons towork effectively with greater precision and control. This versatile system is an evolution in the Company’soffering of powered surgical instruments designed to remove and reshape bone in a wide variety of medicalspecialties including hand surgery, podiatry, orthopaedic foot and ankle surgery and extremity trauma surgery.The Maestro drill represents Stryker’s line of micro powered instruments for spine, neurology and ENTapplications. Employing the pneumatic technology that is the preference of many surgeons in these specialties,the Maestro drill leverages the Company’s Total Performance System (TPS) and CORE platforms by using thesame cutting attachments. The Stryker Bone Mill, launched in 2008, further leverages the CORE platform and isdesigned for use in spine, orthognathic and orthopaedic primary and revision joint procedures. The Bone Millprovides the ability to morselize both autograph and allograft bone quickly and efficiently and provide consistentgranulation of bone in 3 sizes depending on the need of the surgeon. In 2007 Stryker introduced the CORESumex drill, designed for use in ENT procedures, to leverage the Company’s CORE platform. The Sumex drillutilizes electronic torque feedback to increase RPM’s when the drill is engaged in more demanding tasks. Inaddition, the Sumex drill incorporates a tapered front end to allow for better surgeon line of sight.
The Company’s Stryker Precision Oscillating Tip Saw is an innovative saw incorporating a stationarycartridge blade shaft with an oscillating tip in contrast with standard surgical saws with oscillating blades. Thisfeature gives surgeons the opportunity for greater accuracy while simplifying cuts and reducing the potential forsoft tissue damage and facilitating less invasive procedures. This saw represents an advance in proceduralsimplification, offering customers the potential for time and cost savings by reducing the number of steps in thesurgical process.
Stryker Instruments also produces disposable products that are utilized in conjunction with jointreplacement surgery. These products include the Revolution Cement Mixing System, designed to provide onesolution for mixing all surgical cements, in addition to offering mixing efficacy, safety and ease of use; theInterPulse, a self-contained pulsed lavage system used by surgeons to cleanse the surgical site during total jointarthroplasty; and the ConstaVac CBC II Blood Conservation System, a postoperative wound drainage and bloodreinfusion device that enables joint replacement patients to receive their own blood rather than donor blood.
To serve the postsurgical technology market, the Company offers the PainPump2 and BlockAid productsthat are designed for continuous nerve block applications and enable the delivery of a local anesthetic to specificneurologic anatomy. The pumps facilitate peri-operative pain control by allowing physicians to program the
7

pump and offer a patient-controlled analgesia (PCA) option of non-narcotic medication to manage break-throughpain. The Blockaid also offers a reprogramming feature, previously unavailable to the market in a disposable,single-use pump.
To promote safety for patients and medical staff, Stryker works closely with hospitals and other healthcareorganizations to develop a broad product portfolio. In 2009 the Company introduced the Flyte personalprotection system, the latest version of Stryker’s Sterishield line of personal protection products combiningimproved comfort and support with higher levels of protection against contamination, exposure to infectiousbodily fluids and transfer of microorganisms and particulate matter. Additionally, Flyte’s integrated helmet withillumination represents enhancements aimed towards improving the surgical environment.
The Neptune Waste Management System represents Stryker’s leading product for liquid waste managementin the operating room. The self-contained device, first introduced in 2000 and consistently improved, collects anddisposes of fluid and smoke waste from surgical procedures, minimizing the need for operator intervention and,therefore, the risk of exposure to these waste byproducts. In 2008 Stryker introduced the Neptune 2 WasteManagement platform. This next-generation system allows for increased fluid collection capacity whileenhancing end user system preferences based on surgical procedures.
Through Stryker Instruments, the Company offers a broad line of surgical navigation systems that givesurgeons in several specialties the ability to use electronic imaging to see more clearly, better align instrumentsand more accurately track where the instruments are relative to a patient’s anatomy during surgical procedures.The Company offers the Navigation System II Cart, the eNlite suitcase system, which creates a smaller footprintin the operating room while retaining the full functionality of all software programs offered on the NavigationSystem II Cart, and the Navigation iSuite, a fully integrated navigation system housed in the ceiling and walls ofan existing operating room. All of these product offerings are either image based or imageless platforms,incorporating intuitive Smart hardware and software functionality, and a highly accurate digital infrared camerathat result in greater ease of use, less invasive procedures, and reduced surgical time.
Endoscopic and Communications Systems
Stryker Endoscopy develops, manufactures and markets medical video-imaging and communicationsequipment and instruments for arthroscopy, general surgery and urology. Stryker Endoscopy has established aposition of leadership in the production of medical video-imaging technology and accessories for minimallyinvasive surgery, as well as communications equipment to facilitate local and worldwide sharing of medicalinformation among operating rooms, doctors’ offices and teaching institutions. Products include medical videocameras, digital documentation equipment, digital image and viewing software, arthroscopes, laparoscopes,powered surgical instruments, sports medicine instrumentation, radio frequency ablation systems, irrigation fluidmanagement systems, i-Suite operating room solutions and state-of-the-art equipment for telemedicine andenterprise-wide connectivity. Stryker’s line of rigid scopes, which range in diameter from 1.9 millimeters to 10millimeters, contains a series of precision lenses as well as fiber optics that, when combined with Stryker’s high-definition (HD) camera systems, allow the physician to view internal anatomy with a high degree of clarity.
In 2009 Stryker introduced the 1288 HD Camera, the next generation of Stryker 3-chip HD medical videocamera. This latest version has HD 1080p resolution with wireless high definition transmission to the newStryker WiSe wide screen monitor system. This new camera system provides superior image quality compared toprevious camera systems and usability through customized programmable buttons. This product providessurgical teams with improved visibility during endoscopic procedures, which can improve overall surgical andpatient outcomes. In conjunction with the launch of the 1288 HD Camera, Stryker also introduced the L-9000lightsource. This new lightsource includes proprietary LED technology that provides the customer with a coolerand longer lasting bulb. Also introduced was the IDEAL EYES line of HD arthroscopes and laparoscopes. Toaccommodate the recording of HD images, the Company offers the SDC HD digital documentation system. TheCompany also offers its Formula shaver system, which is small, light and equipped with radio frequencyidentification (RFID), facilitating communication between the blade and console.
8

In 2008 Stryker introduced the High Definition Digital Radiography (HDDR) 3000, a space efficient andmultifunctional direct digital radiography system designed to accommodate the demanding requirements ofmodern orthopaedic practices. The HDDR 3000 features a Q-arm design with the x-ray tube always centered tothe detector for fast, precise and convenient patient positioning. The system efficiently performs all generalradiographic procedures with a single detector.
In 2007 the Company launched the Stryker Digital Capture (SDC) Ultra, an all-in-one medical imaginginformation management system allowing for patient scheduling, video capture and storage, DVD burning andother capabilities. The SDC Ultra archives surgical images and videos on its 250-gigabyte internal hard drive.This system also allows for the recording of all surgical footage in high-definition video. Through dual-channelinput support, the SDC Ultra can capture images and video independently on two separate video channels, insynchronized mode or in picture-in-picture format.
Also in 2007 Stryker introduced the 45L PneumoSure insufflator that provides exceptional performancewith enhanced safety and reliability. This new insufflator is designed to handle the needs of today’s dynamicsurgical environment and includes two additional modes for bariatric and vessel harvesting. The 45LPneumoSure insufflator offers real-time pressure sensing for increased accuracy during a procedure. Its ability tomaintain pneumoperitoneum under the most extreme conditions, coupled with a fully integrated color touchscreen, allows for increased ease of use.
Patient Handling and Emergency Medical Equipment
Stryker Medical is a leader in the patient handling equipment segment, offering a wide variety of stretcherscustomized to fit the needs of acute care and specialty surgical care facilities with a focus on providing a safe andcomfortable surface for patients while reducing the risk of back injury for hospital staff. The Company offers theM-Series Stretcher, which has become the standard in patient mobility. The M-Series Stretcher incorporates theCompany’s BackSmart side rail design elements, reducing the risk of back injury for caregivers; the ZoomMotorized Drive System, virtually eliminating push force; Big Wheel technology, reducing start-up force by upto 50 percent and increasing maneuverability; and a 700-pound weight capacity. The Company’s Glide LateralAir Transfer System allows two caregivers to easily transfer even the largest patients while reducing the risk forcaregiver back injury by lifting and floating the patient on a cushion of air.
Stryker Medical also develops and manufactures beds and accessories that are designed to meet the uniqueneeds of specialty departments within the acute care environment. In 2008 the Company introduced theredesigned S3 Med/Surg Hospital Bed, the first redesign since its original 1994 introduction, combining aretractable frame with the Company’s BackSmart ergonomically designed side rails and featuring an openarchitecture to accept any standard support surface. The S3 offers the Chaperone center-of-gravity bed-exitsystem with Zone Control to help prevent patient falls, as well as iBed Awareness, an exclusive technology thatmonitors safe patient bed positions and alerts caregivers in the event that the desired, safe bed configuration isaltered. In 2007 the Company introduced the InTouch, the first high-acuity care bed to combine advancedtechnology, intuitive operation and BackSmart ergonomics to the benefit of both patients and caregivers. In 2009the Company introduced the Impression non-powered support surface designed to improve pressureredistribution, enhance patient comfort and provide enhanced moisture management similar to that achieved bypowered support surfaces. Stryker has a complete line of intensive care unit (ICU) beds for critical care and step-down units. The beds incorporate advanced features that facilitate patient care, such as in-bed scales thataccurately weigh the patient regardless of bed position and a radiolucent surface that facilitates chest x-rayswithout moving the patient from the bed. Stryker’s XPRT support surface, with low air loss, percussion androtational therapy, aids in the prevention and treatment of certain skin ulcers and pulmonary care.
To serve the worldwide pre-hospital market, the Company offers a line of manually operated and poweredambulance cots and cot-to-ambulance fastening systems. In addition, Stryker offers the Stair-PRO stair chairswith Stair-TREAD track systems that facilitate patient transport up and down stairs. The Company’s Power-PRO
9

ambulance cot incorporates an advanced battery-powered hydraulic lift system that enables emergency medicalprofessionals to raise and lower the cot with the press of a button. The use of Stair-PRO and the Power-PROhelps prevent caregiver back injuries. Stryker expanded the Power-PRO line with a version customized to carrytransport incubators on both inter-facility and intra-facility transports and with a version customized forambulances that use hydraulic tail lifts or ramps that are popular in the United Kingdom.
PRODUCT DEVELOPMENT
Most of the Company’s products and product improvements have been developed internally. The Companymaintains close working relationships with physicians and medical personnel in hospitals and universities whoassist in product research and development. New and improved products play a critical role in the Company’ssales growth. The Company continues to place emphasis on the development of proprietary products and productimprovements to complement and expand its existing product lines. The Company has a decentralized researchand development focus, with manufacturing locations responsible for new product development and productimprovements. Research, development and engineering personnel at the various manufacturing locationsmaintain relationships with staff at distribution locations and with customers to understand changes in the marketand product needs.
Total expenditures for product research, development and engineering were $336.2 million in 2009, $367.8million in 2008 and $375.3 million in 2007. Research, development and engineering expenses represented 5.0%of sales in 2009, compared with 5.5% in 2008 and 6.3% in 2007. The spending level in 2009 decreased due to theCompany’s tight control on discretionary spending as well as the Company’s focus of certain research anddevelopment resources on compliance initiatives. Recent new product introductions in the Orthopaedic Implantsand MedSurg Equipment segments are more fully described under the caption Product Sales.
In addition to internally developed products, the Company invests in technologies developed by third partiesthat have the potential to expand the markets in which the Company operates. In 2009 the Company acquiredAscent Healthcare Solutions, Inc. (Ascent) the market leader in the reprocessing and remanufacturing of medicaldevices in the U.S. The acquisition of Ascent is expected to enhance the Company’s presence in a variety ofproduct offerings in its MedSurg Equipment segment and allow for cost savings to its customers. During 2009,the Company acquired certain additional companies that are expected to enhance the Company’s productofferings to its customers within its Orthopaedic Implants and MedSurg Equipment business segments.
MARKETING
Domestic sales accounted for 64% of total revenues in 2009. Most of the Company’s products are marketeddirectly to doctors, hospitals and other healthcare facilities through dedicated sales forces for each of its principalproduct lines to provide focus and a high level of expertise to each medical specialty served.
International sales accounted for 36% of total revenues in 2009. The Company’s products are sold in morethan 100 countries through local dealers and direct sales efforts. Stryker distributes its products through salessubsidiaries and branches with offices located in Argentina, Australia, Austria, Belgium, Brazil, Canada, Chile,China, Denmark, Egypt, Finland, France, Germany, Greece, Hong Kong, India, Italy, Japan, Korea, Malaysia,Mexico, The Netherlands, New Zealand, Norway, Poland, Portugal, Romania, Russia, Serbia and Montenegro,Singapore, South Africa, Spain, Sweden, Switzerland, Taiwan, Ukraine, the United Arab Emirates and the UnitedKingdom. Stryker exports products to dealers and to customers in Africa, Bangladesh, the Balkans, China, theCIS (former Soviet Union), Cyprus, Czech Republic, Hungary, Iceland, Indonesia, Ireland, Israel, Latin America,the Middle East, Paraguay, the Philippines, Slovakia, Thailand, Turkey, Uruguay and Vietnam. Additionalinformation regarding the Company’s international and domestic operations and sales appears in Note 14 to theConsolidated Financial Statements in Item 8 of this report.
The Company’s business is generally not seasonal in nature; however, the number of orthopaedic implantsurgeries is lower during the summer months.
10

COMPETITION
The Company is one of five leading competitors in the United States for orthopaedic reconstructiveproducts. The four other leading competitors are DePuy Orthopaedics, Inc. (a subsidiary of Johnson & Johnson),Zimmer Holdings, Inc., Biomet, Inc., and Smith & Nephew plc. While competition abroad varies from area toarea, the Company believes it is also a leading player in the international markets with these same companies asits principal competitors.
In the trauma implant segment, Stryker is one of five leaders competing principally with Synthes, Inc.,Smith & Nephew Orthopaedics (a division of Smith & Nephew plc), Zimmer Holdings, Inc., and DePuyOrthopaedics, Inc.
In the spinal implant segment, the Company is one of five leaders, competing principally with MedtronicSofamor Danek, Inc. (a subsidiary of Medtronic, Inc.), DePuy Spine, Inc. (a subsidiary of Johnson & Johnson),Synthes, Inc., and Zimmer Holdings, Inc.
In the craniomaxillofacial implant segment, Stryker is one of four leaders, competing principally withSynthes, Inc., Biomet Microfixation, LLC (a subsidiary of Biomet, Inc.), and KLS Martin L.P.
Several companies are engaged in the research and development of products for the repair of hard and softtissues that, if approved, would compete with the Company’s OP-1 product. Medtronic Sofamor Danek hasreceived FDA approval for its recombinant bone morphogenetic protein (“rhBMP-2”) for certain spine, traumaand orthopaedic indications, including the treatment of acute, open fractures of the tibial shaft and spinal fusionsurgeries. A number of companies currently provide various other therapies, including allografts, bone fillers andelectrical stimulation devices for the treatment, repair or replacement of bone and joint tissue. The Companybelieves that its OP-1 product, which is approved for limited trauma and spine indications in certain markets andis currently in clinical trials for other indications, will ultimately compete with these products and with traditionaltherapies, such as autograft and allograft.
In the surgical equipment segment, Stryker is one of three leaders, competing principally with Medtronic,Inc., and Conmed Linvatec, Inc. (a subsidiary of CONMED Corporation). These companies are also competitors inthe international segments, along with Aesculap-Werke AG (a division of B. Braun Melsungen AG), a largeEuropean manufacturer.
In the surgical navigation segment, Stryker is one of six principal competitors, including Medtronic SurgicalNavigation Technologies (a division of Medtronic, Inc.), BrainLAB Inc. (a subsidiary of BrainLAB AG),AESCULAP AG & Co. KG (a division of B. Braun Melsungen AG), Radionics, Inc. (a subsidiary of IntegraLifeSciences Corporation), and GE Medical Systems Navigation and Visualization, Inc. (a subsidiary of GeneralElectric Company).
In the arthroscopy segment, the Company is one of four leaders, together with the principal competitorsSmith & Nephew Endoscopy (a division of Smith & Nephew plc), Conmed Linvatec, Inc., and Arthrex, Inc. Inthe laparoscopic imaging products segment, the Company is one of three leaders, together with the principalcompetitors, Karl Storz GmbH & Co. (a German company) and Olympus Optical Co. Ltd. (a Japanese company).
The Company’s primary competitor in the patient handling segment is Hill-Rom Holdings, Inc. In thespecialty stretcher segment, the primary competitors are Hausted, Inc. (a subsidiary of STERIS Corporation),Hill-Rom Holdings, Inc., and Midmark Hospital Products Group (a subsidiary of Ohio Medical InstrumentCompany, Inc.). In the emergency medical services segment, Ferno-Washington, Inc. is the Company’s principalcompetitor.
The principal factors that the Company believes differentiate it in the highly competitive market segments inwhich it operates and enable it to compete effectively are innovation, reliability, service and reputation. The
11

Company believes that its competitive position in the future will depend to a large degree on its ability to developnew products and make improvements to existing products. While the Company does not consider patents amajor factor in its overall competitive success, patents and trademarks are significant to the extent that a productor an attribute of a product represents a unique design or process. Patent protection of such products restrictscompetitors from duplicating these unique designs and features. Stryker seeks to obtain patent protection on itsproducts whenever appropriate for protecting its competitive advantage. The Company currently ownsapproximately 1,145 United States patents and 1,470 international patents.
MANUFACTURING AND SOURCES OF SUPPLY
The Company’s manufacturing processes consist primarily of precision machining, metal fabrication andassembly operations; the forging and investment casting of cobalt chrome; and the finishing of cobalt chrome andtitanium. In addition, the Company is the sole manufacturer of its OP-1 product. Approximately 12% of theCompany’s cost of sales in 2009 represented finished products that were purchased complete from outsidesuppliers. The Company also purchases parts and components, such as forgings, castings, gears, bearings, castersand electrical components, and uses outside sources for certain finishing operations, such as plating, hardeningand coating of machined components and sterilization of certain products. The principal raw materials used bythe Company are stainless steel, aluminum, cobalt chrome and titanium alloys. In all, purchased parts andcomponents from outside sources were approximately 41% of the total cost of sales in 2009.
While the Company relies on single sources for certain purchased materials and services, it believesalternate sources are available if needed. The Company has not experienced any significant difficulty in the pastin obtaining the materials necessary to meet its production schedules.
Substantially all products manufactured by the Company are stocked in inventory, while certain productsmanufactured within the Company’s MedSurg Equipment segment are assembled to order.
REGULATION AND PRODUCT QUALITY
The Medical Device Amendments of 1976 to the federal Food, Drug and Cosmetic Act and the Safe MedicalDevices Act of 1990, together with regulations issued or proposed thereunder, provide for regulation by the FDA ofthe design, manufacture and marketing of medical devices, including most of the Company’s products.
The FDA’s Quality System regulations set forth standards for the Company’s product design andmanufacturing processes, require the maintenance of certain records and provide for inspections of theCompany’s facilities by the FDA. There are also certain requirements of state, local and foreign governments thatmust be complied with in the manufacturing and marketing of the Company’s products.
In 2009 the Company received a warning letter from the FDA related to compliance issues for one of itsCMF implant products that was previously sold through its CMF distribution facility in Portage, Michigan. In2008 the Company received a warning letter from the FDA related to quality systems and compliance issues at itsOP-1 implant manufacturing facility in Hopkinton, Massachusetts. In 2007 the Company received two warningletters from the FDA regarding compliance with certain quality system specifications at its reconstructive implantmanufacturing facilities: one letter for its facility in Cork, Ireland and another for its facility in Mahwah, NewJersey. In October 2009, the FDA informed the Company that the warning letter related to its OP-1 implantmanufacturing facility had been resolved following a productive reinspection earlier in 2009. The Company takesthese matters very seriously and continues to fully cooperate with the FDA to address their observations at theother facilities.
Most of the Company’s new products fall into FDA classifications that require notification of and review bythe FDA before marketing, submitted as a 510(k). The Company’s FlexiCore and CerviCore artificial discproducts and OP-1 products require extensive clinical testing, consisting of safety and efficacy studies, followedby PMA applications for specific surgical indications.
12

Stryker also is subject to the laws that govern the manufacture and distribution of medical devices of eachcountry in which the Company manufactures or sells products. The member states of the European Union (EU)have adopted the European Medical Device Directives, which create a single set of medical device regulationsfor all EU member countries. These regulations require companies that wish to manufacture and distributemedical devices in EU member countries to obtain CE Marking for their products. Stryker has authorization toapply the CE Marking to substantially all of its products. The Company’s OP-1 product has been considered adrug under the regulations for Europe, Australia and Japan.
Initiatives sponsored by government agencies, legislative bodies and the private sector to limit the growth ofhealthcare expenses generally and hospital costs in particular, including price regulation and competitive pricing,are ongoing in markets where the Company does business. It is not possible to predict at this time the long-termimpact of such cost-containment measures on the Company’s future business.
EMPLOYEES
At December 31, 2009, the Company had 18,582 employees worldwide. Certain international employees arecovered by collective bargaining agreements that are updated annually. The Company believes that its employeerelations are satisfactory.
EXECUTIVE OFFICERS OF THE REGISTRANT
Information regarding the executive officers of the Company appears under the caption “Directors,Executive Officers and Corporate Governance” in Item 10 of this report.
ITEM 1A. RISK FACTORS.
The following information contains specific risks that could potentially impact the Company’s business,financial condition or operating results. The Company may be subject to additional risks that are not currentlyknown to the Company or those which the Company deems immaterial that may also impact its businessoperations.
The Company’s inability to maintain adequate working relationships with healthcare professionals could havea negative impact on the Company’s future operating results.
The Company maintains close working relationships with respected physicians and medical personnel inhospitals and universities who assist in product research and development. The Company continues to placeemphasis on the development of proprietary products and product improvements to complement and expand itsexisting product lines. If the Company is unable to maintain these good relationships, its ability to market andsell new and improved products could decrease and future operating results could be unfavorably affected.
The Company’s inability to continue to hire and retain key employees could have a negative impact on theCompany’s future operating results.
The talent and drive of the Company’s employees are key factors in the success of its business. TheCompany’s sales, technical and other key personnel play an integral role in the development, marketing andselling of new and existing products. If the Company is unable to recruit, hire, develop and retain a talented,competitive work force, it may not be able to meet its strategic business objectives.
13

Stricter pricing guidelines for the medical technology industry could have a negative impact on the Company’sfuture operating results.
Initiatives sponsored by government agencies, legislative bodies and the private sector to limit the growth ofhealthcare costs, including price regulation and competitive pricing, are ongoing in markets where the Companydoes business. The Company could experience a negative impact on its operating results due to increased pricingpressure in the United States, Japan and certain other markets. Governments, hospitals and other third partypayers could reduce the amount of approved reimbursements for the Company’s products. Reductions inreimbursement levels or coverage or other cost-containment measures could unfavorably affect the Company’sfuture operating results.
The Company’s operating results could be negatively impacted by changes in its excess and obsolete inventoryreserves.
The Company maintains reserves for excess and obsolete inventory resulting from the potential inability tosell its products at prices in excess of current carrying costs. The markets in which the Company operates arehighly competitive, and new products and surgical procedures are introduced on an ongoing basis. Suchmarketplace changes may cause some of the Company’s products to become obsolete. The Company makesestimates regarding the future recoverability of the costs of these products and records a provision for excess andobsolete inventories based on historical experience, expiration of sterilization dates and expected future trends. Ifactual product life cycles, product demand or acceptance of new product introductions are less favorable thanprojected by management, additional inventory write-downs may be required, which could unfavorably affectfuture operating results.
The Company’s operating results could be negatively impacted if it is unable to capitalize on research anddevelopment spending.
The Company has spent a significant amount of time and resources on research and development projects inorder to develop and validate new and innovative products. The Company believes these projects will result inthe commercialization of new products and will create additional future sales. However, factors includingregulatory delays, safety concerns or patent disputes could delay the introduction or marketing of new products.Additionally, unanticipated issues may arise in connection with current and future clinical studies that coulddelay or terminate a product’s development prior to regulatory approval. The Company may experience anunfavorable impact on its operating results if it is unable to capitalize on those efforts by attaining the properFDA approval or to successfully market new products.
The Company’s operating results could be negatively impacted by future changes in the allocation of incometo each of the income tax jurisdictions in which the Company operates.
The Company operates in multiple income tax jurisdictions both inside and outside the United States.Income tax authorities in these jurisdictions regularly perform audits of the Company’s income tax filings.Accordingly, management must determine the appropriate allocation of income to each of these jurisdictionsbased on current interpretations of complex income tax regulations. Income tax audits associated with theallocation of this income and other complex issues, including inventory transfer pricing and cost sharing andproduct royalty arrangements, may require an extended period of time to resolve and may result in significantincome tax adjustments. If changes to the income allocation are required between jurisdictions with differentincome tax rates, such adjustments could have a material unfavorable impact on the Company’s income taxexpense and net earnings in future periods.
14

The Company’s operating results could be negatively impacted by future product liability claims, unfavorablecourt decisions, regulatory compliance or legal settlements.
The Company is a defendant in various proceedings, legal actions and claims arising in the normal course ofbusiness, including product liability and other matters. In addition, the Company may incur significant legalexpenses regardless of whether it is found to be liable. Such matters are subject to many uncertainties andoutcomes are not predictable with assurance. To partially mitigate losses arising from unfavorable outcomes insuch matters, the Company purchases third-party insurance coverage subject to certain deductibles and losslimitations. While the Company believes its current insurance coverage is adequate to mitigate losses arisingfrom such matters, its future operating results may be unfavorably impacted by any settlement payments or lossesbeyond the amounts of insurance carried. In addition, such product liability matters may negatively impact theCompany’s ability to obtain cost-effective third-party insurance coverage in future periods.
Substantially all of the Company’s products are subject to regulation by the FDA and other governmentalauthorities both inside and outside of the United States. If the Company were to fail to comply with theapplicable regulatory requirements, it may be subject to a range of sanctions including, but not limited to,warning letters, monetary fines, product recalls and the suspension of product manufacturing. Such sanctions, ifimplemented, could have a material, unfavorable impact on the Company’s future operating results.
The Company’s operating results could be negatively impacted by economic, political or other developments incountries in which the Company does business.
The Company distributes its products throughout the world. As a result, the Company’s future operatingresults could be negatively impacted by unstable economic, political and social conditions, including but notlimited to fluctuations in foreign currency exchange rates, political instability or changes in the interpretation orcreation of laws and regulations, including tax laws and regulations, in each of the countries where the Companyconducts business, including the United States.
15

ITEM 1B. UNRESOLVED STAFF COMMENTS.
Not applicable.
ITEM 2. PROPERTIES.
The Company has the following properties:
Location Segment UseSquare
FeetOwned/Leased
Mahwah, New Jersey Orthopaedic Implants Manufacturing of reconstructiveimplants
531,000 Owned
Limerick, Ireland Orthopaedic Implants Manufacturing of reconstructiveimplants and OP-1
130,000 Owned
Herouville, France Orthopaedic Implants Manufacturing of reconstructiveimplants
130,000 Owned
Kiel, Germany Orthopaedic Implants Manufacturing of trauma implants 147,000 Owned
Selzach, Switzerland Orthopaedic Implants Manufacturing of trauma implants 78,000 Owned
Neuchâtel, Switzerland Orthopaedic Implants Manufacturing of spinal implants 88,000 Owned
Bordeaux, France Orthopaedic Implants Manufacturing of spinal implants 79,000 Owned
Bordeaux, France Orthopaedic Implants Manufacturing of spinal implants 35,000 Leased
Carrigtwohill, Ireland Orthopaedic Implants andMedSurg Equipment
Manufacturing of reconstructiveimplants and surgical equipment
154,000 Owned
Freiburg, Germany Orthopaedic Implants andMedSurg Equipment
Manufacturing ofcraniomaxillofacial implants andsurgical navigation systems
106,000 Owned
Stetten, Germany Orthopaedic Implants Manufacturing ofcraniomaxillofacial implants
33,000 Owned
West Lebanon, NewHampshire
Orthopaedic Implants Manufacturing of OP-1 140,000 Owned
Hopkinton, Massachusetts Orthopaedic Implants Manufacturing of OP-1 69,000 Leased
Portage, Michigan MedSurg Equipment Manufacturing of surgicalequipment and patient-handling andemergency medical equipment
1,034,000 Owned
Arroyo, Puerto Rico MedSurg Equipment Manufacturing of surgicalequipment and endoscopic systems
220,000 Leased
San Jose, California MedSurg Equipment Manufacturing of endoscopicsystems
165,000 Leased
Flower Mound, Texas MedSurg Equipment Manufacturing of communicationssystems
127,000 Leased
L’Islet, Canada MedSurg Equipment Manufacturing of patient-handlingequipment
132,000 Owned
Lakeland, Florida MedSurg Equipment Reprocessing and remanufacturingof medical devices
112,000 Leased
Phoenix, Arizona MedSurg Equipment Reprocessing and remanufacturingof medical devices
51,000 Leased
Suzhou, China Orthopaedic Implants Manufacturing of reconstructive,trauma and spinal implants
155,000 Owned
Kalamazoo, Michigan Other Corporate headquarters 75,000 Owned
16

In addition to the above, the Company maintains administrative and sales offices and warehousing anddistribution facilities in various countries, including the United States, Argentina, Australia, Austria, Belgium,Brazil, Canada, Chile, China, Denmark, Egypt, Finland, France, Germany, Greece, Hong Kong, India, Israel,Italy, Japan, Korea, Malaysia, Mexico, The Netherlands, New Zealand, Norway, Poland, Portugal, Romania,Russia, Serbia and Montenegro, Singapore, South Africa, Spain, Sweden, Switzerland, Taiwan, Thailand,Ukraine, the United Arab Emirates and the United Kingdom.
The Company believes that its properties are suitable and adequate for the manufacture and distribution ofthe Company’s products.
ITEM 3. LEGAL PROCEEDINGS.
The Company is involved in various proceedings, legal actions and claims arising in the normal course ofbusiness, including proceedings related to product, labor and intellectual property, and other matters that aremore fully described in Note 16 to the Consolidated Financial Statements in Item 8 of this report. The outcomesof these matters will generally not be known for prolonged periods of time. In certain of the legal proceedings,the claimants seek damages, as well as other compensatory relief, which could result in the payment ofsignificant claims and settlements. In legal matters for which management has sufficient information toreasonably estimate the Company’s future obligations, a liability representing management’s best estimate of theprobable cost, or the minimum of the range of probable losses when a best estimate within the range is notknown, for the resolution of these legal matters is recorded. The estimates are based on consultation with legalcounsel, previous settlement experience and settlement strategies.
ITEM 4. SUBMISSION OF MATTERS TO A VOTE OF SECURITY HOLDERS.
Not applicable.
PART II
ITEM 5. MARKET FOR THE REGISTRANT’S COMMON EQUITY, RELATED STOCKHOLDERMATTERS AND ISSUER PURCHASES OF EQUITY SECURITIES.
The Company’s Common Stock is traded on the New York Stock Exchange under the symbol SYK.Quarterly stock prices appear under the caption “Summary of Quarterly Data (Unaudited)” in Item 8 of thisreport and dividend information for the years ended December 31, 2009 and 2008 appears under the caption“Selected Financial Data” in Item 6 below. The Company’s Board of Directors considers a cash dividend at eachof its quarterly meetings.
In the fourth quarter of 2009, the Company issued 220 shares of Common Stock as performance incentiveawards to certain employees. The shares were not registered under the Securities Act of 1933 based on theconclusion that the awards would not be events of sale within the meaning of Section 2(a)(3) of the Act.
On January 31, 2010, there were 4,732 shareholders of record of the Company’s Common Stock.
17

PERFORMANCE GRAPH (UNAUDITED)
Set forth below is a graph comparing the total returns (including reinvestments of dividends) of theCompany, the Standard & Poor’s (S&P) 500 Composite Stock Price Index and the S&P Health Care (MedicalProducts and Supplies) Index. The graph assumes $100 invested on December 31, 2004 in the Company’sCommon Stock and each of the indices.
$0
$50
$100
$150
$200
$250
2004
COMPARISON OF CUMULATIVE FIVE YEAR TOTAL RETURN
Stryker Corporation
S&P 500 Index
S&P 500 Health Care Index
2005 2006 2007 2008 2009
2004 2005 2006 2007 2008 2009
Stryker Corporation . . . . . . . . . . . . . . . . . . . . . . . . . . . . . . . . . 100 92.31 114.96 156.55 84.54 107.12S&P 500 Index . . . . . . . . . . . . . . . . . . . . . . . . . . . . . . . . . . . . . 100 104.91 121.48 128.16 80.74 102.11S&P 500 Health Care Index . . . . . . . . . . . . . . . . . . . . . . . . . . . 100 106.46 114.48 122.66 94.68 113.33
18

ITEM 6. SELECTED FINANCIAL DATA.
The financial information for each of the five years in the period ended December 31, 2009 is set forthbelow (dollars in millions, except per share amounts):
2009 2008 2007 2006 2005
Net sales . . . . . . . . . . . . . . . . . . . . . . . . . . . . . . . . . . . . . . . . . . . . $6,723.1 $6,718.2 $6,000.5 $5,147.2 $4,608.9Cost of sales . . . . . . . . . . . . . . . . . . . . . . . . . . . . . . . . . . . . . . . . . 2,183.7 2,131.4 1,865.2 1,616.6 1,489.2
Gross profit . . . . . . . . . . . . . . . . . . . . . . . . . . . . . . . . . . . . . . . . . 4,539.4 4,586.8 4,135.3 3,530.6 3,119.7
Research, development and engineering expenses . . . . . . . . . . . 336.2 367.8 375.3 324.6 284.7Selling, general and administrative expenses . . . . . . . . . . . . . . . 2,506.3 2,625.1 2,391.5 2,047.0 1,839.4Intangibles amortization . . . . . . . . . . . . . . . . . . . . . . . . . . . . . . . . 35.5 40.0 41.4 42.7 47.6Other (a) . . . . . . . . . . . . . . . . . . . . . . . . . . . . . . . . . . . . . . . . . . . . 67.0 34.9 19.8 52.7 15.9
2,945.0 3,067.8 2,828.0 2,467.0 2,187.6
Operating income . . . . . . . . . . . . . . . . . . . . . . . . . . . . . . . . . . . . . 1,594.4 1,519.0 1,307.3 1,063.6 932.1Other income (expense) . . . . . . . . . . . . . . . . . . . . . . . . . . . . . . . . 29.5 61.2 62.8 30.2 4.9
Earnings from continuing operations before income taxes . . . . . 1,623.9 1,580.2 1,370.1 1,093.8 937.0Income taxes . . . . . . . . . . . . . . . . . . . . . . . . . . . . . . . . . . . . . . . . 516.5 432.4 383.4 322.4 304.5
Net earnings from continuing operations . . . . . . . . . . . . . . . . . . . 1,107.4 1,147.8 986.7 771.4 632.5Net earnings and gain on sale of discontinued operations . . . . . . — — 30.7 6.3 11.1
Net earnings . . . . . . . . . . . . . . . . . . . . . . . . . . . . . . . . . . . . . . . . . $1,107.4 $1,147.8 $1,017.4 $ 777.7 $ 643.6
Net earnings from continuing operations per share of commonstock:
Basic . . . . . . . . . . . . . . . . . . . . . . . . . . . . . . . . . . . . . . . . . . . $ 2.79 $ 2.81 $ 2.41 $ 1.90 $ 1.57Diluted . . . . . . . . . . . . . . . . . . . . . . . . . . . . . . . . . . . . . . . . . $ 2.77 $ 2.78 $ 2.37 $ 1.87 $ 1.54
Net earnings per share of common stock:Basic . . . . . . . . . . . . . . . . . . . . . . . . . . . . . . . . . . . . . . . . . . . $ 2.79 $ 2.81 $ 2.48 $ 1.91 $ 1.59Diluted . . . . . . . . . . . . . . . . . . . . . . . . . . . . . . . . . . . . . . . . . $ 2.77 $ 2.78 $ 2.44 $ 1.89 $ 1.57
Dividends declared per share of common stock (See Note 10) . . . $ 0.25 $ 0.40 $ 0.33 $ 0.22 $ 0.11
Average number of shares outstanding—in millions:Basic . . . . . . . . . . . . . . . . . . . . . . . . . . . . . . . . . . . . . . . . . . . 397.4 408.1 409.7 406.5 403.7Diluted . . . . . . . . . . . . . . . . . . . . . . . . . . . . . . . . . . . . . . . . . 399.4 413.6 417.2 411.8 410.8
(a) Includes restructuring charges, intangible asset impairment and purchased in-process research anddevelopment charges.
19

FINANCIAL AND STATISTICAL DATA
2009 2008 2007 2006 2005
Cash and marketable securities . . . . . . . . . . . . . . . . . . . . . . . . . . 2,954.8 2,195.6 2,410.8 1,414.8 1,056.5Working capital . . . . . . . . . . . . . . . . . . . . . . . . . . . . . . . . . . . . . . 4,410.2 3,517.2 3,571.9 2,182.8 1,621.3Current ratio . . . . . . . . . . . . . . . . . . . . . . . . . . . . . . . . . . . . . . . . 4.1 3.4 3.7 2.6 2.3Property, plant and equipment—net . . . . . . . . . . . . . . . . . . . . . . 947.6 963.8 991.6 914.9 796.3Capital expenditures . . . . . . . . . . . . . . . . . . . . . . . . . . . . . . . . . . 131.3 155.2 187.7 209.4 261.8Depreciation and amortization . . . . . . . . . . . . . . . . . . . . . . . . . . 385.3 387.6 366.6 324.1 282.7Total assets . . . . . . . . . . . . . . . . . . . . . . . . . . . . . . . . . . . . . . . . . 9,071.3 7,603.3 7,354.0 5,873.8 4,992.5Long-term debt, including current maturities . . . . . . . . . . . . . . . 18.0 20.5 16.8 14.8 231.6Shareholders’ equity . . . . . . . . . . . . . . . . . . . . . . . . . . . . . . . . . . 6,595.1 5,406.7 5,378.5 4,191.0 3,300.2Return on average equity . . . . . . . . . . . . . . . . . . . . . . . . . . . . . . . 18.5% 21.3% 21.3% 20.8% 21.1%Net cash provided by operating activities . . . . . . . . . . . . . . . . . . 1,460.7 1,175.9 1,028.3 867.3 833.4Number of shareholders of record . . . . . . . . . . . . . . . . . . . . . . . . 4,607 4,500 4,373 4,091 3,979Number of employees . . . . . . . . . . . . . . . . . . . . . . . . . . . . . . . . . 18,582 17,594 16,026 18,806 17,265
ITEM 7. MANAGEMENT’S DISCUSSION AND ANALYSIS OF FINANCIAL CONDITION ANDRESULTS OF OPERATIONS.
Throughout this discussion, references are made to the following financial measures: “constant currency,”“adjusted net earnings,” “adjusted basic net earnings per share,” “adjusted diluted net earnings per share,”“adjusted net earnings from continuing operations,” “adjusted basic net earnings per share from continuingoperations” and “adjusted diluted net earnings per share from continuing operations.” These financial measuresare an alternative representation of Stryker Corporation’s (the Company or Stryker) past and potential futureoperational performance and do not replace the presentation of the Company’s reported financial results underU.S. generally accepted accounting principles (GAAP). The Company has provided these supplementalnon-GAAP financial measures because they provide meaningful information regarding the Company’s results ona consistent and comparable basis for the periods presented. Management uses these non-GAAP financialmeasures for reviewing the operating results of its business segments, for analyzing potential future businesstrends in connection with its budget process and bases certain annual bonus plans on these non-GAAP financialmeasures. In order to measure the Company’s sales performance on a constant currency basis, it is necessary toremove the impact of changes in foreign currency exchange rates which affects the comparability and trend ofsales. Constant currency results are calculated by translating current year results at prior year average foreigncurrency exchange rates. In order to measure earnings performance on a consistent and comparable basis, theCompany excludes the patent litigation gain and the income tax expenses associated with the repatriation offoreign earnings recorded in 2009, the restructuring charges recorded in 2009 and 2008, and the intangible assetimpairment charge recorded in 2007, each of which affects the comparability of operating results and the trend ofearnings. Additional details regarding the nature, determination and financial statement impact of these items areincluded in Results of Operations. In addition, the Company believes investors will utilize this information toevaluate period-to-period results on a comparable basis and to better understand potential future operatingresults. The Company encourages investors and other users of these financial statements to review itsConsolidated Financial Statements and other publicly filed reports in their entirety and not to rely solely on anysingle financial measure.
Executive Level Overview
Stryker is one of the world’s leading medical technology companies with the most broadly based range ofproducts in orthopaedics and a significant presence in other medical specialties. Stryker works with respectedmedical professionals to help people lead more active and more satisfying lives. The Company’s productsinclude implants used in joint replacement, trauma and spinal surgeries; surgical equipment and surgicalnavigation systems; endoscopic and communications systems; patient handling and emergency medicalequipment as well as other medical device products used in a variety of medical specialties.
20
Domestic sales accounted for 64% of total revenues in 2009. Most of the Company’s products are marketeddirectly to doctors, hospitals and other healthcare facilities by approximately 4,100 sales and marketing personnelin the United States. Stryker primarily maintains separate and dedicated sales forces for each of its principalproduct lines to provide focus and a high level of expertise to each medical specialty served.
International sales accounted for 36% of total revenues in 2009. The Company’s products are sold in morethan 100 countries through Company-owned sales subsidiaries and branches as well as third-party dealers anddistributors.
The Company’s business is generally not seasonal in nature; however, the number of orthopaedic implantsurgeries is lower during the summer months.
In the fourth quarter of 2009, the Company acquired Ascent Healthcare Solutions, Inc. (Ascent), the marketleader in the reprocessing and remanufacturing of medical devices in the United States, for $525.0 million in anall cash transaction. In addition, the Company settled an outstanding patent infringement lawsuit and received$62.5 million pursuant to a confidential settlement. The Company also repatriated $787.0 million of foreignearnings to the United States which was used in part to fund the acquisition of Ascent. In the third quarter of2009, the Company decided to terminate certain third-party agreements at the Company’s EMEA Division, tosimplify the organization structure at its Biotech, EMEA, Japan and Canada divisions and to discontinue sellingcertain products within its Orthopaedic Implants and MedSurg business segments. Additional details, includingthe financial statement impact of these transactions, are included in Results of Operations and Liquidity andCapital Resources.
In 2009 a federal grand jury in the District of Massachusetts returned an indictment charging StrykerBiotech LLC and certain current and former employees of Stryker Biotech with wire fraud, conspiracy to defraudthe U.S. Food and Drug Administration (FDA), distribution of a misbranded device and false statements to theFDA. The Company still hopes to be able to reach a fair and just resolution of this matter. Conviction of thesecharges could result in significant monetary fines and Stryker Biotech’s exclusion from participating in federaland state healthcare programs, which could have a material affect on Stryker Biotech’s business. However, theultimate resolution of these matters is not reasonably estimatable at this time. The Company understands thatcertain former Stryker Biotech employees have pled guilty to charges in connection with this matter. In 2009 theFDA Orthopaedic and Rehabilitation Devices Advisory Panel voted not to recommend that the Company receivemarketing approval for its OP-1 Putty. The Company is reviewing its strategic alternatives for OP-1, which couldbe impacted by the ultimate resolution of the indictment.
In the fourth quarter of 2008, the Company decided to simplify the structure of its Japanese distributionbusiness and to substantially reduce development efforts associated with the product technologies acquired fromSightline Technologies Ltd. (Sightline) in 2006. Unanticipated issues arose that delayed the regulatory approvaland commercialization efforts of new products associated with the product technologies acquired. Additionaldetails, including the financial statement impact resulting from those decisions, are included in Results ofOperations.
21

Results of Operations
The table below outlines the components of net earnings from continuing operations from the ConsolidatedStatements of Earnings as a percentage of net sales and the year-to-year percentage change in dollar amounts:
Percentage of Net Sales Percentage Change
2009 2008 2007 2009/2008 2008/2007
Net sales . . . . . . . . . . . . . . . . . . . . . . . . . . . . . . . . . . . . . . . . . 100.0% 100.0% 100.0% 0% 12%Cost of sales . . . . . . . . . . . . . . . . . . . . . . . . . . . . . . . . . . . . . . 32.5 31.7 31.1 2 14
Gross profit . . . . . . . . . . . . . . . . . . . . . . . . . . . . . . . . . . . . . . 67.5 68.3 68.9 (1) 11Research, development and engineering expenses . . . . . . . . 5.0 5.5 6.3 (9) (2)Selling, general and administrative expenses . . . . . . . . . . . . 37.3 39.1 39.9 (5) 10Intangibles amortization . . . . . . . . . . . . . . . . . . . . . . . . . . . . 0.5 0.6 0.7 (11) (3)Restructuring charges . . . . . . . . . . . . . . . . . . . . . . . . . . . . . . 1.0 0.5 — 92 —Intangible asset impairment . . . . . . . . . . . . . . . . . . . . . . . . . . — — 0.3 — (100)
Operating income . . . . . . . . . . . . . . . . . . . . . . . . . . . . . . . . . 23.7 22.6 21.8 5 16Other income (expense) . . . . . . . . . . . . . . . . . . . . . . . . . . . . . 0.4 0.9 1.0 (52) (3)
Earnings from continuing operations before incometaxes . . . . . . . . . . . . . . . . . . . . . . . . . . . . . . . . . . . . . . . . . . 24.2 23.5 22.8 3 15
Income taxes . . . . . . . . . . . . . . . . . . . . . . . . . . . . . . . . . . . . . 7.7 6.4 6.4 19 13
Net earnings from continuing operations . . . . . . . . . . . . . . . 16.5% 17.1% 16.4% (4) 16
The Company segregates its operations into two reportable business segments: Orthopaedic Implants andMedSurg Equipment. The Orthopaedic Implants segment includes orthopaedic reconstructive (hip and knee),trauma, craniomaxillofacial and spinal implant systems and other related products. The MedSurg Equipmentsegment includes surgical equipment and surgical navigation systems; endoscopic and communications systems;as well as patient handling and emergency medical equipment.
The table below sets forth domestic/international and product line sales information (in millions):
Percentage Change
Net Sales2009/2008 2008/2007
ReportedConstantCurrency Reported
ConstantCurrency2009 2008 2007
Domestic/international sales:Domestic . . . . . . . . . . . . . . . . . . $4,317.4 $4,282.2 $3,850.3 1% 1% 11% 11%International . . . . . . . . . . . . . . . 2,405.7 2,436.0 2,150.2 (1) 3 13 9
Total net sales . . . . . . . . . . . . . . . . . . $6,723.1 $6,718.2 $6,000.5 0 2 12 11
Product line sales:Orthopaedic Implants . . . . . . . . $4,119.7 $3,967.5 $3,587.3 4 6 11 9MedSurg Equipment . . . . . . . . . 2,603.4 2,750.7 2,413.2 (5) (4) 14 13
Total net sales . . . . . . . . . . . . . . . . . . $6,723.1 $6,718.2 $6,000.5 0 2 12 11
22

The tables below set forth additional geographical sales growth information for significant products withinthe Company’s Orthopaedic Implants and MedSurg Equipment segments on both a reported basis and a constantcurrency basis:
Year Ended December 31, 2009
Percentage Change
Domestic International Total
Reported ReportedConstantCurrency Reported
ConstantCurrency
Orthopaedic Implants sales:Hips . . . . . . . . . . . . . . . . . . . . . . . . . . . . . . . . . . . . . . . . . 6 (2) 4 2 5Knees . . . . . . . . . . . . . . . . . . . . . . . . . . . . . . . . . . . . . . . 10 (5) 0 4 6Trauma . . . . . . . . . . . . . . . . . . . . . . . . . . . . . . . . . . . . . . 10 2 4 5 6Spine . . . . . . . . . . . . . . . . . . . . . . . . . . . . . . . . . . . . . . . . 11 9 12 10 11Craniomaxillofacial . . . . . . . . . . . . . . . . . . . . . . . . . . . . 13 (2) 2 8 9Total Orthopaedic Implants . . . . . . . . . . . . . . . . . . . . . . 7 (1) 3 4 6
MedSurg Equipment sales:Surgical equipment and surgical navigation systems . . . 2 (2) 3 1 2Endoscopic and communications systems . . . . . . . . . . . (5) 6 11 (2) (1)Patient handling and emergency medical equipment . . . (23) (17) (12) (22) (20)Total MedSurg Equipment . . . . . . . . . . . . . . . . . . . . . . . (7) (2) 3 (5) (4)
Year Ended December 31, 2008
Percentage Change
Domestic International Total
Reported ReportedConstantCurrency Reported
ConstantCurrency
Orthopaedic Implants sales:Hips . . . . . . . . . . . . . . . . . . . . . . . . . . . . . . . . . . . . . . . . . 2 3 0 3 1Knees . . . . . . . . . . . . . . . . . . . . . . . . . . . . . . . . . . . . . . . 15 13 10 14 13Trauma . . . . . . . . . . . . . . . . . . . . . . . . . . . . . . . . . . . . . . 20 17 10 18 14Spine . . . . . . . . . . . . . . . . . . . . . . . . . . . . . . . . . . . . . . . . 22 14 8 19 18Craniomaxillofacial . . . . . . . . . . . . . . . . . . . . . . . . . . . . 21 6 3 16 15Total Orthopaedic Implants . . . . . . . . . . . . . . . . . . . . . . 11 10 6 11 9
MedSurg Equipment sales:Surgical equipment and surgical navigation systems . . . 16 18 14 17 15Endoscopic, communications and digital imaging
systems . . . . . . . . . . . . . . . . . . . . . . . . . . . . . . . . . . . . 6 18 15 9 8Patient handling and emergency medical equipment . . . 13 43 41 18 17Total MedSurg Equipment . . . . . . . . . . . . . . . . . . . . . . . 11 22 18 14 13
2009 Compared with 2008
The Company’s net sales increased to $6,723.1 million in 2009 from $6,718.2 million in 2008. Net salesgrew by 2% as a result of increased unit volume and changes in product mix partially offset by unfavorablechanges in foreign currency exchange rates.
The Company’s domestic sales were $4,317.4 million for 2009, representing an increase of 1%, as a resultof higher shipments of Orthopaedic Implants partially offset by lower shipments of MedSurg Equipment.International sales were $2,405.7 million for 2009, representing a decrease of 1%. The impact of foreigncurrency comparisons to the dollar value of international sales was unfavorable by $110.1 million for 2009. On aconstant currency basis, international sales increased 3% in 2009 as a result of higher shipments of OrthopaedicImplants and MedSurg Equipment.
23

Worldwide sales of Orthopaedic Implants were $4,119.7 million for 2009, representing an increase of 4%.On a constant currency basis, sales of Orthopaedic Implants increased 6% in 2009 as a result of higher shipmentsof hips, knees, trauma, craniomaxillofacial and spinal implant systems.
Hip Implant Systems: Sales of hip implant systems increased 2% in 2009 (5% on a constant currency basis).In the United States, sales growth was driven by Trident hip products, X3 Polyethylene hip products, Accoladecementless hip products and Restoration Modular Hip System revision hip products. Sales growth in several hipsystems, including X3 Polyethylene and Accolade cementless hip products in Europe, Canada and the LatinAmerica and Pacific regions and Trident in Japan, also contributed to the Company’s constant currency salesgrowth in 2009.
Knee Implant Systems: Sales of knee implant systems increased 4% in 2009 (6% on a constant currencybasis) due to strong sales growth in the Triathlon Knee System in the United States, Europe, Japan, Canada andthe Pacific region and solid sales growth in the Scorpio Knee System in the Latin America region.
Trauma Implant Systems: Sales of trauma implant systems increased 5% in 2009 (6% on a constantcurrency basis) as a result of sales growth in the Gamma 3 Hip Fracture System and the SPS Calcaneal FootPlating System in the United States, Europe, Canada, Latin America and Pacific regions as well as sales growthin the Company’s VariAx Distal Radius System in Europe, Canada and the Latin America region. Strong salesgrowth in the HydroSet injectable bone substitute product in the United States, Canada and the Pacific regionalso contributed to the Company’s constant currency sales growth in 2009.
Spinal Implant Systems: Sales of spinal implant systems increased 10% in 2009 (11% on a constantcurrency basis). The increase was driven by strong worldwide sales growth of thoracolumbar implant systems,interbody devices and cervical implants in the United States, Europe and the Latin America and Pacific regions.
Craniomaxillofacial Implant Systems: Sales of craniomaxillofacial (CMF) implant systems increased 8% in2009 (9% on a constant currency basis) primarily due to strong sales growth of products for neurologicalindications in the United States, Japan, Canada and the Latin America and Pacific regions. Sales growth of theHydroSet injectable bone substitute products in the United States, Europe Canada and the Pacific region alsocontributed to the Company’s constant currency sales growth.
Worldwide sales of MedSurg Equipment were $2,603.4 million for 2009, representing a decrease of 5%.The general economic slowdown in the United States resulted in a significant and rapid contraction in hospitalcapital budgets that depressed demand for certain MedSurg Equipment products. The severe weakening of theeconomy caused the Company’s hospital customers to reduce capital purchases, which generate about 60% ofsales within the MedSurg Equipment segment, to a degree not previously experienced in prior recessionaryperiods. On a constant currency basis, sales of MedSurg Equipment decreased 4% in 2009 as higher shipments ofsurgical equipment and surgical navigation systems were offset by lower shipments of endoscopic andcommunication systems as well as patient handling and emergency medical equipment.
Surgical Equipment and Surgical Navigation Systems: Sales of surgical equipment and surgical navigationsystems increased 1% in 2009 (2% on a constant currency basis) due to worldwide sales growth in operatingroom equipment as well as sales growth in powered surgical products in the United States, Europe, Japan and theLatin America region and sales growth in interventional pain products in the United States, Japan and the Pacificregion.
Endoscopic and Communications Systems: Sales of endoscopic and communications systems decreased 2%in 2009 (1% decrease on a constant currency basis) due to lower sales of medical video imaging equipmentproducts and image portal products in the United States partially offset by worldwide sales growth in arthroscopyand general surgery products as well as sales growth in communications products in Japan and the Latin Americaand Pacific regions and medical video imaging equipment in Europe, Japan and the Latin America and Pacificregions.
24

Patient Handling and Emergency Medical Equipment: Sales of patient handling and emergency medicalequipment decreased 22% in 2009 (20% decrease on a constant currency basis) due to lower worldwide sales ofhospital bed products and stretchers in the United States, Europe, Canada and the Pacific and Latin Americaregions, partially offset by sales growth in stretchers in Japan and emergency medical equipment in the UnitedStates.
Cost of sales represented 32.5% of sales in 2009 compared with 31.7% in 2008. The increase in the cost ofsales percentage is primarily due to increased spending for compliance initiatives, higher excess and obsoleteinventory costs associated with the Orthopaedic Implants businesses as well as higher unabsorbed costs due tolower production levels.
Research, development and engineering expenses represented 5.0% of sales in 2009 compared with 5.5% in2008. The spending level in 2009 decreased by 9% to $336.2 million due to tight control on discretionaryspending as well as the Company’s continued focus of certain research and development resources oncompliance initiatives. New product introductions in 2009 for the Orthopaedic Implants segment included theRejuvenate Modular Primary Hip system; the VariAx elbow plating system and the Xia Uniplanar TitaniumSpinal System. Within the MedSurg equipment segment, new product introductions in 2009 included the 1288HD Camera, the Impression non-powered support surface, the Flyte Suit personal protection system and theRemB micro electric system.
Selling, general and administrative expenses decreased 5% in 2009 and represented 37.3% of salescompared with 39.1% in 2008. In 2009 the Company settled an outstanding patent infringement lawsuit andreceived $62.5 million pursuant to a confidential settlement agreement. This gain represented a reduction toselling, general and administrative expenses. The remaining decrease in selling, general and administrativeexpenses as a percent of sales in 2009 is due to tight control on discretionary spending that more than offsetincreased legal settlement costs, net of insurance recoveries, recorded for certain product liability claims.
In 2009 the Company recorded $67.0 million ($48.4 million net of income taxes) in restructuring chargesrelated to decisions to terminate certain third-party agent agreements at the Company’s EMEA Division, tosimplify the organization structure at its Biotech, EMEA, Japan and Canada divisions and to discontinue sellingcertain products within its Orthopaedic Implants and MedSurg Equipment segments. In 2008 the Companyrecorded $34.9 million ($21.7 million net of income taxes) in restructuring charges related to the decisions tosimplify the structure of the Company’s Japanese distribution business and to substantially reduce developmentefforts associated with Sightline product technologies acquired in 2006.
Interest and marketable securities income, which is included in other income (expense), decreased to $53.9million in 2009 from $97.7 million in 2008 primarily as a result of lower average yields on the Company’sinvestments.
The Company’s effective income tax rate on earnings for the year ended December 31, 2009 was 31.8%compared to an effective income tax rate for the year ended December 31, 2008 of 27.4%. The effective incometax rate for the year ended December 31, 2009 reflects the impact of restructuring charges of $48.4 million (netof $18.6 million income tax benefits), the patent litigation gain of $42.9 million (net of $19.6 million income taxexpenses) and the impact of the $67.1 million income tax expenses associated with the repatriation of foreignearnings of $787.0 million. The effective income tax rate for the year ended December 31, 2008 reflects theimpact of the restructuring charges of $21.7 million (net of $13.2 million income tax benefits). In addition tothese factors, the Company’s reported effective income tax rates for the years ended December 31, 2009 and2008 are lower than the U.S. statutory income tax rate primarily as a result of manufacturing in lower income taxjurisdictions.
Net earnings decreased 4% in 2009 to $1,107.4 million from $1,147.8 million in 2008. Basic net earningsper share decreased 1% in 2009 to $2.79 from $2.81 in 2008, and diluted net earnings per share decreased to$2.77 in 2009 from $2.78 in 2008.
25

Excluding the impact of the patent litigation gain, the income tax charge associated with the repatriation offoreign earnings and the restructuring charges recorded in 2009 and 2008, adjusted net earnings increased 1% in2009 to $1,180.0 million from $1,169.5 million in 2008. Adjusted basic net earnings per share increased 4% in2009 to $2.97 from $2.87 in 2008 and adjusted diluted net earnings per share increased 4% in 2009 to $2.95 from$2.83 in 2008.
The reconciliations of these non-GAAP financial measures are as follows (in millions, except per shareamounts):
2009 2008Percentage
Change
Reported net earnings . . . . . . . . . . . . . . . . . . . . . . . . . . . . . . . . . . . $1,107.4 $1,147.8 (4)Restructuring charges . . . . . . . . . . . . . . . . . . . . . . . . . . . . . . . . . . . 48.4 21.7 123Patent litigation gain . . . . . . . . . . . . . . . . . . . . . . . . . . . . . . . . . . . (42.9) — —Income taxes on repatriation of foreign earnings . . . . . . . . . . . . . . 67.1 — —
Adjusted net earnings . . . . . . . . . . . . . . . . . . . . . . . . . . . . . . . $1,180.0 $1,169.5 1
Basic net earnings per share of common stock:Reported basic net earnings per share . . . . . . . . . . . . . . . . . . . . . . $ 2.79 $ 2.81 (1)Restructuring charges . . . . . . . . . . . . . . . . . . . . . . . . . . . . . . . . . . . $ 0.12 $ 0.05 140Patent litigation gain . . . . . . . . . . . . . . . . . . . . . . . . . . . . . . . . . . . $ (0.11) — —Income taxes on repatriation of foreign earnings . . . . . . . . . . . . . . $ 0.17 — —
Adjusted basic net earnings per share . . . . . . . . . . . . . . . . . . $ 2.97 $ 2.87 4
Weighted-average basic shares outstanding . . . . . . . . . . . . . 397.4 408.1
Diluted net earnings per share of common stock:Reported diluted net earnings per share . . . . . . . . . . . . . . . . . . . . . $ 2.77 $ 2.78 (0)Restructuring charges . . . . . . . . . . . . . . . . . . . . . . . . . . . . . . . . . . . $ 0.12 $ 0.05 140Patent litigation gain . . . . . . . . . . . . . . . . . . . . . . . . . . . . . . . . . . . $ (0.11) — —Income taxes on repatriation of foreign earnings . . . . . . . . . . . . . . $ 0.17 — —
Adjusted diluted net earnings per share . . . . . . . . . . . . . . . . . $ 2.95 $ 2.83 4
Weighted-average diluted shares outstanding . . . . . . . . . . . . 399.4 413.6
The weighted-average basic and diluted shares outstanding used in the calculation of these non-GAAPfinancial measures are the same as the weighted-average shares outstanding used in the calculation of thereported per share amounts.
2008 Compared with 2007
The Company’s net sales increased 12% in 2008 to $6,718.2 million from $6,000.5 million in 2007. Netsales grew by 11% as a result of increased unit volume and changes in product mix and by 1% due to favorablechanges in foreign currency exchange rates.
The Company’s domestic sales were $4,282.2 million for 2008, representing an increase of 11%, as a resultof higher shipments of Orthopaedic Implants and MedSurg Equipment. International sales were $2,436.0 millionfor 2008, representing an increase of 13%. The impact of foreign currency comparisons to the dollar value ofinternational sales was favorable by $84.7 million for 2008. On a constant currency basis, international salesincreased 9% in 2008 as a result of higher shipments of Orthopaedic Implants and MedSurg Equipment.
Worldwide sales of Orthopaedic Implants were $3,967.5 million for 2008, representing an increase of 11%.On a constant currency basis, sales of Orthopaedic Implants increased 9% in 2008 as a result of higher shipmentsof reconstructive, trauma, spinal and craniomaxillofacial implant systems and bone cement.
26

Hip Implant Systems: Sales of hip implant systems increased 3% in 2008 (1% on a constant currency basis).In the United States, sales growth was driven by increased sales of the Cormet Hip Resurfacing product and salesgrowth in X3 Polyethylene and Accolade cementless hip products, partially offset by declines in other hipsystems. Sales growth in several hip systems, including Accolade, X3 Polyethylene and ABG II in Europe andSecur-Fit in Japan and the Pacific region, also contributed to the Company’s constant currency sales growth in2008.
Knee Implant Systems: Sales of knee implant systems increased 14% in 2008 (13% on a constant currencybasis) due to strong sales growth in the Triathlon Knee System in the United States, Europe, Canada and thePacific region and solid sales growth in the Scorpio Knee System in Japan and the Latin America region.
Trauma Implant Systems: Sales of trauma implant systems increased 18% in 2008 (14% on a constantcurrency basis) as a result of strong worldwide sales growth in the Gamma3 Hip Fracture System and the SPSCalcaneal Foot Plating System and strong sales growth in the Company’s T2 Nailing System in the UnitedStates, Canada and the Pacific region. Strong sales growth in the HydroSet injectable bone substitute product inthe United States and the Pacific region also contributed to the Company’s constant currency sales growth in2008.
Spinal Implant Systems: Sales of spinal implant systems increased 19% in 2008 (18% on a constantcurrency basis). The increase was driven by strong worldwide sales growth of thoracolumbar implant systems,interbody devices and cervical implants.
Craniomaxillofacial Implant Systems: Sales of craniomaxillofacial implant systems increased 16% in 2008(15% on a constant currency basis) primarily due to strong sales growth of products for neurological indicationsand craniomaxillofacial implants and the HydroSet injectable bone substitute product in the United States and thePacific region.
Worldwide sales of MedSurg Equipment were $2,750.7 million for 2008, representing an increase of 14%.On a constant currency basis, sales of MedSurg Equipment increased 13% in 2008 as a result of higher shipmentsof surgical equipment and surgical navigation systems; endoscopic, communications and digital imagingsystems; as well as patient handling and emergency medical equipment.
Surgical Equipment and Surgical Navigation Systems: Sales of surgical equipment and surgical navigationsystems increased 17% in 2008 (15% on a constant currency basis) due to strong worldwide sales growth inpowered surgical and operating room equipment as well as solid sales growth in interventional pain products inthe United States and the Pacific region.
Endoscopic and Communications: Sales of endoscopic and communications systems increased 9% in 2008(8% on a constant currency basis) as a result of strong worldwide sales growth in arthroscopy and generalsurgery as well as strong international sales growth of medical video imaging equipment, led by the 1188 HDcamera and complimentary products, partially offset by lower sales of medical video imaging equipment in theUnited States. Strong sales growth in communication products, led by the SwitchPoint Infinity 2, in the UnitedStates and Canada also contributed to the Company’s constant currency sales growth.
Patient Handling and Emergency Medical Equipment: Sales of patient handling and emergency medicalequipment increased 18% in 2008 (17% on a constant currency basis) due to strong sales growth of hospital bedproducts in the United States and the Latin America region and stretchers and emergency medical equipment inthe United States and Europe.
Cost of sales represented 31.7% of sales in 2008 compared with 31.1% in 2007. The increase in the cost ofsales percentage is primarily due to increased compliance initiative spending and higher commodity and freightcosts.
27
Research, development and engineering expenses represented 5.5% of sales in 2008 compared with 6.3% in2007. As anticipated, the spending level in 2008 decreased by 2% to $367.8 million as the Companyimplemented a more normalized level of spending for these costs compared to prior periods as well as theCompany’s focus of certain research and development resources on compliance initiatives, which has sloweddown some research and development projects and reduced outside contractor spending on certain projects. Newproduct introductions in 2008 for the Orthopaedic Implants segment included the Tritanium Primary Hip System;the Triathlon TS Revision Knee System; the Triathlon Partial Knee Resurfacing System; the Asnis ScrewSystem; the VariAx Hand and Foot Trauma Systems; and the Xia III Thoracolumbar Spinal System. Within theMedSurg Equipment segment, new product introductions in 2008 included the S3 Med/Surg Hospital Bed andthe Neptune 2 Waste Management System.
Selling, general and administrative expenses increased 10% in 2008 and represented 39.1% of salescompared with 39.9% in 2007. The decrease in selling, general and administrative expenses as a percent of salesin 2008 is due to tight control of discretionary spending in the second half of 2008 partially offset by increases insales-related costs and costs associated with compliance activities.
In 2008 the Company recorded $34.9 million ($21.7 million net of income taxes) in restructuring chargesrelated to the decisions to simplify the structure of the Company’s Japanese distribution business and tosubstantially reduce development efforts associated with Sightline product technologies acquired in 2006. In2007 the Company recorded a $19.8 million charge ($12.7 million net of income taxes) to write off patentsassociated with intervertebral body fusion cage products. The impairment followed a U.S. Food and DrugAdministration (FDA) decision to downgrade certain intervertebral body fusion products to Class II devices,along with a weak market for sales of these specific products. As a result, the Company performed a discountedcash flow analysis over the remaining life of the patented technologies and determined that the charge wasrequired.
Interest and marketable securities income, which is included in other income (expense), increased to $97.7million in 2008 from $85.5 million in 2007 primarily as a result of increased average cash and cash equivalentsand marketable securities balances in 2008 compared to 2007. Interest expense, which is included in otherincome (expense), increased to $30.5 million in 2008 from $22.2 million in 2007, primarily as a result of interestexpense associated with unresolved income tax positions.
The Company’s effective income tax rate on earnings from continuing operations for the year endedDecember 31, 2008 was 27.4% compared to an effective income tax rate for the year ended December 31, 2007of 28.0%. The effective income tax rate for the year ended December 31, 2008 reflects the impact of therestructuring charges of $21.7 million (net of $13.2 million income tax benefits). The effective income tax ratefor the year ended December 31, 2007 reflects the impact of the intangible asset impairment charge of $12.7million (net of $7.1 million income tax benefit). In addition to these factors, the Company’s reported effectiveincome tax rates for the years ended December 31, 2008 and 2007 are lower than the U.S. statutory income taxrate primarily as a result of manufacturing in lower income tax jurisdictions.
Net earnings from continuing operations increased 16% in 2008 to $1,147.8 million from $986.7 million in2007. Basic net earnings per share from continuing operations increased 17% in 2008 to $2.81 from $2.41 in2007, and diluted net earnings per share from continuing operations increased 17% in 2008 to $2.78 from $2.37in 2007.
Excluding the impact of the restructuring charges recorded in 2008 and the charge to reflect the intangibleasset impairment in 2007, adjusted net earnings from continuing operations increased 17% in 2008 to $1,169.5million from $999.4 million in 2007. Adjusted basic net earnings per share from continuing operations increased18% in 2008 to $2.87 from $2.44 in 2007, and adjusted diluted net earnings per share from continuing operationsincreased 18% in 2008 to $2.83 from $2.40 in 2007.
28
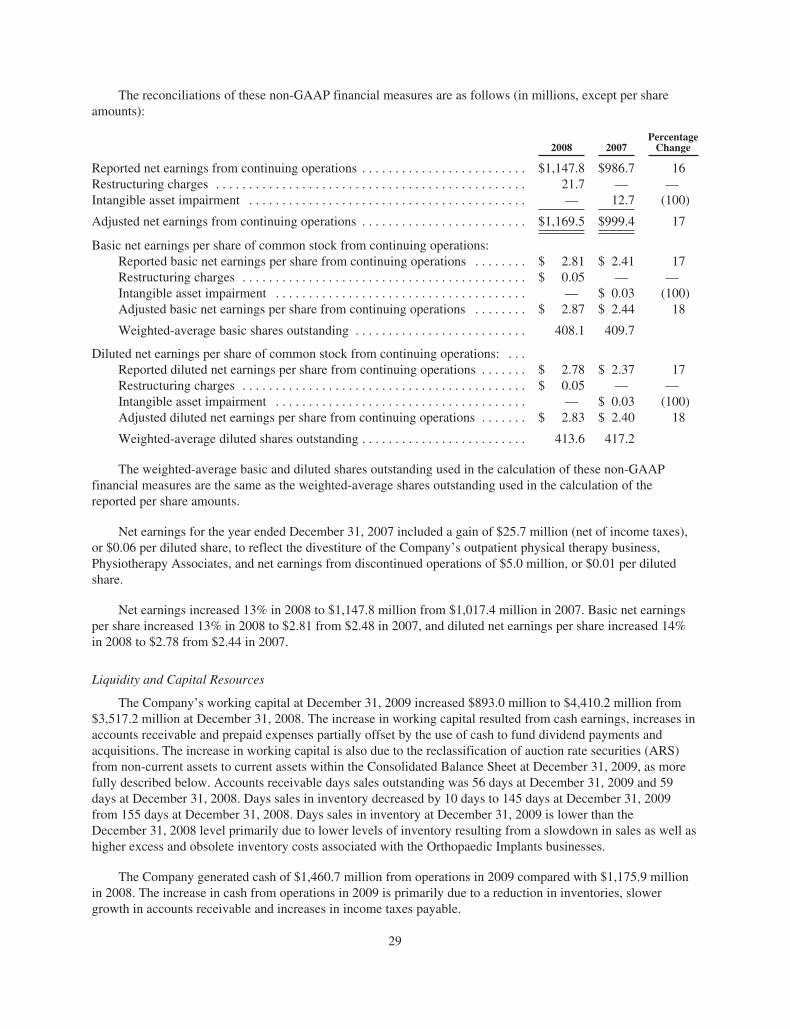
The reconciliations of these non-GAAP financial measures are as follows (in millions, except per shareamounts):
2008 2007Percentage
Change
Reported net earnings from continuing operations . . . . . . . . . . . . . . . . . . . . . . . . . $1,147.8 $986.7 16Restructuring charges . . . . . . . . . . . . . . . . . . . . . . . . . . . . . . . . . . . . . . . . . . . . . . . 21.7 — —Intangible asset impairment . . . . . . . . . . . . . . . . . . . . . . . . . . . . . . . . . . . . . . . . . . — 12.7 (100)
Adjusted net earnings from continuing operations . . . . . . . . . . . . . . . . . . . . . . . . . $1,169.5 $999.4 17
Basic net earnings per share of common stock from continuing operations:Reported basic net earnings per share from continuing operations . . . . . . . . $ 2.81 $ 2.41 17Restructuring charges . . . . . . . . . . . . . . . . . . . . . . . . . . . . . . . . . . . . . . . . . . . $ 0.05 — —Intangible asset impairment . . . . . . . . . . . . . . . . . . . . . . . . . . . . . . . . . . . . . . — $ 0.03 (100)Adjusted basic net earnings per share from continuing operations . . . . . . . . $ 2.87 $ 2.44 18
Weighted-average basic shares outstanding . . . . . . . . . . . . . . . . . . . . . . . . . . 408.1 409.7
Diluted net earnings per share of common stock from continuing operations: . . .Reported diluted net earnings per share from continuing operations . . . . . . . $ 2.78 $ 2.37 17Restructuring charges . . . . . . . . . . . . . . . . . . . . . . . . . . . . . . . . . . . . . . . . . . . $ 0.05 — —Intangible asset impairment . . . . . . . . . . . . . . . . . . . . . . . . . . . . . . . . . . . . . . — $ 0.03 (100)Adjusted diluted net earnings per share from continuing operations . . . . . . . $ 2.83 $ 2.40 18
Weighted-average diluted shares outstanding . . . . . . . . . . . . . . . . . . . . . . . . . 413.6 417.2
The weighted-average basic and diluted shares outstanding used in the calculation of these non-GAAPfinancial measures are the same as the weighted-average shares outstanding used in the calculation of thereported per share amounts.
Net earnings for the year ended December 31, 2007 included a gain of $25.7 million (net of income taxes),or $0.06 per diluted share, to reflect the divestiture of the Company’s outpatient physical therapy business,Physiotherapy Associates, and net earnings from discontinued operations of $5.0 million, or $0.01 per dilutedshare.
Net earnings increased 13% in 2008 to $1,147.8 million from $1,017.4 million in 2007. Basic net earningsper share increased 13% in 2008 to $2.81 from $2.48 in 2007, and diluted net earnings per share increased 14%in 2008 to $2.78 from $2.44 in 2007.
Liquidity and Capital Resources
The Company’s working capital at December 31, 2009 increased $893.0 million to $4,410.2 million from$3,517.2 million at December 31, 2008. The increase in working capital resulted from cash earnings, increases inaccounts receivable and prepaid expenses partially offset by the use of cash to fund dividend payments andacquisitions. The increase in working capital is also due to the reclassification of auction rate securities (ARS)from non-current assets to current assets within the Consolidated Balance Sheet at December 31, 2009, as morefully described below. Accounts receivable days sales outstanding was 56 days at December 31, 2009 and 59days at December 31, 2008. Days sales in inventory decreased by 10 days to 145 days at December 31, 2009from 155 days at December 31, 2008. Days sales in inventory at December 31, 2009 is lower than theDecember 31, 2008 level primarily due to lower levels of inventory resulting from a slowdown in sales as well ashigher excess and obsolete inventory costs associated with the Orthopaedic Implants businesses.
The Company generated cash of $1,460.7 million from operations in 2009 compared with $1,175.9 millionin 2008. The increase in cash from operations in 2009 is primarily due to a reduction in inventories, slowergrowth in accounts receivable and increases in income taxes payable.
29

In 2009 the Company used cash of $131.3 million for capital expenditures. In addition, the Company usedcash of $198.4 million for the payment of dividends and $570.2 million of cash to fund acquisitions. TheCompany also purchased and sold marketable securities, which are classified as available-for-sale investments inaccordance with the provisions of the Investments-Debt and Equity Securities Topic of the Financial AccountingStandard Board (FASB) Accounting Standards Codification (Codification).
The Company had $658.7 million in cash and cash equivalents and $2,296.1 million in current marketablesecurities at December 31, 2009. The Company had outstanding borrowings totaling $18.0 million at that date,all of which were classified as current obligations. The Company believes its cash on hand and marketablesecurities, proceeds from the January 2010 note offering as more fully described below as well as anticipatedcash flows from operations, will be sufficient to fund future operating capital requirements; future manufacturingfacility construction and other capital expenditures; future business and product line acquisitions to supplementits current product offerings; loaner instrumentation for surgical implants in support of new product launches;required debt repayments and the payment of dividends.
On January 15, 2010, the Company sold $500.0 million of senior unsecured notes due January 15, 2015 (the“2015 Notes”) and $500.0 million of senior unsecured notes due January 15, 2020 (the “2020 Notes”). The 2015Notes will bear interest at 3.00% per year and, unless previously redeemed, will mature on January 15, 2015. The2020 Notes will bear interest at 4.375% per year and, unless previously redeemed, will mature on January 15,2020. The Company intends to use the net proceeds from the offering for working capital and other generalcorporate purposes, including acquisitions, stock repurchases and other business opportunities.
Should additional funds be required, the Company had $1,049.2 million of additional borrowing capacityavailable under all of its existing credit facilities as of December 31, 2009, including the Company’s $1,000.0million 5-year nonamortizing, revolving Unsecured Credit Facility that expires in November 2010.
The Company’s additional borrowing capacity, along with the expected expiration period of thecommitments, is summarized as follows (in millions):
TotalAmount
Committed
Amount ofCommitment
Expiration Per Period
Less Than1 Year
In Excessof 1 Year
Unsecured Credit Facility and other lines of credit . . . . . . . . . . . . $1,049.2 $1,015.3 $33.9
The Company reviews declines in the fair value of its investments classified as available-for-sale forimpairment in accordance with the provisions of the Investments-Debt and Equity Securities Topic of the FASBCodification in order to determine whether the decline in fair value is an other-than-temporary impairment.Other-than-temporary impairments of available-for-sale marketable securities are recorded in earnings.
Beginning in February 2008, liquidity issues in the global credit markets resulted in the failure of auctionsfor all of the ARS investments held by the Company, as the amount of securities submitted for sale in thoseauctions exceeded the amount of purchase bids. To date, the Company has collected all interest receivable onoutstanding ARS when due and expects to continue to do so in the future. Due to current market conditions, theARS investments have continued to experience failed auctions. These failed auctions result in a lack of liquidityin the securities but do not affect the underlying collateral of the securities. The Company does not anticipate thatthe lack of liquidity in its ARS, even for an extended period of time, will affect its ability to finance itsoperations, including its expansion programs and planned capital expenditures. The Company continues tomonitor efforts by the financial markets to find alternative means for restoring the liquidity of these investments.
As of December 31, 2009, the Company held $156.3 million, at par value, of ARS investments. In 2008 theCompany entered into an ARS Rights agreement (Rights) with UBS Financial Services Inc. (UBS), one of itsinvestment providers, whereby the Company received the right to sell its ARS at par value to UBS at any time
30

during the period June 30, 2010 through July 2, 2012. These Rights are nontransferable securities registered withthe U.S. Securities and Exchange Commission (U.S. SEC). As a result of accepting the ARS Rights, theCompany has released UBS and its employees/agents from all claims except claims for consequential damagesdirectly or indirectly relating to UBS’s marketing and sale of ARS and agreed not to serve as a classrepresentative or receive benefits under any class action settlement or investor fund. The Company has elected toapply the fair value option to its ARS Rights pursuant to the provisions of the Financial Instruments Topic of theFASB Codification. As a result of this election, in the twelve-month period ended December 31, 2009, theCompany recorded a loss of $11.0 million in other income (expense) to recognize the change in fair valueestimate of its ARS Rights; the loss was offset by a corresponding gain in the fair value estimate of the relatedtrading marketable securities. The Company intends to exercise its ARS Rights described above when it becomesdue and has, therefore, reclassified the ARS as current marketable securities within its Consolidated BalanceSheet as of December 31, 2009.
The Company’s future contractual obligations for agreements with initial terms greater than 1 year,including agreements to purchase materials in the normal course of business, are summarized as follows (inmillions):
Payment Period
Total2010 2011 2012 2013 2014 After 2014
Long-term debt . . . . . . . . . . . . . . . . . . . . . . . . . . . $ 18.0 $ — $ — $ — $ — $ — $ 18.0Operating leases . . . . . . . . . . . . . . . . . . . . . . . . . . 49.0 34.3 26.3 19.4 14.3 24.8 168.1Unconditional purchase obligations . . . . . . . . . . . 388.9 124.5 16.2 1.9 1.3 1.3 534.1Contributions to defined benefit plans . . . . . . . . . 19.0 — — — — — 19.0Other . . . . . . . . . . . . . . . . . . . . . . . . . . . . . . . . . . . 4.0 2.1 1.6 2.1 1.3 46.4 57.5
$478.9 $160.9 $44.1 $23.4 $16.9 $72.5 $796.7
As further described in Note 12 to the Consolidated Financial Statements, as of December 31, 2009 theCompany’s defined benefit pension plans are in an underfunded status of $85.1 million. Due to the rules affectingtax-deductible contributions in the jurisdictions in which the plans are offered and the impact of future plan assetperformance, changes in interest rates and the potential for changes in legislation in the United States and otherforeign jurisdictions, the Company is not able to reasonably estimate the future periods, beyond 2010, in whichcontributions to fund defined benefit pension plans will be made. As further described in Note 13 to theConsolidated Financial Statements, as of December 31, 2009, the Company has recorded a liability forunresolved income tax positions of $292.7 million. Due to uncertainties regarding the ultimate resolution ofincome tax audits, the Company is not able to reasonably estimate the amount or the future periods in whichincome tax payments to settle these unresolved income tax positions will be made.
Critical Accounting Policies and Estimates
The preparation of the Company’s Consolidated Financial Statements requires management to makeestimates and assumptions that affect the amounts reported in the financial statements and accompanying notes.Management evaluates these estimates and assumptions on an ongoing basis. Estimates are based on historicalexperience, when available, and on various other assumptions that are believed to be reasonable under thecircumstances, the results of which form the basis for making judgments about the carrying values of assets andliabilities that are not readily apparent from other sources. Actual results may differ from these estimates underdifferent assumptions or conditions.
Management believes that, of its significant accounting policies (see Note 1 to the Consolidated FinancialStatements), an understanding of the following critical accounting policies is important in obtaining an overallunderstanding of the Consolidated Financial Statements.
31

Allowance for Doubtful Accounts
The Company maintains an allowance for doubtful accounts for estimated losses in the collection ofaccounts receivable. The Company makes estimates regarding the future ability of its customers to make requiredpayments based on historical credit experience and expected future trends. If actual customer financial conditionsare less favorable than projected by management, additional accounts receivable write offs may be necessary,which could unfavorably affect future operating results.
Inventory Reserves
The Company maintains reserves for excess and obsolete inventory resulting from the potential inability tosell its products at prices in excess of current carrying costs. The markets in which the Company operates arehighly competitive and new products and surgical procedures are introduced on an ongoing basis. Thesemarketplace changes may cause some of the Company’s products to become obsolete. The Company makesestimates regarding the future recoverability of the costs of these products and records a provision for excess andobsolete inventories based on historical experience, expiration of sterilization dates and expected future trends. Ifactual product life cycles, product demand or acceptance of new product introductions are less favorable thanprojected by management, additional inventory write downs may be required, which could unfavorably affectfuture operating results.
Income Taxes
The Company operates in multiple income tax jurisdictions both inside and outside the United States.Accordingly, management must determine the appropriate allocation of income to each of these jurisdictions.Income tax audits associated with the allocation of this income and other complex issues, including inventorytransfer pricing and cost sharing and product royalty arrangements, may require an extended period of time toresolve and may result in income tax adjustments if changes to the income allocation are required betweenjurisdictions with different income tax rates. Because income tax adjustments in certain jurisdictions can besignificant, the Company records accruals representing management’s best estimate of the probable resolution ofthese matters. To the extent additional information becomes available, such accruals are adjusted to reflect therevised estimated probable outcome.
Recently Adopted Accounting Standards
In 2009 the Company adopted the provisions of the Business Combinations Topic of the FASB Codification.This topic significantly changes the principles and requirements for how an acquisition is recognized andmeasured in financial statements, including the identifiable assets acquired and the liabilities assumed. This topicalso provides guidance for recognizing and measuring goodwill acquired in a business combination and requiresdisclosures to enable users of the financial statements to evaluate the nature and financial effects of the businesscombination. The additional disclosure requirements regarding the Business Combinations Topic of the FASBCodification are included in Note 5 to the Consolidated Financial Statements.
In 2008 the Company adopted the provisions of the Fair Value Measurements and Disclosures Topic of theFASB Codification for financial assets and liabilities measured on a recurring basis. This topic applies to allfinancial assets and financial liabilities that are being measured and reported on a fair value basis, establishes aframework for measuring fair value of assets and liabilities and expands disclosures about fair valuemeasurements. There was no impact to the Consolidated Financial Statements as a result of the adoption of thistopic. The additional disclosure requirements regarding fair value measurements are included in Note 2 to theConsolidated Financial Statements. In 2009 the Company adopted the non-financial assets and liabilitiesguidance of the Fair Value Measurement and Disclosures Topic that were previously deferred.
In 2008 the Company adopted the provisions of the Financial Instruments Topic of the FASB Codification.This topic allows companies the option to measure eligible financial instruments at fair value. Such election,which may be applied on an instrument by instrument basis, is typically irrevocable once elected. The Companyhas elected to apply the fair value option to its ARS Rights agreement as more fully described in Liquidity andCapital Resources.
32

Other Matters
The Company distributes its products throughout the world. As a result, the Company’s financial resultscould be significantly affected by factors such as weak economic conditions or changes in foreign currencyexchange rates. The Company’s operating results are primarily exposed to changes in exchange rates among theU.S. dollar, European currencies, in particular the euro and the British pound, the Japanese yen, the Australiandollar and the Canadian dollar. When the U.S. dollar weakens against foreign currencies, the dollar value of salesdenominated in foreign currencies increases. When the U.S. dollar strengthens, the opposite situation occurs. TheCompany develops and manufactures its products in the United States, Canada, China, France, Germany, Ireland,Puerto Rico and Switzerland and incurs costs in the applicable local currencies. This worldwide deployment offacilities serves to partially mitigate the impact of currency exchange rate changes on the Company’s cost ofsales.
The Company enters into forward currency exchange contracts to mitigate the impact of currencyfluctuations on transactions denominated in nonfunctional currencies, thereby limiting risk to the Company thatwould otherwise result from changes in exchange rates. These nonfunctional currency exposures principallyrelate to intercompany receivables and payables arising from intercompany purchases of manufactured productsas well as, in 2009, intercompany loans associated with the repatriation of foreign earnings. The periods of theforward currency exchange contracts correspond to the periods of the exposed transactions, with realized gainsand losses included in the measurement and recording of transactions denominated in the nonfunctionalcurrencies. All forward currency exchange contracts are recorded at their fair value each period, with resultinggains (losses) included in other income (expense) in the Consolidated Statements of Earnings.
At December 31, 2009, the Company had outstanding forward currency exchange contracts to purchase$2,041.1 million and sell $280.5 million of various currencies (principally U.S. dollars and euros) with maturitiesranging from 4 to 106 days. At December 31, 2008, the Company had outstanding forward currency exchangecontracts to purchase $412.5 million and sell $288.4 million of various currencies (principally U.S. dollars andeuros) with maturities ranging from 2 to 110 days. The estimated fair value of forward currency exchangecontracts represents the measurement of the contracts at month-end spot rates as adjusted by current forwardpoints. A hypothetical 10% change in foreign currencies relative to the U.S. dollar would change theDecember 31, 2009 fair value by approximately $79.1 million. The Company is exposed to credit loss in theevent of nonperformance by counterparties on its outstanding forward currency exchange contracts but does notanticipate nonperformance by any of the counterparties.
The Company has certain investments in net assets in international locations that are not hedged. Theseinvestments are subject to translation gains and losses due to changes in foreign currency exchange rates. For theyear ended December 31, 2009, the strengthening of foreign currencies relative to the U.S. dollar increased thevalue of these investments in net assets and the related foreign currency translation adjustment gain inshareholders’ equity by $73.8 million to $277.5 million from $203.7 million at December 31, 2008.
In 2009 the Company received a subpoena from the Attorney General of New Jersey requesting variousdocuments related to the financial interests and arrangements of physicians participating in certain clinical trialsfor or on behalf of the Company. The Company is evaluating the scope of the subpoena and its response. TheAttorney General of New Jersey reportedly issued similar subpoenas to other major medical devicemanufacturing companies.
In 2009 a federal grand jury in the District of Massachusetts returned an indictment charging StrykerBiotech LLC and certain current and former employees of Stryker Biotech with wire fraud, conspiracy to defraudthe U.S. Food and Drug Administration (FDA), distribution of a misbranded device and false statements to theFDA. The Company still hopes to be able to reach a fair and just resolution of this matter. Conviction of thesecharges could result in significant monetary fines and Stryker Biotech’s exclusion from participating in federaland state health care programs, which could have a material affect on Stryker Biotech’s business. However, theultimate resolution of these matters is not reasonably estimatable at this time. The Company understands thatcertain former Stryker Biotech employees have pled guilty to charges in connection with this matter.
33

In 2009 the Company received a warning letter from the U.S. FDA related to compliance issues for one ofits craniomaxillofacial (CMF) implant products that was previously sold through its CMF distribution facility inPortage, Michigan. In 2008 the Company received a warning letter from the FDA related to quality systems andcompliance issues at its OP-1 implant manufacturing facility in Hopkinton, Massachusetts. In 2007 the Companyreceived two warning letters from the FDA regarding compliance with certain quality system specifications at itsreconstructive implant manufacturing facilities: one letter for its facility in Cork, Ireland and another for itsfacility in Mahwah, New Jersey. In October 2009, the FDA informed the Company that the warning letter relatedto its OP-1 implant manufacturing facility had been resolved following a productive reinspection earlier in 2009.The Company takes these matters very seriously and continues to fully cooperate with the FDA to address theirobservations at the other facilities.
In 2007 the Company announced that it reached a resolution with the U.S. Attorney’s office for the Districtof New Jersey in connection with a previously announced investigation relating to “any and all consultingcontracts, professional service agreements, or remuneration agreements between Stryker Corporation and anyorthopedic surgeon, orthopedic surgeon in training, or medical school graduate using or considering the surgicaluse of hip or knee joint replacement/reconstruction products manufactured or sold by Stryker Corporation.” Theresolution was in the form of a non-prosecution agreement for an 18-month period that ended on March 27, 2009.During the term of the agreement, the Company’s Orthopaedics subsidiary was subject to oversight by a federalmonitor, as appointed by the U.S. Attorney, regarding compliance with certain standards and procedures inconnection with the retention and payment of orthopaedic surgeon consultants related to reconstructive productsand the provision of certain benefits to such surgeons. Subsequent to entering into the non-prosecutionagreement, the U.S. Department of Health and Human Services, Office of Inspector General (HHS) issued a civilsubpoena to the Company in seeking to determine whether the Company violated various laws by payingconsulting fees and providing other things of value to orthopedic surgeons and healthcare and educationalinstitutions as inducements to use Stryker’s orthopedic medical devices in procedures paid for in whole or in partby Medicare. The Company produced numerous documents and other materials to HHS in response to thesubpoena and had been working with HHS to attempt to narrow the scope of the requested production. In 2008the U.S. Department of Justice and HHS sought judicial enforcement of the subpoena and a court agreed toenforce it in January 2009. At the same time, the U.S. District Court for the District of New Jersey dismissed theCompany’s complaint, which had asked the court to quash the subpoena and sought other appropriate relief onthe grounds that the subpoena was overbroad and oppressive.
In 2007 the Company disclosed that the U.S. SEC made an informal inquiry of the Company regardingpossible violations of the Foreign Corrupt Practices Act in connection with the sale of medical devices in certainforeign countries. Subsequently, in 2008, the Company received a subpoena from the U.S. Department of Justice,Criminal Division, requesting certain documents for the period since January 1, 2000 in connection with the U.S.SEC inquiry. The Company is fully cooperating with the U.S. Department of Justice and the U.S. SEC regardingthese matters.
The Company is partially self-insured for product liability claims and utilizes a wholly owned captiveinsurance company in the United States to manage its self-insured retention limits. The captive insurancecompany provides insurance reserves for estimated liabilities for product claims incurred but not reported basedon actuarially determined liabilities. The actuarial valuations are based on historical information along withcertain assumptions about future events.
ITEM 7A. QUANTITATIVE AND QUALITATIVE DISCLOSURES ABOUT MARKET RISK
Quantitative and qualitative disclosures about market risk are included in the “Results of Operations,Liquidity and Capital Resources” and “Other Matters” sections of the Company’s Management’s Discussion andAnalysis of Financial Condition in Item 7 of this report.
34

ITEM 8. FINANCIAL STATEMENTS AND SUPPLEMENTARY DATA.
REPORT OF INDEPENDENT REGISTERED PUBLIC ACCOUNTING FIRM ON CONSOLIDATEDFINANCIAL STATEMENTS
The Board of Directors and Shareholders of Stryker Corporation:
We have audited the accompanying consolidated balance sheets of Stryker Corporation and subsidiaries asof December 31, 2009 and 2008, and the related consolidated statements of earnings, shareholders’ equity, andcash flows for each of the three years in the period ended December 31, 2009. Our audits also included thefinancial statement schedule listed in the Index at Item 15(a). These financial statements and schedule are theresponsibility of the Company’s management. Our responsibility is to express an opinion on these financialstatements and schedule based on our audits.
We conducted our audits in accordance with the standards of the Public Company Accounting OversightBoard (United States). Those standards require that we plan and perform the audit to obtain reasonable assuranceabout whether the financial statements are free of material misstatement. An audit includes examining, on a testbasis, evidence supporting the amounts and disclosures in the financial statements. An audit also includesassessing the accounting principles used and significant estimates made by management, as well as evaluatingthe overall financial statement presentation. We believe that our audits provide a reasonable basis for ouropinion.
In our opinion, the financial statements referred to above present fairly, in all material respects, theconsolidated financial position of Stryker Corporation and subsidiaries at December 31, 2009 and 2008, and theconsolidated results of their operations and their cash flows for each of the three years in the period endedDecember 31, 2009, in conformity with U.S. generally accepted accounting principles. Also, in our opinion, therelated financial statement schedule, when considered in relation to the basic financial statements taken as awhole, presents fairly in all material respects the information set forth therein.
As discussed in Note 1 to the consolidated financial statements, in 2009 the Company changed its method ofaccounting for business combinations with the adoption of the guidance originally issued in FASB StatementNo. 141(R), Business Combinations (codified in FASB ASC Topic 805, Business Combinations).
We also have audited, in accordance with the standards of the Public Company Accounting Oversight Board(United States), Stryker Corporation’s internal control over financial reporting as of December 31, 2009, basedon criteria established in Internal Control—Integrated Framework issued by the Committee of SponsoringOrganizations of the Treadway Commission and our report dated February 26, 2010 expressed an unqualifiedopinion thereon.
/s/ ERNST & YOUNG LLP
Grand Rapids, MichiganFebruary 26, 2010
35

Stryker Corporation and Subsidiaries
CONSOLIDATED BALANCE SHEETS(in millions, except per share amounts)
December 31
2009 2008
ASSETSCurrent AssetsCash and cash equivalents . . . . . . . . . . . . . . . . . . . . . . . . . . . . . . . . . . . . . . . . . . . . . . . . . . . . $ 658.7 $ 701.1Marketable securities . . . . . . . . . . . . . . . . . . . . . . . . . . . . . . . . . . . . . . . . . . . . . . . . . . . . . . . 2,296.1 1,494.5Accounts receivable, less allowance of $66.3 ($44.5 in 2008) . . . . . . . . . . . . . . . . . . . . . . . . 1,147.1 1,129.5Inventories . . . . . . . . . . . . . . . . . . . . . . . . . . . . . . . . . . . . . . . . . . . . . . . . . . . . . . . . . . . . . . . . 943.0 952.7Deferred income taxes . . . . . . . . . . . . . . . . . . . . . . . . . . . . . . . . . . . . . . . . . . . . . . . . . . . . . . . 602.2 521.9Prepaid expenses and other current assets . . . . . . . . . . . . . . . . . . . . . . . . . . . . . . . . . . . . . . . 204.1 179.6
Total current assets . . . . . . . . . . . . . . . . . . . . . . . . . . . . . . . . . . . . . . . . . . . . . . . . . . . . . . . . . 5,851.2 4,979.3
Property, Plant and EquipmentLand, buildings and improvements . . . . . . . . . . . . . . . . . . . . . . . . . . . . . . . . . . . . . . . . . . . . . 693.4 686.7Machinery and equipment . . . . . . . . . . . . . . . . . . . . . . . . . . . . . . . . . . . . . . . . . . . . . . . . . . . . 1,270.3 1,184.3
Total Property, Plant and Equipment . . . . . . . . . . . . . . . . . . . . . . . . . . . . . . . . . . . . . . . . . . . 1,963.7 1,871.0Less allowance for depreciation . . . . . . . . . . . . . . . . . . . . . . . . . . . . . . . . . . . . . . . . . . . . . . . 1,016.1 907.2
Net Property, Plant and Equipment . . . . . . . . . . . . . . . . . . . . . . . . . . . . . . . . . . . . . . . . . . . . 947.6 963.8
Other AssetsGoodwill . . . . . . . . . . . . . . . . . . . . . . . . . . . . . . . . . . . . . . . . . . . . . . . . . . . . . . . . . . . . . . . . . 956.8 567.5Other intangibles, less accumulated amortization of $421.0 ($383.8 in 2008) . . . . . . . . . . . 634.7 368.0Loaner instrumentation, less accumulated amortization of $771.3 ($708.3 in 2008) . . . . . . . 285.4 275.2Deferred income taxes . . . . . . . . . . . . . . . . . . . . . . . . . . . . . . . . . . . . . . . . . . . . . . . . . . . . . . . 258.9 212.2Other . . . . . . . . . . . . . . . . . . . . . . . . . . . . . . . . . . . . . . . . . . . . . . . . . . . . . . . . . . . . . . . . . . . . 136.7 237.3
Total assets . . . . . . . . . . . . . . . . . . . . . . . . . . . . . . . . . . . . . . . . . . . . . . . . . . . . . . . . . . . . . . . $9,071.3 $7,603.3
LIABILITIES AND SHAREHOLDERS’ EQUITYCurrent LiabilitiesAccounts payable . . . . . . . . . . . . . . . . . . . . . . . . . . . . . . . . . . . . . . . . . . . . . . . . . . . . . . . . . . $ 200.2 $ 274.3Accrued compensation . . . . . . . . . . . . . . . . . . . . . . . . . . . . . . . . . . . . . . . . . . . . . . . . . . . . . . 354.1 336.8Income taxes . . . . . . . . . . . . . . . . . . . . . . . . . . . . . . . . . . . . . . . . . . . . . . . . . . . . . . . . . . . . . . 134.7 30.0Dividend payable . . . . . . . . . . . . . . . . . . . . . . . . . . . . . . . . . . . . . . . . . . . . . . . . . . . . . . . . . . . 59.7 158.6Accrued expenses and other liabilities . . . . . . . . . . . . . . . . . . . . . . . . . . . . . . . . . . . . . . . . . . 674.3 641.9Current maturities of long-term debt . . . . . . . . . . . . . . . . . . . . . . . . . . . . . . . . . . . . . . . . . . . . 18.0 20.5
Total current liabilities . . . . . . . . . . . . . . . . . . . . . . . . . . . . . . . . . . . . . . . . . . . . . . . . . . . . . . 1,441.0 1,462.1
Other Liabilities . . . . . . . . . . . . . . . . . . . . . . . . . . . . . . . . . . . . . . . . . . . . . . . . . . . . . . . . . . . 1,035.2 734.5
Shareholders’ EquityCommon stock, $0.10 par value:
Authorized—1,000.0 shares, Outstanding -397.9 shares (396.4 in 2008) . . . . . . . . . . . 39.8 39.6Additional paid-in capital . . . . . . . . . . . . . . . . . . . . . . . . . . . . . . . . . . . . . . . . . . . . . . . . . . . . 899.9 812.8Retained earnings . . . . . . . . . . . . . . . . . . . . . . . . . . . . . . . . . . . . . . . . . . . . . . . . . . . . . . . . . . 5,397.4 4,389.5Accumulated other comprehensive gain . . . . . . . . . . . . . . . . . . . . . . . . . . . . . . . . . . . . . . . . . 258.0 164.8
Total shareholders’ equity . . . . . . . . . . . . . . . . . . . . . . . . . . . . . . . . . . . . . . . . . . . . . . . . . . . . 6,595.1 5,406.7
Total liabilities & shareholders’ equity . . . . . . . . . . . . . . . . . . . . . . . . . . . . . . . . . . . . . . . . . . $9,071.3 $7,603.3
See accompanying notes to Consolidated Financial Statements.
36

Stryker Corporation and Subsidiaries
CONSOLIDATED STATEMENTS OF EARNINGS(in millions, except per share amounts)
Years Ended December 31
2009 2008 2007
Net sales . . . . . . . . . . . . . . . . . . . . . . . . . . . . . . . . . . . . . . . . . . . . . . . . . . . . . . . . $6,723.1 $6,718.2 $6,000.5Cost of sales . . . . . . . . . . . . . . . . . . . . . . . . . . . . . . . . . . . . . . . . . . . . . . . . . . . . . 2,183.7 2,131.4 1,865.2
Gross profit . . . . . . . . . . . . . . . . . . . . . . . . . . . . . . . . . . . . . . . . . . . . . . . . . . . . . . 4,539.4 4,586.8 4,135.3Research, development and engineering expenses . . . . . . . . . . . . . . . . . . . . . . . . 336.2 367.8 375.3Selling, general and administrative expenses . . . . . . . . . . . . . . . . . . . . . . . . . . . . 2,506.3 2,625.1 2,391.5Intangible asset amortization . . . . . . . . . . . . . . . . . . . . . . . . . . . . . . . . . . . . . . . . . 35.5 40.0 41.4Restructuring charges . . . . . . . . . . . . . . . . . . . . . . . . . . . . . . . . . . . . . . . . . . . . . . 67.0 34.9 —Intangible asset impairment . . . . . . . . . . . . . . . . . . . . . . . . . . . . . . . . . . . . . . . . . — — 19.8
Total operating expenses . . . . . . . . . . . . . . . . . . . . . . . . . . . . . . . . . . . . . . . . . . . . 2,945.0 3,067.8 2,828.0
Operating income . . . . . . . . . . . . . . . . . . . . . . . . . . . . . . . . . . . . . . . . . . . . . . . . . 1,594.4 1,519.0 1,307.3Other income (expense) . . . . . . . . . . . . . . . . . . . . . . . . . . . . . . . . . . . . . . . . . . . . 29.5 61.2 62.8
Earnings from continuing operations before income taxes . . . . . . . . . . . . . . . . . . 1,623.9 1,580.2 1,370.1Income taxes . . . . . . . . . . . . . . . . . . . . . . . . . . . . . . . . . . . . . . . . . . . . . . . . . . . . . 516.5 432.4 383.4
Net earnings from continuing operations . . . . . . . . . . . . . . . . . . . . . . . . . . . . . . . 1,107.4 1,147.8 986.7Net earnings from discontinued operations . . . . . . . . . . . . . . . . . . . . . . . . . . . . . . — — 5.0Net gain on sale of discontinued operations . . . . . . . . . . . . . . . . . . . . . . . . . . . . . — — 25.7
Net earnings . . . . . . . . . . . . . . . . . . . . . . . . . . . . . . . . . . . . . . . . . . . . . . . . . . . . . . $1,107.4 $1,147.8 $1,017.4
Basic net earnings per share of common stock:Net earnings from continuing operations . . . . . . . . . . . . . . . . . . . . . . . . . . . $ 2.79 $ 2.81 $ 2.41Net earnings from discontinued operations . . . . . . . . . . . . . . . . . . . . . . . . . . — — $ 0.01Net gain on sale of discontinued operations . . . . . . . . . . . . . . . . . . . . . . . . . — — $ 0.06Basic net earnings per share of common stock . . . . . . . . . . . . . . . . . . . . . . . $ 2.79 $ 2.81 $ 2.48
Diluted net earnings per share of common stock:Net earnings from continuing operations . . . . . . . . . . . . . . . . . . . . . . . . . . . $ 2.77 $ 2.78 $ 2.37Net earnings from discontinued operations . . . . . . . . . . . . . . . . . . . . . . . . . . — — $ 0.01Net gain on sale of discontinued operations . . . . . . . . . . . . . . . . . . . . . . . . . — — $ 0.06Diluted net earnings per share of common stock . . . . . . . . . . . . . . . . . . . . . $ 2.77 $ 2.78 $ 2.44
See accompanying notes to Consolidated Financial Statements.
37

Stryker Corporation and Subsidiaries
CONSOLIDATED STATEMENTS OF SHAREHOLDERS’ EQUITY(in millions, except per share amounts)
CommonStock
AdditionalPaid-InCapital
RetainedEarnings
AccumulatedOther
ComprehensiveGain (Loss) Total
Balances at January 1, 2007 . . . . . . . . . . . . . . . . . . . . . . . . . . . . . . $40.8 $569.1 $3,490.5 $ 90.6 $ 4,191.0Net earnings for 2007 . . . . . . . . . . . . . . . . . . . . . . . . . . . . . . . . . . . — — 1,017.4 — 1,017.4Unrealized gains on securities, net of $0.8 income tax expense . . . — — — 1.1 1.1Unfunded pension gains, net of $5.5 income tax expense . . . . . . . — — — 16.4 16.4Foreign currency translation adjustments . . . . . . . . . . . . . . . . . . . . — — — 152.7 152.7
Comprehensive earnings for 2007 . . . . . . . . . . . . . . . . . . . . . . . . . 1,187.6Issuance of 3.0 shares of common stock under stock option and
benefit plans, including $43.5 excess income tax benefit . . . . . . 0.3 80.4 — — 80.7Share-based compensation . . . . . . . . . . . . . . . . . . . . . . . . . . . . . . . — 62.4 — — 62.4Cash dividend declared of $0.33 per share of common stock . . . . — — (135.6) — (135.6)Adjustment to adopt new accounting rules for income tax
uncertainties, net of $4.2 income tax benefit . . . . . . . . . . . . . . . — — (7.6) — (7.6)
Balances at December 31, 2007 . . . . . . . . . . . . . . . . . . . . . . . . . . . 41.1 711.9 4,364.7 260.8 5,378.5Net earnings for 2008 . . . . . . . . . . . . . . . . . . . . . . . . . . . . . . . . . . . — — 1,147.8 — 1,147.8Unrealized gains on securities, including $0.7 income tax
benefit . . . . . . . . . . . . . . . . . . . . . . . . . . . . . . . . . . . . . . . . . . . . . — — — 0.8 0.8Unfunded pension losses, net of $8.3 income tax benefit . . . . . . . . — — — (28.2) (28.2)Foreign currency translation adjustments . . . . . . . . . . . . . . . . . . . . — — — (68.6) (68.6)
Comprehensive earnings for 2008 . . . . . . . . . . . . . . . . . . . . . . . . . 1,051.8Issuance of 2.8 shares of common stock under stock option and
benefit plans, including $33.7 excess income tax benefit . . . . . . 0.2 69.3 — — 69.5Share-based compensation . . . . . . . . . . . . . . . . . . . . . . . . . . . . . . . — 65.5 — — 65.5Cash dividend declared of $0.40 per share of common stock . . . . — — (158.6) — (158.6)Repurchase and retirement of 17.4 million shares of common
stock . . . . . . . . . . . . . . . . . . . . . . . . . . . . . . . . . . . . . . . . . . . . . . (1.7) (33.9) (964.4) — (1,000.0)
Balances at December 31, 2008 . . . . . . . . . . . . . . . . . . . . . . . . . . . 39.6 812.8 4,389.5 164.8 5,406.7Net earnings for 2009 . . . . . . . . . . . . . . . . . . . . . . . . . . . . . . . . . . . — — 1,107.4 — 1,107.4Unrealized gains on securities, including $1.4 income tax
expense . . . . . . . . . . . . . . . . . . . . . . . . . . . . . . . . . . . . . . . . . . . . — — — 2.7 2.7Unfunded pension gains, net of $8.2 income tax expense . . . . . . . — — — 16.7 16.7Foreign currency translation adjustments . . . . . . . . . . . . . . . . . . . . — — — 73.8 73.8
Comprehensive earnings for 2009 . . . . . . . . . . . . . . . . . . . . . . . . . 1,200.6Issuance of 1.4 shares of common stock under stock option and
benefit plans, including $6.9 excess income tax benefit . . . . . . . 0.2 24.8 — — 25.0Share-based compensation . . . . . . . . . . . . . . . . . . . . . . . . . . . . . . . — 62.3 — — 62.3Cash dividends declared of $0.25 per share of common stock . . . . — — (99.5) — (99.5)
Balances at December 31, 2009 . . . . . . . . . . . . . . . . . . . . . . . . . . . $39.8 $899.9 $5,397.4 $258.0 $ 6,595.1
See accompanying notes to Consolidated Financial Statements.
38

Stryker Corporation and Subsidiaries
CONSOLIDATED STATEMENTS OF CASH FLOWS(in millions)
Years Ended December 31
2009 2008 2007
Operating ActivitiesNet earnings . . . . . . . . . . . . . . . . . . . . . . . . . . . . . . . . . . . . . . . . . . . . . . . . . . . . . . . . . . . $ 1,107.4 $ 1,147.8 $ 1,017.4
Less: Net earnings from discontinued operations . . . . . . . . . . . . . . . . . . . . . . . . . . — — (5.0)Less: Net gain on sale of discontinued operations . . . . . . . . . . . . . . . . . . . . . . . . . . — — (25.7)
Net earnings from continuing operations . . . . . . . . . . . . . . . . . . . . . . . . . . . . . 1,107.4 1,147.8 986.7Adjustments to reconcile net earnings from continuing operations to net cash provided
by operating activities:Depreciation . . . . . . . . . . . . . . . . . . . . . . . . . . . . . . . . . . . . . . . . . . . . . . . . . . . 165.2 155.4 137.1Amortization . . . . . . . . . . . . . . . . . . . . . . . . . . . . . . . . . . . . . . . . . . . . . . . . . . . 220.1 232.2 229.5Share-based compensation . . . . . . . . . . . . . . . . . . . . . . . . . . . . . . . . . . . . . . . . 62.3 65.5 61.3Income tax benefit from exercise of stock options . . . . . . . . . . . . . . . . . . . . . 12.7 44.6 53.3Excess income tax benefit from exercise of stock options . . . . . . . . . . . . . . . . (6.9) (33.7) (43.5)Restructuring charges . . . . . . . . . . . . . . . . . . . . . . . . . . . . . . . . . . . . . . . . . . . . 67.0 34.9 —Payments of restructuring charges . . . . . . . . . . . . . . . . . . . . . . . . . . . . . . . . . . (47.4) (0.5) —Intangible asset impairment . . . . . . . . . . . . . . . . . . . . . . . . . . . . . . . . . . . . . . . — — 19.8Provision for losses on accounts receivable . . . . . . . . . . . . . . . . . . . . . . . . . . . 27.9 10.4 7.3Deferred income tax credit . . . . . . . . . . . . . . . . . . . . . . . . . . . . . . . . . . . . . . . . (72.7) (17.6) (147.1)Other . . . . . . . . . . . . . . . . . . . . . . . . . . . . . . . . . . . . . . . . . . . . . . . . . . . . . . . . . 10.0 0.2 8.2Changes in operating assets and liabilities, net of effects of acquisitions:
Accounts receivable . . . . . . . . . . . . . . . . . . . . . . . . . . . . . . . . . . . . . . . . . (9.8) (131.2) (133.5)Inventories . . . . . . . . . . . . . . . . . . . . . . . . . . . . . . . . . . . . . . . . . . . . . . . . 33.7 (180.2) (89.9)Loaner instrumentation . . . . . . . . . . . . . . . . . . . . . . . . . . . . . . . . . . . . . . (188.6) (181.8) (184.9)Accounts payable . . . . . . . . . . . . . . . . . . . . . . . . . . . . . . . . . . . . . . . . . . . (80.5) 10.4 11.1Accrued expenses and other liabilities . . . . . . . . . . . . . . . . . . . . . . . . . . . 66.1 54.8 20.4Income taxes . . . . . . . . . . . . . . . . . . . . . . . . . . . . . . . . . . . . . . . . . . . . . . . 192.0 (29.1) 83.5Other . . . . . . . . . . . . . . . . . . . . . . . . . . . . . . . . . . . . . . . . . . . . . . . . . . . . . (97.8) (6.2) 18.9
Net cash used in discontinued operations . . . . . . . . . . . . . . . . . . . . . . . . . . . . — — (9.9)
Net cash provided by operating activities . . . . . . . . . . . . . . . . . . . . . . . . . . . . . . . . . . . . 1,460.7 1,175.9 1,028.3
Investing ActivitiesAcquisitions, net of cash acquired . . . . . . . . . . . . . . . . . . . . . . . . . . . . . . . . . . . . . . . . . . (570.2) (14.2) (54.8)Proceeds from sale of discontinued operations, net of cash divested . . . . . . . . . . . . . . . — — 144.7Purchases of marketable securities . . . . . . . . . . . . . . . . . . . . . . . . . . . . . . . . . . . . . . . . . . (4,602.1) (16,832.3) (14,851.9)Proceeds from sales of marketable securities . . . . . . . . . . . . . . . . . . . . . . . . . . . . . . . . . . 3,973.7 17,303.2 13,772.4Purchases of property, plant and equipment . . . . . . . . . . . . . . . . . . . . . . . . . . . . . . . . . . (131.3) (155.2) (187.7)Proceeds from sales of property, plant and equipment . . . . . . . . . . . . . . . . . . . . . . . . . . 1.5 8.6 0.7Net cash used by discontinued operations . . . . . . . . . . . . . . . . . . . . . . . . . . . . . . . . . . . . — — (1.6)
Net cash provided by (used in) investing activities . . . . . . . . . . . . . . . . . . . . . . . . . . . . . (1,328.4) 310.1 (1,178.2)
Financing ActivitiesProceeds from borrowings . . . . . . . . . . . . . . . . . . . . . . . . . . . . . . . . . . . . . . . . . . . . . . . . 16.9 26.0 103.7Payments on borrowings . . . . . . . . . . . . . . . . . . . . . . . . . . . . . . . . . . . . . . . . . . . . . . . . . (19.6) (19.3) (102.9)Dividends paid . . . . . . . . . . . . . . . . . . . . . . . . . . . . . . . . . . . . . . . . . . . . . . . . . . . . . . . . . (198.4) (135.6) (89.7)Proceeds from exercise of stock options . . . . . . . . . . . . . . . . . . . . . . . . . . . . . . . . . . . . . 6.3 50.1 69.5Excess income tax benefit from exercise of stock options . . . . . . . . . . . . . . . . . . . . . . . . 6.9 33.7 43.5Repurchase and retirement of common stock . . . . . . . . . . . . . . . . . . . . . . . . . . . . . . . . . — (1,000.0) —Other . . . . . . . . . . . . . . . . . . . . . . . . . . . . . . . . . . . . . . . . . . . . . . . . . . . . . . . . . . . . . . . . . (5.4) (1.0) (10.5)
Net cash provided by (used in) financing activities . . . . . . . . . . . . . . . . . . . . . . . . . . . . . (193.3) (1,046.1) 13.6Effect of exchange rate changes on cash and cash equivalents . . . . . . . . . . . . . . . . . . . . 18.6 (29.3) 10.2
Increase (decrease) in cash and cash equivalents . . . . . . . . . . . . . . . . . . . . . . . . . . . . . . . (42.4) 410.6 (126.1)Cash and cash equivalents at beginning of year . . . . . . . . . . . . . . . . . . . . . . . . . . . . . . . . 701.1 290.5 416.6
Cash and cash equivalents at end of year . . . . . . . . . . . . . . . . . . . . . . . . . . . . . . . . . . . . . $ 658.7 $ 701.1 $ 290.5
See accompanying notes to Consolidated Financial Statements.
39

Stryker Corporation and Subsidiaries
NOTES TO CONSOLIDATED FINANCIAL STATEMENTSDecember 31, 2009
NOTE 1SIGNIFICANT ACCOUNTING POLICIES
Business: Stryker Corporation (the Company or Stryker) is one of the world’s leading medical technologycompanies with the most broadly based range of products in orthopaedics and a significant presence in othermedical specialties. Stryker works with respected medical professionals to help people lead more active and moresatisfying lives. The Company’s products include implants used in joint replacement, trauma, and spinalsurgeries; surgical equipment and surgical navigation systems; endoscopic and communications systems; patienthandling and emergency medical equipment as well as other medical device products used in a variety of medicalspecialties.
Principles of Consolidation: The Consolidated Financial Statements include the accounts of the Companyand its subsidiaries after elimination of intercompany accounts and transactions.
Use of Estimates: The preparation of these Consolidated Financial Statements in conformity with U.S.generally accepted accounting principles (GAAP) requires Company management to make estimates andassumptions that affect the amounts reported in the Consolidated Financial Statements and accompanying notes.Actual results could differ from those estimates.
Revenue Recognition: A significant portion of the Company’s Orthopaedic Implants revenue is generatedfrom consigned inventory maintained at hospitals or with field representatives. The Company retains title to allinventory held on consignment at hospitals or with field locations until the Company receives appropriatenotification that the product has been used or implanted at which time revenue is recognized. The Companyrecords revenue from Orthopaedic Implants not held on consignment and MedSurg Equipment product saleswhen title and risk of ownership have been transferred to the customer, which is typically upon shipment to thecustomer. The Company records estimated sales returns, discounts, rebates and other sales incentives as areduction of net sales in the same period revenue is recognized. Estimates of sales returns are recorded foranticipated product returns based on historical sales and returns information. Estimates of sales discounts, rebatesand other sales incentives are recorded based on contractual terms, historical experience and trend analysis.
Shipping and Handling of Products: Amounts billed to customers for shipping and handling of products areincluded in net sales. Costs incurred related to shipping and handling of products are included in cost of sales.
Foreign Currency Translation: The functional currencies for substantially all of the Company’sinternational affiliates are their local currencies. Accordingly, the financial statements of these internationalaffiliates are translated into U.S. dollars using current exchange rates for balance sheets and average exchangerates for statements of earnings and cash flows. Unrealized translation adjustments are included in accumulatedother comprehensive gain (loss) in shareholders’ equity. Transaction gains and losses, such as those resultingfrom the settlement of nonfunctional currency receivables or payables, are included in net earnings.
Financial Instruments: The Company’s financial instruments consist of cash, cash equivalents, marketablesecurities, accounts receivable, other investments, accounts payable, debt and foreign currency exchangecontracts. The Company’s estimates of fair value for financial instruments approximate their carrying amounts asof December 31, 2009 and 2008.
The Company adopted the provisions of the Financial Instruments and the Fair Value Measurements andDisclosures Topics of the Financial Accounting Standard Board (FASB) Accounting Standards Codification(Codification) in 2008. The required disclosures regarding the fair value of financial instruments are included inNote 2 to the Consolidated Financial Statements.
40

Stryker Corporation and Subsidiaries
NOTES TO CONSOLIDATED FINANCIAL STATEMENTS—(Continued)December 31, 2009
Cash equivalents are highly liquid investments with a maturity of three months or less when purchased.Marketable securities consist of marketable debt securities and certificates of deposit and mutual funds. Mutualfunds are acquired to offset changes in certain liabilities related to deferred compensation arrangements and areexpected to be used to settle these liabilities. Pursuant to the Company’s investment policy, all individualmarketable security investments must have a minimum credit quality of single A (per Standard & Poor’s orFitch) or A2 (per Moody’s Corporation) at the time of acquisition, while the overall portfolio of marketablesecurities must maintain a minimum average credit quality of double A (per Standard & Poor’s or Fitch) or Aa(per Moody’s Corporation). In the event of a rating downgrade below the minimum credit quality subsequent topurchase, the marketable security investment is evaluated to determine the appropriate action to take to minimizethe overall risk to the Company’s marketable security investment portfolio. As of December 31, 2009,approximately 1% of the Company’s investments in marketable securities had a credit quality rating of less thansingle A (per Standard & Poor’s or Fitch) and A2 (per Moody’s Corporation).
The Company follows the provisions of the Investments-Debt and Equity Securities Topic of the FASBCodification in accounting for its marketable securities, which are classified as available-for-sale and tradingsecurities. This topic requires the Company to recognize all marketable securities on the Consolidated BalanceSheets at fair value. The Company’s marketable securities are stated at fair value pursuant to the requirements ofthe Fair Value Measurements and Disclosures Topic of the FASB Codification. Adjustments to the fair value ofmarketable securities that are classified as available-for-sale are recorded as increases or decreases, net of incometaxes, within accumulated other comprehensive gain (loss) in shareholders’ equity and adjustments to the fairvalue of marketable securities that are classified as trading are recorded in earnings. The amortized cost ofmarketable debt securities is adjusted for amortization of premiums and discounts to maturity computed underthe effective interest method. Such amortization is included in other income (expense) along with interest andrealized gains and losses. The cost of securities sold is determined by the specific identification method.
The Company reviews declines in the fair value of its investments classified as available-for-sale forimpairment in accordance with the provisions of the Investments-Debt and Equity Securities Topic of the FASBCodification in order to determine whether the decline in fair value is an other-than-temporary impairment.Other-than-temporary impairments of available-for-sale marketable securities are recorded in earnings.
The Company follows the provisions of the Derivatives and Hedging Topic of the FASB Codification,which requires the Company to recognize all derivatives on the Consolidated Balance Sheets at fair value. TheCompany enters into forward currency exchange contracts to mitigate the impact of currency fluctuations ontransactions denominated in nonfunctional currencies, thereby limiting risk to the Company that would otherwiseresult from changes in exchange rates. These nonfunctional currency exposures principally relate tointercompany receivables and payables arising from intercompany purchases of manufactured products. Theperiods of the forward currency exchange contracts correspond to the periods of the exposed transactions, withrealized gains and losses included in the measurement and recording of transactions denominated in thenonfunctional currencies. All forward currency exchange contracts are recorded at their fair value each period,with resulting gains (losses) included in other income (expense) in the Consolidated Statements of Earnings.
Accounts Receivable: Accounts receivable consists of trade and other miscellaneous receivables. TheCompany maintains an allowance for doubtful accounts for estimated losses in the collection of accountsreceivable. The Company makes estimates regarding the future ability of its customers to make requiredpayments based on historical credit experience and expected future trends. Accounts receivable are written offwhen all reasonable collection efforts are exhausted.
41
Stryker Corporation and Subsidiaries
NOTES TO CONSOLIDATED FINANCIAL STATEMENTS—(Continued)December 31, 2009
Accounts Receivable Securitization: The Company did not extend its $100 million accounts receivablesecuritization facility agreement upon its expiration on April 24, 2009. There were no amounts of undividedpercentage ownership interests in accounts receivable sold by Stryker Funding Corporation, a wholly ownedspecial-purpose subsidiary of the Company, under the facility as of December 31, 2008 or at any time thereafter.
Inventories: Inventories are stated at the lower of cost or market. Cost for approximately 84% of inventoriesis determined using the first-in, first-out (FIFO) cost method. Cost for certain domestic inventories is determinedusing the last-in, first-out (LIFO) cost method. The FIFO cost for all inventories approximates replacement cost.
The Company maintains reserves for excess and obsolete inventory resulting from the potential inability tosell its products at prices in excess of current carrying costs. The markets in which the Company operates arehighly competitive, and new products and surgical procedures are introduced on an ongoing basis. Suchmarketplace changes may cause some of the Company’s products to become obsolete. The Company makesestimates regarding the future recoverability of the costs of these products and records a provision for excess andobsolete inventories based on historical experience, expiration of sterilization dates and expected future trends.
Property, Plant and Equipment: Property, plant and equipment is stated at cost. Depreciation is computedby either the straight-line or declining-balance method over the estimated useful lives of 3 to 30 years forbuildings and improvements and 3 to 10 years for machinery and equipment.
Goodwill and Other Intangible Assets: Goodwill represents the excess of purchase price over fair value oftangible net assets of acquired businesses after amounts allocated to other intangible assets. Other intangibleassets include developed technology, which is amortized on a straight-line basis over 20 years and customerrelationships (which reflect expected continued customer patronage), trademarks and patents, which areamortized on a straight-line basis over 4 to 40 years (weighted-average life of 15 years for other intangibleassets).
Goodwill and Long-Lived Assets Impairment Tests: The Intangibles-Goodwill and Other Topic of the FASBCodification requires companies to test goodwill for possible impairment on an annual basis. The Companyperforms the annual impairment test in the fourth quarter of each year using a discounted cash flow analysis thatrequires certain assumptions and estimates be made regarding market conditions and the Company’s futureprofitability. The Company also performs impairment tests of goodwill and other intangible and long-lived assetsduring interim periods upon the occurrence of certain events or changes in circumstance as defined in theProperty, Plant, and Equipment and Presentation of Financial Statements Topics of the FASB Codification.
Loaner Instrumentation: Loaner instrumentation represents the net book value of loaner instruments forsurgical implants provided to customers by the Company. Loaner instrumentation is amortized on a straight-linebasis over a 3-year period. Amortization expense for loaner instrumentation is included in selling, general andadministrative expenses.
42

Stryker Corporation and Subsidiaries
NOTES TO CONSOLIDATED FINANCIAL STATEMENTS—(Continued)December 31, 2009
Stock Options: At December 31, 2009, the Company had key employee and director stock option plans,which are described more fully in Note 10 to the Consolidated Financial Statements. Pursuant to the provisionsof the Compensation-Stock Compensation Topic of the FASB Codification, the Company measures the cost ofemployee stock options based on the grant-date fair value and recognizes that cost over the period during which arecipient is required to provide services in exchange for the options, typically the vesting period. The weighted-average fair value per share of options granted during 2009, 2008 and 2007, estimated on the date of grant usingthe Black-Scholes option pricing model, was $13.09, $19.87 and $21.90, respectively. The fair value of optionsgranted was estimated using the following weighted-average assumptions:
2009 2008 2007
Risk-free interest rate . . . . . . . . . . . . . . . . . . . . . . . . . . . 2.5% 3.2% 4.8%Expected dividend yield . . . . . . . . . . . . . . . . . . . . . . . . . 0.7% 0.5% 0.5%Expected stock price volatility . . . . . . . . . . . . . . . . . . . . 27.7% 22.7% 24.2%Expected option life . . . . . . . . . . . . . . . . . . . . . . . . . . . . 6.8 years 6.7 years 6.7 years
The risk-free interest rate for periods within the expected life of options granted is based on the U.S.Treasury yield curve in effect at the time of grant. Expected stock price volatility is based on historical volatilityof the Company’s stock. The expected option life, representing the period of time that options granted areexpected to be outstanding, is based on historical option exercise and employee termination data. The Companyrecognizes the cost of stock options using the straight-line method over their vesting periods.
Income Taxes: The Company accounts for income taxes using the liability method pursuant to the provisionsof the Income Taxes Topic of the FASB Codification. Under this method, deferred income tax assets andliabilities are determined based on differences between financial reporting and income tax bases of assets andliabilities and are measured using the enacted income tax rates in effect for the years in which the differences areexpected to reverse. Deferred income tax credit represents the change in net deferred income tax assets andliabilities during the year. Interest expense and penalties incurred associated with unresolved income taxpositions are included in other income (expense) pursuant to the provisions of the Income Taxes Topic of theFASB Codification.
The Company operates in multiple income tax jurisdictions both inside and outside the United States. Incometax authorities in these jurisdictions regularly perform audits of the Company’s income tax filings. Accordingly,management must determine the appropriate allocation of income to each of these jurisdictions based on currentinterpretations of complex income tax regulations. Income tax audits associated with the allocation of this incomeand other complex issues, including inventory transfer pricing and cost sharing and product royalty arrangements,may require an extended period of time to resolve and may result in significant income tax adjustments if changes tothe income allocation are required between jurisdictions with different income tax rates.
Legal and Other Contingencies: The Company is involved in various proceedings, legal actions and claimsarising in the normal course of business, including proceedings related to product, labor and intellectual property,and other matters that are more fully described in Note 16 to the Consolidated Financial Statements. Theoutcomes of these matters will generally not be known for prolonged periods of time. In certain of the legalproceedings, the claimants seek damages, as well as other compensatory relief, which could result in the paymentof significant claims and settlements. In legal matters for which management has sufficient information toreasonably estimate the Company’s future obligations, a liability representing management’s best estimate of theprobable cost, or the minimum of the range of probable losses when a best estimate within the range is notknown, for the resolution of these legal matters is recorded. The estimates are based on consultation with legalcounsel, previous settlement experience and settlement strategies.
43

Stryker Corporation and Subsidiaries
NOTES TO CONSOLIDATED FINANCIAL STATEMENTS—(Continued)December 31, 2009
Accumulated Other Comprehensive Gain (Loss): The components of accumulated other comprehensive gain(loss) are as follows (in millions):
UnrealizedGains
on Securities
UnfundedPension
Gains (Losses)
ForeignCurrency
TranslationAdjustments
AccumulatedOther
ComprehensiveGain (Loss)
Balances at January 1, 2008 . . . . . . . . . . . . . . . . . . . . . . $0.1 $(11.6) $272.3 $260.8Other comprehensive gain (loss) for 2008 . . . . . . . . . . . 0.8 (28.2) (68.6) (96.0)
Balances at December 31, 2008 . . . . . . . . . . . . . . . . . . . 0.9 (39.8) 203.7 164.8Other comprehensive gain for 2009 . . . . . . . . . . . . . . . . 2.7 16.7 73.8 93.2
Balances at December 31, 2009 . . . . . . . . . . . . . . . . . . . $3.6 $(23.1) $277.5 $258.0
Recently Adopted Accounting Standards: In 2009 the Company adopted the provisions of the FASBStatement No. 168, The FASB Accounting Standards Codification and the Hierarchy of Generally AcceptedAccounting Principles—a replacement of FASB Statement No. 162. This Statement establishes the FASBCodification as the source of authoritative U.S. GAAP, together with rules and interpretive releases of the U.S.Securities and Exchange Commission (U.S. SEC), under authority of federal securities laws. All existingaccounting standards are superseded as described in this statement. All other accounting literature not included inthe FASB Codification is nonauthoritative.
In 2009 the Company adopted the provisions of the Business Combinations Topic of the FASB Codification.This topic significantly changes the principles and requirements for how an acquisition is recognized andmeasured in a company’s financial statements including the identifiable assets acquired and the liabilitiesassumed. This topic also provides guidance for recognizing and measuring goodwill acquired in a businesscombination and required disclosures to enable users of the financial statements to evaluate the nature andfinancial effects of the business combination. The additional disclosure requirements regarding BusinessCombinations Topic of the FASB Codification are included in Note 5 to the Consolidated Financial Statements.
In 2009 the Company adopted the provisions of the Derivatives and Hedging Topic of the FASBCodification. This topic requires enhanced disclosures about derivative instruments and hedging activities toenable investors to better understand a company’s use of derivative instruments and their effect on a company’sfinancial position, financial performance, and cash flows. The enhanced disclosures regarding derivativeinstruments and hedging activities are included in Note 3 to the Consolidated Financial Statements.
In 2009 the Company adopted FASB’s guidance on Determining Fair Value When the Volume and Level ofActivity for the Asset or Liability Have Significantly Decreased and Identifying Transactions that are NotOrderly (included in the Fair Value Measurement and Disclosures Topic of the FASB Codification) andRecognition and Presentation of Other-Than-Temporary Impairments (included in the Investment—Debt andEquity Securities Topic of the FASB Codification). This new guidance provides additional application rules andenhanced disclosures about fair value measurements and impairments of securities and clarifies the objective andmethod of fair value measurement even when there has been a significant decrease in market activity for the assetbeing measured. In addition, this guidance establishes a new model for measuring other-than-temporaryimpairments for debt securities, including establishing criteria for when to recognize a write-down throughearnings. The required disclosures regarding the fair value of financial instruments are included in Note 2 to theConsolidated Financial Statements.
44

Stryker Corporation and Subsidiaries
NOTES TO CONSOLIDATED FINANCIAL STATEMENTS—(Continued)December 31, 2009
In 2009 the Company adopted the FASB’s guidance on Employers’ Disclosures about PostretirementBenefit Plant Assets (included in the Compensation-Retirements Benefits Topic of the FASB Codification). Thisguidance requires enhanced employer’s disclosures about plan assets of a defined benefit pension or otherpostretirement plan. The required disclosures about plan assets are included in Note 12 to the ConsolidatedFinancial Statements.
In 2009 the Company adopted the provisions of the Subsequent Events Topic, as amended, of the FASBCodification. This topic establishes general standards of accounting for and disclosure of events that occur afterthe balance sheet date but before the date that the financial statements are issued or are available to be issued.The required disclosures are included in Note 17 to the Consolidated Financial Statements.
Recently Issued Accounting Standards: In 2009 the FASB issued the Improvement to Financial Reporting byEnterprises Involved with Variable Interest Entities Topic of the FASB Codification. The topic requires aqualitative approach to identifying a controlling financial interest in a variable interest entity (VIE), and requiresongoing assessment of whether an entity is a VIE and whether an interest in a VIE makes the holder the primarybeneficiary of the VIE. This topic is effective for the Company beginning on January 1, 2010. The Companydoes not expect the adoption of the topic to have a material impact on its Consolidated Financial Statements.
In 2010 the FASB issued an update to the Fair Value Measurements and Disclosures Topic “ImprovingDisclosures About Fair Value Measurements” of the FASB Codification that requires reporting entities to makenew disclosures about recurring or nonrecurring fair-value measurements including significant transfers into andout of Level 1 and Level 2 fair-value measurements, and information on purchases, sales, issuances, andsettlements on a gross basis in the reconciliation of Level 3 fair-value measurements. The update to the FairValue Measurements and Disclosures Topic “Improving Disclosures About Fair Value Measurements” of theFASB Codification is effective for annual reporting periods beginning after December 15, 2009, except for Level3 reconciliation disclosures, which are effective for annual periods beginning after December 15, 2010. TheCompany does not expect the adoption of the update to have a material impact on its Consolidated FinancialStatements.
Reclassifications: Certain prior year amounts have been reclassified to conform with the presentation usedin 2009. In 2009 the Company disclosed payments of restructuring charges separately in its ConsolidatedStatements of Cash Flows.
NOTE 2FINANCIAL INSTRUMENTS
The Company’s financial instruments consist of cash, cash equivalents, marketable securities, accountsreceivable, other investments, accounts payable, debt and foreign currency exchange contracts. The Company’sestimates of fair value for financial instruments approximate their carrying amounts as of December 31, 2009.
45

Stryker Corporation and Subsidiaries
NOTES TO CONSOLIDATED FINANCIAL STATEMENTS—(Continued)December 31, 2009
Pursuant to the requirements of the Fair Value Measurements and Disclosures Topic of the FASBCodification, the Company’s financial assets and liabilities measured at fair value on a recurring basis areclassified and disclosed in one of the following three categories:
Level 1: Financial instruments with unadjusted, quoted prices listed on active market exchanges.
Level 2: Financial instruments lacking unadjusted, quoted prices from active market exchanges,including over-the-counter traded financial instruments. The prices for the financialinstruments are determined using prices for recently traded financial instruments withsimilar underlying terms as well as directly or indirectly observable inputs, such as interestrates and yield curves that are observable at commonly quoted intervals.
Level 3: Financial instruments that are not actively traded on a market exchange. This categoryincludes situations where there is little, if any, market activity for the financialinstrument. The prices are determined using significant unobservable inputs or valuationtechniques.
The following describes the methods the Company uses to estimate the fair value of the Company’sfinancial assets and liabilities:
Cash and cash equivalents:
The Company considers the carrying values of these financial instruments to approximate fair value forthese financial instruments because of the short period of time between origination of the instruments and theirexpected realization.
Available-for-sale marketable securities:
The Company’s Level 2 available-for-sale marketable securities primarily include U.S. government andagency securities, foreign government debt securities, asset-backed debt securities, commercial paper, corporatedebt securities, and certificates of deposit. The Company’s Level 2 available-for-sale marketable securitiesvalues are determined using prices for recently traded financial instruments with similar underlying terms as wellas directly or indirectly observable inputs, such as interest rates and yield curves that are observable at commonlyquoted intervals. The Company’s Level 3 available-for-sale marketable securities include corporate debtsecurities. The Company’s Level 3 available-for-sale marketable securities valuations are based on the incomeapproach, specifically discounted cash flow analyses that utilize significant inputs based on the Company’sestimates and assumptions. Using this approach, estimates for timing and amount of cash flows and expectedholding periods of the securities were used and the expected future cash flows were calculated over the expectedlife of each security and were discounted to a single present value using an estimated market required rate ofreturn.
Trading marketable securities and Auction-Rate Securities (ARS) Rights:
The Company’s Level 1 trading marketable securities consist of mutual funds and are valued using a marketapproach based on quoted prices for the specific mutual fund from transactions in active exchange markets.
The Company’s Level 3 trading marketable securities include investments in auction-rate securities (ARS),the majority of which are triple A rated (per Standard & Poor’s) and collateralized by student loans guaranteedby the U.S. Department of Education. The interest rates of these ARS investments are reset through an auctionprocess, most commonly at intervals of 7, 28 and 35 days.
46

Stryker Corporation and Subsidiaries
NOTES TO CONSOLIDATED FINANCIAL STATEMENTS—(Continued)December 31, 2009
Beginning in February 2008, liquidity issues in the global credit markets resulted in the failure of auctionsfor all of the ARS investments held by the Company, as the amount of securities submitted for sale in thoseauctions exceeded the amount of purchase bids. As of December 31, 2009, the Company held $156.3 million, atpar value, of ARS investments. In 2008 the Company entered into an ARS Rights agreement (Rights) with UBSFinancial Services Inc. (UBS), one of its investment providers, whereby the Company received the right to sellits ARS at par value to UBS at any time during the period from June 30, 2010 through July 2, 2012. These ARSRights are nontransferable securities registered with the U.S. SEC. The Company has elected to apply the fairvalue option to its ARS Rights pursuant to the provisions of the Fair Value Option for Financial Assets andFinancial Liabilities Topic of the FASB Codification. As a result of this election, in the twelve-month periodended December 31, 2009, the Company recorded a loss of $11.0 million in other income (expense) to recognizethe change in fair value estimate of its ARS Rights. This loss was offset by a corresponding gain in the fair valueestimate of the related trading marketable securities. In 2008 the Company recorded a gain of $28.0 million inother income (expense), and a corresponding non-current asset within the Consolidated Balance Sheet.Simultaneously, the Company transferred the ARS investments, at their fair value of $138.8 million, fromavailable-for-sale to trading marketable securities. As a result of this transfer, the Company recognized a loss of$28.0 million in other income (expense), reflecting a reversal of the related temporary valuation allowance thatwas previously recorded within accumulated other comprehensive gain (loss) in shareholders’ equity.
As a result of the illiquidity in the market for ARS investments, the Company has estimated the fair value ofits ARS and ARS Rights using a Level 3 valuation methodology. The Company’s Level 3 valuations of its ARSand ARS Rights are based on the income approach, specifically discounted cash flow analyses that utilizesignificant inputs based on the Company’s estimates and assumptions. The discounted cash flow analysesincluded the following assumptions at December 31, 2009: current coupon rates, expected maturity and currentdiscount rates. The current coupon rates are based on forecasted interest rates, specifically the 3 month U.S.Treasury bill plus the applicable coupon spread, generally 120 basis points. The expected maturity assumption isbased on the weighted average remaining term for the underlying student loans financed by the trusts that issuedthe ARS. Based on available information, the expected maturity reflects a 17 year assumption. The currentdiscount rates reflect a base rate, a credit spread and an illiquidity premium. The base rate corresponds to the3month Libor, which is also the base rate that matches the credit spread. The credit spread is consistent withtriple A rated investments collateralized by student loans that are guaranteed by the U.S. Government under theFederal Family Education Loan Program. The illiquidity premium estimate is a proxy for additional returnrequired in holding illiquid assets. The Company’s valuation was supported by a broker pricing valuation thatincorporates transaction details, such as contractual terms, maturity, timing and anticipated amounts of futurecash flows, as well as assumptions about liquidity and credit valuation adjustments by marketplace participants atDecember 31, 2009. These adjustments are subject to future changes as the underlying market conditions andmarketplace sources change.
Foreign currency exchange contracts:
The Company values foreign currency exchange contracts using a market approach based on foreigncurrency exchange rates obtained from active markets. The estimated fair value of forward currency exchangecontracts represents the measurement of the contracts at month-end spot rates as adjusted by current forwardpoints. At December 31, 2009, the fair value carrying amount of the Company’s forward currency exchangecontracts assets and liabilities were $8.3 million and $6.2 million, respectively.
47
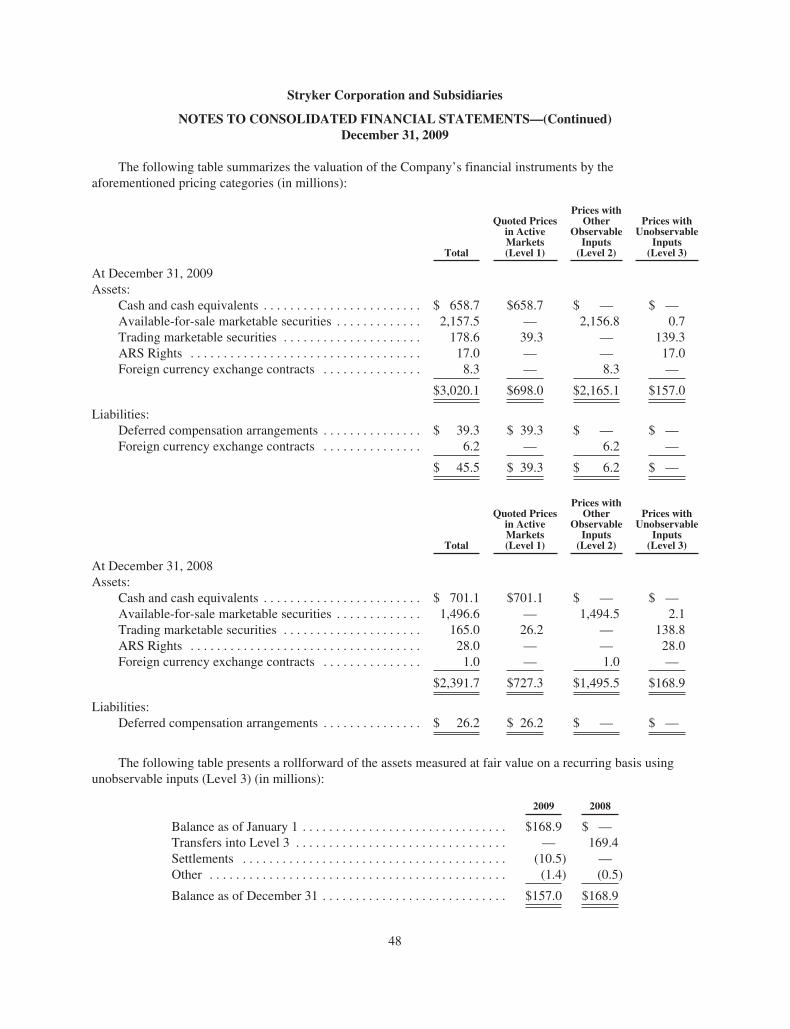
Stryker Corporation and Subsidiaries
NOTES TO CONSOLIDATED FINANCIAL STATEMENTS—(Continued)December 31, 2009
The following table summarizes the valuation of the Company’s financial instruments by theaforementioned pricing categories (in millions):
Total
Quoted Pricesin ActiveMarkets(Level 1)
Prices withOther
ObservableInputs
(Level 2)
Prices withUnobservable
Inputs(Level 3)
At December 31, 2009Assets:
Cash and cash equivalents . . . . . . . . . . . . . . . . . . . . . . . . $ 658.7 $658.7 $ — $ —Available-for-sale marketable securities . . . . . . . . . . . . . 2,157.5 — 2,156.8 0.7Trading marketable securities . . . . . . . . . . . . . . . . . . . . . 178.6 39.3 — 139.3ARS Rights . . . . . . . . . . . . . . . . . . . . . . . . . . . . . . . . . . . 17.0 — — 17.0Foreign currency exchange contracts . . . . . . . . . . . . . . . 8.3 — 8.3 —
$3,020.1 $698.0 $2,165.1 $157.0
Liabilities:Deferred compensation arrangements . . . . . . . . . . . . . . . $ 39.3 $ 39.3 $ — $ —Foreign currency exchange contracts . . . . . . . . . . . . . . . 6.2 — 6.2 —
$ 45.5 $ 39.3 $ 6.2 $ —
Total
Quoted Pricesin ActiveMarkets(Level 1)
Prices withOther
ObservableInputs
(Level 2)
Prices withUnobservable
Inputs(Level 3)
At December 31, 2008Assets:
Cash and cash equivalents . . . . . . . . . . . . . . . . . . . . . . . . $ 701.1 $701.1 $ — $ —Available-for-sale marketable securities . . . . . . . . . . . . . 1,496.6 — 1,494.5 2.1Trading marketable securities . . . . . . . . . . . . . . . . . . . . . 165.0 26.2 — 138.8ARS Rights . . . . . . . . . . . . . . . . . . . . . . . . . . . . . . . . . . . 28.0 — — 28.0Foreign currency exchange contracts . . . . . . . . . . . . . . . 1.0 — 1.0 —
$2,391.7 $727.3 $1,495.5 $168.9
Liabilities:Deferred compensation arrangements . . . . . . . . . . . . . . . $ 26.2 $ 26.2 $ — $ —
The following table presents a rollforward of the assets measured at fair value on a recurring basis usingunobservable inputs (Level 3) (in millions):
2009 2008
Balance as of January 1 . . . . . . . . . . . . . . . . . . . . . . . . . . . . . . . $168.9 $ —Transfers into Level 3 . . . . . . . . . . . . . . . . . . . . . . . . . . . . . . . . — 169.4Settlements . . . . . . . . . . . . . . . . . . . . . . . . . . . . . . . . . . . . . . . . (10.5) —Other . . . . . . . . . . . . . . . . . . . . . . . . . . . . . . . . . . . . . . . . . . . . . (1.4) (0.5)
Balance as of December 31 . . . . . . . . . . . . . . . . . . . . . . . . . . . . $157.0 $168.9
48

Stryker Corporation and Subsidiaries
NOTES TO CONSOLIDATED FINANCIAL STATEMENTS—(Continued)December 31, 2009
The following is a summary of the Company’s marketable securities (in millions):
AmortizedCost
GrossUnrealized
Gains
GrossUnrealized
(Losses)EstimatedFair Value
At December 31, 2009Available-for-sale marketable securities:
Corporate and asset backed debt securities . . . . . . . . . . . . . . . $1,043.6 $5.2 $ (1.0) $1,047.8Foreign government debt securities . . . . . . . . . . . . . . . . . . . . . 742.2 0.9 (1.0) 742.1U.S. agency debt securities . . . . . . . . . . . . . . . . . . . . . . . . . . . 165.9 0.5 (0.1) 166.3Certificates of deposit . . . . . . . . . . . . . . . . . . . . . . . . . . . . . . . 92.0 0.1 — 92.1Other . . . . . . . . . . . . . . . . . . . . . . . . . . . . . . . . . . . . . . . . . . . . . 109.1 0.1 — 109.2
Total available-for-sale marketable securities . . . . . . . . . . . . . $2,152.8 $6.8 ($ 2.1) 2,157.5
Trading marketable securities:Municipal debt securities (ARS) . . . . . . . . . . . . . . . . . . . . . . . 139.3Mutual funds . . . . . . . . . . . . . . . . . . . . . . . . . . . . . . . . . . . . . . 39.3
Total trading marketable securities . . . . . . . . . . . . . . . . . . . . . 178.6
Total marketable securities . . . . . . . . . . . . . . . . . . . . . . . . . . . . . . . $2,336.1
Reported as:Current assets-Marketable securities . . . . . . . . . . . . . . . . . . . . $2,296.1Noncurrent assets-Other . . . . . . . . . . . . . . . . . . . . . . . . . . . . . . 40.0
$2,336.1
AmortizedCost
GrossUnrealized
Gains
GrossUnrealized
(Losses)EstimatedFair Value
At December 31, 2008Available-for-sale marketable securities:
Corporate and asset backed debt securities . . . . . . . . . . . . . . . $ 918.4 $3.4 $ (6.9) $ 914.9Foreign government debt securities . . . . . . . . . . . . . . . . . . . . . 226.5 2.5 (0.1) 228.9U.S. agency debt securities . . . . . . . . . . . . . . . . . . . . . . . . . . . 146.2 1.1 — 147.3Certificates of deposit . . . . . . . . . . . . . . . . . . . . . . . . . . . . . . . 135.9 0.3 (0.1) 136.1Other . . . . . . . . . . . . . . . . . . . . . . . . . . . . . . . . . . . . . . . . . . . . . 69.0 0.4 — 69.4
Total available-for-sale marketable securities . . . . . . . . . . . . . $1,496.0 $7.7 ($ 7.1) 1,496.6
Trading marketable securities:Municipal debt securities (ARS) . . . . . . . . . . . . . . . . . . . . . . . 138.8Mutual funds . . . . . . . . . . . . . . . . . . . . . . . . . . . . . . . . . . . . . . 26.2
Total trading marketable securities . . . . . . . . . . . . . . . . . . . . . 165.0
Total marketable securities . . . . . . . . . . . . . . . . . . . . . . . . . . . . . . . $1,661.6
Reported as:Current assets-Marketable securities . . . . . . . . . . . . . . . . . . . . $1,494.5Noncurrent assets-Other . . . . . . . . . . . . . . . . . . . . . . . . . . . . . . 167.1
$1,661.6
49

Stryker Corporation and Subsidiaries
NOTES TO CONSOLIDATED FINANCIAL STATEMENTS—(Continued)December 31, 2009
The cost and estimated fair value of available-for-sale marketable securities at December 31, 2009, bycontractual maturity, are as follows (in millions):
CostEstimatedFair Value
Due in one year or less . . . . . . . . . . . . . . . . . . . . . . . . . . . . $ 589.6 $ 589.7Due after one year through three years . . . . . . . . . . . . . . . . 1,487.0 1,491.3Due after three years . . . . . . . . . . . . . . . . . . . . . . . . . . . . . . 76.2 76.5
$2,152.8 $2,157.5
The gross unrealized losses and fair value of the Company’s investments with unrealized losses that are notdeemed to be other-than-temporarily impaired, aggregated by investment category and length of time that theindividual securities have been in a continuous unrealized loss position, at December 31, 2009 are as follows (inmillions):
Less Than 12 months 12 months or Greater
Number ofInvestments
FairValue
UnrealizedLosses
Number ofInvestments
FairValue
UnrealizedLosses
Available-for-sale marketable securities:Corporate and asset backed debt
securities . . . . . . . . . . . . . . . . . . . . . . . . 102 $380.8 $1.0 — $— $—Foreign government debt securities . . . . . 34 380.2 1.0 — — —U.S. agency debt securities . . . . . . . . . . . . 27 54.3 0.1 — — —
Total . . . . . . . . . . . . . . . . . . . . . . . . . . . . . . . . . . 163 $815.3 $2.1 — $— $—
The unrealized losses on the Company’s investments in corporate and asset backed and U.S. agency debtsecurities were primarily caused by increases in interest yields as a result of continued challenging conditions inthe global credit markets. While many of these investments have been downgraded by rating agencies since theirinitial purchase, less than 1% of the Company’s investments in corporate and asset-backed debt securities had acredit quality rating of less than single A (per Standard & Poor’s or Fitch). Because the Company does not intendto sell the investments and it is not more likely than not that the Company will be required to sell the investmentsbefore recovery of their amortized cost basis, which may be maturity, the Company does not consider thoseinvestments to be other-than-temporarily impaired at December 31, 2009.
The unrealized losses on the Company’s investments in foreign government debt securities were also causedby interest rate increases. Because the decline in market value is attributable to changes in interest rates andbecause the Company does not intend to sell the investments and it is not more likely than not that the Companywill be required to sell the investments before recovery of their amortized cost basis, which may be maturity, theCompany does not consider those investments to be other-than-temporarily impaired at December 31, 2009.
Pursuant to the Company’s investment policy, all individual marketable security investments must have aminimum credit quality of single A (per Standard & Poor’s or Fitch) or A2 (per Moody’s Corporation) at thetime of acquisition, while the overall portfolio of marketable securities must maintain a minimum average creditquality of double A (per Standard & Poor’s or Fitch) or Aa (per Moody’s Corporation). In the event of a ratingdowngrade below the minimum credit quality subsequent to purchase, the marketable security investment isevaluated to determine the appropriate action to take to minimize the overall risk to the Company’s marketable
50

Stryker Corporation and Subsidiaries
NOTES TO CONSOLIDATED FINANCIAL STATEMENTS—(Continued)December 31, 2009
security investment portfolio. As of December 31, 2009, approximately 1% of the Company’s investments inmarketable securities had a credit quality rating of less than single A (per Standard & Poor’s or Fitch) and A2(per Moody’s Corporation). As of December 31, 2009, approximately 1% of the Company’s investments inmarketable securities were held in triple A rated (per Standard & Poor’s or Fitch) asset backed debt securities.
Interest and marketable securities income, which is included in other income (expense), totaled $53.9million in 2009, $97.7 million in 2008 and $85.5 million in 2007.
NOTE 3DERIVATIVE INSTRUMENTS AND HEDGING STRATEGIES
The Company follows the provisions of the Derivatives and Hedging Topic of the FASB Codification,which requires the Company to recognize all derivatives on the Consolidated Balance Sheets at fair value.
The Company enters into forward currency exchange contracts to mitigate the impact of currencyfluctuations on transactions denominated in nonfunctional currencies, thereby limiting risk to the Company thatwould otherwise result from changes in exchange rates. These currency exposures principally relate tointercompany receivables and payables arising from intercompany purchases of manufactured products as wellas, in 2009, intercompany loans associated with the repatriation of foreign earnings. The duration of the forwardcurrency exchange contracts correspond to the anticipated period the intercompany receivables and payablesremain outstanding. The Company does not designate these contracts as hedges; therefore, all forward currencyexchange contracts are recorded at their fair value each period, with resulting gains and losses included in otherincome (expense) in the Consolidated Statements of Earnings as an offset to the gains and losses recognized onthe intercompany receivables and payables. For the twelve months ended December 31, 2009 and 2008,recognized foreign currency transaction losses included in other income (expense) in the ConsolidatedStatements of Earnings were $1.1 million and $6.0 million, respectively.
At December 31, 2009, the Company had outstanding forward currency exchange contracts to purchase$2,041.1 million and sell $280.5 million of various currencies (principally U.S. dollars and euros) with originalmaturities ranging from 4 to 106 days. The maximum length of time over which the Company is limiting itsexposure to the reduction in value of nonfunctional receivables and payables through foreign currency exchangecontracts is through March 31, 2010. At December 31, 2008, the Company had outstanding forward currencyexchange contracts to purchase $412.5 million and sell $288.4 million of various currencies (principally U.S.dollars and euros) with maturities ranging from 2 to 110 days.
At December 31, 2009, the fair value carrying amount of the Company’s forward currency exchangecontracts asset and liabilities were $8.3 million and $6.2 million, respectively, and was included as a componentof prepaid expenses and other current assets and accrued expenses and other liabilities, respectively, in theConsolidated Balance Sheets. The estimated fair value of forward currency exchange contracts represents themeasurement of the contracts at month-end spot rates as adjusted by current forward points. The Company isexposed to credit loss in the event of nonperformance by counterparties on its outstanding forward currencyexchange contracts but does not anticipate nonperformance by any of its counterparties.
51

Stryker Corporation and Subsidiaries
NOTES TO CONSOLIDATED FINANCIAL STATEMENTS—(Continued)December 31, 2009
NOTE 4INVENTORIES
Inventories are summarized as follows (in millions):
December 31
2009 2008
Finished goods . . . . . . . . . . . . . . . . . . . . . . . . . . . . . . . . . . . . . . $730.4 $727.4Work-in-process . . . . . . . . . . . . . . . . . . . . . . . . . . . . . . . . . . . . 84.0 92.7Raw materials . . . . . . . . . . . . . . . . . . . . . . . . . . . . . . . . . . . . . . 140.1 138.2
FIFO cost . . . . . . . . . . . . . . . . . . . . . . . . . . . . . . . . . . . . . . 954.5 958.3Less LIFO reserve . . . . . . . . . . . . . . . . . . . . . . . . . . . . . . . . . . . (11.5) (5.6)
$943.0 $952.7
NOTE 5ACQUISITIONS
On December 31, 2009, the Company acquired Ascent Healthcare Solutions, Inc. (Ascent), the marketleader in the reprocessing and remanufacturing of medical devices in the United States, in an all cash transactionfor $525.0 million. The acquisition of Ascent is expected to enhance the Company’s product offerings as well asprovide cost savings opportunities to its customers in its MedSurg Equipment segment. The Ascent acquisitiondid not have any effect on the Company’s consolidated net sales and operating income for 2009. Ascent had salesof $133.9 million for the year ended December 31, 2009 and sales of $109.4 million for the year endedDecember 31, 2008.
During 2009 the Company acquired certain additional companies that are expected to enhance theCompany’s product offerings to its customers within its Orthopaedic Implants and MedSurg Equipment businesssegments. These acquisitions did not have a material effect on the Company’s consolidated net sales andoperating income for 2009.
The acquisitions described above were accounted for pursuant to the requirements of the BusinessCombinations Topic of the FASB Codification. The assets acquired and liabilities assumed as a result of theacquisitions were included in the Company’s Consolidated Balance Sheet as of December 31, 2009. Pro formaconsolidated results of operations would not differ significantly as a result of these acquisitions.
The purchase price for each of the acquisitions described above was preliminarily allocated to the tangible andintangible assets acquired and liabilities assumed based on their estimated fair values on the acquisition date. Thefair value assigned to identifiable intangible assets acquired was determined primarily by using the incomeapproach. The excess purchase price over the value of the net tangible and identifiable intangible assets wasrecorded as goodwill. Purchased identifiable intangible assets other than goodwill are amortized on a straight-linebasis over their respective estimated useful lives. With respect to the Ascent acquisition, the estimated useful livesrange between 11 and 15 years; for all other acquisitions, the estimated useful lives range between 2 and 11 years.
For all acquisitions, the preliminary allocation of the purchase price was based upon a preliminaryvaluation, and the Company’s estimates and assumptions are subject to change within the measurement period asvaluations are finalized. The table below represents the allocation of the preliminary purchase price to theacquired net assets of Ascent and all other acquisitions completed in 2009 (in millions):
52

Stryker Corporation and Subsidiaries
NOTES TO CONSOLIDATED FINANCIAL STATEMENTS—(Continued)December 31, 2009
Ascent All Other Total
Accounts receivable . . . . . . . . . . . . . . . . . . . . . . . . . . . . . . . . . . . . . . . $ 10.6 $ 0.1 $ 10.7Inventory . . . . . . . . . . . . . . . . . . . . . . . . . . . . . . . . . . . . . . . . . . . . . . . . 10.3 0.2 10.5Other current assets . . . . . . . . . . . . . . . . . . . . . . . . . . . . . . . . . . . . . . . . 6.3 2.9 9.2Identifiable intangible assets:
Customer relationship . . . . . . . . . . . . . . . . . . . . . . . . . . . . . . . . . . 221.1 9.1 230.2Developed technology . . . . . . . . . . . . . . . . . . . . . . . . . . . . . . . . . 22.5 18.5 41.0In-process research and development . . . . . . . . . . . . . . . . . . . . . . — 20.2 20.2Trademarks . . . . . . . . . . . . . . . . . . . . . . . . . . . . . . . . . . . . . . . . . . 5.0 — 5.0Other . . . . . . . . . . . . . . . . . . . . . . . . . . . . . . . . . . . . . . . . . . . . . . . — 1.7 1.7
Goodwill . . . . . . . . . . . . . . . . . . . . . . . . . . . . . . . . . . . . . . . . . . . . . . . . 329.1 58.4 387.5Other assets . . . . . . . . . . . . . . . . . . . . . . . . . . . . . . . . . . . . . . . . . . . . . . 22.7 5.2 27.9Current liabilities . . . . . . . . . . . . . . . . . . . . . . . . . . . . . . . . . . . . . . . . . (6.3) (2.0) (8.3)Contingent consideration . . . . . . . . . . . . . . . . . . . . . . . . . . . . . . . . . . . — (45.1) (45.1)Noncurrent deferred income tax liabilities . . . . . . . . . . . . . . . . . . . . . . (96.7) (18.5) (115.2)Other liabilities . . . . . . . . . . . . . . . . . . . . . . . . . . . . . . . . . . . . . . . . . . . — (0.5) (0.5)
Goodwill associated with the acquisition of Ascent was $329.1 million and was $58.4 million for all otheracquisitions. The factors that contributed to the recognition of goodwill included securing synergies that arespecific to the Company’s business and not available to other market participants, which are expected to increaserevenues and profits; acquisition of a talented workforce; and cost savings opportunities.
In 2004 the Company acquired all of the outstanding stock of SpineCore, Inc. (SpineCore), a developer ofartificial lumbar and cervical discs for an upfront payment of $120.0 million in cash plus certain transaction costs.Terms of the transaction also include potential milestone and royalty payments of up to an additional $240.0 millionupon commercialization of SpineCore’s products in the United States. The potential milestone payments are expectedto be capitalized at their fair values as intangible assets at the time of payment. Current products under developmentinclude the FlexiCore lumbar artificial disc and the CerviCore cervical artificial disc.
The Company believes that the technologies acquired in the SpineCore acquisition will result in theintroduction of new products and additional future sales. However, unanticipated issues may arise that couldfurther delay or terminate a product’s development prior to regulatory approval or commercialization, whichcould have an unfavorable impact on the Company’s operating results. As of December 31, 2009, the Companyhad not encountered significant issues and expects completion of the development and initial U.S.commercialization of the FlexiCore lumbar artificial disc and the CerviCore cervical artificial disc followingreceipt of all required regulatory approvals.
NOTE 6DISCONTINUED OPERATIONS
In 2007 the Company sold its outpatient physical therapy business, Physiotherapy Associates, for $150.0million in cash less certain indebtedness. The sale of Physiotherapy Associates allowed the Company to focus itsefforts on the medical technology market. The sale of Physiotherapy Associates resulted in a gain of $25.7million (net of $15.0 million income tax expense), or $0.06 per diluted share. Net sales from discontinuedoperations and net earnings from discontinued operations for the year ended December 31, 2007 were $107.4million and $5.0 million, respectively.
53

Stryker Corporation and Subsidiaries
NOTES TO CONSOLIDATED FINANCIAL STATEMENTS—(Continued)December 31, 2009
NOTE 7RESTRUCTURING CHARGES
In 2009 the Company initiated a number of restructuring projects focused on shifting resources to thoseareas where the Company has the greatest opportunities for growth and streamlining operations to driveoperating leverage. In 2008 the Company made decisions to simplify the structure of its Japanese distributionbusiness and to substantially reduce development efforts associated with product technologies purchased in theSightline Technologies Ltd. acquisition in 2006. The Company recorded restructuring charges in 2009 and 2008consisting of the following items (in millions):
2009 2008
Agent conversion charges . . . . . . . . . . . . . . . . . . . . . . . . . . . . . . . $30.3 $ 0.0Asset impairment charges . . . . . . . . . . . . . . . . . . . . . . . . . . . . . . . 18.3 22.3Severance and related costs . . . . . . . . . . . . . . . . . . . . . . . . . . . . . . 12.9 8.5Contractual obligations and other charges . . . . . . . . . . . . . . . . . . 5.5 4.1
Total . . . . . . . . . . . . . . . . . . . . . . . . . . . . . . . . . . . . . . . . . . . . . . . $67.0 $34.9
2009 Charges:
The $30.3 million agent conversion charges represent costs associated with the termination of certain third-party agent agreements at the Company’s Europe, Middle East, Africa (EMEA) Division. This initiative is intendedto provide the Company greater control over its distribution channels as well as improve customer focus and sellingefficiency. The $18.3 million asset impairment charges are associated with the Company’s decision to discontinueselling certain products within its Orthopaedic Implants and MedSurg Equipment business segments and relatesprimarily to identifiable intangible assets. The discontinued product lines are not expected to have a material impacton the Company’s future operating results. The $12.9 million severance and related costs charge representsworkforce reduction employment-related severance costs for approximately 120 employees resulting from theCompany’s decision to simplify the organization structure at its Biotech, EMEA, Japan and Canada divisions. The$5.5 million contractual obligations and other charges represent costs associated with the termination of varioussupplier contracts as well as other incidental costs related to the discontinued product lines.
2008 Charges:
The $22.3 million asset impairment charges represent the excess of net book value over fair market valuefor assets to be disposed of by sale, primarily related to sales offices and warehousing and distribution facilitiesin Japan. The $8.5 million charge represents employment-related severance costs for 84 employees. The $4.1million contractual obligations and other charges represent costs associated with the termination of varioussupplier contracts as well as other incidental costs.
54

Stryker Corporation and Subsidiaries
NOTES TO CONSOLIDATED FINANCIAL STATEMENTS—(Continued)December 31, 2009
The following table provides a rollforward of the remaining liabilities, included within accrued expensesand other liabilities in the Consolidated Balance Sheet, related to the restructuring charges recorded by theCompany in 2009 and 2008 (in millions):
AgentConversions
Severance andrelated costs
Contractual Obligationsand Other Charges
Balances at January 1, 2009 . . . . . . . . $ 0.0 $ 8.7 $ 1.8Charges . . . . . . . . . . . . . . . . . . . . . . . . 30.3 12.9 5.5Payments . . . . . . . . . . . . . . . . . . . . . . . (24.5) (18.1) (4.8)Foreign currency translation effects . . 0.1 (0.1) —
Balances at December 31, 2009 . . . . . $ 5.9 $ 3.4 $ 2.5
The restructuring projects initiated in 2009 and 2008 are substantially complete. The Company expects theasset disposals to be completed and final severance payments to be made in 2010.
NOTE 8GOODWILL AND OTHER INTANGIBLE ASSETS
The changes in the net carrying amount of goodwill by segment for the years ended December 31, 2009 and2008 are as follows (in millions):
OrthopaedicImplants
MedSurgEquipment Total
Balance as of January 1, 2008 . . . . . . . . . . . . . . . . . . . . $477.4 $ 50.0 $527.4Foreign currency translation effects and other . . . . . . . 40.2 (0.1) 40.1
Balance as of December 31,2008 . . . . . . . . . . . . . . . . . 517.6 49.9 567.5Goodwill acquired . . . . . . . . . . . . . . . . . . . . . . . . . . . . . 36.3 351.2 387.5Foreign currency translation effects and other . . . . . . . (1.6) 3.4 1.8
Balance as of December 31, 2009 . . . . . . . . . . . . . . . . . $552.3 $404.5 $956.8
In the fourth quarters of 2009 and 2008, the Company completed the required annual impairment tests ofgoodwill as prescribed by the Intangibles-Goodwill and Other Topic of the FASB Codification and determined,in all instances, that recorded goodwill was not impaired and that no goodwill write down was necessary.
55

Stryker Corporation and Subsidiaries
NOTES TO CONSOLIDATED FINANCIAL STATEMENTS—(Continued)December 31, 2009
The following is a summary of the Company’s other intangible assets (in millions):
GrossCarryingAmount
LessAccumulatedAmortization
NetCarryingAmount
At December 31, 2009:Amortized intangible assets:
Developed technology . . . . . . . . . . . . . . . . . . . . . $ 316.9 $160.3 $156.6Customer relationship . . . . . . . . . . . . . . . . . . . . . 410.9 63.0 347.9Patents . . . . . . . . . . . . . . . . . . . . . . . . . . . . . . . . . 241.4 156.0 85.4Trademarks . . . . . . . . . . . . . . . . . . . . . . . . . . . . . . 37.8 19.2 18.6Other . . . . . . . . . . . . . . . . . . . . . . . . . . . . . . . . . . . 48.7 22.5 26.2
$1,055.7 $421.0 $634.7
At December 31, 2008:Amortized intangible assets:
Developed technology . . . . . . . . . . . . . . . . . . . . . $ 272.4 $139.7 $132.7Customer relationship . . . . . . . . . . . . . . . . . . . . . 177.9 53.7 124.2Patents . . . . . . . . . . . . . . . . . . . . . . . . . . . . . . . . . 239.0 151.8 87.2Trademarks . . . . . . . . . . . . . . . . . . . . . . . . . . . . . . 32.2 17.5 14.7Other . . . . . . . . . . . . . . . . . . . . . . . . . . . . . . . . . . . 30.3 21.1 9.2
$ 751.8 $383.8 $368.0
The estimated amortization expense for each of the five succeeding years is as follows (in millions):
2010 . . . . . . . . . . . . . . . . . . . . . . . . . . . . . . . . . . . . . . . . . . . . . . . $48.62011 . . . . . . . . . . . . . . . . . . . . . . . . . . . . . . . . . . . . . . . . . . . . . . . $48.02012 . . . . . . . . . . . . . . . . . . . . . . . . . . . . . . . . . . . . . . . . . . . . . . . $47.12013 . . . . . . . . . . . . . . . . . . . . . . . . . . . . . . . . . . . . . . . . . . . . . . . $45.62014 . . . . . . . . . . . . . . . . . . . . . . . . . . . . . . . . . . . . . . . . . . . . . . . $45.4
NOTE 9DEBT
The Company had current debt outstanding under various debt instruments totaling $18.0 million, $20.5million and $16.8 million at December 31, 2009, 2008 and 2007, respectively.
The Company also has a $1,000.0 million Unsecured Credit Facility (Facility). The Facility, which expiresin November 2010, includes a senior 5-year nonamortizing, revolving credit agreement with a maximum amountof $1,000.0 million. The Company may increase the Facility maximum limit in $100.0 million increments up toan additional $500.0 million upon acceptance by the existing lender group or additional lenders. No amountswere outstanding under the Unsecured Credit Facility as of December 31, 2009 and 2008.
The Unsecured Credit Facility requires a facility fee ranging from 0.04% to 0.15% on the aggregatecommitment of the Facility, depending on the Company’s debt rating. The Facility includes a $500.0 millionmulticurrency sublimit, under which yen and euro can be borrowed; a $100.0 million swing line sublimit; and a$100.0 million letter of credit sublimit. The Facility bears interest at a base rate, as defined, plus an applicablemargin ranging from 0.12% to 0.475%, depending on the Company’s debt rating.
56

Stryker Corporation and Subsidiaries
NOTES TO CONSOLIDATED FINANCIAL STATEMENTS—(Continued)December 31, 2009
During 2009 the weighted-average interest rate, excluding required fees, for all borrowings was 4.3%. TheFacility requires the Company to comply with certain financial and other covenants. The Company was incompliance with all covenants at December 31, 2009. In addition to the Facility, the Company has lines of credit,issued by various financial institutions, available to fund the Company’s day-to-day operating needs. AtDecember 31, 2009, the Company had $1,049.2 million of additional borrowing capacity available under all ofits existing credit facilities.
The carrying amounts of the Company’s debt approximate their fair values, based on the quoted interestrates for similar types and amounts of borrowing agreements.
Interest paid on debt, including required fees, was $5.3 million in 2009, $5.7 million in 2008 and $6.5million in 2007 and approximates amounts reflected in interest expense, which is included in other income(expense).
NOTE 10CAPITAL STOCK
In December 2009 the Company’s Board of Directors authorized the Company to repurchase up to $750.0million of its common stock. The manner, timing and amount of any purchases will be determined by theCompany’s management based on their evaluation of market conditions, stock price and other factors and will besubject to regulatory considerations. Purchases may be made from time to time in the open market, in privatelynegotiated transactions or otherwise. The Company had not made any stock repurchases relative to the $750.0million repurchase program as of December 31, 2009.
In October 2009 the Company’s Board of Directors modified the Company’s dividend policy to adopt aquarterly payment schedule in lieu of an annual dividend. In conjunction with this modification, the Company’sBoard of Directors declared a cash transition dividend of $0.10 per share. The transition dividend increased thetotal dividends paid in 2009 to $0.50 per share, up 52% from the $0.33 per share paid in 2008. In addition, inDecember 2009 the Company’s Board of Directors declared its first quarterly dividend of $0.15 per sharepayable January 29, 2010 to shareholders of record at the close of business on December 30, 2009.
During 2008 the Company repurchased 17.4 million shares of common stock in the open market at a cost of$1,000.0 million pursuant to the repurchase programs authorized by the Company’s Board of Directors. Sharesrepurchased under the share repurchase programs are available for general corporate purposes, includingoffsetting dilution associated with stock option and other equity-based employee benefit plans.
The Company has 0.5 million authorized shares of $1 par value preferred stock, none of which isoutstanding.
57

Stryker Corporation and Subsidiaries
NOTES TO CONSOLIDATED FINANCIAL STATEMENTS—(Continued)December 31, 2009
The Company has key employee and director stock option plans under which options are granted at anexercise price not less than the fair market value of the underlying common stock at the date of grant. Theoptions are granted for periods of up to 10 years and become exercisable in varying installments. A summary ofstock option activity follows:
Shares(in millions)
WeightedAverage
Exercise Price
Weighted-AverageRemaining
Contractual Term(in years)
AggregateIntrinsic Value
(in millions)
Options outstanding at January 1, 2009 . . . . . . . . . . 23.8 $45.01Granted . . . . . . . . . . . . . . . . . . . . . . . . . . . . . . . . . . . 5.5 41.96Exercised . . . . . . . . . . . . . . . . . . . . . . . . . . . . . . . . . . (1.8) 21.03Cancelled . . . . . . . . . . . . . . . . . . . . . . . . . . . . . . . . . . (1.2) 52.55
Options outstanding at December 31, 2009 . . . . . . . 26.3 $45.69 5.9 $210.4
Exercisable at December 31, 2009 . . . . . . . . . . . . . . 14.6 $41.20 4.3 $158.6Options expected to vest . . . . . . . . . . . . . . . . . . . . . . 11.3 $51.78 7.9 $ 48.2
The aggregate intrinsic value, which represents the cumulative difference between the fair market value ofthe underlying common stock and the option exercise prices, of options exercised during the years endedDecember 31, 2009, 2008 and 2007 was $37.5 million, $135.4 million and $160.1 million, respectively. Sharesreserved for future compensation grants of Stryker common stock were 14.5 million at December 31, 2009 and19.7 million at December 31, 2008. Exercise prices for options outstanding as of December 31, 2009 ranged from$16.21 to $67.80. At December 31, 2009, there was $143.2 million of unrecognized compensation cost related tononvested stock options granted under the stock option plans; that cost is expected to be recognized over thefollowing 5.2 years (weighted-average period of 1.6 years). During 2009, the Company also granted restrictedstock units representing 0.1 million shares of common stock with a weighted average fair value per share of$40.45.
NOTE 11NET EARNINGS PER SHARE
The following table sets forth the computation of basic and diluted net earnings per share (in millions,except per share amounts):
2009 2008 2007
Net earnings . . . . . . . . . . . . . . . . . . . . . . . . . . . . . . . . . . . . . . . . . . . . . . . . . . . . . . $1,107.4 $1,147.8 $1,017.4Weighted-average shares outstanding for basic net earnings per share . . . . . . . . 397.4 408.1 409.7Effect of dilutive employee stock options . . . . . . . . . . . . . . . . . . . . . . . . . . . . . . . 2.0 5.5 7.5
Adjusted weighted-average shares outstanding for diluted net earnings pershare . . . . . . . . . . . . . . . . . . . . . . . . . . . . . . . . . . . . . . . . . . . . . . . . . . . . . . . . . 399.4 413.6 417.2
Net earnings per share of common stock:Basic . . . . . . . . . . . . . . . . . . . . . . . . . . . . . . . . . . . . . . . . . . . . . . . . . . . . . . . $ 2.79 $ 2.81 $ 2.48Diluted . . . . . . . . . . . . . . . . . . . . . . . . . . . . . . . . . . . . . . . . . . . . . . . . . . . . . . $ 2.77 $ 2.78 $ 2.44
Options to purchase an average of 18.1 million, 5.7 million and 0.9 million shares of common stock duringthe years ended December 31, 2009, 2008 and 2007, respectively, were outstanding but were not included in thecomputation of diluted net earnings per share because the exercise prices of the options were greater than theaverage market price of common stock for those periods.
58

Stryker Corporation and Subsidiaries
NOTES TO CONSOLIDATED FINANCIAL STATEMENTS—(Continued)December 31, 2009
NOTE 12RETIREMENT PLANS
Certain of the Company’s subsidiaries have both funded and unfunded defined benefit pension planscovering some or all of their employees. Substantially all of the defined benefit pension plans have projectedbenefit obligations in excess of plan assets. A summary of the Company’s defined benefit pension plans is asfollows (in millions):
December 31
2009 2008
Change in projected benefit obligations:Projected benefit obligations at beginning of year . . . . . . . . . . . . . $252.1 $ 230.7Service cost . . . . . . . . . . . . . . . . . . . . . . . . . . . . . . . . . . . . . . . . . . . 15.8 15.8Interest cost . . . . . . . . . . . . . . . . . . . . . . . . . . . . . . . . . . . . . . . . . . . 11.5 11.7Foreign exchange impact . . . . . . . . . . . . . . . . . . . . . . . . . . . . . . . . . 3.7 4.8Employee contributions . . . . . . . . . . . . . . . . . . . . . . . . . . . . . . . . . . 3.4 3.5Actuarial gains . . . . . . . . . . . . . . . . . . . . . . . . . . . . . . . . . . . . . . . . . (9.8) (5.5)Benefits paid . . . . . . . . . . . . . . . . . . . . . . . . . . . . . . . . . . . . . . . . . . (14.3) (8.9)
Projected benefit obligations at end of year . . . . . . . . . . . . . . . . . . . 262.4 252.1
Change in plan assets:Fair value of plan assets at beginning of year . . . . . . . . . . . . . . . . . 150.5 172.4Actual return . . . . . . . . . . . . . . . . . . . . . . . . . . . . . . . . . . . . . . . . . . 13.2 (35.3)Employer contributions . . . . . . . . . . . . . . . . . . . . . . . . . . . . . . . . . . 20.4 13.9Employee contributions . . . . . . . . . . . . . . . . . . . . . . . . . . . . . . . . . . 3.4 3.5Foreign exchange impact . . . . . . . . . . . . . . . . . . . . . . . . . . . . . . . . . 3.2 4.2Benefits paid . . . . . . . . . . . . . . . . . . . . . . . . . . . . . . . . . . . . . . . . . . (13.4) (8.2)
Fair value of plan assets at end of year . . . . . . . . . . . . . . . . . . . . . . 177.3 150.5
Funded status . . . . . . . . . . . . . . . . . . . . . . . . . . . . . . . . . . . . . . . . . . $ (85.1) $(101.6)
The weighted-average discount rate used in the determination of the projected benefit obligations was 4.9%as of December 31, 2009 and 2008.
The components of the amounts recognized in the Consolidated Balance Sheets are as follows (in millions):
December 31
2009 2008
Noncurrent assets—Other . . . . . . . . . . . . . . . . . . . . . . . . . . . . . $ 1.7 $ 2.2Current liabilities—Accrued compensation . . . . . . . . . . . . . . . (1.0) (2.2)Noncurrent liabilities—Other liabilities . . . . . . . . . . . . . . . . . . (85.8) (101.6)
$(85.1) $(101.6)
59

Stryker Corporation and Subsidiaries
NOTES TO CONSOLIDATED FINANCIAL STATEMENTS—(Continued)December 31, 2009
The components of the amounts recognized in accumulated other comprehensive gain (loss), before theeffect of income taxes, are as follows (in millions):
December 31
2009 2008
Unrecognized net actuarial loss . . . . . . . . . . . . . . . . . . . . . . . . . $(24.4) $(49.1)Unrecognized prior service cost . . . . . . . . . . . . . . . . . . . . . . . . . (0.1) (0.7)Unrecognized transition amount . . . . . . . . . . . . . . . . . . . . . . . . . (0.5) (0.1)
$(25.0) $(49.9)
The accumulated benefit obligations for all of the defined benefit pension plans was $238.2 million and$234.2 million as of December 31, 2009 and 2008, respectively. Pension plans with an accumulated benefitobligation in excess of plan assets had projected benefit obligations, accumulated benefit obligations and fairvalue of plan assets of $248.9 million, $229.8 million and $165.0 million, respectively, as of December 31, 2009and $187.5 million, $174.9 million and $86.1 million, respectively, as of December 31, 2008.
The components of net periodic benefit cost and other changes in plan assets and benefit obligationsrecognized in other comprehensive gain (loss) before the effect of income taxes are as follows (in millions):
2009 2008 2007
Net periodic benefit cost:Service cost . . . . . . . . . . . . . . . . . . . . . . . . . . . . . . . . . . . . $(15.8) $(15.8) $(17.2)Interest cost . . . . . . . . . . . . . . . . . . . . . . . . . . . . . . . . . . . . (11.5) (11.7) (9.4)Expected return on plan assets . . . . . . . . . . . . . . . . . . . . . . 8.4 11.1 8.9Amortization of prior service cost and transition
amount . . . . . . . . . . . . . . . . . . . . . . . . . . . . . . . . . . . . . . (0.1) (0.1) (0.2)Recognized actuarial loss . . . . . . . . . . . . . . . . . . . . . . . . . . (2.2) (0.2) (1.0)
Net periodic benefit cost . . . . . . . . . . . . . . . . . . . . . . (21.2) (16.7) (18.9)
Other changes in plan assets and benefit obligations,recognized in other comprehensive gain (loss):
Net actuarial gain (loss) . . . . . . . . . . . . . . . . . . . . . . . . . . . 22.5 (36.5) 20.8Recognized net actuarial loss . . . . . . . . . . . . . . . . . . . . . . . 2.2 0.2 1.0Prior service cost and transition amount . . . . . . . . . . . . . . 0.2 0.3 0.1
Total recognized in other comprehensive gain (loss) . . . . . . . . 24.9 (36.0) 21.9
Total recognized in net periodic benefit cost and othercomprehensive gain (loss) . . . . . . . . . . . . . . . . . . . . . . . . . . . $ 3.7 $(52.7) $ 3.0
Weighted-average assumptions used in the determination ofnet periodic benefit cost:
Discount rate . . . . . . . . . . . . . . . . . . . . . . . . . . . . . . . . . . . 4.7% 4.7% 4.4%Expected return on plan assets . . . . . . . . . . . . . . . . . . . . . . 5.8% 5.5% 5.8%Rate of compensation increase . . . . . . . . . . . . . . . . . . . . . . 2.8% 2.9% 2.9%
The estimated net actuarial loss for the defined benefit pension plans to be recognized from accumulatedother comprehensive gain (loss) into net periodic benefit cost in the year ended December 31, 2010 is $0.5million. The Company estimates that an immaterial amount of amortization of prior service cost and transition
60

Stryker Corporation and Subsidiaries
NOTES TO CONSOLIDATED FINANCIAL STATEMENTS—(Continued)December 31, 2009
amount for the defined benefit pension plans will be recognized from accumulated other comprehensive gain(loss) into net periodic benefit cost in the year ended December 31, 2010.
The Company has assumed an average long-term expected return on defined benefit plan assets of 5.8% asof December 31, 2009. The expected return is determined by applying the target allocation in each asset categoryof plan investments to the anticipated return for each asset category based on historical and projected returns.
The weighted-average allocation of plan assets by asset category is as follows:
December 31
2009 2008
Equity securities . . . . . . . . . . . . . . . . . . . . . . . . . . . . . . . . . . . . . . . . 57% 50%Debt securities . . . . . . . . . . . . . . . . . . . . . . . . . . . . . . . . . . . . . . . . . . 26 41Other . . . . . . . . . . . . . . . . . . . . . . . . . . . . . . . . . . . . . . . . . . . . . . . . . 17 9
100% 100%
The investment strategy for the Company’s defined benefit pension plans is both to meet the liabilities ofthe plans as they fall due and to maximize the return on invested assets within appropriate risk tolerances.
Reflected below are weighted-average target investment allocation ranges for the plans at December 31,2009:
Low High
Equity securities . . . . . . . . . . . . . . . . . . . . . . . . . . . . . . . . . . . . . . . . 50% 59%Debt securities . . . . . . . . . . . . . . . . . . . . . . . . . . . . . . . . . . . . . . . . . . 26 35Other . . . . . . . . . . . . . . . . . . . . . . . . . . . . . . . . . . . . . . . . . . . . . . . . . 16 21
The following table summarizes the valuation of the Company’s pension plan assets by pricing categories atDecember 31, 2009 (in millions):
Total
Quoted Pricesin Active Markets
(Level 1)
Prices withother
ObservableInputs
(Level 2)
Prices withUnobservable
Inputs(Level 3)
Asset Category:Cash . . . . . . . . . . . . . . . . . . . . . . . . . . . . . . . . $ 12.2 $ 8.5 $ 3.7 $ —Equity securities:
U.S companies . . . . . . . . . . . . . . . . . . . . 34.8 23.4 11.4 —International companies . . . . . . . . . . . . 66.2 31.7 34.5 —
Mutual funds . . . . . . . . . . . . . . . . . . . . . . . . . 28.3 28.3 — —U.S Treasury securities . . . . . . . . . . . . . . . . . 12.4 — 12.4 —Corporate debt securities . . . . . . . . . . . . . . . . 5.7 5.7 — —Other . . . . . . . . . . . . . . . . . . . . . . . . . . . . . . . 17.7 1.5 — 16.2
Total . . . . . . . . . . . . . . . . . . . . . . . . . . . $177.3 $99.1 $62.0 $16.2
61

Stryker Corporation and Subsidiaries
NOTES TO CONSOLIDATED FINANCIAL STATEMENTS—(Continued)December 31, 2009
The Company’s Level 3 assets consist primarily of guaranteed investment contracts with insurancecompanies. The insurance contracts guarantee the Company principal repayment and a fixed rate of return. TheCompany’s valuation of its Level 3 assets is based on third party actuarial valuations which are an estimation ofthe surrender value of the guaranteed investment contract between the Company and the insurance company. Thesurrender value equals the actuarial value of the notional investments underlying the guaranteed investmentcontract, using the actuarial assumptions as stated in the guaranteed investment contract.
The following table presents a rollforward of pension plan assets measured at fair value on a recurring basisusing unobservable inputs (Level 3) at January 1, 2009 and December 31, 2009 (in millions):
Balance as of January 1, 2009 . . . . . . . . . . . . . . . . . . . . . . . . . . . . . . . . . . . $14.9Actual return on plan assets held at the reporting date . . . . . . . . . . . . . . . . (0.3)Purchases, sales, and settlements . . . . . . . . . . . . . . . . . . . . . . . . . . . . . . . . . 1.6
Balance as of December 31, 2009 . . . . . . . . . . . . . . . . . . . . . . . . . . . . . . . . $16.2
The Company anticipates contributing $19.0 million to its defined benefit pension plans in 2010.
The following estimated future benefit payments, which reflect expected future service as appropriate, areexpected to be paid in the years indicated (in millions):
2010 2011 2012 2013 2014 2015-2019
Expected benefits payments . . . . . . . . . . . . . . . . . . $6.4 $7.1 $7.7 $8.5 $9.1 $55.1
Retirement plan expense under the Company’s defined contribution retirement plans totaled $100.7 millionin 2009, $98.6 million in 2008 and $82.3 million in 2007. A portion of the Company’s retirement plan expensewas funded with Stryker common stock totaling $10.8 million in 2009, $9.3 million in 2008 and $8.4 million in2007. The use of Stryker common stock represents a noncash operating activity that is not reflected in theConsolidated Statements of Cash Flows. The amount of Stryker common stock held by the Company’s definedcontribution retirement plans totaled $82.6 million (approximately 1.6 million shares) and $58.8 million(approximately 1.5 million shares) as of December 31, 2009 and 2008, respectively. The value of Strykercommon stock as a percentage of total defined contribution retirement plan assets was 11% as of December 31,2009 and 2008.
NOTE 13INCOME TAXES
Earnings from continuing operations before income taxes consist of the following (in millions):
2009 2008 2007
U.S operations . . . . . . . . . . . . . . . . . . . . . . . . . . . . . . . . . $ 709.5 $ 738.1 $ 666.8Foreign operations . . . . . . . . . . . . . . . . . . . . . . . . . . . . . . 914.4 842.1 703.3
$1,623.9 $1,580.2 $1,370.1
62

Stryker Corporation and Subsidiaries
NOTES TO CONSOLIDATED FINANCIAL STATEMENTS—(Continued)December 31, 2009
The components of the provision for income taxes follow (in millions):
2009 2008 2007
Current income tax expenseFederal . . . . . . . . . . . . . . . . . . . . . . . . . . . . . . . . . . . $382.4 $262.3 $ 290.9State . . . . . . . . . . . . . . . . . . . . . . . . . . . . . . . . . . . . . 26.6 48.1 49.5Foreign . . . . . . . . . . . . . . . . . . . . . . . . . . . . . . . . . . 180.2 139.6 190.1
589.2 450.0 530.5Deferred income tax credit . . . . . . . . . . . . . . . . . . . . . . . (72.7) (17.6) (147.1)
$516.5 $432.4 $ 383.4
A reconciliation of the U.S. statutory income tax rate to the Company’s effective income tax rate fromcontinuing operations follows:
2009 2008 2007
U.S. statutory income tax rate . . . . . . . . . . . . . . . . . . . . . . . . . . . . . 35.0% 35.0% 35.0%Add (deduct):
State income taxes, less effect of federal deduction . . . . . . . . 2.6 1.5 0.8International operations . . . . . . . . . . . . . . . . . . . . . . . . . . . . . . (13.8) (11.5) (10.2)Repatriation of foreign earnings . . . . . . . . . . . . . . . . . . . . . . . . 4.1 — —Other . . . . . . . . . . . . . . . . . . . . . . . . . . . . . . . . . . . . . . . . . . . . . 3.9 2.4 2.4
31.8% 27.4% 28.0%
Deferred income taxes reflect the net income tax effects of temporary differences between the carryingamounts of assets and liabilities for financial reporting purposes and the amounts used for income tax purposes.Valuation allowances are recorded to reduce deferred income tax assets when it is more likely than not that anincome tax benefit will not be realized.
63

Stryker Corporation and Subsidiaries
NOTES TO CONSOLIDATED FINANCIAL STATEMENTS—(Continued)December 31, 2009
The income tax effects of significant temporary differences, which comprise the Company’s deferredincome tax assets and liabilities, are as follows (in millions):
December 31
2009 2008
Deferred income tax assets:Inventories . . . . . . . . . . . . . . . . . . . . . . . . . . . . . . . . . . . . . . . . . . . $ 471.7 $ 361.8Other accrued expenses . . . . . . . . . . . . . . . . . . . . . . . . . . . . . . . . . 130.7 146.2Depreciation and amortization . . . . . . . . . . . . . . . . . . . . . . . . . . . . 17.3 25.1State income taxes . . . . . . . . . . . . . . . . . . . . . . . . . . . . . . . . . . . . . 29.0 21.3Share-based compensation . . . . . . . . . . . . . . . . . . . . . . . . . . . . . . . 98.5 82.5Net operating loss carryforwards . . . . . . . . . . . . . . . . . . . . . . . . . . 59.7 35.2Other . . . . . . . . . . . . . . . . . . . . . . . . . . . . . . . . . . . . . . . . . . . . . . . . 81.8 86.9
Total deferred income tax assets . . . . . . . . . . . . . . . . . . . . . . . . . . . . . . 888.7 759.0Less valuation allowances . . . . . . . . . . . . . . . . . . . . . . . . . . . . . . . . . . . (27.6) (24.9)
Total deferred income tax assets after valuation allowances . . . . . . . . . 861.1 734.1
Deferred income tax liabilities:Depreciation and amortization . . . . . . . . . . . . . . . . . . . . . . . . . . . . (347.4) (177.5)Other . . . . . . . . . . . . . . . . . . . . . . . . . . . . . . . . . . . . . . . . . . . . . . . . (59.3) (71.4)
Total deferred income tax liabilities . . . . . . . . . . . . . . . . . . . . . . . . . . . . (406.7) (248.9)
Total deferred income tax assets . . . . . . . . . . . . . . . . . . . . . . . . . . . . . . $ 454.4 $ 485.2
Reported as:Current assets—Deferred income taxes . . . . . . . . . . . . . . . . . . . . . $ 602.2 $ 521.9Noncurrent assets—Deferred income taxes . . . . . . . . . . . . . . . . . . 258.9 212.2Current liabilities—Accrued expenses and other liabilities . . . . . . (24.1) (87.6)Noncurrent liabilities—Other liabilities . . . . . . . . . . . . . . . . . . . . . (382.6) (161.3)
$ 454.4 $ 485.2
Net operating loss carryforwards totaling $196.2 million at December 31, 2009 are available to reducefuture taxable earnings of certain domestic and foreign subsidiaries. U.S. loss carryforwards of $62.3 millionexpire between 2010 and 2025. The majority of the Company’s foreign loss carryforwards of $133.9 million donot expire. In addition, $108.4 million of the foreign loss carryforward is subject to a full valuation allowance.
During the fourth quarter of 2009, the Company repatriated $787.0 million of foreign earnings to the UnitedStates and recorded a charge of $67.1 million to recognize the income tax expense and related liability associatedwith the repatriation. The repatriated cash was used to fund the acquisition of Ascent and will also be used forpreviously announced initiatives, including the share repurchase authorization. Pursuant to the requirements ofthe Accounting for Income Taxes-Special Areas (included in the Income Taxes Topic of the FASB Codification),no provision has been made for U. S. federal and state income taxes or foreign income taxes that may result fromfuture remittances of the undistributed earnings of foreign subsidiaries that are determined to be reinvestedoverseas indefinitely ($3,231.4 million at December 31, 2009). Determination of the amount of any unrecognizeddeferred income tax liability on these unremitted earnings is not practicable.
Total income taxes paid, net of refunds received, were $406.4 million in 2009, $478.5 million in 2008 and$411.6 million in 2007.
64

Stryker Corporation and Subsidiaries
NOTES TO CONSOLIDATED FINANCIAL STATEMENTS—(Continued)December 31, 2009
The changes in the amounts recorded for unresolved income tax positions are as follows (in millions):
December 31
2009 2008
Balance at beginning of year . . . . . . . . . . . . . . . . . . . . . . . . . . . . . . . . . . . $277.1 $233.8Increases related to current year income tax positions . . . . . . . . . . . . . . . 41.0 42.4Increases related to prior year income tax positions . . . . . . . . . . . . . . . . . 64.7 24.6
Decreases related to prior year income tax positions:Settlements and resolutions of income tax audits . . . . . . . . . . . . . . . (66.9) —Statute of limitations expirations . . . . . . . . . . . . . . . . . . . . . . . . . . . (3.7) (4.1)Other . . . . . . . . . . . . . . . . . . . . . . . . . . . . . . . . . . . . . . . . . . . . . . . . . (19.5) (19.6)
Balance at end of year . . . . . . . . . . . . . . . . . . . . . . . . . . . . . . . . . . . . . . . . $292.7 $277.1
Reported as:Current liabilities—Income taxes . . . . . . . . . . . . . . . . . . . . . . . . . . . $ 0.5 $ 9.1Noncurrent liabilities—Other liabilities . . . . . . . . . . . . . . . . . . . . . . 292.2 268.0
$292.7 $277.1
The Company’s income tax expense could be reduced by $274.3 million and $241.6 million atDecember 31, 2009 and December 31, 2008, respectively, upon favorable resolution of these unresolved incometax positions.
At December 31, 2009, income tax authorities in several income tax jurisdictions both inside and outside theUnited States were conducting routine audits of the Company’s income tax returns filed in prior years. Theseaudits are generally designed to determine if individual income tax authorities are in agreement with theCompany’s interpretations of complex income tax regulations regarding the allocation of income to the variousincome tax jurisdictions. With few exceptions, the Company is no longer subject to audits by income taxauthorities for tax years prior to 2003. Income tax years subsequent to 2002 are open to examination in many ofthe income tax jurisdictions in which the Company operates. In April 2009, the U.S. Internal Revenue Service(IRS) proposed adjustments to the Company’s previously filed 2003, 2004 and 2005 income tax returns related toincome tax positions the Company has taken for its cost sharing arrangements with two wholly owned entitiesoperating in Ireland. The Company believes it followed the applicable tax law and Treasury regulations and willvigorously defend these income tax positions. If the IRS were ultimately to prevail with respect to its proposedadjustments, such adjustments could have a material unfavorable impact on the Company’s income tax expenseand net earnings in future periods.
Interest expense and penalties included in other income (expense) were $9.2 million for the year endedDecember 31, 2009. Accrued interest and penalties included in accrued expenses and other liabilities were $58.7million and $52.6 million at December 31, 2009 and December 31, 2008, respectively.
It is reasonably possible that the amount of unrecognized tax benefits will significantly change due to one ormore of the following events in the next twelve months: expiring statutes, audit activity, tax payments, competentauthority proceedings related to transfer pricing, or final decisions in matters that are the subject of controversyin various taxing jurisdictions in which we operate, including cost sharing and product royalty arrangements. TheCompany is not able to reasonably estimate the amount or the future periods in which changes in unrecognizedtax benefits may be required.
65

Stryker Corporation and Subsidiaries
NOTES TO CONSOLIDATED FINANCIAL STATEMENTS—(Continued)December 31, 2009
NOTE 14SEGMENT AND GEOGRAPHIC DATA
The Company segregates its operations into two reportable business segments: Orthopaedic Implants andMedSurg Equipment. The Orthopaedic Implants segment includes orthopaedic reconstructive (hip and knee),trauma and spinal implant systems and other related products. The MedSurg Equipment segment includessurgical equipment and surgical navigation systems; endoscopic and communications systems; as well as patienthandling and emergency medical equipment. The Other category includes corporate administration, interestexpense, interest and marketable securities income and share-based compensation, which includes compensationrelated to both employee and director stock option and restricted stock grants.
The Company’s reportable segments are business units that offer different products and services and aremanaged separately because each business requires different manufacturing, technology and marketingstrategies. The accounting policies of the segments are the same as those described in the summary of significantaccounting policies in Note 1 to the Consolidated Financial Statements. The Company measures the financialresults of its reportable segments using an internal performance measure that excludes the patent litigation gainand the income tax expenses associated with the repatriation of foreign earnings recorded in 2009, therestructuring charges recorded in 2009 and 2008 and the intangible asset impairment charge recorded in 2007.Identifiable assets are those assets used exclusively in the operations of each business segment or allocated whenused jointly. Corporate assets are principally cash and cash equivalents; marketable securities and property, plantand equipment. The identifiable assets of the MedSurg Equipment segment at December 31, 2009 include theacquired assets of Ascent Healthcare Solutions, Inc.
66

Stryker Corporation and Subsidiaries
NOTES TO CONSOLIDATED FINANCIAL STATEMENTS—(Continued)December 31, 2009
Sales and other financial information by business segment follows (in millions):
OrthopaedicImplants
MedSurgEquipment Other Total
Year ended December 31, 2009:Net sales . . . . . . . . . . . . . . . . . . . . . . . . . . . . . . . . . . . . . . . . . $4,119.7 $2,603.4 $ — $6,723.1Interest and marketable securities income . . . . . . . . . . . . . . . — — 53.9 53.9Interest expense . . . . . . . . . . . . . . . . . . . . . . . . . . . . . . . . . . . — — (22.4) (22.4)Depreciation and amortization expense . . . . . . . . . . . . . . . . . 305.7 68.8 10.8 385.3Income taxes (credit) . . . . . . . . . . . . . . . . . . . . . . . . . . . . . . . 327.0 159.5 (38.2) 448.3Segment net earnings (loss) . . . . . . . . . . . . . . . . . . . . . . . . . . 802.0 462.9 (84.9) 1,180.0Less restructuring charges, net of income tax benefits . . . . . . (48.4)Less income taxes on repatriation of foreign earnings . . . . . . (67.1)Add patent litigation gain, net of income taxes . . . . . . . . . . . 42.9
Net earnings from continuing operations . . . . . . . . . . . . . . . . 1,107.4Total assets . . . . . . . . . . . . . . . . . . . . . . . . . . . . . . . . . . . . . . . 3,830.7 1,924.2 3,316.4 9,071.3Capital expenditures . . . . . . . . . . . . . . . . . . . . . . . . . . . . . . . . 83.0 43.4 4.9 131.3
Year ended December 31, 2008:Net sales . . . . . . . . . . . . . . . . . . . . . . . . . . . . . . . . . . . . . . . . . 3,967.5 2,750.7 — 6,718.2Interest and marketable securities income . . . . . . . . . . . . . . . — — 97.7 97.7Interest expense . . . . . . . . . . . . . . . . . . . . . . . . . . . . . . . . . . . — — (30.5) (30.5)Depreciation and amortization expense . . . . . . . . . . . . . . . . . 308.1 72.2 7.3 387.6Income taxes (credit) . . . . . . . . . . . . . . . . . . . . . . . . . . . . . . . 310.6 162.8 (27.8) 445.6Segment net earnings (loss) . . . . . . . . . . . . . . . . . . . . . . . . . . 760.4 471.2 (62.1) 1,169.5Less restructuring charges, net of income tax benefits . . . . . . (21.7)
Net earnings from continuing operations . . . . . . . . . . . . . . . . 1,147.8Total assets . . . . . . . . . . . . . . . . . . . . . . . . . . . . . . . . . . . . . . . 3,693.5 1,319.6 2,590.2 7,603.3Capital expenditures . . . . . . . . . . . . . . . . . . . . . . . . . . . . . . . . 95.3 52.1 7.8 155.2
Year ended December 31, 2007:Net sales . . . . . . . . . . . . . . . . . . . . . . . . . . . . . . . . . . . . . . . . . 3,587.3 2,413.2 — 6,000.5Interest and marketable securities income . . . . . . . . . . . . . . . — — 85.5 85.5Interest expense . . . . . . . . . . . . . . . . . . . . . . . . . . . . . . . . . . . — — (22.2) (22.2)Depreciation and amortization expense . . . . . . . . . . . . . . . . . 302.7 58.2 5.7 366.6Income taxes (credit) . . . . . . . . . . . . . . . . . . . . . . . . . . . . . . . 274.5 140.4 (24.4) 390.5Segment net earnings (loss) . . . . . . . . . . . . . . . . . . . . . . . . . . 646.7 403.3 (50.6) 999.4Less intangible asset impairment, net of income tax
benefit . . . . . . . . . . . . . . . . . . . . . . . . . . . . . . . . . . . . . . . . . (12.7)
Net earnings from continuing operations . . . . . . . . . . . . . . . . 986.7Total assets . . . . . . . . . . . . . . . . . . . . . . . . . . . . . . . . . . . . . . . 3,597.2 1,211.0 2,545.8 7,354.0Capital expenditures . . . . . . . . . . . . . . . . . . . . . . . . . . . . . . . . 126.7 52.2 8.8 187.7
67
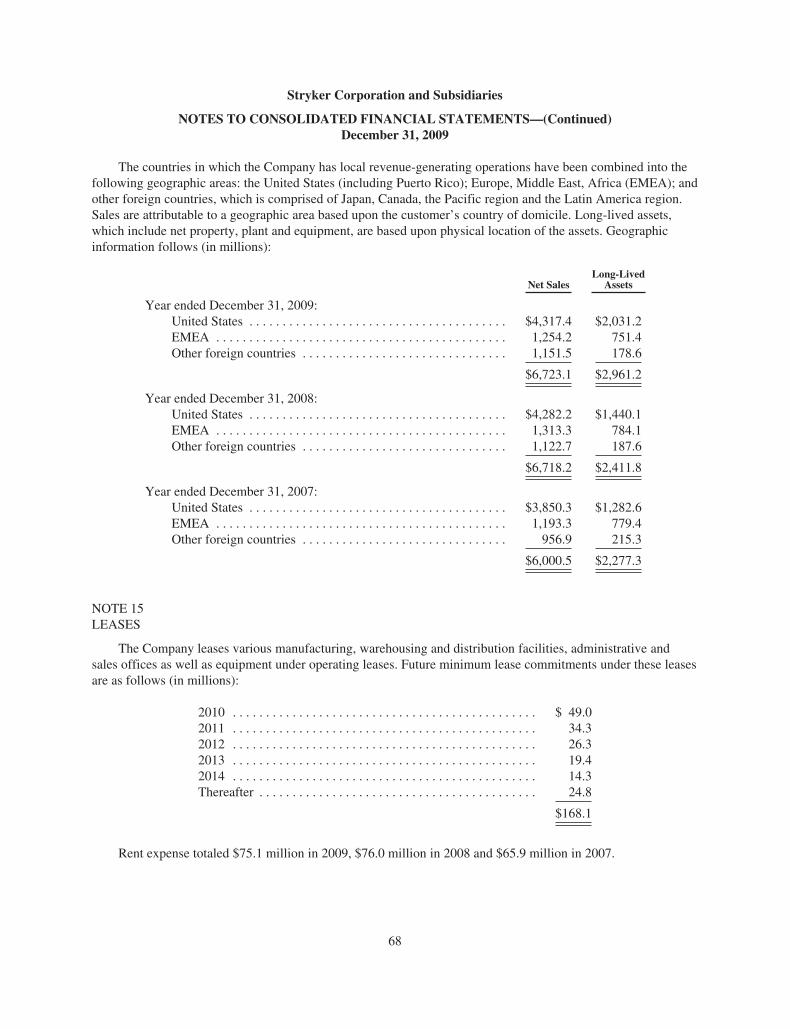
Stryker Corporation and Subsidiaries
NOTES TO CONSOLIDATED FINANCIAL STATEMENTS—(Continued)December 31, 2009
The countries in which the Company has local revenue-generating operations have been combined into thefollowing geographic areas: the United States (including Puerto Rico); Europe, Middle East, Africa (EMEA); andother foreign countries, which is comprised of Japan, Canada, the Pacific region and the Latin America region.Sales are attributable to a geographic area based upon the customer’s country of domicile. Long-lived assets,which include net property, plant and equipment, are based upon physical location of the assets. Geographicinformation follows (in millions):
Net SalesLong-Lived
Assets
Year ended December 31, 2009:United States . . . . . . . . . . . . . . . . . . . . . . . . . . . . . . . . . . . . . . . $4,317.4 $2,031.2EMEA . . . . . . . . . . . . . . . . . . . . . . . . . . . . . . . . . . . . . . . . . . . . 1,254.2 751.4Other foreign countries . . . . . . . . . . . . . . . . . . . . . . . . . . . . . . . 1,151.5 178.6
$6,723.1 $2,961.2
Year ended December 31, 2008:United States . . . . . . . . . . . . . . . . . . . . . . . . . . . . . . . . . . . . . . . $4,282.2 $1,440.1EMEA . . . . . . . . . . . . . . . . . . . . . . . . . . . . . . . . . . . . . . . . . . . . 1,313.3 784.1Other foreign countries . . . . . . . . . . . . . . . . . . . . . . . . . . . . . . . 1,122.7 187.6
$6,718.2 $2,411.8
Year ended December 31, 2007:United States . . . . . . . . . . . . . . . . . . . . . . . . . . . . . . . . . . . . . . . $3,850.3 $1,282.6EMEA . . . . . . . . . . . . . . . . . . . . . . . . . . . . . . . . . . . . . . . . . . . . 1,193.3 779.4Other foreign countries . . . . . . . . . . . . . . . . . . . . . . . . . . . . . . . 956.9 215.3
$6,000.5 $2,277.3
NOTE 15LEASES
The Company leases various manufacturing, warehousing and distribution facilities, administrative andsales offices as well as equipment under operating leases. Future minimum lease commitments under these leasesare as follows (in millions):
2010 . . . . . . . . . . . . . . . . . . . . . . . . . . . . . . . . . . . . . . . . . . . . . . $ 49.02011 . . . . . . . . . . . . . . . . . . . . . . . . . . . . . . . . . . . . . . . . . . . . . . 34.32012 . . . . . . . . . . . . . . . . . . . . . . . . . . . . . . . . . . . . . . . . . . . . . . 26.32013 . . . . . . . . . . . . . . . . . . . . . . . . . . . . . . . . . . . . . . . . . . . . . . 19.42014 . . . . . . . . . . . . . . . . . . . . . . . . . . . . . . . . . . . . . . . . . . . . . . 14.3Thereafter . . . . . . . . . . . . . . . . . . . . . . . . . . . . . . . . . . . . . . . . . . 24.8
$168.1
Rent expense totaled $75.1 million in 2009, $76.0 million in 2008 and $65.9 million in 2007.
68

Stryker Corporation and Subsidiaries
NOTES TO CONSOLIDATED FINANCIAL STATEMENTS—(Continued)December 31, 2009
NOTE 16CONTINGENCIES
In 2009 the Company received a subpoena from the Attorney General of New Jersey requesting variousdocuments related to the financial interests and arrangements of physicians participating in certain clinical trialsfor or on behalf of the Company. The Company is evaluating the scope of the subpoena and its response. TheAttorney General of New Jersey reportedly issued similar subpoenas to other major medical devicemanufacturing companies.
In 2009 a federal grand jury in the District of Massachusetts returned an indictment charging StrykerBiotech LLC and certain current and former employees of Stryker Biotech with wire fraud, conspiracy to defraudthe U.S. Food and Drug Administration (FDA), distribution of a misbranded device and false statements to theFDA. The Company still hopes to be able to reach a fair and just resolution of this matter. Conviction of thesecharges could result in significant monetary fines and Stryker Biotech’s exclusion from participating in federaland state health care programs, which could have a material affect on Stryker Biotech’s business. However, theultimate resolution of these matters is not reasonably estimatable at this time. The Company understands thatcertain former Stryker Biotech employees have pled guilty to charges in connection with this matter.
In 2009 the Company received a warning letter from the U.S. FDA related to compliance issues for one ofits craniomaxillofacial (CMF) implant products that was previously sold through its CMF distribution facility inPortage, Michigan. In 2008 the Company received a warning letter from the FDA related to quality systems andcompliance issues at its OP-1 implant manufacturing facility in Hopkinton, Massachusetts. In 2007 the Companyreceived two warning letters from the FDA regarding compliance with certain quality system specifications at itsreconstructive implant manufacturing facilities: one letter for its facility in Cork, Ireland and another for itsfacility in Mahwah, New Jersey. In October 2009, the FDA informed the Company that the warning letter relatedto its OP-1 implant manufacturing facility had been resolved following a productive reinspection earlier in 2009.The Company takes these matters very seriously and continues to fully cooperate with the FDA to address theirobservations at the other facilities.
In 2007 the Company announced that it reached a resolution with the U.S. Attorney’s office for the Districtof New Jersey in connection with a previously announced investigation relating to “any and all consultingcontracts, professional service agreements, or remuneration agreements between Stryker Corporation and anyorthopedic surgeon, orthopedic surgeon in training, or medical school graduate using or considering the surgicaluse of hip or knee joint replacement/reconstruction products manufactured or sold by Stryker Corporation.” Theresolution was in the form of a non-prosecution agreement for an 18-month period that ended on March 27, 2009.During the term of the agreement, the Company’s Orthopaedics subsidiary was subject to oversight by a federalmonitor, as appointed by the U.S. Attorney, regarding compliance with certain standards and procedures inconnection with the retention and payment of orthopaedic surgeon consultants related to reconstructive productsand the provision of certain benefits to such surgeons. Subsequent to entering into the non-prosecutionagreement, the U.S. Department of Health and Human Services, Office of Inspector General (HHS) issued a civilsubpoena to the Company in seeking to determine whether the Company violated various laws by payingconsulting fees and providing other things of value to orthopedic surgeons and healthcare and educationalinstitutions as inducements to use Stryker’s orthopedic medical devices in procedures paid for in whole or in partby Medicare. The Company produced numerous documents and other materials to HHS in response to thesubpoena and had been working with HHS to attempt to narrow the scope of the requested production. In 2008the U.S. Department of Justice and HHS sought judicial enforcement of the subpoena and a court agreed toenforce it in January 2009. At the same time, the U.S. District Court for the District of New Jersey dismissed theCompany’s complaint, which had asked the court to quash the subpoena and sought other appropriate relief onthe grounds that the subpoena was overbroad and oppressive.
69

Stryker Corporation and Subsidiaries
NOTES TO CONSOLIDATED FINANCIAL STATEMENTS—(Continued)December 31, 2009
In 2007 the Company disclosed that the U.S. SEC made an informal inquiry of the Company regardingpossible violations of the Foreign Corrupt Practices Act in connection with the sale of medical devices in certainforeign countries. Subsequently, in 2008, the Company received a subpoena from the U.S. Department of Justice,Criminal Division, requesting certain documents for the period since January 1, 2000 in connection with the U.S.SEC inquiry. The Company is fully cooperating with the U.S. Department of Justice and the U.S. SEC regardingthese matters.
Pursuant to certain of the Company’s credit and lease agreements, the Company has provided financialguarantees to third parties in the form of indemnification provisions. These provisions indemnify the third partiesfor costs, including but not limited to adverse judgments in lawsuits and the imposition of additional incometaxes due to either a change in the tax law or an adverse interpretation of the tax law. The terms of the guaranteesare equal to the terms of the related credit or lease agreements. The Company is not able to calculate themaximum potential amount of future payments it could be required to make under these guarantees, as anypotential payment is dependent on the occurrence of future unknown events (e.g., changes in U.S. or foreign taxlaws).
NOTE 17SUBSEQUENT EVENTS
On January 15, 2010, the Company sold $500.0 million of senior unsecured notes due January 15, 2015 (the“2015 Notes”) and $500.0 million of senior unsecured notes due January 15, 2020 (the “2020 Notes”). The 2015Notes will bear interest at 3.00% per year and, unless previously redeemed, will mature on January 15, 2015. The2020 Notes will bear interest at 4.375% per year and, unless previously redeemed, will mature on January 15,2020. The Company intends to use the net proceeds from the offering for working capital and other generalcorporate purposes, including acquisitions, stock repurchases and other business opportunities.
On January 15, 2010, a class action lawsuit against the Company was filed in the United States DistrictCourt for the Southern District of New York on behalf of those who purchased the Company’s common stockbetween January 25, 2007 and November 13, 2008, inclusive. The lawsuit seeks remedies under the SecuritiesExchange Act of 1934. The Company is evaluating the scope of the claim and intends to defend itself vigorously.
Pursuant to the Subsequent Events Topic of the FASB Codification, the Company evaluated subsequentevents after December 31, 2009 and concluded that no material transactions occurred subsequent to that date thatprovided additional evidence about conditions that existed at or after December 31, 2009 that require adjustmentto the Consolidated Financial Statements.
70

Stryker Corporation and Subsidiaries
SUMMARY OF QUARTERLY DATA (UNAUDITED)(in millions, except per share amounts)
2009 Quarter Ended 2008 Quarter Ended
Mar. 31 June 30 Sept. 30 Dec. 31 Mar. 31 June 30 Sept. 30 Dec. 31
Net sales . . . . . . . . . . . . . . . . . . . $1,601.3 $1,634.3 $1,653.3 $1,834.2 $1,634.4 $1,712.6 $1,653.0 $1,718.2Gross profit . . . . . . . . . . . . . . . . . 1,085.8 1,098.0 1,114.6 1,241.0 1,133.9 1,179.4 1,111.3 1,162.2Earnings before income taxes . . . 386.4 400.0 314.4 523.1 404.0 420.1 376.0 380.1Net earnings . . . . . . . . . . . . . . . . . 281.1 291.3 229.0 306.0 290.5 305.8 273.8 277.7
Net earnings per share ofcommon stock:
Basic . . . . . . . . . . . . . . . . . . 0.71 0.73 0.58 0.77 0.71 0.74 0.67 0.70Diluted . . . . . . . . . . . . . . . . . 0.71 0.73 0.57 0.76 0.70 0.73 0.66 0.69
Market price of common stock:High . . . . . . . . . . . . . . . . . . . 44.46 41.73 48.10 52.66 74.94 67.50 69.00 63.26Low . . . . . . . . . . . . . . . . . . . 30.96 32.34 37.14 42.74 58.45 61.22 60.50 35.38
The price quotations reported above were supplied by the New York Stock Exchange.
71

ITEM 9. CHANGES IN AND DISAGREEMENTS WITH ACCOUNTANTS ON ACCOUNTING ANDFINANCIAL DISCLOSURE.
Not applicable.
ITEM 9A. CONTROLS AND PROCEDURES.
Evaluation of Disclosure Controls and Procedures—An evaluation of the effectiveness of the Company’sdisclosure controls and procedures as of December 31, 2009 was carried out under the supervision and with theparticipation of the Company’s management, including the President and Chief Executive Officer and the VicePresident and Chief Financial Officer (the “Certifying Officers”). Based on that evaluation, the CertifyingOfficers concluded that the Company’s disclosure controls and procedures are effective.
Changes in Internal Control Over Financial Reporting—There was no change to the Company’s internalcontrol over financial reporting during the quarter ended December 31, 2009 that materially affected, or isreasonably likely to materially affect, the Company’s internal control over financial reporting.
Management’s Report on Internal Control Over Financial Reporting—The management of StrykerCorporation is responsible for establishing and maintaining adequate internal control over financial reporting, assuch term is defined in Exchange Act Rules 13a-15(f). Stryker Corporation’s internal control system wasdesigned to provide reasonable assurance to the Company’s management and Board of Directors regarding thepreparation and fair presentation of published financial statements.
Stryker Corporation’s management assessed the effectiveness of the Company’s internal control overfinancial reporting as of December 31, 2009. In making this assessment, it used the criteria set forth by theCommittee of Sponsoring Organizations of the Treadway Commission in Internal Control—IntegratedFramework. Based on that assessment, management believes that, as of December 31, 2009, the Company’sinternal control over financial reporting is effective.
Stryker Corporation’s independent registered public accounting firm, Ernst & Young LLP, has issued anattestation report on the effectiveness of the Company’s internal control over financial reporting. This reportappears on the following page.
Other Matters—The Company is in the process of implementing new Enterprise Resource Planning (ERP)systems at certain of its divisions. An ERP system is a fully-integrated set of programs and databases thatincorporate order processing, production planning and scheduling, purchasing, accounts receivable and inventorymanagement and accounting. The Company’s Europe division continues to transition to its new ERP system. Inconnection with this ERP system implementation, the Company will update its internal controls over financialreporting, as necessary, to accommodate modifications to its business processes and accounting procedures. TheCompany does not believe that this ERP system implementation will have an adverse effect on the Company’sinternal control over financial reporting.
72

REPORT OF INDEPENDENT REGISTERED PUBLIC ACCOUNTING FIRM ON INTERNAL CONTROLOVER FINANCIAL REPORTING
The Board of Directors and Shareholders of Stryker Corporation:
We have audited Stryker Corporation and subsidiaries’ internal control over financial reporting as ofDecember 31, 2009, based on criteria established in Internal Control—Integrated Framework issued by theCommittee of Sponsoring Organizations of the Treadway Commission (the COSO criteria). StrykerCorporation’s management is responsible for maintaining effective internal control over financial reporting andfor its assessment of the effectiveness of internal control over financial reporting included in the accompanyingManagement’s Report on Internal Control over Financial Reporting. Our responsibility is to express an opinionon the Company’s internal control over financial reporting based on our audit.
We conducted our audit in accordance with the standards of the Public Company Accounting OversightBoard (United States). Those standards require that we plan and perform the audit to obtain reasonable assuranceabout whether effective internal control over financial reporting was maintained in all material respects. Ouraudit included obtaining an understanding of internal control over financial reporting, assessing the risk that amaterial weakness exists, testing and evaluating the design and operating effectiveness of internal control basedon the assessed risk, and performing such other procedures as we considered necessary in the circumstances. Webelieve that our audit provides a reasonable basis for our opinion.
A company’s internal control over financial reporting is a process designed to provide reasonable assuranceregarding the reliability of financial reporting and the preparation of financial statements for external purposes inaccordance with generally accepted accounting principles. A company’s internal control over financial reportingincludes those policies and procedures that (1) pertain to the maintenance of records that, in reasonable detail,accurately and fairly reflect the transactions and dispositions of the assets of the company; (2) provide reasonableassurance that transactions are recorded as necessary to permit preparation of financial statements in accordancewith generally accepted accounting principles, and that receipts and expenditures of the company are being madeonly in accordance with authorizations of management and directors of the company; and (3) provide reasonableassurance regarding prevention or timely detection of unauthorized acquisition, use, or disposition of thecompany’s assets that could have a material effect on the financial statements.
Because of its inherent limitations, internal control over financial reporting may not prevent or detectmisstatements. Also, projections of any evaluation of effectiveness to future periods are subject to the risk thatcontrols may become inadequate because of changes in conditions, or that the degree of compliance with thepolicies or procedures may deteriorate.
In our opinion, Stryker Corporation and subsidiaries maintained, in all material respects, effective internalcontrol over financial reporting as of December 31, 2009, based on the COSO criteria.
We also have audited, in accordance with the standards of the Public Company Accounting Oversight Board(United States), the consolidated balance sheets of Stryker Corporation and subsidiaries as of December 31, 2009and 2008, and the related consolidated statements of earnings, shareholders’ equity, and cash flows for each ofthe three years in the period ended December 31, 2009 of Stryker Corporation and subsidiaries, and our reportdated February 26, 2010 expressed an unqualified opinion thereon.
/s/ ERNST & YOUNG LLP
Grand Rapids, MichiganFebruary 26, 2010
73

ITEM 9B. OTHER INFORMATION.
Not applicable.
PART III
ITEM 10. DIRECTORS, EXECUTIVE OFFICERS AND CORPORATE GOVERNANCE.
Information regarding the directors of the Company and certain corporate governance and other mattersappearing under the captions “Information About the Board of Directors and Corporate Governance Matters,”“Proposal 1—Election of Directors,” “Audit Committee” and “Additional Information—Section 16(a) BeneficialOwnership Reporting Compliance” in the 2010 proxy statement is incorporated herein by reference.
Information regarding the executive officers of the Company appears below. All officers are appointedannually. Reported ages are as of January 31, 2010.
Stephen P. MacMillan, age 46, was appointed President and Chief Operating Officer of the Company inJune 2003 and Chief Executive Officer as of January 1, 2005. He was also appointed Chairman of the Board onJanuary 1, 2010. Prior to joining the Company, he was most recently Sector Vice President, Global SpecialtyOperations for Pharmacia Corporation, which he joined in 1999. Prior to Pharmacia, he spent 11 years atJohnson & Johnson (“J&J”), most recently as President of Johnson & Johnson-Merck ConsumerPharmaceuticals, a joint venture between J&J and Merck. Prior to joining J&J, he held various marketingpositions at Procter & Gamble.
Lonny J. Carpenter, age 48, was appointed Group President, Global Quality and Operations in September2009 and was the Group President, Instruments and Medical since November 2008. He had previously beenPresident, Stryker Medical since May 2008 and Vice President and General Manager, Stryker Medical since2006. After joining the Company in 1989, Mr. Carpenter held various roles of increasing responsibility at StrykerInstruments before being promoted to Vice President, Global Operations, Stryker Instruments in 2004.
Andrew G. Fox-Smith, age 44, was appointed Group President, International in January 2008. He hadpreviously been President, Pacific since 2005, Vice President and General Manager, Stryker Pacific since 2001and Managing Director, UK/Ireland/South Africa since 1999. Prior to the acquisition of Howmedica in 1998, heheld various sales positions with the Howmedica division of Pfizer since 1994.
Curtis E. Hall, age 53, was appointed Vice President and General Counsel of the Company in June 2004. Hehad previously been General Counsel for the Company since 1994. Prior to joining the Company, he was apartner in the Michigan law firm of Miller, Canfield, Paddock and Stone, an Assistant United States Attorney inWashington, D.C. and an Assistant District Attorney in New York City.
Curt R. Hartman, age 46, was appointed Vice President and Chief Financial Officer in April 2009 and wasthe Vice President, Finance of the Company since November 2008. He had previously been President, StrykerGlobal Instruments since 2006 and President, Stryker Instruments since 2003. After joining the Company in1990, Mr. Hartman held several functional leadership roles at Stryker Instruments before being promoted to VicePresident and General Manager, Stryker Instruments in 1999.
Tony M. McKinney, age 40, was appointed Vice President, Chief Accounting Officer in November 2008.He had previously been the Vice President, Finance, International Group since 2006 and Group Controller,International Group since 2004. After joining the Company in 1995, Mr. McKinney held various roles ofincreasing responsibility in the Corporate Accounting department before becoming the Director, Finance for theJapan Division in 2002. Prior to joining the Company in 1995, Mr. McKinney was an Audit Senior Accountantwith Ernst & Young LLP.
74

Michael P. Mogul, age 45, was appointed Group President, Orthopaedics in September 2009. He hadpreviously been President, Stryker Orthopaedics since 2005 and Managing Director of Stryker’s businesses inGermany, Austria and Switzerland since 2000. After joining the Company in 1989, Mr. Mogul held various rolesof increasing responsibility at Stryker Instruments before being promoted to Vice President of Sales for the nowOrthopaedics division in 1994.
Katherine Owen, age 39, was appointed Vice President, Strategy and Investor Relations in February 2007.Prior to joining the Company, she served as a medical technology analyst at Merrill Lynch. Prior to that she helda similar position at Cowen & Co./SG Cowen and had been a corporate lending analyst at State Street Bank.
Michael W. Rude, age 48, was appointed Vice President, Human Resources of the Company in July 2000.Prior to joining the Company, he served as Vice President of Human Resources for the SCIMED Division ofBoston Scientific Corporation. Prior to that he held various positions as Vice President, Human Resources withinThe Dun & Bradstreet Corporation and spent eight years in various Human Resources positions at BaxterInternational, Inc.
Timothy J. Scannell, age 45, was appointed Group President, MedSurg and Spine in September 2009 andwas Group President, Spine and Endoscopy since November 2008. He had previously been President, StrykerSpine since 2005 and Vice President and General Manager, Stryker Spine since 2003. After joining the Companyin 1990, Mr. Scannell held a variety of leadership roles at Stryker Endoscopy before being promoted to VicePresident and General Manager, Stryker Biotech in 2001.
The Corporate Governance Guidelines adopted by the Company’s Board of Directors, as well as the chartersof each of the Audit Committee, the Governance and Nominating Committee, the Compensation Committee andthe Code of Ethics applicable to the principal executive officer, principal financial officer and principalaccounting officer or controller or persons performing similar functions is available, free of charge, under the“Investors—Corporate Governance” section of the Company’s website at www.stryker.com. Print copies of suchdocuments are available, free of charge, upon written request sent to the Secretary of the Company at 2825Airview Boulevard, Kalamazoo, Michigan 49002.
ITEM 11. EXECUTIVE COMPENSATION.
Information regarding the compensation of the management of the Company appearing under the captions“Compensation Discussion and Analysis,” “Compensation Committee Report,” “Executive Compensation” and“Compensation of Directors” in the 2010 proxy statement is incorporated herein by reference.
75

ITEM 12. SECURITY OWNERSHIP OF CERTAIN BENEFICIAL OWNERS AND MANAGEMENTAND RELATED STOCKHOLDER MATTERS.
The information under the caption “Stock Ownership” in the 2010 proxy statement is incorporated herein byreference.
At December 31, 2009, the Company had key employee and director stock option plans under which optionsare granted at a price not less than fair market value at the date of grant. These stock option plans werepreviously submitted to and approved by the Company’s shareholders. Additional information regarding theCompany’s stock option plans appears in Note 1 and Note 10 to the Consolidated Financial Statements in Item 8of this report. At December 31, 2009, the Company also had a stock performance incentive award programpursuant to which shares of the Company’s Common Stock have been and may be issued to certain employeeswith respect to performance in any calendar year through December 31, 2013. The status of these plans as ofDecember 31, 2009 follows:
Plan category
Number of shares of CommonStock to be issued upon
exercise of outstanding options,warrants and rights
Weighted-averageexercise price of
outstanding options,warrants and rights
Number of shares of CommonStock remaining available forfuture issuance under equity
compensation plans (excludingshares reflected in the first column)
Equity compensation plansapproved by shareholders . . . 26,307,289 $45.69 19,978,560
ITEM 13. CERTAIN RELATIONSHIPS AND RELATED TRANSACTIONS, AND DIRECTORINDEPENDENCE.
The information under the caption “Information About the Board of Directors and Corporate GovernanceMatters—Independent Directors” and “Information About the Board of Directors and Corporate GovernanceMatters—Certain Relationships and Related Party Transactions” in the 2010 proxy statement is incorporatedherein by reference.
ITEM 14. PRINCIPAL ACCOUNTING FEES AND SERVICES.
The information under the caption “Proposal 2—Ratification of Appointment of Our IndependentRegistered Public Accounting Firm—Relationship with Ernst & Young LLP” in the 2010 proxy statement isincorporated herein by reference.
76

PART IV
ITEM 15. EXHIBITS, FINANCIAL STATEMENT SCHEDULES.
(a) 1. Financial Statements
The following Consolidated Financial Statements of the Company and its subsidiaries are set forthin Part II, Item 8 of this report.
Report of Independent Registered Public Accounting Firm on Financial Statements . . . . . . . . . . 35Consolidated Balance Sheets as of December 31, 2009 and 2008 . . . . . . . . . . . . . . . . . . . . . . . . . 36Consolidated Statements of Earnings for the Years Ended December 31, 2009, 2008 and
2007 . . . . . . . . . . . . . . . . . . . . . . . . . . . . . . . . . . . . . . . . . . . . . . . . . . . . . . . . . . . . . . . . . . . . . . 37Consolidated Statements of Shareholders’ Equity for the Years Ended December 31, 2009,
2008 and 2007 . . . . . . . . . . . . . . . . . . . . . . . . . . . . . . . . . . . . . . . . . . . . . . . . . . . . . . . . . . . . . . . 38Consolidated Statements of Cash Flows for the Years Ended December 31, 2009, 2008 and
2007 . . . . . . . . . . . . . . . . . . . . . . . . . . . . . . . . . . . . . . . . . . . . . . . . . . . . . . . . . . . . . . . . . . . . . . 39Notes to Consolidated Financial Statements . . . . . . . . . . . . . . . . . . . . . . . . . . . . . . . . . . . . . . . . . 40
(a) 2. Financial Statement Schedules
The consolidated financial statement schedule (Schedule II) of the Company and its subsidiaries hasbeen submitted as a separate section of this report following the signature page. All other schedulesfor which provision is made in the applicable accounting regulation of the U.S. Securities andExchange Commission are not required under the related instructions or are inapplicable and,therefore, have been omitted.
(a) 3. Exhibits
A list of exhibits required to be filed as part of this report is set forth in the Exhibit Index, whichimmediately precedes such exhibits, and is incorporated herein by reference.
(c) Financial Statement Schedules
The consolidated financial statement schedule (Schedule II) of the Company and its subsidiaries hasbeen submitted as a separate section of this report following the signature page. All other schedulesfor which provision is made in the applicable accounting regulation of the U.S. Securities andExchange Commission are not required under the related instructions or are inapplicable and,therefore, have been omitted.
77

SIGNATURES
Pursuant to the requirements of Section 13 or 15(d) of the Securities Exchange Act of 1934, the registranthas duly caused this report to be signed on its behalf by the undersigned, thereunto duly authorized.
STRYKER CORPORATION
Date: February 26, 2010 /s/ CURT R. HARTMAN
Curt R. Hartman, Vice President andChief Financial Officer
Pursuant to the requirements of the Securities Exchange Act of 1934, this report has been signed below bythe following persons on behalf of the registrant and in the capacities and on the dates indicated.
/s/ STEPHEN P. MACMILLAN /s/ CURT R. HARTMAN
Stephen P. MacMillan, Chairman, President andChief Executive Officer(Principal Executive Officer)
Curt R. Hartman, Vice President andChief Financial Officer(Principal Financial Officer)
/s/ TONY M. MCKINNEY
Tony M. McKinney, Vice President,Chief Accounting Officer(Principal Accounting Officer)
/s/ HOWARD E. COX, JR. /s/ SRIKANT M. DATAR
Howard E. Cox, Jr.—Director Srikant M. Datar, Ph.D.—Director
/s/ DONALD M. ENGELMAN /s/ LOUISE L. FRANCESCONI
Donald M. Engelman, Ph.D.—Director Louise L. Francesconi—Director
/s/ HOWARD L. LANCE /s/ WILLIAM U. PARFET
Howard L. Lance—Director William U. Parfet—Director
/s/ RONDA E. STRYKER
Ronda E. Stryker—Director
78

SCHEDULE II—VALUATION AND QUALIFYING ACCOUNTSSTRYKER CORPORATION AND SUBSIDIARIES
Column A Column B Column C Column D Column E Column F
Additions Deductions
Description
Balance atBeginningof Period
Charged toCosts &
Expenses Describe (a) Describe (b)
Balanceat End
of Period
DEDUCTED FROM ASSET ACCOUNTSAllowance for Doubtful Accounts (in millions):Year ended December 31, 2009 . . . . . . . . . . . . . . . . . $44.5 $27.9 $ 6.6 $(0.5) $66.3
Year ended December 31, 2008 . . . . . . . . . . . . . . . . . $44.5 $10.4 $10.2 $ 0.2 $44.5
Year ended December 31, 2007 . . . . . . . . . . . . . . . . . $41.8 $ 7.3 $ 5.4 $(0.8) $44.5
(a) Uncollectible amounts written off, net of recoveries.(b) Effect of changes in foreign exchange rates.
79

FORM 10-K—ITEM 15(a) 3. and ITEM 15(c)STRYKER CORPORATION AND SUBSIDIARIES
EXHIBIT INDEX
Exhibit 1— Underwriting Agreements(i) Underwriting Agreement, dated January 12, 2010, between Stryker Corporation and Banc of
America Securities LLC, Barclays Capital Inc. and Wells Fargo Securities, LLC, asrepresentatives of the underwriters named therein—Incorporated by reference to Exhibit 1.1 tothe Company’s Form 8-K dated January 15, 2010 (Commission File No. 000-09165).
Exhibit 3— Articles of Incorporation and By-Laws(i) Composite copy of Restated Articles of Incorporation as amended through April 19, 2000—
Incorporated by reference to Exhibit 3(i) to the Company’s Form 10-K for the year endedDecember 31, 2000 (Commission File No. 000-09165).
(ii) Certificate of Amendment of Restated Articles of Incorporation dated June 4, 2004—Incorporated by reference to Exhibit 3(i) to the Company’s Form 10-Q for the quarter endedJune 30, 2004 (Commission File No. 000-09165).
(iii) By-Laws—Incorporated by reference to Exhibit 3(ii) to the Company’s Form 8-K datedOctober 28, 2008 (Commission File No. 000-09165).
Exhibit 4— Instruments defining the rights of security holders, including indentures—The Company agreesto furnish to the Commission upon request a copy of each instrument pursuant to which long-term debt of the Company and its subsidiaries not exceeding 10% of the total assets of theCompany and its consolidated subsidiaries is authorized.
(i) Form of $1 billion Five-Year Credit Agreement, dated as of November 18, 2005, among theCompany and the Agents and other Lenders party thereto—Incorporated by reference toExhibit 10.1 to the Company’s Form 8-K dated November 23, 2005 (Commission FileNo. 000-09165).
(ii) Indenture, dated January 15, 2010, between Stryker Corporation and U.S. Bank NationalAssociation.—Incorporated by reference to Exhibit 4.1 to the Company’s Form 8-K datedJanuary 15, 2010 (Commission File No. 000-09165).
(iii) First Supplemental Indenture (including the form of 2015 note), dated January 15, 2010,between Stryker Corporation and U.S. Bank National Association.—Incorporated by referenceto Exhibit 4.2 to the Company’s Form 8-K dated January 15, 2010 (Commission FileNo. 000-09165).
(iv) Second Supplemental Indenture (including the form of 2020 note), dated January 15, 2010,between Stryker Corporation and U.S. Bank National Association.—Incorporated by referenceto Exhibit 4.3 to the Company’s Form 8-K dated January 15, 2010 (Commission FileNo. 000-09165).
Exhibit 10— Material contracts(i)* 2006 Long-Term Incentive Plan (as amended effective July 23, 2008)—Incorporated by
reference to Exhibit 10.1 to the Company’s Form 10-Q for the quarter ended June 30, 2008(Commission File No. 000-09165).
(ii)* Form of grant notice and terms and conditions for stock options granted under the 2006 Long-Term Incentive Plan.
(iii)* Form of grant notice and terms and conditions for restricted stock units granted under the 2006Long-Term Incentive Plan.
(iv)* 1998 Stock Option Plan (as Amended Effective July 23, 2008)—Incorporated by reference toExhibit 10.2 to the Company’s Form 10-Q for the quarter ended June 30, 2008 (CommissionFile No. 000-09165).
(v)* Supplemental Savings and Retirement Plan (as Amended Effective January 1, 1996)—Incorporated by reference to Exhibit 10(iii) to the Company’s Form 10-K for the year endedDecember 31, 1994 (Commission File No.000-09165).
80

(vi)* Stock option agreement relating to special stock option award to Stephen P. MacMillanpursuant to the 1998 Stock Option Plan on February 7, 2006—Incorporated by reference toExhibit 10.3 to the Company’s Form 8-K dated February 9, 2006 (Commission FileNo. 000-09165).
(vii)* Statement of Terms Relating to Employment dated as of December 4, 1998 between StrykerUK Limited and Andrew G. Fox-Smith as amended and restated through February 9, 2009—Incorporated by reference to Exhibit 10 (x) to the Company’s Form 10-K for the year endedDecember 31, 2008 (Commission File No. 000-09165).
(viii)* Executive Management Agreement dated as of December 2, 2008 between Dean H. Bergyand Stryker Corporation—Incorporated by reference to Exhibit 10 (xii) to the Company’sForm 10-K for the year ended December 31, 2008 (Commission File No. 000-09165).
(ix)* Stryker Corporation Executive Bonus Plan—Incorporated by reference to Exhibit 10.1 to theCompany’s Form 8-K dated February 21, 2007 (Commission File No. 000-09165).
(x) Form of Indemnification Agreement for Directors—Incorporated by reference to Exhibit 10(xiv) to the Company’s Form 10-K for the year ended December 31, 2008 (Commission FileNo. 000-09165).
(xi) Form of Indemnification Agreement for Certain Officers—Incorporated by reference toExhibit 10 (xv) to the Company’s Form 10-K for the year ended December 31, 2008(Commission File No. 000-09165).
Exhibit 11— Statement re: computation of per share earnings(i) Note 11 to the Consolidated Financial Statements in Item 8 of this report.
Exhibit 21— Subsidiaries of the registrant(i) List of Subsidiaries.
Exhibit 23— Consent of experts and counsel(i) Consent of Independent Registered Public Accounting Firm.
Exhibit 31— Rule 13a-14(a) Certifications(i) Certification of Principal Executive Officer of Stryker Corporation.
(ii) Certification of Principal Financial Officer of Stryker Corporation.
Exhibit 32— 18 U.S.C. Section 1350 Certifications(i)** Certification by President and Chief Executive Officer of Stryker Corporation.
(ii)** Certification by Vice President and Chief Financial Officer of Stryker Corporation.
Exhibit 99— Additional exhibits(i)* 2008 Employee Stock Purchase Plan as amended on February 10, 2009—Incorporated by
reference to Exhibit 99 (i) to the Company’s Form 10-K for the year ended December 31,2008 (Commission File No. 000-09165).
Exhibit 101— XBRL (Extensible Business Reporting Language) Documents101.INS** XBRL Instance Document
101.SCH** XBRL Schema Document101.CAL** XBRL Calculation Linkbase Document101.DEF** XBRL Definition Linkbase Document101.LAB** XBRL Label Linkbase Document101.PRE** XBRL Presentation Linkbase Document
* compensation arrangement** furnished with this Form 10-K
81
