student and graduate profiles - collegesontario.org · • twenty-eight per cent of graduates...
TRANSCRIPT
2011 E n v i r o n m E n t a l S c a n 2011
Student and Graduate profiles

2 0 1 1 E n v i r o n m E n t a l S c a n • c o l l E g E S o n t a r i o Student and graduate profiles 1
3.0 Highlights . . . . . . . . . . . . . . . . . . . . . . . . . . . .2
3.1 College activity . . . . . . . . . . . . . . . . . . . . . . 3
3.2 Numbers of Ontario college applicants,
students and graduates . . . . . . . . . . . . . . .4
Applicants . . . . . . . . . . . . . . . . . . . . . . . . . . . . . . 4
Students . . . . . . . . . . . . . . . . . . . . . . . . . . . . . . . 5
Postsecondary funded enrolment . . . . . 5
Collaborative nursing students . . . . . . . 7
International students . . . . . . . . . . . . . . . . 8
Graduates . . . . . . . . . . . . . . . . . . . . . . . . . . . . . 10
3.3 Learner demographics and
characteristics . . . . . . . . . . . . . . . . . . . . . . . 12
Level of education . . . . . . . . . . . . . . . . . . . . . 14
Household income . . . . . . . . . . . . . . . . . . . . . 16
Population of applicant communities . . . 17
Aboriginal status . . . . . . . . . . . . . . . . . . . . . . 18
Students with disabilities . . . . . . . . . . . . . . 19
Main goals . . . . . . . . . . . . . . . . . . . . . . . . . . . . . 21
3.4 Apprentices . . . . . . . . . . . . . . . . . . . . . . . . . 23
3.5 Continuing education students . . . . . . 29
3.6 Graduates . . . . . . . . . . . . . . . . . . . . . . . . . . .31
3.7 Perceptions . . . . . . . . . . . . . . . . . . . . . . . . . 39
Students . . . . . . . . . . . . . . . . . . . . . . . . . . . . . . 39
Graduates . . . . . . . . . . . . . . . . . . . . . . . . . . . . . 40
3.8 Key performance indicators:
Students and graduates . . . . . . . . . . . . . .42
3.9 Notes on data sources . . . . . . . . . . . . . . . 45
tablE of contEntS
Student and Graduate profiles 2011

2 0 1 1 E n v i r o n m E n t a l S c a n • c o l l E g E S o n t a r i o Student and graduate profiles 2
• Each year, approximately 600,000 students and clients are served by Ontario’s Colleges of
Applied Arts and Technology (CAATs) . Of the 600,000, more than 200,000 are full-time students .
• There were 194,567 distinct applicants for the 2009-10 academic year, representing an
11 .3 per cent increase over 2008-09 .
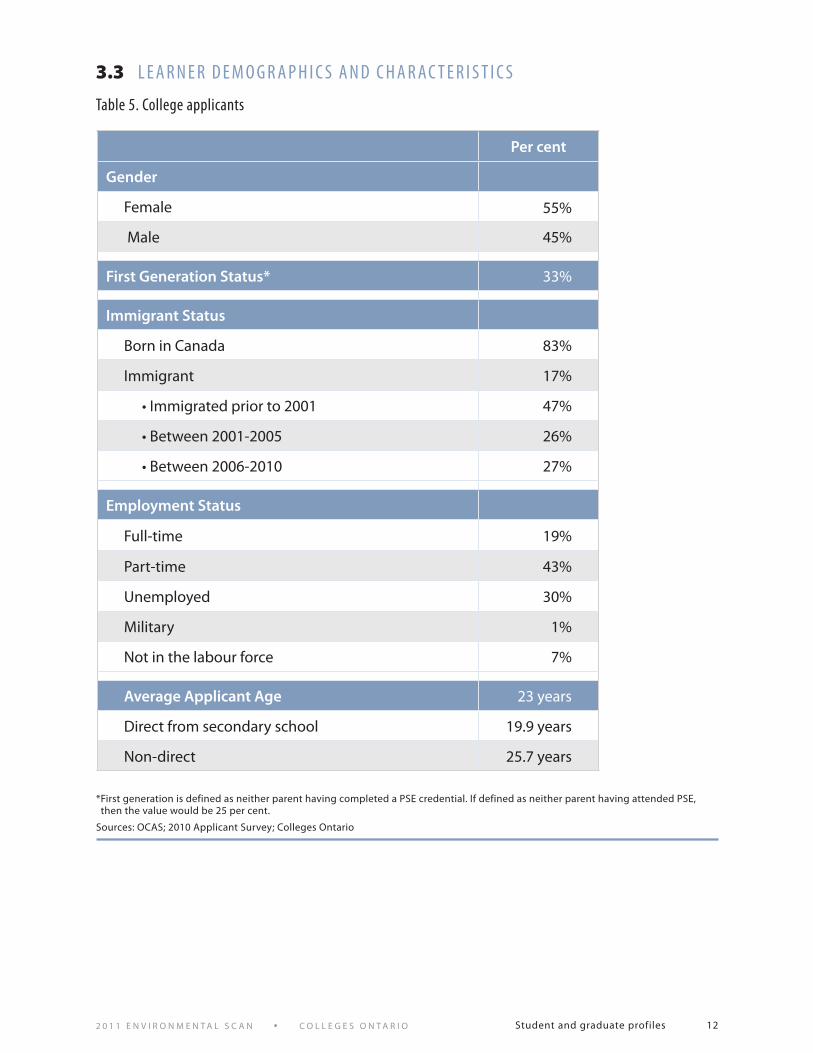
• Seventeen per cent of surveyed college applicants were not born in Canada; 26 per cent of these
individuals came to Canada between 2001 and 2005, while another 27 per cent arrived since 2006 .
• Over one-quarter of college applicants reported a household income of less than $30,000,
and 54 per cent had incomes less than $60,000 .
• Total funded full-time equivalent (FTE) postsecondary enrolment in the colleges was 205,203
(including funded full-time, part-time and tuition short programs) .
• Almost 15,000 international students were enrolled in Ontario colleges in 2010, representing
a 48 per cent increase over 2009 .
• Twelve per cent of Ontario college students indicated use of “Special Needs/Disability Services,”
half of whom reported high usage .
• Colleges delivered approximately 90 per cent of the apprenticeship “in-school” training in 2009-10 .
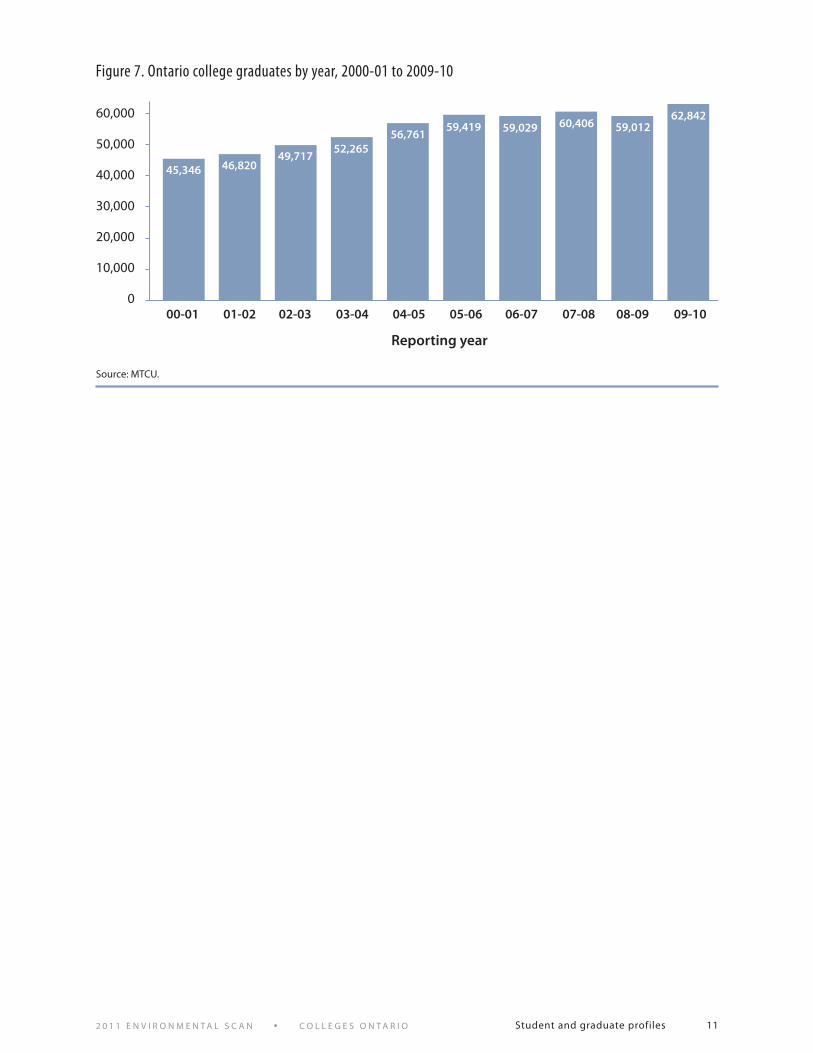
• Over the last five years, Ontario colleges have graduated approximately 60,000 individuals per year
from postsecondary programs .
• Eighty-three per cent of 2009-10 graduates in the labour force were working six months
after graduation .
• Twenty-eight per cent of graduates continued their education with full- or part-time studies
within six months of graduation .
3.0 H i g H l i g H t S
Student and Graduate profiles

2 0 1 1 E n v i r o n m E n t a l S c a n • c o l l E g E S o n t a r i o Student and graduate profiles 3
• Learners at Ontario colleges comprise a diverse population . In addition to traditional
postsecondary education, colleges offer many other types of programs and courses,
including apprenticeship training, continuing education courses, collaborative programs
with universities, and literacy and basic skills programs .
3.1 c o l l E g E a c t i v i t y
Sources: MTCU; OCAS; CSES; Continuing Education Surveys; Colleges Ontario
Employment counseling
Other
Apprenticeship
Collaborativediploma/degree(includes nursing)
Tuition short & college board approved
Full time PSE
Part-time(Non-funded)
Part-time(Funded)
figure 1. relative distribution of learners/clients served by ontario’s colleges

2 0 1 1 E n v i r o n m E n t a l S c a n • c o l l E g E S o n t a r i o Student and graduate profiles 4
*Distinct applicants for fall/winter/spring
Direct = applicants applying directly from high school (for OCAS applicant data, this category includes school board-run adult day schools)
Non-direct = applicants not applying directly from high school
** Not final, as the cycle is not complete . To date, April 2011 . Source: OCAS
table 1. Per cent of caat applicants* direct from secondary school vs. non-direct by year
3.2 n u m b E r S o f o n ta r i o co l l E g E a P P l i c a n t S , S t u d E n t S a n d g r a d u at E S
A p p l i c A n t s
figure 2. ontario fall 2010 postsecondary entrants by sector
• A majority (57 per cent) of fall 2010 new entrants to PSE in Ontario enrolled in a college .
Year
Direct Non-direct
TotalNumber % of total Number % of total
2002-03 64,761 40 .4% 95,681 59 .6% 160,442
2003-04 68,762 41 .2% 98,082 58 .8% 166,844
2004-05 61,389 38 .6% 97,663 61 .4% 159,052
2005-06 60,289 38 .9% 94,596 61 .1% 154,885
2006-07 60,225 38 .6% 95,743 61 .4% 155,968
2007-08 64,952 39 .5% 99,652 60 .5% 164,604
2008-09 68,056 38 .9% 106,776 61 .1% 174,832
2009-10 70,970 36 .5% 123,597 63 .5% 194,567
2010-11** 72,991 36 .8% 125,170 63 .2% 198,161
Note: University and college data include first-year full-time undergraduate headcounts for fall 2010 . Significant numbers of students also enrol in colleges during the winter and spring intake periods, not shown in the above figure . New full-time CAAT apprentices planned for 2010-11 are included with the college data .
Sources: MTCU; OCAS
0 10 20 30 40 50 60 70
Per cent
43%
57%
University
College

2 0 1 1 E n v i r o n m E n t a l S c a n • c o l l E g E S o n t a r i o Student and graduate profiles 5
s t u d e n t s
postsecondary funded enrolment
* FTE = full-time equivalent; FT = full time; PT = part time; TS = tuition short (typically, these programs are less than 52 weeks in duration) Note that funded students do not comprise the total college population .
Source: MTCU .
220,000
200,000
180,000
160,000
140,000
120,000
100,000
80,000
60,000
40,000
20,000
0
00-01 01-02 02-03 03-04 04-05 05-06 06-07 07-08 08-09 09-10
Total FTE
FTE-FT
FTE-PT
FTE-TS
figure 3. funded college enrolment as ftE* from 2000-01 to 2009-10

2 0 1 1 E n v i r o n m E n t a l S c a n • c o l l E g E S o n t a r i o Student and graduate profiles 6
* FTE = full-time equivalent; FT = full time; PT = part time; TS = tuition short Note that funded students do not comprise the total college population .
Source: MTCU .
table 2. total funded college enrolment as ftE* by college, 2009-10
College 2009-10 FTE
Algonquin 16,236 .4
Collège Boréal 1,585 .7
Cambrian 3,658 .9
Canadore 2,904 .8
Centennial 10,851 .2
Confederation 3,293 .9
Conestoga 8,755 .2
Durham 7,869 .1
Fanshawe 13,851 .9
Fleming 6,297 .0
Georgian 8,468 .4
George Brown 19,124 .5
Humber 18,878 .2
La Cité collégiale 4,009 .2
Lambton 2,713 .3
Loyalist 3,518 .2
Mohawk 11,617 .4
Niagara 7,608 .9
Northern 1,383 .9
Sault 2,189 .3
Seneca 20,481 .1
Sheridan 16,024 .2
St . Lawrence 5,698 .0
St . Clair 8,184 .2
Total 205,202 .9
2 0 1 1 E n v i r o n m E n t a l S c a n • c o l l E g E S o n t a r i o Student and graduate profiles 7
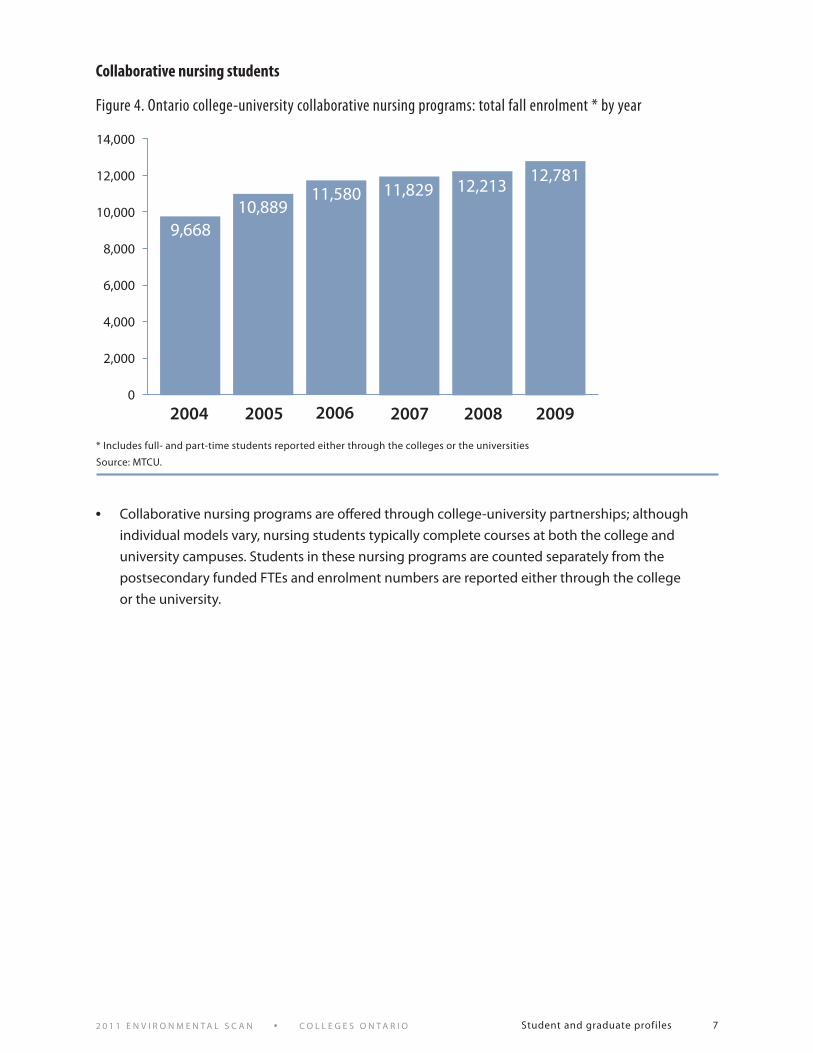
• Collaborative nursing programs are offered through college-university partnerships; although
individual models vary, nursing students typically complete courses at both the college and
university campuses . Students in these nursing programs are counted separately from the
postsecondary funded FTEs and enrolment numbers are reported either through the college
or the university .
collaborative nursing students
* Includes full- and part-time students reported either through the colleges or the universities
Source: MTCU .
2004 2005 2006 2007 2008 2009
14,000
12,000
10,000
8,000
6,000
4,000
2,000
0
9,66810,889
11,580 11,829 12,21312,781
figure 4. ontario college-university collaborative nursing programs: total fall enrolment * by year
2 0 1 1 E n v i r o n m E n t a l S c a n • c o l l E g E S o n t a r i o Student and graduate profiles 8
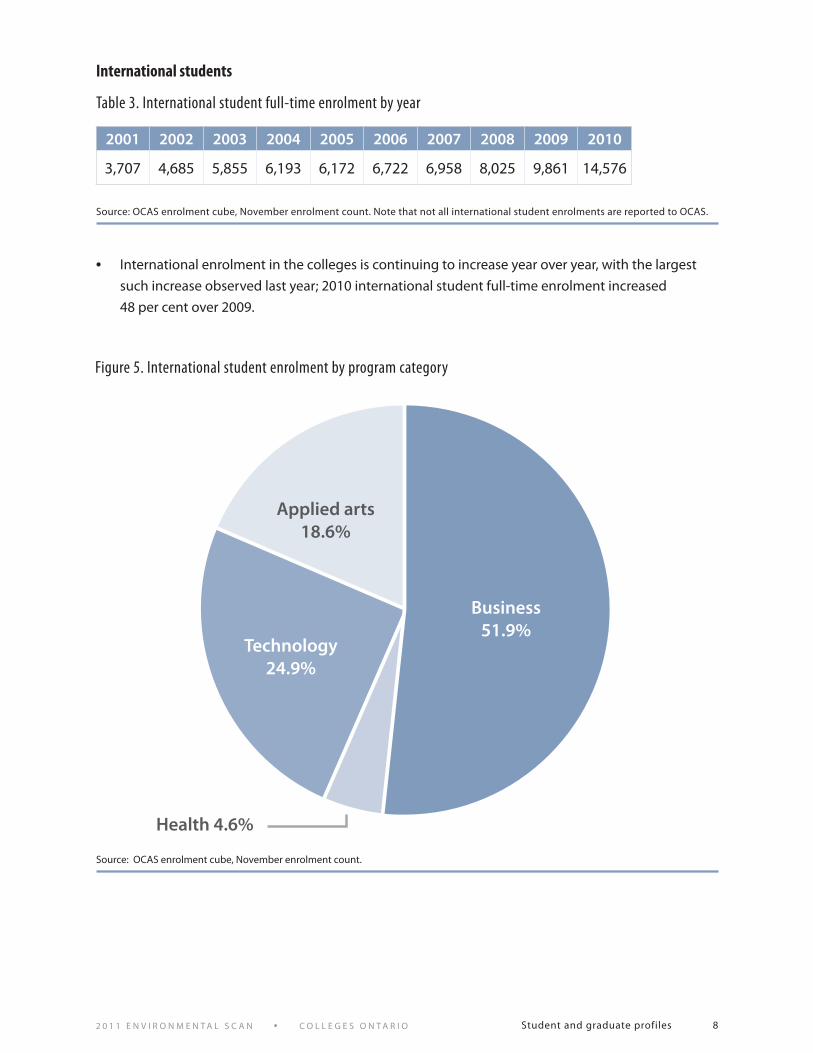
figure 5. international student enrolment by program category
• International enrolment in the colleges is continuing to increase year over year, with the largest
such increase observed last year; 2010 international student full-time enrolment increased
48 per cent over 2009 .
international students
Source: OCAS enrolment cube, November enrolment count . Note that not all international student enrolments are reported to OCAS .
Source: OCAS enrolment cube, November enrolment count .
table 3. international student full-time enrolment by year
Health 4.6%
Business51.9%
Technology24.9%
Applied arts18.6%
2001 2002 2003 2004 2005 2006 2007 2008 2009 2010
3,707 4,685 5,855 6,193 6,172 6,722 6,958 8,025 9,861 14,576
2 0 1 1 E n v i r o n m E n t a l S c a n • c o l l E g E S o n t a r i o Student and graduate profiles 9
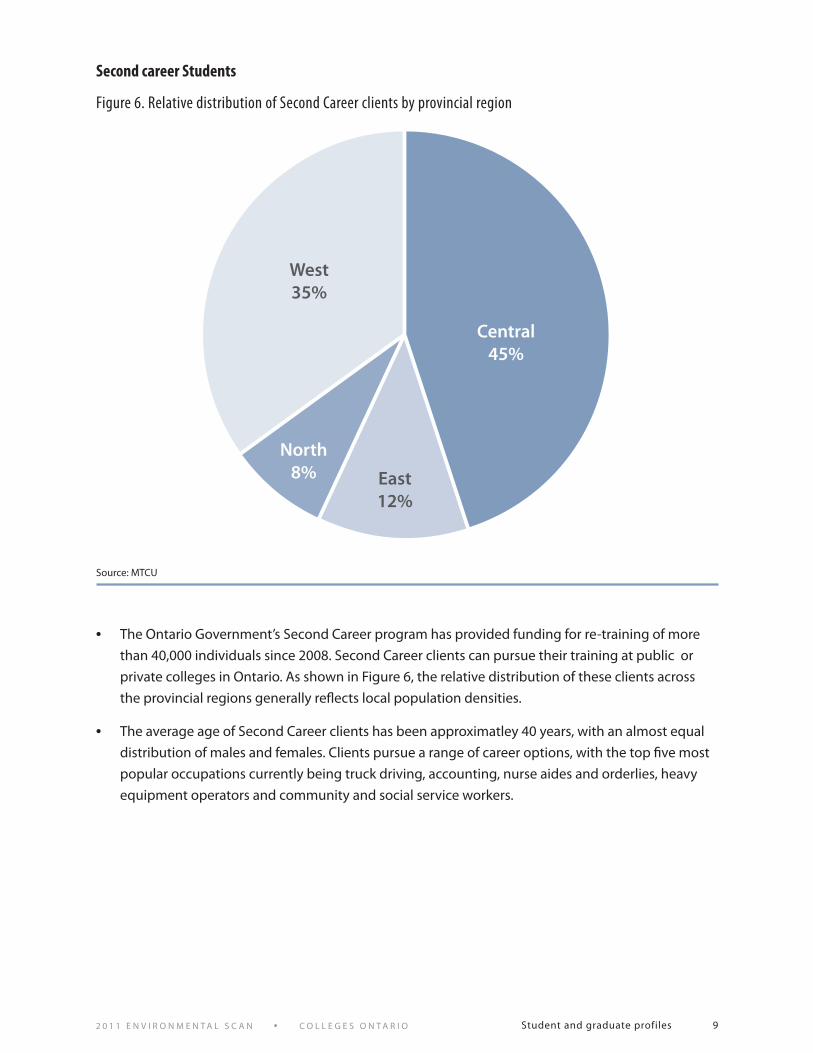
• The Ontario Government’s Second Career program has provided funding for re-training of more
than 40,000 individuals since 2008 . Second Career clients can pursue their training at public or
private colleges in Ontario . As shown in Figure 6, the relative distribution of these clients across
the provincial regions generally reflects local population densities .
• The average age of Second Career clients has been approximatley 40 years, with an almost equal
distribution of males and females . Clients pursue a range of career options, with the top five most
popular occupations currently being truck driving, accounting, nurse aides and orderlies, heavy
equipment operators and community and social service workers .
second career students
Source: MTCU
figure 6. relative distribution of Second career clients by provincial region
Central45%
North8%
West35%
East12%

2 0 1 1 E n v i r o n m E n t a l S c a n • c o l l E g E S o n t a r i o Student and graduate profiles 10
G r A d u At e s
Note that these totals exclude the graduates of collaborative nursing programs .
Source: MTCU .
College Summer 2008
Fall 2008
Winter 2009
Total
Algonquin 1,092 441 3,539 5,072
Collège Boréal 140 93 401 634
Cambrian 421 88 1,191 1,700
Canadore 163 50 849 1,062
Centennial 602 630 2,224 3,456
Conestoga 407 380 1,658 2,445
Confederation 145 49 921 1,115
Durham 459 59 1,838 2,356
Fanshawe 943 563 3,419 4,925
Fleming 406 293 1,534 2,233
George Brown 1,005 773 3,784 5,562
Georgian 1,085 322 1,273 2,680
Humber 930 732 3,594 5,256
La Cité collégiale 271 52 843 1,166
Lambton 87 54 617 758
Loyalist 110 39 1,030 1,179
Mohawk 543 349 2,465 3,357
Niagara 682 132 2,079 2,893
Northern 74 31 428 533
St .Clair 617 103 1,714 2,434
St . Lawrence 497 94 1,400 1,991
Sault 170 44 457 671
Seneca 1,218 943 2,739 4,900
Sheridan 643 458 3,363 4,464
Total 12,710 6,772 43,360 62,842
table 4. number of graduates by college and semester of graduation, 2008-09
2 0 1 1 E n v i r o n m E n t a l S c a n • c o l l E g E S o n t a r i o Student and graduate profiles 11
Source: MTCU .
60,000
50,000
40,000
30,000
20,000
10,000
000-01
45,346 46,82049,717
52,26556,761
59,419 59,029 60,406 59,01262,842
01-02 02-03 03-04 04-05 05-06 06-07 07-08 08-09 09-10
figure 7. ontario college graduates by year, 2000-01 to 2009-10
Reporting year
2 0 1 1 E n v i r o n m E n t a l S c a n • c o l l E g E S o n t a r i o Student and graduate profiles 12
* First generation is defined as neither parent having completed a PSE credential . If defined as neither parent having attended PSE, then the value would be 25 per cent .
Sources: OCAS; 2010 Applicant Survey; Colleges Ontario
3.3 l E a r n E r d E m o g r a P H i c S a n d c H a r a c t E r i S t i c S
table 5. college applicants
Per cent
Gender
Female 55%
Male 45%
First Generation Status* 33%
Immigrant Status
Born in Canada 83%
Immigrant 17%
• Immigrated prior to 2001 47%
• Between 2001-2005 26%
• Between 2006-2010 27%
Employment Status
Full-time 19%
Part-time 43%
Unemployed 30%
Military 1%
Not in the labour force 7%
Average Applicant Age 23 years
Direct from secondary school 19 .9 years
Non-direct 25 .7 years
2 0 1 1 E n v i r o n m E n t a l S c a n • c o l l E g E S o n t a r i o Student and graduate profiles 13
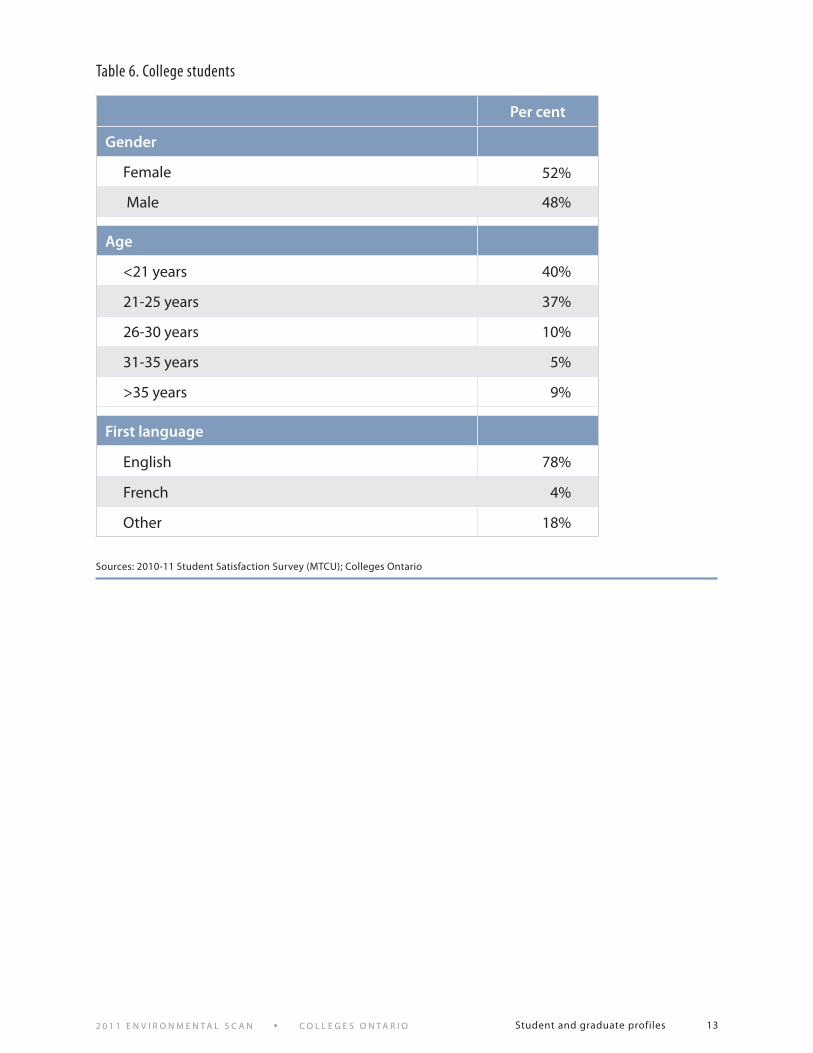
Sources: 2010-11 Student Satisfaction Survey (MTCU); Colleges Ontario
Per cent
Gender
Female 52%
Male 48%
Age
<21 years 40%
21-25 years 37%
26-30 years 10%
31-35 years 5%
>35 years 9%
First language
English 78%
French 4%
Other 18%
table 6. college students

2 0 1 1 E n v i r o n m E n t a l S c a n • c o l l E g E S o n t a r i o Student and graduate profiles 14
Direct: entered college directly from secondary school Delayed: no prior PSE experience, but did not enter directly from secondary school Incomplete PSE: previous PSE experience, without a completed credential Complete PSE: previous attainment of a diploma or degree
Sources: Student Satisfaction Survey 2010-11 (MTCU); Colleges Ontario
figure 8. Pathways to college
• In 2010-11, 35 per cent of college students came directly from high school and an additional
23 per cent were delayed entrants (i .e ., no prior PSE experience, but did not come directly from
high school) . Forty-one per cent of students had previous postsecondary education, 23 per cent
of whom previously completed a college and/or university credential (11 per cent university) .
l e v e l o f e d u c At i o n
Other 1%Less than HS 1%
Direct35%
Complete PSE23%
Delayed23%
Incomplete PSE18%
2 0 1 1 E n v i r o n m E n t a l S c a n • c o l l E g E S o n t a r i o Student and graduate profiles 15
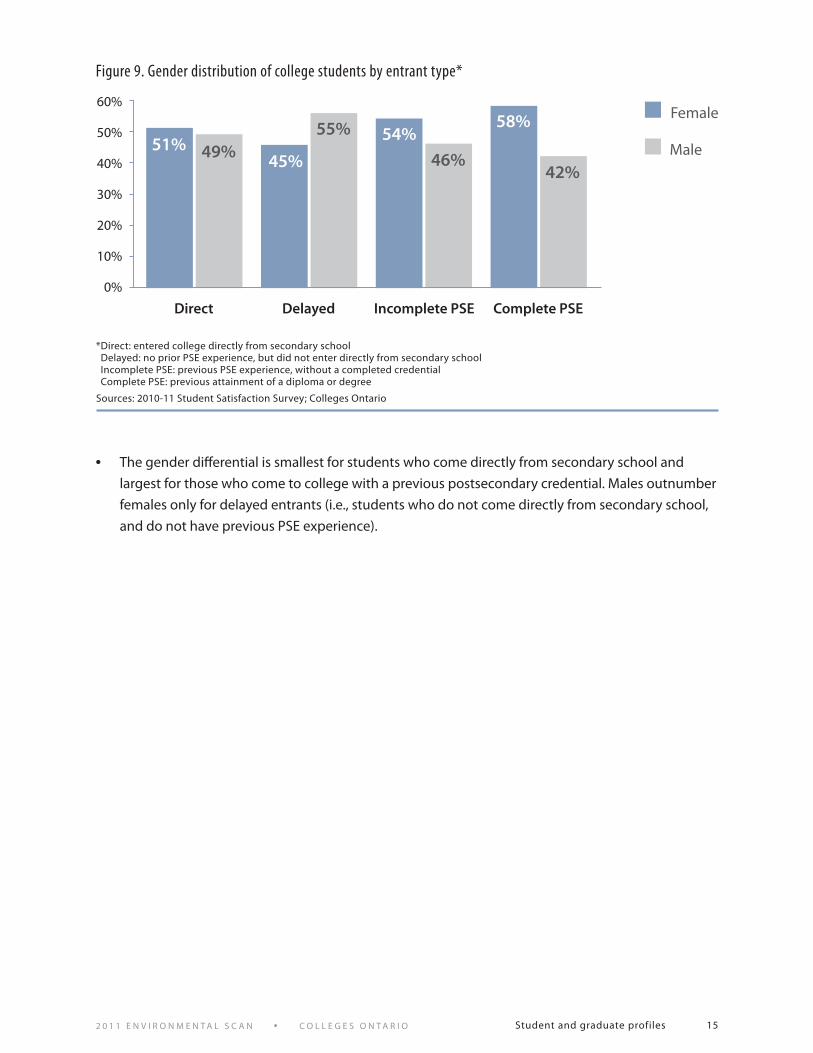
* Direct: entered college directly from secondary school Delayed: no prior PSE experience, but did not enter directly from secondary school Incomplete PSE: previous PSE experience, without a completed credential Complete PSE: previous attainment of a diploma or degree
Sources: 2010-11 Student Satisfaction Survey; Colleges Ontario
• The gender differential is smallest for students who come directly from secondary school and
largest for those who come to college with a previous postsecondary credential . Males outnumber
females only for delayed entrants (i .e ., students who do not come directly from secondary school,
and do not have previous PSE experience) .
Female
Male
Direct Delayed Incomplete PSE Complete PSE
60%
50%
40%
30%
20%
10%
0%
51%45%
54%58%
49%55%
46%42%
figure 9. gender distribution of college students by entrant type*

2 0 1 1 E n v i r o n m E n t a l S c a n • c o l l E g E S o n t a r i o Student and graduate profiles 16
Source: Applicant Surveys, Academica Group Inc . (respondents who did not know their household incomes were not included) . Household income data were not available in a directly comparable format for 2007 .
• In 2010, more than one-quarter of college applicants reported a household income of less than
$30,000, and 54 per cent had incomes less than $60,000 .
H o u s e H o l d i n c o m e
Under $30,001
$30,001- $60,000
$60,001- $90,000
Over $90,001
2005 25% 28% 26% 22%
2006 26% 28% 24% 22%
2008 23% 29% 23% 25%
2009 25% 29% 22% 24%
2010 27% 27% 22% 24%
30%
25%
20%
15%
10%
5%
0%
figure 10. Per cent of college applicants by household income quartile over time
2 0 1 1 E n v i r o n m E n t a l S c a n • c o l l E g E S o n t a r i o Student and graduate profiles 17
Source: Applicants surveys (Academica Group Inc .)
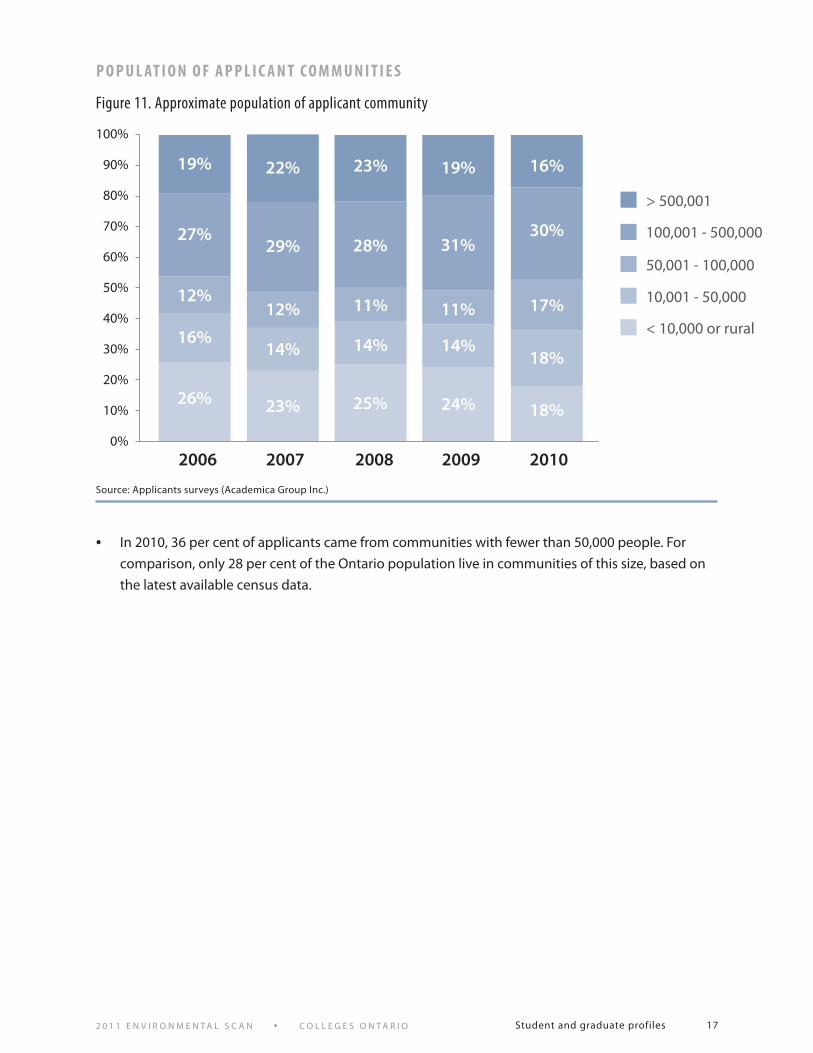
• In 2010, 36 per cent of applicants came from communities with fewer than 50,000 people . For
comparison, only 28 per cent of the Ontario population live in communities of this size, based on
the latest available census data .
2006 2007 2008 2009 2010
> 500,001
50,001 - 100,000
100,001 - 500,000
10,001 - 50,000
< 10,000 or rural
100%
90%
80%
70%
60%
50%
40%
30%
20%
10%
0%
26% 23% 25% 24% 18%
16%14% 14% 14%
18%
12%12% 11% 11% 17%
27%29% 28% 31%
30%
19% 22% 23% 19% 16%
p o p u l At i o n o f A p p l i c A n t c o m m u n i t i e s
figure 11. approximate population of applicant community
2 0 1 1 E n v i r o n m E n t a l S c a n • c o l l E g E S o n t a r i o Student and graduate profiles 18
Sources: OCAS registrants matched to 2010 Applicant Survey respondents; Census 2006, Statistics Canada
Sources: Census 2006, Statistics Canada; Colleges Ontario
A b o r i G i n A l s tAt u s
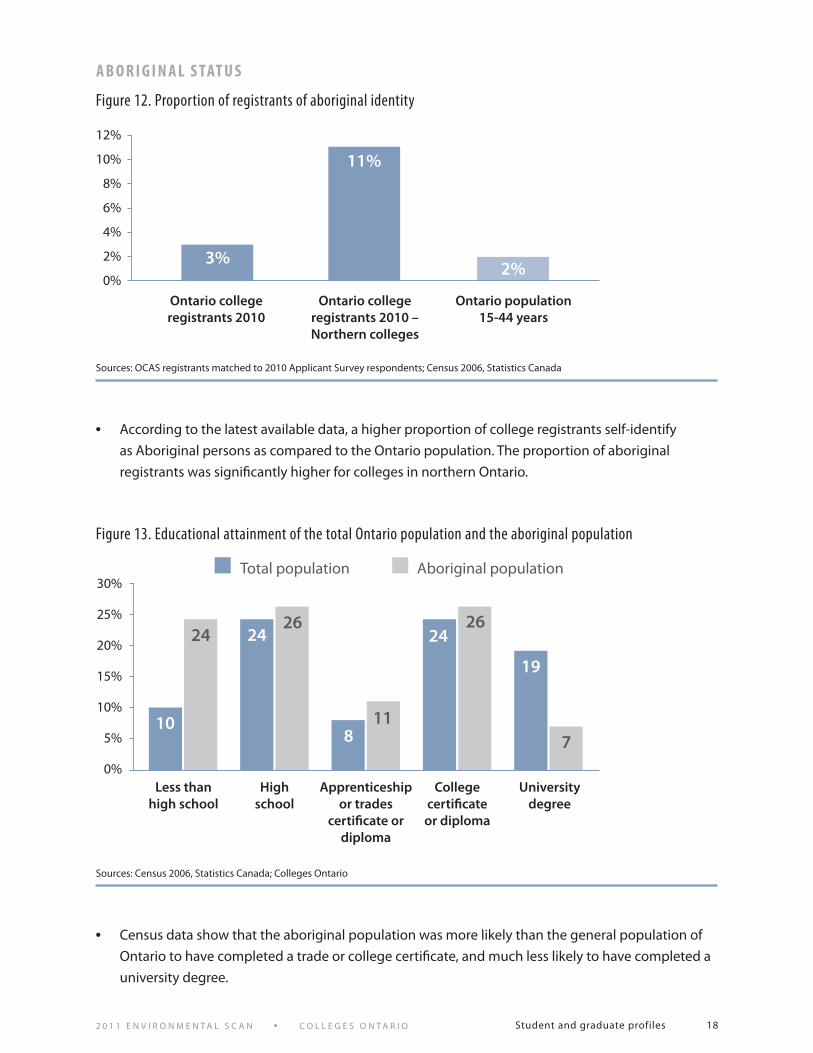
figure 12. Proportion of registrants of aboriginal identity
figure 13. Educational attainment of the total ontario population and the aboriginal population
• Census data show that the aboriginal population was more likely than the general population of
Ontario to have completed a trade or college certificate, and much less likely to have completed a
university degree .
• According to the latest available data, a higher proportion of college registrants self-identify
as Aboriginal persons as compared to the Ontario population . The proportion of aboriginal
registrants was significantly higher for colleges in northern Ontario .
Ontario college registrants 2010
Ontario college registrants 2010 – Northern colleges
Ontario population 15-44 years
12%
10%
8%
6%
4%
2%
0%
3%
11%
2%
Total population Aboriginal population
Less than high school
High school
Apprenticeship or trades
certificate or diploma
College certificate or diploma
University degree
30%
25%
20%
15%
10%
5%
0%
10
24
8
24
19
2426
11
26
7

2 0 1 1 E n v i r o n m E n t a l S c a n • c o l l E g E S o n t a r i o Student and graduate profiles 19
Sources: Student Satisfaction Surveys; Colleges Ontario
Sources: 2009-10 College Disability Offices Year-End Reports, MTCU; Colleges Ontario
• Of the12 per cent of Ontario college students who indicated use of “Special Needs/Disability
Services” at their colleges in the last few years, half reported high usage .
14%
12%
10%
8%
6%
4%
2%
0%01-02 02-03 03-04 04-05 05-06 06-07 07-08 08-09 09-10 10-11
12.1 12.1 11.9 12.211.3
10.710.410.09.99.5
0 5 10 15 20 25 30 35 40 45 50
Per cent
2%
2%
3%
7%
8%
9%
13%
17%
39%
Low vision, blind
Acquired brain injury
Deaf, deafened, hard-of-hearing
Other
Mobility/functional
Attention-deficit/ Hyperactivity disorder
Chronic illness/ Systemic/medical
Psychiatric
Learning disability
s t u d e n t s w i t H d i s A b i l i t i e s
figure 14. Per cent of students self-reporting the use of special needs/disability services
figure 15. Students with disabilities: Per cent distribution by disability type

2 0 1 1 E n v i r o n m E n t a l S c a n • c o l l E g E S o n t a r i o Student and graduate profiles 20
Source: Participation and Activity Limitation Survey 2001, Statistics Canada
• The most recent data available from Statistics Canada on educational attainment of Ontarians
with disabilities show that these individuals are much less likely to complete high school, and also
much less likely to attain a university credential than individuals without disabilities . In contrast,
individuals with disabilities are as likely as those without disabilities to attain a trade or college
credential .
With disabilities Without disabilities
Less than high school
High school
dipoma
Trades certificate or
diploma
College University
30%
25%
20%
15%
10%
5%
0%
28 27
11
20
1516
26
11
21
27
figure 16. Educational attainment of the ontario population with and without disabilities, ages 25 to 54

2 0 1 1 E n v i r o n m E n t a l S c a n • c o l l E g E S o n t a r i o Student and graduate profiles 21
Source: 2010 Applicant Survey, Academic Group Inc .
80%
65%
63%
62%
60%
47%
46%
39%
32%
31%
29%
24%
22%
22%
13%
9%
4%
4%
Career preparation
Future Options
Personal & intellectual growth
Knowledge
Earning potential
Pursue further study (grad or prof)
Meet new people
Enhance confidence
Leadership skills
Encouragement from others
Give back to society
Student life & activities
Social status
Career advancement
Transfer to university
Could not find a job
Transfer to another college
Not sure of what to do
0 10 20 30 40 50 60 70 80 90
Per cent
m A i n G o A l s
figure 17. major reasons for applying to college as reported by college applicants

2 0 1 1 E n v i r o n m E n t a l S c a n • c o l l E g E S o n t a r i o Student and graduate profiles 22
Source: Student Satisfaction Survey 2010-11
To prepare for further college or university study
To prepare for employment/career
90%
80%
70%
60%
50%
40%
30%
20%
10%
0%11
8386
8
21
7375
18
4448
figure 18. ‘main goal’ of college students in enrolling in their programs by credential
Certificate Diploma Advanced diploma
Graduatecertificate
Degree

2 0 1 1 E n v i r o n m E n t a l S c a n • c o l l E g E S o n t a r i o Student and graduate profiles 23
Source: MTCU .
• In 2009-10, 90 per cent of the new apprenticeship seats in Ontario were allocated to the colleges,
for a CAAT total of 47,551 . This represents a 34 per cent increase in the number of CAAT new starts,
and is due to significant increases in part-time apprenticeship activity .
• Another large increase was planned for 2010-11, for a total of 56,634 new CAAT apprenticeship
seats (Figure 20) . Much of this increase is due to increases in part-time apprenticeships in the
service sector planned for the western region of the province .
50,000
45,000
40,000
35,000
30,000
25,000
20,000
15,000
10,000
5,000
009-1000-01 01-02 02-03 03-04 04-05 05-06 06-07 07-08 08-09
21,14222,799 22,426 23,113 24,124 24,908
30,20231,867
35,504
47,551
3.4 a P P r E n t i c E S
figure 19. total new caat apprenticeship starts by year
Year
Num
ber
of n
ew s
tart
s

2 0 1 1 E n v i r o n m E n t a l S c a n • c o l l E g E S o n t a r i o Student and graduate profiles 24
Source: MTCU .
Central13,367
Eastern7,733
Western32,239
figure 20. new caat planned apprenticeship starts by region for 2010-11
Northern3,295

2 0 1 1 E n v i r o n m E n t a l S c a n • c o l l E g E S o n t a r i o Student and graduate profiles 25
*Total, full and part time
Sources: MTCU; Colleges Ontario
Central East North West
Construction
5,000
4,500
4,000
3,500
3,000
2,500
2,000
1,500
1,000
500
0
00-01 01-02 02-03 03-04 04-05 05-06 06-07 07-08 08-09 09-10
Motive power
3,000
2,500
2,000
1,500
1,000
500
0
00-01 01-02 02-03 03-04 04-05 05-06 06-07 07-08 08-09 09-10
figure 21. caat apprenticeship new starts* by region and year

2 0 1 1 E n v i r o n m E n t a l S c a n • c o l l E g E S o n t a r i o Student and graduate profiles 26
• Reflecting local economies, the distribution of new apprenticeship starts and the pattern of
change across employment sectors differs by provincial region . Particularly apparent in recent
years is the growth in number of new starts in the service sector, especially in western Ontario .
Compared to the construction and service sectors, the numbers of new starts in the motive power
and industrial sectors are relatively low across regions .
*Total, full and part time
Sources: MTCU; Colleges Ontario
Central East North West
Service
14,000
12,000
10,000
8,000
6,000
4,000
2,000
0
00-01 01-02 02-03 03-04 04-05 05-06 06-07 07-08 08-09 09-10
Industrial
4,500
4,000
3,500
3,000
2,500
2,000
1,500
1,000
500
0
00-01 01-02 02-3 03-04 04-05 05-06 06-07 07-08 08-09 09-10

2 0 1 1 E n v i r o n m E n t a l S c a n • c o l l E g E S o n t a r i o Student and graduate profiles 27
* Certificate of Qualification (C of Q) or a Certificate of Apprenticeship (C of A) where the C of A is the only requirement of the trade .
Source: MTCU
9,000
8,000
7,000
6,000
5,000
4,000
3,000
2,000
1,000
02001 2002 2003 2004 2005 2006 2007 2008 2009 2010
figure 22. number of certificates* issued in ontario by year

2 0 1 1 E n v i r o n m E n t a l S c a n • c o l l E g E S o n t a r i o Student and graduate profiles 28
• Detailed information on the gender of registered apprentices is available from Statistics Canada .
In Ontario, females comprise just under 19 per cent of total registered apprentices, and are
significantly under-represented in most of the trades .
figure 23. Per cent distribution of registered apprentices by gender
Building construction
trades
Electrical, electronics and related
trades
Food and service trades
Industrial and related mechanical
trades
Metal fabricating
trades
Motor vehicle
and heavy equipment
trades
Other
Male Female30,000
25000
20000
15000
10000
5000
0
* Statistics Canada notes that the “Other trades” category includes many of the apprenticeship trades and occupations that have been introduced since the 1990’s . Examples provided include child and youth worker, early childhood educator, pork production technician, and those related to motion picture and theatre .
Source: Statistics Canada 2007, Table 477-0051

2 0 1 1 E n v i r o n m E n t a l S c a n • c o l l E g E S o n t a r i o Student and graduate profiles 29
* The survey from which these data are derived is typically administered every two to three years . These are the most recent data available for this student group .
Source: 2008 Continuing Education Survey (CCI Research Inc .); Colleges Ontario
Gender Per cent
Female 66% Male 34%
Age
<20 years 2%
20-24 years 12%
25-34 years 31%
35-44 years 28%
45-54 years 19%
>54 years 8%
First language
English 70%
French 3%
Other 27%
Immigrant status
Recent immigrant (last 10 years) 19%
Previous education
High school or less 29%
College certificate 12%
College diploma 24%
University degree 35%
First generation status
Neither parents nor siblings attended college or university 32%
Employment status
Full time 69%
Part time 15%
Unemployed 7%
Homemaker 3%
Retired 3%
Other 3%
3.5 c o n t i n u i n g E d u c at i o n S t u d E n t S *
table 7. background characteristics of college continuing education students

2 0 1 1 E n v i r o n m E n t a l S c a n • c o l l E g E S o n t a r i o Student and graduate profiles 30
Looking for a job
Improving in my
current career
Preparing for career
change
Seeking credit
towards a FT program
Personal develop-ment &
fulfillment
Pursuing a hobby/ interest
40%
35%
30%
25%
20%
15%
10%
5%
0%
7%
35%
22%
7%
11%
18%
figure 24. main reason for taking a continuing education course
Source: 2008 Continuing Education Survey (CCI Research Inc .)

2 0 1 1 E n v i r o n m E n t a l S c a n • c o l l E g E S o n t a r i o Student and graduate profiles 31
*Includes graduates who are self-employed full time
Sources: 2010 Employment Profile (MTCU); Colleges Ontario
Note that this chart does not include any graduates of collaborative nursing programs .
Sources: 2010 Employment Profile (MTCU); Colleges Ontario
3.6 g r a d u at E S
figure 25. current status of 2008-09 graduates (six months after graduation)
figure 26. college graduates by employment sector
Other, 2%
Employed (FT or PT unknown), 1%
Employed FT*,51%Unemployed,
11%
Full-time education,
24%
Employed PT,
12%
Hospitality, 6%
Community service,
19%
Engineering/technology,
18%
Health science,
13%
Business,23%
Creative and applied arts,
12%
Preparatory/upgrading,
8%

2 0 1 1 E n v i r o n m E n t a l S c a n • c o l l E g E S o n t a r i o Student and graduate profiles 32
Applied arts Number of graduates
% of total graduates
% change over previous year
Advertising and design 1,717 2 .7 -5 .0
Art 893 1 .4 8 .0
Child/youth worker 926 1 .5 12 .2
Community planning 20 0 .0 -4 .8
Crafts 108 0 .2 18 .7
Developmental services worker 527 0 .8 0 .8
Education 3262 5 .2 3 .8
Fashion 887 1 .4 26 .2
Graphic arts/printing 27 0 .0 3 .8
Horticulture 253 0 .4 -4 .2
Law and security 3549 5 .6 7 .3
Library 105 0 .2 7 .1
Media 3411 5 .4 3 .9
Native community worker 22 0 .0 -37 .1
Performing arts 503 0 .8 25 .4
Preparatory/upgrading 5230 8 .3 10 .8
Public relations 545 0 .9 5 .0
Recreation/fitness 1110 1 .8 14 .8
Social services 2636 4 .2 3 .9
table 8. graduates by occupation cluster: 2008-09
2 0 1 1 E n v i r o n m E n t a l S c a n • c o l l E g E S o n t a r i o Student and graduate profiles 33
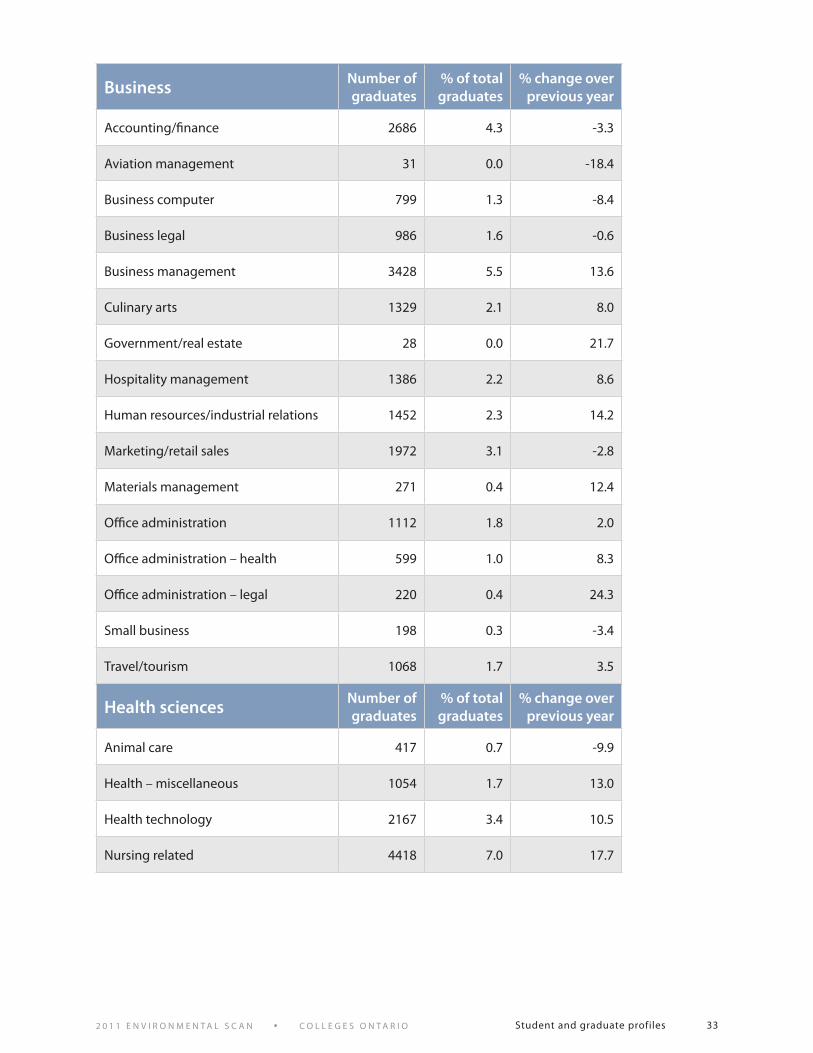
Business Number of graduates
% of total graduates
% change over previous year
Accounting/finance 2686 4 .3 -3 .3
Aviation management 31 0 .0 -18 .4
Business computer 799 1 .3 -8 .4
Business legal 986 1 .6 -0 .6
Business management 3428 5 .5 13 .6
Culinary arts 1329 2 .1 8 .0
Government/real estate 28 0 .0 21 .7
Hospitality management 1386 2 .2 8 .6
Human resources/industrial relations 1452 2 .3 14 .2
Marketing/retail sales 1972 3 .1 -2 .8
Materials management 271 0 .4 12 .4
Office administration 1112 1 .8 2 .0
Office administration – health 599 1 .0 8 .3
Office administration – legal 220 0 .4 24 .3
Small business 198 0 .3 -3 .4
Travel/tourism 1068 1 .7 3 .5
Health sciences Number of graduates
% of total graduates
% change over previous year
Animal care 417 0 .7 -9 .9
Health – miscellaneous 1054 1 .7 13 .0
Health technology 2167 3 .4 10 .5
Nursing related 4418 7 .0 17 .7

2 0 1 1 E n v i r o n m E n t a l S c a n • c o l l E g E S o n t a r i o Student and graduate profiles 34
Technology Number of graduates
% of total graduates
% change over previous year
Architectural 505 0 .8 -4 .0
Automotive 842 1 .3 26 .0
Aviation – flight 96 0 .2 11 .6
Aviation – maintenance 197 0 .3 -10 .0
Chemical/biological 740 1 .2 2 .9
Civil 1416 2 .3 9 .3
Drafting 72 0 .1 -4 .0
Electronics 2656 4 .2 8 .9
Furniture/wood products 311 0 .5 -6 .0
Geology/mining 87 0 .1 11 .5
Industrial 57 0 .1 96 .6
Instrumentation 118 0 .2 -12 .6
Machining 442 0 .7 5 .2
Marine 40 0 .1 -27 .3
Mechanical 2052 3 .3 -0 .8
Power 137 0 .2 -21 .7
Resources 900 1 .4 7 .0
Technology miscellaneous 624 1 .0 -9 .8
Welding 198 0 .3 55 .9
Total 62,842 100% 6.5%
Sources: 2010 Employment Profile (MTCU); Colleges Ontario

2 0 1 1 E n v i r o n m E n t a l S c a n • c o l l E g E S o n t a r i o Student and graduate profiles 35
* Note: This is an early cohort for college degree graduates (the first college degree programs began in 2002) . The degree category does not include collaborate college-university degree programs .
Source: Employment Profile, 2010
figure 27. 2008-09 graduates by credential
Degree*887
Certificate12,094
Graduatecertificate
5,941
Diploma32,018
Adv diploma11,902
2 0 1 1 E n v i r o n m E n t a l S c a n • c o l l E g E S o n t a r i o Student and graduate profiles 36
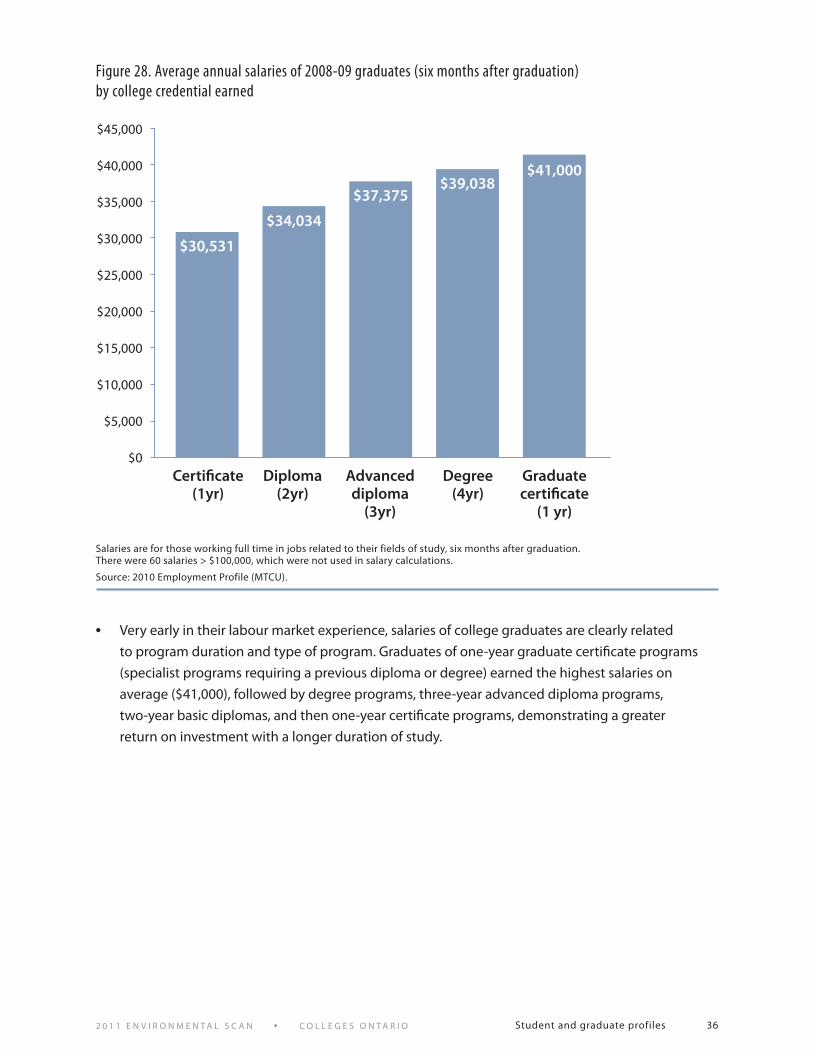
• Very early in their labour market experience, salaries of college graduates are clearly related
to program duration and type of program . Graduates of one-year graduate certificate programs
(specialist programs requiring a previous diploma or degree) earned the highest salaries on
average ($41,000), followed by degree programs, three-year advanced diploma programs,
two-year basic diplomas, and then one-year certificate programs, demonstrating a greater
return on investment with a longer duration of study .
Certificate (1yr)
Diploma (2yr)
Advanced diploma
(3yr)
Degree (4yr)
Graduate certificate
(1 yr)
$45,000
$40,000
$35,000
$30,000
$25,000
$20,000
$15,000
$10,000
$5,000
$0
$30,531
$34,034
$37,375$39,038
$41,000
Salaries are for those working full time in jobs related to their fields of study, six months after graduation . There were 60 salaries > $100,000, which were not used in salary calculations .
Source: 2010 Employment Profile (MTCU) .
figure 28. average annual salaries of 2008-09 graduates (six months after graduation) by college credential earned

2 0 1 1 E n v i r o n m E n t a l S c a n • c o l l E g E S o n t a r i o Student and graduate profiles 37
• Typically, about one-quarter of college graduates continue their education immediately
(i .e ., within six months) after graduation . The percentages vary slightly from year to year, but
returning to their college of graduation or enrolling in an Ontario university continues to be the
most popular choices . As shown in Figure 29 above, an increase was observed last year, with a
total of 28 per cent of graduates choosing to further their education .
Returned to own college
Returned to a different
CAAT
Other college
(non-CAAT)
Ontario university
Non-Ontario university
Other educational institution
18%
16%
14%
12%
10%
8%
6%
4%
2%
0%
2003-04 2004-05 2005-06 2006-07 2007-08 2008-09
Sources: Graduate Satisfaction Surveys; Colleges Ontario
figure 29. further education of college graduates (within six months of college graduation)

2 0 1 1 E n v i r o n m E n t a l S c a n • c o l l E g E S o n t a r i o Student and graduate profiles 38
• Of the college graduates who continue their education immediately after graduation, 55 per cent
chose to enrol in a college certificate or diploma program . Undergraduate degrees were chosen by
30 per cent of college graduates (three per cent college degree, 21 per cent university degree and
six per cent collaborative college-university degree) . A further eight per cent pursued graduate
work, either through a college (six per cent) or university (two per cent) .
college certificate or diploma
university certificate or diploma
college degree
university degree (under-
graduate)
collabora-tive degree
college graduate certificate
university graduate or professional
degree
continuing education
course (college or university)
Sources: 2009-10 Graduate Satisfaction Survey; Colleges Ontario
figure 30. further education credential choices of college graduates (within six months of college graduation)
60%
50%
40%
30%
20%
10%
0%
55%
2% 3%
21%
6% 6% 6%2%
2 0 1 1 E n v i r o n m E n t a l S c a n • c o l l E g E S o n t a r i o Student and graduate profiles 39
s t u d e n t s
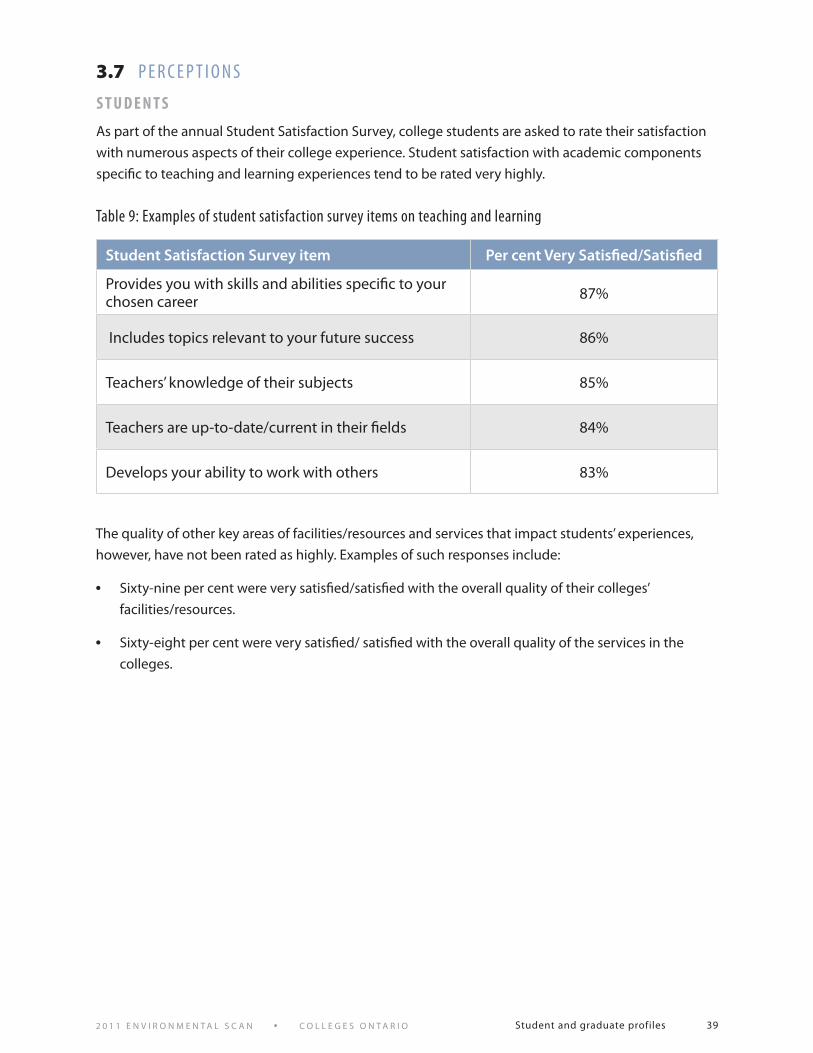
As part of the annual Student Satisfaction Survey, college students are asked to rate their satisfaction
with numerous aspects of their college experience . Student satisfaction with academic components
specific to teaching and learning experiences tend to be rated very highly .
The quality of other key areas of facilities/resources and services that impact students’ experiences,
however, have not been rated as highly . Examples of such responses include:
• Sixty-nine per cent were very satisfied/satisfied with the overall quality of their colleges’
facilities/resources .
• Sixty-eight per cent were very satisfied/ satisfied with the overall quality of the services in the
colleges .
Student Satisfaction Survey item Per cent Very Satisfied/Satisfied
Provides you with skills and abilities specific to your chosen career 87%
Includes topics relevant to your future success 86%
Teachers’ knowledge of their subjects 85%
Teachers are up-to-date/current in their fields 84%
Develops your ability to work with others 83%
3.7 P E r c E P t i o n S
table 9: Examples of student satisfaction survey items on teaching and learning

2 0 1 1 E n v i r o n m E n t a l S c a n • c o l l E g E S o n t a r i o Student and graduate profiles 40
G r A d u At e s
In addition to the KPI’s, many other details regarding graduate experiences are available from the
Graduate and Employer Surveys . Some of the highlights from last year’s survey include:
• Ninety-five per cent of graduates would recommend their colleges to someone else, and 88 per
cent of graduates would recommend their specific programs .
• Ninety-one per cent of college graduates were very satisfied/satisfied that the course material in
their programs was up to date .
• Eighty-eight per cent of graduates were very satisfied/satisfied with the course content and with
the overall quality of instruction .
• Eighty-seven per cent of graduates were very satisfied/satisfied that the equipment was up to date
Employer satisfactionGraduate satisfaction
100%
90%
80%
70%
60%
50%
40%
30%
20%
10%
0%
Applied arts Business Health Technology
8176
9389
94
75
9294
Source: Employment Profile 2010 (MTCU)
figure 31. graduate and employer satisfaction by division (2008-09 graduates, six months after graduation; percentages very satisfied/satisfied)

2 0 1 1 E n v i r o n m E n t a l S c a n • c o l l E g E S o n t a r i o Student and graduate profiles 41
Sources: Graduate Satisfaction Survey 2008-09; Colleges Ontario
table 10. graduate and employer beliefs about the importance of the following skills and abilities for the graduates current position and their satisfaction with graduates’ educational preparation (percentages)
• Graduates and employers display very high agreement in their ratings of the relative importance
of each of these components to the work the graduates are doing . Ratings of satisfaction with
preparation are also quite high, with a somewhat greater difference between the ratings of
graduates and employers .
Importance (extremely important /important)
Satisfaction (very satisfied/satisfied)
Graduate-rated
Employer-rated
Graduate-rated
Employer-rated
A . Specific job-related knowledge 91 92 85 88
B . Specific job-related skills 91 94 85 90
C . Oral communication 96 98 90 93
D . Written communications 83 87 88 90
E . Comprehension 95 98 92 95
F . Math skills 59 65 72 80
G . Computer skills 71 75 82 89
H . Critical thinking 91 94 91 89
I . Problem solving 94 96 91 89
J . Research and analysis 62 58 80 74
K . Teamwork 95 99 92 96
L . Organization and planning 94 95 90 90
M . Time management 95 98 89 89
N . Quality of work 98 100 91 94
O . Productivity 95 98 89 91
P . Creative and innovative 73 80 82 81
Q . Adaptable 93 98 89 94
R . Responsible 99 100 93 95

2 0 1 1 E n v i r o n m E n t a l S c a n • c o l l E g E S o n t a r i o Student and graduate profiles 42
01-02 02-03 03-04 04-05 05-06Reporting year
06-07 07-08 08-09 09-10 10-11
Employer satisfaction
Graduate satisfaction
Student satisfaction
100%
95%
90%
85%
80%
75%
70%
65%
60%
55%
50%
• Ontario college data include five key performance indicators (KPIs): student satisfaction rate,
graduate satisfaction rate, employer satisfaction rate, graduation rate, and graduate employment
rate . Graduation rates are reported by the colleges, while surveys are used to collect all other
information . Independent research firms collect the survey data on behalf of the colleges and the
ministry .
3.8 K E y P E r f o r m a n c E i n d i c ato r S : S t u d E n t S a n d g r a d u at E S
figure 32. Satisfaction scores by year*
*reporting year
Sources: Student Satisfaction Surveys, Graduate Satisfaction Surveys, Employer Satisfaction Surveys (MTCU); Colleges Ontario
2 0 1 1 E n v i r o n m E n t a l S c a n • c o l l E g E S o n t a r i o Student and graduate profiles 43
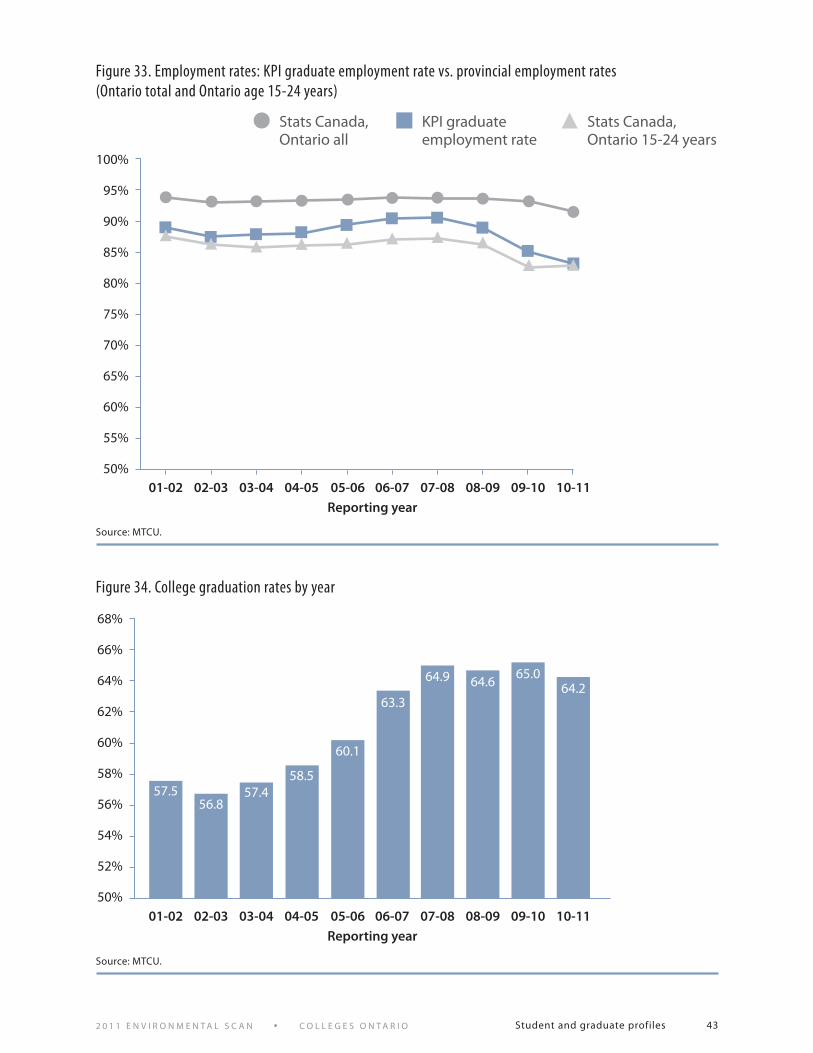
figure 33. Employment rates: KPi graduate employment rate vs. provincial employment rates (ontario total and ontario age 15-24 years)
figure 34. college graduation rates by year
Source: MTCU .
Source: MTCU .
01-02 02-03 03-04 04-05 05-06Reporting year
06-07 07-08 08-09 09-10 10-11
Stats Canada, Ontario all
KPI graduate employment rate
Stats Canada, Ontario 15-24 years
100%
95%
90%
85%
80%
75%
70%
65%
60%
55%
50%
01-02 02-03 03-04 04-05 05-06Reporting year
06-07 07-08 08-09 09-10 10-11
68%
66%
64%
62%
60%
58%
56%
54%
52%
50%
57 .556 .8
57 .458 .5
60 .1
63 .3
64 .9 64 .665 .0
64 .2

2 0 1 1 E n v i r o n m E n t a l S c a n • c o l l E g E S o n t a r i o Student and graduate profiles 44
01-02 02-03 03-04 04-05 05-06 06-07 07-08 08-09 09-10 10-11
Graduate employment rate (%) 88.7 87.4 87.7 88.0 89.3 90.1 90.5 88.9 84.8 83.0
Graduation rate (%) 57.5 56.8 57.4 58.5 60.1 63.3 64.9 64.6 65.0 64.2
Graduate satisfaction rate (%)
Very satisfied/satisfied 81.4 79.8 79.7 80.5 81.6 82.0 82.8 82.7 79.8 79.1
Neither 9 .7 11 .0 10 .5 10 .3 9 .9 10 .0 10 .0 9 .6 11 .4 11 .8
Very dissatisfied/dissatisfied 8 .9 9 .1 9 .8 9 .2 8 .5 8 .0 7 .2 7 .7 8 .8 9 .1
Employer satisfaction rate (%)
Very satisfied/satisfied 91.7 92.0 92.0 92.7 92.1 92.6 93.1 93.3 93.0 93.2
Neither 6 .0 6 .0 5 .4 4 .6 5 .1 4 .8 4 .2 4 .2 4 .9 4 .5
Very dissatisfied/dissatisfied 2 .4 2 .0 2 .6 2 .7 2 .9 2 .6 2 .7 2 .5 2 .1 2 .4
Student satisfaction rate (%)
Very satisfied/satisfied 74.4 75.1 75.1 76.3 77.8 77.4 77.9 78.4 76.3 76.1
Neither 18 .6 17 .9 17 .8 17 .1 16 .2 16 .4 16 .2 15 .8 17 .0 16 .9
Very dissatisfied/dissatisfied 7 .0 7 .0 7 .0 6 .6 6 .1 6 .1 5 .9 5 .8 6 .7 7 .1
• Knowledge and skills gained (Question 14)
Very satisfied/satisfied 85 .6 85 .8 85 .1 86 .3 87 .3 87 .2 87 .5 88 .1 87 .2 87 .1
Neither 10 .3 9 .8 10 .4 9 .7 8 .8 9 .0 8 .8 8 .4 8 .9 8 .9
Very dissatisfied/dissatisfied 4 .1 4 .3 4 .5 4 .0 3 .9 3 .8 3 .7 3 .4 3 .9 4 .0
• Quality of learning experience (Question 26)
Very satisfied/satisfied 78 .6 79 .0 78 .9 80 .1 81 .2 81 .1 81 .8 82 .4 80 .2 80 .2
Neither 15 .7 15 .2 15 .3 14 .5 13 .7 13 .7 13 .4 13 .0 14 .4 14 .2
Very dissatisfied/dissatisfied 5 .8 5 .8 5 .9 5 .4 5 .1 5 .2 4 .8 4 .7 5 .4 5 .6
• Quality of facilities/resources (Question 44)
Very satisfied/satisfied 67 .1 68 .1 68 .8 70 .0 71 .7 71 .0 71 .3 71 .8 69 .3 68 .8
Neither 23 .5 22 .5 22 .2 21 .4 20 .5 20 .9 20 .8 20 .4 21 .5 21 .4
Very dissatisfied/dissatisfied 9 .4 9 .3 9 .0 8 .6 7 .8 8 .0 7 .8 7 .8 9 .2 9 .7
• Quality of college services (Question 45)
Very satisfied/satisfied 66 .2 67 .5 67 .7 68 .9 70 .8 70 .3 70 .9 71 .3 68 .6 68 .1
Neither 25 .0 23 .9 23 .5 22 .9 21 .7 22 .2 21 .8 21 .5 23 .0 23 .0
Very dissatisfied/dissatisfied 8 .8 8 .6 8 .7 8 .2 7 .5 7 .5 7 .3 7 .2 8 .4 8 .9
table 11. Key performance indicators 2001-02 to 2010-11*
* Reporting year (graduate data refer to graduates of the previous academic year) .
Source: MTCU

2 0 1 1 E n v i r o n m E n t a l S c a n • c o l l E g E S o n t a r i o Student and graduate profiles 45
Data shown in this chapter were derived from the following sources:
• Applicants: Ontario College Application Service (OCAS) application data and responses to survey
questions from the annual applicant survey (Academica Group Inc .) .
• Students: Demographic and opinion data were obtained from OCAS enrolment reports and from
the Student Satisfaction Surveys (MTCU), an annual in-class survey of all funded students beyond
first semester .
• Apprentices: Ontario Ministry of Training, Colleges and Universities (MTCU)
• Continuing education students: Continuing Education Surveys conducted by CCI
Research Inc . on behalf of the colleges .
• Graduates (and employers): Graduate Outcomes/Satisfaction Survey and Employer Satisfaction
Survey (MTCU) provide data for college graduates six months after graduation .
3.9 n ot E S o n d ata S o u r c E S