student design of a bipropellant liquid rocket engine and
TRANSCRIPT

1
Student Design of a Bipropellant Liquid
Rocket Engine and Associated Infrastructure
James J. Hansen*, Mennatallah Hussein†, Samuel Moehring‡, Maxwell Stauffer§, Colton Acosta**, John Daly††,
Nitish Chennoju‡‡, and Patrick Imper§§
Arizona State University, Tempe, AZ, 85310, United States
Sun Devil Rocketry, previously known as Daedalus Astronautics, is a student-led
organization at Arizona State University focusing on rocket propulsion research and high-
power rocketry. Since its founding in 2003, student members have continued to gain
extracurricular experience relevant to today’s aerospace industry through the projects they
design, lead, and execute. In August 2019, students at Sun Devil Rocketry began developing a
bipropellant liquid rocket engine and accompanying test infrastructure to improve students’
access to and knowledge of liquid propulsion systems. The pressure-fed kerosene/liquid
oxygen engine, initiated by an AP/HTPB slug, is designed to produce 405 lbf of thrust at a
chamber pressure of 250 psig for 5 seconds. Kerosene is used to regeneratively cool the thrust
chamber before being injected and atomized along with liquid oxygen using multiple unlike-
triplet injector elements. Kerosene is also injected along the chamber wall for use in film
cooling. The engine is mounted to a static test stand, which supports all plumbing, data
acquisition, and control equipment necessary to fully support and document testing
operations. Currently, the project is transitioning out of the design and review phase into
manufacturing and testing. The following is a report on the processes used to design the system
and important lessons learned thus far.
I. Nomenclature
𝛼 = Converging half-angle
𝛽 = Beta ratio
𝛾 = Specific heat ratio
휀 = Expansion ratio
휀𝑐 = Contraction ratio
𝜗 = Sweep angle
𝜇 = Fluid viscosity
𝜈 = Prandtl-Meyer angle
𝜌 = Density
𝜎 = Boundary layer correction factor
𝐴 = Area
𝐵 = Element correlation factor
𝑐∗ = Characteristic velocity
𝐶𝑑 = Discharge coefficient
𝐶𝑓 = Thrust coefficient
𝐶𝑝 = Specific heat at constant pressure
* Research Lead, B.Sc.Eng. ‘21, SEMTE, Arizona State University, Tempe, AZ 85281, AIAA Student Member
† Propulsion Lead, B.Sc.Eng. ’20, SEMTE, Arizona State University, Tempe, AZ 85281, AIAA Student Member ‡ Avionics Lead, B.Sc.Eng. ’20, SEMTE, Arizona State University, Tempe, AZ 85281, AIAA Student Member
§ Propulsion Team, B.Sc.Eng. ’22, SEMTE, Arizona State University, Tempe, AZ 85281, AIAA Student Member ** Avionics Team, B.Sc.Eng. ’22, SEMTE, Arizona State University, Tempe, AZ 85281, AIAA Student Member
†† Propulsion Team, B.Sc.Eng. ’21, SEMTE, Arizona State University, Tempe, AZ 85281, AIAA Student Member
‡‡ Avionics Team, B.Sc.Eng. ’23, CIDSE, Arizona State University, Tempe, AZ 85281, AIAA Student Member
§§ Propulsion Team, B.Sc.Eng. ’23, SEMTE, Arizona State University, Tempe, AZ 85281, AIAA Student Member
𝐷 = Diameter
𝑓 = Friction factor
𝐹 = Thrust
𝑔0 = Acceleration due to gravity
ℎ = Heat transfer coefficient
ℎ𝐿 = Head loss
𝑘 = Thermal conductivity
𝐾𝐿 = Resistance coefficient
𝐾𝑂𝑃 = Distance scaling factor
𝐿 = Length
𝐿∗ = Characteristic length
𝐿𝑓 = Nozzle length factor
�̇� = Mass flow rate
𝑀 = Mach number
𝑀𝑊 = Molecular weight
𝑁𝑢 = Nusselt number

2
𝑃 = Pressure (𝑃𝑐)𝑛𝑠 = Nozzle stagnation pressure
𝑃𝑟 = Prandtl number
𝑞 = Heat flux
𝑅 = Gas constant
𝑅𝐶 = Radius
𝑅𝐷 = Orifice diameter ratio
𝑅𝐺 = Resistor gain
𝑡 = Time
𝑡𝑊 = Wall thickness
𝑇 = Temperature
(𝑇𝑐)𝑛𝑠 = Nozzle stagnation temperature
𝑣 = Velocity
𝑉 = Volume
𝑊 = Net explosive weight
𝑋𝐻𝐹 = Hazard fragmentation distance
𝑋𝑂𝑃 = Peak incident overpressure distance
𝑧 = Height
II. Introduction
OR nearly two decades, there has been a student-driven interest in rocketry and rocket propulsion at Arizona State
University (ASU). In 2003, Daedalus Astronautics was founded in hopes of attracting students with similar levels
of interest in the hobby. The club grew slowly at first, but over time the membership grew and gained experience with
progressively larger and more complicated projects. This included mixing and burning solid motors of a variety of
sizes, launching multi-stage high-power rockets, and developing and testing experimental hybrid rocket motors as
seen in Fig. 1. As students gained knowledge and skills
desired by industry, multiple members went on to be
recruited by several leading aerospace engineering
firms.
Today, Daedalus Astronautics, now Sun Devil
Rocketry (SDR), has an active membership of over 70
undergraduate and graduate students in multiple
academic disciplines collaborating on projects related
to high-power rocketry and rocket propulsion
research. However, despite the storied history of the
organization and the university, no one has ever
successfully tested a bipropellant liquid rocket engine at ASU. Past attempts by students in SDR to pursue projects in
liquid propulsion have yielded incomplete success. An impinging liquid injector prototype was cold-flowed by a
student in an attempt to observe its impingement characteristics, and a group of students gained knowledge of liquid
propulsion while attempting to design a nitrous oxide/isopropyl alcohol bipropellant engine, but further progress has
been limited by a lack of permanent support.
With the growth of commercial spaceflight, there is an increasing student interest in acquiring the skills and
knowhow to better contribute to industry or academia having already been exposed to some of the intricacies of liquid
propulsion systems. However, no system or project exists at ASU to provide this type of hands-on education. A group
of students set out in fall of 2019 to develop, manufacture and test a liquid rocket engine from the ground up, with the
intention of using it as a project-based educational tool.
III. Project Planning and Requirements
While past projects at SDR made important steps towards the development of a functioning engine, it was clear
that strong project planning and organization would be necessary to make further gains. Therefore, early project
members created central requirements and deliverables for the project as well as an organizational structure before
beginning engine research and development. As a core goal for the project was project-based education, creating an
engine that utilized industry-relevant systems and techniques was desirable. It was also desirable to set requirements
which would be feasible to execute, as the project team had little prior experience with liquid propulsion systems.
Based on current bipropellant engines used on orbital launch vehicles, successful propulsion projects of other
university teams, and preliminary trade studies, the following requirements were specified for the engine:
• The engine shall produce 405 lbf of thrust for a continuous duration of 5 seconds.
• The engine shall operate at a chamber pressure of 250 psig.
• The engine shall utilize liquid oxygen and kerosene as the propellants.
• The engine shall utilize regenerative methods to cool the thrust chamber.
The specification of these deliverables allowed for confidence in design and development about a specific goal,
without fear of fundamental requirement modifications later. To support this development and assign subsystem
F
Figure 1. SDR Experimental Hybrid Rocket Motor

3
responsibility to specific team members, a sub-team structure was devised. Below in Fig. 2 is an organization diagram
showing the primary sub-teams as well as the developmental responsibilities assigned to them at the beginning of the
project.
As the development progressed over time, both the specified requirements and organizational structure of the
project matured to accommodate changes in capability and team personnel.
Once top-level deliverables were defined, development of the engine could begin. This process involved
researching standards for liquid propulsion systems, trade studies on potential subsystem solutions, and calculations
based on theory and widely available empirical relations. However, additional systems are required to make a liquid
rocket engine function. Propellant must be pressurized and delivered to the engine in a suitable fashion, data must be
collected and reported on critical safety and performance variables of the test, thrust from the engine must be statically
supported, and a physical location must be prepared to host all these activities. Each of these challenges were worked
in parallel with engine development.
IV. Liquid Rocket Engine Development
The liquid rocket engine contains multiple subsystems, each critical to the function of the engine. A propellant
manifold must deliver from feedlines to injector orifices, which will atomize and mix the propellant. This atomizing
and mixing must occur in a combustion chamber, which will sustain a chemical reaction between the two propellants.
Once combustion gases have propagated downstream, they must exit the system through a nozzle. This nozzle must
accelerate gases rapidly in order to generate thrust. Finally, due to the large amounts of heat generated during this
process, a method of cooling must be addressed.
Design of the engine began with selecting a mass mixture ratio, also written as O/F ratio, to support combustion.
Using the thermochemical analysis technique detailed in Sutton and Biblarz, the specific impulse of
hydrocarbon/liquid oxygen combustion is shown to be greatest at an O/F of 2.3 when assuming frozen equilibrium
expansion and at an O/F of 2.5 when assuming shifting equilibrium[1]. As shifting equilibrium tends to overestimate
engine performance and frozen equilibrium tends to underestimate performance, choosing a mixture ratio between 2.3
and 2.5 would yield maximum performance[1]. However, sustaining kerosene/liquid oxygen combustion near the
optimal mixture ratio would generate a chamber temperature near 6,000 °F. While systems using advanced materials
and manufacturing techniques can sufficiently cool a thrust chamber operating at such high temperatures, only readily
available materials and construction methods are suitable for the engine under consideration. Additionally, the
relatively low chamber pressure and thrust of the engine result in a low mass flow rate and therefore decreased cooling
capability. Therefore, a fuel-rich mixture ratio must be selected. A trade study was
performed using CEA, a chemical equilibrium analysis program made by NASA
Glenn, to predict combustion performance. As the mixture ratio decreases, so does
combustion temperature and performance. Following the trade, the mixture ratio
was set at 1.6, resulting in a specific impulse decrease of 23 sec and a combustion
temperature decrease of 1,560 °F. Following the determination of mixture ratio,
combustion properties could be further evaluated by CEA. Tabulated in Table 1 are
some notable variables determined.
A. Nozzle and Combustion Chamber
A combustion chamber must be designed to sustain combustion at the appropriate pressure and propagate reacted
gases towards the nozzle. The nozzle must accelerate this flow to exhaust velocity and decrease the pressure of the
flow to match the designed exit plane pressure. As stated in the system requirements, the rocket engine must combust
liquid oxygen and kerosene at a combustion chamber pressure of 250 psig and produce 405 lbf of thrust. Also, since
Figure 2. Preliminary Organizational Diagram
Table 1. Combustion and
Nozzle Expansion Properties
(𝑇𝑐)𝑛𝑠 (°𝐹) 4,381
𝛾𝑡 1.241
𝐴𝑒/𝐴𝑡 3.091
𝑐∗ (𝑓𝑡/𝑠) 5,533
𝐶𝑓 1.372

4
the engine is designed for ground testing, the engine can be constrained to operation at one altitude. Given Tempe,
Arizona’s altitude of 1,140 ft. above sea level, atmospheric pressure 𝑃𝑎𝑡𝑚 is equal to 14.12 psi. Flow through an
enclosed system with variable cross-sectional area is generally analyzed as three-dimensional. However, as the
variation of area in this case is gradual, flow can be treated as quasi-one-dimensional, simplifying analysis[2]. Design
begins with coefficient of thrust 𝐶𝑓, a key performance parameter indicating the quality of exhaust gas expansion by
the nozzle. Optimum thrust coefficient is determined when using CEA. As thrust and chamber pressure are known,
Eq. (1) can be used to solve for the optimal area of the throat 𝐴𝑡, where 𝐹 is thrust and (𝑃𝑐)𝑛𝑠 is total chamber pressure
at the nozzle inlet[1].
𝐶𝑓 =𝐹
At(𝑃𝑐)𝑛𝑠 (1)
Combustion chamber configuration has a significant impact on how the rest of the engine is designed and can be
instrumental in ensuring design tolerances are met when the engine is part of a larger system. Engine mass budget,
cooling requirements, and manufacturing ability must be considered when determining thrust chamber geometry.
Additionally, the size and shape of the combustion chamber must provide sufficient volume for propellants to
adequately atomize, mix, evaporate, and thoroughly combust[3]. Different propellant combinations and states yield
different mixing, vaporization, and reaction times, and therefore different requirements for combustion chamber
volume. However, the timescales for mixing and reaction of propellants are typically small compared to the timescale
for propellant vaporization[1]. As such, the characteristic
droplet vaporization time is the rate governing process in
combustion and ultimately determines the required
combustion chamber length. Vaporization time is largely
dependent on the injected propellants’ droplet size, which is
a function of injector geometry, pressure drop across the
injector, surface tension and viscosity of the propellant, as
well as the injection velocity[1]. However, correlations
relating these factors must be experimentally derived, and are
therefore unsuitable to use in the preliminary engine design.
As no design correlations were available based on
vaporization time, another design correlation must be used.
One method is by relating the chamber length and throat
diameter of previous successful rocket engines. As throat size
is a relatively trivial characteristic to determine, using it as a
baseline to provide a preliminary chamber length is
reasonable. To determine the optimum combustion chamber length, vaporization characteristics must still be
determined. A sample correlation curve from Braeunig is shown in Fig. 3, though such curves can also be found in
literature[4][5]. Note that in this case, the combustion chamber length is defined as the distance from the aft end of the
injector plate to the nozzle throat plane.
Having determined a preliminary combustion chamber length, the combustion chamber volume can be found. The
characteristic chamber length, 𝐿∗ can be used to find chamber volume. The 𝐿∗ parameter allows for a geometric
representation of combustion residence time, the time for which propellants must be retained in the chamber to ensure
complete combustion, based on propellant combination[4]. Typical characteristic lengths for liquid oxygen/RP-1
engines are between 40 in and 50 in[4]. As RP-1 is a kerosene-type fuel, this range was used to set 𝐿∗ as 50 in. While
the use of an excessively large value for 𝐿∗ can be detrimental to system performance, the risk of incomplete
combustion led to the selection of a conservatively long characteristic length. Combustion chamber volume may be
found using Eq. (2), where 𝑉𝑐 is chamber volume[1].
𝐿∗ =𝑉𝑐
𝐴𝑡 (2)
The chamber diameter must satisfy the previously calculated thrust chamber length and volume. As a cylindrical
combustion chamber is being used, the forward section of the chamber can be approximated as a cylinder and the
converging section can be approximated as a truncated cone. However, the length and therefore the volume of the
converging section is dependent on 𝛼, the convergent half-angle. This angle can range from 20° to 45°. It should be
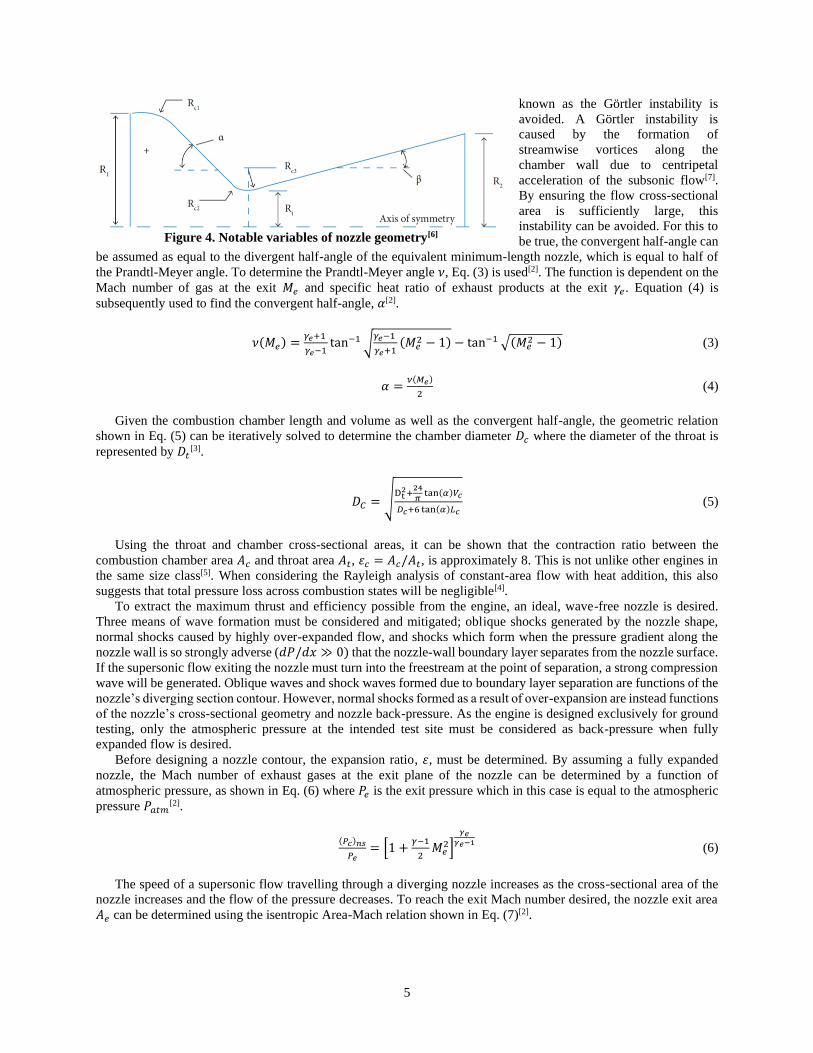
set such that, when considered with the converging radius of curvature 𝑅𝑐1 shown in Fig. 4, a centrifugal instability
Figure 3. Historical correlation between throat
diameter and chamber length[3]
5
known as the Görtler instability is
avoided. A Görtler instability is
caused by the formation of
streamwise vortices along the
chamber wall due to centripetal
acceleration of the subsonic flow[7].
By ensuring the flow cross-sectional
area is sufficiently large, this
instability can be avoided. For this to
be true, the convergent half-angle can
be assumed as equal to the divergent half-angle of the equivalent minimum-length nozzle, which is equal to half of
the Prandtl-Meyer angle. To determine the Prandtl-Meyer angle 𝜈, Eq. (3) is used[2]. The function is dependent on the
Mach number of gas at the exit 𝑀𝑒 and specific heat ratio of exhaust products at the exit 𝛾𝑒. Equation (4) is
subsequently used to find the convergent half-angle, 𝛼[2].
𝜈(𝑀𝑒) =𝛾𝑒+1
𝛾𝑒−1tan−1 √
𝛾𝑒−1
𝛾𝑒+1(𝑀𝑒
2 − 1) − tan−1 √(𝑀𝑒2 − 1) (3)
𝛼 =𝜈(𝑀𝑒)
2 (4)
Given the combustion chamber length and volume as well as the convergent half-angle, the geometric relation
shown in Eq. (5) can be iteratively solved to determine the chamber diameter 𝐷𝑐 where the diameter of the throat is
represented by 𝐷𝑡[3].
𝐷𝐶 = √Dt
2+24
𝜋tan(𝛼)𝑉𝑐
𝐷𝑐+6 tan(𝛼)𝐿𝑐 (5)
Using the throat and chamber cross-sectional areas, it can be shown that the contraction ratio between the
combustion chamber area 𝐴𝑐 and throat area 𝐴𝑡, 휀𝑐 = 𝐴𝑐/𝐴𝑡, is approximately 8. This is not unlike other engines in
the same size class[5]. When considering the Rayleigh analysis of constant-area flow with heat addition, this also
suggests that total pressure loss across combustion states will be negligible[4].
To extract the maximum thrust and efficiency possible from the engine, an ideal, wave-free nozzle is desired.
Three means of wave formation must be considered and mitigated; oblique shocks generated by the nozzle shape,
normal shocks caused by highly over-expanded flow, and shocks which form when the pressure gradient along the
nozzle wall is so strongly adverse (𝑑𝑃/𝑑𝑥 ≫ 0) that the nozzle-wall boundary layer separates from the nozzle surface.
If the supersonic flow exiting the nozzle must turn into the freestream at the point of separation, a strong compression
wave will be generated. Oblique waves and shock waves formed due to boundary layer separation are functions of the
nozzle’s diverging section contour. However, normal shocks formed as a result of over-expansion are instead functions
of the nozzle’s cross-sectional geometry and nozzle back-pressure. As the engine is designed exclusively for ground
testing, only the atmospheric pressure at the intended test site must be considered as back-pressure when fully
expanded flow is desired.
Before designing a nozzle contour, the expansion ratio, 휀, must be determined. By assuming a fully expanded
nozzle, the Mach number of exhaust gases at the exit plane of the nozzle can be determined by a function of
atmospheric pressure, as shown in Eq. (6) where 𝑃𝑒 is the exit pressure which in this case is equal to the atmospheric
pressure 𝑃𝑎𝑡𝑚[2].
(𝑃𝑐)𝑛𝑠
𝑃𝑒= [1 +
𝛾−1
2𝑀𝑒
2]
𝛾𝑒𝛾𝑒−1
(6)
The speed of a supersonic flow travelling through a diverging nozzle increases as the cross-sectional area of the
nozzle increases and the flow of the pressure decreases. To reach the exit Mach number desired, the nozzle exit area
𝐴𝑒 can be determined using the isentropic Area-Mach relation shown in Eq. (7)[2].
Figure 4. Notable variables of nozzle geometry[6]

6
𝐴𝑒
𝐴𝑡=
1
𝑀𝑒[
2
𝛾+1(1 +
𝛾−1
2𝑀𝑒
2)]
𝛾+1
2(𝛾−1) (7)
Having found the expansion ratio 휀 = 𝐴𝑒/𝐴𝑡, there are multiple established methods of contouring a nozzle.
However, each method has distinct benefits and drawbacks which must be weighed according to project priorities. As
previously discussed, the nozzle contour must avoid the formation of shocks due to boundary layer separation and
should minimize irreversibilities which would increase flow entropy and lower performance. In addition, flow at the
nozzle exit should be uniform and axial such that the momentum of all gas exiting the nozzle is contributing to thrust.
Finally, minimizing nozzle length is desirable to reduce engine size, weight, and cooling requirements. Three nozzle
types were considered; the simple conical nozzle, ideal bell nozzle, and non-ideal bell nozzle or Rao nozzle. Due to
their shape, conical nozzles are relatively simple to manufacture;
however, a portion of exit flow is divergent which leads to a
reduction in thrust[8]. This effect can be minimized by increasing
nozzle length, but this length is detrimental to engine size and
cooling. Unlike conical nozzles, ideal bell nozzles optimized using
the method of characteristics can produce perfectly parallel flow
at the exit. However, these nozzles are very long and thus present
the same problems as conical nozzles. A Rao nozzle, however, has
a considerably shorter length than the ideal bell nozzle and
produces significantly smaller divergence losses than the conical
nozzle, making it the ideal choice for the system.
The Rao contour is parabolic in nature and can be generated
using a series of calculations detailed in Appendix A. Following
the generation of the nozzle contour, the combustion chamber
geometry is complete and is shown in Fig. 5. Finally, performance
characteristics may be calculated. The total propellant mass flow
rate �̇� can be found using Eq. (8), where (𝑇𝑐)𝑛𝑠 is the total combustion chamber temperature[1]. The specific heat ratio
and total temperature at the chamber is obtained from CEA.
�̇� =(𝑃𝑐)𝑛𝑠𝐴𝑡
√𝑅(𝑇𝑐)𝑛𝑠[𝛾 (
2
𝛾+1)]
1
2 (8)
The velocity of the exhaust gases exiting the nozzle 𝑣𝑒 can then be determined. In Eq. (9), the gas constant used is
the one evaluated by CEA right at the exit of the combustion chamber while the 𝛾 used is the one evaluated at the
nozzle exit[1].
𝑣𝑒 = (2𝛾
𝛾−1) 𝑅(𝑇𝑐)𝑛𝑠 [1 − (
𝑃𝑒
(𝑃𝑐)𝑛𝑠)
𝛾−1
𝛾] (9)
B. Thrust Chamber Cooling
For combustion to be sustained, the thrust chamber must remain rigid and able to support the pressures generated
by engine operation. However, as the temperature of most materials used to construct combustion chambers rise, their
strength tends to decrease. As temperatures continue to rise, these materials either fail or melt, destroying the engine.
There are no widely available materials that can sustain the extremely high temperatures generated in high-
performance rocket engines, some which can produce combustion temperatures exceeding 6000°F[3]. Recall that when
analyzing the selected propellant combination and ratio with CEA, the combustion temperature was predicted to
approach 4400°F. While considerably lower than the combustion temperatures in high-performance engines, this is
still well out of capability of these materials[1]. However, a variety of methods exist to manage and remove heat
generated by combustion and maintain thrust chamber integrity. Perhaps the simplest method is radiation cooling,
during which heat is radiated from the engine into the surrounding space. However, radiation cooling is generally
utilized to cool very small engines or in-space nozzle extensions and would not provide sufficient heat transfer in this
case[4]. Another method, and perhaps the predominant method used in today’s orbital-class liquid rocket engines, is
regenerative cooling. Regenerative cooling uses a propellant as coolant; it is fed through multiple channels in the
combustion chamber prior to being delivered to the injector[3]. The coolant absorbs heat transferred through the
chamber wall, lowering the temperature of the material. In addition, heating of the propellant reduces vaporization
Figure 5. Finalized thrust chamber contour

7
time, increasing engine efficiency. However, designing and manufacturing a regenerative cooling system is complex
and requires intensive analysis. Orbital-class liquid rocket engines have also been known to use ablative cooling,
where a coating on the inside of the combustion chamber undergoes pyrolysis and is ejected from the nozzle[3]. While
ablative cooling can be incredibly effective, it is essentially a one-shot device and cannot be reused once the ablative
is expended. Additionally, manufacturing of ablative substances is outside the capabilities of labs associated with SDR
and would provide significant challenges. As a supplement to regenerative cooling and ablative cooling, film cooling
is often used. Film cooling involves the secretion of propellant through orifices in the injector plate or chamber wall
to create a boundary layer of coolant between combustion and the wall[3]. Additional exotic cooling methods include
dump cooling, and transpiration cooling, but were not considered due to operational or manufacturing challenges[4].
Given the high performance of regenerative cooling, the
ability to reuse the system, and its abundance in modern rocket
engines, it was selected as the primary cooling method.
However, due to the relatively low mass flow rate of
propellant and high predicted heat flux, film cooling was
selected as a supplementary cooling method.
To implement regenerative cooling, passages must be
created to transport coolant along the chamber wall. These
channels must be thin enough to allow heat transfer to transfer
to the coolant while also maintaining structural integrity.
Multiple channel designs have been used. Tubular wall combustion chambers are constructed of multiple tubes which
transport the propellant. These walls are generally brazed together and reinforced by bands[4]. These tubes can be very
thin, lending to desirable heat transfer properties. However, high precision is required to manufacture a tubular wall
on such a small scale. As such, a tubular wall is an appropriate option. Channel wall construction, shown in Fig. 6,
consists of many rectangular channels within the chamber wall. These channels are generally milled from the
combustion chamber liner and sealed using
electrodeposition of a close-out structure or by
brazing or sealing a jacket around the channels[9].
Alternatively, channels may be generated during
manufacturing of the combustion chamber if
selective laser melting is used[9]. A channel wall
construction was selected due to the reduced
manufacturing challenge presented. It was also
decided that coolant flow is in the opposite direction
to the hot gas flow such that propellant can be easily
delivered to the injector manifold. To create the
channel walls, an inner combustion chamber liner
will be milled prior to being closed-out with a solid, single-piece jacket. While this provides tolerancing and sealing
challenges, it allows for modulation of individual design elements late in the testing process without constructing an
entirely new engine. A single-piece jacket also creates an open volume around the nozzle throat. To enclose the
channels in this region, a two-piece cuff was designed which fits flush against the nozzle contour underneath the
jacket. Sealing of the combustion chamber assembly, shown in Fig. 7, is accomplished with a combination of O-rings
and C-rings.
Given the compatibility issues presented by liquid oxygen, kerosene was
selected as the coolant. Given its high thermal conductivity, copper was
selected as the material for the combustion chamber liner. While it has a low
melting point and softer than other metals like aluminum or steel, the thermal
conductivity of copper significantly increases the capability of the
regenerative circuit to remove heat from the chamber wall[1]. As material
selection for the combustion chamber jacket and nozzle cuff have no impact
on cooling ability, alloy steel 8620 and stainless steel 304 were selected
respectively. Having determined the general construction of the thrust
chamber and how coolant will be contained, the regenerative channels must
be designed. To do so, multiple modes of heat transfer must be analyzed. As
shown in Fig. 8, in the steady-state, one-dimensional case, heat transfer from
the combustion gas to the coolant involves a combination of convection
through multiple boundary layers and conduction through the chamber wall[4].
Figure 6. Diagram of channel wall cross section [4]
Figure 7. Thrust chamber assembly cross section
Figure 8. Heat transfer schematic
for regenerative cooling[4]

8
Radiative heat transfer, which is generally only appreciable in the combustion chamber, can also contribute from 5%
to 35% of the total heat transfer[9]. First, we may analyze the convective transfer of heat from combustion gases to the
chamber wall. This steady-state process can be represented by Eq. (10) below, where 𝑞 is the rate of heat flux, ℎ𝑔 is
the gas-side heat transfer coefficient, 𝑇𝑎𝑤 is the adiabatic wall temperature, and 𝑇𝑤𝑔 is the gas-side wall temperature[4].
𝑞 = ℎ𝑔(𝑇𝑎𝑤 − 𝑇𝑤𝑔) (10)
To determine the gas-side heat transfer coefficient, Eq. (11) from Bartz’s correlation of nozzle heat transfer is
used[4].
ℎ𝑔 = [0.026
𝐷𝑡0.2 (
𝜇0.2𝐶𝑝
𝑃𝑟0.6 )𝑛𝑠
((𝑝𝑐)𝑛𝑠𝑔
𝑐∗ )0.8
(𝐷𝑡
𝑅)
0.1
] × (𝐴𝑡
𝐴)
0.9
𝜎 (11)
Before the above relation can be used, the specific heat at constant pressure 𝐶𝑝, Prandtl number 𝑃𝑟, fluid viscosity
𝜇, and correction factor for property variations across the boundary layer 𝜎 must be determined. Generally,
combustion-gas mixture data may be used to determine 𝐶𝑝 and 𝑃𝑟[4]. However, as no such data is available in this
case, specific heat at constant pressure may be determined using Eq. (12) where 𝑅𝐶 is the nozzle radius of curvature
at the throat in inches, and 𝐽 is a conversion factor[4]. Likewise, 𝑃𝑟 may be found using Eq. (13)[4].
𝐶𝑝 =𝛾𝑅𝐶
(𝛾−1)𝐽 (12)
𝑃𝑟 =4𝛾
9𝛾−5 (13)
The fluid viscosity can be determined using Eq. (14), which applies empirical multipliers and exponents to the gas
mixture’s temperature 𝑇 in °R and molecular weight 𝑀𝑊 in lb/mol[4].
𝜇 = (46.6 × 10⁻¹⁰)𝑀𝑊0.5𝑇0.6 (14)
To determine the correction factor 𝜎 to be used, Eq. (15) below may be used[4]. Alternatively, Fig. 9 shows values
of correction factor 𝜎 as calculated by Bartz based on 𝑇𝑤𝑔/(𝑇𝑐)𝑛𝑠 ratio and 𝛾.
𝜎 =1
[1
2
𝑇𝑤𝑔(𝑇𝑐)𝑛𝑠
(1+𝛾−1
2𝑀𝑊
2 )+1
2]0.68
[1+𝛾−1
2𝑀𝑊
2 ]0.12
(15)
Returning to Eq. (10), the gas-side heat transfer coefficient may
be determined. Note that ℎ𝑔 will be maximum when 𝐴𝑡/𝐴 = 1, or
at the throat. Having solved for the gas-side heat transfer
coefficient, focus may now turn to determining the maximum
allowable heat flux through the chamber wall. 𝑇𝑎𝑤 may be found by
multiplying (𝑇𝐶)𝑛𝑠 by a stagnation recovery factor[4]. 𝑇𝑤𝑔, or the
maximum allowable chamber wall temperature, is dependent on the
constructing material. From analysis of the properties of pure
copper, yield stress becomes unstable between 940°F and
1160°F[10]. Given the chamber is constructed from C11000 copper,
the maximum service temperature was set at 840°F. Having
calculated 𝑇𝑎𝑤 , 𝑇𝑤𝑔 and ℎ𝑔, the heat flux at the throat 𝑞 can then be
determined with Eq. (10). The fact that 𝑞 is constant throughout the
chamber wall enables the coolant-side wall temperature 𝑇𝑤𝑐 to be
calculated using Eq. (16) for conduction through a wall below for
an assumed wall thickness 𝑡𝑊, where 𝑘𝑤𝑎𝑙𝑙 is the thermal
conductivity[4].
𝑞 =𝑘𝑤𝑎𝑙𝑙
𝑡𝑊(𝑇𝑤𝑔 − 𝑇𝑤𝑐) (16)
Figure 9. Values of correction factor 𝝈 for
property variation across boundary layer[4]
9
Using 𝑇𝑤𝑐 and knowledge of the coolant temperature 𝑇𝑐𝑜 , the coolant-side heat transfer coefficient ℎ𝑐 required to
achieve a heat flux rate of 𝑞 can be found using Eq. (17) below[4].
𝑞 = ℎ𝑐(𝑇𝑤𝑐 − 𝑇𝑐𝑜) (17)
The required coolant-side heat transfer coefficient can be used to calculate the required channel size by combining
the relationship between the Nusselt number 𝑁𝑢𝑐 and convective heat transfer coefficient for a pipe ℎ𝑐, Eq. (18), with
a correlation for the Nusselt number that is suited to lower speed flow than the Bartz correlation is. Setting the
correlation and Eq. (18) equal to one another results in an equation that can be solved to find the required pipe diameter
𝐷, and thus the needed channel size.
𝑁𝑢𝑐 =ℎ𝑐𝐷
𝑘 (18)
The required number of coolant channels can then be approximated using the circular tubular wall method detailed
in Huzel and Huang[4]. Using this method, approximately 52 channels are required. To convert this to a channel wall
design, add film cooling elements, consider radiative heat transfer, and verify heat flux calculations, a commercial
chemical rocket analysis tool called Rocket Propulsion Analysis is used. Following optimization of the cooling design
in Rocket Propulsion Analysis, the regenerative cooling circuit was set to use 45 square channels with a constant
square cross-section with side lengths of 1/16-inch. Additional coolant used for film using is routed through the
regenerative circuit to increase the total mass flow to 1.26 lbm/s. To reduce machining challenges, the chamber wall
thickness was set as 1/8-inch. While in the regenerative cooling circuit, kerosene decreases in pressure by 10.8 psi and
increases in temperature by 68.3°F. By using 0.60 lbm/s of kerosene for film cooling, the maximum wall temp is
predicted to be approximately 626.3°F, well below the previously determined maximum allowable service
temperature.
C. Injector and Propellant Manifold
The role of the injection system within a bipropellant liquid rocket engine is to atomize and mix the propellants in
the combustion chamber such that efficient and stable combustion is supported. While in some experimental thrust
chamber designs injector elements are situated in the walls of the chamber, conventional engines feature injector
assemblies occupying the forward end of the combustion chamber sometimes called the injector plate[4]. A wide
variety of injector elements is in use, and the implementation of each has distinct benefits and drawbacks. Element
selection, sizing, orientation, and pattern can have significant effects on the performance and reliability of an engine[11].
Also integral to any injection system is a manifold which routes propellants from their respective feedlines to each
orifice of the injector. While the manifold does not have as significant of an effect on the performance of an engine as
the injector, it can induce pressure loss and increase manufacturing complexity. Injector design has a large impact on
the simplicity or complexity required of the manifold.
Given the impact injector element selection has on the design of many other
components within the injection system assembly, it was the first major point of
focus in injector design. Common element types used in modern liquid rocket
engines include the pintle and coaxial swirl which promote combustion stability
and throttling ability[11][12]. However, unlike-impinging elements allow for rapid
prototyping and inexpensive manufacturing. In addition, empirical relations and
guidelines are available which provide insight into element performance[11].
Without these results, costly simulations or physical testing would extend the
design phase as a suitable geometry is found.
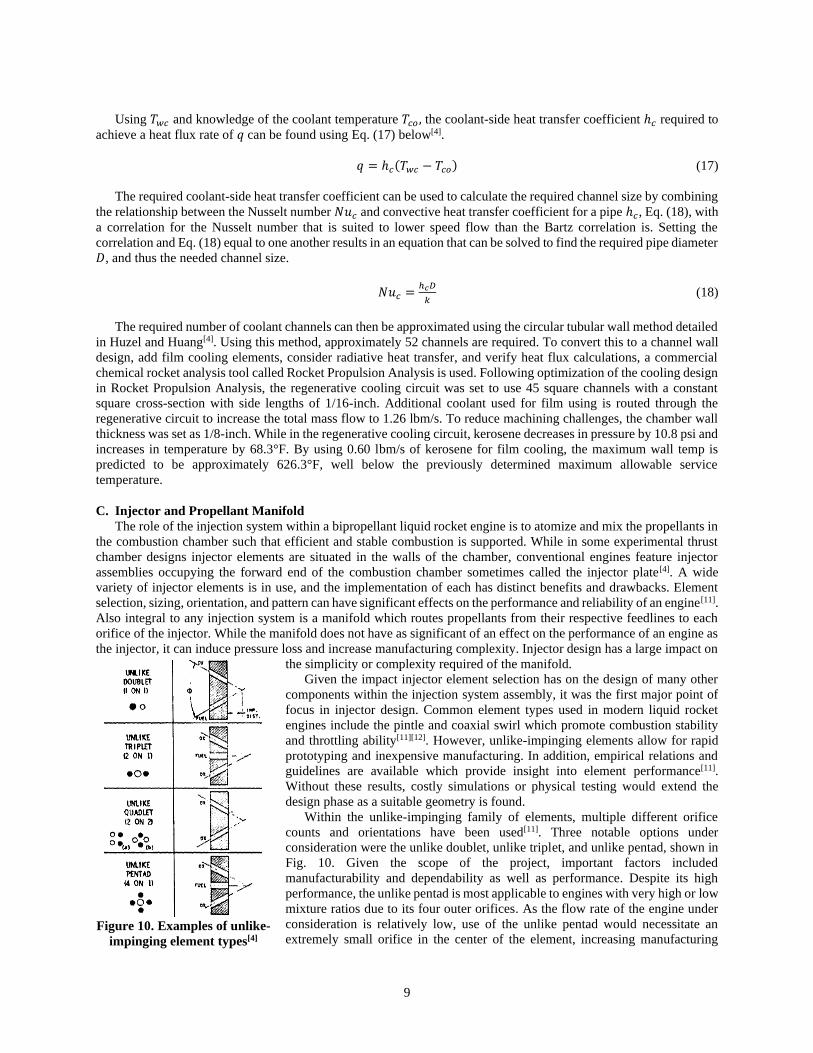
Within the unlike-impinging family of elements, multiple different orifice
counts and orientations have been used[11]. Three notable options under
consideration were the unlike doublet, unlike triplet, and unlike pentad, shown in
Fig. 10. Given the scope of the project, important factors included
manufacturability and dependability as well as performance. Despite its high
performance, the unlike pentad is most applicable to engines with very high or low
mixture ratios due to its four outer orifices. As the flow rate of the engine under
consideration is relatively low, use of the unlike pentad would necessitate an
extremely small orifice in the center of the element, increasing manufacturing
Figure 10. Examples of unlike-
impinging element types[4]

10
difficulty. In contrast, the unlike doublet is a very simple element to manufacture, and manifold design is simplified
due to only having two orifices. However, the resulting spray is not directed axially due to a momentum imbalance
between the two orifices[11]. Such an imbalance has the potential to cause chamber wall compatibility issues. The
unlike triplet suffers neither of the issues detailed above. Additionally, it has been well characterized and provides
good mixing, although it requires a manifold design more complex than that paired with an unlike doublet. Given the
mixture ratio of 1.6, an OFO configuration was used. Despite the potential for oxygen-rich flow to reach the chamber
wall, this allows for simplified manufacturing and greater repeatability.
Having selected the unlike triplet element type, variables governing the geometry of the element must be specified.
This includes the orifice diameters and diameter ratio, the impingement angle between free-stream jets, and the
impingement distance. Optimization of these factors influence the level of mixing and atomization possible and help
mitigate backsplash and stream misalignment concerns[11]. To determine orifice diameters, the diameter ratio between
fuel and oxidizer orifices must first be found. Equation (19) from Elverum and Morey was used to find a preliminary
value for this ratio, 𝑅𝐷[13]. 𝐵 is an experimental multiplier related to the orifice count used, 𝜌𝑜𝑥 and 𝜌𝑓 represent the
density of the oxidizer and fuel respectively, and �̇�𝑜𝑥 and �̇�𝑓 represent the mass flow rate of the oxidizer and fuel
respectively. From Elverum and Morey, 𝐵 = 1.577 for an unlike triplet element. A diameter ratio of 1.0625 was
calculated.
𝑅𝐷 = 𝐵 [(𝜌𝑜𝑥
𝜌𝑓) (
�̇�𝑜𝑥
�̇�𝑓)
2
]
1
1.75
(19)
Due to the experimental nature of many injectors, design
correlations based on previously successful injector designs were
considered. When selecting an impingement angle, an effort was made
to keep the angle below 90° due to backflow concerns. An example of
propellant backflow is shown in Fig. 11. From NASA SP-8089,
impingement angles greater than 90° consistently result in injector face
heating and corrosion[11]. The greatest number of correlations and
datasets found from successful configurations set an impingement
angle of 60°. Therefore, while further experimentation may merit future
modification, the impingement angle was set at 60°.
Impingement distance describes the free-flow distance following exit of fluid from the injector orifice until it
impinges another stream. The designed impingement distance can affect both injector face durability and the quality
of jet impingement. Impingement distance 𝐿𝑖, generally characterized by a ratio considering the average orifice
diameter 𝐷𝑎𝑣𝑔, can result in misimpingement of jets and combustion instabilities if too large and excessive injector
face heating if too small[11]. However, 𝐿𝑖/𝐷𝑎𝑣𝑔 values between 5 and 7 have been shown to produce few of these
related hardware problems[11]. An impingement distance 𝐿𝑖/𝐷𝑎𝑣𝑔 of 6.8 or 0.375 in was selected.
Following the specification of injector element geometry, the total element pattern and arrangement can be
considered. While the injector element geometry affects local atomization and mixing, a thoughtful placement and
pattern of elements on the injector plate contributes to the continuation of propellant mixing and a uniform mass
distribution while curbing corrosion of the chamber wall and combustion instability[11]. When designing the pattern
of elements, the number of elements and the mass-flux distribution of each element should be considered. To
determine the number of elements in the total pattern, a trade study was performed considering the size of the chamber,
manufacturing ability, desired injection velocities, instrumentation challenges, and chamber wall compatibility. A
high element count lends to a more uniform mass flow distribution, reducing the risk of combustion instability [11].
However, manifold design becomes increasingly complex and chamber wall corrosion is more likely. Low element
count provides manufacturing simplicity at the cost of atomization and mixing performance due to larger orifices.
Based on the trade study, the total element count was set as 9.
To determine the mass-flux distribution of each element, the momentum balance, and therefore the injection
velocities of each orifice, must be found. Given the total number of orifices for each propellant, 9 for fuel and 18 for
oxidizer, the mass flow rate through each orifice can be calculated. To determine the diameter of each orifice, 𝐷, Eq.
(20) below from Sutton and Biblarz can be used[1].
�̇� = 𝐶𝑑𝜋
4𝐷2√2𝜌∆𝑃 (20)
Figure 11. Illustration of propellant
backflow[11]

11
The pressure drop across the orifice is notated by Δ𝑃, and
discharge coefficient of the orifice by 𝐶𝑑. From common design
trends noted in Huzel and Huang, pressure drop was set as 20%
of design chamber pressure to act as a preliminary flow resistance
target[4]. Therefore, Δ𝑃 is equal to 50 psi. There are multiple ways
to determine discharge coefficient. The Stolz equation, while
providing a robust solution, is best applied to ideal pipe and
orifice plate systems[14]. Due to the unique non-ideal geometry
used in this case, application of the Stolz equation would not be
appropriate. Additionally, no characterizations exist to relate the
Stolz equation to such an application. However, experimental
correlations have been made between several orifice geometries
and their respective discharge coefficients[1]. These correlations
depend primarily on the length to diameter ratio of the orifice
and the type of orifice inlet used, as shown in Fig. 12 and Fig.
13. As the thickness of the injector plate and impingement angle
fix the orifice length, and the diameter of the orifice can be
iteratively approximated, the discharge coefficients can be
found. The discharge coefficient for fuel orifices was determined
to be 0.7. This is assuming that the inlet, due to its more
complicated manifold requirements, cannot be directly accessed
by machining tools and is therefore a semi-blind inlet. The
oxidizer inlets’ discharge coefficient was determined to be
slightly higher at 0.75. This is due to a larger length to diameter radio, though it also assumes that the orifice inlets
will be accessible and may be rounded.
Having determined the diameter of the fuel and oxidizer orifices using Eq. (20), the ratio between these two values
should be compared to the ideal ratio found using the relation from Elverum and Morey. Equation (21) below is used
where 𝐷𝑓 and 𝐷𝑜𝑥 are diameters of the fuel and oxidizer orifices respectively and 𝑒𝑟𝑟𝑜𝑟𝑅 is the error between ideal
and derived ratios.
|𝐷𝑓
𝐷𝑜𝑥− 𝑅𝐷| = 𝑒𝑟𝑟𝑜𝑟𝑅 (21)
The resulting error, 0.0948, was within the self-selected tolerance accepted for this application. Following
validation of calculated orifice diameters, expected performance characteristics may be found. The primary
performance characteristic evaluated was injection velocity. Assuming both
the fuel and oxidizer is injected as an incompressible liquid, the conservation
of mass can be rearranged to find the average injection velocity for each orifice
type.
𝑣 = �̇�
𝜌𝐴 (22)
The average fuel and oxidizer injection velocities were calculated to be
80.5 ft/s and 60.5 ft/s respectively. While higher injection velocities are
desirable and would improve mixing, the injection velocity is correlated to the
pressure drop across the orifice. Given the relatively low chamber pressure of
the engine, the injection velocities found are suitable and correlate with
published data[15]. Having determined injection velocities, the ratio between
inner and outer orifice momentum can be found, and correlations from
literature can be used to predict mass-flux distribution. Using Eq. (23) below,
momentum per unit time was calculated for the inner and outer orifices.
𝐹𝑜/𝑓 = �̇�𝑜/𝑓𝑣𝑜/𝑓 (23)
Figure 13. Effect of orifice inlet characteristics
on coefficient of discharge[11]
Figure 14. Mass-flux distributions
of unlike triplet elements[11]
Figure 12. Effect of bore length on coefficient
of discharge[11]
12
This resulted in momentums of 0.1837 lbf for fuel orifices and 0.1104
lbf for oxidizer orifices. Despite the 50% difference between the two
momentums, they are similar enough to assume momentum is balanced.
Figure 14 displays the mass-flux distributions assuming balanced and
unbalanced stream momentums. Given these distributions, arrangement of
the 9 elements on the injector face can be determined. Due to the oblong
spray pattern generated by a single element, interference of flows from
multiple elements must be considered. In addition, element arrangement
has a large impact on manifold complexity. Following a trade study
between multiple designs, the manifold plate in Fig. 15 was selected.
Compared to other designs, the selected pattern favors manufacturability
and reduces the probability of oxygen-rich flow being directed towards
the chamber wall.
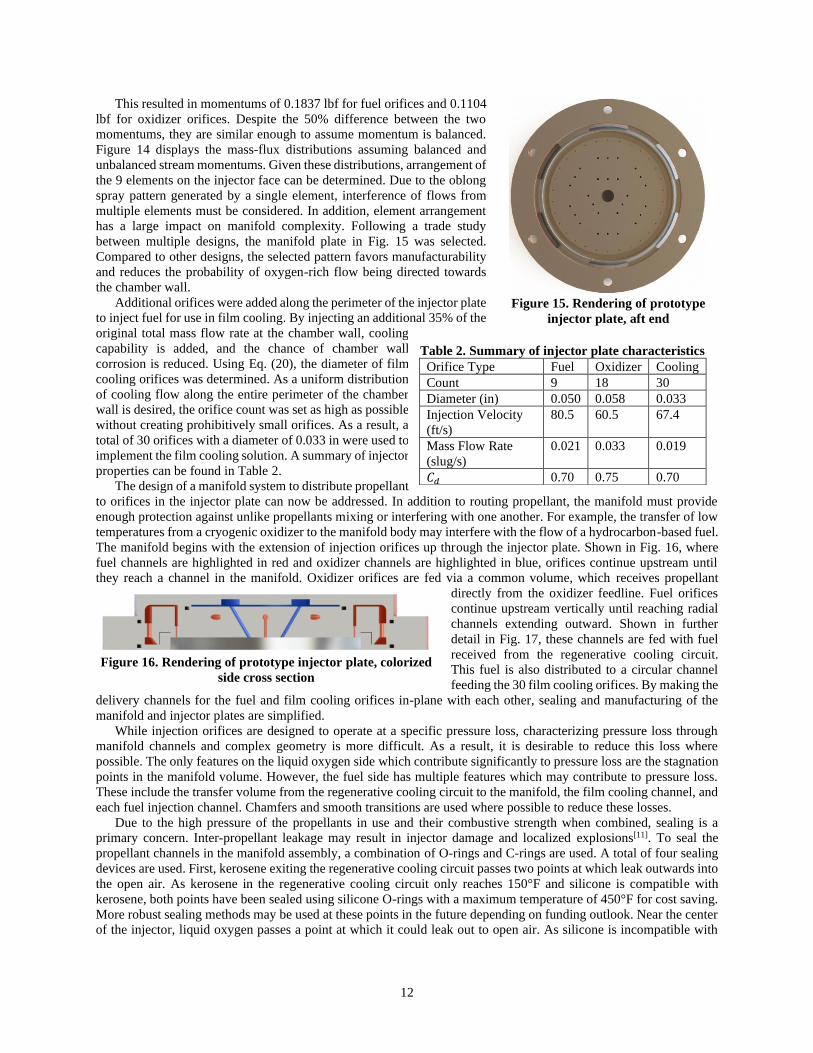
Additional orifices were added along the perimeter of the injector plate
to inject fuel for use in film cooling. By injecting an additional 35% of the
original total mass flow rate at the chamber wall, cooling
capability is added, and the chance of chamber wall
corrosion is reduced. Using Eq. (20), the diameter of film
cooling orifices was determined. As a uniform distribution
of cooling flow along the entire perimeter of the chamber
wall is desired, the orifice count was set as high as possible
without creating prohibitively small orifices. As a result, a
total of 30 orifices with a diameter of 0.033 in were used to
implement the film cooling solution. A summary of injector
properties can be found in Table 2.
The design of a manifold system to distribute propellant
to orifices in the injector plate can now be addressed. In addition to routing propellant, the manifold must provide
enough protection against unlike propellants mixing or interfering with one another. For example, the transfer of low
temperatures from a cryogenic oxidizer to the manifold body may interfere with the flow of a hydrocarbon-based fuel.
The manifold begins with the extension of injection orifices up through the injector plate. Shown in Fig. 16, where
fuel channels are highlighted in red and oxidizer channels are highlighted in blue, orifices continue upstream until
they reach a channel in the manifold. Oxidizer orifices are fed via a common volume, which receives propellant
directly from the oxidizer feedline. Fuel orifices
continue upstream vertically until reaching radial
channels extending outward. Shown in further
detail in Fig. 17, these channels are fed with fuel
received from the regenerative cooling circuit.
This fuel is also distributed to a circular channel
feeding the 30 film cooling orifices. By making the
delivery channels for the fuel and film cooling orifices in-plane with each other, sealing and manufacturing of the
manifold and injector plates are simplified.
While injection orifices are designed to operate at a specific pressure loss, characterizing pressure loss through
manifold channels and complex geometry is more difficult. As a result, it is desirable to reduce this loss where
possible. The only features on the liquid oxygen side which contribute significantly to pressure loss are the stagnation
points in the manifold volume. However, the fuel side has multiple features which may contribute to pressure loss.
These include the transfer volume from the regenerative cooling circuit to the manifold, the film cooling channel, and
each fuel injection channel. Chamfers and smooth transitions are used where possible to reduce these losses.
Due to the high pressure of the propellants in use and their combustive strength when combined, sealing is a
primary concern. Inter-propellant leakage may result in injector damage and localized explosions[11]. To seal the
propellant channels in the manifold assembly, a combination of O-rings and C-rings are used. A total of four sealing
devices are used. First, kerosene exiting the regenerative cooling circuit passes two points at which leak outwards into
the open air. As kerosene in the regenerative cooling circuit only reaches 150°F and silicone is compatible with
kerosene, both points have been sealed using silicone O-rings with a maximum temperature of 450°F for cost saving.
More robust sealing methods may be used at these points in the future depending on funding outlook. Near the center
of the injector, liquid oxygen passes a point at which it could leak out to open air. As silicone is incompatible with
Figure 16. Rendering of prototype injector plate, colorized
side cross section
Figure 15. Rendering of prototype
injector plate, aft end
Table 2. Summary of injector plate characteristics
Orifice Type Fuel Oxidizer Cooling
Count 9 18 30
Diameter (in) 0.050 0.058 0.033
Injection Velocity
(ft/s)
80.5 60.5 67.4
Mass Flow Rate
(slug/s)
0.021 0.033 0.019
𝐶𝑑 0.70 0.75 0.70

13
liquid oxygen and cryogenic temperatures would reduce the effectiveness
of a petroleum-based seal, an Inconel 718 C-ring is used. At the fourth
and most critical sealing point, there is the potential for inter-propellant
mixing. As liquid oxygen and cryogenic temperatures are present in this
environment, a second Inconel 718 C-ring is used.
To manufacture the manifold and injector plates described, only
simple lathe and mill operations are required. Considerations were made
throughout the design process to reduce the overall required machine
time, reducing cost. Similarly, system integration with the combustion
chamber, test stand, and propellant feed system was designed favoring
simplicity. A single port at the forward end of the injector manifold
receives liquid oxygen from the main oxidizer feedline. Fuel is received
from the regenerative cooling circuit through milled channels in the
propellant manifold, reducing the need for additional external plumbing
commonly found on larger engines. Data acquisition equipment interfaces
the manifold through tap-off ports. In the center of the injector, a 0.375 in
port accommodates a pressure transducer to monitor combustion chamber pressure. Additionally, the fuel manifold
features a tap-off to measure pressure and temperature of the fluid prior to injection. This provides information
necessary for density calculations and allows for measurement of the pressure drop across the regenerative cooling
circuit. Structural considerations include fasteners to secure the manifold assembly and provide the compression
necessary to seal O-rings and C-rings. As the manifold assembly is the forward-most load-bearing component of the
engine, compatibility with a structure to transfer thrust force to a load cell is also considered. Six thru-holes allow
fasteners to secure the manifold assembly to the thrust structure and the combustion chamber. Using stainless steel
socket head screws with 0.25 in thread, safety factors over 4 are achievable.
Several design iterations of the injector and manifold plate have been prototyped by additively printing PLA. These
prototypes were subjugated to fit-checks and qualitative testing. By flowing low-pressure water through the system,
sealing and impingement characteristics were evaluated by visual inspection. Initial tests produced mixed results but
led to a better understanding of injector design. Later tests demonstrated positive impingement characteristics, despite
using a source flow below design pressure.
To improve confidence in the design selected and increase understanding, computer simulations are planned.
Further qualitative testing is also planned prior to performing quantitative testing with a machined metal prototype
and increased flow rates to validate design characteristics. During these tests, pressure drop, injection velocities, and
mixing characteristics will be evaluated via cold-flow with water and later with simulating fluids.
D. Ignition
During steady-state operation of the engine, combustion is self-sustaining. However, start-up requires ignition of
propellants by heating them above their autoignition temperature[1]. This process must occur rapidly and without delay
once propellants are injected into the chamber. Retarded ignition may result in the detonation of accumulated
propellant, referred to as a “hard-start.”[1] To ensure prompt ignition, an external ignition source is used to impart large
amounts of heat to propellants during engine start-up. Multiple devices have been used to act as this ignition source,
and many more are in development. Pyrotechnic igniters burn slugs of solid propellant to generate large amounts of
heat. Solid propellants are easily characterized, and manufacturing processes have matured to allow for reliable
replication of results[4]. However, a solid propellant slug is a one-shot device and must be replaced after use.
Additionally, many solid propellants contain components which may easily damage the interior of the thrust chamber.
A more repeatable method is by using a spark-initiated torch igniter. These igniters use a spark plug or other spark
plasma generating device to initiate a small amount of propellant before ejecting the combustion products into the
combustion chamber[4]. Torch igniters may use the same propellants as the combustion chamber, further simplifying
pad operations. However, development and implementation of a spark igniter is more complex and expensive than
using a pyrotechnic igniter. Finally, hypergolic igniters utilize propellants which spontaneously ignite with each other,
allowing for rapid ignition[4]. However, handling of hypergolic propellants is prohibitively hazardous and therefore
not suitable for a student project, regardless of any possible benefits.
Given the ease of implementation and SDR’s ability to manufacture small quantities of solid propellant in-house,
a nozzle-inserted pyrotechnic igniter was selected. Literature cites multiple propellants which are commonly used to
generate ignition slugs[1]. However, most of these are double-base compounds and exceed the manufacturing ability
of SDR. As a result, a composite AP/HTPB charge will be used, initiated by a nichrome bridgewire. While AP/HTPB
is generally mixed with a metal additive to increase performance, metal products may damage the combustion chamber
Figure 17. Rendering of prototype
injector plate, forward cross section

14
and it was decided they should be excluded[1]. The propellant charge is suspended in the center of the combustion
chamber and is blown out by combustion products following engine start-up. To allow for the detection of good igniter
initiation by the control operator and subsequent ignition of propellants, a 5 second burn time was selected. As with
liquid propellants, the mixture ratio of solid propellants may be modified to change burn temperature. PROPEP was
used to predict the burn temperature of AP/HTPB at different mixture ratios. As the combustion chamber liner is
constructed of copper, the burn temperature was set at 1960°F to allow for maximum heat flux without damaging the
chamber wall. This resulted in a mixture ratio of 8/3.4 parts mass of AP/HTPB.
Empirical development will be required to characterize the burn characteristics of the pyrotechnic slug. Multiple
samples must be tested to observe burn time, burn temperature, size of reaction products, and manufacturing
consistency. Following characterization, results can be used to improve engine start-up sequencing procedures.
V. Ground Support Equipment Development
Testing a liquid rocket engine requires thoughtful management of propellants and pressurants. Propellants must
be delivered to the engine pressurized, and the system must also be able to accept new propellant during loading,
purge the system of unwanted contaminants, prevent the backflow of propellants, relieve excess pressure, and perform
several other duties. A system must also be in place to allow for semi-autonomous control of these activities from a
safe distance. In addition, live monitoring of test conditions and a means to record data for future study must be
considered. A complete ground support system which satisfies these needs was developed to support the firing of the
rocket engine.
A. Propellant Feed and Management
The propellant feed and management system must support multiple activities critical to project success. Propellants
must be stored in containers prior to being delivered to the engine in the state and at the rate desired. A method must
be devised to safety fill and pressurize these containers. Once propellant is released, it must be controlled such that its
condition is maintained, and tests are repeatable. Additional safety and control features are required to ensure
operational hazards are mitigated and there is minimal risk to the safety of personnel and the system. Finally, the
measurable characteristics of propellant flow during these tests must also be observed so system performance can be
evaluated. The system plumbing and instrumentation diagram, shown in Appendix B, will be frequently referenced
throughout this section.
To support the liquid rocket engine previously described, the system must supply liquid oxygen to the injector at
a mass flow rate of 1.057 lbm/s and a pressure of 300 psig. Kerosene must similarly be delivered regenerative cooling
circuit at a mass flow rate of 1.260 lbm/s, pressurized to 310 psig. Given the engine-firing duration 𝑡, the required
usable propellant volume for each propellant tank 𝑉𝑜/𝑓 can be calculated using Eq. (24) below.
𝑉𝑜/𝑓 =�̇�𝑜/𝑓𝑡
𝜌 (24)
With a desired hot-fire length of 5 seconds, the required usable propellant volumes are 128 in3 and 215 in3 for
liquid oxygen and kerosene respectively. Spacefaring systems necessitate the consideration of trapped propellant
volume, tank ullage volume, and boiled-off propellant volume when selecting a tank[4]. However, the focus of this
system is on ground test and total weight is of little concern. This allows for selection of tanks larger than necessary,
increasing flexibility in future testing. As such, stainless steel, 231 in3, double-tapped sample cylinders were selected
as the two propellant tanks. Off-the-shelf tank solutions were desirable to keep costs low. In addition, institutional
rules prohibit the modification of pressure vessels. Double-tapped sample cylinders provide two ports so pressurant
and propellant feedlines can be separated, removing the need for vessel modification. The tanks are also rated to high
pressures and stainless steel is compatible with all working fluids used. As no special requirements exist for the
pressurant tank, a standard K-type gas cylinder can be used.
With tanks selected, operations to fill and drain these tanks must be considered. To fill or drain the kerosene tank,
no hazardous or complex operations are needed. As shown in Appendix B, a ball valve is present above and below
the kerosene tank leading to the atmosphere. When filling the tank, the upper ball valve is opened, and a clean funnel
is inserted to allow kerosene to be poured into the tank. When the ball valve is closed and locked, the system can be
pressurized. Likewise, draining the tank is as simple as opening the lower ball valve and releasing any fluid in the
tank to a container. The primary concern when filling the liquid oxygen tank is the cryogenic nature of the propellant.
If liquid oxygen were quickly poured in the tank, it would evaporate due to the high temperature difference between
the surface of the tank and liquid oxygen. Similarly, if liquid oxygen were released from a tank to travel through tubing

15
towards an engine still at room temperature, it too would quickly evaporate and deliver gaseous oxygen to the engine.
To solve both problems simultaneously and simplify operational procedures, a unified fill/pre-chill system is used. A
pressurized dewar of liquid oxygen is connected to the liquid oxygen fill/drain valve upstream of the main oxidizer
valve. As the fill/drain valve is opened, liquid oxygen will begin to flow into the system, evaporating while chilling
the tubing. There is no isolating valve upstream of this point prior to the run tank. Therefore, evaporated gas travels
upstream and escapes to atmosphere through a normally open vent solenoid valve located upstream of the run tank.
As the tubing in proximity to the main oxidizer valve is chilled, further tubing may begin filling with liquid oxygen.
This process propagates upstream until the tank itself is chilled and filled with liquid oxygen. Upon completion of
tank fill, the fill/drain valve will be closed and the dewar will be disconnected from the system. To drain the system,
the fill/drain valve may be opened to release liquid oxygen into a container.
Following tank fill, propellants must be pressurized. A high-pressure cylinder of gaseous nitrogen is used to
pressurize both the fuel and oxidizer tanks. As available gas cylinders come pressurized to 2,000 psig and the system
only requires a source pressure of approximately 450 psig, the source pressure must be brought down. Immediately
downstream of the nitrogen source, a regulator is used to reduce the pressure of the gas. This pressure is dictated by
the required fuel tank pressure, as the fuel line experiences the greatest pressure loss. As the oxidizer tank requires a
lower source pressure than the fuel tank, a second regulator is present between the first regulator and oxidizer tank to
further step down the pressure. Pressurant flow is controlled by a solenoid upstream of each propellant tank, allowing
for remote pressurization of the system. To remotely depressurize the system, a normally open vent solenoid is present
upstream of each propellant tank. In addition to relieving pressure introduced by gaseous nitrogen, an overpressure
due to liquid oxygen boiling can be avoided.
To utilize the pressurized propellants contained in the tanks previously described, the ability to control propellant
flow must be present. To control the flow of propellant to the chamber, only one isolation valve is used in each line.
As a result, each main propellant valve is wetted when the tank is filled, reducing the probability of complications due
to water hammer. The main propellant valves are servo-actuated ball valves. Electrically actuated ball valves allow
for high pressure differences across the valve, are compatible with cryogenic fluids, and allow for gradual opening of
the valve. Additionally, the valve can be used as a trim control, allowing for fine control of mixture ratio. Once
propellants have flowed through to the engine, it is desirable to have the capability to evacuate the chamber. This
allows for residual propellants to be removed from the propellant manifold and regenerative cooling circuit. In the
case of an abort, this function could also be used to quickly stop combustion. To integrate this feature, a line of
pressurized gaseous nitrogen intersects each propellant feedline upstream of the engine. This purge line, which begins
downstream of the primary pressure regulator, splits into two separate lines each controlled by a solenoid. By
providing each line after the split with its own isolation valve, the fuel feedline can be shut down independent of the
oxidizer feedline or vice versa.
When working with fuels, high-pressure gases, strong oxidizers, and cryogenic fluids, safety must be thought of
early and often. Each, even on their own, has the potential to cause material damage and personal injury if
mishandled[1]. As a result, safety considerations have been implemented in all systems, including the plumbing system.
A major concern is inter-propellant mixing as a result of fuel or oxidizer propagating upstream. To mitigate this issue,
a check valve has been placed downstream of each flow control valve. A total of six check valves are present in the
system; one check valve is downstream of each pressurant solenoid, one is downstream of each main propellant valve,
and one is downstream of each purge valve. In addition to inter-propellant mixing, precautions must be taken against
system overpressure. While a vent is present in-line with each propellant tank, failure of the main pressure regulator
may still result in a catastrophic failure. Relief valves upstream of each propellant tank mitigate this issue by providing
a last resort method of safely depressurize the system. Due to the increased hazards of a liquid oxygen tank
overpressure, a redundant relief valve is present[16]. Finally, steps must be taken during assembly and operation to
ensure components, especially those in contact with liquid oxygen, remain clean to avoid fires or particle impact
issues[17]. An ultrasonic cleaner will be used to clean valves, fittings, and other small components. Isopropyl alcohol
treatments will be used to clean larger components such as tanks or lengths of tubing.
Data collection is a high priority in the operation of the liquid engine system. Quality data enables autonomous
and remote operation of the test stand and provides valuable insight into the performance of the system. While some
data points such as thrust may be collected via an external sensor, instrumentation which interacts with fluids must be
integral to the plumbing system. To collect pressure data about the two propellant run tanks, a pressure transducer has
been fitted to each. A pressure gauge has also been fitted to each tank. These gauges provide a redundant pressure
measurement in case of transducer failure and allow for immediate measurements during pad operations. To measure
the mass flow rate of each propellant from the tank to the engine during test, a custom orifice plate flow meter is
present in each line upstream of the main propellant valves. The flow meter is constructed of an orifice plate with a
pressure transducer upstream and downstream, measuring the pressure loss across the orifice plate. While the orifice

16
plate introduces considerable pressure loss, it reduces cost when compared to a turbine flow meter and reduces
manufacturing complexity when compared to a venturi flow meter. The pressure transducers downstream of the orifice
double as a measurement of fluid pressure prior to reaching the engine. In the liquid oxygen line, this is also the
pressure at which fluid is delivered to the manifold. However, fuel travels through regenerative cooling channels prior
to reaching the propellant manifold, reducing in pressure. To measure the fuel pressure prior to injection and
characterize this pressure loss, a pressure transducer is connected to a tap-off of the fuel manifold. Similarly, to
determine propellant density prior to injection, an in-line thermocouple is attached to the same tap-off. Measurement
of liquid oxygen temperature is not attempted as the fluid is assumed to be at its saturation temperature. To measure
combustion chamber pressure, a stand-off tube extends through the injector plate to a pressure transducer. Finally,
measurement of thrust will be achieved using a load cell secured to the test stand. The engine assembly is secured to
a sled which is free to move in the direction of thrust. As thrust is generated, the engine forces an attachment into the
load cell and thrust may be measured.
As the engine is pressure-fed, propellant tanks, directly pressurized by the regulated pressurant source, deliver
propellant to the system of tubes and components leading to the engine. Pressure loss then cascades until propellant
reaches the engine. Therefore, all tanks and tubes upstream of the combustion chamber must be at a pressure greater
than the design chamber pressure. Additionally, propellant in the tanks must have the greatest pressure of all wetted
components. The loss of pressure through the plumbing system downstream of the propellant tanks must be
characterized such that by the time it reaches the combustion chamber, propellant is pressurized to 250 psig. To
accomplish this, the Bernoulli Equation, shown in Eq. (25), is used to determine major and minor head loss in the
system[18].
𝑃1
𝜌𝑔0+
𝑣12
2𝑔0+ 𝑧1 =
𝑃2
𝜌𝑔0+
𝑣22
2𝑔0+ 𝑧2 + ℎ𝐿 (25)
It can be assumed that the density of the propellant moving through the tubing’s uniform cross-sectional area is
constant. As propellant temperature, and therefore density, will not change significantly between the tank and the
combustion chamber, it can also be assumed that the velocity through the line is constant. The liquid oxygen line will
be pre-chilled before flow begins, minimizing density change. This assumption is not applicable to the regenerative
cooling circuit, which is being evaluated separately. To calculate head loss, Eq. (26) can be used[18]. The head loss
equation generalizes frictional losses from the fluid interacting with the tubing wall, and the twists and turns of the
tubing, valves, and components. By ignoring change in velocity and substituting this equation into Eq. (25), Eq. (27)
is generated[18].
ℎ𝐿 = 𝑓𝑣2𝐿
2𝑔0𝐷+ ∑𝐾𝐿𝑖
𝑣2
2𝑔0 (26)
Δ𝑃 = (Δ𝑧 + 𝑓𝑣2𝐿
2𝑔0𝐷+ ∑𝐾𝐿𝑖
𝑣2
2𝑔0) 𝜌𝑔0 (27)
Using Eq. (27), pressure loss can be found. Equation (27) requires the friction factor 𝑓 of the linear tubing, and the
sum of the resistance coefficients, or 𝐾𝐿-values, of all plumbing components in the system. The friction factor is
determined using the Moody Diagram shown in Fig. 18 and other corresponding equations, which use the
relative roughness of the tubing and as well as the
Reynolds number of the working fluid. While
resistance coefficient is generally determined
experimentally, values may be approximated with
tables of typical K-values using the excess head
method[20]. However, using the more accurate 2K
method, the K-value of each component is
individually determined[20]. The 2K method
relates the K-value of each component to the
Reynolds number, tube diameter, component type.
It can be seen in Eq. (27) that pressure loss is
generally proportional to the velocity of the fluid
squared, with the condition that 𝛥𝑧 ≈ 0. As
velocity is inversely proportional to cross-
sectional area, as shown in Eq. (22) repeated from
Figure 18. Moody diagram[19]

17
above, the pressure loss in general is therefore inversely proportional to the square of the tube’s cross-sectional area.
This can also be written as inversely proportional to the tube’s inner diameter to the fourth power, shown in Eq. (28).
𝑣 =�̇�
𝜌𝐴 (22)
Δ𝑃~ ∝1
𝐴2 ∝1
𝐷4 (28)
This relation shows that a small increase in tubing diameter can result in a large decrease in pressure loss. By
analyzing the designed plumbing system using this method, it is found that tubing of 0.5 in diameter generates
significantly less pressure drop than 0.375 in tubing. Given the wide availability of 0.5 in lines, components, and
instruments, this was selected as the predominant line size for the system.
To implement the design discussed above,
component selection and physical orientation must be
considered. Compression fittings were chosen over
NPT- or AN-type fittings due to their performance at
high pressures, wide adaptability to other plumbing
fitting types, and relative ease of use. Stainless steel
tubing was selected with a wall thickness of 0.035 in,
providing a maximum allowable working pressure of
2,500 psig. However, construction of the system must
respect the physical limitations of the space available.
The lack of a permanent testing facility necessitates a
portable test stand which can be constructed and
dismantled in a relatively short period of time. Shown
in Fig. 19, several plumbing panels have been
developed to split the propellant feed and
management system into manageable subsets. These
panels may be individually attached or detached from
the test stand, allowing for operational flexibility
during pad operations and preliminary testing.
Annotated renderings of each panel can be found in
Appendix C. Mounted on the rear-most panel are the
fuel and oxidizer tanks. While a simplified mount is shown in Fig. 19, tanks are secured to a bulkhead to support the
weight of the tanks and provide protection in the case of an engine failure. This panel also includes components to
support venting of the propellant tanks, measurement of tank pressures, and emergency pressure relief. A panel on the
side of the test stand mounts all oxidizer-related plumbing. The oxidizer panel includes all components necessary for
filling, draining, and pre-chill of the oxidizer lines and oxygen tank. The panel also supports the main oxidizer valve,
purge tee, and orifice plate flow meter. The main oxidizer feedline has been designed such that no point in the line has
a greater ground height than a point upstream. This allows for gaseous oxygen to escape through the vent upstream of
the oxidizer tank. Additionally, all cryogenic lines as well as the oxidizer tank are insulated with an insulated foil to
reduce boiloff. Mounted opposite to the oxidizer panel is the fuel panel, which supports many of the same components
as the oxidizer panel but to support the main fuel feedline. Keeping the fuel and oxidizer panel physically separate
reduces the risk of inter-propellant mixing in the case of a leak. To connect both main propellant lines to the engine,
flexible hoses are used. As the engine is on a translating sled, these hoses allow for movement in the system without
a line shear. Finally, the panel on top of the test stand provides a centralized location for data acquisition equipment
as well as pressurant controls. Mounted on the panel are components for connecting the pressurant source and
regulating the source pressure. Cameras to record the test are also attached to this panel.
B. Data Acquisition and Control
The design of the avionics system centered around the interfacing requirements of the propulsion system and
associated plumbing circuitry. These requirements can be summarized with the following design objectives:
• The system should be capable of reliable data acquisition pertaining to the instantaneous operating state
of the system.
• The system should allow for precise, semi-autonomous, and remote control of engine sequencing.
Figure 19. Rendering of prototype test stand assembly
with engine and ancillary equipment

18
• The system should be graphically interfaced with a single control computer to facilitate the execution of
operational procedures and display live telemetry from the engine.
The system is comprised of two hardware subsystems, one for data acquisition and one for control, which will be
controlled and monitored with a graphical user interface (GUI). Due to the wide availability of prototyping electronics,
the system requirements may be met using a wide variety of approaches. However, affordability, convenience, and
performance of the system must be considered. Additionally, due to the experimental nature of the project, designs
are highly iterative and may need to change quickly to acclimate to new requirements.
The data acquisition subsystem is the primary means by which engine performance is evaluated, and by which
failures and inefficiencies may be diagnosed. Due to the cost constraints, high-precision sensors capable of
withstanding extreme pressures, temperatures, and vibrations cannot be considered. Several practical measurement
schemes were implemented to allow for useful and affordable measurement of key environments. However, these
constraints will likely necessitate the post-processing of some collected data using inferential statistics. While the
measurement schemes make necessary measurements possible, they also have the potential to introduce multiple
sources of error. As a result, error analysis and instrument calibration must be integral to design. The subsystem is
designed to measure pressure, temperature, force, and flow. These measurements will be made with the use of pressure
transducers, a thermocouple, and a load cell. The sensors convert instantaneous measured values of the environment
to analog signals interpretable by prototyping
electronics. Cost constraints kept the number of
measurands to a minimum. The quantities of
interest are given in Table 3 along with the method
of measurement, the sensors involved, and the
number of measurements needed. Quantities
obtained from a single signal output are direct
measurements while quantities determined from
several signals are calculated.
The pressure drop across the regenerative
cooling circuit is calculated by taking the
difference in the readings of two pressure
transducers. The mass flow rate can be calculated
by measuring the pressure drop across an orifice
of known diameter and assuming both liquid
propellants to be incompressible. Despite liquid
oxygen having a low boiling point, the pre-chill system previously described allows for the assumption of purely
liquid flow. The relationship between the pressure differential and propellant mass flow rate for turbulent flow is given
by Eq. (29).
�̇� =1
4𝜋𝐶𝑑𝐷𝑖
2√2𝜌Δ𝑃
1−𝛽4 (29)
The coefficient of discharge depends on the orifice-to-tubing diameter ratio, 𝛽, and the Reynolds number of the
flow. Values of 𝐶𝑑 for various diameter ratios and Reynolds numbers from [21] are displayed in Table 4.
The pressure transducers acquired only produce
consistent and linear output within a limited range of
temperatures exclusive of cryogenic conditions. Similarly,
the expected temperature of the combustion chamber is
well out of range. To take pressure measurements in these
adverse conditions, stainless steel standoff tubing is used
to physically isolate the transducer bodies from regions of
high or low temperature. Due to the physical separation,
gas will approach an allowable temperature while
preserving the pressure at the point of interest[22]. The
required tubing length is proportional to the temperature and tubing diameter[22]. For tabulated data on standoff tubing
lengths for various temperatures, reference Appendix D.
While raw signals from instrumentation can be processed by a computer in their original form, signal processing
is required to avoid generation of significant error. The main prototyping board for both subsystems is the Arduino
Uno. The Uno includes an internal analog-to-digital converter (ADC) with six input pins capable of reading a 0-5 V
Table 3. Measurable quantities of interest
Measurand Method Sensor Instances
Upstream
Line Pressure
Direct
Measurement
Pressure
Transducer 2
Mass Flow
Rate Calculated
Pressure
Transducers 2
Coolant
Pressure Drop Calculated
Pressure
Transducers 1
Pre-Injection
Temperature
Direct
Measurement Thermocouple 1
Thrust Direct
Measurement Load Cell 1
Chamber
Pressure
Direct
Measurement
Pressure
Transducer 1
Table 4. Tabulated coefficient of discharge values[21]
Diameter Ratio
𝛽
Reynolds Number
104 105 106 107
0.2 0.60 0.595 0.594 0.594
0.4 0.61 0.603 0.598 0.598
0.5 0.62 0.608 0.603 0.603
0.6 0.63 0.61 0.608 0.608
0.7 0.64 0.614 0.609 0.609

19
analog signal with 5 mV resolution. The six input pins are multiplexed to allow for a total of 16 inputs to a single
Arduino. Upon reading a signal, the Arduino transmits the data to the controlling computer via serial communication.
A complete list of raw outputs and required signal manipulations is given in Table 5.
The selected load cell is being recycled
from a previous project; its origin is
unknown, and documentation is
unavailable. However, the range of
measurable loads is known, and the
sensor’s sensitivity and resolution can be
determined experimentally. Output from
the load cell and thermocouple are
manipulated using breakout boards
specifically manufactured for use with
Arduino. The boards use an internal ADC
chip to communicate signal readings to the
Arduino digitally, requiring the use of digital input pins. For pressure readings, two models of pressure transducer are
used. While the first model from Table 5 requires no signal processing, output from the second model is amplified
with an amplifier integrated circuit (IC). The gain of the IC is set by the resistance of an externally connected resistor.
For specifications of the signal processing chip and wiring, reference Appendix E.
As the instruments being used are based on generating voltages from analog responses to an environment,
calibration of the sensors must be done against a known control sample so accurate readings are taken. Apart from the
load cell, documentation of signal outputs and error specifications is available for all components. Calibration
procedures and experiments for the documented sensors will center around verification of the nominal specifications.
Variation in sensor output with respect to ambient temperature will be especially scrutinized, as hot-fire testing will
occur outdoors in Arizona where temperature can wildly fluctuate. One large concern is the gain of the amplifier
circuits, which are dependent on a single resistance which may vary with temperature. To mitigate this issue, the gain
can be set by a variable resistor such as a potentiometer that will allow for adjustment if necessary. The exact
sensitivity and resolution of the load cell sensor is not known. The component is a single-point, miniature load cell,
where the measured load is applied at a raised, metal button. To determine the calibration curve, a simply-supported
beam structure will be used to apply varying loads to the button. The weight of the beam will be measured, and a
known weight will be hung at the end of the beam opposite the hinge point. The load applied to the sensor can be
varied by changing the position of the hanging weight, and the force at the load cell button is calculated with a balance
of moments about the hinge point. Assuming deformational effects of the beam are negligible, calibration is only
limited by the precision with which the known load is applied. This can be verified with a significance test performed
on the linear regression data of the calibration curve.
As with any real system with finite resolution and limited accuracy, errors are present and must be accounted for.
Measurement errors primarily come from two sources. Both the sensor and data acquisition hardware convert between
measurand and signal value with finite resolution and error. This hardware limitation sets a definitive limit on the
accuracy of acquired data, and greatly influences system design. Due to the imprecision of the available instruments,
instrument error is the dominant error source. Given in Table 6 is a
list of error approximations based on the measurements from Table
3. The advertised error margins are calculated using error
specifications provided by each sensor manufacturer, assuming no
external sources of error are present. For additional details on the
error calculations performed, see Appendix F.
The second major hardware subsystem is the control and
sequencing subsystem. Control of pressurant and propellant flow
during engine operation is achieved using electronic valves and
actuators. Once characterized, these flow control devices allow for
complex and rapid sequences of operations to be automated by
computer code. Additionally, data collected on the status of these
valves during operation allows for the impact of sequence-timing on
engine performance to be better understood.
Hardware selection was heavily influenced by availability and cost. The subsystem makes use of both solenoid
valves and servo-actuated valves. While the solenoid is a completely electronic valve, the servo-actuator is merely a
motor for actuating a standard ball valve. Solenoids are used for a low-latency, binary control of flow, whereas servo-
Table 5. Sensor signal outputs
Sensor Measurement Raw
Signal
Processed
Signal
Method
Pressure
Transducer 15-700 psia 0.5-4.5 V 0.5-4.5 V N/A
Pressure
Transducer 0-1000 psig
0-100
mV 0-5 V
IC
Amplifier
Load Cell 0-440 lbf Unknown Digital ADC
Breakout
Thermocouple
(K-type) -200-1250°C 0-60 mV Digital
ADC
Breakout
Table 6. Measurement errors
Measurand Error
Upstream Line
Pressure
±6.85 psi (Kerosene),
±20 psi (LOX)
Mass Flow Rate ±3.53% (Kerosene),
±20.45% (LOX)
Regen-Cooling
Pressure Drop ±9.7 psi
Pre-Injection
Temperature ±2°C
Thrust Experimentally
Determined
Chamber Pressure ±6.85 psi

20
actuated ball valves can be used for proportional flow or latency control. While solenoids offer less control than servo-
actuated valves, their associated electronics are simple to use. The valves open when sufficient current is provided to
the internal circuitry, making them controllable with an electronic switch such as a relay or transistor. This also
provides a fail-safe condition for the valve as the valve will automatically default to the normal state if power loss
occurs. Unfortunately, solenoid valves also have relatively little flexibility to operate in extreme conditions. Cryogenic
solenoids are prohibitively expensive and can be intolerant of large pressure differentials. Servo-actuators are a
sufficiently more flexible means of circumventing these limitations. While pneumatic valves are a flexible and capable
substitute, the added complexity and cost made them a less desirable option.
Dynamixel AX-12a servo motors have been selected as valve actuators. The AX-12a is internally equipped with
a microcontroller programmable with several commands which allow motor speed, applied torque, and angle of
rotation to be precisely controlled. Programming commands are issued from the control Arduino serially with the use
of an Arduino shield that allows for simultaneous communication with up to seven motors. Additionally, the AX-12a
has an associated Arduino library which makes programming straightforward. Mechanical interfacing of the ball valve
with the motor can be achieved with a gear mechanism. Due to torque limitations of the servo, it is likely that an
intermediate gearbox will be needed to prevent the motor from stalling. Another limitation is the incompatibility of
the servo with cryogenic temperatures. To avoid damage to the motor it may be necessary to consider methods of
power transmission that distance the motor from extremely low temperatures. While the design requirements of the
mechanical interface are well defined, development is still ongoing.
Sequencing is a topic of great importance when testing complex systems such as liquid rocket engines. Liquid
engines have complicated plumbing systems which require the sequential actuation of multiple valves with precise
timing. To maintain stable operation and reduce the risk of hardware failures, these sequences must be characterized
and automated by the control system. As the project has not yet moved into the manufacturing and testing phase, the
engine’s sequencing is still in a primitive form. However, a basic order of operations has been developed including
sequences for LOX fill/pre-chill, engine start-up and run, engine shutdown, and emergency contingencies. Latency
characterization tests will contribute to the refinement of sequence timings. Also, as engine-performance data becomes
available, sequences will be iterated and expanded into refined sub-sequences to achieve desired performance.
Integration of the data acquisition and control subsystem hardware is achieved through the communication of both
subsystem boards with a centralized control computer. The integrated approach allows for more sophisticated
sequencing by enabling sequences to read and depend on real-time data. While the centralized control computer is
remote, the hardware for both subsystems remain in close physical proximity. A concern presented by this proximity
is the difference in current requirements of the hardware. While the data acquisition subsystem draws negligible
current, the control subsystem is highly dependent on current supply. These high currents have the potential to corrupt
data by inducing noise in the circuitry. To circumvent this issue, subsystem wiring will be kept as separate as possible
and each subsystem will draw power from unique power supplies. A detailed wiring diagram of subsystem integration
hardware is included in Appendix E.
While the Arduino boards are powered by the control computer via USB, all additional hardware will be powered
by 12 V power supplies. Voltage regulator chips can be used to drop the source voltage of the data acquisition
subsystem to voltages that best meet the excitation needs of the sensors and
active circuit components, and that are consistent with recommendations from
available documentation. A relay board is used to control the high-power
solenoids with the low-power Arduino board. While the power source for the
data acquisition subsystem will be placed close to the components it powers,
the control source will be remote. Remote power can be connected to a
switchbox accessible to operations personnel, such that power can be cut in
case of an emergency using a manual switch, automatically safing the system.
All avionics hardware is graphically interfaced with a custom GUI. The
base program is built in Python for convenience and flexibility. Despite the
relatively slow performance of the language, the availability of well-
documented modules simplifies programming logic and make it a desirable
option. The computational requirements of the system for live tests are
insufficient to warrant the logical complexity of low-level programming.
Additionally, while other purpose-built programs provide robust solutions,
their use often comes with significant cost.
The main program window of the GUI includes a control dashboard,
shown in Fig. 20, and a set of gauges for displaying data. The control
dashboard contains multiple switch and button widgets programmed to
Figure 20. Prototype of live
control dashboard
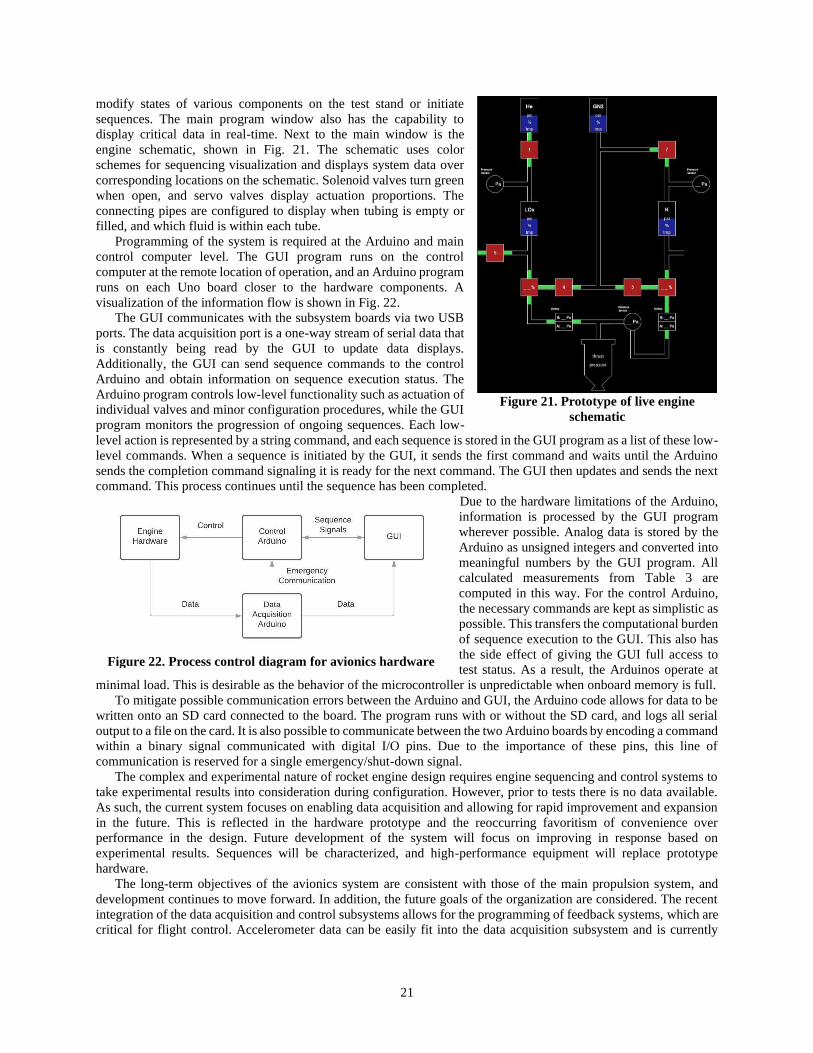
21
modify states of various components on the test stand or initiate
sequences. The main program window also has the capability to
display critical data in real-time. Next to the main window is the
engine schematic, shown in Fig. 21. The schematic uses color
schemes for sequencing visualization and displays system data over
corresponding locations on the schematic. Solenoid valves turn green
when open, and servo valves display actuation proportions. The
connecting pipes are configured to display when tubing is empty or
filled, and which fluid is within each tube.
Programming of the system is required at the Arduino and main
control computer level. The GUI program runs on the control
computer at the remote location of operation, and an Arduino program
runs on each Uno board closer to the hardware components. A
visualization of the information flow is shown in Fig. 22.
The GUI communicates with the subsystem boards via two USB
ports. The data acquisition port is a one-way stream of serial data that
is constantly being read by the GUI to update data displays.
Additionally, the GUI can send sequence commands to the control
Arduino and obtain information on sequence execution status. The
Arduino program controls low-level functionality such as actuation of
individual valves and minor configuration procedures, while the GUI
program monitors the progression of ongoing sequences. Each low-
level action is represented by a string command, and each sequence is stored in the GUI program as a list of these low-
level commands. When a sequence is initiated by the GUI, it sends the first command and waits until the Arduino
sends the completion command signaling it is ready for the next command. The GUI then updates and sends the next
command. This process continues until the sequence has been completed.
Due to the hardware limitations of the Arduino,
information is processed by the GUI program
wherever possible. Analog data is stored by the
Arduino as unsigned integers and converted into
meaningful numbers by the GUI program. All
calculated measurements from Table 3 are
computed in this way. For the control Arduino,
the necessary commands are kept as simplistic as
possible. This transfers the computational burden
of sequence execution to the GUI. This also has
the side effect of giving the GUI full access to
test status. As a result, the Arduinos operate at
minimal load. This is desirable as the behavior of the microcontroller is unpredictable when onboard memory is full.
To mitigate possible communication errors between the Arduino and GUI, the Arduino code allows for data to be
written onto an SD card connected to the board. The program runs with or without the SD card, and logs all serial
output to a file on the card. It is also possible to communicate between the two Arduino boards by encoding a command
within a binary signal communicated with digital I/O pins. Due to the importance of these pins, this line of
communication is reserved for a single emergency/shut-down signal.
The complex and experimental nature of rocket engine design requires engine sequencing and control systems to
take experimental results into consideration during configuration. However, prior to tests there is no data available.
As such, the current system focuses on enabling data acquisition and allowing for rapid improvement and expansion
in the future. This is reflected in the hardware prototype and the reoccurring favoritism of convenience over
performance in the design. Future development of the system will focus on improving in response based on
experimental results. Sequences will be characterized, and high-performance equipment will replace prototype
hardware.
The long-term objectives of the avionics system are consistent with those of the main propulsion system, and
development continues to move forward. In addition, the future goals of the organization are considered. The recent
integration of the data acquisition and control subsystems allows for the programming of feedback systems, which are
critical for flight control. Accelerometer data can be easily fit into the data acquisition subsystem and is currently
Figure 22. Process control diagram for avionics hardware
Figure 21. Prototype of live engine
schematic

22
being used for testing of prototype GUI programs. As the vehicle-based needs of the engine increase the avionics
system will evolve correspondingly.
VI. Test Infrastructure Development
The engine, data acquisition and control equipment, propellant tanks, and propellant feed system must all be
statically supported during testing operations. In addition, it must be ensured that any personnel present during the test
are either adequately protected by the facilities they are in or sufficiently far from any potential hazard. To meet these
requirements, a subteam was dedicated to the development of supporting structures and managing hazards at the
testing site.
A. Test Stand
To enable testing of the rocket engine described above, a test
stand is needed to physically support the thrust generated by the
engine, as well as house any other associated equipment necessary
during test. As numerous pieces of plumbing and controls
equipment are integral to system function, they must be supported
by the same structure. Additionally, the testing facility available to
SDR is remote and not suitable for long-term storage of equipment.
As such, the test stand must be relatively mobile and designed for
quick assembly and disassembly onsite. To facilitate transportation
and assembly, a modular test stand was developed consisting of a
two-piece structural frame with several removable panels allowing
for support of ancillary equipment.
To support horizontal firing of the liquid engine, a test stand
frame was designed as an iteration on previous successful tests
stands built by SDR. Historically, rectangular frames of steel
square tubing have been used by SDR to support horizontal firing
of solid and hybrid motors. Shown in Fig. 23 without the engine or
ancillary equipment attached, the designed test stand features
multiple surfaces on which propellant routing equipment can be
mounted in addition to supporting the engine. Fully assembled, the
test stand measures approximately 4 ft long, 1.75 ft wide, and 2 ft tall. The test stand is constructed primarily of square
A500 steel square tubing with a 2.125 in x 2.125 in cross section and 0.125 in wall thickness. While these members
provide significantly more strength than is required, this allows for support of future engines in a higher thrust class
without reworking the stand. To support the plumbing equipment, 0.128 in thickness A653 sheet steel is used. Most
connections on the test stand frame will be welded to increase strength, but fasteners are used in strategic areas to
increase portability without sacrificing structural integrity. The test stand is secured during firing using a combination
of tethers connected to sunken concrete blocks in the area and sandbags placed on the lower part of the frame.
The engine is secured to the test stand via a sled using custom brackets, shown in Fig. 24. By mounting the engine
on a sled, it can translate forward and back relative to the test stand. During setup of the engine and stand, this allows
for easy movement of the engine to work on otherwise
inaccessible portions of the stand. When firing, translation
of the engine is constrained by a backstop with an integral
load cell.
Safety is a critical component of any test. In the event of
an engine failure, damage to a dewar or propellant tank must
be avoided. To mitigate this hazard, a blast shield was
integrated in the test stand design. Located between the
engine backplate and plumbing assembly, the 0.25 in thick
steel plate acts as a bulkhead between critical plumbing
components and the engine, preventing a cascade of damage
in the event of a failure.
Static structural analyses were performed on the thrust
frame to ensure its viability under load. Initial stress
calculations were performed during the design process,
Figure 23. Test stand structure and panels
for mounting ancillary equipment
Figure 24. Rendering of engine prototype mounted
on test stand via translating sled

23
which were then followed by ANSYS FEA simulations on the final geometry of the structure. For the expected engine
thrust of 405 lb and current geometry of the thrust frame, the maximum stress in the structure reaches approximately
14 ksi immediately behind the load cell. This value was supported by numerical simulations on the geometry model.
For an ASTM A653 plate this stress value results in a factor of safety of 3.57 based on yield stress and 4.66 based on
ultimate stress.
Static loading of the test stand frame and plumbing panels due to the weight of plumbing and avionics components
is assumed negligible, save for the panel supporting the fuel and oxidizer tanks. Preliminary analysis of the propellant
tanks, neglecting additional components, show that the oxidizer and fuel tanks will weigh approximately 30.5 lb and
27.7 lb respectively when fully loaded. Using the current method of tank support illustrated in Fig. C-4, moments of
146 lb-in for the oxidizer tank and 132 lb-in for the fuel tank are transferred to the supporting plate. Further analysis
is required to determine what, if any, reinforcement is required to support the tanks. Additional future work includes
the creation of refined static structural analyses of the test frame, as well as analysis of vibrational modes.
B. Test Site
Sun Devil Rocketry has a dedicated test site located in Glendale, Arizona. The test site, which has regularly been
used for solid and hybrid motor tests in the past, is the
planned location to test the previously described liquid
engine system. The site consists of a portion of the
undeveloped land east of ASU’s West campus. The
test stand and test article will be secured to concrete
blocks located on a flat portion of the land. The test
area, shown by satellite image in Fig. 25, is surrounded
on three sides by a 5 ft dirt berm. This berm is between
the test area and the nearest occupied structure, which
is 500 ft to the west. 140 ft to the east of the test area
is a quarter-size shipping container which acts as a
bunker, housing data acquisition and test monitoring
equipment. On the test side of the bunker is a dirt
mound which surrounds the bunker. 400 ft to the south
is a parking lot. The maximum overpressure and
hazard fragmentation distances were calculated.
Given the density of kerosene as 1.572 slug/ft3 and the
density of liquid oxygen as 2.214 slug/ft3, the total
propellant weight can be found[10]. As each propellant
tank has a capacity of 1 gallon, storage of
approximately 12.9 lb of propellant is possible on the
test stand during operation. According to [23], a 10%
yield factor can be applied to LOX/RP-1 propellant combinations on a static test stand[23]. RP-1 is a kerosene-type
propellant, so this assumption was used to calculate the TNT equivalent net explosive weight as 1.29 lb. Peak incident
pressure distance 𝑋𝑂𝑃 was then found using the Eq. (30)[24].
𝑋𝑂𝑃 = 𝐾 ⋅ 𝑊1
3 (30)
Applying a K-factor of 45 lb/ft1/3 for a peak incident overpressure of 1 psig, the peak incident pressure distance
was calculated to be 49.0 ft, less than the distance to the bunker[24]. To calculate the hazard fragmentation distance
𝑋𝐻𝐹, Eq. (31) was used as the net explosive weight 𝑊 was under 100 lb[25].
𝑋𝐻𝐹 = 291.3 + (79.2 ⋅ ln 𝑊) (31)
The calculated hazard fragmentation distance of 311.5 ft is less than the distance to the parking lot but greater than
the distance to the bunker. To ensure operators within the bunker will be safe during the test, further analyses will be
required to determine whether the current barriers will be sufficient in reducing the hazard fragmentation distance, or
if new barriers will be required to safely conduct the test.
Figure 25. Layout of test site.

24
VII. Conclusion
In the past year, the team has gone from having very little collective experience in the field of rocket propulsion
to pushing the boundaries of what has been previously achieved by students at Arizona State in the field. The team is
currently focused on transitioning from design and analysis to working on hardware and physical experimentation.
There are innumerable technical challenges that may only be realized once physical implementation of these systems
is attempted. The thrust chamber assembly must be manufactured, and flow tested to ensure there are no leaks between
different sections of the regenerative cooling system. Advanced thermal models of the regenerative cooling system
are currently being developed to verify preliminary design results, which may change the chamber design. The thrust
chamber design may also be modified as machining challenges are realized. Similarly, the injector assembly must be
flow tested to observe impingement characteristics, and leak checked with helium as inter-propellant mixing upstream
of the combustion chamber would almost certainly result in an engine failure. The ignition slugs, currently in work by
SDR’s solid propulsion-focused research team, must be characterized along with propellant valves to determine
crucial portions of the engine start-up sequence. Valves and other plumbing equipment must be fit checked and
assembled prior to pressurized leak and operational tests. To control all this equipment, development of the data
acquisition and control systems must continue with extensive run-time tests to make up for the lack of system maturity.
Finally, the test stand and test site must be developed in parallel to ensure any hazardous tests can be conducted safely.
Pending successful management of these manufacturing and operational hurdles, the team intends to push towards
completing a hot-fire test of the system.
There is also much work to be done to continue the educational goals of the team and Sun Devil Rocketry. While
intricate designs and interesting hardware will always be an attractive element of working with liquid propulsion,
SDR’s mission is to prepare students to become leaders in aerospace through meaningful projects, interactions, and
experiences. During the project, student members have gained practical experience dealing with real-world technical
challenges. These have included working with hazardous plumbing and pneumatic systems, using programming to
implement data acquisition and control systems, and the use of statistics and analysis to decipher the meaning of
experimental results. Additionally, student members work in a collaborative team environment. While individuals
may grow in pursuit of their own portions of the project, they work towards a collective goal and end-result. However,
regardless of the result the most important aspect of the project is providing students the opportunity to learn and gain
experiences not offered in a classroom setting.

25
Appendix A: Rao Nozzle Design Method
The Rao nozzle geometry is calculated in three different
sections: a circular-arc throat entrance, a circular-arc throat exit,
and a parabolic bell-nozzle approximation. These three sections
can be seen in Fig. A-1. Given the angle at which the converging
section meets the circular-arc throat entrance 𝜗0 = 𝛼, and the
radius of the throat 𝑅𝑡, the two circular-arc sections may be
calculated. Using a cartesian coordinate system, the Eqs. (A-1)
and (A-2) below may be used to plot the circular-arc throat
entrance section for −𝜗0 ≤ 𝜗 ≤ −90°.
𝑥
𝑅𝑡= 1.5 cos 𝜗 (A-1)
𝑦
𝑅𝑡= 1.5 sin 𝜗 + 2.5 (A-2)
The circular-arc throat exit section may be similarly
calculated for −90° ≤ 𝜗 ≤ (𝜗𝑛 − 90°) using Eqs. (A-3) and (A-
4). The initial parabola angle 𝜗𝑛, which is a function of nozzle
expansion ratio 휀 and the length factor of the nozzle 𝐿𝑓 is
determined using Fig. A-2.
𝑥
𝑅𝑡= 0.382 cos 𝜗 (A-3)
𝑦
𝑅𝑡= 0.382 sin 𝜗 + 1.382 (A-4)
To find a geometric representation of the parabolic section,
shown in Fig. A-3, the expansion ratio 휀, throat radius 𝑅𝑡, initial
parabola angle 𝜗𝑛, and final parabola angle 𝜗𝑒 are used. From
0 ≤ 𝑡 ≤ 1, the vertical coordinates 𝑥 and 𝑦 of the parabola are
found using Eqs. (A-5) and (A-6).
𝑥
𝑅𝑡= (1 − 𝑡)2𝑁𝑥 + 2(1 − 𝑡)𝑡𝑄𝑥 + 𝑡2𝐸𝑥 (A-5)
𝑦
𝑅𝑡= (1 − 𝑡)2𝑁𝑦 + 2(1 − 𝑡)𝑡𝑄𝑦 + 𝑡2𝐸𝑦 (A-6)
To find the values of 𝑁𝑥, 𝑁𝑦, 𝐸𝑥, and 𝐸𝑦, reference sequential Eqs. (A-7) through (A-10) below.
𝑁𝑥 = 0.382 cos(𝜗𝑛 − 90°) (A-7)
𝑁𝑦 = 0.382 sin(𝜗𝑛 − 90°) + 1.382 (A-8)
𝐸𝑥 = 𝐿𝑓√ε−1
tan 15° (A-9)
𝐸𝑦 = √ε (A-10)
Figure A-2. Initial and final parabola angle of
Rao nozzle.
Figure A-1. Geometric characteristics of Rao
nozzle throat region.
Figure A-3. Parabolic section of Rao nozzle.

26
Similarly, 𝑄𝑥 and 𝑄𝑦 can be found using sequential Eqs. (A-11) through (A-16).
𝐶1 = 𝑁𝑦 − 𝑚1𝑁𝑥 (A-11)
𝐶2 = 𝐸𝑦 − 𝑚2𝐸𝑥 (A-12)
𝑚1 = tan 𝜗𝑛 (A-13)
𝑚2 = tan 𝜗𝑒 (A-14)
𝑄𝑥 =𝐶2−𝐶1
𝑚1−𝑚2 (A-15)
𝑄𝑦 =𝑚1𝐶2−𝑚2𝐶1
𝑚1−𝑚2 (A-16)
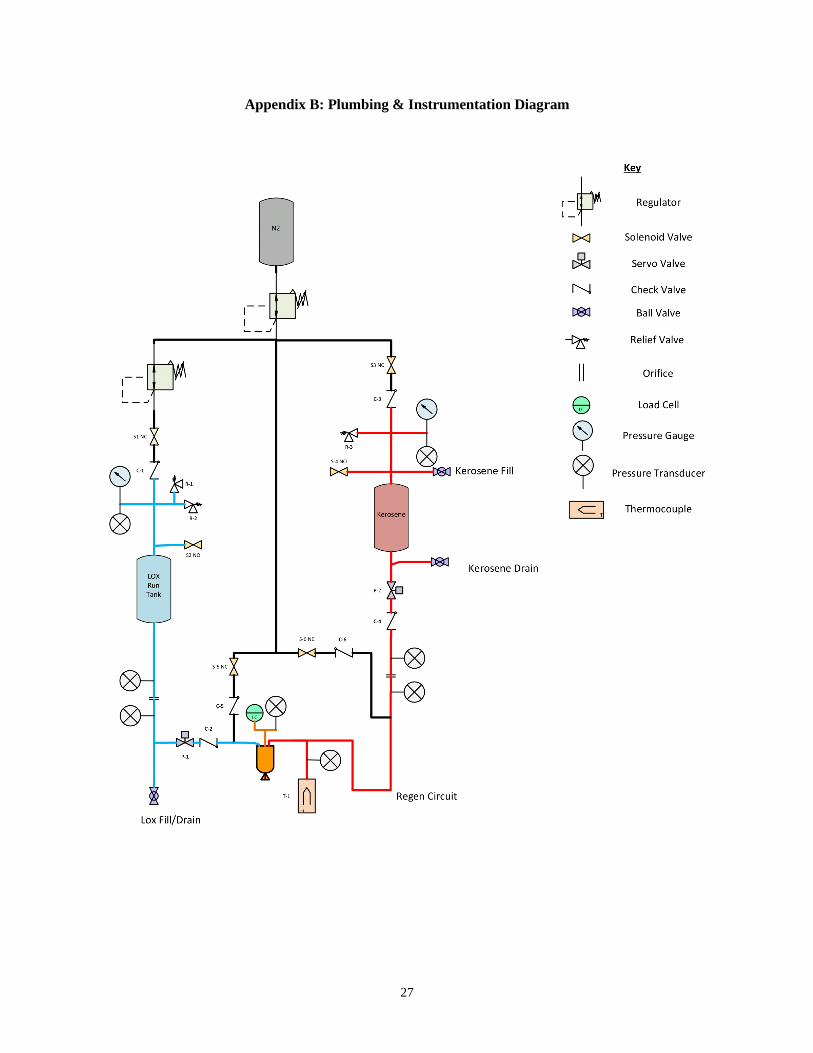
27
Appendix B: Plumbing & Instrumentation Diagram

28
Appendix C: Plumbing Panel Renders
Figure C-1. Computer rendering of fuel panel.
Figure C-2. Computer rendering of oxidizer panel.
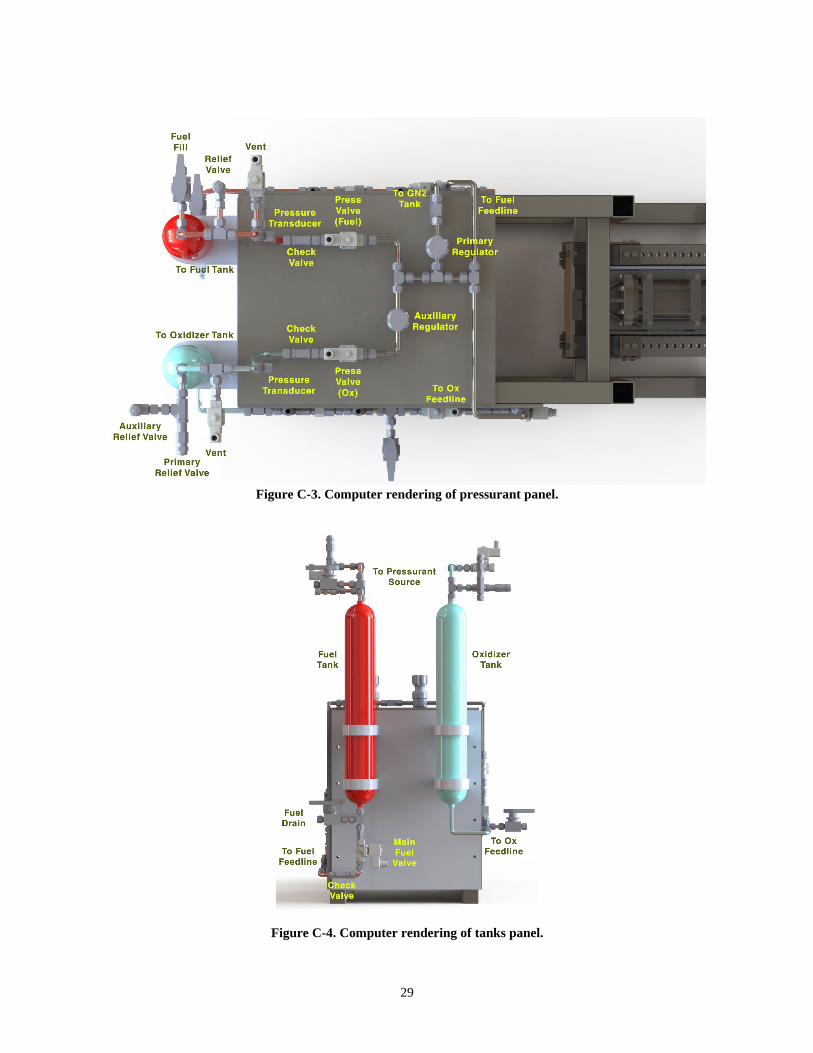
29
Figure C-3. Computer rendering of pressurant panel.
Figure C-4. Computer rendering of tanks panel.

30
Appendix D: Standoff Tubing
The following data is provided by Setra Systems, Inc. and assumes an ambient temperature of 100°F. The generation
of the table is detailed in [22].
Table D-1. Standoff Tubing Tabulated Data
Length of Temperature Stand-Offs (in)
Pressure Media
Temperature (°F)
303 Stainless Steel
(0.125 in OD x 0.007 in ID)
303 Stainless Steel
(0.25 in OD x 0.18 in ID)
-400 - 4.50
-300 - 4.25
-200 - 3.75
-100 - 3.00
0 Not Required Not Required
200 Not Required Not Required
400 3.00 3.50
600 3.75 4.50
800 4.30 5.20
1000 4.90 5.75
1200 5.25 6.10
1400 5.60 6.40
1600 5.85 6.80
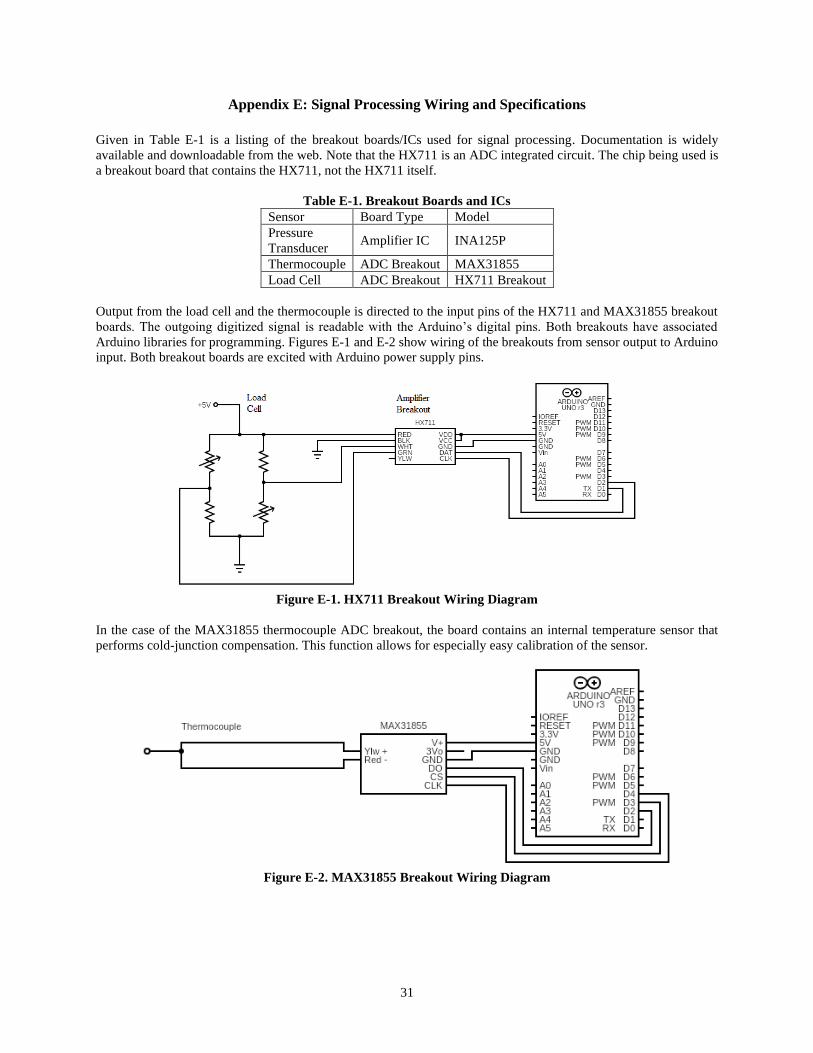
31
Appendix E: Signal Processing Wiring and Specifications
Given in Table E-1 is a listing of the breakout boards/ICs used for signal processing. Documentation is widely
available and downloadable from the web. Note that the HX711 is an ADC integrated circuit. The chip being used is
a breakout board that contains the HX711, not the HX711 itself.
Table E-1. Breakout Boards and ICs
Sensor Board Type Model
Pressure
Transducer Amplifier IC INA125P
Thermocouple ADC Breakout MAX31855
Load Cell ADC Breakout HX711 Breakout
Output from the load cell and the thermocouple is directed to the input pins of the HX711 and MAX31855 breakout
boards. The outgoing digitized signal is readable with the Arduino’s digital pins. Both breakouts have associated
Arduino libraries for programming. Figures E-1 and E-2 show wiring of the breakouts from sensor output to Arduino
input. Both breakout boards are excited with Arduino power supply pins.
Figure E-1. HX711 Breakout Wiring Diagram
In the case of the MAX31855 thermocouple ADC breakout, the board contains an internal temperature sensor that
performs cold-junction compensation. This function allows for especially easy calibration of the sensor.
Figure E-2. MAX31855 Breakout Wiring Diagram

32
Output from the pressure transducer will be amplified by the INA125P integrated circuit. The gain is set by the value
of an external resistor (𝑅𝐺) by the following relation:
𝐺 = 4 +60𝑘Ω
𝑅𝐺
From the gain equation, it follows that amplification of the 0-100 mV output to the 0-5 V range readable by the
Arduino requires a gain of 50 and an external resistance of approximately 1.3 kΩ. Correspondingly, the output of the
pressure transducer will be wired to the Arduino as shown in Figure E-3. Inclusion of a 10kΩ resistor across the
amplifier output allows a small amount of current to flow through the circuit.
Figure E-3. INA125P Amplifier Wiring Diagram
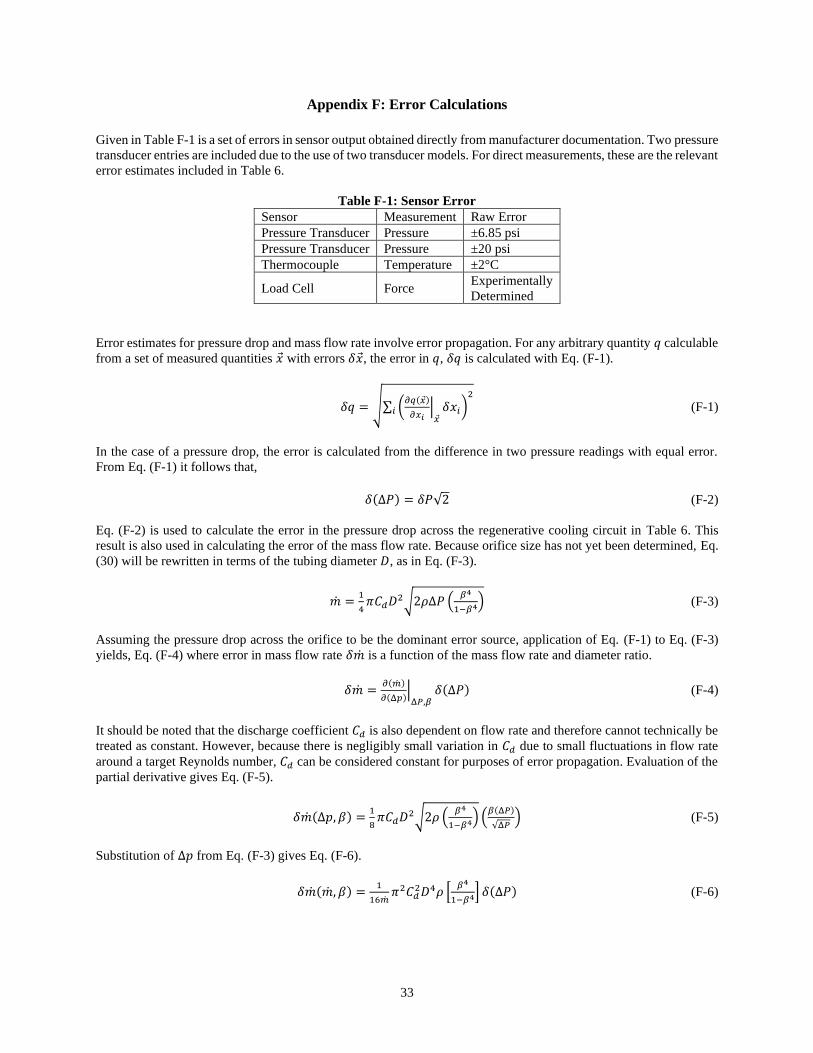
33
Appendix F: Error Calculations
Given in Table F-1 is a set of errors in sensor output obtained directly from manufacturer documentation. Two pressure
transducer entries are included due to the use of two transducer models. For direct measurements, these are the relevant
error estimates included in Table 6.
Table F-1: Sensor Error
Sensor Measurement Raw Error
Pressure Transducer Pressure ±6.85 psi
Pressure Transducer Pressure ±20 psi
Thermocouple Temperature ±2°C
Load Cell Force Experimentally
Determined
Error estimates for pressure drop and mass flow rate involve error propagation. For any arbitrary quantity 𝑞 calculable
from a set of measured quantities �⃗� with errors 𝛿�⃗�, the error in 𝑞, 𝛿𝑞 is calculated with Eq. (F-1).
𝛿𝑞 = √∑ (𝜕𝑞(𝑥)
𝜕𝑥𝑖|
𝑥𝛿𝑥𝑖)
2
𝑖 (F-1)
In the case of a pressure drop, the error is calculated from the difference in two pressure readings with equal error.
From Eq. (F-1) it follows that,
𝛿(Δ𝑃) = 𝛿𝑃√2 (F-2)
Eq. (F-2) is used to calculate the error in the pressure drop across the regenerative cooling circuit in Table 6. This
result is also used in calculating the error of the mass flow rate. Because orifice size has not yet been determined, Eq.
(30) will be rewritten in terms of the tubing diameter 𝐷, as in Eq. (F-3).
�̇� =1
4𝜋𝐶𝑑𝐷2√2𝜌Δ𝑃 (
𝛽4
1−𝛽4) (F-3)
Assuming the pressure drop across the orifice to be the dominant error source, application of Eq. (F-1) to Eq. (F-3)
yields, Eq. (F-4) where error in mass flow rate 𝛿�̇� is a function of the mass flow rate and diameter ratio.
𝛿�̇� =𝜕(�̇�)
𝜕(Δ𝑝)|
Δ𝑃,𝛽𝛿(Δ𝑃) (F-4)
It should be noted that the discharge coefficient 𝐶𝑑 is also dependent on flow rate and therefore cannot technically be
treated as constant. However, because there is negligibly small variation in 𝐶𝑑 due to small fluctuations in flow rate
around a target Reynolds number, 𝐶𝑑 can be considered constant for purposes of error propagation. Evaluation of the
partial derivative gives Eq. (F-5).
𝛿�̇�(Δ𝑝, 𝛽) =1
8𝜋𝐶𝑑𝐷2√2𝜌 (
𝛽4
1−𝛽4) (𝛽(Δ𝑃)
√Δ𝑃) (F-5)
Substitution of ∆𝑝 from Eq. (F-3) gives Eq. (F-6).
𝛿�̇�(�̇�, 𝛽) =1
16�̇�𝜋2𝐶𝑑
2𝐷4𝜌 [𝛽4
1−𝛽4] 𝛿(Δ𝑃) (F-6)

34
From Eq. (F-6), the error in mass flow rate is inversely proportional to the mass flow rate, and dependent on the
diameter ratio of the orifice 𝛽 by the expression within brackets. Figure F-1 shows the value of this multiplicative
factor for various values of 𝛽.
Figure F-1. Plot of Scaling of 𝜹�̇� vs 𝜷
From the plot, the error in mass flow rate increases exponentially as 𝛽 tends toward unity. This trend is indicative of
a tradeoff between the accuracy of flow rate data and allowable pressure loss in the plumbing system. Greater tolerance
for pressure drop will allow for more precise flow readings obtainable by decreasing diameter ratio. Because the value
of 𝛽 has not yet been chosen, the values in Table 6 are calculated from Eq. (F-6) with the assumptions 𝛽 = 0.5 and
𝐶𝑑 = 0.6.

35
Appendix G: Wiring Diagram

36
Acknowledgments
The authors would like to thank the faculty and Fulton Student Organizations staff at the Ira A. Fulton Schools of
Engineering that made this project possible. Without your steadfast commitment to student growth and success, we
would be lost with nowhere to take our passions. Special thanks go out to our organization’s faculty mentor Valana
Wells and our FSO Coordinator Melissa Stine, who have both been instrumental to the continued success of SDR.
The team would like to thank the Ira A. Fulton Schools of Engineering, ASU/NASA Space Grant program, Dassault
Systèmes, and RP Software+Engineering UG for their generous contributions to the project. Finally, the authors would
like to thank all the student members of SDR who chose to dive headfirst into the exciting world of liquid propulsion
with us, not sure where it might take you. Your dedication and passion drove this project forward and will continue
to drive our success for years to come.
References
[1] Sutton, G. P., and Biblarz, O., Rocket Propulsion Elements, 9th ed., Wiley, New York, 2017.
[2] Anderson, J. D., Modern Compressible Flow: With Historical Perspective, 3rd ed., McGraw-Hill Education, New York, 2002.
[3] Braeunig, R. A., “Rocket Propulsion,” Rocket & Space Technology, retrieved 25 April 2020.
http://www.braeunig.us/space/index.htm
[4] Huzel, D. K., and Huang, D. H., Modern Engineering for Design of Liquid-Propellant Rocket Engines, edited by A. R. Seebass,
Vol. 147, Progress in Astronautics and Aeronautics, AIAA, New York, 1992.
[5] Humble, R. W., Henry, G. N., and Larson, W. J., Space Propulsion Analysis and Design, Revised ed., McGraw-Hill, New
York, 1995.
[6] Germer, E. M., and Marchi, C. H., “Effect of Convergent Section Contour on the Sonic Line in Rocket Engine Nozzles,”
Journal of Aerospace Technology and Management, Vol. 10, Ed. 3218.
https://doi.org/10.5028/jatm.v10.924.
[7] Saric, W. S., “Görtler vortices,” Annual Review of Fluid Mechanics, Vol. 26:379-409, 1994.
https://doi.org/10.1146/annurev.fl.26.010194.002115
[8] Arrington, L. A., Reed, B. D., and Rivera, A., “A Performance Comparison of Two Small Rocket Nozzles,” NASA AIAA-96-
2582, 1996.
[9] Pizzarelli, M., “Regenerative cooling of liquid rocket engine thrust chambers,” November 2017.
https://doi.org/ 10.13140/RG.2.2.30668.92804
[10] Jenkins, W. D., Digges, T. G., and Johnson, C. R., “Tensile Properties of Copper, Nickel, and 70-Percent-Copper-30-Percent-
Nickel and 30-Percent-Copper-70-Percent-Nickel Alloys at High Temperatures,” Journal of Research of the National Bureau
of Standards, Vol. 58, No. 4.
[11] Gill, G. S., and Nurick, W. H., “Liquid rocket engine injectors,” NASA SP-8089, March 1976.
[12] Yang, V., Habiballah, M., Hulka, J., and Popp, M., Liquid Rocket Thrust Chambers, edited by P. Zarchan, Vol. 200, Progress
in Astronautics and Aeronautics, AIAA, New York, 2004.
[13] Elverum, G. W., and Morey, T. F., “Criteria for Optimum Mixture-Ratio Distribution Using Several Types of Impinging-
Stream Injector Elements,” JPL Memorandum 30-6, February 1959.
[14] “Differential Head Flowmeters,” The Water Measurement Manual, Revised Reprint, Bureau of Reclamation, U.S. Department
of the Interior, 2001.
[15] Conrad, E. W., Parish, H. C., and Wanhainen, J. P., “Effect of propellant injection velocity on screech in 20,000-pound
hydrogen-oxygen rocket engine,” NASA TN-D-3373, April 1966.
[16] Keddy, C. P., “Methodology for Assessing a Boiling Liquid Expanding Vapor Explosion (BLEVE) Blast Potential,” NASA
JSC-CN-26873, August 2012.
[17] “Safety Standard for Oxygen and Oxygen Systems: Guidelines for Oxygen System Design, Materials Selection, Operations,
Storage, and Transportation,” NASA NSS-1740.15, January 1996.
[18] Cengel, Y., and Cimbala, J., Fluid Mechanics: Fundamentals and Applications, 4th Ed., McGraw-Hill Education, New York,
2018.
[19] “Moody EN.svg,” Moody Diagram, retrieved 23 July 2020.
https://commons.wikimedia.org/wiki/File:Moody_EN.svg
[20] “Pressure Loss from Fittings – 2K Method,” Neutrium, retrieved 17 July 2020. https://neutrium.net/tags/2k-method/
[21] “Orifice, Nozzle and Venturi Flow Rate Meters,” The Engineering ToolBox, retrieved 1 June 2020.
https://www.engineeringtoolbox.com/orifice-nozzle-venturi-d_590.html
[22] Lish, T., “Pressure Transducers for High Temperature Liquids & Gases,” Setra Systems, retrieved 11 March 2020.
https://www.setra.com/blog/sensors-for-liquids-gases-in-high-temperatures/2015/02/12
[23] “14 CFR Appendix E to Part 420 - Tables for Explosive Site Plan,” Legal Information Institute, Cornell Law School, retrieved
6 May 2020. https://www.law.cornell.edu/cfr/text/14/appendix-E_to_part_420
[24] “Calculation of Safety Clear Zones for Experimental Permits under 14 CFR § 437.53(a),” Guide No. 437.53-1, Federal Aviation
Administration, U.S. Department of Transportation, February 2011.
[25] “DoD Ammunition and Explosives Safety Standards: General Quantity-Distance Criteria for Accidental Detonations,” Manual
No. 6055.09-M, Vol. 3, U.S. Department of Defense, February 2008.