student digital experience tracker€¦ · the student digital experience tracker (sdet) is an...
TRANSCRIPT
Version [2018-07-03/23] 1 | PAGE
STUDENT DIGITAL EXPERIENCE TRACKER
RESULTS & ANALYSIS
Contents Background ................................................................................................................................................................... 2
SDET @ CCCU ................................................................................................................................................................ 2
Implementation ............................................................................................................................................................ 2 Prize Draw ................................................................................................................................................................................. 3
Results ........................................................................................................................................................................... 3 Base Demographics ................................................................................................................................................................... 3 Access to Devices ....................................................................................................................................................................... 3 University Technology Services .................................................................................................................................................. 4 Virtual Learning Environment.................................................................................................................................................... 6 Digital Capabilities..................................................................................................................................................................... 7 Digital Teaching & Learning ...................................................................................................................................................... 9 Student Response to Digital Teaching & Learning .................................................................................................................. 10 Quality of Digital Provision ...................................................................................................................................................... 11 Digital Communications .......................................................................................................................................................... 12
Additional Points of Note ........................................................................................................................................... 13
Next Steps ................................................................................................................................................................... 13
Appendix A – Base Demographic Data ....................................................................................................................... 15 Appendix B – Action Plan ............................................................................................................................................ 17
Appendix C – Question Set ......................................................................................................................................... 22

Version [2018-07-03/23] 2 | PAGE
BACKGROUND The Student Digital Experience Tracker (SDET) is an online survey that was set up by Jisc and run first as a pilot during AY2015-16. Designed to be a sector standard, it aims to allow FE & HE institutions to gather information on their students’ experiences and expectations for their digital environment, covering a range of areas from IT basics (access to devices, quality of wifi etc) to the effectiveness of embedding technology into programmes. The initial closed pilot ran with 12 HE and 12 FE institutions, with questions that had been intensively tested with students. Feedback from that pilot resulted in some changes to the question set and a modified version was launched for the open pilot during AY2016-17. Over 100 institutions took part in the open pilot, ranging across HE, FE, Adult & Community Learning, online learners and some international institutions, with around 27,000 student responses received across them all. The results of the open pilot can be found on the Jisc SDET website at http://bit.ly/jisctracker17/ Some additional changes were made to the question set for running the Tracker during AY2017-18, but where possible Jisc have tried to keep the questions as close to those in the open pilot as possible, to allow for comparison and contrast.
SDET @ CCCU During 2017 the decision was made for CCCU to run the Tracker during AY2017-18, in order to allow us to gather information that we don’t currently otherwise receive institutionally. The only institution-wide information received regarding our digital environment is received through Learning Resources questions in the National Student Survey, but the questions are very generalised, and don’t provide detailed data that would allow us to structure our development and support for technology across the university. A rapid SDET working group was set up in September 2017, with membership including academics and representatives from key professional services departments, in particular Student Communications, LTE and IT. Unfortunately, no student representation was available to join the group at the time. The group met in October 2017 and agreed the implementation approach to be taken.
IMPLEMENTATION The Tracker is created and distributed through Bristol Online Surveys (BOS), with each institution asking exactly the same questions to allow for sector-wide comparison. A small amount of customisation is also available to allow the Tracker to meet individual institutions’ specific needs, through the addition of institution-specific questions at the end of the survey. The working group discussed various questions to be added, but finally settled on just one matrix question regarding the use of digital communications across the institution. Jisc run the Tracker from November through to the end of April, so the group decided that within that period the best time to gather student feedback would be between the middle of November and Christmas. This avoided clashes with NSS and other key surveys, and the length of time gave flexibility around the various assessment periods during the latter half of the Advent Semester. It was also decided that we should target all active students, including those within our partner institutions. Data was provided by Student Planning to give us the list of students to include and let us link responses to demographics, with a total of 13,038 students being included. A marketing campaign was launched using a variety of approaches including digital signage, posters, and tabletoppers and tray inserts in the canteen, as well as social media through Student Communications and the Students Union. As additional incentive, LTE provided £100 of shopping vouchers to be included in a prize draw, and IT were able to secure an iPad and an Amazon Dot as additional prizes. Individual emails were generated giving each student a unique link to the Tracker, which needed to be handled internally via IT due to limitations in the BOS mailing system. Two emails were sent. The first was to all included students when the Tracker was launched on Monday 13th November. We received 450 responses within the first 24 hours, and a significant further number over the course of the week, with responses dropping off as expected into the second week.

Version [2018-07-03/23] 3 | PAGE
The second reminder email was sent on Friday 8th December, sent only to those students who had not yet filled out the Tracker. This resulted in another significant spike of responses, and these continued to trickle in right through to the closing date. The survey was fully closed off for responses on December 31st 2017.
PRIZE DRAW The prize draw was made by SU President Krum Tashev during TEL Advisory Group on Tuesday 16th January, and the winners selected were: Gifty Agyei, BSc (Hons) Nursing (Adult), Stage 1 - £100 Shopping Vouchers Karen Kent, MA in Social Work, Stage 3 – Amazon Dot Catherine Herd, BA (Hons) Dance / Media and Communications, Stage 3 - iPad
RESULTS In total, 1,452 responses were received, giving an 11% response rate.
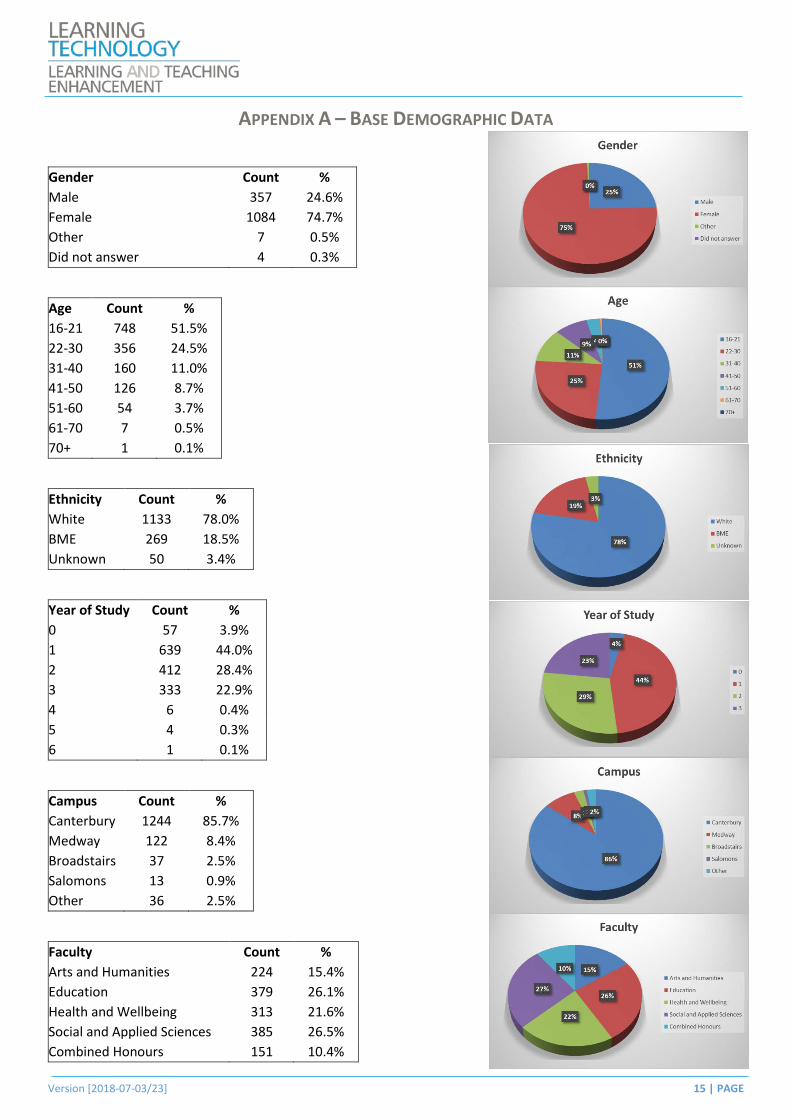
BASE DEMOGRAPHICS 75% of respondents were female, over 50% were aged 21 or under, and 78% were white, with BME students making up 19% of respondents. 82% of respondents had no known disability, with 7.5% having listed a specific learning difficulty. The majority of respondents were based at Canterbury (86%), and 44% were Year 1 students. All four faculties were well represented, with Arts & Humanities having the lowest number of respondents at 15% of the final figures. There were a total of 57 responses from partner institutions, with nearly half of those from School Direct. Full details of the base demographics can be found in Appendix A of this report.
ACCESS TO DEVICES Two questions were asked of the respondents regarding access to devices specifically for supporting their learning – question 4 asks about ownership of personal devices, while question 8 deals with access to University-owned devices. The questions split the devices into five categories: Desktop computer, Laptop computer, Tablet/iPad, Smartphone and Printer.
In total, only 5 students reported having access to no personal technology within any of these categories, and over 90% stated that they had access to their own personal laptop. This is similar to data provided across the sector last year where 88% of HE students made similar claim.
Action 1 : Increased support for Bring Your Own Device (BYOD)
Interestingly, 76% of students who owned either a personal laptop or desktop computer also stated that they use University-owned desktop computers for their studies, suggesting that the need for access to University computers
Figure 1 - Personal Devices Figure 2 - University Devices

Version [2018-07-03/23] 4 | PAGE
is as strong as it has ever been. Conversely, there is low usage of the University’s iBorrow service (22%), which IT are set to review.
Action 2 : Review iBorrow service
When we compare the use of printers, 72% of students said they use the University printers, even though 62% of that subset have access to their own personal printers.
The fact that 81% of students own smartphones is also a key statistic for shaping future solutions.
UNIVERSITY TECHNOLOGY SERVICES Only 86% of students feel reliable WiFi is available when needed, with particularly low results being shown in Medway. This does, however, compare favourably with sector results, where only 80% of HE students felt similarly. IT are currently investigating in an attempt to improve reliability.
Action 3 : Review WiFi coverage on all campuses, with particular focus at Medway
Access to file storage and backup are not well used, with improvements around MacOS storage and promotion of OneDrive to be made.
Action 4 : Review marketing of file storage solutions
When students require support for their devices, peer support is by far the favoured option, with Uni support only making up 16% of responses. Further analysis would need to be undertaken to determine whether that is due to perception of current support provision at CCCU specifically or a more general mind-set amongst students. Online information is clearly popular, suggesting that more online provision rather than face-to-face support may be more effective.
Action 5 : Ensure online guidance provided for devices is kept up-to-date for new University services and new device updates.
Figure 3 - University Services Figure 4 - Ubiquitous WiFi Service
Version [2018-07-03/23] 5 | PAGE
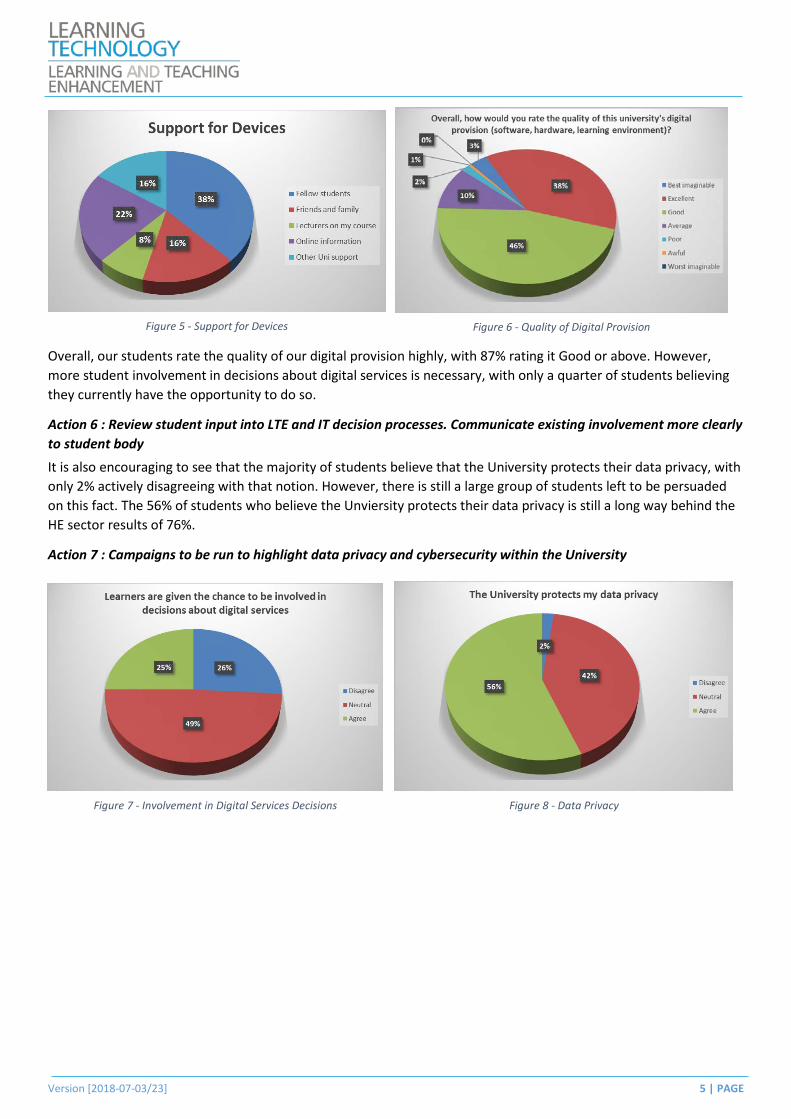
Overall, our students rate the quality of our digital provision highly, with 87% rating it Good or above. However, more student involvement in decisions about digital services is necessary, with only a quarter of students believing they currently have the opportunity to do so.
Action 6 : Review student input into LTE and IT decision processes. Communicate existing involvement more clearly to student body
It is also encouraging to see that the majority of students believe that the University protects their data privacy, with only 2% actively disagreeing with that notion. However, there is still a large group of students left to be persuaded on this fact. The 56% of students who believe the Unviersity protects their data privacy is still a long way behind the HE sector results of 76%.
Action 7 : Campaigns to be run to highlight data privacy and cybersecurity within the University
Figure 5 - Support for Devices Figure 6 - Quality of Digital Provision
Figure 7 - Involvement in Digital Services Decisions Figure 8 - Data Privacy
Version [2018-07-03/23] 6 | PAGE
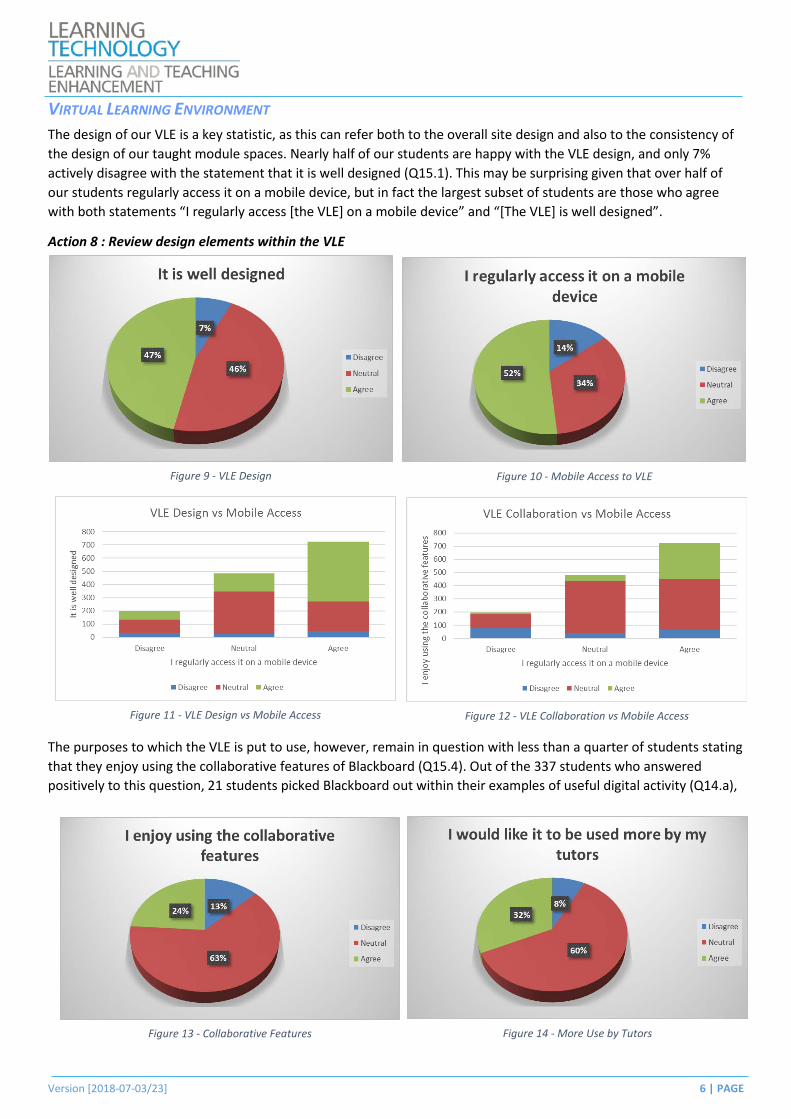
VIRTUAL LEARNING ENVIRONMENT The design of our VLE is a key statistic, as this can refer both to the overall site design and also to the consistency of the design of our taught module spaces. Nearly half of our students are happy with the VLE design, and only 7% actively disagree with the statement that it is well designed (Q15.1). This may be surprising given that over half of our students regularly access it on a mobile device, but in fact the largest subset of students are those who agree with both statements “I regularly access [the VLE] on a mobile device” and “[The VLE] is well designed”.
Action 8 : Review design elements within the VLE
The purposes to which the VLE is put to use, however, remain in question with less than a quarter of students stating that they enjoy using the collaborative features of Blackboard (Q15.4). Out of the 337 students who answered positively to this question, 21 students picked Blackboard out within their examples of useful digital activity (Q14.a),
Figure 9 - VLE Design Figure 10 - Mobile Access to VLE
Figure 13 - Collaborative Features Figure 14 - More Use by Tutors
Figure 11 - VLE Design vs Mobile Access Figure 12 - VLE Collaboration vs Mobile Access

Version [2018-07-03/23] 7 | PAGE
which suggests that the overall results regarding collaborative features are more likely a result of lack of use across programmes, rather than poor activity results.
It is encouraging to see 32% of students expressing a desire for their tutors to use the VLE more, although developing wider understanding of its capabilities amongst our students may allow us to see further increase in these numbers.
DIGITAL CAPABILITIES Our students are unsure as to what is being done by the University to address their online safety. Cybersecurity campaigns are now progressing to change this.
Two thirds of our students do not believe that they have regular opportunity to update their digital skills, which needs to be addressed both centrally (through promotion of training and certificates available) and through more clearly embedded opportunities within programmes. The Digital Capabilities Working Group are currently exploring existing opportunities in order to determine additional development.
Action 9 : Develop greater opportunity for digital skills to be easily embedded within programme design
Our students clearly understand the importance of digital skills in their chosen career, and those that do are more aware of the opportunities (and lack thereof) available to them for developing those skills effectively. Only a third of our students, however, believe that their course prepares them for the digital workplace, with 22% actively disagreeing with this statement. This opinion is split equally across all four faculties, emphasising the need for us to further embed the development of digital skills as a core element within all programmes.
Action 10 : Programmes to review their digital capabilities development for students
Figure 15 - Online Safety
Figure 16 - Opportunities to update digital skills Figure 17 - Updating Digital Skills by Faculty

Version [2018-07-03/23] 8 | PAGE
Additionally, only a quarter of students were told what digital skills they would need prior to starting their course. This is an area that the Digital Capabilities Working Group are currently investigating towards developing better visibility of both the skills that are needed and how the University will support the student in developing those skills. Again, there is no huge difference between the four faculties on this opinion.
Action 11 : Highlight digital capabilities necessary for any given programme, and the opportunities provided to develop them, in programme marketing or enrolment.
Figure 18 - Importance of Digital Skills Figure 19 - Digital Skills importance vs opportunity
Figure 20 - Preparation for the Digital Workspace Figure 21 - Preparation for the Digital Workspace by Faculty
Figure 22 - Understanding of Course Digital Skills Figure 23 - Understanding of Course Digital Skills by Faculty
Version [2018-07-03/23] 9 | PAGE
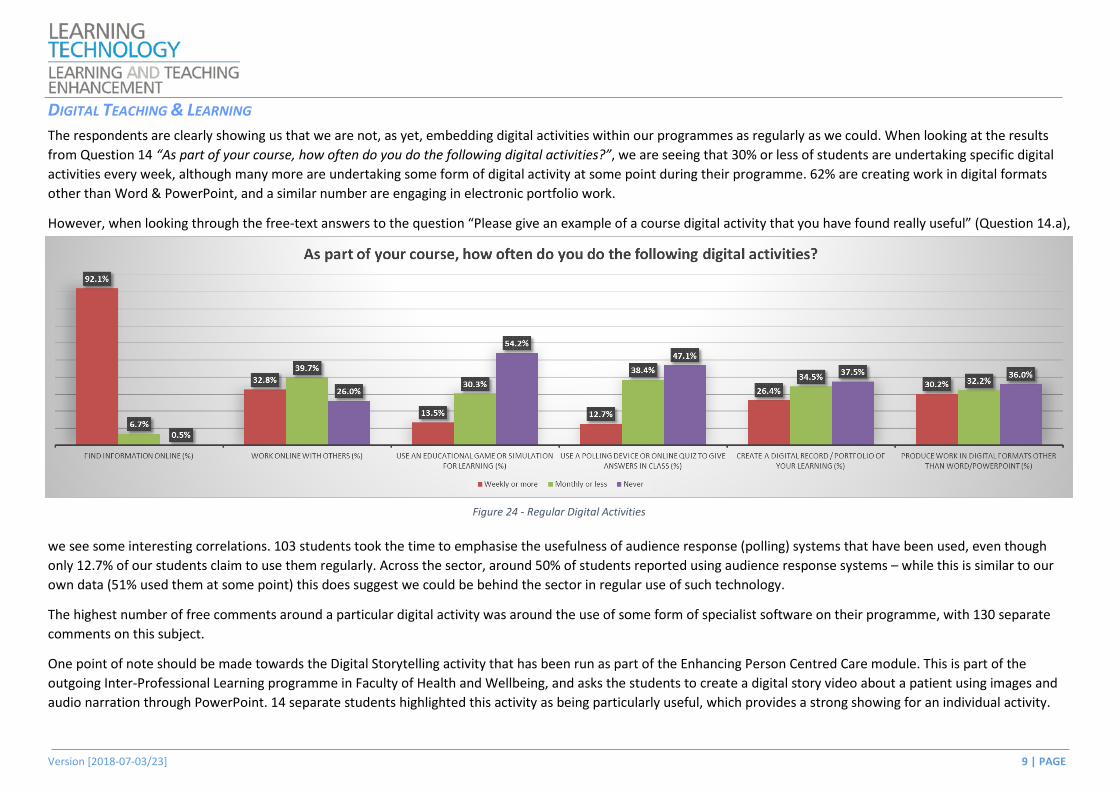
DIGITAL TEACHING & LEARNING The respondents are clearly showing us that we are not, as yet, embedding digital activities within our programmes as regularly as we could. When looking at the results from Question 14 “As part of your course, how often do you do the following digital activities?”, we are seeing that 30% or less of students are undertaking specific digital activities every week, although many more are undertaking some form of digital activity at some point during their programme. 62% are creating work in digital formats other than Word & PowerPoint, and a similar number are engaging in electronic portfolio work.
However, when looking through the free-text answers to the question “Please give an example of a course digital activity that you have found really useful” (Question 14.a),
we see some interesting correlations. 103 students took the time to emphasise the usefulness of audience response (polling) systems that have been used, even though only 12.7% of our students claim to use them regularly. Across the sector, around 50% of students reported using audience response systems – while this is similar to our own data (51% used them at some point) this does suggest we could be behind the sector in regular use of such technology.
The highest number of free comments around a particular digital activity was around the use of some form of specialist software on their programme, with 130 separate comments on this subject.
One point of note should be made towards the Digital Storytelling activity that has been run as part of the Enhancing Person Centred Care module. This is part of the outgoing Inter-Professional Learning programme in Faculty of Health and Wellbeing, and asks the students to create a digital story video about a patient using images and audio narration through PowerPoint. 14 separate students highlighted this activity as being particularly useful, which provides a strong showing for an individual activity.
Figure 24 - Regular Digital Activities
Version [2018-07-03/23] 10 | PAGE
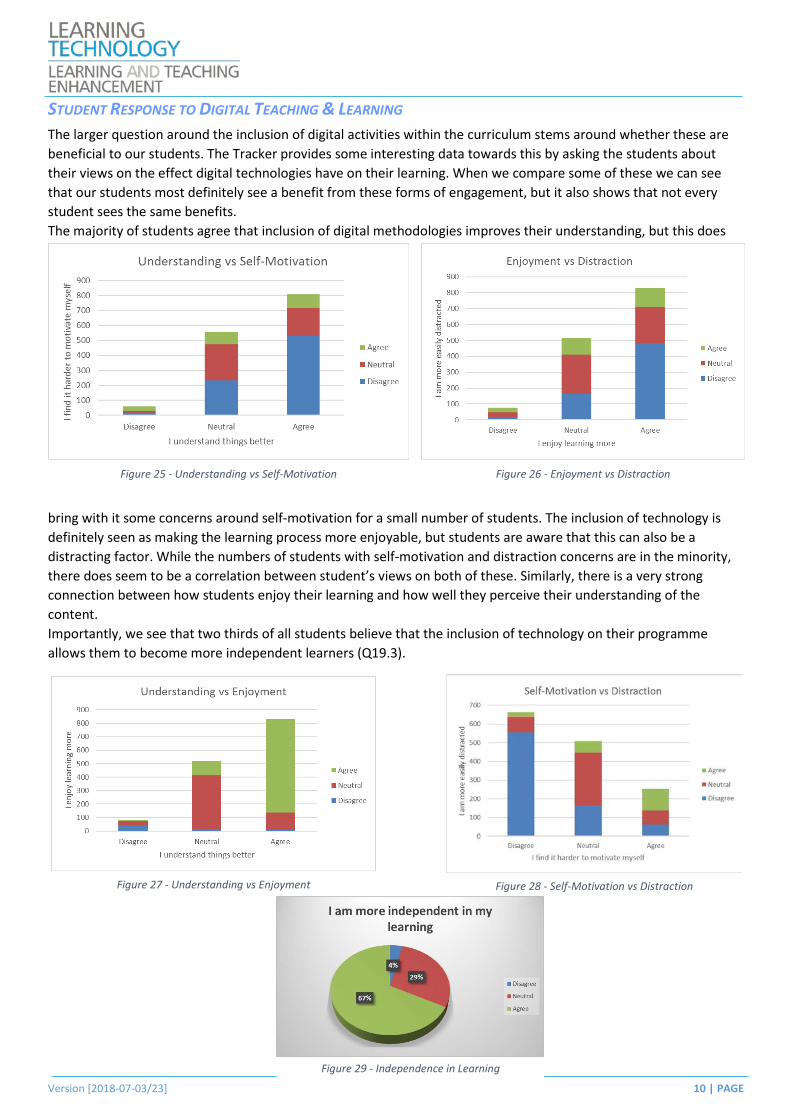
STUDENT RESPONSE TO DIGITAL TEACHING & LEARNING The larger question around the inclusion of digital activities within the curriculum stems around whether these are beneficial to our students. The Tracker provides some interesting data towards this by asking the students about their views on the effect digital technologies have on their learning. When we compare some of these we can see that our students most definitely see a benefit from these forms of engagement, but it also shows that not every student sees the same benefits. The majority of students agree that inclusion of digital methodologies improves their understanding, but this does
bring with it some concerns around self-motivation for a small number of students. The inclusion of technology is definitely seen as making the learning process more enjoyable, but students are aware that this can also be a distracting factor. While the numbers of students with self-motivation and distraction concerns are in the minority, there does seem to be a correlation between student’s views on both of these. Similarly, there is a very strong connection between how students enjoy their learning and how well they perceive their understanding of the content. Importantly, we see that two thirds of all students believe that the inclusion of technology on their programme allows them to become more independent learners (Q19.3).
Figure 25 - Understanding vs Self-Motivation Figure 26 - Enjoyment vs Distraction
Figure 27 - Understanding vs Enjoyment Figure 28 - Self-Motivation vs Distraction
Figure 29 - Independence in Learning
Version [2018-07-03/23] 11 | PAGE
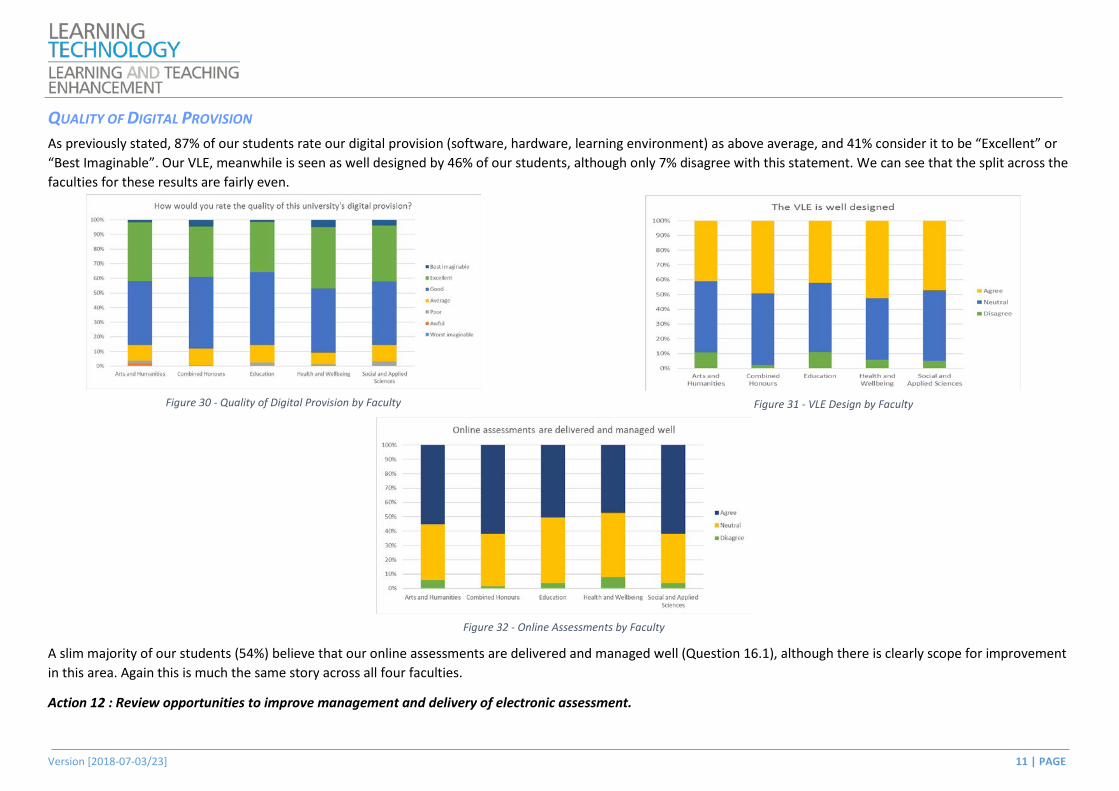
QUALITY OF DIGITAL PROVISION As previously stated, 87% of our students rate our digital provision (software, hardware, learning environment) as above average, and 41% consider it to be “Excellent” or “Best Imaginable”. Our VLE, meanwhile is seen as well designed by 46% of our students, although only 7% disagree with this statement. We can see that the split across the faculties for these results are fairly even.
A slim majority of our students (54%) believe that our online assessments are delivered and managed well (Question 16.1), although there is clearly scope for improvement in this area. Again this is much the same story across all four faculties.
Action 12 : Review opportunities to improve management and delivery of electronic assessment.
Figure 30 - Quality of Digital Provision by Faculty Figure 31 - VLE Design by Faculty
Figure 32 - Online Assessments by Faculty

Version [2018-07-03/23] 12 | PAGE
DIGITAL COMMUNICATIONS CCCU added their own final question (Q23) to the Tracker, in order to garner student opinion on the digital methods that they would prefer us to use for communicating with them. Working with Student Communications, we split the communications over six key areas across the University – Your Course, Programme Admin, University Facilities, Responses to Student Feedback, Support Services, and Wider Opportunities. We then provided options for the eight main digital communications channels that Student Communications have identified – University Email, Text Messaging (SMS), Web sites, Student Portal, Blackboard, Facebook, Twitter & Instagram.
Students could select multiple channels for each area.
The question asked was “Which digital channels do you prefer the University to use when providing you with information on the following…?”
Across all six areas, it was clear that students still prefer to be contacted via University Email above all other methods, with between 65% and 81% of students selecting that channel dependent upon the area.
As expected, Blackboard and Student Portal both score strongly for programme communications, but we see that both sit at around 50% across all other areas. Social Media, on the other hand, scores very poorly for everything except Wider Opportunities, suggesting that our students are either not using social media as much as may be expected, or want to keep their social media separate from their studies.
Action 13 : Expand Customer Relationship Management project to allow students to select preferred communications channels.
Figure 33 - Digital Communications Channels by Area
Version [2018-07-03/23] 13 | PAGE
ADDITIONAL POINTS OF NOTE In addition, free-text responses provided some consistently repeated feedback on particular areas. These are noted below for additional action. Note that as these were free-text responses, the range of results is greater and as such the overall percentages are considerably lower. The items highlighted here were amongst the most popular results. The greatest number of free-text responses to the question “To improve your experience of digital teaching and learning … what one thing should we DO?” were classed as requests for additional training or guidance (30% of respondents).
Action 14 : Review online guidance and training provided to students and identify improvements to signposting.
Out of the subset of students (7%) who highlighted Library resources as an area for improvement, 17% wanted to see LibrarySearch improved.
Action 15 : Review LibrarySearch facility with focus on suitable results and opportunity for expansion of sources.
The fifth most popular request was for lectures to be recorded for online viewing. 6% of respondents took the opportunity to highlight that lecture capture would be beneficial to their learning.
Action 16 : Implement lecture capture solution across campus.
Blackboard was the second most mentioned response, covering a variety of requests. The most popular were around improving the ease of use of the VLE (particularly on mobile devices), and improving/increasing the content hosted within Blackboard.
Action 8 (repeated from p6) : Review design elements within the VLE
Action 17 : Programme Teams to review appropriate increased use of the VLE and associated learning technologies as part of programme review and development
NEXT STEPS The data shown in this report is an institutional-level overview of some of the key elements drawn from the data. In order to fully benefit from the Tracker results, data next needs to be provided to a variety of areas within the university to allow them to have opportunity to assess pertinent results for those areas. We have already seen benefits from this approach in IT where the data is already being used to assess and improve key service elements. The four faculties will be provided access to their data through their Faculty Learning Technologist, to allow them to analyse the data at faculty-, school-, and programme- levels. Other departments, such as Student Disability Service, Library and Learning Resources and Student Communications should also be given access to the data for similar analysis.
Action 18 : Share results with all staff and encourage amendment of practice (particularly around use of VLE and assessment)
Key actions highlighted in this report (summarised in Appendix B) will be acted upon by the appropriate departments and faculties. Jisc close the Tracker for all institutions at the end of April 2018, and will generate a sector-wide report in the early summer, which will allow us to compare and contrast our results with those of the sector averages.
Version [2018-07-03/23] 14 | PAGE
The data provided in the Tracker has already seen to be useful, and is shaping the approaches we take in a number of different areas. It is recommended that this is run again in November 2018 to allow us to compare and contrast results, with the suggestion that this become an annual survey beyond that. A similar survey of academic staff is currently being developed by Jisc, and this is being considered by the Digital Capabilities Working Group for use at CCCU. Discussions around this between LTE, HR, Library and Learning Resources and IT have begun and it is believed that this will provide an interesting counterpoint of data to contrast against the Student Digital Experience Tracker.
Version [2018-07-03/23] 15 | PAGE
APPENDIX A – BASE DEMOGRAPHIC DATA
Gender Count % Male 357 24.6% Female 1084 74.7% Other 7 0.5% Did not answer 4 0.3%
Age Count % 16-21 748 51.5% 22-30 356 24.5% 31-40 160 11.0% 41-50 126 8.7% 51-60 54 3.7% 61-70 7 0.5% 70+ 1 0.1%
Ethnicity Count % White 1133 78.0% BME 269 18.5% Unknown 50 3.4%
Year of Study Count % 0 57 3.9% 1 639 44.0% 2 412 28.4% 3 333 22.9% 4 6 0.4% 5 4 0.3% 6 1 0.1%
Campus Count % Canterbury 1244 85.7% Medway 122 8.4% Broadstairs 37 2.5% Salomons 13 0.9% Other 36 2.5%
Faculty Count % Arts and Humanities 224 15.4% Education 379 26.1% Health and Wellbeing 313 21.6% Social and Applied Sciences 385 26.5% Combined Honours 151 10.4%

Version [2018-07-03/23] 16 | PAGE
Disability Count % No Known Disability 1190 82.0% You have a mental health condition, such as depression, schizophrenia or anxiety disorder 56 3.9% You have a specific learning difficulty such as dyslexia, dyspraxia or AD(H)D 109 7.5% Mental health difficulties 4 0.3% You have two or more impairments and/or disabling medical conditions 10 0.7% Blind/partially sighted 1 0.1% You have a disability, impairment or medical condition that is not listed above 23 1.6% You have a social/communication impairment such as Asperger's syndrome/other autistic spectrum disorder 9 0.6% You have a long standing illness or health condition such as cancer, HIV, diabetes, chronic heart disease, or epilepsy 17 1.2% You have physical impairment or mobility issues, such as difficulty using your arms or using a wheelchair or crutches 4 0.3% An unseen disability, e.g. diabetes, epilepsy, asthma 9 0.6% You are deaf or have a serious hearing impairment 4 0.3% You are blind or have a serious visual impairment uncorrected by glasses 2 0.1% Other Disability Not Otherwise Listed 1 0.1% A Specific Learning Difficulty E.g. Dyslexia 5 0.3% Deaf/hearing impairment 1 0.1%
Version [2018-07-03/23] 17 | PAGE
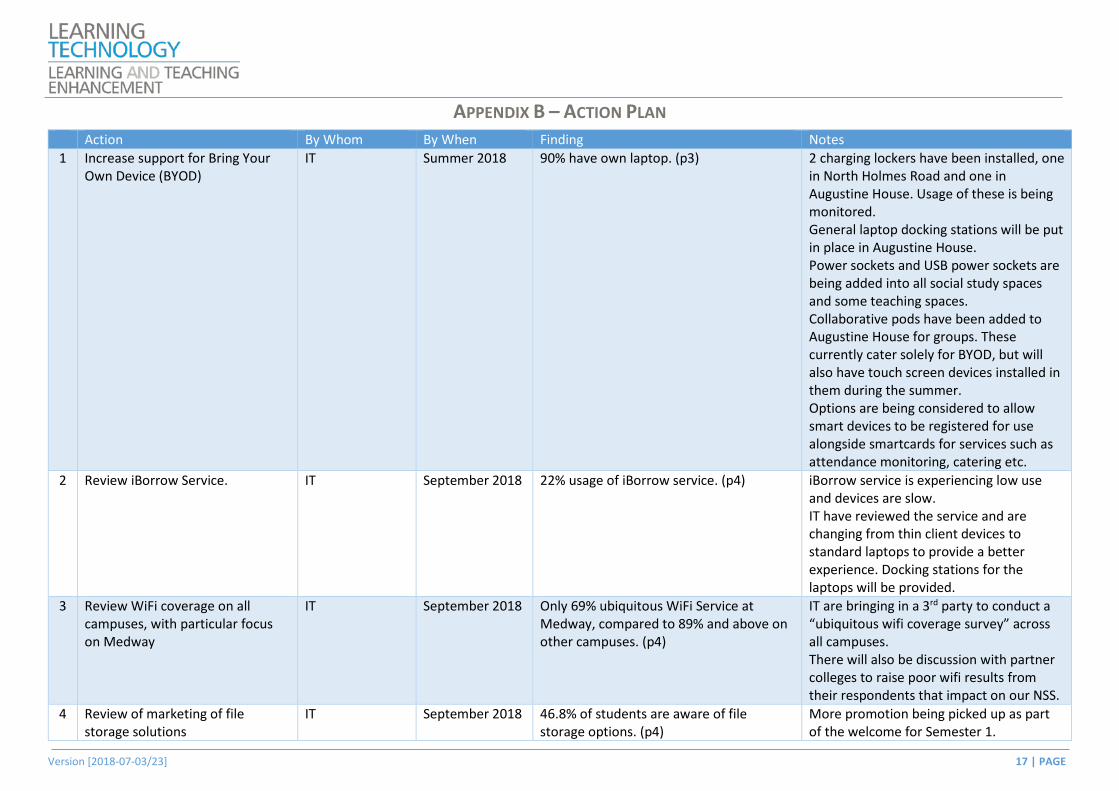
APPENDIX B – ACTION PLAN Action By Whom By When Finding Notes
1 Increase support for Bring Your Own Device (BYOD)
IT Summer 2018 90% have own laptop. (p3) 2 charging lockers have been installed, one in North Holmes Road and one in Augustine House. Usage of these is being monitored. General laptop docking stations will be put in place in Augustine House. Power sockets and USB power sockets are being added into all social study spaces and some teaching spaces. Collaborative pods have been added to Augustine House for groups. These currently cater solely for BYOD, but will also have touch screen devices installed in them during the summer. Options are being considered to allow smart devices to be registered for use alongside smartcards for services such as attendance monitoring, catering etc.
2 Review iBorrow Service. IT September 2018 22% usage of iBorrow service. (p4) iBorrow service is experiencing low use and devices are slow. IT have reviewed the service and are changing from thin client devices to standard laptops to provide a better experience. Docking stations for the laptops will be provided.
3 Review WiFi coverage on all campuses, with particular focus on Medway
IT September 2018 Only 69% ubiquitous WiFi Service at Medway, compared to 89% and above on other campuses. (p4)
IT are bringing in a 3rd party to conduct a “ubiquitous wifi coverage survey” across all campuses. There will also be discussion with partner colleges to raise poor wifi results from their respondents that impact on our NSS.
4 Review of marketing of file storage solutions
IT September 2018 46.8% of students are aware of file storage options. (p4)
More promotion being picked up as part of the welcome for Semester 1.
Version [2018-07-03/23] 18 | PAGE
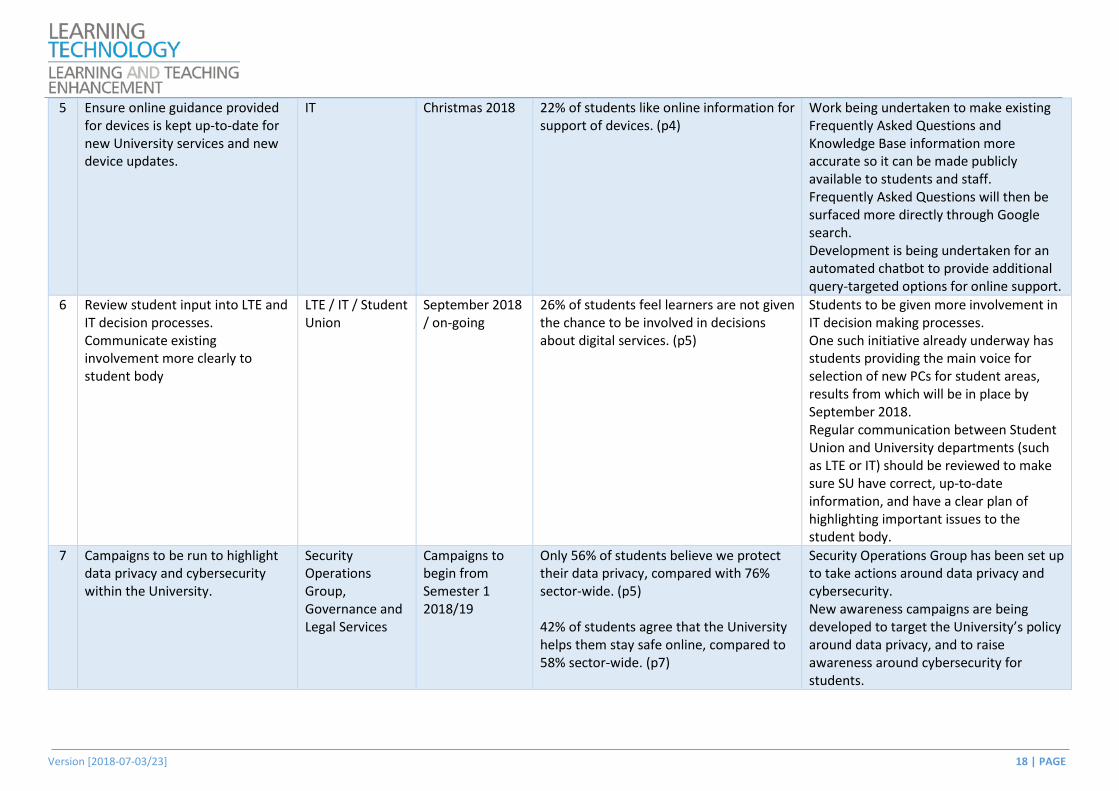
5 Ensure online guidance provided for devices is kept up-to-date for new University services and new device updates.
IT Christmas 2018 22% of students like online information for support of devices. (p4)
Work being undertaken to make existing Frequently Asked Questions and Knowledge Base information more accurate so it can be made publicly available to students and staff. Frequently Asked Questions will then be surfaced more directly through Google search. Development is being undertaken for an automated chatbot to provide additional query-targeted options for online support.
6 Review student input into LTE and IT decision processes. Communicate existing involvement more clearly to student body
LTE / IT / Student Union
September 2018 / on-going
26% of students feel learners are not given the chance to be involved in decisions about digital services. (p5)
Students to be given more involvement in IT decision making processes. One such initiative already underway has students providing the main voice for selection of new PCs for student areas, results from which will be in place by September 2018. Regular communication between Student Union and University departments (such as LTE or IT) should be reviewed to make sure SU have correct, up-to-date information, and have a clear plan of highlighting important issues to the student body.
7 Campaigns to be run to highlight data privacy and cybersecurity within the University.
Security Operations Group, Governance and Legal Services
Campaigns to begin from Semester 1 2018/19
Only 56% of students believe we protect their data privacy, compared with 76% sector-wide. (p5) 42% of students agree that the University helps them stay safe online, compared to 58% sector-wide. (p7)
Security Operations Group has been set up to take actions around data privacy and cybersecurity. New awareness campaigns are being developed to target the University’s policy around data privacy, and to raise awareness around cybersecurity for students.
Version [2018-07-03/23] 19 | PAGE
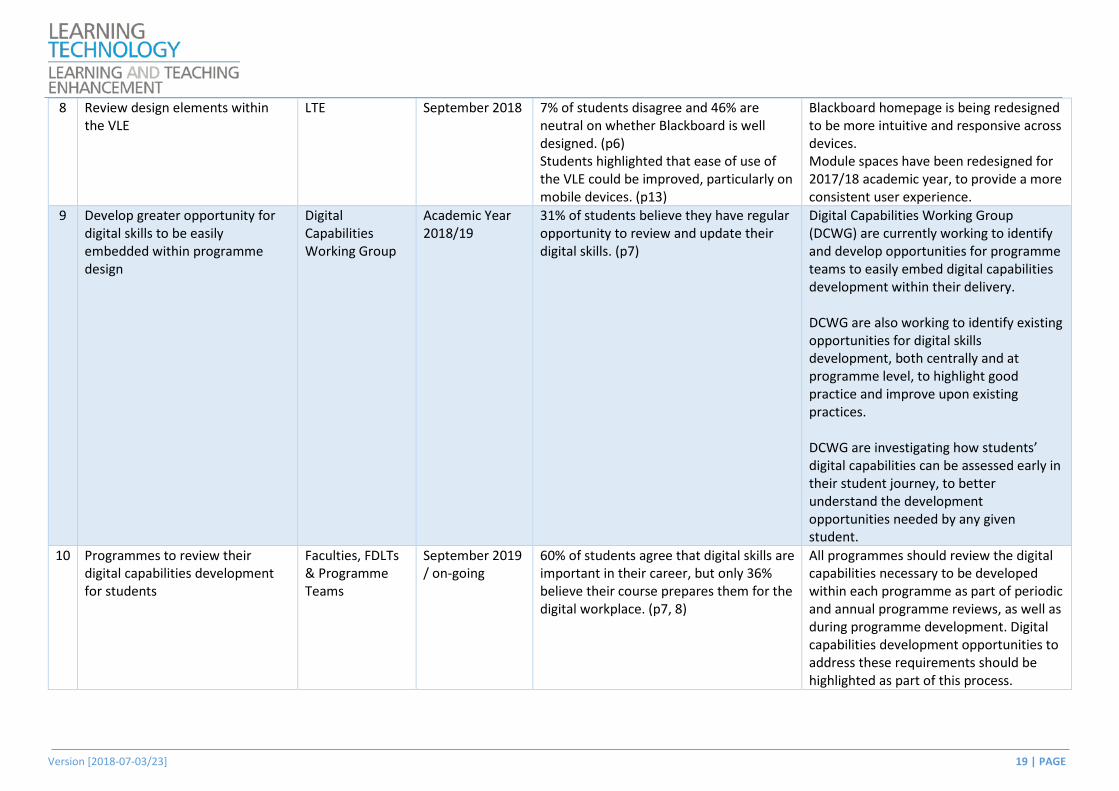
8 Review design elements within the VLE
LTE September 2018 7% of students disagree and 46% are neutral on whether Blackboard is well designed. (p6) Students highlighted that ease of use of the VLE could be improved, particularly on mobile devices. (p13)
Blackboard homepage is being redesigned to be more intuitive and responsive across devices. Module spaces have been redesigned for 2017/18 academic year, to provide a more consistent user experience.
9 Develop greater opportunity for digital skills to be easily embedded within programme design
Digital Capabilities Working Group
Academic Year 2018/19
31% of students believe they have regular opportunity to review and update their digital skills. (p7)
Digital Capabilities Working Group (DCWG) are currently working to identify and develop opportunities for programme teams to easily embed digital capabilities development within their delivery. DCWG are also working to identify existing opportunities for digital skills development, both centrally and at programme level, to highlight good practice and improve upon existing practices. DCWG are investigating how students’ digital capabilities can be assessed early in their student journey, to better understand the development opportunities needed by any given student.
10 Programmes to review their digital capabilities development for students
Faculties, FDLTs & Programme Teams
September 2019 / on-going
60% of students agree that digital skills are important in their career, but only 36% believe their course prepares them for the digital workplace. (p7, 8)
All programmes should review the digital capabilities necessary to be developed within each programme as part of periodic and annual programme reviews, as well as during programme development. Digital capabilities development opportunities to address these requirements should be highlighted as part of this process.

Version [2018-07-03/23] 20 | PAGE
11 Highlight digital capabilities necessary for any given programme, and the opportunities provided to develop them, in programme marketing or enrolment.
Digital Capabilities Working Group
Christmas 2018 25% of students felt they were told the digital skills they would need prior to starting their course, compared to 53% sector-wide. (p8)
Digital Capabilities Working Group is looking at recommendations for how digital capabilities required on a programme (and opportunities through which these will be developed) can be highlighted to students when they apply or enrol.
12 Review opportunities to improve management and delivery of electronic assessment.
EMA Working Group, LTE
September 2019 / on-going
54% of students believe our online assessments are delivered and managed well. (p11)
Electronic Management of Assessments Working Group (EMAWG) will be reviewing all aspects of electronic assessment. Consistent submission facilities and guidance were put in place across 2017/18 academic year to improve the overall student experience. LTE working with programme teams as part of on-going programme review to advise on development of electronic assessment processes.
13 Expand Customer Relationship Management project to allow students to select preferred communications channels.
Student Communications
September 2018 University Email is the communication channel our students most prefer, but there are varied preferences across areas of the University. (p12)
Current CRM project covers applicants, but should be expanded to include enrolled students. This will provide greater opportunity for students to select the communications channels they prefer to use for different aspects of student life.
14 Review LibrarySearch facility with focus on suitable results and opportunity for expansion of sources.
LLR September 2019 17% of students highlighting necessity for improvement in library resources want LibrarySearch to be improved. (p13)
Review with partner institutions how LibrarySearch results could be improved. Investigate whether it would be possible to return results from heavily used systems like Google Scholar and YouTube.
15 Review online guidance and training provided to students and identify improvements to signposting.
Student Communications, All professional services and academic teams
On-going 30% of students requested additional or improved guidance. (p13)
Student Communications have redeveloped the Current Students page of the web site to more clearly signpost areas of particular interest, including clear access to i-Zone support.
Version [2018-07-03/23] 21 | PAGE
All teams should regularly review guidance & training and work with Student Communications to provide clear and consistent access for students.
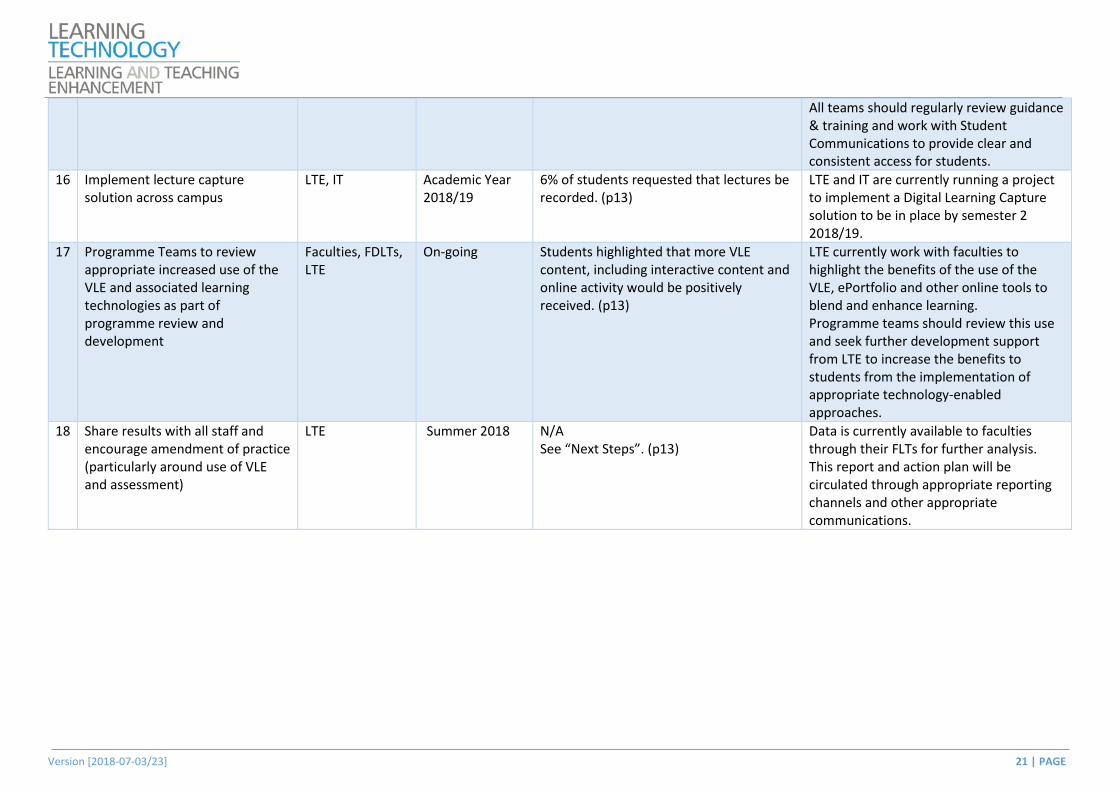
16 Implement lecture capture solution across campus
LTE, IT Academic Year 2018/19
6% of students requested that lectures be recorded. (p13)
LTE and IT are currently running a project to implement a Digital Learning Capture solution to be in place by semester 2 2018/19.
17 Programme Teams to review appropriate increased use of the VLE and associated learning technologies as part of programme review and development
Faculties, FDLTs, LTE
On-going Students highlighted that more VLE content, including interactive content and online activity would be positively received. (p13)
LTE currently work with faculties to highlight the benefits of the use of the VLE, ePortfolio and other online tools to blend and enhance learning. Programme teams should review this use and seek further development support from LTE to increase the benefits to students from the implementation of appropriate technology-enabled approaches.
18 Share results with all staff and encourage amendment of practice (particularly around use of VLE and assessment)
LTE Summer 2018 N/A See “Next Steps”. (p13)
Data is currently available to faculties through their FLTs for further analysis. This report and action plan will be circulated through appropriate reporting channels and other appropriate communications.
Version [2018-07-03/23] 22 | PAGE
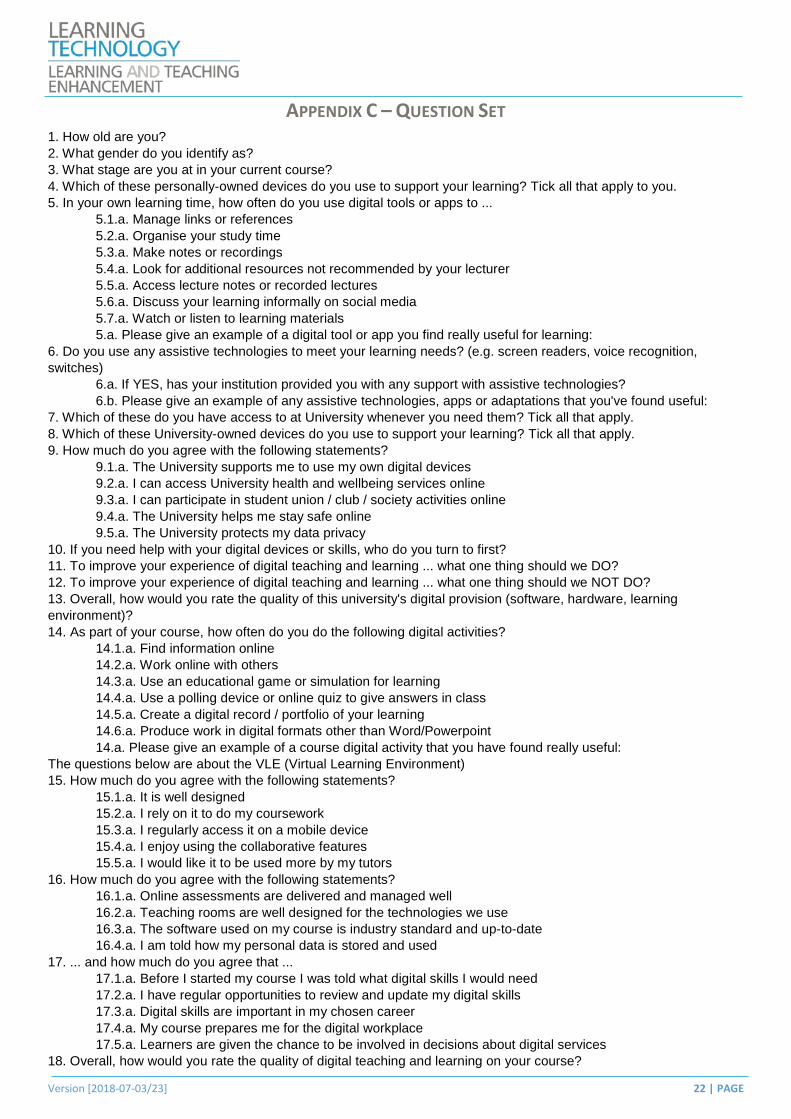
APPENDIX C – QUESTION SET 1. How old are you? 2. What gender do you identify as? 3. What stage are you at in your current course? 4. Which of these personally-owned devices do you use to support your learning? Tick all that apply to you. 5. In your own learning time, how often do you use digital tools or apps to ...
5.1.a. Manage links or references 5.2.a. Organise your study time 5.3.a. Make notes or recordings 5.4.a. Look for additional resources not recommended by your lecturer 5.5.a. Access lecture notes or recorded lectures 5.6.a. Discuss your learning informally on social media 5.7.a. Watch or listen to learning materials 5.a. Please give an example of a digital tool or app you find really useful for learning:
6. Do you use any assistive technologies to meet your learning needs? (e.g. screen readers, voice recognition, switches)
6.a. If YES, has your institution provided you with any support with assistive technologies? 6.b. Please give an example of any assistive technologies, apps or adaptations that you've found useful:
7. Which of these do you have access to at University whenever you need them? Tick all that apply. 8. Which of these University-owned devices do you use to support your learning? Tick all that apply. 9. How much do you agree with the following statements?
9.1.a. The University supports me to use my own digital devices 9.2.a. I can access University health and wellbeing services online 9.3.a. I can participate in student union / club / society activities online 9.4.a. The University helps me stay safe online 9.5.a. The University protects my data privacy
10. If you need help with your digital devices or skills, who do you turn to first? 11. To improve your experience of digital teaching and learning ... what one thing should we DO? 12. To improve your experience of digital teaching and learning ... what one thing should we NOT DO? 13. Overall, how would you rate the quality of this university's digital provision (software, hardware, learning environment)? 14. As part of your course, how often do you do the following digital activities?
14.1.a. Find information online 14.2.a. Work online with others 14.3.a. Use an educational game or simulation for learning 14.4.a. Use a polling device or online quiz to give answers in class 14.5.a. Create a digital record / portfolio of your learning 14.6.a. Produce work in digital formats other than Word/Powerpoint 14.a. Please give an example of a course digital activity that you have found really useful:
The questions below are about the VLE (Virtual Learning Environment) 15. How much do you agree with the following statements?
15.1.a. It is well designed 15.2.a. I rely on it to do my coursework 15.3.a. I regularly access it on a mobile device 15.4.a. I enjoy using the collaborative features 15.5.a. I would like it to be used more by my tutors
16. How much do you agree with the following statements? 16.1.a. Online assessments are delivered and managed well 16.2.a. Teaching rooms are well designed for the technologies we use 16.3.a. The software used on my course is industry standard and up-to-date 16.4.a. I am told how my personal data is stored and used
17. ... and how much do you agree that ... 17.1.a. Before I started my course I was told what digital skills I would need 17.2.a. I have regular opportunities to review and update my digital skills 17.3.a. Digital skills are important in my chosen career 17.4.a. My course prepares me for the digital workplace 17.5.a. Learners are given the chance to be involved in decisions about digital services
18. Overall, how would you rate the quality of digital teaching and learning on your course?

Version [2018-07-03/23] 23 | PAGE
19. When digital technologies are used on my course ... 19.1.a. I understand things better 19.2.a. I enjoy learning more 19.3.a. I am more independent in my learning 19.4.a. I feel more connected with my lecturers 19.5.a. I feel more connected with other learners 19.6.a. I can fit learning into my life more easily
20. Which best describes your preferences as a learner? 21. When digital technologies are used on my course ...
21.1.a. I am more easily distracted 21.2.a. I find it harder to manage all the information 21.3.a. I feel more isolated 21.4.a. I find it harder to motivate myself 21.5.a. I am less likely to attend class
22. How much would you like digital technologies to be used on your course? 23. Which digital channels do you prefer the University to use when providing you with information on the following…? (tick as many channels as you like for each type of information)
23.1.a. Your course (e.g. structure / requirements etc) 23.2.a. Programme admin (e.g. timetables / results) 23.3.a. University facilities (e.g. IT / transport / accommodation) 23.4.a. Responses to student feedback (e.g. surveys) 23.5.a. Support services (e.g. wellbeing / finance / careers) 23.6.a. Wider opportunities (e.g. events / socials / volunteering)