student enrollment page - office of superintendent of … abfr screen shots...student enrollment...
TRANSCRIPT
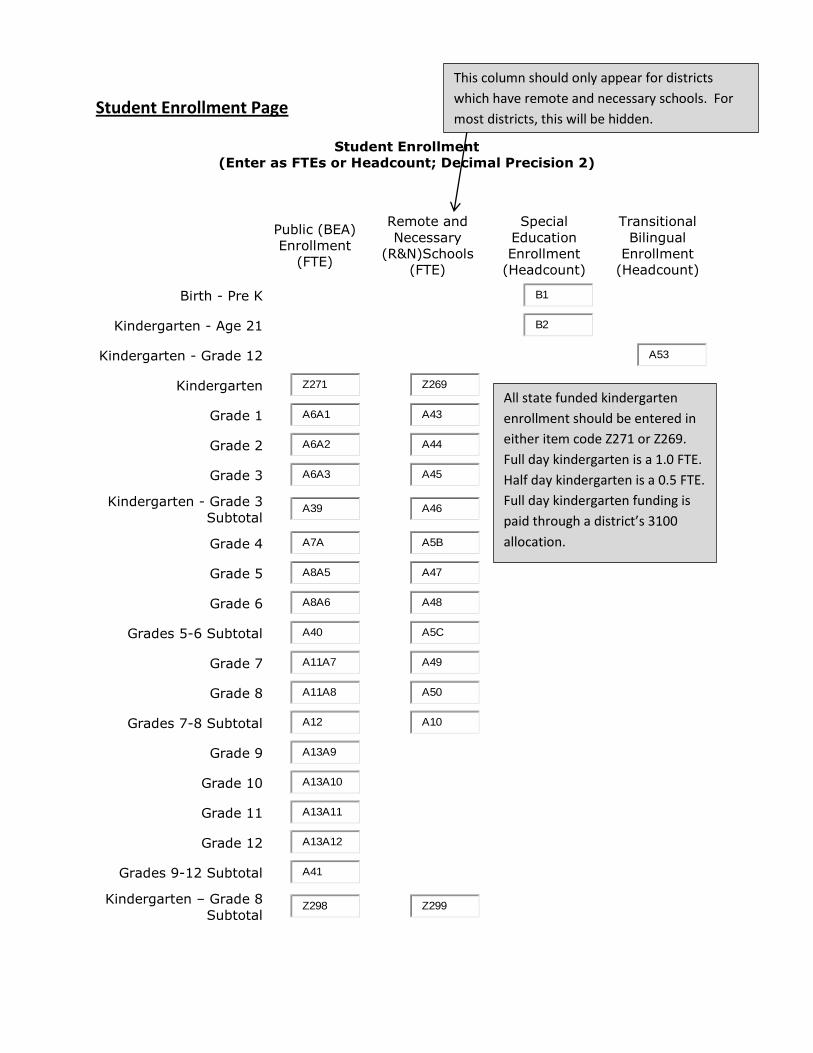
Student Enrollment Page
Student Enrollment
(Enter as FTEs or Headcount; Decimal Precision 2)
Public (BEA)
Enrollment
(FTE)
Remote and
Necessary
(R&N)Schools
(FTE)
Special
Education
Enrollment
(Headcount)
Transitional
Bilingual
Enrollment
(Headcount)
Birth - Pre K
B1
Kindergarten - Age 21
B2
Kindergarten - Grade 12
A53
Kindergarten Z271 Z269
Grade 1 A6A1 A43
Grade 2 A6A2 A44
Grade 3 A6A3 A45
Kindergarten - Grade 3
Subtotal A39
A46
Grade 4 A7A A5B
Grade 5 A8A5 A47
Grade 6 A8A6 A48
Grades 5-6 Subtotal A40 A5C
Grade 7 A11A7 A49
Grade 8 A11A8 A50
Grades 7-8 Subtotal A12 A10
Grade 9 A13A9
Grade 10 A13A10
Grade 11 A13A11
Grade 12 A13A12
Grades 9-12 Subtotal A41
Kindergarten – Grade 8
Subtotal Z298
Z299
All state funded kindergarten
enrollment should be entered in
either item code Z271 or Z269.
Full day kindergarten is a 1.0 FTE.
Half day kindergarten is a 0.5 FTE.
Full day kindergarten funding is
paid through a district’s 3100
allocation.
This column should only appear for districts
which have remote and necessary schools. For
most districts, this will be hidden.
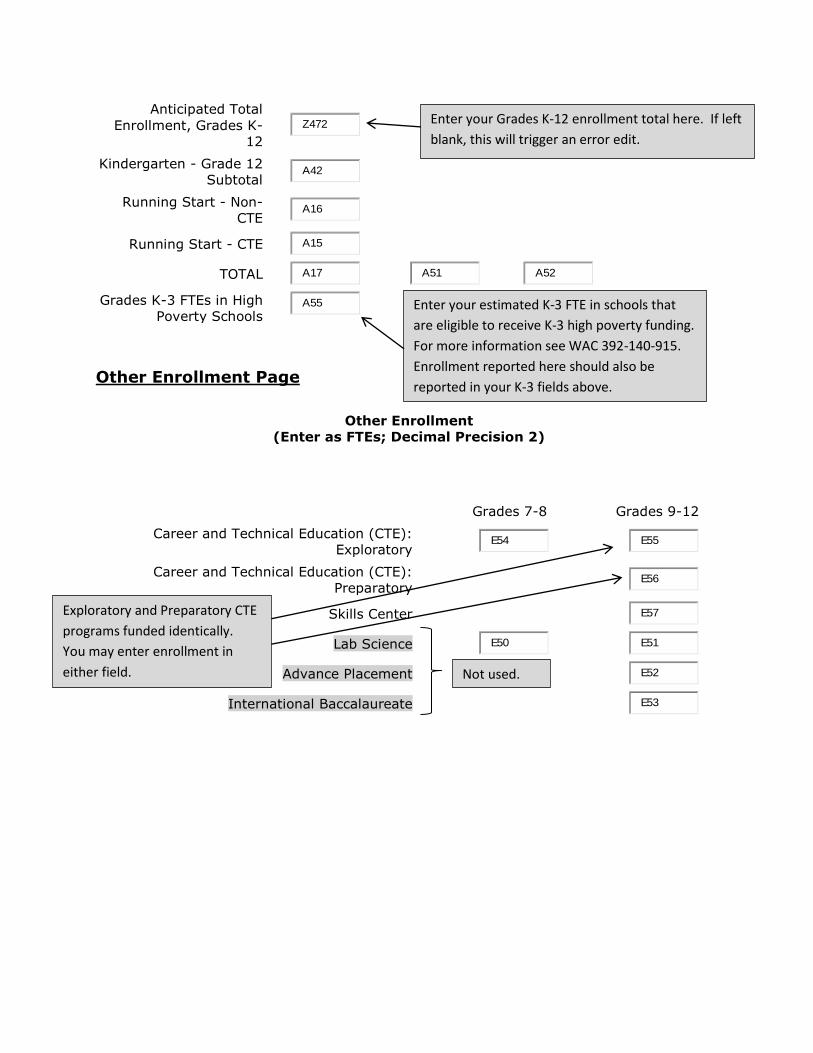
Anticipated Total
Enrollment, Grades K-
12
Z472
Kindergarten - Grade 12
Subtotal A42
Running Start - Non-
CTE A16
Running Start - CTE A15
TOTAL A17 A51
A52
Grades K-3 FTEs in High
Poverty Schools A55
Other Enrollment Page
Other Enrollment
(Enter as FTEs; Decimal Precision 2)
Grades 7-8 Grades 9-12
Career and Technical Education (CTE):
Exploratory E54
E55
Career and Technical Education (CTE):
Preparatory E56
Skills Center
E57
Lab Science E50
E51
Advance Placement
E52
International Baccalaureate
E53
Enter your estimated K-3 FTE in schools that
are eligible to receive K-3 high poverty funding.
For more information see WAC 392-140-915.
Enrollment reported here should also be
reported in your K-3 fields above.
Exploratory and Preparatory CTE
programs funded identically.
You may enter enrollment in
either field. Not used.
Enter your Grades K-12 enrollment total here. If left
blank, this will trigger an error edit.
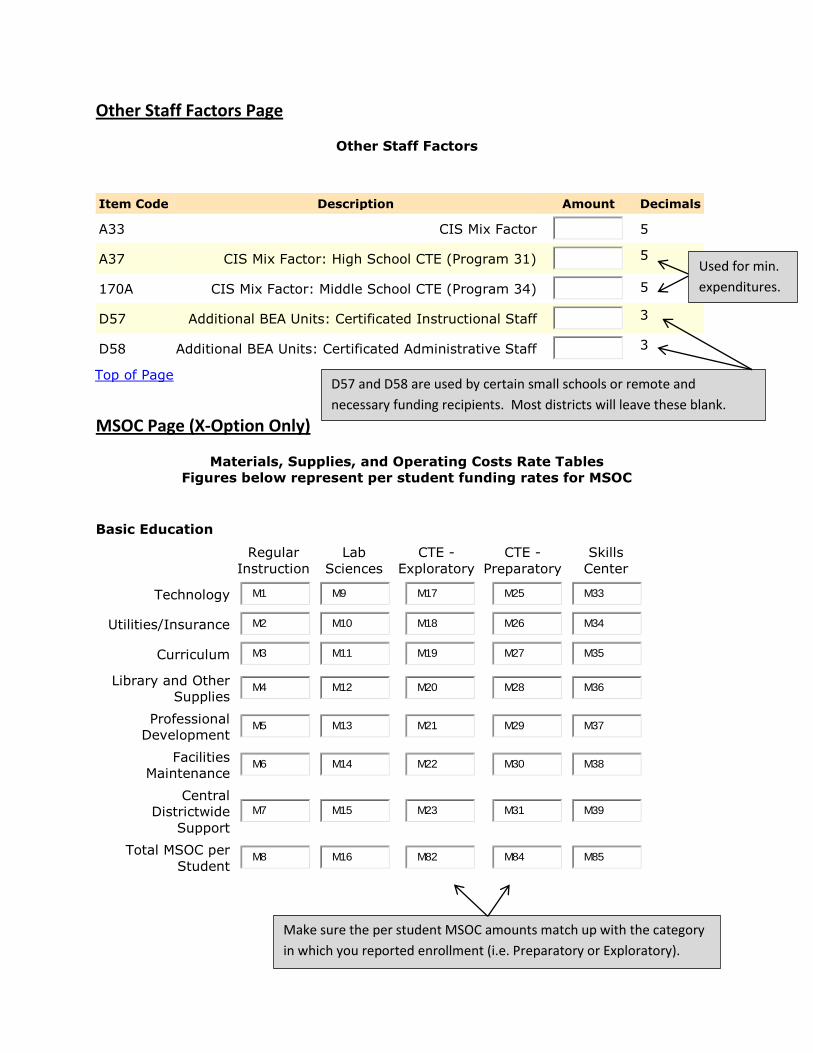
Other Staff Factors Page
Other Staff Factors
Item Code Description Amount Decimals
A33 CIS Mix Factor
5
A37 CIS Mix Factor: High School CTE (Program 31)
5
170A CIS Mix Factor: Middle School CTE (Program 34)
5
D57 Additional BEA Units: Certificated Instructional Staff
3
D58 Additional BEA Units: Certificated Administrative Staff
3
Top of Page
MSOC Page (X-Option Only)
Materials, Supplies, and Operating Costs Rate Tables
Figures below represent per student funding rates for MSOC
Basic Education
Regular
Instruction
Lab
Sciences
CTE -
Exploratory
CTE -
Preparatory
Skills
Center
Technology M1
M9
M17
M25
M33
Utilities/Insurance M2
M10
M18
M26
M34
Curriculum M3
M11
M19
M27
M35
Library and Other
Supplies M4
M12
M20
M28
M36
Professional
Development M5
M13
M21
M29
M37
Facilities
Maintenance M6
M14
M22
M30
M38
Central
Districtwide
Support
M7
M15
M23
M31
M39
Total MSOC per
Student M8
M16
M82
M84
M85
Used for min.
expenditures.
D57 and D58 are used by certain small schools or remote and
necessary funding recipients. Most districts will leave these blank.
Make sure the per student MSOC amounts match up with the category
in which you reported enrollment (i.e. Preparatory or Exploratory).
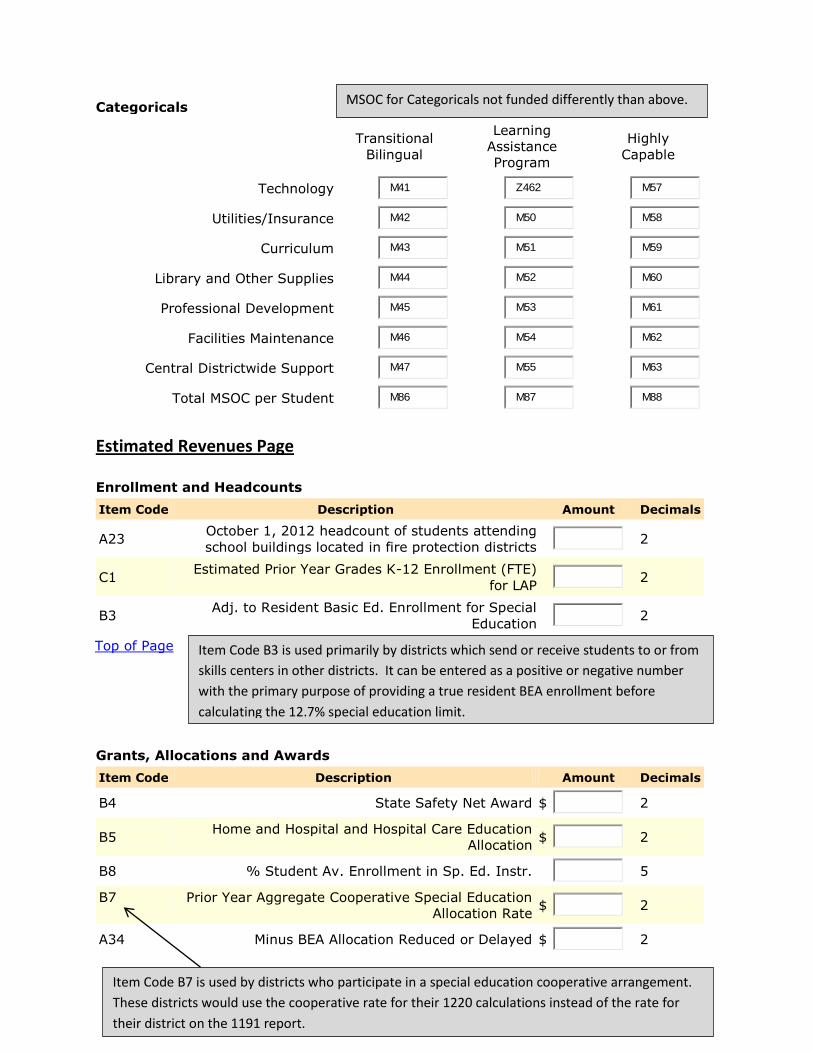
Categoricals
Transitional
Bilingual
Learning
Assistance
Program
Highly
Capable
Technology M41 Z462
M57
Utilities/Insurance M42 M50
M58
Curriculum M43 M51
M59
Library and Other Supplies M44 M52
M60
Professional Development M45 M53
M61
Facilities Maintenance M46 M54
M62
Central Districtwide Support M47 M55
M63
Total MSOC per Student M86 M87
M88
Estimated Revenues Page
Enrollment and Headcounts
Item Code Description Amount Decimals
A23 October 1, 2012 headcount of students attending
school buildings located in fire protection districts 2
C1 Estimated Prior Year Grades K-12 Enrollment (FTE)
for LAP 2
B3 Adj. to Resident Basic Ed. Enrollment for Special
Education 2
Top of Page
Grants, Allocations and Awards
Item Code Description Amount Decimals
B4 State Safety Net Award $
2
B5 Home and Hospital and Hospital Care Education
Allocation $
2
B8 % Student Av. Enrollment in Sp. Ed. Instr.
5
B7 Prior Year Aggregate Cooperative Special Education
Allocation Rate $
2
A34 Minus BEA Allocation Reduced or Delayed $
2
MSOC for Categoricals not funded differently than above.
Item Code B3 is used primarily by districts which send or receive students to or from
skills centers in other districts. It can be entered as a positive or negative number
with the primary purpose of providing a true resident BEA enrollment before
calculating the 12.7% special education limit.
Item Code B7 is used by districts who participate in a special education cooperative arrangement.
These districts would use the cooperative rate for their 1220 calculations instead of the rate for
their district on the 1191 report.
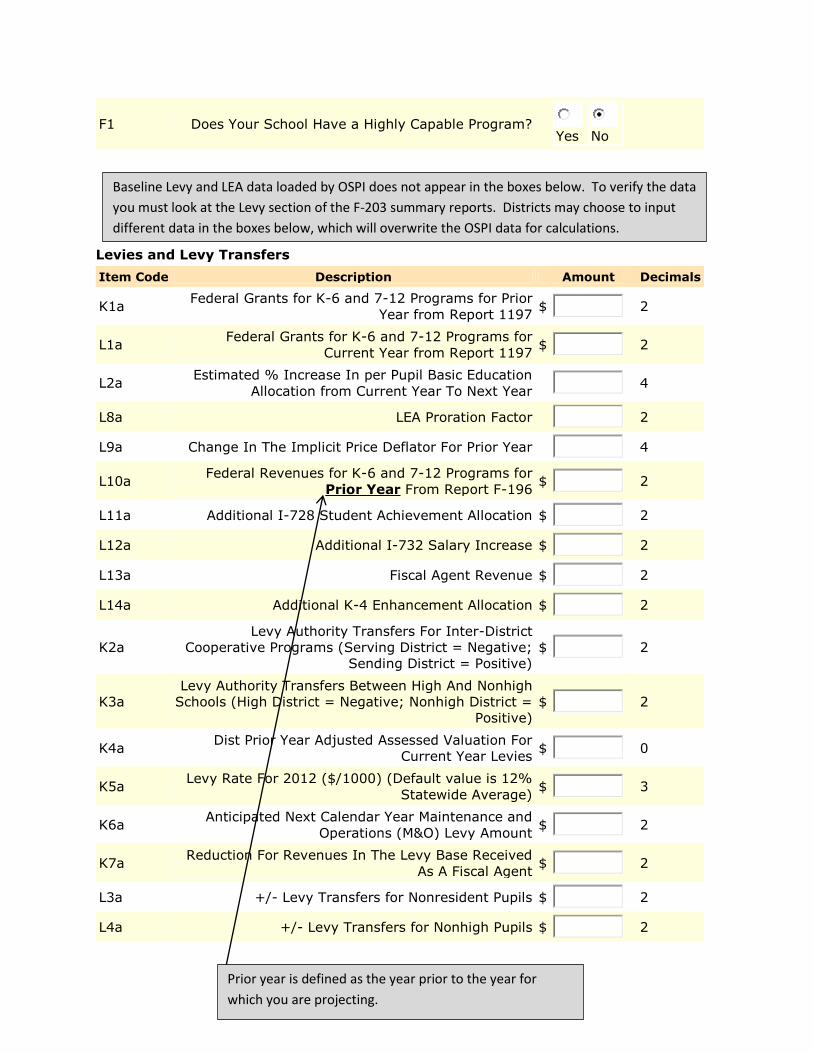
F1 Does Your School Have a Highly Capable Program? Yes No
Levies and Levy Transfers
Item Code Description Amount Decimals
K1a Federal Grants for K-6 and 7-12 Programs for Prior
Year from Report 1197 $
2
L1a Federal Grants for K-6 and 7-12 Programs for
Current Year from Report 1197 $
2
L2a Estimated % Increase In per Pupil Basic Education
Allocation from Current Year To Next Year 4
L8a LEA Proration Factor
2
L9a Change In The Implicit Price Deflator For Prior Year
4
L10a Federal Revenues for K-6 and 7-12 Programs for
Prior Year From Report F-196 $
2
L11a Additional I-728 Student Achievement Allocation $
2
L12a Additional I-732 Salary Increase $
2
L13a Fiscal Agent Revenue $
2
L14a Additional K-4 Enhancement Allocation $
2
K2a
Levy Authority Transfers For Inter-District
Cooperative Programs (Serving District = Negative;
Sending District = Positive)
$
2
K3a
Levy Authority Transfers Between High And Nonhigh
Schools (High District = Negative; Nonhigh District =
Positive)
$
2
K4a Dist Prior Year Adjusted Assessed Valuation For
Current Year Levies $
0
K5a Levy Rate For 2012 ($/1000) (Default value is 12%
Statewide Average) $
3
K6a Anticipated Next Calendar Year Maintenance and
Operations (M&O) Levy Amount $
2
K7a Reduction For Revenues In The Levy Base Received
As A Fiscal Agent $
2
L3a +/- Levy Transfers for Nonresident Pupils $
2
L4a +/- Levy Transfers for Nonhigh Pupils $
2
Baseline Levy and LEA data loaded by OSPI does not appear in the boxes below. To verify the data
you must look at the Levy section of the F-203 summary reports. Districts may choose to input
different data in the boxes below, which will overwrite the OSPI data for calculations.
Prior year is defined as the year prior to the year for
which you are projecting.
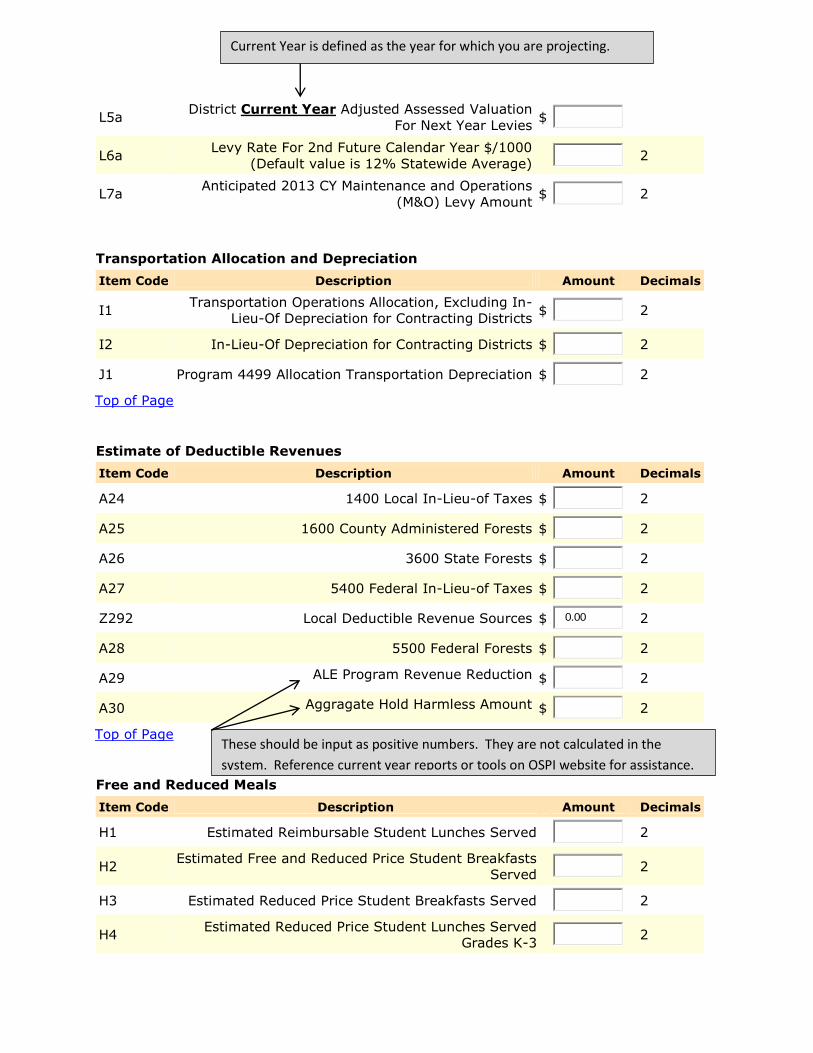
L5a District Current Year Adjusted Assessed Valuation
For Next Year Levies $
L6a Levy Rate For 2nd Future Calendar Year $/1000
(Default value is 12% Statewide Average) 2
L7a Anticipated 2013 CY Maintenance and Operations
(M&O) Levy Amount $
2
Transportation Allocation and Depreciation
Item Code Description Amount Decimals
I1 Transportation Operations Allocation, Excluding In-
Lieu-Of Depreciation for Contracting Districts $
2
I2 In-Lieu-Of Depreciation for Contracting Districts $
2
J1 Program 4499 Allocation Transportation Depreciation $
2
Top of Page
Estimate of Deductible Revenues
Item Code Description Amount Decimals
A24 1400 Local In-Lieu-of Taxes $
2
A25 1600 County Administered Forests $
2
A26 3600 State Forests $
2
A27 5400 Federal In-Lieu-of Taxes $
2
Z292 Local Deductible Revenue Sources $ 0.00
2
A28 5500 Federal Forests $
2
A29 ALE Program Revenue Reduction $
2
A30 Aggragate Hold Harmless Amount $
2
Top of Page
Free and Reduced Meals
Item Code Description Amount Decimals
H1 Estimated Reimbursable Student Lunches Served
2
H2 Estimated Free and Reduced Price Student Breakfasts
Served 2
H3 Estimated Reduced Price Student Breakfasts Served
2
H4 Estimated Reduced Price Student Lunches Served
Grades K-3 2
These should be input as positive numbers. They are not calculated in the
system. Reference current year reports or tools on OSPI website for assistance.
Current Year is defined as the year for which you are projecting.
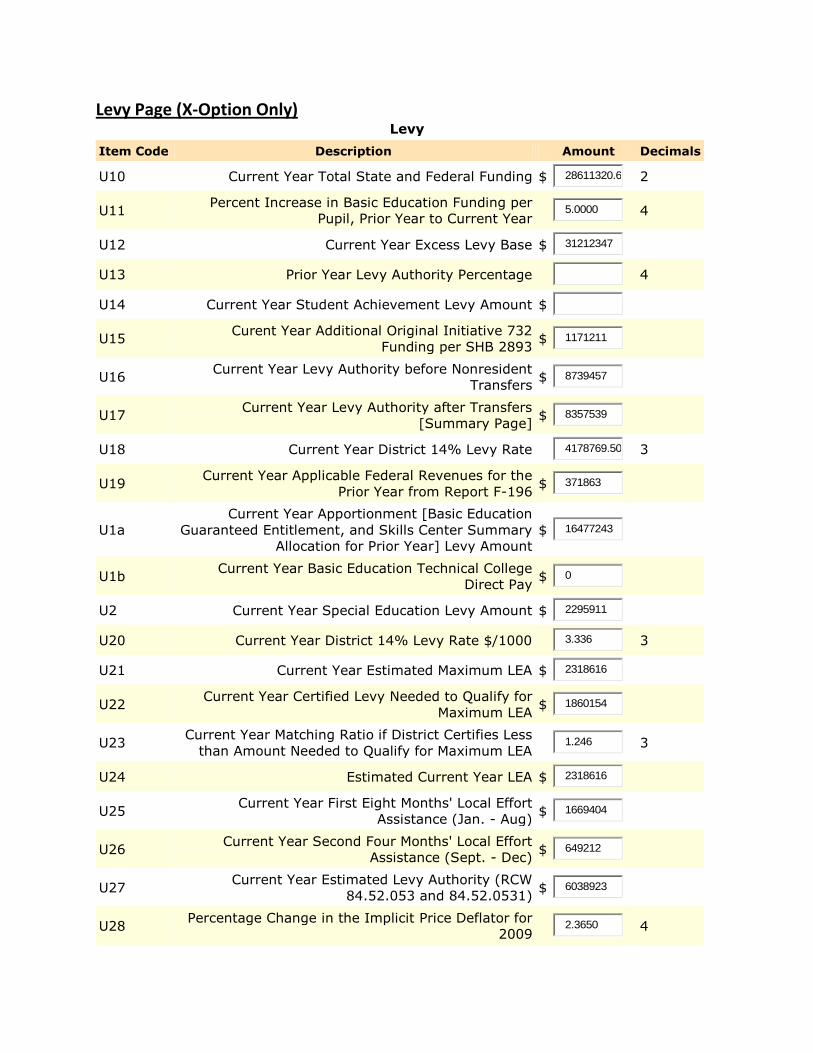
Levy Page (X-Option Only) Levy
Item Code Description Amount Decimals
U10 Current Year Total State and Federal Funding $ 28611320.6
2
U11 Percent Increase in Basic Education Funding per
Pupil, Prior Year to Current Year 5.0000
4
U12 Current Year Excess Levy Base $ 31212347
U13 Prior Year Levy Authority Percentage
4
U14 Current Year Student Achievement Levy Amount $
U15 Curent Year Additional Original Initiative 732
Funding per SHB 2893 $ 1171211
U16 Current Year Levy Authority before Nonresident
Transfers $ 8739457
U17 Current Year Levy Authority after Transfers
[Summary Page] $ 8357539
U18 Current Year District 14% Levy Rate
4178769.50
3
U19 Current Year Applicable Federal Revenues for the
Prior Year from Report F-196 $ 371863
U1a
Current Year Apportionment [Basic Education
Guaranteed Entitlement, and Skills Center Summary
Allocation for Prior Year] Levy Amount
$ 16477243
U1b Current Year Basic Education Technical College
Direct Pay $ 0
U2 Current Year Special Education Levy Amount $ 2295911
U20 Current Year District 14% Levy Rate $/1000
3.336
3
U21 Current Year Estimated Maximum LEA $ 2318616
U22 Current Year Certified Levy Needed to Qualify for
Maximum LEA $ 1860154
U23 Current Year Matching Ratio if District Certifies Less
than Amount Needed to Qualify for Maximum LEA 1.246
3
U24 Estimated Current Year LEA $ 2318616
U25 Current Year First Eight Months' Local Effort
Assistance (Jan. - Aug) $ 1669404
U26 Current Year Second Four Months' Local Effort
Assistance (Sept. - Dec) $ 649212
U27 Current Year Estimated Levy Authority (RCW
84.52.053 and 84.52.0531) $ 6038923
U28 Percentage Change in the Implicit Price Deflator for
2009 2.3650
4
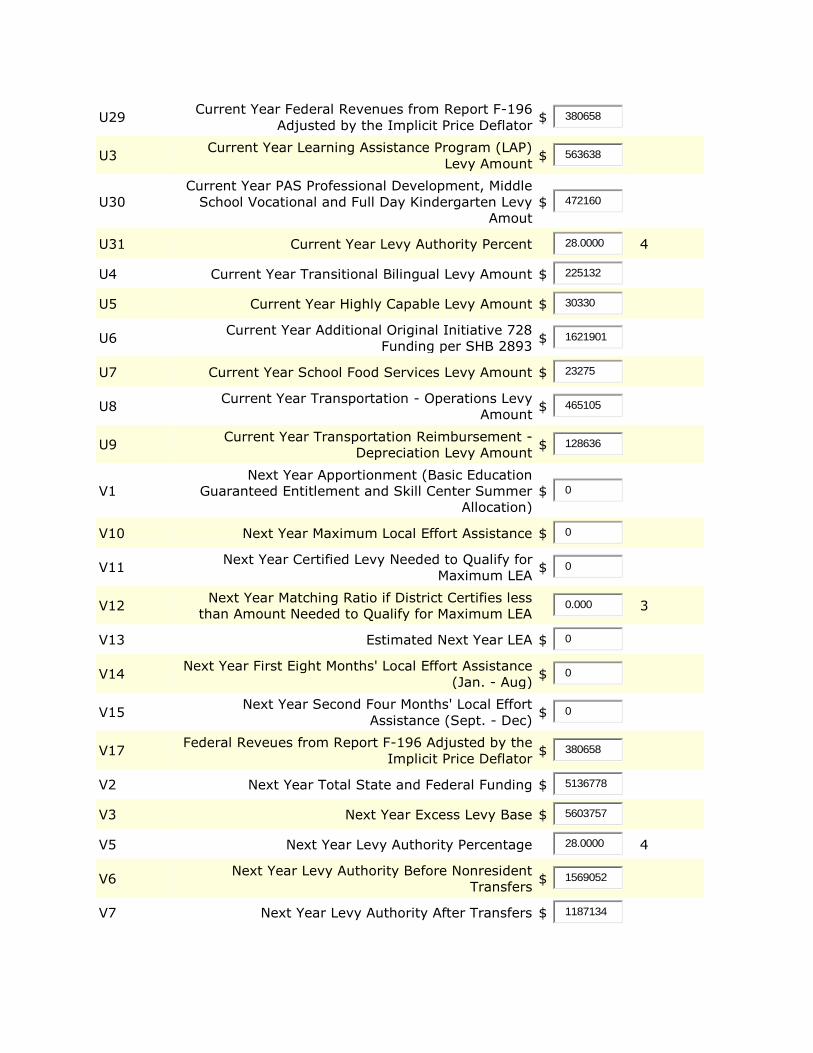
U29 Current Year Federal Revenues from Report F-196
Adjusted by the Implicit Price Deflator $ 380658
U3 Current Year Learning Assistance Program (LAP)
Levy Amount $ 563638
U30
Current Year PAS Professional Development, Middle
School Vocational and Full Day Kindergarten Levy
Amout
$ 472160
U31 Current Year Levy Authority Percent
28.0000
4
U4 Current Year Transitional Bilingual Levy Amount $ 225132
U5 Current Year Highly Capable Levy Amount $ 30330
U6 Current Year Additional Original Initiative 728
Funding per SHB 2893 $ 1621901
U7 Current Year School Food Services Levy Amount $ 23275
U8 Current Year Transportation - Operations Levy
Amount $ 465105
U9 Current Year Transportation Reimbursement -
Depreciation Levy Amount $ 128636
V1
Next Year Apportionment (Basic Education
Guaranteed Entitlement and Skill Center Summer
Allocation)
$ 0
V10 Next Year Maximum Local Effort Assistance $ 0
V11 Next Year Certified Levy Needed to Qualify for
Maximum LEA $ 0
V12 Next Year Matching Ratio if District Certifies less
than Amount Needed to Qualify for Maximum LEA 0.000
3
V13 Estimated Next Year LEA $ 0
V14 Next Year First Eight Months' Local Effort Assistance
(Jan. - Aug) $ 0
V15 Next Year Second Four Months' Local Effort
Assistance (Sept. - Dec) $ 0
V17 Federal Reveues from Report F-196 Adjusted by the
Implicit Price Deflator $ 380658
V2 Next Year Total State and Federal Funding $ 5136778
V3 Next Year Excess Levy Base $ 5603757
V5 Next Year Levy Authority Percentage
28.0000
4
V6 Next Year Levy Authority Before Nonresident
Transfers $ 1569052
V7 Next Year Levy Authority After Transfers $ 1187134
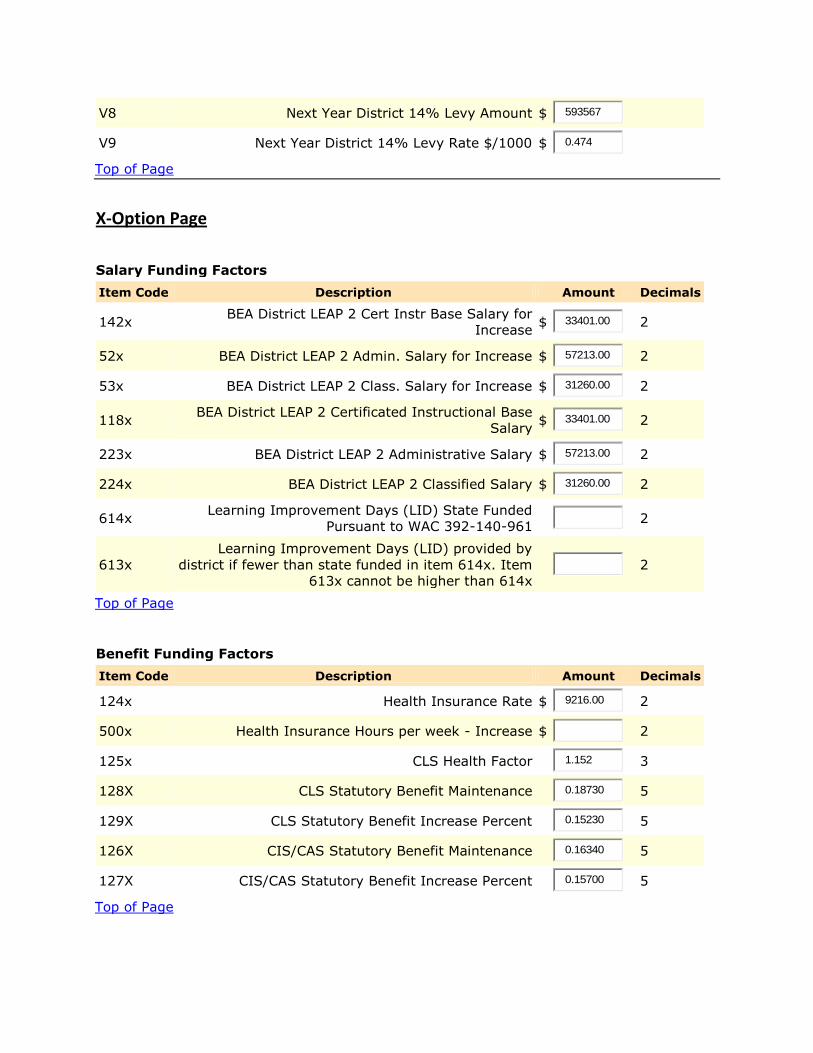
V8 Next Year District 14% Levy Amount $ 593567
V9 Next Year District 14% Levy Rate $/1000 $ 0.474
Top of Page
X-Option Page
Salary Funding Factors
Item Code Description Amount Decimals
142x BEA District LEAP 2 Cert Instr Base Salary for
Increase $ 33401.00
2
52x BEA District LEAP 2 Admin. Salary for Increase $ 57213.00
2
53x BEA District LEAP 2 Class. Salary for Increase $ 31260.00
2
118x BEA District LEAP 2 Certificated Instructional Base
Salary $ 33401.00
2
223x BEA District LEAP 2 Administrative Salary $ 57213.00
2
224x BEA District LEAP 2 Classified Salary $ 31260.00
2
614x Learning Improvement Days (LID) State Funded
Pursuant to WAC 392-140-961 2
613x
Learning Improvement Days (LID) provided by
district if fewer than state funded in item 614x. Item
613x cannot be higher than 614x
2
Top of Page
Benefit Funding Factors
Item Code Description Amount Decimals
124x Health Insurance Rate $ 9216.00
2
500x Health Insurance Hours per week - Increase $
2
125x CLS Health Factor
1.152
3
128X CLS Statutory Benefit Maintenance
0.18730
5
129X CLS Statutory Benefit Increase Percent
0.15230
5
126X CIS/CAS Statutory Benefit Maintenance
0.16340
5
127X CIS/CAS Statutory Benefit Increase Percent
0.15700
5
Top of Page
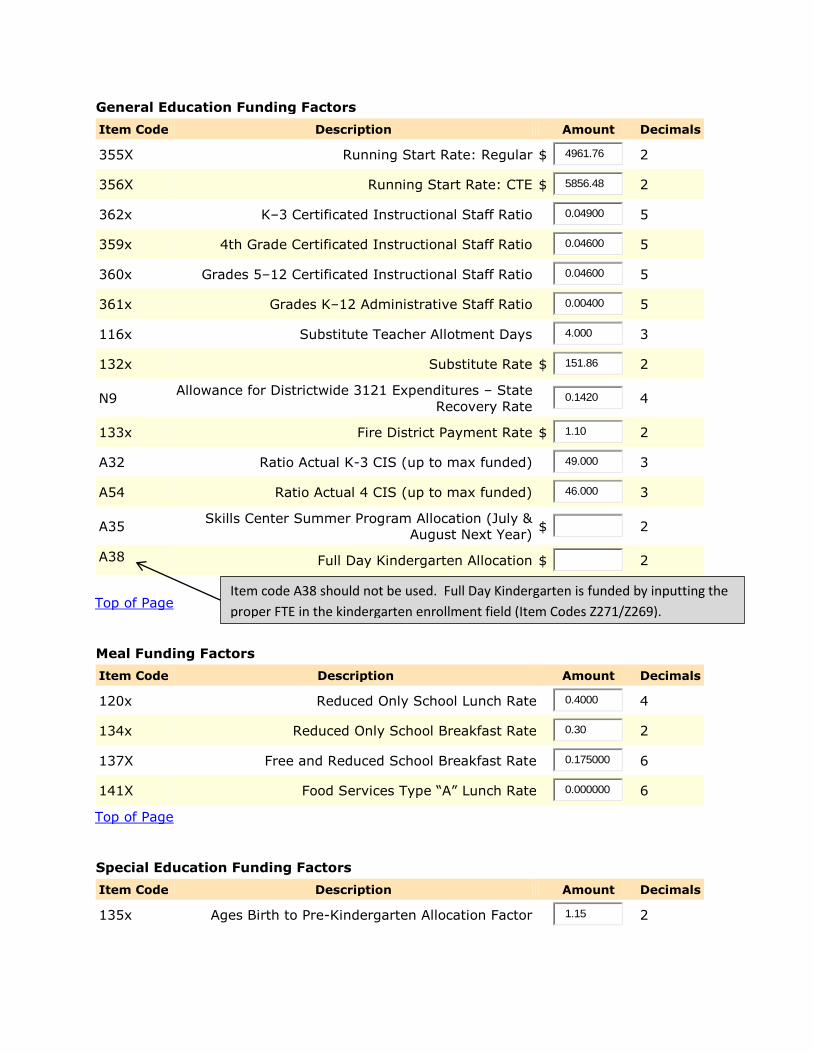
General Education Funding Factors
Item Code Description Amount Decimals
355X Running Start Rate: Regular $ 4961.76
2
356X Running Start Rate: CTE $ 5856.48
2
362x K–3 Certificated Instructional Staff Ratio
0.04900
5
359x 4th Grade Certificated Instructional Staff Ratio
0.04600
5
360x Grades 5–12 Certificated Instructional Staff Ratio
0.04600
5
361x Grades K–12 Administrative Staff Ratio
0.00400
5
116x Substitute Teacher Allotment Days
4.000
3
132x Substitute Rate $ 151.86
2
N9 Allowance for Districtwide 3121 Expenditures – State
Recovery Rate 0.1420
4
133x Fire District Payment Rate $ 1.10
2
A32 Ratio Actual K-3 CIS (up to max funded)
49.000
3
A54 Ratio Actual 4 CIS (up to max funded)
46.000
3
A35 Skills Center Summer Program Allocation (July &
August Next Year) $
2
A38 Full Day Kindergarten Allocation $
2
Top of Page
Meal Funding Factors
Item Code Description Amount Decimals
120x Reduced Only School Lunch Rate
0.4000
4
134x Reduced Only School Breakfast Rate
0.30
2
137X Free and Reduced School Breakfast Rate
0.175000
6
141X Food Services Type “A” Lunch Rate
0.000000
6
Top of Page
Special Education Funding Factors
Item Code Description Amount Decimals
135x Ages Birth to Pre-Kindergarten Allocation Factor
1.15
2
Item code A38 should not be used. Full Day Kindergarten is funded by inputting the
proper FTE in the kindergarten enrollment field (Item Codes Z271/Z269).
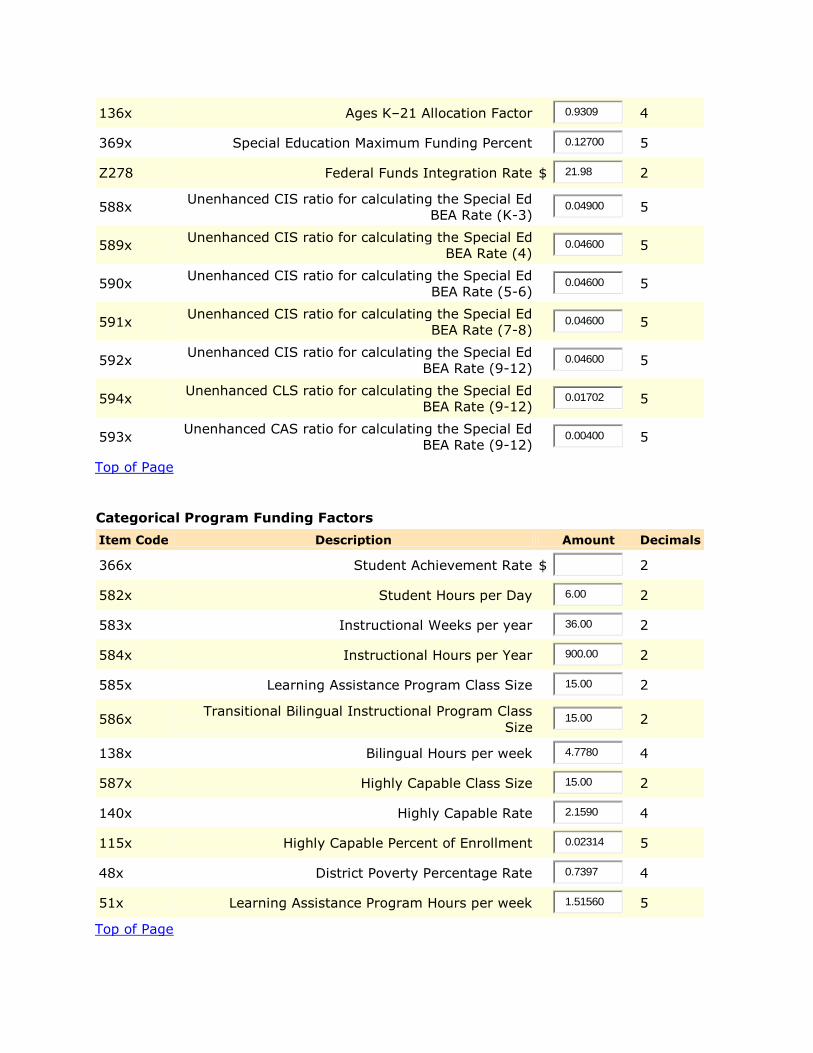
136x Ages K–21 Allocation Factor
0.9309
4
369x Special Education Maximum Funding Percent
0.12700
5
Z278 Federal Funds Integration Rate $ 21.98
2
588x Unenhanced CIS ratio for calculating the Special Ed
BEA Rate (K-3) 0.04900
5
589x Unenhanced CIS ratio for calculating the Special Ed
BEA Rate (4) 0.04600
5
590x Unenhanced CIS ratio for calculating the Special Ed
BEA Rate (5-6) 0.04600
5
591x Unenhanced CIS ratio for calculating the Special Ed
BEA Rate (7-8) 0.04600
5
592x Unenhanced CIS ratio for calculating the Special Ed
BEA Rate (9-12) 0.04600
5
594x Unenhanced CLS ratio for calculating the Special Ed
BEA Rate (9-12) 0.01702
5
593x Unenhanced CAS ratio for calculating the Special Ed
BEA Rate (9-12) 0.00400
5
Top of Page
Categorical Program Funding Factors
Item Code Description Amount Decimals
366x Student Achievement Rate $
2
582x Student Hours per Day
6.00
2
583x Instructional Weeks per year
36.00
2
584x Instructional Hours per Year
900.00
2
585x Learning Assistance Program Class Size
15.00
2
586x Transitional Bilingual Instructional Program Class
Size 15.00
2
138x Bilingual Hours per week
4.7780
4
587x Highly Capable Class Size
15.00
2
140x Highly Capable Rate
2.1590
4
115x Highly Capable Percent of Enrollment
0.02314
5
48x District Poverty Percentage Rate
0.7397
4
51x Learning Assistance Program Hours per week
1.51560
5
Top of Page
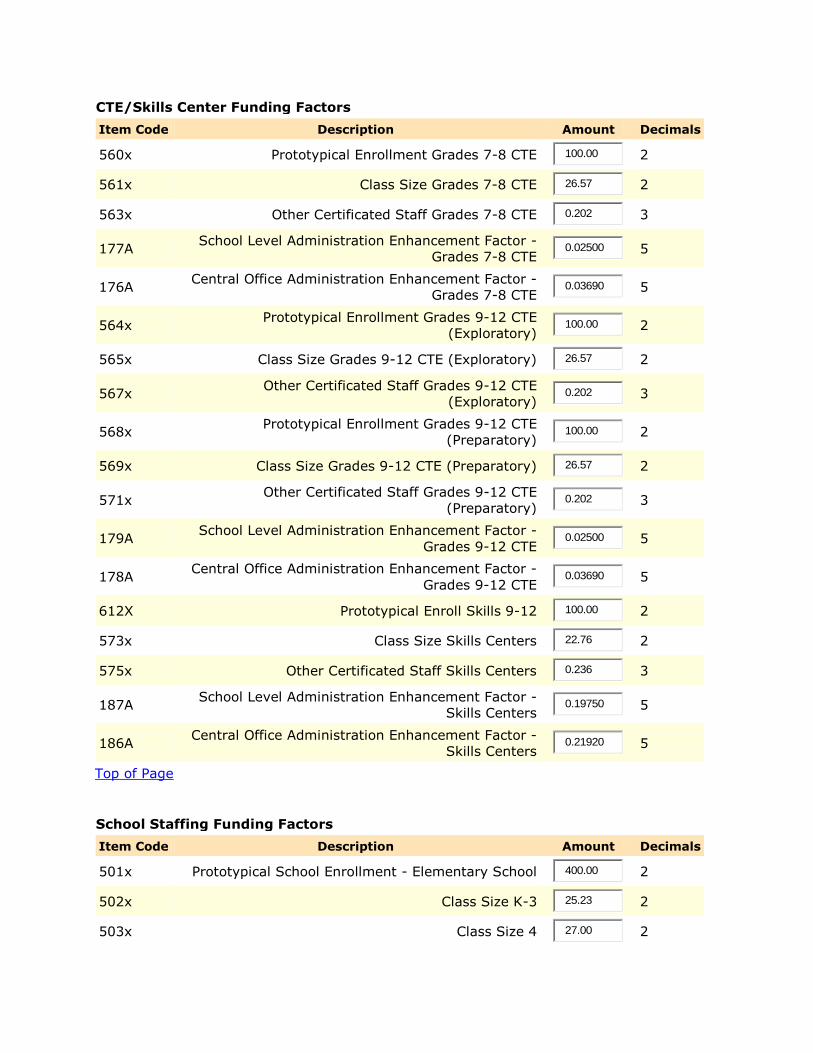
CTE/Skills Center Funding Factors
Item Code Description Amount Decimals
560x Prototypical Enrollment Grades 7-8 CTE
100.00
2
561x Class Size Grades 7-8 CTE
26.57
2
563x Other Certificated Staff Grades 7-8 CTE
0.202
3
177A School Level Administration Enhancement Factor -
Grades 7-8 CTE 0.02500
5
176A Central Office Administration Enhancement Factor -
Grades 7-8 CTE 0.03690
5
564x Prototypical Enrollment Grades 9-12 CTE
(Exploratory) 100.00
2
565x Class Size Grades 9-12 CTE (Exploratory)
26.57
2
567x Other Certificated Staff Grades 9-12 CTE
(Exploratory) 0.202
3
568x Prototypical Enrollment Grades 9-12 CTE
(Preparatory) 100.00
2
569x Class Size Grades 9-12 CTE (Preparatory)
26.57
2
571x Other Certificated Staff Grades 9-12 CTE
(Preparatory) 0.202
3
179A School Level Administration Enhancement Factor -
Grades 9-12 CTE 0.02500
5
178A Central Office Administration Enhancement Factor -
Grades 9-12 CTE 0.03690
5
612X Prototypical Enroll Skills 9-12
100.00
2
573x Class Size Skills Centers
22.76
2
575x Other Certificated Staff Skills Centers
0.236
3
187A School Level Administration Enhancement Factor -
Skills Centers 0.19750
5
186A Central Office Administration Enhancement Factor -
Skills Centers 0.21920
5
Top of Page
School Staffing Funding Factors
Item Code Description Amount Decimals
501x Prototypical School Enrollment - Elementary School
400.00
2
502x Class Size K-3
25.23
2
503x Class Size 4
27.00
2
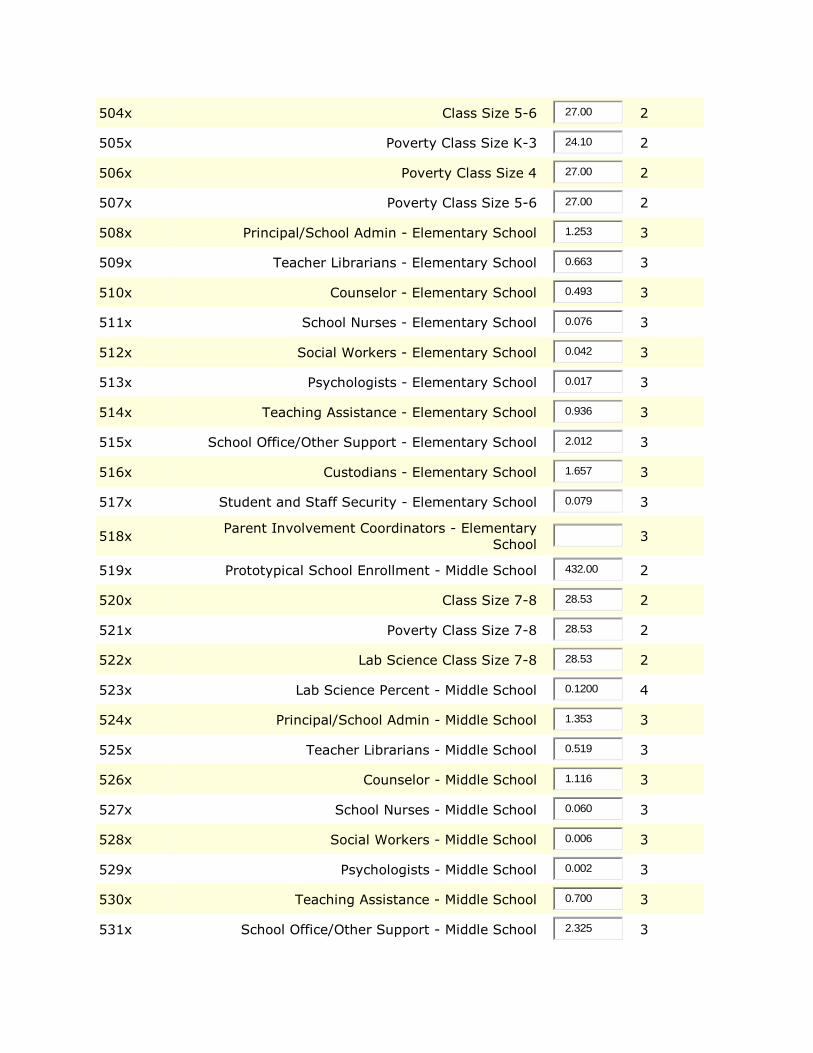
504x Class Size 5-6
27.00
2
505x Poverty Class Size K-3
24.10
2
506x Poverty Class Size 4
27.00
2
507x Poverty Class Size 5-6
27.00
2
508x Principal/School Admin - Elementary School
1.253
3
509x Teacher Librarians - Elementary School
0.663
3
510x Counselor - Elementary School
0.493
3
511x School Nurses - Elementary School
0.076
3
512x Social Workers - Elementary School
0.042
3
513x Psychologists - Elementary School
0.017
3
514x Teaching Assistance - Elementary School
0.936
3
515x School Office/Other Support - Elementary School
2.012
3
516x Custodians - Elementary School
1.657
3
517x Student and Staff Security - Elementary School
0.079
3
518x Parent Involvement Coordinators - Elementary
School 3
519x Prototypical School Enrollment - Middle School
432.00
2
520x Class Size 7-8
28.53
2
521x Poverty Class Size 7-8
28.53
2
522x Lab Science Class Size 7-8
28.53
2
523x Lab Science Percent - Middle School
0.1200
4
524x Principal/School Admin - Middle School
1.353
3
525x Teacher Librarians - Middle School
0.519
3
526x Counselor - Middle School
1.116
3
527x School Nurses - Middle School
0.060
3
528x Social Workers - Middle School
0.006
3
529x Psychologists - Middle School
0.002
3
530x Teaching Assistance - Middle School
0.700
3
531x School Office/Other Support - Middle School
2.325
3
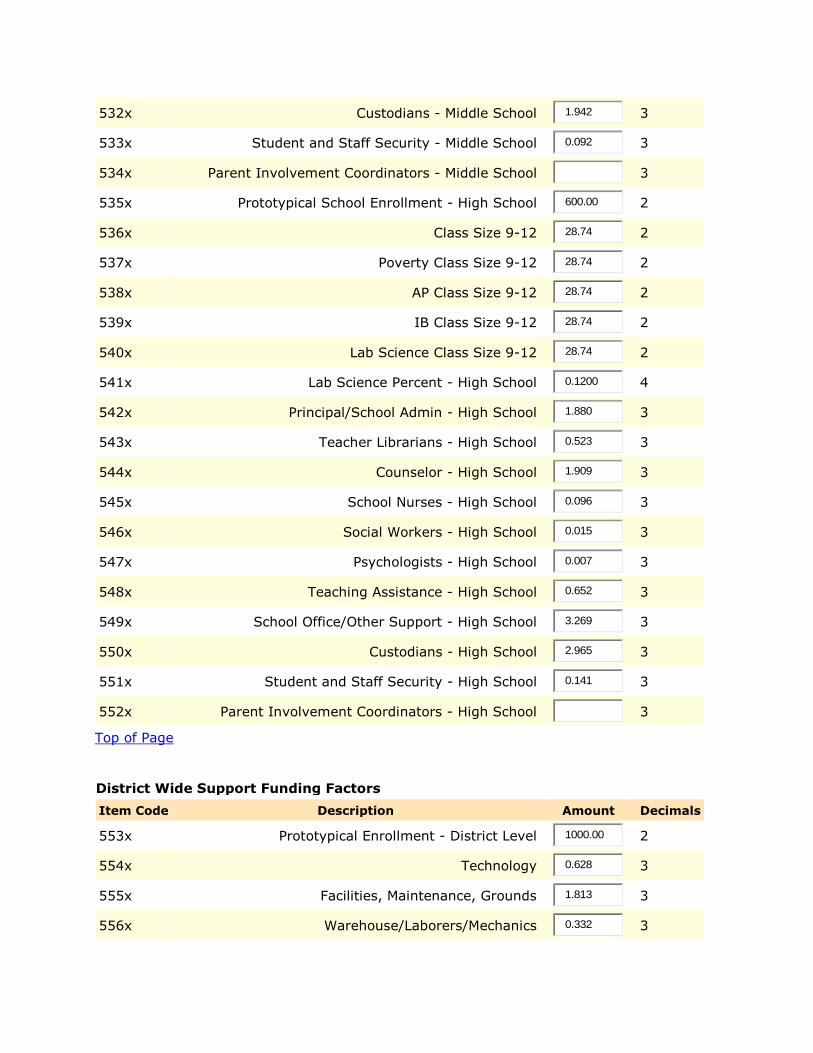
532x Custodians - Middle School
1.942
3
533x Student and Staff Security - Middle School
0.092
3
534x Parent Involvement Coordinators - Middle School
3
535x Prototypical School Enrollment - High School
600.00
2
536x Class Size 9-12
28.74
2
537x Poverty Class Size 9-12
28.74
2
538x AP Class Size 9-12
28.74
2
539x IB Class Size 9-12
28.74
2
540x Lab Science Class Size 9-12
28.74
2
541x Lab Science Percent - High School
0.1200
4
542x Principal/School Admin - High School
1.880
3
543x Teacher Librarians - High School
0.523
3
544x Counselor - High School
1.909
3
545x School Nurses - High School
0.096
3
546x Social Workers - High School
0.015
3
547x Psychologists - High School
0.007
3
548x Teaching Assistance - High School
0.652
3
549x School Office/Other Support - High School
3.269
3
550x Custodians - High School
2.965
3
551x Student and Staff Security - High School
0.141
3
552x Parent Involvement Coordinators - High School
3
Top of Page
District Wide Support Funding Factors
Item Code Description Amount Decimals
553x Prototypical Enrollment - District Level
1000.00
2
554x Technology
0.628
3
555x Facilities, Maintenance, Grounds
1.813
3
556x Warehouse/Laborers/Mechanics
0.332
3
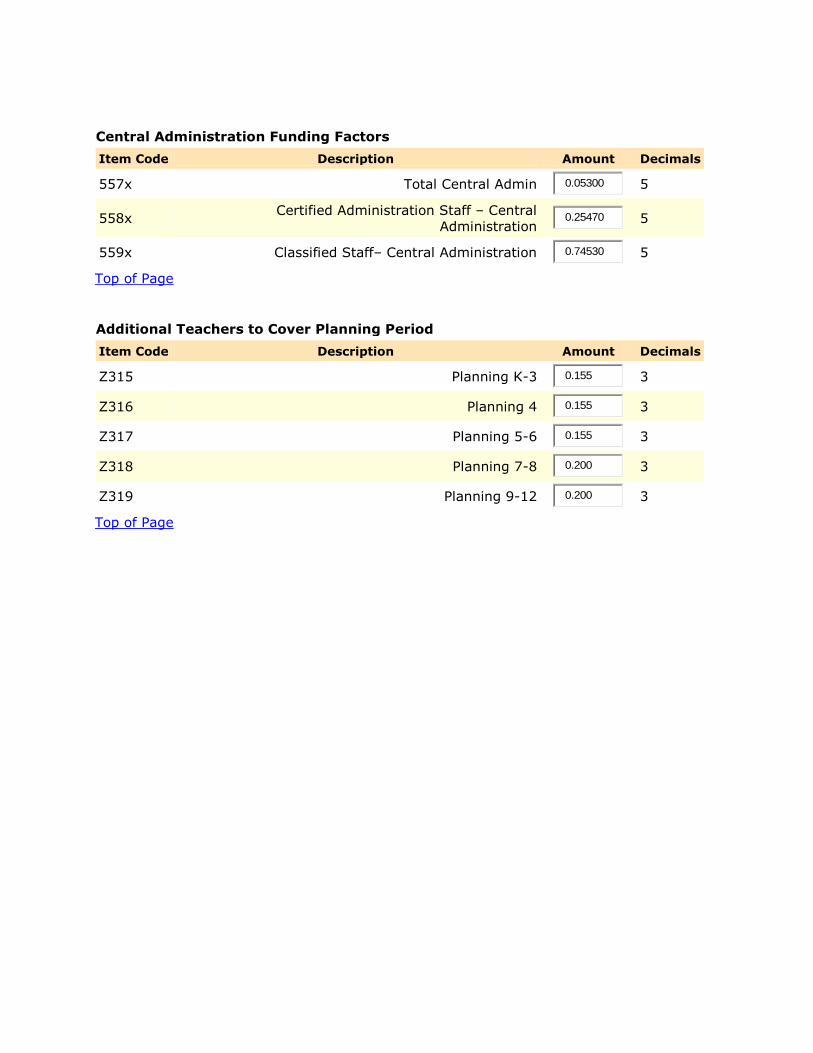
Central Administration Funding Factors
Item Code Description Amount Decimals
557x Total Central Admin
0.05300
5
558x Certified Administration Staff – Central
Administration 0.25470
5
559x Classified Staff– Central Administration
0.74530
5
Top of Page
Additional Teachers to Cover Planning Period
Item Code Description Amount Decimals
Z315 Planning K-3
0.155
3
Z316 Planning 4
0.155
3
Z317 Planning 5-6
0.155
3
Z318 Planning 7-8
0.200
3
Z319 Planning 9-12
0.200
3
Top of Page