student evaluations of teaching, course and student
TRANSCRIPT

Andrews University Andrews University
Digital Commons @ Andrews University Digital Commons @ Andrews University
Dissertations Graduate Research
2018
Student Evaluations of Teaching, Course and Student Student Evaluations of Teaching, Course and Student
Characteristics at Andrews University Characteristics at Andrews University
Fatimah Al Nasser Andrews University, [email protected]
Follow this and additional works at: https://digitalcommons.andrews.edu/dissertations
Part of the Higher Education and Teaching Commons
Recommended Citation Recommended Citation Al Nasser, Fatimah, "Student Evaluations of Teaching, Course and Student Characteristics at Andrews University" (2018). Dissertations. 1662. https://digitalcommons.andrews.edu/dissertations/1662
This Dissertation is brought to you for free and open access by the Graduate Research at Digital Commons @ Andrews University. It has been accepted for inclusion in Dissertations by an authorized administrator of Digital Commons @ Andrews University. For more information, please contact [email protected].
ABSTRACT
STUDENT EVALUATIONS OF TEACHING, COURSE
AND STUDENT CHARACTERISTICS
AT ANDREWS UNIVERSITY
by
Fatimah Al Nasser
Chair: Larry D. Burton

ABSTRACT OF GRADUATE STUDENT RESEARCH
Dissertation
Andrews University
School of Education
Title: STUDENT EVALUATIONS OF TEACHING, COURSE AND STUDENT
CHARACTERISTICS AT ANDREWS UNIVERSITY
Name of researcher: Fatimah Al Nasser
Name and degree of faculty chair: Larry D. Burton, Ph.D.
Date completed: July 2018
Problem
This research examined the type of rating of specific Student Evaluation of
Teaching (SET) dimensions and overall rating students tended to give for the courses that
they took, identified the dimensions that predicted the overall rating, and assessed the
association of gender, student academic status, course level, course type, academic school
and the effect on SET scores.
Method
The researcher used a quantitative research method to explore the type of score
that students give to the courses they took, examine the relationship between dimensions
of SET and overall rating, and the influence of gender, student status, course level, course

type, and academic school in SET score. The study included 3,745 responses to courses
at five schools at Andrews University. Andrews University’s Course Survey was used as
the main instrument. Descriptive analysis, regression linear analysis, and multivariate
analysis of variance were conducted to help answer the research questions.
Results
The research found that students tended to rate all courses highly. However, these
students tended to rate the dimensions of respect for diversity, preparation and
organization, and availability and helpfulness higher than other dimensions. Four
dimensions were found predicting SET overall rating. These dimensions were: stimulate
interest, effective communication, intellectual discovery and inquiry, and evaluation and
grading. Regarding the student and course characteristics that were examined, gender was
not found to influence the SET score. Student academic status and course level were
found to affect SET scores within specific dimensions, but the effect sizes were very
small. Both the course type and the academic school were found not significant enough to
be used in practice.
Conclusion
This study supported other research that reported some dimensions of SET
predicted overall rating. The research offered a model with four dimensions that
predicted overall rating. The results of this study supported the theory that both student
status and course level affect SET scores. However, this study found that the effect of
these two factors tended to be within specific dimensions of SET. Different from other
studies, this study found that gender had no influence on SET scores. Both course type

and academic school had a very small effect size, which is not large enough to be used in
practice
Andrews University
School of Education
STUDENT EVALUATIONS OF TEACHING, COURSE
AND STUDENT CHARACTERISTICS
AT ANDREWS UNIVERSITY
A Dissertation
Present in the Partial Fulfillment
of the Requirements for the Degree
Doctor of Philosophy
by
Fatimah Al Nasser
July 2018

© Copyright by Fatimah Al Nasser 2018
All Rights Reserved

STUDENT EVALUATIONS OF TEACHING, COURSE
AND STUDENT CHARACTERISTICS
AT ANDREWS UNIVERSITY
A dissertation
presented in partial fulfillment
of the requirements for the degree
Doctor of Philosophy
by
Fatimah Al Nasser
APPROVAL BY THE COMMITTEE:
____________________________________________ _______________________________________ Chair: Larry D. Burton Dean, School of Education
Robson Marinho
________________________________
Member: Jimmy Kijai
________________________________
Member: Lynn Merklin
________________________________ ______________________________
External: Alice C Williams Date approved
iii
TABLE OF CONTENTS
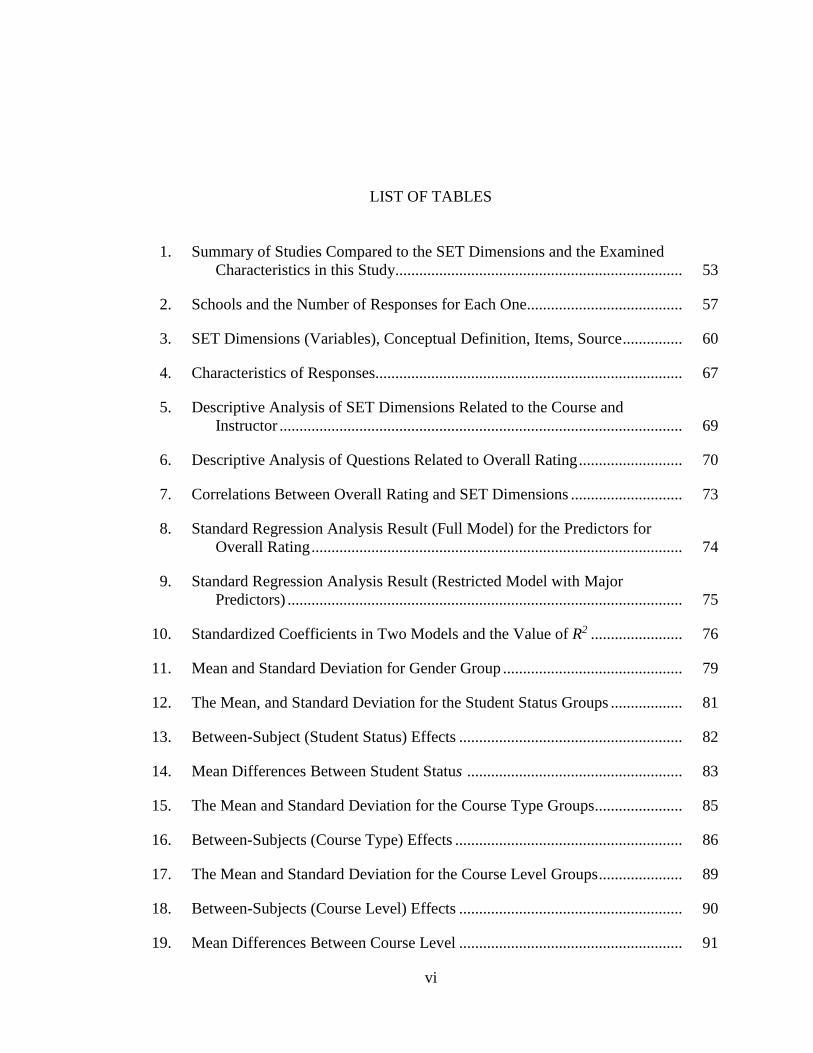
LIST OF TABLES ........................................................................................................ vi
LIST OF ABBREVIATIONS ....................................................................................... viii
ACKNOWLEDGEMENT ............................................................................................ ix
Chapter
1. INTRODUCTION ............................................................................................ 1
Background of the Problem ........................................................................... 1
Rationale ........................................................................................................ 4
Statement of the Problem ............................................................................... 4
Purpose of the Study ...................................................................................... 5
Conceptual Framework .................................................................................. 6
Student Evaluations of Teaching ............................................................. 6
SET Overall Rating and SET Dimensions ............................................... 7
Student and Course Characteristics Influencing SET Scores .................. 8 Gender ................................................................................................. 8
Student Status...................................................................................... 8 Course Type ........................................................................................ 9 Course Level ....................................................................................... 9
Academic School ................................................................................ 9 The Research Questions ................................................................................. 11
Significance of the
Study ........................................................................................................ Erro
r! Bookmark not defined.1 Delimitations .................................................................................................. 12
Definition of Terms........................................................................................ 1313
2. LITERATURE REVIEW ................................................................................. 14
Introduction .................................................................................................... 14
Student Evaluation of Teaching ..................................................................... 15
Introduction to SET.................................................................................. 15 Using SET ................................................................................................ 18
Challenges in SET.................................................................................... 20
Validity and Reliability of SET ............................................................... 21 SET and Bias Factors ............................................................................... 23 Dimensions of Effective Teaching........................................................... 24

iv
Dimensions of SET and SET Overall Rating .......................................... 26 Student and Course Characteristics Affecting SET ................................. 29
Summary of Literature Review ...................................................................... 48
Need for Further Study .................................................................................. 52
3. METHODOLOGY ........................................................................................... 55
The Research Questions ................................................................................. 55
Research Design............................................................................................. 55
Sample............................................................................................................ 56
Instrumentation .............................................................................................. 57
SET Dimensions ...................................................................................... 59 SET Overall Rating .................................................................................. 61 Student Gender......................................................................................... 61
Student Status........................................................................................... 61 Course Type ............................................................................................. 61 Course Level ............................................................................................ 62 Academic School ..................................................................................... 62
Data Collection .............................................................................................. 62
Data Analysis ................................................................................................. 63
4. RESULTS ......................................................................................................... 65
Introduction .................................................................................................... 65
Research Questions ........................................................................................ 65
Characteristics of Participants........................................................................ 66
Results by Research Questions ...................................................................... 68
Research Question 1 ................................................................................ 68 Research Question 2 ................................................................................ 71 Research Question 3 ................................................................................ 76
Gender and SET Score ....................................................................... 78
Student Status and SET Score............................................................ 78
Course Type and SET Score .............................................................. 84 Course Level and SET Score ............................................................. 87 Academic School and SET Score ...................................................... 88
Summary of Major Findings .......................................................................... 95
5. SUMMARY, DISCUSSIONS, CONCLUSIONS, AND
RECOMMENDATIONS .................................................................................. 99
Introduction .................................................................................................... 99 Review of Literature and Conceptual Framework ......................................... 99
Review of Literature ................................................................................ 99
Conceptual Framework ............................................................................ 108 Problem .......................................................................................................... 109
Purpose of the Study ...................................................................................... 110 Research Questions ........................................................................................ 110
v
Research Design............................................................................................. 110 Sample............................................................................................................ 111 Instrument ...................................................................................................... 111 Data Analysis ................................................................................................. 112
Summary of Findings ..................................................................................... 112 Demographic Information ........................................................................ 112
Findings for Research Question 1 ............................................................ 113
Findings for Research Question 2 ............................................................ 113
Findings for Research Question 3 ............................................................ 113
Discussion ...................................................................................................... 114 Conclusions .................................................................................................... 122
Limitations ..................................................................................................... 123
Recommendations .......................................................................................... 124
Summary ........................................................................................................ 125
Appendix
A. ANDREWS UNIVERSITY SET INSTRUMENT ........................................... 127
B. TABLE OF DEFINITON OF VARIABLES .................................................... 129
C. IRB FORM AND CERTIFICATION ............................................................... 132
REFERENCES ............................................................................................................. 137
VITA ............................................................................................................................. 148
vi
LIST OF TABLES
1. Summary of Studies Compared to the SET Dimensions and the Examined
Characteristics in this Study........................................................................ 53
2. Schools and the Number of Responses for Each One ....................................... 57
3. SET Dimensions (Variables), Conceptual Definition, Items, Source ............... 60
4. Characteristics of Responses............................................................................. 67
5. Descriptive Analysis of SET Dimensions Related to the Course and
Instructor ..................................................................................................... 69
6. Descriptive Analysis of Questions Related to Overall Rating .......................... 70
7. Correlations Between Overall Rating and SET Dimensions ............................ 73
8. Standard Regression Analysis Result (Full Model) for the Predictors for
Overall Rating ............................................................................................. 74
9. Standard Regression Analysis Result (Restricted Model with Major
Predictors) ................................................................................................... 75
10. Standardized Coefficients in Two Models and the Value of R2 ....................... 76
11. Mean and Standard Deviation for Gender Group ............................................. 79
12. The Mean, and Standard Deviation for the Student Status Groups .................. 81
13. Between-Subject (Student Status) Effects ........................................................ 82
14. Mean Differences Between Student Status ...................................................... 83
15. The Mean and Standard Deviation for the Course Type Groups ...................... 85
16. Between-Subjects (Course Type) Effects ......................................................... 86
17. The Mean and Standard Deviation for the Course Level Groups ..................... 89
18. Between-Subjects (Course Level) Effects ........................................................ 90
19. Mean Differences Between Course Level ........................................................ 91

vii
20. The Mean and Standard Deviation for the Academic School Groups .............. 93
21. Between-Subjects (Academic School) Effects ................................................. 94
22. Research Questions and Dimensions Found Related........................................ 98

viii
LIST OF ABBREVIATIONS
ANOVA Analysis of Variance
MANOVA Multivariate Analysis of Variance
SET Student Evaluation of Teaching
SPSS Statistical Package for the Social Sciences
VIF Variance Inflation Factor

ix
ACKNOWLEDGEMENT
In the name of God, the Most Gracious, the Most Merciful
I first thank Allah, my Creator and Master, the great teacher and messenger
prophet Mohammad, the Immaculate Imams, Imam Hussain, and Imam Mahdi.
I thank my parents, for always being there for me and inspiring me to reach a high
level of education. Thank you for your prayers that made a hard time much easier. I also
thank all of my family members who prayed for me to reach my goals. Thank you to my
sister and brother who always believed that I can reach all my dreams. Thank you to my
nephew, Hassan, who was always there to help and support during this journey.
I thank my committee chair, Dr. Larry Burton for your guidance, thoughtful
feedback, encouragements, and time during the process of completing this work. I would
like to acknowledge the support of my committee members Dr. Kijai and Dr. Merklin.
Thank you Dr. Kijai for reading the documents many times, helping to modify many
tables, and enlightening me with your knowledge. Thank you Dr. Merklin for providing
thoughtful suggestions for clarity and willing to help me all the time.
I would like to acknowledge the assistance of Laura Carroll and Amy Waller.
Thank you Mrs. Carroll for all your help with the data extraction process. Thank you
Mrs. Waller for all your help finding the documents that I needed during the process of
writing my dissertation. Thank you to all my friends and colleagues who encouraged me
and prayed for me to complete this work with easiness and joy.

1
CHAPTER 1
INTRODUCTION
Background of the Problem
The meaning of effective teaching is expanding faster than before. Effective
teaching includes using effective teaching methods, having knowledge, and making
students interested in learning (Evans, Baskerville, Wynn-Williams, & Gillett, 2014).
Student Evaluation of Teaching (SET) (McIntyre, Smith, & Hassett, 1984) is an
important tool that most higher education institutions use to help measure teaching
effectiveness (Hobler, 2014) and as a tool for faculty evaluation systems around the
world (Al-Issa & Sulieman, 2007). A review of the literature indicated that SET is an
assessment, which takes the form of a survey that is completed by the student at the end
of a course or a program. This survey asks the students to use their judgment to report
their experiences regarding the effectiveness of the instructor or the quality of the course
(Ali & Ajmi, 2013; Brown, 2008; Driscoll & Cadden, 2010; Hobson & Talbot, 2001;
Lindahl & Unger, 2010; Oliver & Pookie, 2005; Smith, 2007; Tsai & Lin, 2012).
The items that are included in the SET survey are related to overall rating and the
dimensions of effective teaching. Overall rating measured the student general opinion
regarding the course, instructor and learning experience. The dimensions of effective
teaching related to the principles of effective teaching that an institution adapts. Each
higher education institution has its own definition of effective teaching that emphasizes
2
specific dimensions that might not be emphasized by other institutions. Therefore, the
SET survey might differ from one institution to another. Research found that effective
teaching should encourage student-faculty contact, cooperation among students, active
learning, communicate high expectations, provide prompt feedback, emphasize time on
task, and respect diverse talents and ways of learning (Chickering & Gamson, 1989).
Other research reported that effective teaching included other aspects such as intellectual
growth (Bowman & Seifert, 2011), course content and critical thinking (Anderson, 2012),
course structure (Lumpkin & Multon, 2013), communication (Nargundkar & Shrikhande,
2012), respect for diversity, organization, and clarity (Lumpkin & Multon, 2013).
The result of this survey is used for different purposes. It is used by administrators
and instructors to make important decisions regarding development of the course and the
instruction (Al-Issa & Sulieman, 2007; Ali & Ajmi, 2013; Beuth et al., 2015; Driscoll &
Cadden, 2010). Also, it is used by students to make better decisions regarding which
course they want to take and to be aware of the course levels of difficulty before the
registration process (Adams & Umbach, 2012; Ali & Ajmi, 2013; Atek, Salim, Ab
Halim, Jusoh, & Yusuf, 2015; Beuth et al., 2015; Brockx, Spooren, & Mortelmans, 2011;
Chulkov & Jason Van, 2012; Donnon, Delver, & Beran, 2010; Driscoll & Cadden, 2010;
Fah, Yin & Osman, 2011). Furthermore, SET is considered an important tool that could
have negative impacts on the development of teaching if it does not give accurate results
(Ali & Ajmi, 2013). Additionally, institutional administrators use SET for accreditation
purposes and to make decisions for the faculty promotion process (Terry, Heitner, Miller,
& Hollis, 2017). Therefore, accurate results help develop better instruction and more
knowledgeable learners (Hobler, 2014).
3
Some researchers have suggested that the results of SET are not truly a reflection
of effective teaching. They proposed that different non-instructional factors could affect
the results of SET or produce biased results, and called for further studies (Coffman,
1954; Reynolds, 1979). Since then, different studies have been conducted to identify and
understand the factors that could affect the results of SET (Abrami, Perry, & Leventhal,
1982; Ali, & Ajmi, 2013; Al-Issa & Sulieman, 2007; Centra, 1977; Frey, Leonard, &
Beatty, 1975; Marsh, 1983; Narayanan, Sawaya, & Johnson, 2014; Santhanam & Hicks,
2002; Whitworth, Price, & Randall, 2002; Worthington, 2002). These studies uncovered
different factors, which were not related to the dimensions that the SET is trying to
measure, which influence the results of SET. These factors were related to the course,
instructor, and student characteristics (Abrami et al., 1982; Frey et al., 1975; Marsh,
1983). Other research examined the correlation between the dimensions of SET and
overall rating (Hoidn & Kärkkäinen, 2014; Jones, 2013; Tsai & Lin, 2012). The results of
these studies suggested that some SET dimensions tended to predict overall score.
Different studies have investigated different external factors related to the three
areas: course, instructor, and student characteristics. Most of these studies identified
gender, student status, course type, course level, and academic school as factors that are
related to course and student characteristics. The majority of the research that
investigated course characteristics suggested that the course level and type affected the
results of SET. Also, the majority of the research that investigated student characteristics
suggested that student status and gender affected the results of SET. These studies
reported that gender, student status, course type, course level, and academic school

4
influenced the SET, and this influence affected the reliability and validity of SET results
(Ali & Ajmi, 2013; Narayanan, Sawaya, & Johnson, 2014).
Rationale
Most of the studies that were found in the literature did not provide any
information regarding the possible SET dimensions that can predict the overall SET score
(Terry et al., 2017). Identifying the dimensions that predict the overall rating can help
instructors to focus on specific areas to improve the courses and help administrators make
better decisions regarding these courses.
Different studies indicate that gender, student status, course type, course level,
and academic status have significant effects on SET (Alauddin & Kifle, 2014; Al-Issa &
Sulieman, 2007; Ali, & Ajmi, 2013; Santhanam & Hicks, 2002; Whitworth et al., 2002;
Worthington, 2002). However, most of this research targeted populations who share
similar majors or grade levels and were from one school or department. Also, the authors
of these studies reported different limitations, including that the percentages of female
participants were higher than male. Also, these studies imply the need for research that
targets participants from different majors, grade levels, and academic schools in order to
generalize the results.
Statement of the Problem
Higher education institutions continue to use the results of SET as an important
source to make different decisions to improve education. Because of the implications of
using SET in higher education, it is important to make sure that SET scores are unbiased
and reliable before being used. A small number of research studies examined the
relationship between SET dimensions and overall score. These studies indicated that SET
5
dimensions predicted overall score and suggested that some of the SET dimensions
tended to predict overall rating better than other dimensions (Hoidn & Kärkkäinen, 2014;
Jones, 2013; Tsai & Lin, 2012).
Different studies indicate that SET scores are affected by some of the
characteristics of the course and/or student (Al-Issa &Sulieman, 2007; Ali & Ajmi, 2013;
Batten, Birch, Wright, Manley, & Smith, 2013; Beuth et al., 2015; Galbraith, Merrill, &
Kline, 2012; Narayanan et al., 2014; Kozub, 2010; Pounder, 2007; Shauki, Ratnam,
Fiedler, & Sawon, 2009; Whitworth et al., 2002; Worthington, 2002). These
characteristics were: gender, student status, course type, course level, and academic
school. However, the results of these studies were not consistent. While some of the
studies reported that SET scores were not affected by external factors, others reported
that the results of SET are influenced by external factors that were related to the course or
student characteristics.
The limited published literature and the contradictions in the findings made the
nature of the relationship between the potential student and course characteristics,
including gender, student status, course type, course level, academic school, and the
result of SET inconclusive.
Purpose of the Study
This study aims to examine the type of rating of SET dimensions (effective
communication, respect for diversity, stimulating student interest, intellectual discovery
and inquiry, integrating faith and learning, preparation and organization, critical thinking,
clarity of objectives, availability and helpfulness, and evaluation and grading) and overall
rating (student overall rating for the course, instructor, and learning experience) that
6
students give for the courses they take and identify the possible SET dimensions, which
affect the results of SET overall rating. Also, it aims to assess the association(s) of
gender, student status (freshman, sophomore, junior, senior, graduate, and postgraduate),
course type (general required, major elective, required major, and general elective),
course level (100s, 200s, 300s, 400s, 500s, 600s), academic school (arts and science,
architecture, business, education, health professions), and SET scores.
Conceptual Framework
Student Evaluations of Teaching
Student evaluation of teaching is an assessment that is used by most higher
education institutions to assess effective teaching. It plays an important role because
some faculty use SET scores to adjust or change some aspects of their courses (Beuth et
al., 2015; Carbone et al., 2014; Hobson & Talbot, 2001). Also, higher education
institutions use SET scores to make decisions to reward instructors or encourage them to
participate in professional development. Because SET scores play such a critical role,
their results need to be accurate and reflect the reality of higher education, i.e. whether
the courses and instructors were effective (Anantharaman, Lee, & Jones, 2010; Galbraith
et al., 2012). Different researchers have recognized that need and searched for evidence
that could help support the accuracy or inaccuracy of SET scores (Alauddin & Kifle,
2014; Ali & Al Ajmi, 2013; Choi & Kim, 2014; Korte, Lavin, & Davies, 2013; McCann
& Gardner, 2013; Narayanan et al., 2014; Nargundkar & Shrikhande, 2012). The
literature review indicated that some dimensions of effective teaching predicted SET
overall rating, and suggested that gender, student academic status, course type, course
7
level, and academic school were the student and course characteristics that affect SET
score.
SET Overall Rating and SET Dimensions
Some research suggests that SET overall rating was influenced by some of the
SET dimensions. Feldman (2007) reported that effective teaching included dimensions
such as clarity, stimulation of interest, meeting the course objectives, organization and
planning, motivating student, and providing feedback. Different research reported that
effective teaching should support student innovation, critical thinking, inquiry, and
respect for diversity (Hoidn & Kärkkäinen, 2014; Jones, 2013; Tsai & Lin, 2012). The
Andrews University Course Survey instrument included most of these dimensions in
addition to the follwing dimensions: communicate effectively, intellectual discovery and
inquiry, and connecting faith and learning (Philosophy of Course Evaluations, 2013).
The literature review indicated that there is a relationship between the SET overall
rating and the SET dimensions (Diette & Kester, 2015; Feldman, 2007; Grace, et al.,
2012; Özgüngör & Duru, 2015; Nasser-Abu, 2017). These studies indicate that there are
relationships between SET overall rating and one or more of the following dimensions:
clear goal setting, teacher availability, clarity, stimulation of interest, appropriate
workload, appropriate assessment, meet the course objectives, communication,
evaluations of the student work, enthusiasm, class interactions, course organization and
planning, generic skills, relationships with students, motivation of students, and teaching
methods.

8
Student and Course Characteristics Influencing SET Scores
Student Evaluation of Teaching scores have been influenced by different
characteristics related to the student and the course that is taken. Some research suggested
that student’s gender and student’s status are important characteristics that may lead to
biased results. Other studies implied that course type, course level, and academic school
affect SET scores.
Gender
One factor research studied is the relationship between gender and SET scores.
They found that female students tended to give higher SET scores than male students (Ali
& Ajmi, 2013; Al-Issa & Sulieman, 2007; Batten et al., 2013; Beuth et al., 2015; Driscoll
& Cadden, 2010; Narayanan et al., 2014; Kozub, 2010; Shauki et al., 2009; Whitworth et
al., 2002; Worthington, 2002).
Student Status
Student status has been examined in two ways: student academic level and age.
The reason for considering this strategy is that both age and academic level are correlated
and it would be repetitive to examine them as two variables. Regarding the student
academic status studies reported that student academic level tends to influence SET
scores (Fah, Yin & Osman, 2011; Macfadyen, Dawson, Prest, & Gašević, 2016;
Nargundkar & Shrikhande, 2012; Zhao & Gallant, 2012). They found that as the student
academic level increased, the course rating increased. Freshman tended to rate courses
lower than all other students. The second way to examine student status was through age.
Different studies suggest that age tends to influence SET scores. Research found that
older students tended to give higher SET scores than younger students (Brockx et al.,

9
2011; Nasser & Hagtvet, 2006; Sauer, 2012; Sawon, 2009; Shauki et al., 2009). Some
research suggested different explanations for such an effect, including reaching a higher
level of maturation or getting to know the instructors.
Course Type
Different studies suggested that the type of a course influenced SET scores. These
studies reported that students tended to score major courses differently than elective ones.
Research found that students tended to score elective courses higher than major courses
(Ali & Ajmi, 2013; Brockx et al., 2011; Galbraith et al., 2012; Nargundkar & Shrikhande,
2012). Such results indicate that course type influences SET score.
Course Level
Researchers also found that course level influenced SET scores. Studies reported
that undergraduate students tended to score SET lower than graduate students (Ali &
Ajmi, 2013; Al-Issa & Sulieman, 2007; Beuth et al., 2013; Driscoll & Cadden, 2010).
Also, researchers claimed that SET scores tended to be higher for upper division courses
than for lower division courses (Hoidn & Kärkkäinen, 2014; Nargundkar & Shrikhande,
2012; Peterson et al., 2008). The results of these studies indicate that SET scores differ
depending on the level of the course.
Academic School
Studies suggested that the academic schools, which offered the courses, affected
the SET score. According to Larry Braskamp and John Ory (1994), the ratings of courses
decrease in sequence with the following areas: arts, humanities, biological, social science,
business, computer science, math, engineering, and physical sciences. Also, more recent
10
research found that found that academic school affected the SET score (Kember &
Leung, 2011; Korte et al. 2013). However, there was not much research that helped with
understanding the association between the SET score and academic school.
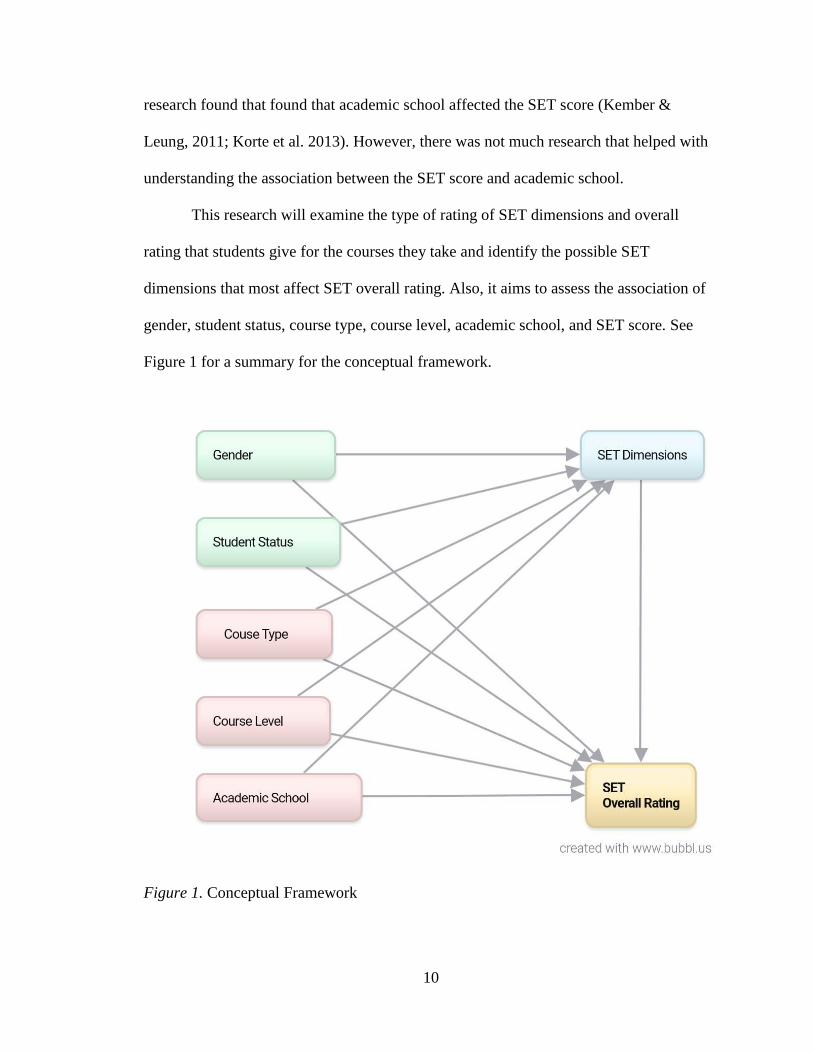
This research will examine the type of rating of SET dimensions and overall
rating that students give for the courses they take and identify the possible SET
dimensions that most affect SET overall rating. Also, it aims to assess the association of
gender, student status, course type, course level, academic school, and SET score. See
Figure 1 for a summary for the conceptual framework.
Figure 1. Conceptual Framework

11
The Research Questions
What type of ratings of SET dimensions and overall rating do students give for
the courses they take?
What SET dimensions are related to the score of SET overall rating?
Is there a significant correlation between SET dimensions and overall rating and
gender, student status (freshman, sophomore, junior, senior, graduate,
postgraduate), course type (general required, major elective, required major, and
general elective), course level (undergraduate and graduate), and academic school
(arts and sciences, architecture, business administration, education, and health
professions)?
Significance of the Study
This study contributes to the literature in the area of SET because it examines the
possible dimensions that affect the SET overall rating and five external factors related to
the course or student characteristics (gender, student status, course type, course level, and
academic school) that might affect the SET scores. Researchers who want to understand
the variables that influence SET score should examine as many variables as they can find
in order to explain the possible effect. Most of the studies that have been
found in the literature examined one or three factors related to the course or student
characteristics that possibly affect the SET scores. This study examines five
characteristics related to the course or student characteristics that might affect the SET
score.
Another significance of this study is that it could help future researchers to better
understand the possible course or student characteristics that affect the results of SET. By

12
understanding these factors, higher education institutions could adjust the SET scores
before report the results to control biased results as much as they can with regard to the
factors. Also, higher education institutions could develop different SET models to help
apply the SET scores in effective ways. Additionally, this study could help higher
education institutions understand the possible factors that could lead to biased SET scores
and to encourage the use of different assessment tools to measure effective teaching in
addition to SET. Some research suggested using peer-review as another way to evaluate
teaching effectiveness (Benton & Ryalls, 2016).
Delimitations
This study is delimited to students who were majoring in one of the following
areas: arts and sciences, architecture, business, education, and health professions. Thus,
the results of this study might not be generalizable to students majoring in other areas,
such as health profession. Also, the survey that the participants completed was online,
which might have affected the participation. The study was conducted on the campus of
Andrews University, which is a small private Christian-based institution. The results of
this study might not be generalizable to students at large public or non-Christian-based
colleges and universities.
This study examined the responses to traditional lecture type courses; other types
of courses such as online or seminar were not included in the study. Also, honors
program courses were not included in this study. All courses related to theological
seminary programs were not included in this study.

13
Definition of Terms
Student Evaluation of Teaching (SET): An assessment that is used to measure
student opinions of the course and instructor effectiveness.
SET Dimensions: The dimensions of effective teaching that the SET instrument
included within its items. Some dimensions were measured by one item, other
dimensions were measured by more than one item.
SET Overall Rating: The score that the students provide for their general opinions
regarding the learning level, course, and instructor characteristics.
Student Status: The academic year the students reached that includes freshmen,
sophomores, juniors, seniors, graduate and postgraduate students, who were students who
completed their bachelor degree and wanted to pursue another bachelor’s degree.
Course Type: The type of a course could be general required, major elective,
major required, or general elective course.
Course Level: The course level refers to the learning level status of the course
whether it is undergraduate or graduate level. Undergraduate level courses are 100s,
200s, 300s, and 400s. Graduate level courses are 500s and 600s.
Academic School: It is the administrative structure in which the academic courses
are offered. The academic school that this study will examine are related to: arts and
sciences, architecture, business, education, and health professions.
14
CHAPTER 2
LITERATURE REVIEW
Introduction
This literature review focuses on SET and aims to introduce the readers to
different research and the wide range of information available in the area of possible
SET’s dimensions that predict SET overall rating and the external factors that affect SET
scores. Also, the studies that the researcher reviewed regarding the external factors were
related to both the course and student characteristics. Specifically, this included
publications on student status, gender, course level, course type, and academic school.
Student Evaluation of Teaching is a critical tool used by administrators and
instructors to make serious decisions regarding developing the course and the instruction
(Al-Issa & Sulieman, 2007; Chulkov & Jason Van, 2012). It is considered an important
tool that could have negative impacts on the development of teaching if it did not give
accurate results (Ali & Ajmi, 2013; Fairris, 2012). Also, some universities post the results
of SET online to help new students make decisions in selecting courses based on the
experience of previous students (Beran, Violato, Kline, & Frideres, 2009). Therefore, it is
important to understand the possible student and course characteristics that could affect
the results of SET.
Before writing the literature review, the researcher used different materials and
sources to give a fully detailed review. The main sources were various databases accessed

15
through the James White Library Database, including Wiley Online Library,
Dissertations, JSTOR, and SpringerLink. Also, the researcher used Google to help locate
other educational resources that studied how SET is influenced by course level, course
type, student academic level, student age, academic status, and gender of students.
The researcher used different terms that are related to the purpose of the literature
review to help locate the referenced articles. Those key words were “student evaluation,”
“student evaluation of teaching,” “student ratings,” “student perception,” “student
satisfaction,” “dimensions,” “overall rating,” “gender,” “age,” “student status,” “course
level,” “course type,” and “academic school.”
The researcher searched for studies that were published by journals related to
education, mostly related to higher education, including Research in Higher Education,
Studies in Higher Education, and Assessment & Evaluation in Higher Education. In
addition, the researcher searched for published dissertations that were written around the
area of SET, and the factors that affected the results of SET. All of the articles that were
used in this literature review were written in English. Additionally, the date of
publication of the articles that were found was between 1954- 2017. The articles that
were published before 2002 were used to help define the variables.
Student Evaluation of Teaching
Introduction to SET
Researchers and institutions use different terms to refer to SET. These include
student satisfaction (Seng, 2013), student perception of teaching (Patrick, 2011;
Riekenberg, 2010), SET effectiveness (Faleye & Awopeju, 2012), and student ratings
(Kember & Leung, 2011; Svanum & Aigner, 2011). Herbert Marsh (1984) defined it as

16
data collected from students that are aimed to help faculty and administrators develop
their programs. Stephen Benton and William E. Cashin (2014) preferred to use the term
student ratings instead of student evaluation. Most of the recently published studies that
were reviewed used the phrase student evaluation of teaching SET. Therefore, the phrase
student evaluation of teaching is used in this literature review to refer to the assessment
that higher education institutions use to measure the level of student satisfaction in
different courses.
Noreen Gaubatz (1999) argued that SET is “defined as either a measure of
instructional process, a measure of the product of instruction, or a combination of the
two” (p.14). A review of the literature indicated that SET (McIntyre et al., 1984) is used
as a survey form that is completed by the student at the end of the course or program.
This survey typically asks the students to use their judgment to report their experiences
regarding the effectiveness of the teacher or the quality of the course (Hobson & Talbot,
2001). Bowman and Seifert (2011) considered SET an informal assessment that asks the
students about their opinions of how their attitudes and skills have been developed during
a specific course. Cohen (1981) argued, “it is important …that ratings be correlated with
numerous teaching effectiveness criteria and uncorrelated with factors assumed to be
irrelevant to quality teaching (i.e., student, course, and instructor characteristics)”
(p.283).
Student Evaluation of Teaching is an assessment that helps to measure
effective teaching. According to Angela Lumpkin and Karen Multon (2013),
Effective teaching is difficult to describe and measure because it is
multidimensional, highly individualized, and seldom observed, other than by
students. Today there is no widely accepted agreement about what exactly
effective teaching is and how it should be measured. (p. 288)

17
Arthur Chickering and Zelda Gamson (1989) proposed seven principles for
effective teaching for undergraduate education. These principles were: encouraging
contact between students and faculty, developing reciprocity and cooperation among
students, encouraging active learning, giving prompt feedback, emphasizing time on task,
communicating high expectations, and respecting diverse talents and ways of learning.
All SET used different forms including different items that help measure the
effectiveness of instructors. Some items can be global (course quality overall) or a
specific aspect of instructor or course. William Coffman (1954) identified different
dimensions that were used to design an instrument with specific items to evaluate the
instructors. These items asked students to rate their teacher in terms of preparation,
organization, assignment, enunciation, scholarship, making the students interested, and to
provoke their thinking. Also, SET could include items that asked the student’s opinion
about the instructor’s personality traits, including open-mindedness, care, respectfulness,
enthusiasm and encouragement (Riekenberg, 2010).
To measure the quality of the course, SET forms included different items that
asked the student to respond using a Likert-type scale. Some of the items that most SET
forms include are related to the materials, learning experience, and the requirements of
the course (Sailor & Worthen, 1997). Furthermore, the items that the SET included are
presented using negative or positive statements related to the student experience. The
scores for the negatively stated items are reversed when the data are analyzed. Frick,
Chadha, Watson, and Zlatkovska (2010) reported that the use of negative statements was
for “the purpose of detecting whether or not students were reading” (p. 118) the SET
items carefully. Faleye and Awopeju (2012) argued that

18
University teaching involves diverse modes of instruction, including: lectures,
seminars, laboratory and mentoring. Disciplines, courses and instructors also
vary widely in their emphasis on such different educational objectives such as
learning new knowledge, stimulating student’s interest, developing cognitive
skills, and leading students to question established tenets…Research and
theory have shown that teaching effectiveness as measured by students’ rating
of teaching is multidimensional in nature. (p.151)
Using SET
Student Evaluations of Teaching are generally an end-of-course evaluation used
by an entire university community. They include items designed to target specific
dimensions or behaviors. Chen and Hoshower (2003) argued that SET function as
summative and formative measurements of teaching effectiveness. SET serves as
formative assessment when it is used at the end of the semester to provide the faculty
with formative feedback to help improve their teaching skills, instructions, and the
content of the course (Hobson & Talbot, 2001). However, SET is used as summative
assessment when administrators and policymakers make decisions for program
adjustment and faculty promotion and tenure. Also, it is used as a summative assessment
to provide future students with information that help them choose courses and instructors
(Chen & Hoshower, 2003).
Marsh (2007) discussed four applications for SET; providing diagnostic feedback
to faculty, measuring teaching effectiveness, providing information for students to help
them select future courses and using the results for pedagogical research. Other research
emphasized that the most important use of SET is to improve instruction so that students
grow intellectually (Hammonds, Mariano, Ammons, & Chambers, 2016). Additionally,
Husain and Khan (2016) stressed that student feedback is considered the most effective
19
and reliable method for teacher evaluation, helping the faculty to improve and develop
their courses and teaching skills.
A study conducted by a group of researchers (Carbone et al., 2014) suggested that
educators could use the results of SET to improve their teaching. The researchers
reported that SET results were positively used as part of the process toward developing
courses and encouraged educators to take advantage of SET results.
Student Evaluation of Teaching plays a significant role in developing education
because it helps determine the dimensions of learning that lead to student satisfaction
(Lizzio, Wilson, & Simons, 2002). Also, Wibbecke, Kahmann, Pignotti, Altenberger, and
Kadmon, (2015) argued that using SET could help improve courses. They reported that
combining the results of SET with professional consultation helped to teach the faculty
members initiate and maintain improvement in teaching. Other researchers (Beuth et al.,
2015) argued that SET can be a useful tool to revise a course using exploratory factor
analysis. They claimed that such a strategy helps to target specific elements of the course
that could be used to develop and improve courses by understanding which SET
dimensions lead to a high level of student satisfaction. Hansen (2014) reported that using
a customized approach of student course evaluation helped improve teaching and
learning. Wibbecke et al. (2015) also reported that combining the results of SET with
professional consultation elements could initiate and maintain improvements in teaching.
Malouff, Reid, Wilkes, and Emmerton (2015) claimed that SET could help
instructors know if they achieve their learning goals for the courses that they teach. They
argued that high ratings for specific aspects indicates achieving these goals. Using the
results systematically could help the instructors understand the results of the changes in

20
their teaching methods. Similarly, the systematic uses of the results help instructors focus
on specific aspects where they need to develop their skills. Quaglia and Corso (2014)
considered SET as a tool that reflects student voice, which is essential to positive change
in the classroom. They believed that SET could help support student’s needs. Oermann
(2017) emphasized that students provide the instructors with a unique view of their
teaching, because they engage with the instructors and other students every day. Darwin
(2017) claimed that the enforcing of market-based models in higher education leads some
institutions to “further alienate the student voice from its originating motive as a tool of
pedagogical improvement” (p. 18). He argued that SET should be used to reflect student
perspectives of effective teaching.
Challenges in SET
Researchers reported that educators face different challenges when it comes to
designing SET. For example, shifting from a four-point scale to a five-point scale in SET
affected the results of SET and led the students to give less positive feedback (Chulkov &
Jason Van, 2012). Such a finding suggests that researchers who had used five-point scale
might have found more negative rating scores than those who used a four-point scale.
Balam and Shannon (2009) reported that while students tend to believe that they
have the qualification to give an accurate evaluation, instructors tend to consider SET as
an invalid and unreliable source for evaluating teaching effectiveness. However, most of
these instructors agreed that SET could be helpful in improving instruction. According to
Anantharaman et al. (2010), student satisfaction not only serves as an instrument of the
overall quality of an institution’s education but also indicates its long-term viability in a
competitive environment. Galbraith et al. (2012) reported that
21
Student evaluations of teaching effectiveness (SETEs) are one of the most
highly debated aspects of modern university life…While originally
implemented to provide student feedback in order to improve teaching, since
the 1970s SETEs have become increasingly prevalent in faculty personnel
decisions. (p. 353)
Another challenge is the using of one form of SET instrument that has the same
dimensions by a different department. Researchers reported that using different forms of
SET that includes different dimensions affect the SET results. They believed that each
department should develop their SET instrument based on their institution’s and
instructors’ philosophy of effective teaching in order to get accurate results (Nerger,
Viney, & Riedel, 1997).
Validity and Reliability of SET
The validity of an instrument examines the extent to which a test measures what it
is designed to measure. Student Evaluation of Teaching forms vary depending on the
institutional definition of effective teaching. Student Evaluation of Teaching covers
different dimensions that represent the educational aspects a higher education institution
values most. As a result, not all SET tools cover the same dimensions of effective
teaching. Some SET forms represent nine dimensions that defined teaching effectiveness
(Marsh, 1982), some forms covered seven dimensions (Pritchard & Potter, 2011), and
some five dimensions (Jones, 2013).
Craig Galbraith, Gregory Merrill, and Doug Kline (2012) argued that most of the
validity and reliability issues of SET “shifted more toward the dimensionality problem of
SETEs, including the number and stability of the different dimensions” (p. 355). The
researchers reported that this shift discourages conducting new research that challenges
the validity of SET and recommends that new research focus on improving SET.

22
Another validity problem is that some SET forms do not represent the dimension
of effective teaching that meet the needs of the new generation. Marsha Cole (2013)
argued that the needs of the new generation of learners were different than the needs of
traditional learners. She believed that effective teaching should aim to meet the needs of
non-traditional learners. An example of the needs of non-traditional learners is innovation
and creativity. Tsai and Lin ( 2012) believed that the new generation of students should
be exposed to different ideas that spark their creativity and innovation skills. Most SET
instruments found in the literature were developed a long time ago, during the 1900s
(Marsh, 1982) or based on an old SET instrument.
Another validation challenge that some SET tools face is that they have been
developed based on pioneers in the area of SET and might not reflect what the students
view as effective teaching. Victor Catano and Steve Harvey (2011) attempted to validate
a SET instrument that had nine dimensions, including availability, communication,
conscientiousness, creativity, feedback, individual consideration, professionalism,
problem-solving, and social awareness. The researchers found that students defined
effective teaching differently than teaching masters, who were pioneers in developing
SET, such as Marsh (1982). The researchers found that communication,
conscientiousness, and creativity were overrepresented by teaching masters. Also, they
reported that these teaching masters underrepresented the following dimensions:
availability, feedback, individual consideration, professionalism, and social awareness,
while overlooking the dimension of problem solving. In their conclusion, the researchers
suggested that educators consider creating a SET form that recognizes competencies that
students believe embody effective teaching and then by “developing a psychometrically

23
sound rating scale by various empirical tests” (Catano & Harvey, 2011, p.714).
Nargundkar and Shrikhande (2012) argued that generational shifts affect the dimensions
that SET instruments include because the meaning of effective teaching changes in
relation to what is considered important to students.
Another validation problem is that some SET instruments used ambiguous or
vague words that students might not understand. According to Dujari (1993), about half
of the students who were asked to complete SET were able to understand only 75% of the
vocabulary that was used. About 85% of the participants were African American
students. The Dujari study indicated that using specific vocabulary, with which all
students are not familiar, could affect the reliability of SET.
SET and Bias Factors
Although different research supports the validity and reliability of SETs (Cashin,
1995; Marsh, 1984; Marsh & Roche, 1997), other research suggested that different
factors affect the students' responses. The most common criticism of SET is that it could
include biased results (Al-Issa & Sulieman, 2007; Appleton-Knapp & Krentler, 2006;
D'Apollonia & Abrami, 1997). Svanum and Aigner (2011) stated that “students can
assess the same course and instructor in different ways depending upon such factors as
their degree of success, their motivations for taking the course, and the amount of effort
invested. Course satisfaction, then, can be substantially influenced by factors loosely or
unrelated to course or teacher effectiveness” ( p. 667).
Other researchers (Shevlin, Banyard, Davies, & Griffiths, 2000) examined the
reliability of SET, specifically the factor of the lecturer’s ability and the module
attributes. They found that there were some factors that influenced the SET score. They

24
reported that charisma factors explained 69% of the variation in the lecturer ability and
37% of the variation of the module attributes. Such results indicated that SET score
tended to be influenced by non-teaching related factors. Also, Franklin (2016) reviewed
the literature regarding the strengths and weaknesses of SET. He argued that when there
is bias in an evaluation, one of the first efforts a program can make is to attempt to
control it within the evaluation based on the demographic information collected.
Therefore, schools should collect demographic information. Benton and Ryalls (2016)
reported that there has “been steady increase in average ratings since 2002” (p.2). They
believed that millennials rated teachers higher than previous generations and argued that
faculty development had increased and has led to student satisfaction. Reflecting on SET
results help some instructors improve their teaching skills. They reported that institutions
should control the influence of external factors that include required and elective or first
year and upper level classes.
Dimensions of Effective Teaching
The dimensions of effective teaching is a broad area that researchers examined.
Some researchers suggested seven principles for effective teaching. These principles
were: encouraging contact between students and faculty, developing reciprocity and
cooperation among students, encouraging active learning, giving prompt feedback,
emphasizing time on task, communicating high expectations, and respecting diverse
talents and ways of learning (Chickering & Gamson, 1989).
Other researchers proposed that effective teaching included aspects related to
course structure (Lumpkin & Multon, 2013). They believed that good teaching allows
students to understand the content of knowledge that they learned and motivated students

25
to learn. Other research reported that effective teaching encourages intellectual growth
(Bowman & Seifert, 2011). Students develop their understanding of the subject by
learning more information about that subject and explore that area.
Anderson (2012) reported that course content and critical thinking are important
aspects of effective teaching. She emphasized that linking the course objectives and goals
to the content are critical for effective teaching. She also stressed that instructors should
support student critical thinking. Other researchers reported that the learning materials
(Seng, 2013) are an important aspect of good teaching. Instructors should use materials
that motivate and expand the students’ knowledge of the subject. Burton, Katenga, &
Moniyung (2017) reported that instructor’s availability and support as one of the aspects
of effective teaching that supported student academic success.
Other aspects of effective teaching that had been reported are collaboration
(Lidice & Saglam, 2013), communication (Nargundkar & Shrikhande, 2012), and respect
for diversity (Lumpkin & Multon, 2013). Researchers also found that enthusiasm,
including sensitivity to student’s needs, an important feature of good teaching (Korte et
al., 2013; Latif & Miles, 2013; Seng, 2013). These researchers reported that students
appreciate instructors who understand their needs and are available for them. Another
important aspect of effective teaching is organization and clarity (Alauddin & Kifle,
2014; Lidice & Saglam, 2013; Lumpkin & Multon, 2013). Research found that students
learn better when they receive clear objectives, guidelines, and expectations. Grading and
evaluation were also found to be important qualities of good teaching (Anderson, 2012;
Latif & Miles, 2013). Students should understand the grading system for the course that
they take and the requirements that they need to complete the course.

26
Encouraging creativity and innovation (Hoidn & Kärkkäinen, 2014), stimulating
thinking (Tsai & Lin, 2012), and providing transferable experiences (Annan, Tratnack,
Rubenstein, Metzler-Sawin, & Hulton, 2013) were also reported as important aspects of
effective teaching. Students’ ability to solve problems and find creative ways to solve
these problems was considered part of developing cognitive skills (Wyke, 2013). Also,
Wyke (2013) believed that allowing the students to explore and use their thinking skills
to solve problems encouraged these students to use their prior knowledge. Student-
teacher interaction is important in student learning (Lumpkin & Multon, 2013).
Researchers reported that when students interact with their instructors, they develop good
relationships which result in a productive learning environment.
Dimensions of SET and SET Overall Rating
Feldman (2007) examined SET dimensions that might affect the results of SET
overall rating. He found that clarity and understandability, teacher stimulation of interest,
teacher preparation and organization, meeting the objectives, and student motivation
highly impacted the SET overall rating. Also, he reported that clarity of course
objectives, teacher sensitivity to class, encouragement, intellectual challenge, knowledge
of the subject, teacher’s elocutionary skills, enthusiasm, and availability had a moderate
impact on the SET overall rating. Additionally, Feldman reported that the dimensions
related to the areas of respecting students, managing classroom, and using good
evaluation methods tend to have low to moderate impact on SET score. Also, Feldman
reported that feedback, materials, workload, and usefulness of the course tended to have
the lowest impact on the SET score. Coffman (1954) examined 19 variables that measure
how students rate the instructor trait. He argued that the more difficulty students have
27
with class work, the more they are likely to value teachers who are helpful and
understanding. He reported that a high rating was found in the area of preparing for the
class, which was connected with the area of organization.
Debra Grace et al. (2012) examined the SET overall rating and some dimensions
of SET, including good teaching, clear goal setting, appropriate workload, appropriate
assessment, and generic skills development. They reported that SET was influenced by
good teaching and generic skills which include communication skills and problem
solving. Also, the reported that there was no significant correlation between SET overall
rating and assessment and workload. Also, Timothy Diette and George Kester (2015)
examined the SET overall rating for courses related to accounting, business and
economic and the dimensions that impacted the results of SET. The sample contained 860
individual course evaluation questionnaires. The results indicated that high ratings were
associated with clear communication of the main points of lectures, evaluation of the
student work, and enthusiasm. Also, Harrison, Douglas, and Burdsal (2004) reported that
course workload and difficulties were some of the dimensions that affected SET overall
rating.
Özgüngör and Duru (2015) conducted research that studied the relationship
between SET overall rating and SET dimensions. He examined the dimensions of SET
that could impact the SET overall rating. The research included 23,814 students from
different departments, excluding the medical school. The researcher used an SET that
included 20 items measuring six dimensions. These dimensions were: effective teaching
(instructor ability to capture student interest and make the content meaningful), course
organization and planning, relationship with students, exams and evaluation, class

28
interaction, and the contribution of generic skills (p.123). The results indicated that high
ratings were correlated with generic skills, class interactions, course organization and
planning, effective teaching, relationships with the students, and exams and evaluations.
Hongbiao Yin, Wenlan Wang and Jiying Han (2016) tested the relationship
between SET and the factors that influenced SET overall rating. The participants were
2,043 undergraduate students from two Chinese universities. The researchers used a 5-
point Likert scale that included 36 items, two-factor study process questionnaire, and
overall satisfaction scale. The SET dimensions that were included in the questionnaire
were: clear goals and standards, generic skills, emphasis on independence, good teaching,
and appropriate workload. The results indicated that student perceptions about the
curriculum, instruction, and assessment influenced the results of SET. Also, the results
showed that clear goals, standards, and generic skills significantly affect the overall
rating.
Nasser -Abu (2017) examined students’ perceptions regarding the characteristics
of good teaching. The study included 2,475 undergraduate and graduate students taking
courses from one of the following areas: social sciences, natural sciences, humanities,
and exact sciences. The SET instruments that were used included five dimensions. These
dimensions were: achieving goals, long-term student development, teaching methods and
characteristics, relations with students, and assessment qualities. The results indicated
that students tended to consider assessment as the most important one, then goals to be
achieved, relation with students, and teaching methods. The least important was long-
term development. Female students tended to consider all dimensions more important for
good teaching than male students. Also, older students tended to rate long-term

29
development higher than younger students. There was a significant difference between
the groups of disciplines regarding student long-term development.
Daniela Feistauer and Tobias Richter (2017) examined the correlation between
rating course, rating instructor, rating student/teacher interaction, and the four dimensions
of SET: planning and presentation, interaction with students, interestingness and
relevance, and difficulty and complexity. The researcher used 4,224 evaluations of
psychology courses. The results indicated that instructor, course, and student/teacher
interaction were large sources of variance for the four dimensions of SET. The results
also indicated that student/teacher interaction had the most influence on SET scores.
Student and Course Characteristics Affecting SET
Many studies have been conducted to identify and understand contextual factors
that could affect the results of SET. Demographic factors that were related to the course,
instructor, and student characteristics were found affecting SET score. This literature
review discusses only two demographic factors, which are course and student
characteristics. Because there are many studies that examined the instructor
characteristics, this research examined only the student and course characteristics.
Among the researchers interested in understanding the relationship between the
SET and course characteristics since the 1980s, Cranton and Smith (1986) stated that,
“the relation [between SET and course characteristics] varied dramatically. It was
concluded that the effect of course characteristics on student ratings of instruction varied
depending on the situation in which the ratings were collected, and that the relationships
are complex” (p.117). Braskamp and Ory (1994) reported that studies suggested that
ratings in elective courses tend to be higher than in required courses. Also, they reported

30
that ratings in higher-level courses tend to be higher than in lower-level courses.
Additionally, students tended to rate courses in the arts the highest, then humanities, then
biological, then social science, then business, then computer science, then math, then
engineering, and physical sciences (p. 181). Anstine (1991) reported that the course
requirement status (p. 32) is one of the demographic variables that appeared to have some
influence on the SET. Moreover, Donnon et al. (2010) reported that giving the students
the freedom to choose the courses affected the results of SET.
Patricia Cranton and Ronald Smith (1986) reported that there was a complex
relationship between course characteristics and SET. They concluded their article with
the statement
it is logical to assume that in higher education, with the variety of disciplines,
class sizes, and the learning that takes place over the years of university
teaching, there would be a large variation in the way students perceive
instruction and its effectiveness. (p.127).
Pekka Rantanen (2013) found that students tended to favor some courses over others. He
reported that students tended to favor art and humanities courses rather than courses in
physics and mathematics.
The literature also suggests that different factors related to student characteristics
influence SET. Student characteristics are related to demographic characteristics of the
student, including ethnic background, native language, age, student status, gender,
academic year, and learning and study skills (Sauer, 2012; Lizzio et al., 2002). This
literature review examined the influence of student status and gender on SET. The reason
for not examining other factors, such as ethnicity, is that not all students reported such
information. Student status is an important factor that researchers should consider when
they examine students’ satisfaction in education (Akareem & Hossain, 2016). The

31
students with lower age had different views and expectations, and these expectations
changed as they mature. Also, today, higher educational institutions understand the
negative impact of gender inequality and try to close the gap of gender as much as
possible (Campbell, 2015). Therefore, examining whether gender affected the SET scores
or not is a critical part of this study.
Whitworth et al. (2002) examined different possible factors affecting SET
effectiveness. Some of the factors that were examined were course level and course type
through the use of 12,153 student evaluation forms to examine the possible relationship.
The SET form included 15 items, where eight were used to measure the students’
perceptions of the quality of the instructor. A factor analysis was conducted to help
analyze the data. The results showed that SET scores differed significantly across course
category. Additionally, the results showed that there were significant differences
regarding the course level. Graduate courses tended to be rated higher than undergraduate
courses. The researchers believed that the reasons why graduate courses rated higher than
undergraduate courses were related to age, experience, and maturity. Regarding the
course type, the researchers reported that students tended to rate courses differently.
Business statistic courses tended to be rated higher than other business courses. The study
helped to understand how course level and course type affect the SET. It also supported
the theory that non-instructional factors could play a role in SET.
A quantitative research study that examined the influence of student background
characteristics effect on the SET score, was conducted by Worthington (2002).
Anonymous SET questionnaires were collected from juniors and seniors. The first section
of the questionnaire dealt with SET using a 5-point scale. The second section dealt with
32
the student’s own characteristics and perceptions of the SET process. This section
included items related to ethnic background, age, gender, course enrollment status,
average grade, and student perceptions of the evaluation process.
The results showed that student background characteristics had significant
impacts on SET and indicated that females or students over thirty years of age tended to
rate instructors higher than others students (p.11). The author reported that, “the impact
of student background variables varies across the various dimensions of teaching
performance” (Worthington, 2002, p.13). This suggested that student background
characteristics were influential factors affecting SET and were also affecting specific
SET dimensions.
The possible effect of academic school, gender, and course year on SET gained
the attention of Elizabeth Santhanam and Owen Hicks (2002). They conducted a
quantitative study to observe the differences between the arts, humanities, and social
sciences students’ rating score; and those of the sciences and mathematics students
considering the course year and gender. The researchers used data collected over three
years (1996-1998) that were conducted for the targeted academic schools at different
academic levels. The instrument that was used to collect the data was the Student
Perception of Teaching (SPOT) questionnaire in which each item is measured by a five-
point rating scale. Six items, three related to academic’s teaching and three related to the
course, were chosen to test the assumptions.
The results showed that students who took sciences and mathematics tended to
rate the instructor lower than students who took arts, humanities, or social studies.
Female students tended to rate higher than males, and students from different year levels

33
tended to rate the teaching differently. The senior or graduate students rated higher than
other groups. Such results indicated that the higher year level a student reached, the more
teaching satisfaction could be expected. This finding was consistent with the results of
Whitworth et al.’s study (2002). Also, the results pointed out that sophomore students
tend to rate the teaching lower than any other students. Such a result suggested that there
were possible factors that affect the sophomore students learning experiences.
The researchers believed that such a result could be a consequence of “sophomore
slump” in which “first year college students’ enthusiasm found to have been replaced by
second year students’ cynicism” (Santhanam & Hicks, 2002, p. 27). Furthermore, the
researchers found that SET is influenced by gender. Female students tended to rate SET
higher than male students. Such a result indicated that both course characteristics and
student characteristics could affect SET.
Jenny Darby (2006a) examined gender differences in SET score. She found that
female students rated their instructors different than male. According to Darby, female
students were able to remember and notice things and scored higher than male students.
She linked these high scores to SET scores and argued that these abilities affect the SET
score. Another study by Darby (2006b) examined the impact of course type on SET. She
tested whether students who took elective courses would rate their courses more
favorably than would those who took required courses or not. Data were collected from
course evaluations of 185 new lecturers (93 lecturers taught required courses and 92
lecturers taught elective courses) for courses related to business studies, engineering,
science, social science, and mathematics. The participants were asked to evaluate three

34
aspects of each course. These aspects were human characteristics-related factors, feelings
about course content, and aspects of the learning environment.
Darby (2006b) found that students tended to rate elective courses higher than the
required courses. In her conclusion, she argued that her study “provided some evidence to
support the view that some elements of evaluation are decided by factors which have
nothing to do with the quality of teaching on the course” (p.28). The results of her study
supported the idea that course type could be an influential factor in SET scores.
Fadia Nasser and Knut Hagtvet (2006) conducted a quantitative study that aimed
to examine the degree of influence of student, instructor, and course characteristics on
student ratings. The researchers observed the relationship among the three areas: interest
in the course subject, expected grade, and SET scores. The participants were 1,867
students registered in 117 courses in teacher education. The evaluation questionnaire that
was used included 16 items that measured the course content, instructor’s planning and
teaching, and instructor’s behavior relating to students.
The researchers (Nasser & Hagtvet, 2006) used Multilevel Structural Equation
Modeling to test four models to help find the relationship between the three variables.
They reported that Model 4, which assumed an unanalyzed association between expected
grade and SET, was good because it fit the data and had acceptable variance in student
ratings. Also, the result indicated that Model 2 was a direct effect of interest in the
course, age, and SET. The research implied that students who were more interested in the
course subject rated their instructors higher than the students who were not interested. A
limitation of the study was that the participants were mostly female (89.5%). Such a
limitation could affect the model framework that the researchers found.

35
James Pounder (2007) analyzed the findings of different studies that examined
possible factors influencing SET scores. The research framework for analyzing the
studies included three factors, which are student related factors, including gender,
student’s academic level and maturity, students punishing their teachers via the SET
score; course related factors, including grading, class size, course content, and class
timing; and teacher related factor. This framework suggested that gender is one of the key
factors that performs a role in the SET score.
Stewart, Goodson, Miertschin, and Faulkenberry (2007) studied the impact of
contextual factors on SET scores. They selected different factors, including the student’s
desire to take the course, the field of the study, and the level of the evaluated course. The
participants were students enrolled in courses in the College of Technology (Engineering
Technology, Human Development and Consumer Science, Information and Logistics
Technology, and Occupational Technology). About 4,605 student ratings were analyzed.
The results indicate there was no significant difference in the SET scores when
comparing student major. Also, the researchers reported that higher-level courses were
rated higher than lower-level courses. Also, graduate-level courses were scored higher
than other courses, while freshmen-level courses were scored the lowest.
Ahmad Al-Issa and Hana Sulieman (2007) conducted a quantitative research to
examine the students’ perception of SET and student and course characteristics. The
researchers aimed to identify factors that might potentially bias the SET score. A 5-point
Likert-type scale questionnaire that included eight items/questions related to students’
perceptions of SET, and seven items/questions related to potential factors for biased SET,
was used to collect data. The lower the score, the higher bias was indicated. About 819

36
students (482 males and 337 females) completed the questionnaire. These students were
enrolled in summer courses in 2004-2005 from several different majors, including arts,
science, business management, architecture, design, and engineering.
The results showed that regarding SET score, academic status was one factor that
affected SET score. Graduate students had the highest SET rating, while freshman and
sophomore had the lowest SET rating. Also, gender was found to be an influential factor
on SET score. Less bias was shown in 70% of females as compared to 60% of males. The
study showed that SET score was influenced by gender and academic status and affected
score validity. Such results supported the results of Worthington’s study (Worthington,
2002) in which gender and course level were found to be influential factors in SET
results.
Richard Peterson et al. (2008) attempted to find evidence of differences in the
students’ rating across four business school course levels, which were 100 or 200 =
sophomore or lower level, 300 = junior level, 400 = senior level, or 500 = graduate level.
Also, they tried to search for evidence of a difference in the students’ ratings of required
core business school courses versus courses taken as part of a selected discipline
concentration. A SET survey for courses with a total of 355 class sections offered by the
Management and Information Systems Department was completed. A five-point Likert
scale survey that included 10 items was used to obtain data.
The researchers found that senior students tended to rate their professor
significantly higher than sophomore students or freshmen and all other undergraduate and
graduate students. Also, the researchers reported that general required courses were rated
lower than major-required and elective courses. The researchers believed that a possible

37
explanation for the significant difference in student ratings is the “familiarity effect” in
which
students may know the professors by the time they take these courses and,
therefore, they should experience less anxiety about taking them as opposed to
students who must take major required 100- 200- or 300-level undergraduate
courses and major required graduate (500)- level courses where they are
typically encountering a professor for the first time. (p. 392)
Also, they suggested that students’ interest in courses that were related to their major
concentration or elective courses could explain the significant differences in the results.
This study suggested that both course level and course type are non-teaching factors that
influence the result of SET. A limitation of the study is that the sample represented only
one area of study, which is business.
Kozub (2010) studied the relationships among SET scores, SET dimensions, and
student and course characteristics. About 463 students at a school of business completed
a 7-point response scale survey that included four items related to the overall evaluation,
five items related to pedagogical skill, seven items related to rapport with students, seven
items related to the perceived appropriateness of class difficulty, and four items related to
course value/learning. The results showed that course type tended to affect SET overall
rating. Students who took the courses as an elective tended to rate the course higher than
students taking classes as a general requirement or as a major or minor requirement. Male
and female students tended to rate similarly, except for the rapport dimension where
female students tended to rate this dimension higher than male students. Similarly, there
were no student status group differences, except for the rapport dimension.
Beran et al. (2009) used 1,229 completed surveys to examine how students
perceive the usefulness of SET. They analyzed the relationship between instructor
38
characteristics, student characteristics, the overall rating, and student perception of SET.
They reported that female students and young students tend to consider fairness,
enthusiasm, and respect more useful information about the instructors than did male and
older students. Also, the researchers reported that students varied in rating depend on
their view of what is important. Such results indicate that SET scores might be influenced
by gender and age.
Shauki, Alagiah, Fiedler, and Sawon (2009) examined the possible impact of
student gender, age, and prior education on SET scores. They hypothesized that older
students (older than 25) would give lower SET score than other students and that female
students would give lower SET score than male students. The participants were 187
postgraduate students in an accounting program. The SET instrument that was used
contained 10 items. The researchers used a two-independent sample test to help analyze
the data. The results showed that there were no significant differences between the SET
score of older students (over 25) and younger students (under 25).
Also, the researchers reported that there were no statistical differences between
the SET score of female and male students. The results of this study contrast the results
of other studies, in which age and gender are found to be influential factors in the SET
score. One possible explanation why researchers did not find age or gender differences in
the SET scores is that all participants were postgraduate students who were studying the
same area. A study that includes participants from different schools could help
understand whether student’s age and gender were or were not bias factors that affected
SET score, regardless of the academic school that they are related to.

39
Kember and Leung (2011) examined the possible correlation between SET scores
and disciplinary area of learning. Participants were 3,305 freshman and juniors from 50
undergraduate programs in four fields: Humanities, business, hard science, and health.
The researchers used 33-items with fifteen dimensions: Student Engagement
Questionnaire with a 5-point Likert scale that examined intellectual capability (critical
thinking, self-managed learning, adaptability, problem solving, communication skills,
and interpersonal skills); teaching (active learning, teaching for understanding,
assessment, and coherence curriculum); teacher-student Relationship (feedback to assist
learning, assistance from teaching staff, and teacher-student interaction), and student-
student relationship (relationship with other students, and cooperative learning).
The results indicated that there were group differences regarding their evaluation
scores. The humanities group rated intellectual capacity—specifically critical thinking—
higher than other groups.rThe health group rated intellectual capacity lower than the
humanities and business groups. Also, the rating scores of all academic school groups
were higher than the hard science group. For the business administration, the researchers
reported that the business administration group rated working together capabilities higher
than the other groups.
Brockx, Spooren, and Mortelmans (2011) studied the effect of some course and
student characteristics on SET scores. The researchers used 1,244 completed SETs for 56
core and elective courses related to: law, arts, economics, science, pharmacology,
biomedical, and veterinary science. The SET instrument that was used contained 37 items
measuring 12 dimensions of effective teaching. However, the researchers used the sum
score of seven dimensions that were related to teaching professionalism. The researchers

40
developed seven models to examine the possible predictors of SET score. The results
indicated that when student age, gender, course type, and field of study were added to the
model of the possible predictors, they did not show any significant predictors.
Fah, Yin and Osman (2011) used a survey that was completed by 88 junior and
senior students obtaining a Bachelor of Science degree to determine the relationship
between the course and lecturer characteristics, and tutorial ratings with the SET scores.
The participants were 18 males and 70 females and 50 students aged 22 years old and
older taking Personal Finance classes. The results indicated that there was a correlation
between the lecturer and course ratings. Both female and male students rated the course
and lecturer characteristics at a similar rate. Also, they reported that the predictors of
lecturer overall performance were course characteristics (r = .689) and lecturer
characteristic (r = .755). This study indicates that there was no relationship between SET
score and gender or student status. However, the results indicated that there were
significant relationships among the course and lecturer characteristics and SET overall
rating. Students who tended to give high ratings to the course and lecturer characteristics
tended to give a high overall rating.
Verena Bonitz (2011) studied the individual differences and bias effects on the
SET score. Bonitz asked 610 college students to rate hypothetical instructors who were
described using eight common dimensions of effective teaching. She found that the
factors: agreeableness, conscientiousness, conventional and investigative confidence, and
gender role attitudes were related to SET scores. Also, she found that female students
tended to score SET higher than male students.

41
Yeoh, Ho Sze-Yin, and Chan Yin-Fah (2012) tried to identify the factors and
predictors of instructor teaching effectiveness. The researchers collected 223 cases from
undergraduate students at the School of Management using a self-administrated five-
point Likert scale questionnaire. The questionnaire that was used included 32 items (13
items related to instructor characteristics, six items related to subject characteristics,
seven items related to student characteristics, and four items related to learning resources
and facilities). Both Multiple Regression Analysis and Stepwise method were used to
analyze the data. The results showed that juniors (M = 52.08) tended to give higher SET
scores than sophomores (M = 49.12). Also, the researchers reported that there was no
mean difference between the SET score of sophomores and freshmen. The results of this
study suggested that student academic level may influence the SET score.
Timothy Sauer (2012) explored the relationship between student, course, and
instructor-level variables and SET. The participants were 373 undergraduate students at
the College of Education and Human Development at a large metropolitan university in
the southern United States. The study used a 5-point Likert scale instrument that included
19 statements related to the instructor's teaching ability, preparation, grading, the course
text, and organization. A Hierarchical Linear Modeling analysis was used to find out the
relationship between the student, course, instructor-level variables, and SET. The results
showed that both student interest in the course and the amount of student effort were
significant predictors of SET in all of the regression models. Such results supported the
results of Nasser and Hagtvet (2006) in which they found a relationship between the
student’s interest in the course and SET. However, the results indicated a small positive
correlation between age and SET. Such a result indicates that there might be no

42
correlation between age and SET score. One limitation of the study was that its target
population was only students who study a specific major. Such a limitation made it
difficult to generalize the results. The results of this study encouraged researchers to seek
more understanding of the effect of student’s age on SET.
Satish Nargundkar and Milind Shrikhande (2012) tried to answer the question,
“Do the non-instructional factors (such as course type and level, instructor rank and
gender, semester, time of day) have a significant effect on the SET ratings?” (p. 57). The
researchers analyzed data collected on SET forms between 2005-2009 in a college of
business. The SET forms evaluated 6,000 sections of different courses that were from
graduate and undergraduate levels. The researchers created four categories based on
course type and course level; including graduate elective, graduate required,
undergraduate elective, and undergraduate required. Two-sample t-test and Analysis of
Variance (ANOVA) were used to help analyze the data. The results indicated that there
were differences between graduate and undergraduate SET scores. Graduate courses
rated higher (m = 4.3) than undergraduate courses (m = 4.2). Required courses were
scored lower (m = 4.2, p > .05) than elective courses (m = 4.3, p < .05).
Ehsan Latif and Stan Miles (2013) examined how students value different teacher
characteristics and teaching practice. The participants were 387 students who were
enrolled in different level courses in the area of economics. The researchers asked the
participants to rate the characteristics and teaching practices using a 4-item Likert scale
of importance. The results of the study suggested that female students, freshmen, and
sophomores tended to agree that instructor knowledge was the most valued characteristic.
However, male students, juniors, and seniors tended to agree that the instructor’s ability

43
to explain clearly was the most valued characteristic. Additionally, the researchers
reported that student ratings for the instructor’s preparedness, ability to explain clearly,
organization, helpfulness, and fairness tended to increase as the students become more
mature.
Leon Korte et al. (2013) investigated whether there were differences or
similarities in the opinions of male and female students about SET. The data were
collected from 381 participants who were undergraduate and graduate students at a
business school. The researchers asked the participants to rate 35 individual traits that
they believe were related to effective teaching. The results of the study indicated that
female students tended to rate SET differently than male students. Female students
believed that effective instructors were those who contributed to their learning
experiences. Female students tended to rate female instructors higher than male
instructors only on the trait of class preparedness. However, these female students tended
to rate male instructors higher than female instructors in the following traits: Relaxed
demeanor, outgoing personality, encouraging fairness, enthusiasm, repetition of concept
and content, caring attitude, instructor rank/title, established research record, academic
rigor, and receptiveness to questions.
Male students rated female instructors higher than male instructors in four traits,
which were; organized presentation, content/subject matter expertise, engagement, and
industry experience. However, these male students tended to rate male instructors higher
than female instructors in the areas of relaxed demeanor, outgoing personality, strict
adherence to course materials, receptiveness to questions, and sense of humor. The study
suggested that female students might not perceive female or male instructors in the same

44
way that male students perceive them. Such results indicate that gender could be an
effective factor that influences the SET scores.
Another study that attempted to identify bias factors that possibly affect the SET
from the perspective of the instructors, was conducted by Holi Ali and Ahmed Al Ajmi
(2013). Researchers conducted a qualitative study to answer the questions: What are the
college instructors’ views about the use of student evaluation forms to evaluate teaching
effectiveness? What are the non-instructional factors in student evaluations of their
teachers? The researchers conducted a semi-structured interview with 14 teachers in
public colleges in Oman to collect the data. The participants were chosen on “their
availability and for other practical reasons” (p. 87).
The results showed that college instructors believed that using SET’s instruments
is an effective way to evaluate teaching effectiveness. Also, the researchers reported that
instructors tend to believe that gender and course level are important non-instructional
factors that affect SET score. Some instructors reported that students who took the class
because it was required, tended to rate them lower than other motivated students (Ali &
Ajmi, 2013). This result supported Al-Issa and Sulieman’s (2007) results in which they
found that course type tends to affects the SET score. Also, the results supported the
Nasser and Hagtvet (2006) finding that the students’ interests in the course influence SET
score. Most of the results were consistent with the results of previous studies. This study
provided similar results to other studies that had been done to identify the non-
instructional factors that affect SET scores (Leon Korte et al. (2013; Nargundkar &
Shrikhande, 2012). Although the number of the participants was not a large one, the data
collected from the interviews was valuable.

45
Bo-Keum Choi and Jae-Woong Kim (2014) used multilevel models to examine
the influence of student characteristics and course level on SET. The researchers used
11,203 ratings from 343 general education courses that were taught in a private university
in Korea. The variables included were: student gender, academic year, major, faculty
gender, faculty status, faculty age, and course type. The SET questionnaire asked the
students to rate ten items using a 5-Likert scale. Choi and Kim found that about 96% of
the total variance was explained by student-level predictors. The results of the study
indicated that student major, gender, and student status were some of the influential
factors that influenced the SET scores. Male students tended to give identical response
patterns more than female students. Also, the results showed that as the academic year of
students increased, the identical response patterns increased. The results of this study
suggested that students’ characteristics are factors that affect the SET scores. Although
the study provided valuable information, it has different limitations. The first limitation is
that the participants of the study were only students taking general courses, which limit
the results. Also, the study had been conducted using a short 10-item questionnaire,
which the authors admitted needed to be improved and include more items because it
could affect the results.
Mohammad Alauddin and Temesgen Kifle (2014) explored the possible effect of
students’ opinions of the quality of the Teacher Evaluation (TEVAL) test. The
researchers used data that was collected from 10,223 SET forms for 25 economics
courses (18 were undergraduate level with five for level 1, six for level 2, seven for level
3, and seven postgraduate courses), 102 student cohorts, and 20 lecturers. Also, the
researchers reported that the data represented small and large classes. The researchers
46
aimed to identify the teaching qualities that were statistically significant and correlated to
the TEVAL score, and to examine if these qualities affected the TEVAL scores
differently in different levels of courses. The researchers used partial proportional odds
model. They found that intermediate level courses tended to get lower scores than
advanced-level courses. They also found that elective courses tended to get higher ratings
than required courses. A limitation of this study is that it did not include the age of the
students, gender, and academic school.
Narayanan et al. (2014) analyzed the differences of factors that were unrelated to
teaching that influenced the results of SET between business and engineering courses.
The researchers hypothesized that there were no relationships between course-level and
SET scores, and that elective courses would have higher SET scores as compared to
required courses. The data was collected from two different colleges and comprised 816
engineering courses and 167 business courses. Both colleges offered undergraduate,
masters, and doctoral degrees. The researchers used students’ responses from 3,938
individual course offerings in engineering and 2,487 individual course offerings in
business. The SET form that was used by the two colleges was different. The SET
survey that was used by the college of engineering had eight questions, while the SET
survey that was used by the college of business had 17. The researchers used principal
component factor analysis and found that the type of course (required vs. elective) did not
influence the SET scores of business courses but influenced the SET scores of
engineering courses. Engineering major students tended to score elective courses higher
than core courses. Also, while in engineering, the score of SET tended to increase as the

47
course level increased; in business, there was no significant difference reported because
the effect sizes for these variables were too small.
This study shows that course level and type are possible bias factors that need to
be considered during reviewing SET results. One limitation of this study was that the data
were analyzed and collected from only two colleges that represent one university. Further
research that considers including all or most of the university’s departments could help
generalize the results.
A recent study by Catherine Terry et al. (2017) examined the correlation between
the SET overall rating and SET items using their college of pharmacy evaluation survey.
The researchers reported that they tested the relation between eight predictor variables,
which are part of the SET survey and the SET overall rating. The results of the research
indicated that there was no significant effect of the course level in the relation between
the predictor variables and the SET overall rating. However, the researchers reported that
the course itself affected the relationship between the predictor variables and the SET
overall rating. They reported that different instructors used their own SET instruments
that emphasized specific SET dimensions, which affect the SET score. The researchers
concluded their article by emphasizing the need for much research in the area of the
relationship between the score of SET items and the SET overall rating.
The literature indicates that there are potential biases in SETs. The sources of bias
were found in student gender, student age, academic discipline, course type, and course
level. Also, the literature review indicated that there is lack of research that examines the
association between the SET individual dimensions and the SET overall rating. Such an
area needs to be addressed and explored in order to help reduce the gap in the literature.
48
Summary of Literature Review
Many studies reported that SET dimensions affect SET overall rating. The
literature review revealed that there are some specific SET dimensions that affect SET
overall rating. Feldman (2007) found that SET overall rating were influenced by six
dimensions: clarity and understandability of the course, teacher stimulation of interest,
teacher preparation and organization, the perceived outcome of impact of the instructor,
and meeting the objectives and student motivation. Coffman (1954) found that teacher
preparation and organization was the only influential dimension that affected SET overall
rating. Özgüngör & Duru (2015) also found that teacher preparation and organization was
an influential dimension in addition to good teaching and generic skills. His findings
were partially consistent with other research in which generic skills and good teaching
were found as influential dimensions (Grace et al., 2012). Yin et al. (2016) identified
generic skills and clarity as important dimensions.
Another research study reported that clear communication of the main points of
lectures, evaluations of the student work, and enthusiasm were important dimensions
(Diette & Kester, 2015). However, Daniela Feistauer and Tobias Richter (2017) found
that only student/teacher interaction had the most influence. These studies supported the
theory that SET dimensions affect SET overall rating; however, the results of these
studies were not consistent in which SET dimensions influence SET overall rating. While
some studies reported up to five influential dimensions (Diette & Kester, 2015; Feldman
2007; Grace et al., 2012), other studies reported only one dimension (Coffman, 1954;
Feistauer & Richter, 2017).

49
Research also found that the five course and student characteristics included in
this study’s conceptual framework, including student status, gender, class level, course
type, and academic school, were possible factors that influenced the SET scores. Several
studies supported the theory that gender is an important factor that affects SET. Multiple
studies indicated that female students tended to rate SET items higher than male students
(Abrami et al., 1982; Al-Issa & Sulieman, 2007; Kozub, 2010; Pounder, 2007;
Santhanam & Hicks, 2002; Narayanan, 2014; Shauki et al., 2009; Worthington, 2002).
Similarly, Bonitz (2011) found that female students tended to score SET higher than male
students when rating hypothetical instructors. Choi and Kim (2014) reported that male
students tended to mark SET items in identical response patterns, while female students
tended to critically judge each item before they responded. These two studies used
different methods from other studies regarding examining the effect of gender in the SET
score, which might affect their results. Some studies found a different pattern of findings.
Kozub (2010) reported that female and male students rated their instructors similarly in
some dimensions, while other research found there was no relationship between SET
score and gender (Brockx et al., 2011; Fah, Yin & Osman, 2011).
Some studies found that student status is one of the factors that affect SET scores.
Many studies found higher ratings associated with higher student status. Freshmen
(Stewart et al., 2007) or freshmen and sophomores (Al-Issa & Sulieman, 2007) tended to
rate lower than other students. Peterson et al. (2008) found seniors tended to rate their
professors significantly higher than sophomore or freshman. Additional research reported
that sophomore students rated lower than junior students (Fah, Yin & Osman, 2011;
Yeoh et al., 2012). A study reported that freshman and junior students tended to complete
50
SET higher than the sophomore and senior students (Macfadyen et al., 2016). Although
much research indicated relationships between student status and SET score, other
research indicated that there is no practical significant relationship between the two
variables. Timothy Sauer (2012) reported finding a small positive correlation between
student status and SET while others reported no significant difference between the SET
scores of older students and younger students. A few researchers reported that there was
no relationship between SET score and student status (Brockx et al., 2011; Dev &
Qayyum, 2017; Shauki et al., 2009).
Course level is another factor examined by research. Different studies found that
graduate courses tended to rate higher than undergraduate courses (Ali & Ajmi, 2013; Al-
Issa & Sulieman, 2007; Latif & Miles, 2013; Nargundkar & Shrikhande, 2012;
Whitworth et al., 2002). Similarly, Stewart et al. (2007) reported that undergraduate
students tended to rate higher-level courses higher than lower level courses. Another
study found that intermediate level courses tended to get lower scores than advanced-
level courses (Alauddin & Kifle, 2014). However, a recent study showed that there was
no significant effect of the course level in the relation between the predictor variables and
the SET overall rating (Terry et al., 2017).
Different studies reported that course type is considered an influential factor that
affects SET scores (Alauddin & Kifle, 2014; Choi & Kim, 2014; Darbyb, 2002;
Nargundkar & Shrikhande, 2012; Nasser & Hagtvet, 2006; Sauer, 2012).These studies
reported that elective courses tended to be rated higher than required courses. Other
research found that students who take elective courses were motivated to take the
courses. It is likely for this reason that they tended to rate their instructors higher than the
51
students who were required to take the courses (Ali & Al Ajmi, 2013; Nasser & Hagtvet,
2006). Peterson et al. (2008) found that students who took required courses tended to rate
their professors lower than students who took major required courses and elective
courses. Terry et al. (2017) reported that the course type affects the relationship between
the predictor variables and the SET overall rating. However, not all researchers found this
type of association. Brockx et al. (2011) found that course type did not affect the SET
score. Narayanan et al. (2014) found that course type (required vs. elective) did not have
an influence on SET scores of business courses but did influence the SET score of
engineering courses.
The reviewed studies showed that students from different academic schools
tended to rate differently. Some studies indicated that science courses tended to be rated
lower than courses from arts and humanities (Braskamp & Ory, 1994; Santhanam &
Hicks, 2002). Similarly, Braskamp & Ory (1994) found that students tended to rate
business higher than science, but lower than humanities and art. Kember and Leung
(2011) also found that humanities groups rated the intellectual capacity of the instructors
higher than other groups. These studies all agree that humanities courses tended to be
rated higher than other courses. However, Narayanan et al. (2014) found that the rating
scores for courses from different schools were influenced by the course type. They
reported that the type of course tended to have no influence on SET score of business
courses, but to influence the SET score of engineering courses. Inversely, Stewart et al.
(2007) found that there was no significant difference in the SET scores when considering
the student school.
52
Need for Further Study
Different studies have investigated SET dimensions that predict the SET overall
rating. However, the number of these studies is limited and the results were inconclusive.
There is a need for more research examining the SET dimensions that affect SET overall
rating in order to understand the dimensions that predict high scores. Some research
reported one dimension, other studies reported more. Researchers also examined how
gender, student academic status, course level, course type, and academic school affected
SET scores. However, the findings of reviewed studies suggested that not all research
agrees that all or one of the five course and student characteristics were correlated to SET
scores. Some researchers found some factors related to student and course characteristics
affected SET score, others did not report any correlation. Table 1 summarizes the
findings for thirty-four studies that have been conducted from 1954 to 2017. These
studies reported that one or more of the student and course characteristics, which were
gender, student academic status, course level, course type, and academic school,
influenced SET scores, which affected the reliability and validity of SET score (Ali &
Ajmi, 2013). Although all reviewed studies were conducted on different groups of
students, there were limitations in those studies. Some research examined the factors
within specific schools or courses, other research examined the factors with only
undergraduate students. A study that examines the effect of all possible factors could help
find new results.
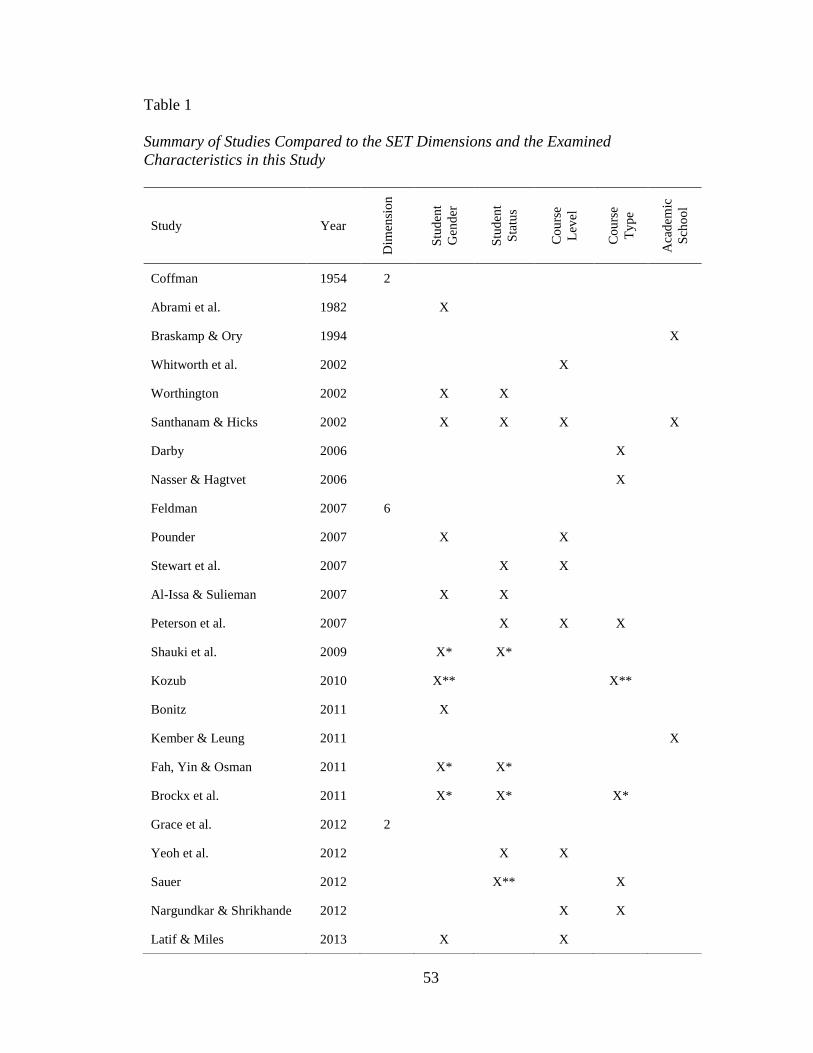
53
Table 1
Summary of Studies Compared to the SET Dimensions and the Examined
Characteristics in this Study
Study Year
Dim
ensi
on
Stu
den
t
Gen
der
Stu
den
t
Sta
tus
Co
urs
e
Lev
el
Co
urs
e
Ty
pe
Aca
dem
ic
Sch
oo
l
Coffman 1954 2
Abrami et al. 1982 X
Braskamp & Ory 1994 X
Whitworth et al. 2002 X
Worthington 2002 X X
Santhanam & Hicks 2002 X X X X
Darby 2006 X
Nasser & Hagtvet 2006 X
Feldman 2007 6
Pounder 2007 X X
Stewart et al. 2007 X X
Al-Issa & Sulieman 2007 X X
Peterson et al. 2007 X X X
Shauki et al. 2009 X* X*
Kozub 2010 X** X**
Bonitz 2011 X
Kember & Leung 2011 X
Fah, Yin & Osman 2011 X* X*
Brockx et al. 2011 X* X* X*
Grace et al. 2012 2
Yeoh et al. 2012 X X
Sauer 2012 X** X
Nargundkar & Shrikhande 2012 X X
Latif & Miles 2013 X X

54
Note: * = No Correlation. ** = Not Clear Correlation.
Table 1—Continued
Study Year
Dim
ensi
on
Stu
den
t
Gen
der
Stu
den
t
Sta
tus
Co
urs
e
Lev
el
Co
urs
e
Ty
pe
Aca
dem
ic
Sch
oo
l
Korte et al. 2013 X
Ali & Ajmi 2013 X X
Choi & Kim 2014 X X X X
Alauddin & Kifle 2014 X X
Narayanan 2014 X** X**
Özgüngör & Duru 2015 5
Diette & Kester 2015 3
Yin, Wang, & Kester 2016 2
Feistauer & Richter 2017 1
Terry et al. 2017 X* X**

55
CHAPTER 3
METHODOLOGY
Chapter 3 is divided into six sections, which are research design, population,
research hypothesis, variable definition, data collection, and a description of the data
analysis procedures that were used in this study.
The Research Questions
What type of ratings of SET dimensions and overall rating do students give for
the courses they take?
What SET dimensions are related to the score of SET overall rating?
Is there a significant correlation between SET dimensions and overall rating and
gender, student status (freshman, sophomore, junior, senior, graduate,
postgraduate), course type (general required, major elective, required major and
general elective), course level (undergraduate and graduate), and academic school
(arts and sciences, architecture, business administration, education, and health
professions)?
Research Design
This quantitative correlational study aims to understand the type of rating that
students give to the course that they take and to examine SET dimensions that might
predict the SET overall rating. Also, this study aims to understand the relationship

56
between SET dimensions and overall rating and gender, student academic status, course
type, course level, and academic school. Correlational design helps investigate the
positive or negative relationship between two or more variables (McMillan &
Schumacher, 2010). In this study, the SET dimensions were considered the independent
variables and the overall rating was considered the dependent variable for the second
research question. For the third research question, the independent variables were gender,
student status, course type, course level, and academic school and the dependent
variables were the SET dimensions and overall rating, which were called SET scores.
Sample
The researcher conducted the study at Andrews University. There were different
reasons for choosing this school. First, this university was composed of multiple colleges
and schools providing programs in a wide range of academic areas. Second, Andrews
University used one type of assessment to evaluate all courses. Third, the dimensions of
effective teaching in the Course Survey covered most of the important aspects of good
teaching that research found. Fourth, Andrews is a Christian university, which is a much
different type of institution than those studied before. Finally, this school was in an area
where the researcher could easily approach the Office of Institutional Effectiveness.
The data analysis was based on 3,745 responses completed in Fall 2017. The
participants who completed the responses were taking courses from one or more of the
following schools: Arts & Sciences, Architecture & Interior Design, Business
Administration, Education, and Health Professions; see Table 2.

57
Table 2
Schools and the Number of Responses for Each One
School Number of Responses
Arts & Sciences 2,388
Architecture & Interior Design 114
Business Administration 415
Education 160
Health Professions 664
The researcher used purposeful nonprobability sampling. The students were
chosen depending on their major and the courses that were offered. Only courses that
were on-campus traditional lectures were included. Other types of courses such as online,
lab, or seminar, were excluded from the study. Also, courses that were offered by
different programs at the School of Arts and Sciences, the School of Architecture &
Interior Design, the School of Business Administration, the School of Education, and the
School of Health Professions were included to the study. Other courses that were offered
for programs at the Seventh-day Adventist Theological Seminary were not included since
all reviewed studies did not provide any information regarding them.
Instrumentation
The researcher used Andrews University’s Course Survey (Course Survey, 2014)
as the main instrument for the study, see Appendix A. Andrew University’s Course
Survey is a questionnaire developed at Andrews University in 2013 by a group of
researchers, including the Office of Institutional Effectiveness, faculty from School of
Education, and others with expertise in teaching and research. It was established based on

58
Andrews University’s philosophy of Student Evaluations (Philosophy of Course
Evaluations, 2013). The Course Survey (Course Survey, 2014) instrument included four
sections. Only the results of three sections were used in this study. The results for the
fourth section, which is open-ended items, were not used in this study. The first part of
the Course Survey asks the student to evaluate the course characteristics by completing
the questionnaire using the five-point agreement Likert scale (strongly disagree, disagree,
neutral, agree, and strongly agree). The second part asks the students to evaluate the
instructor characteristics by completing the questionnaire using the five-point agreement
Likert scale similar to the first part. The third part of the instrument asks the students to
give their overall rating using a 5-point Likert scale (Excellent, very good, good, fair, and
poor) to answer the overall questions (see Appendix A).
The dimensions of the instrument, which were represented by items, were
developed based on IDEA teaching approaches (Benton & Cashin, 2012), the seven
principles of good practice (Chickering & Gamson, 1989), Feldman’s ratings study
(Feldman, 2007) and Andrews University goals based on Andrews University’s Mission
(Mission & Vision, n.d.), including communicate effectively, intellectual discovery and
inquiry, respect for diversity, faith and learning, and critical thinking. The IDEA teaching
approaches and Feldman’s Ratings study were used to define the instructional
dimensions. The seven principles of good teaching, which emphasize: student-faculty
contact, cooperation among students, active learning, prompt feedback, time on task, high
expectations, respect diverse talents, and ways of knowing were used also. The IDEA
teaching approaches emphasized stimulating student interest, fostering student
collaboration, establishing rapport, encouraging student involvement, and structuring the

59
classroom effectively (Benton & Cashin, 2012). Feldman (2007) found that effective
teaching related to dimensions such as clarity, stimulation of interest, meet the course
objectives, organization and planning, motivate students, and feedback. In this study, the
researcher used the classification of effective teaching based on Andrews University
goals and Feldman’s rating study. Andrews researchers interviewed faculty and students
to determine the important items that they would like to see on the instrument. After
selecting the items, the final version of the instrument was developed. The final version is
used now at Andrews University. See Appendix A for a copy of Andrews University
Course Survey (Course Survey, 2014). The Course Survey has been used since 2013, and
it was validated by the Office of Institutional Effectiveness.
SET Dimensions
In this study, SET dimensions means the areas of effective teaching that includes
dimensions based on Andrews University goals (based on Andrews University’s Mission
Statement) and the Feldman Rating Study. These dimensions emphasize: (a) effective
communication, (b) respect for diversity, (c) stimulating student interest, (d) intellectual
discovery and inquiry, (e) integrating faith and learning, (f) preparation and organization,
(g) critical thinking, (h) clarity of objectives, (i) availability and helpfulness, and (j)
evaluation and grading. Fourteen items included in the Course Survey operationalized
these variables; see Table 3. Some dimensions were measured by one item, other
dimensions were measured by more than one item.

60
Table 3
SET Dimensions (Variables), Conceptual Definition, Items, Source
Dimensions Conceptual
Definition
Items Source
Effective
Communication
Develop student
writing, thinking
and communication
skills.
1.1 This course helped me to express
my ideas more clearly
2.2 The instructor made the subject
clear and understandable
2.9 Timely, thoughtful, and helpful
feedback was provided on tests and
other work
Andrews
University
goals
Respect for
Diversity
Develop and
support diverse
community of
learners.
2.6 The instructor was sensitive to
and respectful of all people
Andrews
University
Goals
Stimulating
Student Interest
Engage the
students.
2.3 The instructor stimulated my
interest in the subject
Feldman’s
Principles
Intellectual
Discovery and
Inquiry
Develop creativity
of the student.
2.4 The instructor kept me involved
in the learning process
2.5 The instructor motivated me to
do my best work
Andrews
University
Goals
Integrating Faith
and Learning
Develop
framework of
Christian faith and
purpose.
2.8 The instructor helped me to
understand the course content from a
Christian perspective
Andrews
University
Goals
Preparation and
Organization
Instructor is
prepared and
organized the
course very well.
2.1 The instructor was well prepared
and organized
Feldman’s
Principles
Critical
Thinking
Develop critical
readers.
1.5 This course helped me to
critically evaluate different sources
and/or points of view
Andrews
University
Goals
Clarity of
Objectives
Provide clear
course objectives
and requirements.
1.2 The learning objectives or goals
for this course were clearly stated
Feldman’s
Principles
Availability and
Helpfulness
Instructor is
available and
helpful when
student need.
2.7 The instructor was available to
provide help when needed
Feldman’s
Principles
Evaluation and
Grading
Instructor uses
appropriate grading
system and
evaluation
methods.
1.3 The grading system of this course
was appropriate for the objectives of
the course
1.4 Methods of evaluation were fair
and accurate measures of my
learning
Feldman’s
Principles

61
SET Overall Rating
In this study the overall rating means the students overall opinions regarding the
level of learning, the course, and the instructor’s teaching effectiveness for the course that
they took. Three items from Course Survey represented student’s overall rating. These
items were (see Appendix A):
3.1 How would you describe your level of learning in this course.
3.2 Independent of the instructor, my overall rating of this course is.
3.3 Independent of the course, my overall rating of this instructor's teaching
effectiveness is.
Student Gender
In this study, student gender means whether the student was identified as a female
or male.
Student Status
Student status means the student academic level when they completed the survey.
Student status was grouped into freshman, sophomore, junior, senior, graduate, and
postgraduate. The postgraduate students were students who already gained their bachelor
degree and want to obtain a second bachelor degree.
Course Type
Course type was defined as the course that follows one of the four categories:
general required, general elective, major required, and major elective. General required
courses in this research are the courses that students at Andrews University are required
to take before starting a program or the general education courses that students are

62
required to take before graduation. General elective courses are the courses that students
can take outside of their field of study. Major required courses are the courses that each
program requires the students to take. Major elective courses are the courses that each
program offers related to the program and give the students the chance to choose which
course to take.
Course Level
In this study, the course level means the academic level of the course. The
undergraduate courses were 100s, 200s, 300s, and 400s; and graduate level courses 500s
and 600s.
Academic School
In this study, the academic school was defined as the area that the course was
related to. The courses that this study included were related to one of the following fields:
arts & sciences, architecture, business administration, education, and health professions.
See Appendix B for more information about the conceptual, instrumental and operational
definition for each variable.
Data Collection
Before obtaining the data from the Office of Institutional Effectiveness at
Andrews University, the researcher submitted the research proposal to the Institutional
Review Board (IRB) at Andrews University, see Appendix C, to get approval to conduct
the research. After obtaining IRB approval, the researcher contacted the Office of
Institutional Effectiveness at Andrews University and made appointments to meet with
the individuals who could provide the needed data. The researcher then worked with

63
these individuals to obtain the needed data with respect to the privacy of the subjects.
Before providing the researcher with the needed data, the information that could identify
the participants was removed. This information included the name of the participants and
their school ID number. Also, the researcher did not share the data, except with the
research methodology advisor. Additionally, the researcher kept the data in her private
laptop, which no one could access except her. Then, the researcher created a variable that
was called course type because the obtained data did not include it. The researcher used
student major and degree, which were parts of the received data, to help determine the
course type based on the program requirements and plans. The information regarding the
program requirements and plans was obtained from the academic bulletin for Andrews
University.
Data Analysis
The IBM Statistical Package for the Social Sciences (SPSS) 25 software was used
to run the data analyses. Descriptive Analysis was conducted to help analyze the
demographic characteristics of the participants and to answer the first research question.
To help answer the second research question, a Correlation Analysis was conducted to
understand the correlation between the variables and a Linear Regression was used to
identify possible SET dimensions that affect the SET overall rating. Linear Regression
analysis helps find the best predictors for criterion and “to produce a model in a form of
linear equation that identifies the best weighted linear combination of independent
variables in the study” (Meyers, Gamst & Guarino, 2013, p. 328).
Finally, Multivariate Analysis of Variance (MANOVA) was used to help find
statistically significant mean differences between groups, which helps answer the third

64
research question. Multivariate Analysis of Variance helps analyze a single independent
variable and more than one dependent variable with a low chance of Type I error (Meyers
et al., 2013, p. 227).

65
CHAPTER 4
RESULTS
Introduction
The purpose of this study was to examine the type of rating of SET dimensions
and overall rating that university students give when evaluating the courses that they take
and to identify possible SET dimensions that most affect the results of SET overall rating.
Specifically, it tests the association(s) of gender, student status, course type, course level,
academic school, with SET dimensions and overall rating. This chapter has three
sections. The first section presents the research questions that guided this study. The
second section discusses the sample characteristics. The third section presents the results
by research questions. The chapter ends with a summary of the major findings.
Research Questions
What type of ratings of SET dimensions and overall rating do students give for
the courses they take?
What SET dimensions are related to the score of SET overall rating?
Is there a significant correlation between SET dimensions and overall rating and
gender, student status (freshman, sophomore, junior, senior, graduate,
postgraduate), course type (general required, major elective, required major, and
general elective), course level (undergraduate and graduate), and academic school

66
(arts and sciences, architecture, business administration, education, and health
professions)?
Characteristics of Participants
Before running any data analysis, the researcher conducted data screening. The
exclusion criteria were: To remove all cases that had missing values. To keep only
traditional lecture type courses and remove all courses which were not lecture type,
including online, seminar, and workshop courses. To remove all cases that were
completed by students with undeclared majors. To remove courses that were offered by
honors programs. To remove courses that were not related to the academic schools that
the study examines. To remove all 700 and 800 level courses from the data.
The dataset in this study was developed from 3,745 cases completed by an
unknown number of respondents for one or more of 308 courses. The exact number of
students who completed these cases was not clear because the same student might have
completed the course survey multiple times depending on the courses that this student
enrolled in during Fall semester, 2017, when the data for this research was collected. The
courses that were included in this study were from the following schools: Arts and
Sciences, Architecture and Interior Design, Business Administration, Education, and
Health Professions.
Table 4 shows the demographic characteristics of the responses. The research
included responses that were completed by participants between the ages of 16-67. About
50% of the responses were completed by participants between the ages 19-21. 57.6% of
the responses were completed by female students. 45.4% of the responses were
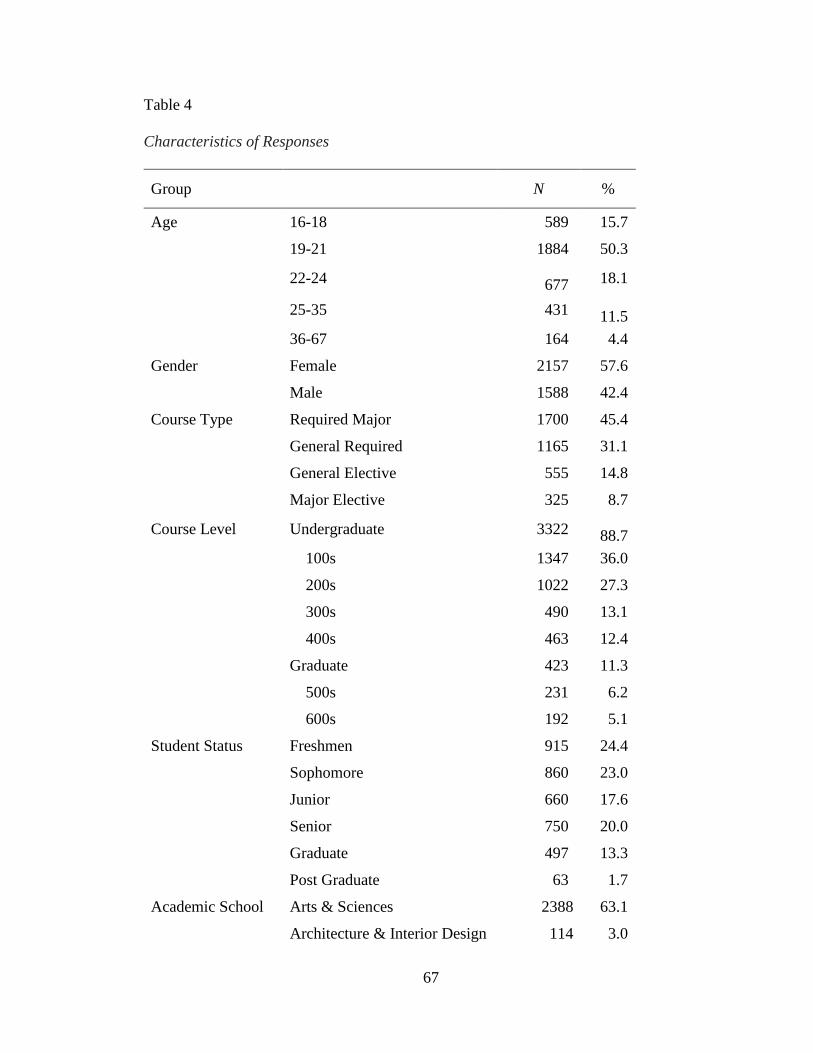
67
Table 4
Characteristics of Responses
Group N %
Age 16-18 589 15.7
19-21 1884 50.3
22-24 677 18.1
25-35 431 11.5
36-67 164 4.4
Gender Female 2157 57.6
Male 1588 42.4
Course Type Required Major 1700 45.4
General Required 1165 31.1
General Elective 555 14.8
Major Elective 325 8.7
Course Level Undergraduate 3322 88.7
100s 1347 36.0
200s 1022 27.3
300s 490 13.1
400s 463 12.4
Graduate 423 11.3
500s 231 6.2
600s 192 5.1
Student Status Freshmen 915 24.4
Sophomore 860 23.0
Junior 660 17.6
Senior 750 20.0
Graduate 497 13.3
Post Graduate 63 1.7
Academic School Arts & Sciences 2388 63.1
Architecture & Interior Design 114 3.0

68
Table 4—Continued
Group N %
Business Administration 415 11.1
Education 160 4.3
Health Professions 664 18.4
completed by students taking required major courses, 31.1% of the of the responses were
completed by participants taking general required courses, 14.8% of the responses were
completed by participants taking general elective courses, and 8.7% of the responses
were completed by students taking major elective courses. Also, 88.7% of the courses
were undergraduate and 11.3% were graduate courses. Additionally, 24.4% of the
responses were completed by participants who were freshmen, 23% who were
sophomores, 17.6% who were juniors, 20% who were seniors, 13.3% who were graduate
students, and 1.7% who were postgraduate students. Furthermore, about 63% of the
completed responses were obtained from students taking courses at the School of Arts &
Sciences.
Results by Research Question
Research Question 1
The first research question asked: What type of ratings of SET dimensions and
overall rating do students give for the courses they take? Before analyzing the data to
help answer this research question, the researcher tested the assumptions of normality.
The researcher found that the skew value for the included SET variables (the ten SET
dimensions and overall rating questions) ranged -.62 to -1.7 (see Table 5). The results
showed that all of the ratings were negatively skewed. This could be explained by the fact
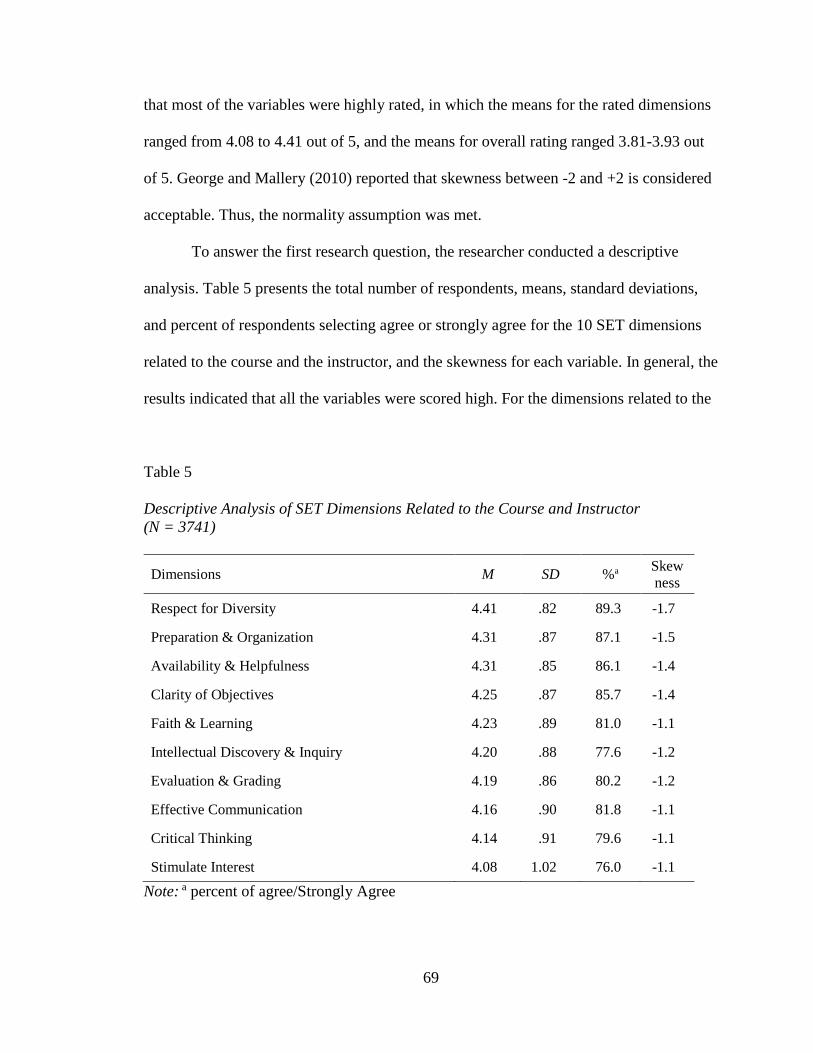
69
that most of the variables were highly rated, in which the means for the rated dimensions
ranged from 4.08 to 4.41 out of 5, and the means for overall rating ranged 3.81-3.93 out
of 5. George and Mallery (2010) reported that skewness between -2 and +2 is considered
acceptable. Thus, the normality assumption was met.
To answer the first research question, the researcher conducted a descriptive
analysis. Table 5 presents the total number of respondents, means, standard deviations,
and percent of respondents selecting agree or strongly agree for the 10 SET dimensions
related to the course and the instructor, and the skewness for each variable. In general, the
results indicated that all the variables were scored high. For the dimensions related to the
Table 5
Descriptive Analysis of SET Dimensions Related to the Course and Instructor
(N = 3741)
Dimensions M SD %a Skew
ness
Respect for Diversity 4.41 .82 89.3 -1.7
Preparation & Organization 4.31 .87 87.1 -1.5
Availability & Helpfulness 4.31 .85 86.1 -1.4
Clarity of Objectives 4.25 .87 85.7 -1.4
Faith & Learning 4.23 .89 81.0 -1.1
Intellectual Discovery & Inquiry 4.20 .88 77.6 -1.2
Evaluation & Grading 4.19 .86 80.2 -1.2
Effective Communication 4.16 .90 81.8 -1.1
Critical Thinking 4.14 .91 79.6 -1.1
Stimulate Interest 4.08 1.02 76.0 -1.1
Note: a percent of agree/Strongly Agree
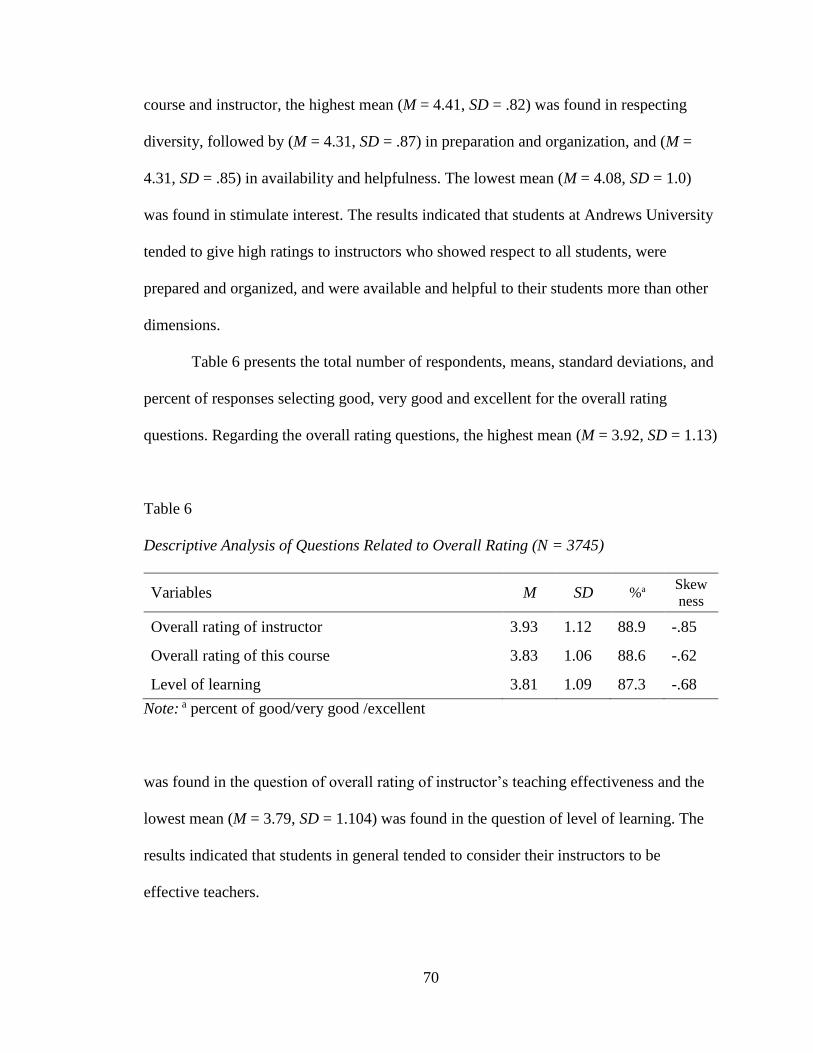
70
course and instructor, the highest mean (M = 4.41, SD = .82) was found in respecting
diversity, followed by (M = 4.31, SD = .87) in preparation and organization, and (M =
4.31, SD = .85) in availability and helpfulness. The lowest mean (M = 4.08, SD = 1.0)
was found in stimulate interest. The results indicated that students at Andrews University
tended to give high ratings to instructors who showed respect to all students, were
prepared and organized, and were available and helpful to their students more than other
dimensions.
Table 6 presents the total number of respondents, means, standard deviations, and
percent of responses selecting good, very good and excellent for the overall rating
questions. Regarding the overall rating questions, the highest mean (M = 3.92, SD = 1.13)
Table 6
Descriptive Analysis of Questions Related to Overall Rating (N = 3745)
Variables M SD %a Skew
ness
Overall rating of instructor 3.93 1.12 88.9 -.85
Overall rating of this course 3.83 1.06 88.6 -.62
Level of learning 3.81 1.09 87.3 -.68
Note: a percent of good/very good /excellent
was found in the question of overall rating of instructor’s teaching effectiveness and the
lowest mean (M = 3.79, SD = 1.104) was found in the question of level of learning. The
results indicated that students in general tended to consider their instructors to be
effective teachers.

71
Research Question 2
The second research question was: What SET dimensions are related to SET
overall rating? Before analyzing the data to answer this question, the researcher examined
the linearity, homoscedasticity and the multicollinearity assumptions. To test linearity,
the researcher used the results of the bivariate correlation test and the scatterplots. The
results indicated that the variables had moderate correlation, which suggested the
relationship between independent and dependent variables was linear. Also, the
scatterplot indicated positive correlation among the variables. To test homoscedasticity,
the researcher plotted the standardized residual against the predicted score. The plot
showed that variance around the regression line is almost the same for all values of the
predictors, which were the dimensions. The plot showed approximately rectangular
shape, which suggested that the homoscedasticity assumption was met.
To test the multicollinearity assumptions, the researcher observed the results of
the Collinearity statistics. The results showed that the tolerance ranges between .209 and
.494, and the variance inflation factor (VIF) ranged between 2.0 and 4.8. Meyers et al.
(2013) state that “a low tolerance value indicates that there are strong relationships
between the predictors” (p. 364). Also, Watson (2015) reported that a good value for VIF
is less than 10. Since the results for the tolerance (between .209 and .494) was less than 1,
and for VIF (between 2.0 and 4.8) less than 10, the multicollinearity assumption was met.
In order to understand which SET dimensions predict SET overall rating, a
bivariate correlation analysis was conducted between all variables. The correlation matrix
showed that the variable level of learning was highly correlated to overall rating of course
(.817), and the overall rating of instructor’s teaching effectiveness (.811). Since the three
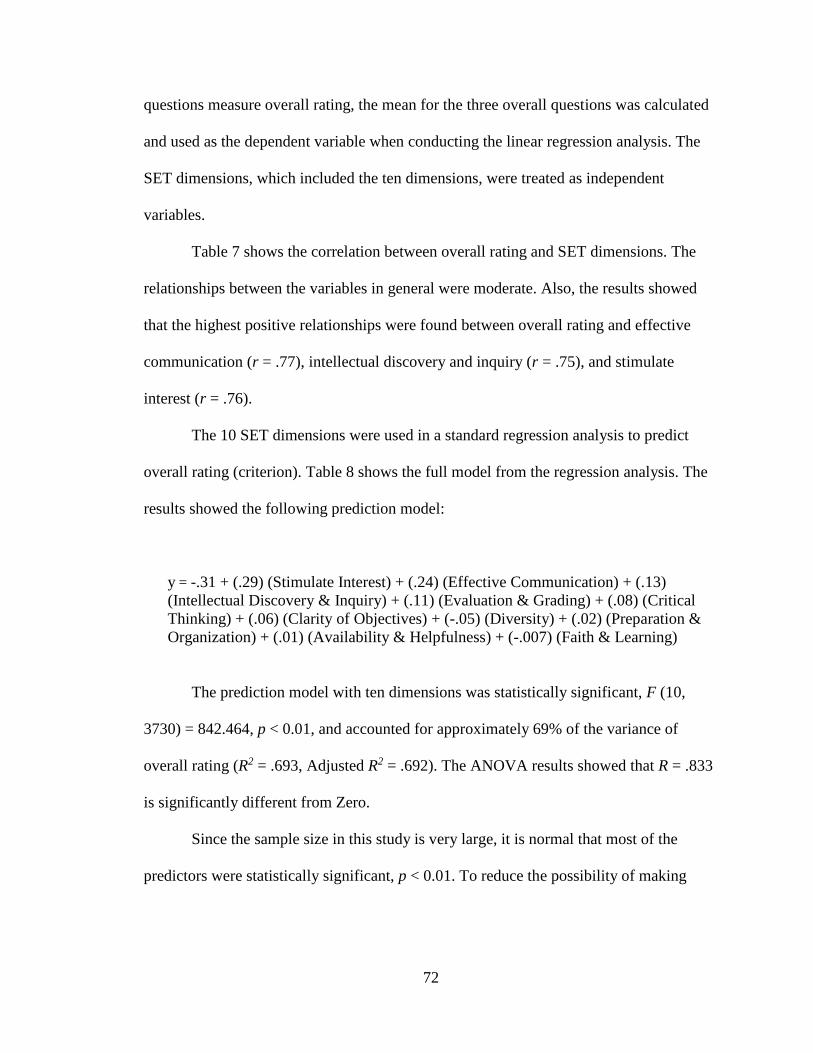
72
questions measure overall rating, the mean for the three overall questions was calculated
and used as the dependent variable when conducting the linear regression analysis. The
SET dimensions, which included the ten dimensions, were treated as independent
variables.
Table 7 shows the correlation between overall rating and SET dimensions. The
relationships between the variables in general were moderate. Also, the results showed
that the highest positive relationships were found between overall rating and effective
communication (r = .77), intellectual discovery and inquiry (r = .75), and stimulate
interest (r = .76).
The 10 SET dimensions were used in a standard regression analysis to predict
overall rating (criterion). Table 8 shows the full model from the regression analysis. The
results showed the following prediction model:
y = -.31 + (.29) (Stimulate Interest) + (.24) (Effective Communication) + (.13)
(Intellectual Discovery & Inquiry) + (.11) (Evaluation & Grading) + (.08) (Critical
Thinking) + (.06) (Clarity of Objectives) + (-.05) (Diversity) + (.02) (Preparation &
Organization) + (.01) (Availability & Helpfulness) + (-.007) (Faith & Learning)
The prediction model with ten dimensions was statistically significant, F (10,
3730) = 842.464, p < 0.01, and accounted for approximately 69% of the variance of
overall rating (R2 = .693, Adjusted R2 = .692). The ANOVA results showed that R = .833
is significantly different from Zero.
Since the sample size in this study is very large, it is normal that most of the
predictors were statistically significant, p < 0.01. To reduce the possibility of making

73
Table 7
Correlations Between Overall Rating and SET Dimensions
Pearson r
Variables
Eff
ecti
ve
Co
mm
un
icat
ion
Inte
llec
tual
Dis
cov
ery
&
Inqu
iry
Ev
alu
atio
n &
Gra
din
g
Fai
th &
Lea
rnin
g
Cri
tica
l
Th
ink
ing
Div
ersi
ty
Cla
rity
of
Ob
ject
ives
Pre
par
atio
n &
Org
aniz
atio
n
Sti
mu
late
Inte
rest
Av
aila
bil
ity
&
Hel
pfu
lnes
s
Overall –Score .77 .75 .69 .56 .68 .57 .66 .64 .76 .61
Effective Communication .81 .75 .64 .73 .67 .72 .73 .78 .71
Intellectual Discovery & Inquiry .73 .63 .69 .70 .70 .71 .81 .72
Evaluation & Grading .56 .71 .64 .74 .65 .66 .64
Faith & Learning .59 .58 .56 .58 .59 .60
Critical Thinking .58 .67 .61 .69 .57
Respect for Diversity .60 .60 .61 .68
Clarity of Objectives .67 .63 .62
Preparation & Organization .65 .66
Stimulate Interest .61
Availability & Helpfulness
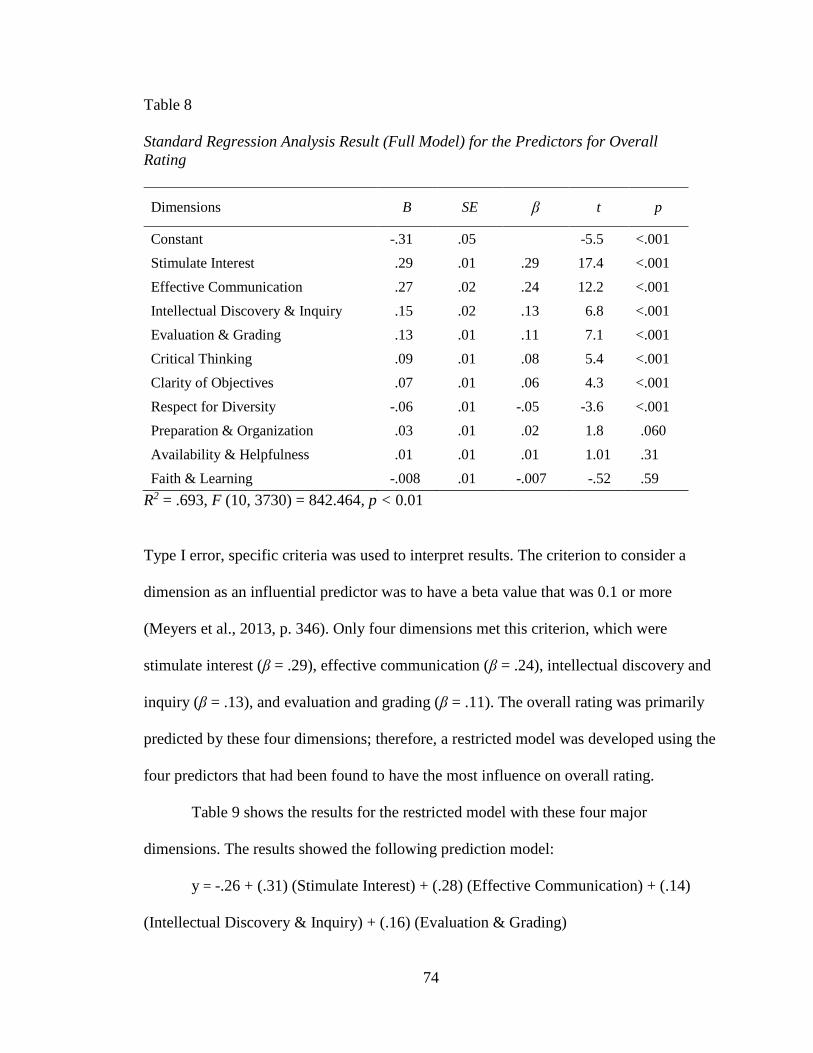
74
Table 8
Standard Regression Analysis Result (Full Model) for the Predictors for Overall
Rating
Dimensions B SE β t p
Constant -.31 .05 -5.5 <.001
Stimulate Interest .29 .01 .29 17.4 <.001
Effective Communication .27 .02 .24 12.2 <.001
Intellectual Discovery & Inquiry .15 .02 .13 6.8 <.001
Evaluation & Grading .13 .01 .11 7.1 <.001
Critical Thinking .09 .01 .08 5.4 <.001
Clarity of Objectives .07 .01 .06 4.3 <.001
Respect for Diversity -.06 .01 -.05 -3.6 <.001
Preparation & Organization .03 .01 .02 1.8 .060
Availability & Helpfulness .01 .01 .01 1.01 .31
Faith & Learning -.008 .01 -.007 -.52 .59
R2 = .693, F (10, 3730) = 842.464, p < 0.01
Type I error, specific criteria was used to interpret results. The criterion to consider a
dimension as an influential predictor was to have a beta value that was 0.1 or more
(Meyers et al., 2013, p. 346). Only four dimensions met this criterion, which were
stimulate interest (β = .29), effective communication (β = .24), intellectual discovery and
inquiry (β = .13), and evaluation and grading (β = .11). The overall rating was primarily
predicted by these four dimensions; therefore, a restricted model was developed using the
four predictors that had been found to have the most influence on overall rating.
Table 9 shows the results for the restricted model with these four major
dimensions. The results showed the following prediction model:
y = -.26 + (.31) (Stimulate Interest) + (.28) (Effective Communication) + (.14)
(Intellectual Discovery & Inquiry) + (.16) (Evaluation & Grading)

75
Table 9
Standard Regression Analysis Result (Restricted Model with Major Predictors)
Dimensions B SE β t p
Constant -.26 .04 -5.3 <.001
Stimulate Interest .31 .01 .31 18.6 <.001
Effective Communication .31 .02 .28 15.5 <.001
Intellectual Discovery & Inquiry .17 .02 .14 8.00 <.001
Evaluation & Grading .19 .01 .16 11.1 <.001
R2 = .69, F (4, 3740) = 2049.770, p < 0.01
The prediction model with four dimensions was statistically significant, F (4, 3740) =
2049.770, p < 0.01, and accounted for approximately 69% of the variance of overall
rating (R2 = .69, Adjusted R2 = .69). The ANOVA results showed that R = .829 is
significantly different from Zero.
The results showed that stimulate interest (β = .31) received the strongest weight
in the model followed by effective communication (β = .28). Both intellectual discovery
and inquiry (β = .14) and evaluation and grading (β = .16) had less weight in the model.
The results indicated that stimulate interest and effective communication the relatively
strongest indicators of the overall rating. Intellectual discovery and inquiry and
evaluation and grading were very strong indicators of the overall rating. Students who
rated stimulate interest, effective communication, intellectual discovery and inquiry, and
evaluation and grading highly, tended to rate overall rating highly too.
Table 10 shows the two developed models and the values for r squares. This table
helps demonstrate that a full model with all SET dimensions (R2 = .69) explained 69% of
the variance in overall rating.

76
Table 10
Standardized Coefficients in Two Models and the Value of R2
Dimensions Standard Model Restricted Model
Stimulate Interest .29 .31
Effective Communication .24 .28
Intellectual Discovery & Inquiry .13 .14
Evaluation & Grading .11 .16
Critical Thinking .08
Clarity of Objectives .06
Respect for Diversity -.05
Preparation & Organization .02
Availability & Helpfulness .01
Faith & Learning -.007
R2 .69 .69
F 842.46 2049.7
Df 10, 3730 4, 3740
p <.001 <.001
A restricted model with four dimensions (R2 = .69) explained 69% of the variance
in the overall rating. Therefore, the restricted model with four dimensions was considered
the best model that predicted the overall rating. The results showed that the overall rating
for SET can be explained by four dimensions of course and instructor characteristics,
which were stimulate student interest, effective communication, intellectual discovery
and inquiry, and evaluation and grading.
Research Question 3
The third research question was: Is there a significant correlation between SET
dimensions and overall rating and gender, student status (freshman, sophomore, junior,

77
senior, graduate, postgraduate), course type (general required, major elective, required
major and general elective), course level (undergraduate and graduate), and academic
school (arts & sciences, architecture, business administration, education, and health
professions)? In order to answer this question, MANOVA was used to analyze the data.
The independent variables that were used in MANOVA analysis were: Gender,
student status, course level, course type and academic school. The thirteen dependent
variables included the three overall questions and the 10 dimensions. The overall
questions were related to the rating of level of learning, the overall rating of a course, and
the overall rating of the instructor’s teaching effectiveness. The 10 dimensions that were
included were: respect for diversity, preparation and organization, availability and
helpfulness, clarity of objectives, faith and learning, intellectual discovery and inquiry,
evaluation and grading, effective communication, critical thinking, and stimulate interest.
The researchers conducted Five MANOVA analyses in order to understand the
correlation between the gender, student status, course type, course level and academic
school and SET scores. The criteria that was applied during the data analysis was: p value
should be equal or less than .01 to be considered statistically significant (Department of
Statistics Online Program, 2018), the alpha value for Phillai’s Trace should be equal or
less than .01 to be considered statistically significant (Department of Statistics Online
Program, 2018), the value of Eta square should be equal or more than .015 to be
considered weak (Meyers et al., 2013, p.147) and to be able to examine the pairwise
comparisons test for group differences.
78
Gender and SET Score
Before examining the correlation between gender and SET score, the test of
normality and homogeneity of variance assumption was conducted. The skew value for
the variables ranged between -.57 and -.17 is considered a normal distributed sample.
Based on the criterion, which was used in question one, skewness between -2 and +2 was
considered an acceptable normal distribution, thus, the normality assumption was met.
The results of Box’s test of equality of covariance M = 219.009, F (91, 36693978.1) =
2.398, p < 0.01, indicated that all SET variables were not equal across gender. Since there
were statistically significant results from Box’s test of equality of covariance, the results
of Pillai’s Trace were examined. Pillai’s Trace = .005, F (13, 3727) = 1.461, p = .124.
The F value was not statistically significant p < 0.01. Since the p value was not
significant, this indicated that there were no statistical gender differences on the linear
combination of SET dimensions and overall questions. No further analysis was
conducted. The results showed that gender had no influence on SET score. Both male and
female students tended to rate all dimensions and overall questions similarly.
Table 11 shows the number, mean and the standard deviation for each variable
based on gender. The highest means were found in respect for diversity, female (M =
4.42) and male (M =4.41), and in availability and helpfulness, female (M = 4.32) and
male (M = 4.31).
Student Status and SET Score
In this study, student status included freshmen, sophomore, junior, senior,
graduate, and postgraduate. Before examining the correlation between student status and
SET score, the test of normality and homogeneity of variance assumption was conducted.
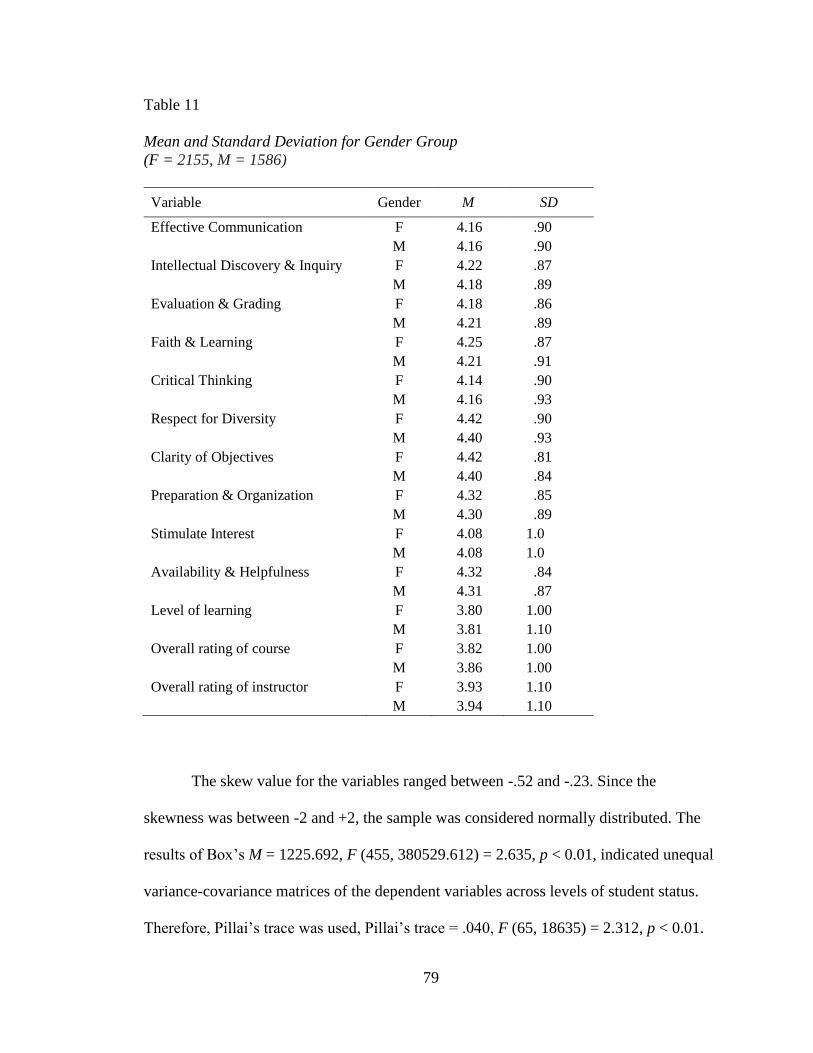
79
Table 11
Mean and Standard Deviation for Gender Group
(F = 2155, M = 1586)
Variable Gender M SD
Effective Communication F 4.16 .90
M 4.16 .90
Intellectual Discovery & Inquiry F 4.22 .87
M 4.18 .89
Evaluation & Grading F 4.18 .86
M 4.21 .89
Faith & Learning F 4.25 .87
M 4.21 .91
Critical Thinking F 4.14 .90
M 4.16 .93
Respect for Diversity F 4.42 .90
M 4.40 .93
Clarity of Objectives F 4.42 .81
M 4.40 .84
Preparation & Organization F 4.32 .85
M 4.30 .89
Stimulate Interest F 4.08 1.0
M 4.08 1.0
Availability & Helpfulness F 4.32 .84
M 4.31 .87
Level of learning F 3.80 1.00
M 3.81 1.10
Overall rating of course F 3.82 1.00
M 3.86 1.00
Overall rating of instructor F 3.93 1.10
M 3.94 1.10
The skew value for the variables ranged between -.52 and -.23. Since the
skewness was between -2 and +2, the sample was considered normally distributed. The
results of Box’s M = 1225.692, F (455, 380529.612) = 2.635, p < 0.01, indicated unequal
variance-covariance matrices of the dependent variables across levels of student status.
Therefore, Pillai’s trace was used, Pillai’s trace = .040, F (65, 18635) = 2.312, p < 0.01.
80
This result suggests that the linear combination of the SET dimensions may be
significantly different for at least two groups of students based on their academic status.
Table 12 shows the number, mean, and the standard deviation for different student
status groups regarding SET variables. The results show that the highest mean was found
among the postgraduate group (M = 4.79) when they rated respect for diversity. The
lowest mean was found among the freshman group (M = 3.63) when they rated level of
learning. The results indicated that postgraduate students tended to rate respect for
diversity higher than other students.
Table 13 shows the results of the univariate ANOVA. At p < .01, there are
significant group differences in all thirteen dependent variables (the 10 SET dimensions
and the three overall rating questions). For the purpose of this study, group differences
were considered significant only if the differences can explain at least 2 percent of the
variance of the dependent variable, using a weak effect size (η2 = .02) as the criterion
(Meyers et al., 2013, p. 147). The highest η2 was found in the dimensions stimulate
interest F (5, 3735) = 12.4, p < 0.01, η2 = .016, and critical thinking F (5, 3735) = 9.91, p
< 0.01, η2 = .016. These η2 values were considered weak. However, since the eta square
was over .015, which can be rounded to .02, for these two dimensions, the researcher
examined the results for the Pairwise Comparisons test to understand the significant
differences between the groups of student status.
Table 14 shows the results of Pairwise Comparisons for the examined two
dimensions: stimulate interest and critical thinking. The results showed that there were
significant statistical differences among the six groups regarding these two dimensions.
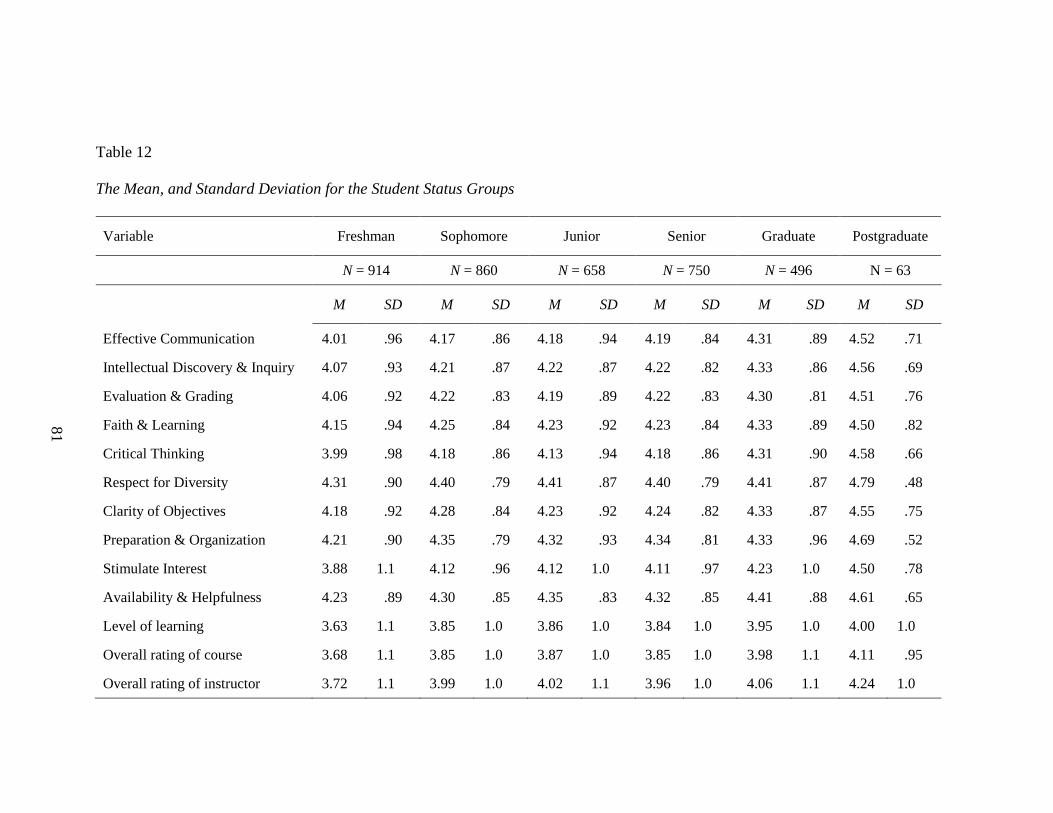
81
Table 12
The Mean, and Standard Deviation for the Student Status Groups
Variable Freshman Sophomore Junior Senior Graduate Postgraduate
N = 914 N = 860 N = 658 N = 750 N = 496 N = 63
M SD M SD M SD M SD M SD M SD
Effective Communication 4.01 .96 4.17 .86 4.18 .94 4.19 .84 4.31 .89 4.52 .71
Intellectual Discovery & Inquiry 4.07 .93 4.21 .87 4.22 .87 4.22 .82 4.33 .86 4.56 .69
Evaluation & Grading 4.06 .92 4.22 .83 4.19 .89 4.22 .83 4.30 .81 4.51 .76
Faith & Learning 4.15 .94 4.25 .84 4.23 .92 4.23 .84 4.33 .89 4.50 .82
Critical Thinking 3.99 .98 4.18 .86 4.13 .94 4.18 .86 4.31 .90 4.58 .66
Respect for Diversity 4.31 .90 4.40 .79 4.41 .87 4.40 .79 4.41 .87 4.79 .48
Clarity of Objectives 4.18 .92 4.28 .84 4.23 .92 4.24 .82 4.33 .87 4.55 .75
Preparation & Organization 4.21 .90 4.35 .79 4.32 .93 4.34 .81 4.33 .96 4.69 .52
Stimulate Interest 3.88 1.1 4.12 .96 4.12 1.0 4.11 .97 4.23 1.0 4.50 .78
Availability & Helpfulness 4.23 .89 4.30 .85 4.35 .83 4.32 .85 4.41 .88 4.61 .65
Level of learning 3.63 1.1 3.85 1.0 3.86 1.0 3.84 1.0 3.95 1.0 4.00 1.0
Overall rating of course 3.68 1.1 3.85 1.0 3.87 1.0 3.85 1.0 3.98 1.1 4.11 .95
Overall rating of instructor 3.72 1.1 3.99 1.0 4.02 1.1 3.96 1.0 4.06 1.1 4.24 1.0

82
Table 13
Between-Subject (Student Status) Effects
Variable SS df MS F P η2
Stimulate Interest Between 62.4 5 12.48 12.03 <.001 .016
Error 3874.8 3735 1.00 Total 3937.3 3740 Critical Thinking Between 49.5 5 9.91 11.88 <.001 .016
Error 3114.0 3735 .83 Total 3163.5 3740 Effective Communication Between 39.9 5 7.99 9.83 <.001 .013
Error 3035.2 3735 .81 Total 3075.2 3740 Overall rating of
instructor Between 62.1 5 12.43 9.93 <.001 .013
Error 4676.7 3735 1.20 Total 4738.9 3740 Intellectual Discovery &
Inquiry Between 33.6 5 6.72 8.73 <.001 .012
Error 2875.6 3735 .77 Total 2909.2 3740 Respect for Diversity Between 31.8 5 6.91 9.39 <.001 .012
Error 2530.1 3735 .67 Total 2561.9 3740 Evaluation & Grading Between 29.9 5 5.99 8.02 <.001 .011
Error 2789.8 3735 .74 Total 2819.7 3740 Level of learning Between 47.5 5 9.50 7.96 <.001 .011
Error 4455.2 3735 1.10 Total 4502.8 3740 Overall rating of course Between 37.9 5 7.59 6.77 <.001 .009
Error 4190.5 3735 1.10 Total 4228.5 3740 Preparation &
Organization Between 21.0 5 4.20 5.52 <.001 .007
Error 2846.0 3735 .76 Total 2867.0 3740 Availability &
Helpfulness Between 16.6 5 3.33 4.56 <.001 .006
Error 2730.9 3735 .73 Total 2747.6 3740 Faith & Learning Between 15.0 5 3.00 3.77 .002 .005
Error 2975.3 3735 .79 Total 2990.3 3740 Clarity of Objectives Between 14.0 5 2.80 3.63 .003 .005
Error 2877.1 3735 .77 Total 2891.1 3740
Box’s M = 1225.692, F (455, 380529.612) = 2.635, p < 0.01
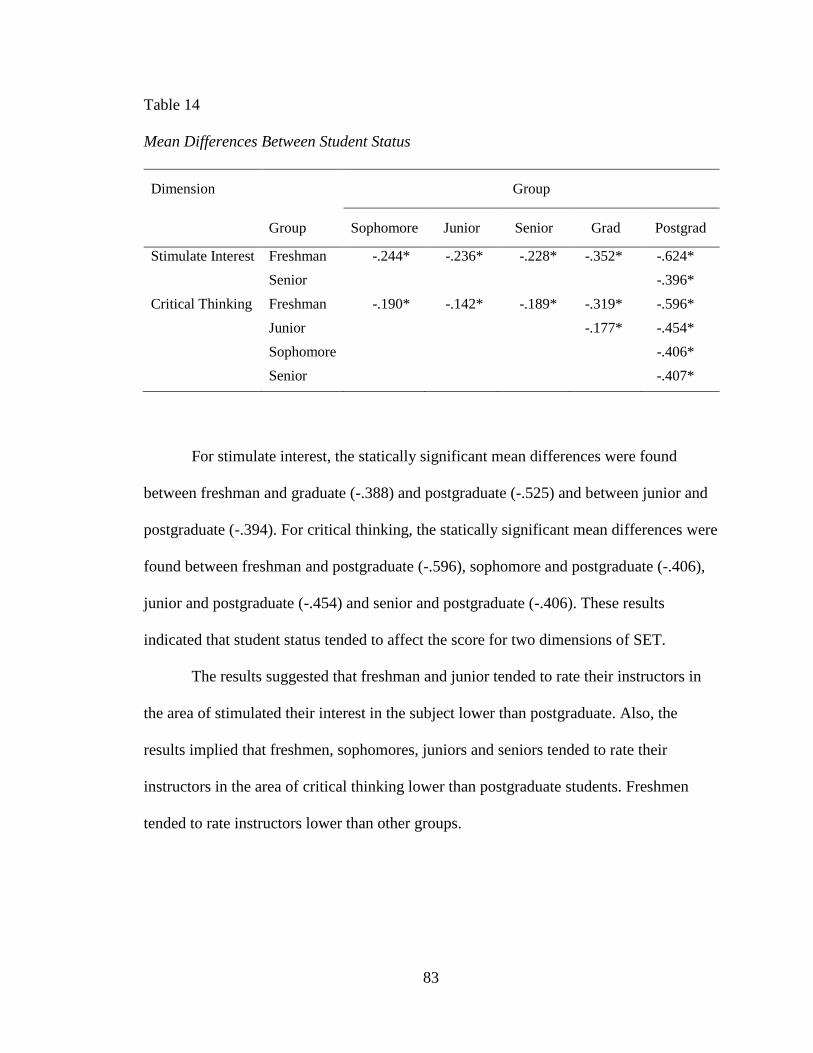
83
Table 14
Mean Differences Between Student Status
Dimension Group
Group Sophomore Junior Senior Grad Postgrad
Stimulate Interest Freshman -.244* -.236* -.228* -.352* -.624*
Senior -.396*
Critical Thinking Freshman -.190* -.142* -.189* -.319* -.596*
Junior -.177* -.454*
Sophomore -.406*
Senior -.407*
For stimulate interest, the statically significant mean differences were found
between freshman and graduate (-.388) and postgraduate (-.525) and between junior and
postgraduate (-.394). For critical thinking, the statically significant mean differences were
found between freshman and postgraduate (-.596), sophomore and postgraduate (-.406),
junior and postgraduate (-.454) and senior and postgraduate (-.406). These results
indicated that student status tended to affect the score for two dimensions of SET.
The results suggested that freshman and junior tended to rate their instructors in
the area of stimulated their interest in the subject lower than postgraduate. Also, the
results implied that freshmen, sophomores, juniors and seniors tended to rate their
instructors in the area of critical thinking lower than postgraduate students. Freshmen
tended to rate instructors lower than other groups.

84
Course Type and SET Score
In this study, course type included general required, major elective, required
major, and general elective courses. Before examining the correlation between course
type and SET score, the test of normality and homogeneity of variance assumption was
conducted. The skew value for the variables ranged between -.51 and -1.8 and was
considered an acceptable normal distribute. Since the Skewness was between -2 and +2,
the sample was considered normally distributed. The results from the Box’s Test of
Equality of Covariance Matrices show that there was a statistically significant Box’s M =
698.105, F (273, 4918243.60) = 2.534, p < 0.01, which indicated unequal variance-
covariance matrices of the dependent variables across the course types. As a result,
Pillai’s trace was used. Pillai’s trace = .035, F (39, 11181.0) = 3.379, p < 0.01.
Table 15 shows the number, mean, and standard deviation for different course
types regarding each SET variable. The results show that the highest mean was found in
general elective (M = 4.44) and major elective (M = 4.44) when they rated respect for
diversity. The lowest mean was found among the group general required (M = 3.73) when
they rated availability and helpfulness. The results indicated that students who took
general or major elective courses tended to rate their instructors in the area of respecting
diversity higher than other SET dimensions.
Table 16 shows the results for univariate ANOVA. At p < .01, there are
significant group differences in stimulate interest, intellectual discovery and inquiry, level
of learning, overall rating of instructor, and overall rating of course. Group differences
are considered significant only if the differences can explain at least 2 percent of the
variance of the dependent variable, using a weak effect size (η2 = .02) as the criterion

85
Table 15
The Mean and Standard Deviation for the Course Type Groups
Variable
General
Required
N = 1162
Major
Elective
N = 325
Required
Major
N = 1698
General
Elective
N = 554
M SD M SD M SD M SD
Effective Communication 4.12 .92 4.23 .83 4.15 .93 4.24 .81
Intellectual Discovery & Inquiry 4.10 .93 4.33 .78 4.20 .88 4.32 .78
Evaluation & Grading 4.15 .89 4.26 .87 4.19 .86 4.25 .79
Faith & Learning 4.20 .94 4.20 .85 4.26 .88 4.26 .83
Critical Thinking 4.07 .95 4.19 .92 4.18 .91 4.18 .84
Respect for Diversity 4.36 .86 4.44 .78 4.43 .81 4.44 .79
Clarity of Objectives 4.22 .90 4.26 .92 4.25 .87 4.29 .87
Preparation & Organization 4.32 .85 4.35 .87 4.29 .90 4.34 .81
Stimulate Interest 3.95 1.0 4.22 .97 4.09 1.0 4.22 .94
Availability & Helpfulness 4.28 .87 4.41 .76 4.31 .88 4.34 .79
Level of learning 3.73 1.0 3.96 1.0 3.78 1.1 3.97 1.0
Overall rating of course 3.74 1.0 3.93 1.0 3.83 1.0 4.00 .96
Overall rating of instructor 3.88 1.1 4.06 1.0 3.90 1.1 4.08 1.1
(Meyers et al., 2013, p. 147). Group differences were considered significant only if the
differences can explain at least 2 percent of the variance of the dependent variable, using
a weak effect size (η2 = .02) as the criterion (Meyers et al., 2013, p. 147). The highest eta
square was found in stimulate interest F (3, 3737) = 11.5, p < 0.01, η2 = .009. Since the
highest η2 value that was less than .015, no further data analysis was conducted. The
results found regarding the correlation between SET score and course type were not
considered practically significant. There was no correlation between SET score and
course type.

86
Table 16
Between-Subjects (Course Type) Effects
Variable SS df MS F p η2
Stimulate Interest Between 36.1 3 12.0 11.5 <.001 .009
Error 3901.1 3737 1.0
Total 3937.3 3740
Intellectual
Discovery &
Inquiry
Between 24.2 3 8.07 10.46 <.001 .008
Error 2885.0 3737 .77
Total 2909.2 3740
Level of learning Between 29.7 3 9.90 8.27 <.001 .007
Error 4473.0 3737 1.1
Total 4502.8 3740
Overall rating of
course Between 27.9 3 9.33 8.30 <.001 .007
Error 4200.5 3737 1.1
Total 4228.5 3740
Overall rating of
instructor Between 22.2 3 7.42 5.88 .001 .005
Error 4716.6 3737 1.2
Total 4738.9 3740
Critical Thinking Between 8.3 3 2.79 3.79 .019 .003
Error 3155.1 3737 .84
Total 3163.5 3740
Availability &
Helpfulness Between 4.9 3 1.60 2.18 .088 .002
Error 2742.8 3737 .73
Total 2747.6 3740
Effective
Communication Between 7.4 3 2.50 3.04 .028 .002
Error 3067.7 3737 .82
Total 3075.2 3740
Evaluation &
Grading Between 5.5 3 1.84 2.44 .062 .002
Error 2814.2 3737 .75
Total 2819.7 3740
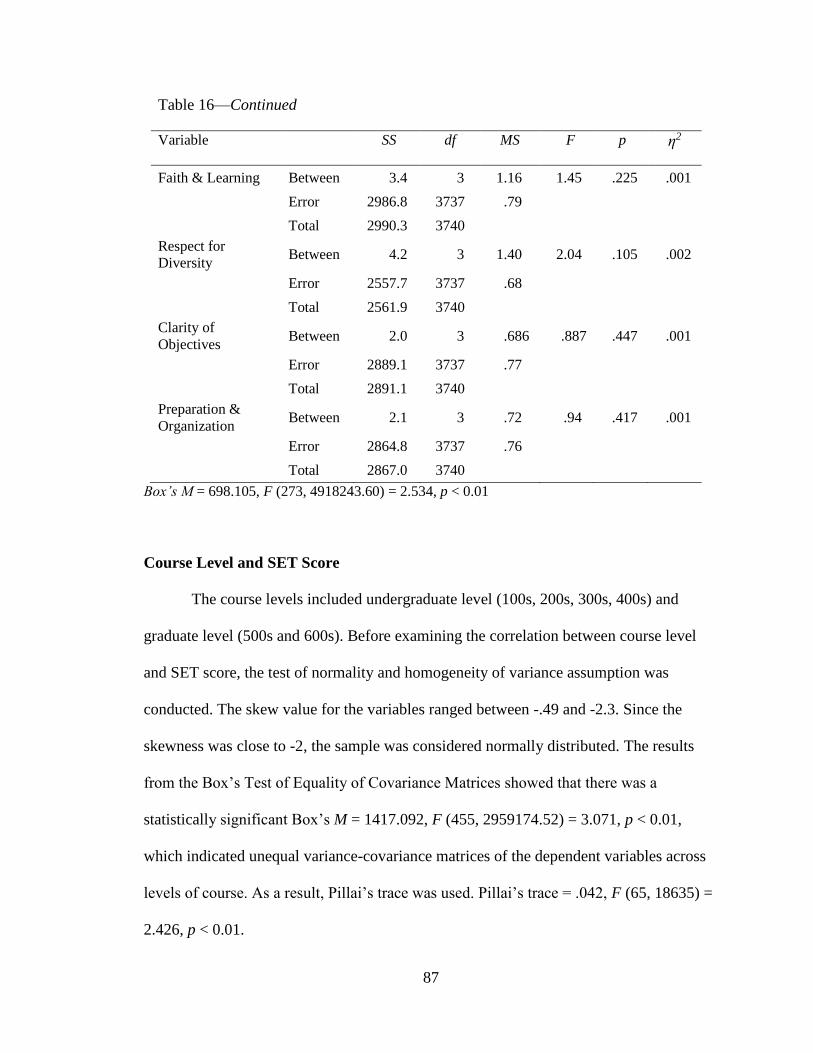
87
Table 16—Continued
Variable SS df MS F p η2
Faith & Learning Between 3.4 3 1.16 1.45 .225 .001
Error 2986.8 3737 .79
Total 2990.3 3740
Respect for
Diversity Between 4.2 3 1.40 2.04 .105 .002
Error 2557.7 3737 .68
Total 2561.9 3740
Clarity of
Objectives Between 2.0 3 .686 .887 .447 .001
Error 2889.1 3737 .77
Total 2891.1 3740
Preparation &
Organization Between 2.1 3 .72 .94 .417 .001
Error 2864.8 3737 .76
Total 2867.0 3740
Box’s M = 698.105, F (273, 4918243.60) = 2.534, p < 0.01
Course Level and SET Score
The course levels included undergraduate level (100s, 200s, 300s, 400s) and
graduate level (500s and 600s). Before examining the correlation between course level
and SET score, the test of normality and homogeneity of variance assumption was
conducted. The skew value for the variables ranged between -.49 and -2.3. Since the
skewness was close to -2, the sample was considered normally distributed. The results
from the Box’s Test of Equality of Covariance Matrices showed that there was a
statistically significant Box’s M = 1417.092, F (455, 2959174.52) = 3.071, p < 0.01,
which indicated unequal variance-covariance matrices of the dependent variables across
levels of course. As a result, Pillai’s trace was used. Pillai’s trace = .042, F (65, 18635) =
2.426, p < 0.01.

88
Table 17 shows the number, mean, and the standard deviation for different course
levels regarding each SET variables. The results showed that the highest mean was found
among the group level 600s (M = 4.58) when rating respect for diversity. The lowest
mean was found among the group level 100s (M = 3.72) when they rated level of
learning. The results indicated that students who took 600s level courses tended to rate
respect for diversity higher than other students.
Table 18 shows the result univariate ANOVA. At p < .01, there were significant
group differences in all dependent variables, except for clarity of objectives and
preparation and organization. The highest eta squares were found in stimulate interest F
(5, 3735) = 11.1, p < 0.01, η2 = .015. The highest η2 value (η2 = .015) was considered
weak. However, since it was equal to .015, which can be rounded to .02, Pairwise
Comparisons test was conducted to understand the significant differences between the
groups.
Table 19 shows the result for the Pairwise Comparison test. The results showed
that there were statistically significant differences among the five groups regarding the
dimension of stimulate interest. The significant statically mean difference was between
the 100s and the 600s level courses (-.299). This result indicated that course level
affected the SET score. The 100s courses tended to be rated lower than the 600s level
courses in stimulate interest.
Academic School and SET Score
Academic school in this study included: (1) arts and sciences, (2) architecture, (3)
business administration, (4) education and (5) health professions. Before examining the
correlation between academic school and SET score, the test of normality and
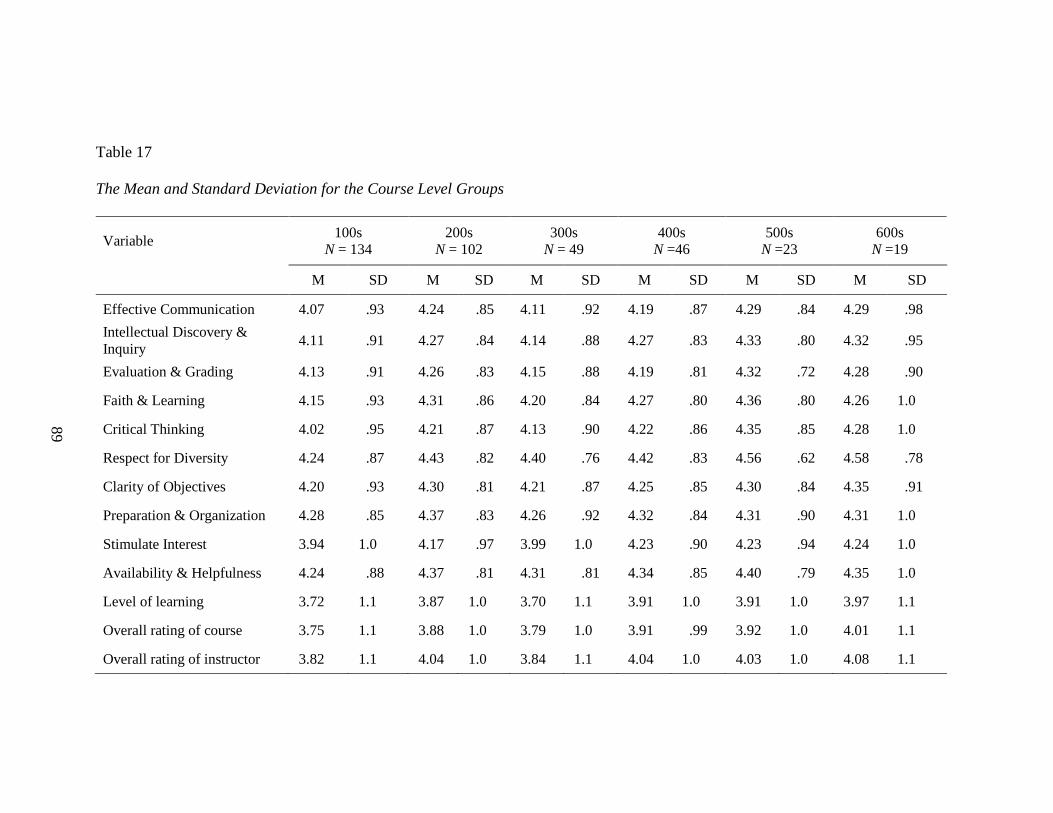
89
89
sad
Table 17
The Mean and Standard Deviation for the Course Level Groups
Variable 100s
N = 134
200s
N = 102
300s
N = 49
400s
N =46
500s
N =23
600s
N =19
M SD M SD M SD M SD M SD M SD
Effective Communication 4.07 .93 4.24 .85 4.11 .92 4.19 .87 4.29 .84 4.29 .98
Intellectual Discovery &
Inquiry 4.11 .91 4.27 .84 4.14 .88 4.27 .83 4.33 .80 4.32 .95
Evaluation & Grading 4.13 .91 4.26 .83 4.15 .88 4.19 .81 4.32 .72 4.28 .90
Faith & Learning 4.15 .93 4.31 .86 4.20 .84 4.27 .80 4.36 .80 4.26 1.0
Critical Thinking 4.02 .95 4.21 .87 4.13 .90 4.22 .86 4.35 .85 4.28 1.0
Respect for Diversity 4.24 .87 4.43 .82 4.40 .76 4.42 .83 4.56 .62 4.58 .78
Clarity of Objectives 4.20 .93 4.30 .81 4.21 .87 4.25 .85 4.30 .84 4.35 .91
Preparation & Organization 4.28 .85 4.37 .83 4.26 .92 4.32 .84 4.31 .90 4.31 1.0
Stimulate Interest 3.94 1.0 4.17 .97 3.99 1.0 4.23 .90 4.23 .94 4.24 1.0
Availability & Helpfulness 4.24 .88 4.37 .81 4.31 .81 4.34 .85 4.40 .79 4.35 1.0
Level of learning 3.72 1.1 3.87 1.0 3.70 1.1 3.91 1.0 3.91 1.0 3.97 1.1
Overall rating of course 3.75 1.1 3.88 1.0 3.79 1.0 3.91 .99 3.92 1.0 4.01 1.1
Overall rating of instructor 3.82 1.1 4.04 1.0 3.84 1.1 4.04 1.0 4.03 1.0 4.08 1.1
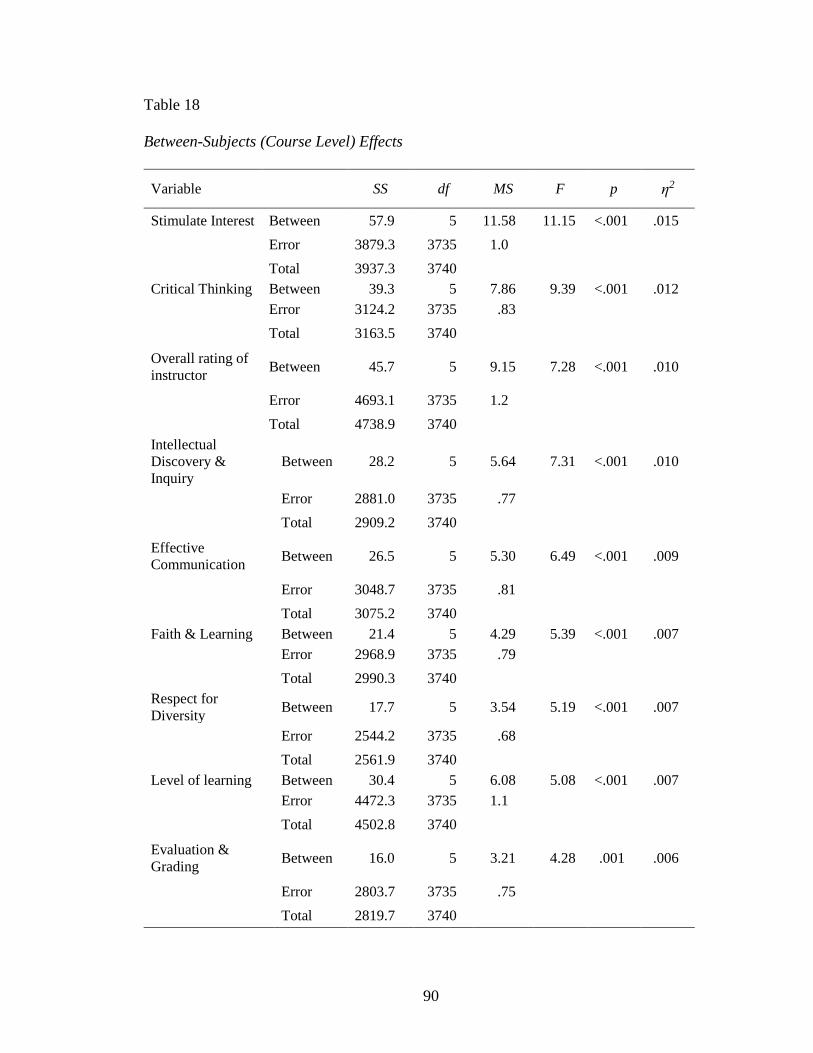
90
90
Table 18
Between-Subjects (Course Level) Effects
Variable SS df MS F p η2
Stimulate Interest Between 57.9 5 11.58 11.15 <.001 .015
Error 3879.3 3735 1.0
Total 3937.3 3740
Critical Thinking Between 39.3 5 7.86 9.39 <.001 .012
Error 3124.2 3735 .83
Total 3163.5 3740
Overall rating of
instructor Between 45.7 5 9.15 7.28 <.001 .010
Error 4693.1 3735 1.2
Total 4738.9 3740
Intellectual
Discovery &
Inquiry
Between 28.2 5 5.64 7.31 <.001 .010
Error 2881.0 3735 .77
Total 2909.2 3740
Effective
Communication Between 26.5 5 5.30 6.49 <.001 .009
Error 3048.7 3735 .81
Total 3075.2 3740
Faith & Learning Between 21.4 5 4.29 5.39 <.001 .007
Error 2968.9 3735 .79
Total 2990.3 3740
Respect for
Diversity Between 17.7 5 3.54 5.19 <.001 .007
Error 2544.2 3735 .68
Total 2561.9 3740
Level of learning Between 30.4 5 6.08 5.08 <.001 .007
Error 4472.3 3735 1.1
Total 4502.8 3740
Evaluation &
Grading Between 16.0 5 3.21 4.28 .001 .006
Error 2803.7 3735 .75
Total 2819.7 3740

91
sad
Table 18—Continued
Variable SS df MS F p η2
Overall rating of
course
Between 23.0 5 4.60 4.08 .001 .005
Error 4205.5 3735 1.1
Total 4228.5 3740
Availability &
Helpfulness Between 12.35 5 2.47 3.37 .005 .004
Error 2735.2 3735 .73
Total 2747.6 3740
Clarity of
Objectives Between 8.8 5 1.76 2.28 .044 .003
Error 2882.3 3735 .77
Total 2891.1 3740
Preparation &
Organization Between 6.37 5 1.27 1.66 .140 .002
Error 2860.6 3735 .76
Total 2867.3 3740
Box’s M = 1417.092, F (455, 2959174.52) = 3.071, p < 0.01
Table 19
Mean Differences Between Course Level
Group
Dimension Group 200s 300s 400s 500s 600s
Stimulate Interest 100s -.227* -.288* -.287* -.299*
200s .176*
300s -.237*

92
sad
homogeneity of variance assumption was conducted. The skewness value for all variables
ranged between -.48 and -2.0 is considered acceptable normal distribution. Since the
Skewness was between -2 and + 2, the sample was considered normally distributed. The
results from the Box’s Test of Equality of Covariance Matrices showed that there was a
statistically significant Box’s M = 1383.934, F (364, 757260.951) = 3.718, p < 0.01,
which indicated unequal variance-covariance matrices of the dependent variables
across levels of course type. As a result, Pillai’s trace was used. Pillai’s trace = .047, F
(52, 14908) = 3.430, p < 0.01.
Table 20 shows the number, mean, and the standard deviation for different
academic school groups. The results showed that the highest mean was found among
group (2) architecture (M = 4.56) when they responded to respect for diversity. The
lowest mean was found among the group (3) business administration (M = 3.66) when
they responded to the question of level of learning. The results indicated that students
from the School of Architecture and Interior Design tended to rate instructors who
showed respect for diversity higher than students from other schools.
Table 21 shows the result of univariate ANOVA. At p < .01, there are significant
group differences in all dependent variables, except for clarity of objectives and
preparation and organization. The highest eta square was found in the dimension of
stimulate interest F (4, 3736) = 8.06, p <0.01, η2 = .009. Since the highest η2 value is
considered too weak (Meyers et al., 2013, p. 147), the results regarding the correlation
between SET scores and academic school were not considered practically significant. The
academic school had no effect on SET score.

93
Table 20
The Mean and Standard Deviation for the Academic School Groups
Variable 1*
(N = 2388)
2*
(N =114)
3*
(N = 415)
4*
(N = 160)
5*
(N = 664)
M SD M SD M SD M SD M SD
Effective Communication 4.13 .92 4.16 .84 4.05 .95 4.22 .99 4.30 .77
Intellectual Discovery & Inquiry 4.17 .90 4.23 .78 4.08 .92 4.28 .92 4.36 .72
Evaluation & Grading 4.16 .90 4.20 .77 4.14 .90 4.24 .85 4.35 .70
Faith & Learning 4.23 .91 4.14 .97 4.14 .92 4.13 1.0 4.34 .75
Critical Thinking 4.14 .93 4.27 .83 4.02 .94 4.21 1.0 4.22 .80
Respect for Diversity 4.38 .87 4.56 .71 4.32 .82 4.51 .78 4.51 .63
Clarity of Objectives 4.25 .90 4.25 .88 4.10 .94 4.32 .87 4.34 .73
Preparation & Organization 4.32 .87 4.34 .81 4.23 .91 4.20 1.1 4.36 .78
Stimulate Interest 4.05 1.0 4.18 .89 3.93 1.0 4.15 1.0 4.26 .88
Availability & Helpfulness 4.30 .87 4.50 .61 4.26 .89 4.20 1.0 4.39 .71
Level of learning 3.77 1.1 3.85 1.0 3.66 1.1 3.91 1.1 4.00 .97
Overall rating of course 3.80 1.0 3.82 .97 3.76 1.0 3.81 1.0 4.01 .95
Overall rating of instructor 3.91 1.1 3.96 1.0 3.77 1.1 3.95 1.2 4.11 .99
Note: 1* = arts and sciences, 2* = architecture, 3* = business administration, 4* = education, 5* =health professions
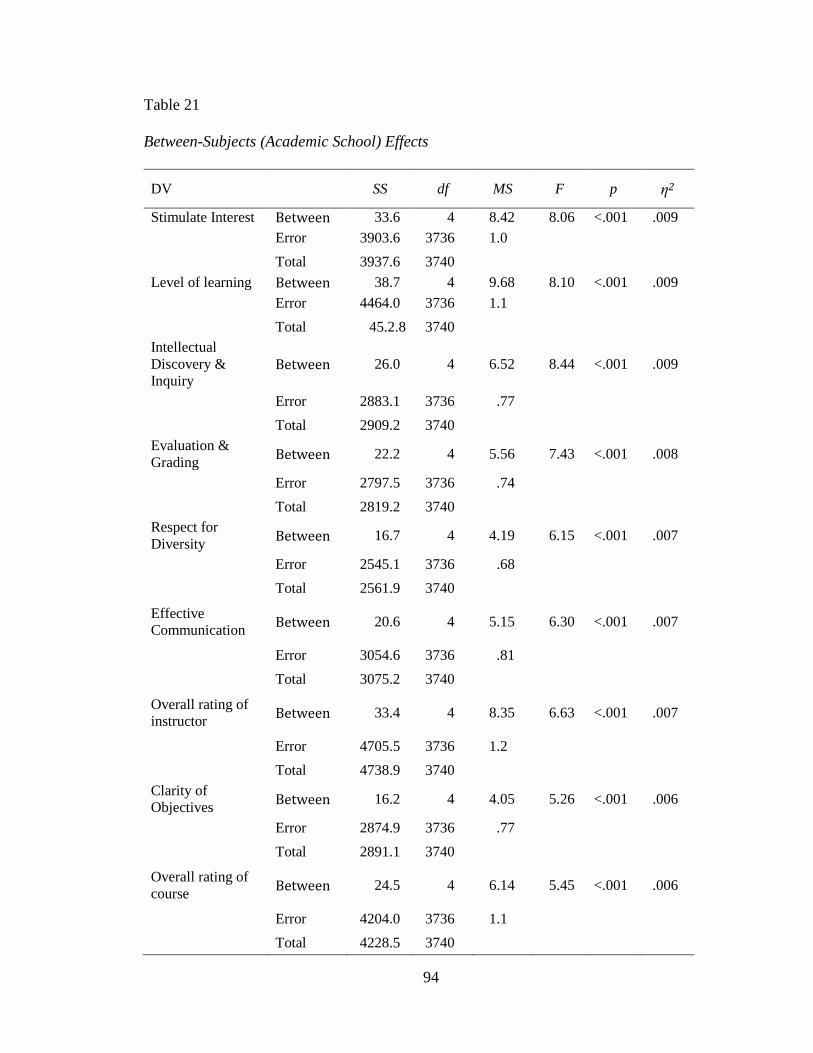
94
Table 21
Between-Subjects (Academic School) Effects
DV SS df MS F p η2
Stimulate Interest Between 33.6 4 8.42 8.06 <.001 .009
Error 3903.6 3736 1.0
Total 3937.6 3740
Level of learning Between 38.7 4 9.68 8.10 <.001 .009
Error 4464.0 3736 1.1
Total 45.2.8 3740
Intellectual
Discovery &
Inquiry Between 26.0 4 6.52 8.44 <.001 .009
Error 2883.1 3736 .77
Total 2909.2 3740
Evaluation &
Grading Between 22.2 4 5.56 7.43 <.001 .008
Error 2797.5 3736 .74
Total 2819.2 3740
Respect for
Diversity Between 16.7 4 4.19 6.15 <.001 .007
Error 2545.1 3736 .68
Total 2561.9 3740
Effective
Communication Between 20.6 4 5.15 6.30 <.001 .007
Error 3054.6 3736 .81
Total 3075.2 3740
Overall rating of
instructor Between 33.4 4 8.35 6.63 <.001 .007
Error 4705.5 3736 1.2
Total 4738.9 3740
Clarity of
Objectives Between 16.2 4 4.05 5.26 <.001 .006
Error 2874.9 3736 .77
Total 2891.1 3740
Overall rating of
course Between 24.5 4 6.14 5.45 <.001 .006
Error 4204.0 3736 1.1
Total 4228.5 3740
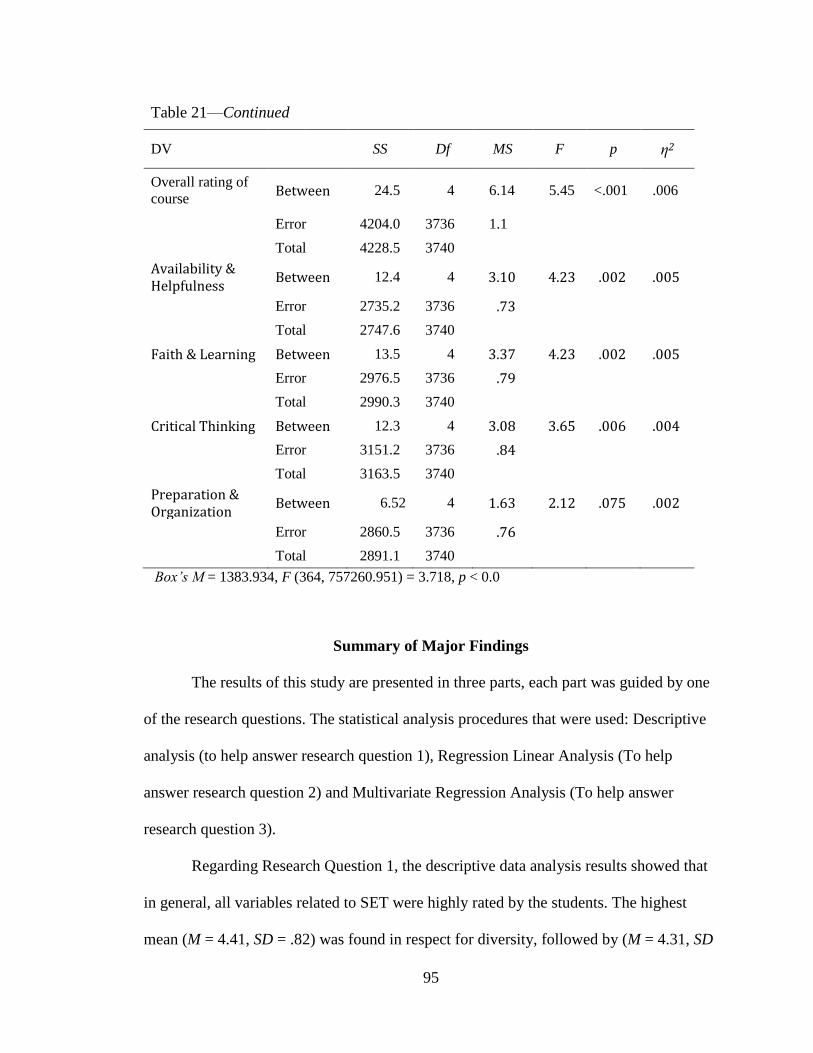
95
Table 21—Continued
DV SS Df MS F p η2
Overall rating of
course Between 24.5 4 6.14 5.45 <.001 .006
Error 4204.0 3736 1.1
Total 4228.5 3740
Availability & Helpfulness
Between 12.4 4 3.10 4.23 .002 .005
Error 2735.2 3736 .73
Total 2747.6 3740
Faith & Learning Between 13.5 4 3.37 4.23 .002 .005
Error 2976.5 3736 .79
Total 2990.3 3740
Critical Thinking Between 12.3 4 3.08 3.65 .006 .004
Error 3151.2 3736 .84
Total 3163.5 3740
Preparation & Organization
Between 6.52 4 1.63 2.12 .075 .002
Error 2860.5 3736 .76
Total 2891.1 3740
Box’s M = 1383.934, F (364, 757260.951) = 3.718, p < 0.0
Summary of Major Findings
The results of this study are presented in three parts, each part was guided by one
of the research questions. The statistical analysis procedures that were used: Descriptive
analysis (to help answer research question 1), Regression Linear Analysis (To help
answer research question 2) and Multivariate Regression Analysis (To help answer
research question 3).
Regarding Research Question 1, the descriptive data analysis results showed that
in general, all variables related to SET were highly rated by the students. The highest
mean (M = 4.41, SD = .82) was found in respect for diversity, followed by (M = 4.31, SD

96
= .87) in preparation and organization, and (M = 4.31, SD = .85) in availability and
helpfulness; refer to Table 5. The results indicated that students tended to rate showed
respect to all students, were prepared and organized, and were available and helpful
higher than other SET dimensions or the overall ratings. This indicated that students
tended to value specific dimensions of effective teaching that were related to instructor
characteristics more than other course and instructor characteristics.
Regarding research question 2, the results indicated that four dimensions had the
largest contribution to the regression than other predictors. Two models were developed,
first the full model included ten SET dimensions (R2 = .69), and then a restricted model
with four dimensions (R2 = .69); refer to Table 10. The best model was found in the
restricted model with four dimensions because it has only four predictors that explained
the variation in overall ratings compared to the model with ten predictors. The predictors
the researcher found that had the most influence on the scores of overall rating were
stimulate interest (β = .31), effective communication (β = .28), intellectual discovery and
inquiry (β = .14), and evaluation and grading (β = .11); refer to Table 10. The results
showed that the SET overall rating can be explained by these four dimensions. In other
words, students who rated stimulate interest, effective communication, intellectual
discovery and inquiry, and evaluation and grading highly, tended to rate overall rating
highly too.
Regarding research question 3, the results showed that all factors except gender
showed statistically significant correlations with SET scores; refer to Table 11. For the
correlation between student status and SET scores, the highest eta squares (η2 = .016)
were found in stimulate interest and critical thinking; refer to Table 13. For stimulate

97
interest, there was a statistically significant mean difference between freshmen and
graduate students (-.38) and postgraduate students (-.52), and between juniors and
postgraduate students (-.39). For critical thinking, the statistically significant mean
differences were found between freshman and postgraduate (-.59), sophomore (-.406),
junior (-.45) and seniors (-.40); refer to Table 14. The results suggested that student status
affected the SET score. Stimulate interest and critical thinking dimensions had significant
group differences. The research found that postgraduate students tended to rate
instructors who stimulated their interest in the subject higher than freshman and juniors.
Freshman, sophomores, juniors and seniors tended to rate critical thinking lower than
postgraduate students.
For the correlation between course type and SET score, the highest eta square was
found in stimulate interest (η2 = .009) refer to Table 16. No correlation was found; course
type did not influence SET score. For the correlation between course level and SET
score, the highest eta square was found in stimulate interest (η2 = .015), refer to Table 18.
The statistically significant mean differences were between the100s and 600s level
courses (-.29), 400s (-.28), and 500s (-.28); refer to Table 19. Course level affected the
SET score in which students who took 100s courses tended to rate stimulate interest
lower than students who took 400s, 500s, and 600s level courses. Students who took 100s
level courses rated their instructors stimulated their interest in the subject lower than
students who takes higher level courses.
For the correlation between academic school and SET score, the highest eta
squared (η2 = .009) was found in stimulate interest, level of learning, and intellectual
discovery and inquiry. However, the eta squared suggested too weak correlations to have
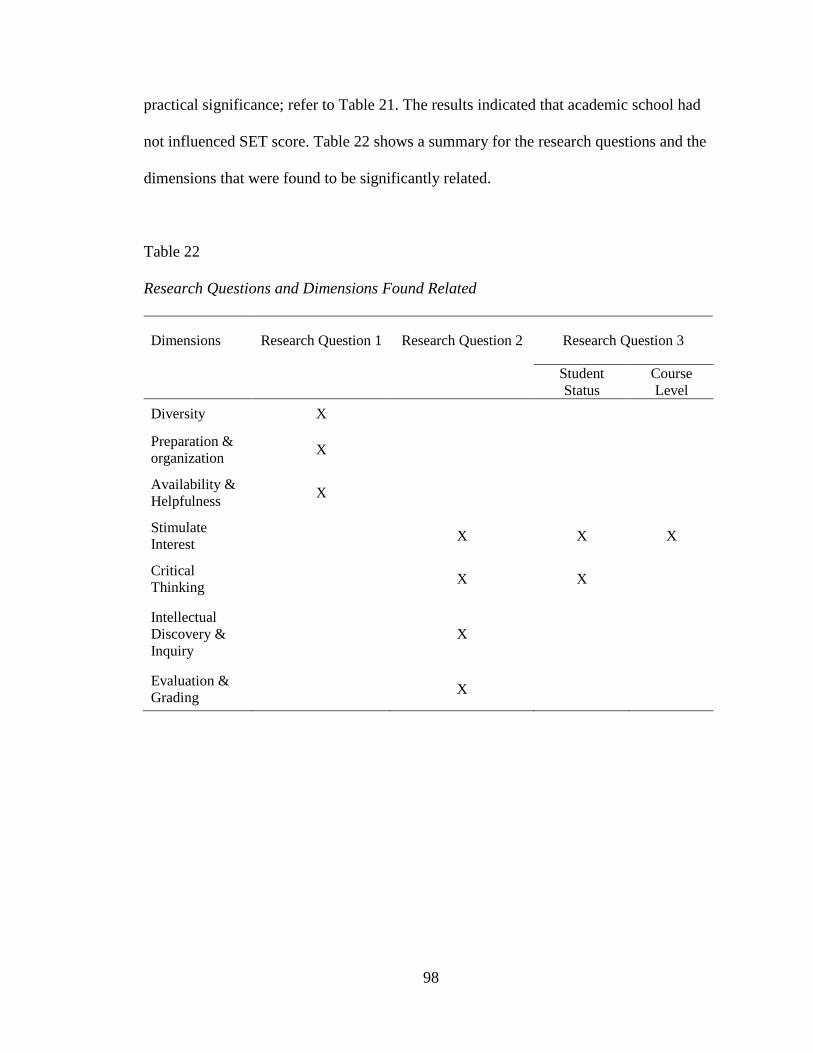
98
practical significance; refer to Table 21. The results indicated that academic school had
not influenced SET score. Table 22 shows a summary for the research questions and the
dimensions that were found to be significantly related.
Table 22
Research Questions and Dimensions Found Related
Dimensions Research Question 1 Research Question 2 Research Question 3
Student
Status
Course
Level
Diversity X
Preparation &
organization X
Availability &
Helpfulness X
Stimulate
Interest X X X
Critical
Thinking X X
Intellectual
Discovery &
Inquiry
X
Evaluation &
Grading X

99
CHAPTER 5
SUMMARY, DISCUSSION, CONCLUSIONS,
AND RECOMMENDATIONS
Introduction
This quantitative study used the Andrews University collected Course Survey in
Fall 2017 to examine the type of ratings that students give for the courses they take and to
identify the possible dimensions that most affect the results of the SET overall rating.
This study also examined the association(s) of gender, student status, course type, course
level, academic school, and SET scores. This chapter presents the following: a review of
the literature and the conceptual framework, problem, purpose, research questions,
research design, a summary of findings, conclusions and discussion, and
recommendations. The chapter ends with a summary.
Review of Literature and Conceptual Framework
Review of Literature
Student evaluation of teaching is one of the tools that higher education institutions
use to measure effective teaching and improve education. It reports the students’ level of
satisfaction with the courses that they take. A good definition for SET is the students’
opinions regarding specific dimensions of effective teaching. Universities emphasize
dimensions of effective teaching that reflect their teaching and assessment philosophies.

100
Therefore, the dimensions that SET instruments include vary from one higher education
institution to another.
The dimensions of effective teaching are a broad area that researchers examined.
Some researchers suggested seven principles for effective teaching. These principles
were: encouraging contact between students and faculty, developing reciprocity and
cooperation among students, encouraging active learning, giving prompt feedback,
emphasizing time on task, communicating high expectations, and respecting diverse
talents and ways of learning (Chickering & Gamson, 1989). Other researchers proposed
different aspects of effective teaching, including course structure (Lumpkin & Multon,
2013), intellectual growth (Bowman & Seifert, 2011) workload (Nargundkar &
Shrikhande, 2012), course content, critical thinking (Anderson, 2012), materials (Seng,
2013), collaboration (Lidice & Saglam, 2013), communication (Nargundkar &
Shrikhande, 2012), respecting diversity (Lumpkin & Multon, 2013), enthusiasm,
including sensitivity to student’s needs (Korte et al., 2013; Latif & Miles, 2013; Seng,
2013), organization and clarity (Alauddin and Kifle, 2014; Lidice & Saglam, 2013;
Lumpkin & Multon, 2013), student-teacher interaction, grading and evaluation
(Anderson, 2012; Latif & Miles, 2013), encouraging creativity and innovation (Hoidn &
Kärkkäinen, 2014), stimulate thinking( Tsai & Lin, 2012), and transferable experience
(Annan et al., 2013).
Higher education institutions use SET as a formative and a summative
assessment. Formative assessment when it aims to help the faculty improve their teaching
skills and adjust their courses (Hobson & Talbot, 2001). Summative assessment is used
by administrators and policymakers to make decisions about program adjustment and

101
faculty promotion and tenure. It can also be used to provide future students information
about the courses before registration (Chen & Hoshower, 2003). According to Marsh
(2007), there are four main applications for SET, which are measuring teaching
effectiveness, providing diagnostic feedback to faculty, providing information for
students to help them select future courses, and using the results for pedagogical research.
Researchers reported different challenges when using SET. They reported that
instructors believed that students’ responses were biased (Balam & Shannon, 2009).
Some researchers (Galbraith, Merrill & Kline, 2012; Balam & Shannon, 2009) examined
the validity and reliability of SET and reported that the dimensions of effective teaching
might affect SET results. Other research suggested that the use of some terms might
confuse the students, which affected the results of SET.
Different researchers found that SET scores were influenced by the dimensions of
effective teaching, which the SET items represent, or by external factors that were related
to the course or student characteristics. Researchers examined the relationship between
SET overall rating and SET dimensions. They found that the SET overall rating was
influenced by some dimensions of SET. Feldman (2007) found that the SET overall
rating was highly influenced by six dimensions. These dimensions were: clarity and
understandability, teacher stimulation of interest, teacher preparation and organization,
the perceived outcome of the impact of instructor, meeting the objectives, and student
motivation. He also reported that other dimensions, including clarity of course objectives,
teacher sensitivity to class, encouragement, intellectual challenge, knowledge of the
subject, teacher’s elocutionary skills, enthusiasm, and availability were other SET
dimensions that affect the SET overall rating moderately. Coffman (1954) found that
102
preparing and organization was the dimension that best that affected the SET overall
rating.
Other researchers found that good teaching and generic skills were the dimensions
that affected the SET overall rating the most (Grace et al., 2012). Özgüngör and Duru,
(2015) reported similar findings and included class interactions, course organization and
planning, and relationships with the students as other predictors for the SET overall
rating. Other dimensions that were highly correlated with SET overall rating were clear
communication of the main points of lectures, evaluations of the student work, and
enthusiasm (Diette & Kester, 2015). Yin, Wang, and Han (2016) studied the relationship
between SET overall rating and SET dimensions and found that only two dimensions
affect the overall rating. These dimensions were good teaching and assessment. Similarly,
Nasser-Abu Alhija (2017) found that assessment was the most important dimension that
affected SET score. Feistauer and Richter (2017) reported that student/teacher interaction
had the most influence on SET score.
Researchers examined the relationship of gender, student status, course type,
course level, and academic school with SET score. Some researchers found that gender is
an influential factor that affected SET score. Worthington (2002) studied the relationship
between gender, student status, and SET scores. He reported that male students and
students who were under thirty years old tended to rate SET lower than did female and
other students. Similarly, Latif and Miles (2013) found that gender and student status
affected the results. Female students tended to value instructor knowledge the most;
however, male students tended to rate highly the instructor’s ability to explain clearly.
Some researchers found that gender was an influential factor on SET score. Female

103
students tended to give higher ratings than male students (Al-Issa & Sulieman, 2007;
Bonitz, 2011). Pounder (2007) conducted a comprehensive review of the literature
regarding the factors that affect SET scores. He found that many research studies
supported the theory that gender affected SET score.
Korte et al. (2013) used the responses of students at a business school to examine
the effect of gender on SET score. They found that female students tended to perceive
instructors differently than did male students. Choi and Kim (2014) attempted to
understand the influence of student characteristics on SET using multilevel models. They
reported that about 96% of the total variance was explained by student-level predictors,
including gender and student status. Male students tended to score all SET items in
identical response patterns; however, female students tended to provide more critical
responses. Kozub (2010) examined the relationship between the course, student, and
instructor characteristics with the different dimensions and SET score in a business
school. The results indicated that female and male students did not differ in their rating,
except for rapport in which male students tended to give lower ratings on rapport than
female students. While some studies found gender to be a factor that affected the SET
score, other studies found that gender had no influence on SET score. Shauki et al. (2009)
attempted to understand the relationship between SET score and the two factors: gender
and student status in pharmacology courses. The results showed that there was no
significant difference between the SET score of female and male students. Similarly,
Brockx et al. (2011) studied the effect of some course and student characteristics on SET
scores. The results indicated that adding the student age, gender, course type, and field of
study to the model of predictor variables did not show any significant predictors. Fah,

104
Yin and Osman (2011) examined the relationship between SET score and the course and
lecturer characteristics and tutorial ratings. The results indicated that female and male
students tended to rate the course and lecturer characteristics similarly.
Researchers also found that SET scores could be influenced by student status. A
study that aimed to examine the relationship between student status and SET scores was
conducted by Whitworth et al. (2002). The researchers found that undergraduate students
tended to rate their instructors lower than graduate students. Other research found that
graduate students rated instructors higher than other students, while freshmen rated them
lowest (Stewart et al., 2007). Al-Issa and Sulieman (2007) found that freshmen and
sophomores tended to rate instructors the lowest compared to other students. Peterson et
al. (2007) examined the relationship between SET scores and student status. They found
that seniors tended to rate their professors significantly higher than sophomores or
freshman and all other undergraduate and graduate students. Santhanam and Hicks (2002)
found that senior and graduate students rated SET higher than other groups. Kozub
(2010) examined the relationships among the course, student, and instructor
characteristics and the different dimensions and SET score in a business school. He found
that there were no group differences regarding student status, except when they rated the
rapport dimension. Yeoh et al. (2012) conducted a research that targeted students at the
School of Management to identify the factors that affect SET scores and the possible
predictors of SET scores. The researchers reported that juniors tended to give higher SET
scores than sophomores. However, the researchers reported that there were no statistical
differences between the SET score of freshman and sophomores. Sauer (2012) reported a
small positive correlation between age and SET. Such a result indicates that there might
105
be no correlation between student status and SET score. Some research found no
relationship between student status and SET score. Brockx et al. (2011) studied the effect
of some course and student characteristics on SET scores. The results indicated that
adding the student status, gender, course type, and field of study to the model of predictor
variables did not show any significant predictors. Fah, Yin and Osman (2011) reported
that there was no relationship between SET scores and student status.
Darby (2006b) examined the relationship between course type and SET scores.
She found that students tended to rate required courses lower than elective courses.
Similarly, Nargundkar and Shrikhande (2012) reported that elective courses tended to be
rated higher than required courses. Peterson et al. (2007) examined the relationship
between SET scores and student status and course type. They found that students who
took core courses rated their professor lower than students who took major required and
elective courses. Two researchers who studied the correlation between SET scores,
student, instructor, and course characteristics were Nasser and Hagtvet (2006). These
researchers reported that students who were interested in taking the course tended to rate
their instructors higher than the students who were not interested.
Ali and Al Ajmi (2013) interviewed different instructors to search for possible
factors that could affect SET scores. They found that some instructors tended to believe
that students who were motivated to take the class tended to rate them higher than other
students who were required to take the course and had no interest in it. Also, researchers
reported that elective courses tended to be rated higher than required major courses
(Nargundkar & Shrikhande, 2012). Kozub (2010) reported that course type affected SET
scores. Students tended to rate elective courses higher than courses that were a general

106
requirement or as required for a major or minor. Brockx et al. (2011) found that student
status does not affect SET scores. The results of this study indicated that course type
might not affect SET score.
Researchers studied the relationship between course level and SET score. Stewart
et al. (2007) examined the impact of course level and academic school on SET scores.
They found that SET scores were affected by course level. Higher-level courses, 300s
and up were rated higher than lower level courses, 200s and lower. Nargundkar and
Shrikhande (2012) found that SET scores were affected by course level. Graduate courses
tended to be rated higher than undergraduate courses. Alauddin and Kifle (2014)
analyzed 10,223 completed SET forms for 25 economics courses to examine the possible
factors that affect SET scores. They found that advanced-level courses were rated higher
than intermediate level courses. Terry et al. (2017) examined a possible correlation
between the SET overall rating and SET dimensions at a college of pharmacy. They
reported that course level did not affect the relation between the predictor variables and
the SET overall rating. Such results contradict the results of other studies that supported
the idea that course level might not affect SET score.
Academic school was another possible factor affecting SET scores. Santhanam
and Hicks (2002) found that students from different academic schools tended to rate their
instructors differently. Students who took arts, humanities, or social studies tended to rate
the instructors higher than students who took science or mathematics courses. Kember
and Leung (2011) found that students from different academic schools tended to rate SET
dimensions differently. Humanities students rated intellectual capacity, specifically
critical thinking, higher than other groups. Health groups tended to rate intellectual
107
capacity lower than the humanities and business groups. Hard science groups of students,
which include physics and other science majors, tended to give SET scores lower than
other groups. Business administration groups rated working together capabilities higher
than the other groups did. Narayanan et al. (2014) studied the relationship between SET
scores and academic school. They found that SET scores tended to be influenced by the
type of the course that each academic school offered. They reported that students at
engineering schools tended to rate courses similarly, however, students at business
schools tended to rate courses depending on the course type (required or elective).
The majority of reviewed studies found that some dimensions of SET influenced
SET overall ratings. However, these studies reported different numbers of dimensions
that mostly influenced SET overall ratings. For some, two dimensions, good teaching and
generic skills (Grace et al., 2012) had the most influence on SET overall rating, other
studies reported more than two dimensions. Feldman (2007) reported six dimensions,
which were clarity and understandability, teacher stimulation of interest, teacher
preparation and organization, the perceived outcome of the impact of instructor, meeting
the objectives, and student motivation. Also, the majority of reviewed studies suggested
that the gender, student status, course type, course level, and academic school influenced
SET score. These studies reported that females tended to rate their instructors higher than
male students did, students with higher levels of academic status tended to rate faculty
higher than other students did, required courses tended to be rated lower than elective
courses, high level courses tended to be rated higher than low level courses, and school of
arts courses tended to be rated higher than courses from other schools.

108
Conceptual Framework
Student Evaluation of Teaching is an important assessment tool that helps higher
educational institutions understand students’ needs and promote quality teaching. Higher
educational institutions use it to make different decisions regarding faculty promotion,
faculty professional development, course improvement, and assessing student course
selection. Therefore, the results of SET should be reliable and valid. Many researchers
understood the importance of SET and examined possible factors that might affect SET
score. These researchers found that some dimensions of SET, course characteristics, and
student characteristics were important factors that affect SET results.
Researchers reported some of the dimensions of SET influenced the SET overall
rating. These dimensions acted as predictors for SET overall rating. The researchers
found that clarity, preparation, stimulate interest, enthusiasm, student interaction with
instructor, generic skills, communication, and feedback could help predict SET overall
rating. Understanding which dimensions predict the overall rating can help educators
understand the areas of effective teaching that students are satisfied with. Higher
educational institutions could use the results to improve courses and teaching.
Several student characteristics have been found by different studies to be external
factors that affect SET scores. Researchers reported that gender and academic status were
important factors that needed to be considered when interpreting the SET results. Some
studies found that female students tended to rate instructors higher than male students
did. Other studies found no correlation between gender and SET scores. Student
academic status was found by different research studies to be a factor that affected SET
scores. Studies reported that graduate students tended to rate courses higher than

109
undergraduate students did. Freshman tended to rate instructors lower than other
undergraduate students. However, some researchers reported that student academic status
did not affect SET scores.
Course characteristics were examined by many studies to understand their
influence on SET score. Researchers found that course type, course level, and the type of
academic school that offered the course affected SET scores. They found that required
courses tended to be rated lower than elective courses, high level courses were rated
higher than low level courses, and courses offered by arts and humanities academic
schools tended to be rated higher than other courses from other academic schools.
Problem
Researchers attempted to understand how some dimensions of SET predict SET
overall rating and examined the effect of external factors on SET scores. A small number
of studies examined the relationship between SET overall rating and SET dimensions.
These studies reported that SET dimensions tended to affect overall rating; however, not
all studies reported finding the same dimensions. Some reported one dimension, other
reported more than four dimensions that predict SET overall rating. The limited number
of studies that examined the SET dimensions that influenced SET overall rating made it
important to examine this area and understand the relationship between these variables.
Different studies reported that SET scores were affected by gender, student status, course
type, course level, and academic school. However, the results of these studies were not
consistent. Some studies were sure that the results of SET were influenced by these
factors, others found that SET scores were not affected by these factors. Because of the
inconclusive results regarding the nature of the relationship between gender, student

110
status, course type, course level, academic school, and SET score, it is important to
examine these factors and understand their relationship with SET scores.
Purpose of the Study
The purpose of this study was to examine the type of SET dimensions and overall
rating that students give for the courses they take and to identify the possible dimensions
which most affect the results of the SET overall rating. Also, it aims to assess the
association(s) of gender, student status, course type, course level, and academic school,
with SET scores.
Research Questions
What type of ratings of SET dimensions and overall rating do students give for
the courses they take?
What SET dimensions are related to the score of SET overall rating?
Is there a significant correlation between SET dimensions and overall rating and
gender, student status (freshman, sophomore, junior, senior, graduate,
postgraduate), course type (general required, major elective, required major and
general elective), course level (undergraduate and graduate), and academic school
(arts and sciences, architecture, business administration, education, and health
professions)?
Research Design
This quantitative correlational study explored the type of score that students give
to the course that they take and examined possible SET variables that might predict the
SET overall rating. Also, this study examined the relationships between SET score and
111
student status, student gender, academic school, course type, and course level. In order to
understand whether there were possible positive or negative correlations between two or
more variables, it was best to use a correlation design. For the second research question,
the independent variables were SET dimensions and the dependent variable was overall
rating. For the third research question, the independent variables were gender, student
status, course type, course level, and academic school; the dependent variables were SET
score (including both SET dimensions and overall rating).
Sample
The researcher used 3,745 responses completed by an unknown number of
students. The participants who completed the survey were taking courses during Fall of
2017. These students were taking one or more courses from the following schools: Arts
and Sciences, Architecture and Interior Design, Business Administration, Education, and
Health Professions.
Instrument
The researcher used Andrews University’s Course Survey (Andrews University,
2013) as the main instrument for the study (Appendix A). The Course Survey included
four sections. The first part includes five items that ask the student to evaluate the course
characteristics. These five items measured four dimensions, which were effective
communication, critical thinking, clarity of objectives, and evaluation and grading. The
second part includes nine items that ask the students to evaluate the instructor behaviors.
These nine items measured seven dimensions, which were effective communication,
respect for diversity, stimulating student interest, intellectual discovery and inquiry,
integrating faith and learning, preparation and organization, and availability and
112
helpfulness. These two sections used the five-point agreement Likert scale. The third
section included three overall questions that ask the student to response using the five-
point Likert scale. The fourth section was not used in this study.
Data Analysis
The data that this research used were obtained from the Office of Institutional
Effectiveness at Andrews University. The Office of Institutional Effectiveness deleted all
information that could identify the participants before the researcher received it. To
ensure the security of data, the researcher saved the data on one laptop that cannot be
accessed by other individuals. The researcher did not share the data with any other
individuals, except the research methodology advisor. The researcher used the IBM SPSS
25 program to help analyze the data. Descriptive Analysis was conducted to answer
Research Question 1, Linear Regression analysis was used to help answer Research
Question 2, and MANOVA was conducted to help answer Research Question 3.
Summary of Findings
This section summarizes the findings and includes demographic information and
the results of the data analysis.
Demographic Information
About 50% of the responses were from participants who were between the ages of
19 and 21, and 57.3% of the responses were completed by female students. Also, 45.2%
of the responses were completed by students taking required major courses; 31.4% were
completed by participants who were taking general required courses. Additionally, 88.7%
of the completed responses were undergraduate courses; refer to Table 4.
113
Findings for Research Question 1
The descriptive data analysis results showed that in general all SET dimensions
that measured effective teaching were highly rated by the students. However, students
tended to rate respect for diversity, preparation and organization, and availability and
helpfulness higher than other dimensions included in the Course Survey; refer to Tables 5
and 6.
Findings for Research Question 2
Two models were developed to find the best model that predicted the overall
rating. The full model included ten dimensions, and a restricted model with four
dimensions was developed. The model with four dimensions was found to be the best
model to predict the overall rating. These dimensions were: stimulate interest, effective
communication, intellectual discovery and inquiry, and evaluation and grading; refer to
Table 10.
Findings for Research Question 3
The results showed gender was not correlated with SET score; refer to Table 11.
Regarding the correlation between SET scores and student academic status, the results
showed that student status tended to affect the results of two dimensions, which were
stimulate interest and critical thinking; refer to Table 13. Freshman tended to rate
stimulate interest lower than graduate and postgraduate. Junior tended to rate this
dimension lower than postgraduate students. Regarding critical thinking, freshman tended
to rate this dimension lower than postgraduate students, followed by sophomores, then
juniors, then seniors; refer to Table 14.

114
Regarding the correlation between SET score and course type, the effect size (η2 =
.009) showed very weak a correlation to be considered statistically significant; refer to
Table16. For practical purposed, there are no significant course type differences between
the groups. For the correlation between SET score and course level, the results showed
that the stimulate interest dimension had a weak effect size (η2 = .015), refer to Table 18.
The results showed that statistically significant mean differences between groups100s and
600s level courses. Students who took 600s, 500s and 400s level courses tended to rate
the dimension of stimulate interest higher than who took 100s level courses; refer to
Table 19. For the correlation between SET score and academic school, the results showed
that the effect size (η2 = .009) was too weak to be considered practically significant; refer
to Table 21.
Discussion
The purpose of this study was to examine the types of ratings of SET dimensions
and overall rating that students give for the courses they take, and to identify the SET
dimensions which most affect the results of the overall rating. Also, it aims to assess the
association(s) among gender, student status, course type, course level, academic school,
and the SET dimensions and overall rating. The discussion of the results is guided by the
research questions.
The first research question was: What type of rating of SET dimensions and
overall rating do students give for the courses they take? The results that were found in
this study indicated that students tended to score all dimensions of SET high. There are
different possible explanations for the high rating. One possible explanation for such a
result was suggested by Benton and Ryalls (2016). They reported that millennial students

115
tended to rate their instructors higher than previous generations did. In this research,
more than 85% of the responses were completed by participants who were millennials, so
this could be the reason for a high rating. Another possible explanation for the high rating
was that since Andrews University is a small private university with small classroom
sizes, creating the potential for more interaction with instructors, which could lead to the
students high level of satisfaction in their courses.
The results of this study also showed that students tended to rate three
dimensions, which were respect for diversity, preparation and organization, and
availability and helpfulness, higher than the other SET dimensions. These findings were
similar to Feldman (2007) who found that students tended to rate more highly instructors
who were well organized and prepared and sensitive and respectful to all students. Other
researchers (Coffman, 1954; Özgüngör & Duru, 2015) reported that students tended to
value the preparation and organization dimension, which is similar to what this study
found. The high rating for instructors who were prepared and organized suggested that
preparation and organization was considered an important aspect of effective teaching by
the students.
Chickering and Gamson (1989) believed that valuing different talents and ways of
learning is an important aspect of good teaching. The result of this study showed that
students tended to value instructors who value respect for diversity, which supported one
of Chickering and Gamson’s principles of good teaching. Other researchers also
emphasized that instructor respect of diversity is an important aspect of good teaching
(Lumpkin & Multon, 2013). It is important that instructors create a safe environment that

116
fulfills the needs of the students and makes them feel accepted and respected by others in
order to help these students flourish and become creative.
In general, reviewed research did not report the dimension of availability and
helpfulness as one of the dimensions that students tended to rate higher than other
dimensions. However, researchers who discussed the dimensions of effective teaching
reported that students tended to appreciate instructors who understand their needs and are
available for them (Korte et al., 2013; Latif & Miles, 2013; Seng, 2013). Specific to
Seventh-day Adventist higher education, Burton, Katenga, & Moniyung (2017) found
that students credited professors’ availability and support during their undergraduate
experience as key contributors to their academic success. Similarly, this study found that
availability and helpfulness is an important aspect of effective teaching that students
tended to value. This finding can help instructors at Andrews University understand that
when they connect with their students, these students feel related to the learning
environment and value the class, which motivates them to learn and increase their
academic achievement.
The second research question was: Which SET dimensions are related to the
results of the SET overall rating? To find the best predictors to predict overall ratings, the
researcher developed two models with different numbers of predictors. The first model
included all the dimensions that the SET included. This model explained 69% of the
variance in overall rating. However, not all dimensions had high loadings in the model.
Therefore, the researcher developed another model that included the dimensions that had
heavy loadings in the first model. Similar to the first developed model, the restricted
model explained 69% of the variance in overall rating. Therefore, the best model that
117
helped to predict the overall rating was the restricted model with four dimensions, which
explained 69% of the variance in overall rating. These four dimensions were: stimulate
interest, effective communication, intellectual discovery and inquiry, and evaluation and
grading. While these four predictors are not the highest rated individually, as identified in
research question 1, they had the largest loadings of all dimensions when the model was
developed. The model indicated that these four dimensions together are the important
aspect of quality of teaching and learning, as viewed by students at Andrews University.
Since the four dimensions together help students develop their innovation and
communication skills, consider and respect their needs, provide them with clear
expectations, and motivate them to learn, it is logical that they constituted the best
prediction model for overall rating. Researchers have argued that instructors should adopt
these aspects of good teaching to help students succeed in higher education (Bowman &
Seifert, 2011; Chickering & Gamson, 1989; Lumpkin & Multon, 2013; Nargundkar &
Shrikhande, 2012). Since the developed model emphasized four aspects of effective
teaching, it is important that future researchers examine it in different institutions to
utilize it in practical education.
Two of the model’s dimensions that the model included, stimulate interest and
evaluation and grading, were similar to the ones that Feldman (2007) said highly
impacted SET overall rating. However, Feldman reported that providing feedback, which
was part of effective communication, had the lowest impact on SET overall rating
compared with other dimensions. This finding indicates the need for further research in
the area of the relationship between effective communication, specifically the feedback,

118
and the SET overall rating for developing a good model for the dimensions of effective
teaching that affect the SET overall rating.
In this study, the researcher found that the dimension of stimulate interest tended
to impact SET overall rating more than other dimensions. Tsai and Lin (2012)
emphasized that the dimension of stimulate students’ interest is one of the dimensions
that should be included in SET assessment instruments in order to get “a complete picture
of the teaching effects” (p. 21). The results of this study suggested that this dimension is
an aspect of effecive teaching that influence students’ overall ratings value. For Tsai and
Lin (2012) stimulating student interest is one of the instructor skills that left students
engaged and satisfed with the course they took. The results of this study supported Tsai
and Lin’s theory that students who believed that their instructors stimulated their interests
rated those courses highly overall. Feldman also (2007) reported that stimulating student
interest in the subject dimension was highly predictive of SET overall rating. The results
of this study supported Feldman’s finding. Students who tended to rate high the
dimension of stimulate interest, also tended to give high overall ratings.
Effective communication tended to impact SET overall rating more than other
dimensions, second only to the dimension of stimulate interest. Catano and Harvey
(2011) reported that students valued instructors who provide effective feedback and
communicate effectively with students. Similarly, Özgüngör and Duru (2015) also
reported that students tended to consider communication as an important aspect of
teaching. Diette and Kester (2015) found that the overall rating was highly correlated
with clear communication. The finding of this study was consistent with those studies in
which effective communication was found to be a good predictor of overall rating. It is

119
important that instructors develop their skills in academic communication in order to help
their students engage in learning and achieve their goals.
Researchers suggested that overall rating was highly correlated with the
dimensions of SET (Diette & Kester, 2015). Similarly, the findings of this study
supported the theory that some dimensions tended to impact overall rating more than
others. Other research reported that generic skills impacted overall rating (Grace et al.,
2012). Generic skills included stimulate student learning by encouraging discovery and
questioning. The results of this study supported these research findings, in which overall
rating was found to be impacted by intellectual discovery and inquiry.
The third research question was Is there a significant correlation between SET
dimensions and overall rating, and gender, student status (freshman, sophomore, junior,
senior, graduate, postgraduate), course type (general required, major elective, required
major and general elective), course level (undergraduate and graduate), and academic
school (arts & sciences, architecture, business administration, education, and health
professions)? The results showed that gender did not affect the SET scores. This
conclusion is similar to results from other studies (Brockx et al., 2011; Dev & Qayyum,
2017; Fah, Yin & Osman, 2011; Kozub, 2010). These studies reported that male and
female students tended to rate their instructors similarly.
The results of this research suggest that student academic status had a weak effect
on SET score. Many studies supported the theory that student status affects SET score
(Al-Issa & Sulieman, 2007; Macfadyen et al., 2016; Peterson et al., 2008; Yeoh et al.,
2012). The results of this study indicated that freshman tended to rate SET dimensions
lower than graduate and postgraduate students. The studies mentioned above supported

120
these results but did not report in which area of SET the students tended to strongly differ
strongly.
In this study, the researcher found that student academic status tended to affect
specific dimensions, which were stimulate student interest and critical thinking. The
researcher found that freshmen tended to disagree that their instructor helped stimulate
their interest in the subject as compared to graduate and postgraduate students. Juniors
also tended to disagree that the instructor stimulated their interest in the subject. Also, the
researcher found that freshman tended to disagree that the course helped them develop
their critical thinking as compared to other students.
The researcher found that course type had very small an effect on SET scores to
be meaningful. This was different from what the major studies reviewed had found.
Different studies reported that high level courses tended to be rated higher than low level
courses (Alauddin & Kifle, 2014; Choi & Kim, 2014; Darby, 2002b; Nargundkar &
Shrikhande, 2012; Nasser & Hagtvet, 2006; Sauer, 2012). The only study that found a
similar finding to this study was conducted by Terry et al. (2017). They reported they did
not find any significant effect of course type on SET scores. The results of this research
indicated that course type had no significant effect that served any practical purpose.
Regarding SET scores and course level, the results of this study showed that there
was a weak correlation between these two variables. Such results supported what other
studies found regarding whether course level tended to influence SET scores (Al-Issa, &
Sulieman, 2007; Ali & Ajmi, 2013; Latif & Miles, 2013; Nargundkar & Shrikhande,
2012; Whitworth et al., 2002). Although these studies reported that graduate courses
tended to be rated higher than undergraduate courses, these studies did not report which

121
areas the students tended to rate high. In this study, the dimension of stimulate interest
found weak effect sizes in SET scores. The results showed that students who took 600s
level courses tended to rate instructors who they believe stimulated their interest in the
subject higher than students who took 100s level courses. This result showed similarity to
the results of student status, in which graduate students tended to rate this dimension
higher than freshmen. Such similarity is possible since 100s level courses are taken
mostly by freshmen and sophomores. In this study, the researcher found that there was
very small an effect of academic school on SET scores to be significant. Not many
studies examined this factor; however, Stewart et al. (2007) found that there was no
significant difference on the SET scores when considering students’ schools.
Since the results of this study did not indicate practical significance for gender,
student status, course level, course type, and academic school, that educators shouldn’t be
very concerned with them when they use SET. Educators and administrators should
continue to use the results of SET to improve education and make decisions regarding
students’ needs. Student Evaluation of Teaching is a tool that contributed and will
continue to contribute in developing education once educators know how to take
advantage of it. In this study, the researcher used the results of SET to develop a model
that provided new insights concerning the major dimensions of effective teaching that
contribute to students’ overall SET ratings at Andrews University. This model helps
understand students’ needs and uncovers the aspects of teaching that, in the opinion of
students, affect the quality of teaching and learning at Andrews University.

122
Conclusions
This study aimed to examine the type of SET dimensions and overall rating that
students give for the courses they take and to identify the possible dimensions which
most affect the results of the SET overall rating. Also, it aims to assess the association(s)
of gender, student status, course type, course level, and academic school, with SET
scores.
In general, students tended to rate all dimensions high. However, the highest
scores were found in the areas of respect for diversity, preparation and organization and
availability and helpfulness. These findings emphasize that students tended to appreciate
specific aspect of effective teaching than other aspects. Not all of the reviewed studies
found similar results. It is important for any institution to understand the dimensions of
effective teaching that their students rated highly because it reflects the dimensions with
which their students are satisfied with.
Gender, which is a major factor that different studies reported its influence on
SET scores, had no influence in SET scores in this study. Student status and course level
tended to influence SET scores, within specific dimensions. Both course type and
academic school showed no significant influence that could be used for practical
purposes. These finding suggested that educators should not be too concerned about any
biased results when they consider using SET for developing education. Although the
results supported other research that found student status and course level affected SET
scores, this research reported only some dimensions that led to differences between
groups. Understanding the dimensions that were influenced by these dimensions could
help understand students’ needs within a specific academic status or course level.
123
The major learning from this study came from the developed model with four
dimensions that explained 69% of the variance of overall ratings. The reviewed studies
did not provide any model that pointed out specific dimensions of effective teaching as
predictors of SET overall ratings. In this study, stimulate interest, effective
communication, intellectual discovery and inquiry, and evaluation and grading. The
developed model with the four dimensions could help educators understand the
dimensions of effective teaching that students in this study most valued. Higher
educational institutions should consider including these dimensions in their instrument if
it does not currently include them.
Because there were limited studies that had examined the possible dimensions
that predict SET overall rating and because of the controversy in the literature regarding
the factors that influence SET scores, understanding which dimension(s) predict an
overall rating and the possible factors that affect SET scores contributed to addressing the
gap in the literature. This study provides answers to some of the questions asked by
researchers in the area of SET, educators who are interested in SET, and assessment
institutions who want to expand their usage of SET.
Limitations
There are some limitations this research within this study. First, some of the
surveys that were used in this study might be completed by the same students, which
might affect the results. When some surveys had been completed by the same students,
the results of the survey would only reflect the opinions of these students. Second, about
50% of the responses were completed by students who were between the ages of 19 and
21; the results could be different with different proportions of age groups. Third, the

124
dimensions of effective teaching that developed the instrument that was used in this
research might not be similar to other instruments used by other institutions. Fourth, the
questionnaire that the participants completed was available only in an online format,
which might affect the number of participants.
Recommendations
There are eight major recommendations from this research. The first three pertain
to Andrews University, the next two pertain to higher educational institutions assessment,
administrators, and institutes of effective teaching, and the last three are to researchers.
The researcher recommends that the administrators at Andrews University and the
Office of Institutional Effectiveness:
Use the four dimensions from the developed model to inform the creation of
professional development opportunities for Andrews University
Introduce the developed model to the teaching faculty at Andrews University and
encourage them to share their experience regarding the four dimensions from the
developed model with new faculty members in order to help these new members
understand the areas that affect the level of student satisfaction in general.
The results for research question 3 suggested that statistically, the influence of
some factors do not biased SET results. Therefore, institutions and instructors
should trust that the results of SET reflect students’ voices and use them in
developing plans for professional growth.
The researcher recommends that higher educational institutions assessment,
administrators, and institutes of effective teaching:
125
As done with research question 2 in this study, use rigorous statistical analyses,
such as linear regression, to identify the SET dimensions that affect SET overall
rating in their institutions. This could help educators better understand students’
needs and concerns as expressed through the SET dimensions at their institution.
In this research, the researcher used Linear Regression analysis to uncover the
dimensions that predict overall ratings, institutions can utilize rigorous analysis
techniques that can help them uncover greater insights from SET data than simple
mean computation and comparisons.
The researcher recommends that researchers:
Replicate this study with other populations and in public institutions.
Conduct another study that includes data from traditional lecture courses and non-
lecture courses, which were excluded from this study.
Replicate this study in other faith-based institutions.
Summary
In this study, the researcher found that students tended, in general, to rate SET
dimensions and overall rating high. Stimulate interest in subject, effective
communication, intellectual discovery and inquiry, and evaluation and grading were
strong predictors for SET overall rating. Gender, course type and academic school
showed no significant influence on SET score. Student status and course level affect
some of the SET dimensions. The findings suggested that students who highly rated
stimulate interest in subject, effective communication, critical thinking, and evaluation
and grading, tended to rate the overall ratings highly as well. The developed restricted
model could be used by educators to understand student needs. This research supported

126
the theory that some SET dimensions predict SET overall score. Since the four
dimensions explained 69% of the variance of overall score, other researchers could use
the developed model as a starting point to develop a better model with additional factors
that predict overall score.
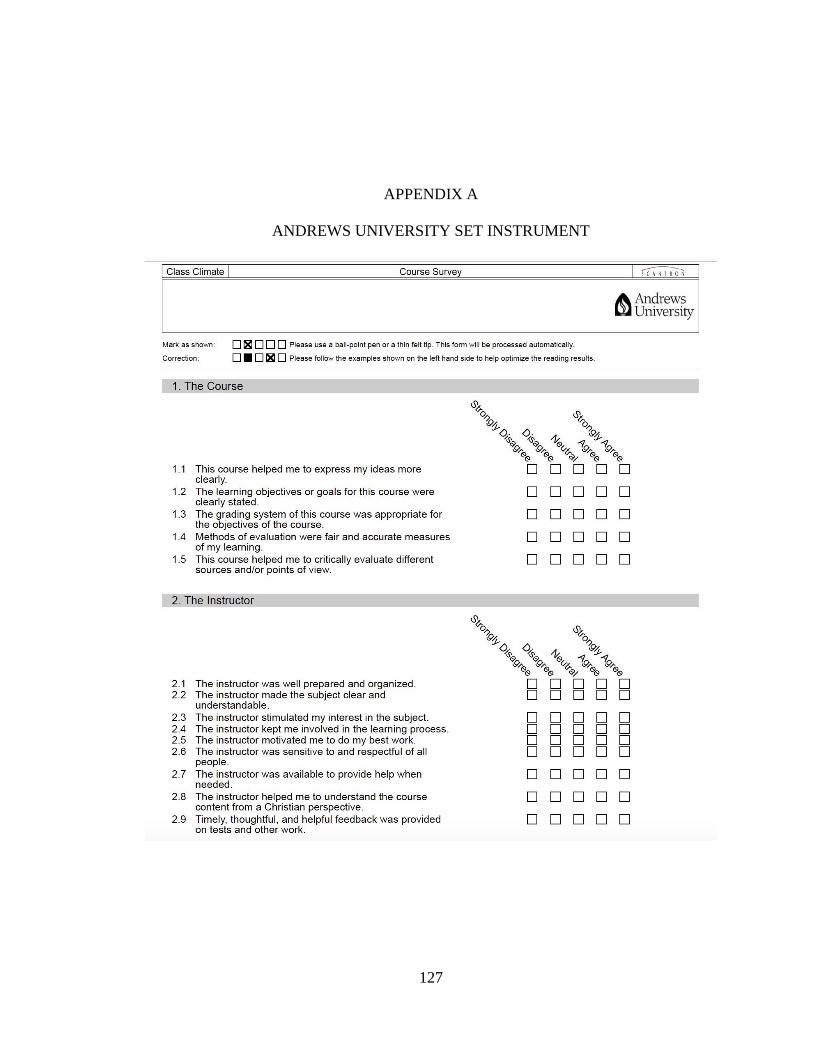
127
APPENDIX A
ANDREWS UNIVERSITY SET INSTRUMENT

128
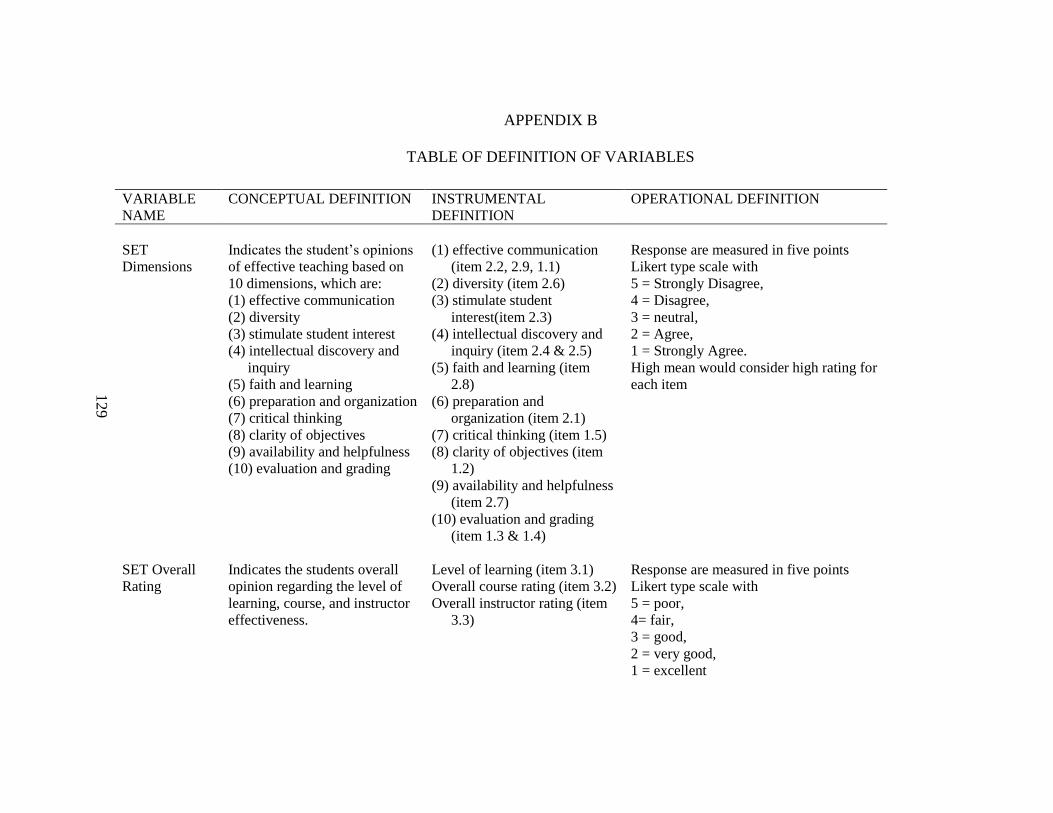
129
APPENDIX B
TABLE OF DEFINITION OF VARIABLES
VARIABLE
NAME
CONCEPTUAL DEFINITION INSTRUMENTAL
DEFINITION
OPERATIONAL DEFINITION
SET
Dimensions
Indicates the student’s opinions
of effective teaching based on
10 dimensions, which are:
(1) effective communication
(2) diversity
(3) stimulate student interest
(4) intellectual discovery and
inquiry
(5) faith and learning
(6) preparation and organization
(7) critical thinking
(8) clarity of objectives
(9) availability and helpfulness
(10) evaluation and grading
(1) effective communication
(item 2.2, 2.9, 1.1)
(2) diversity (item 2.6)
(3) stimulate student
interest(item 2.3)
(4) intellectual discovery and
inquiry (item 2.4 & 2.5)
(5) faith and learning (item
2.8)
(6) preparation and
organization (item 2.1)
(7) critical thinking (item 1.5)
(8) clarity of objectives (item
1.2)
(9) availability and helpfulness
(item 2.7)
(10) evaluation and grading
(item 1.3 & 1.4)
Response are measured in five points
Likert type scale with
5 = Strongly Disagree,
4 = Disagree,
3 = neutral,
2 = Agree,
1 = Strongly Agree.
High mean would consider high rating for
each item
SET Overall
Rating
Indicates the students overall
opinion regarding the level of
learning, course, and instructor
effectiveness.
Level of learning (item 3.1)
Overall course rating (item 3.2)
Overall instructor rating (item
3.3)
Response are measured in five points
Likert type scale with
5 = poor,
4= fair,
3 = good,
2 = very good,
1 = excellent

130
TABLE OF DEFINITION OF VARIABLES—Continued
VARIABLE
NAME CONCEPTUAL DEFINITION INSTRUMENTAL DEFINITION OPERATIONAL DEFINITION
Gender (GEN)
Indicates student’s male or
female gender.
Gender ______
(0) Female
Male
Female = 0
Male = 1
This variable will be recoded as
a dummy variable and will be
entered as categorical data. The
number assigned is the gender of
the student.
Academic
School
Indicate the field that the course
is related to.
The academic school that this
study includes: Arts &
Sciences, Architecture,
Business Administration,
Education, and Health
Professions
This course is related to:
(1) Arts & Sciences
(2) Architecture, Interior & Design
(3) Business Administration
(4) Education
(5) Health Professions
Arts & Sciences = 1
Architecture, Interior & Design
= 2
Business Administration = 3
Education = 4
Health Professions = 5
Course type
(CT)
Indicates whether the course is
General Required (GR),
Elective Required (ER), Major
Required (MR), or General
Elective (GE)
This course:
General requirement (GR)
Elective Required (ER)
Major required (MR)
General elective (GE)
General requirement (GR) = 1
Elective Required (ER) = 2
Required Major (RM) = 3
General elective (GE) = 4

131
TABLE OF DEFINITION OF VARIABLES—Continued
VARIABLE
NAME CONCEPTUAL DEFINITION INSTRUMENTAL DEFINITION OPERATIONAL DEFINITION
Course level
(CL)
Indicate the academic year
(freshmen, sophomore, junior,
senior, graduate or Post
Graduate) in which students
take specific courses
Student is:
Freshmen
Sophomore
Junior
Senior
Graduate
Post Graduate
Freshmen = 1
Sophomore = 2
Junior = 3
Senior = 4
Graduate = 5
Post Graduate = 6

132
APPENDIX C
IRB FORM AND CERTIFICATION
Office of Research and Creative Scholarship
Institutional Review Board
(269) 471-6361 Fax: (269) 471-6246 E-mail: [email protected]
Andrews University, Berrien Springs, MI 49104-0355
APPLICATION FOR APPROVAL OF HUMAN SUBJECTS RESEARCH
Please complete this application as thoroughly as possible. Your application will be
reviewed by a committee of Andrews University IRB, and if approved it will be for one
year. Beyond the one year you will be required to submit a continuation request. It is the
IRB’s responsibility to assign the level of review: Exempt, Expedited or Full. It is your
responsibility to accurately complete the form and provide the required documents.
Should your application fall into the exempt status, you should expect a response from
the IRB office within one (1) week; Expedited within two (2) weeks and a Full review 4-
6 weeks.
Please complete the following application:
1. Research Project
a) Title: Course Type, Course Level, Student’s Age, Gender, and Personality Type as
Correlates of Student Evaluation of Teaching
Will the research be conducted on the AU campus? ___✓ Yes ___ No
If no, please indicate the location(s) of the study and attach an institutional consent letter that references
the researcher’s study.
a) What is the source of funding (please check all that apply)
___ ✓ Unfunded
___ Internal Funding Source:
___ External Funding Sponsor/Source:
Grant title: Award # / Charging String:
If you do not know the funding/grant information, please obtain it from your department
2. Principal Investigator (PI)
First Name: Fatimah Last Name: Al Nasser Telephone: (616) 2065372 E-mail:
___ ✓ Yes I am a student. If so, please provide information about your faculty advisor below.
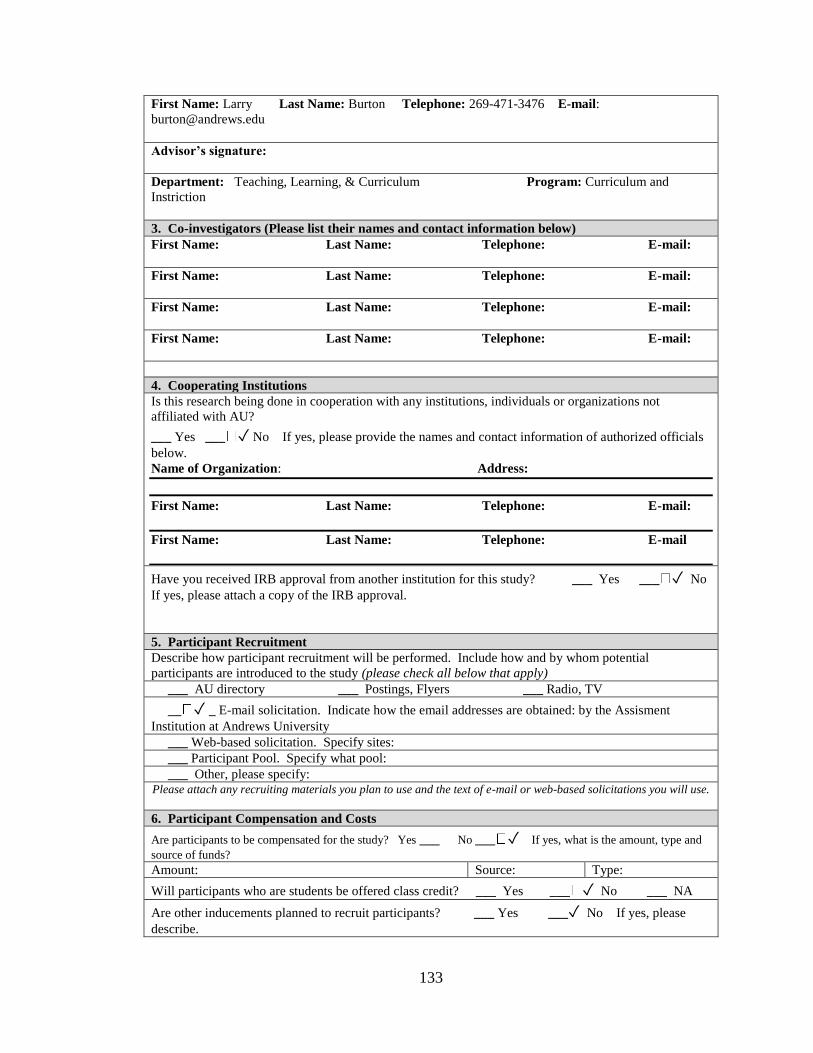
133
First Name: Larry Last Name: Burton Telephone: 269-471-3476 E-mail:
Advisor’s signature:
Department: Teaching, Learning, & Curriculum Program: Curriculum and
Instriction
3. Co-investigators (Please list their names and contact information below)
First Name: Last Name: Telephone: E-mail:
First Name: Last Name: Telephone: E-mail:
First Name: Last Name: Telephone: E-mail:
First Name: Last Name: Telephone: E-mail:
4. Cooperating Institutions
Is this research being done in cooperation with any institutions, individuals or organizations not
affiliated with AU?
___ Yes ___ ✓ No If yes, please provide the names and contact information of authorized officials
below.
Name of Organization: Address:
First Name: Last Name: Telephone: E-mail:
First Name: Last Name: Telephone: E-mail
Have you received IRB approval from another institution for this study? ___ Yes ___ ✓ No
If yes, please attach a copy of the IRB approval.
5. Participant Recruitment
Describe how participant recruitment will be performed. Include how and by whom potential
participants are introduced to the study (please check all below that apply)
___ AU directory ___ Postings, Flyers ___ Radio, TV
__ ✓ _ E-mail solicitation. Indicate how the email addresses are obtained: by the Assisment
Institution at Andrews University
___ Web-based solicitation. Specify sites:
___ Participant Pool. Specify what pool:
___ Other, please specify: Please attach any recruiting materials you plan to use and the text of e-mail or web-based solicitations you will use.
6. Participant Compensation and Costs
Are participants to be compensated for the study? Yes ___ No ___ ✓ If yes, what is the amount, type and
source of funds?
Amount: Source: Type:
Will participants who are students be offered class credit? ___ Yes ___ ✓ No ___ NA
Are other inducements planned to recruit participants? ___ Yes ___✓ No If yes, please
describe.

134
Are there any costs to participants? ___ Yes __✓_ No If yes, please explain.
7. Confidentiality and Data Security
Will personal identifiers be collected? __✓_ Yes
___ No
Will identifiers be translated to a code? __✓_Yes
___ No
Will recordings be made (audio, video)? ___ Yes ___ No If yes, please describe.
Who will have access to data (survey, questionnaires, recordings, interview records, etc.)? Please list
below.
The researcher only
8. Conflict of Interest
Do you (or any individual who is associated with or responsible for the design, the conduct of or the
reporting of this research) have an economic or financial interest in, or act as an officer or director for,
any outside entity whose interests could reasonably appear to be affected by this research project: ___
Yes __ ✓ _ No
If yes, please provide detailed information to permit the IRB to determine if such involvement should be
disclosed to potential research subjects.
9. Results
To whom will you present results (highlight all that apply)
__✓_ Class _✓__ Conference _✓__ Published Article ___ Other If other, please
specify:
10. Description of Research Subjects
If human subjects are involved, please highlight all that apply:
___ Minors (under 18 years) ___ Prison inmates ___ Mentally impaired ___
Physically disabled
__ ✓ _ Institutionalized residents ___ Anyone unable to make informed decisions about
participation
___ Vulnerable or at-risk groups, e.g., poverty, pregnant women, substance abuse population
11. Risks
Are there any potential damage or adverse consequences to researcher, participants, or environment?
These include physical, psychological, social, or spiritual risks whether as part of the protocol or a
remote possibility.
Please highlight all that apply (Type of risk): Definitions of risks can be found at the end of the
application form.
___ Physical harm ___ Psychological harm ___ Social harm ___ Spiritual harm
12. Content Sensitivity
Does your research address culturally or morally sensitive issues? ___ Yes ___ ✓ No If yes,
please describe:

135
13. Please provide (type in or copy - paste or attach) the following documentation in the boxes
below:
Protocol :
The research is an experimental study in which the researcher will implement code switching during
the Arabic literature and science classes. The teachers are the one who will apply the treatment. The
classes will be recorded once a week. The students will be pretested and post tested by answering a
questionnaire that the researcher developed. The implementing period of code switching will be one
year. After collecting data, the researcher will analyze both of the tests and compare the results to see
if using code switching has affect the students’ attitudes toward learning English or using Arabic and
English as a medium of instruction.
Survey instrument or interview protocol: See Appendix E
Institutional approval letter (if off AU campus):
Consent form (for interviews and focus groups): See Appendix D
Participants recruitment documents:
Principal Investigator’s Assurance Statement for Using Human Subjects in Research
____ ✓ __ I certify that the information provided in this IRB application is complete and
accurate.
_____ ✓ _ I understand that as Principal Investigator, I have ultimate responsibility for
the conduct
of IRB approved studies, the ethical performance of protocols, the protection of the rights
and welfare of human subjects, and strict adherence to the study’s protocol and any
stipulation imposed by Andrews University Institutional Review Board.
____ ✓ __ I will submit modifications and / or changes to the IRB as necessary prior to
implementation.

136
_____ ✓ _ I agree to comply with all Andrews University’s policies and procedures, as
well as with all applicable federal, state, and local laws, regarding the protection of
human participants in research.
____ ✓ __My advisor has reviewed and approved my proposal.
Types of risk1
Risk is the Probability that a certain harm will occur.
1. Physical Risk: Physical risks may include pain, injury, and impairment of a
sense such as touch or sight. These risks may be brief or extended, temporary or
permanent, occur during participation in the research or arise after.
2. Psychological Risk: Psychological risks can include anxiety, sadness, regret and
emotional distress, among others. Psychological risks exist in many different
types of research in addition to behavioral studies.
3. Social Risk: Social risks exist whenever there is the possibility that participating
in research or the revelation of data collected by investigators in the course of the
research, if disclosed to individuals or entities outside of the research, could
negatively impact others’ perceptions of the participant. Social risks can range
from jeopardizing the individual’s reputation and social standing, to placing the
individual at-risk of political or social reprisals.
4. Legal Risk: Legal risks include the exposure of activities of a research subject
“that could reasonably place the subjects at risk of criminal or civil liability.
5. Economic Risk: Economic risks may exist if knowledge of one’s participation in
research, fr example, could make it difficult for a research participant to retain a
job or to find a job, or if insurance premiums increase or loss of insurance is a
result of the disclosure of research data.
1 Protecting Human Research Participants NIH Office of Extramural Research 2008
http://phrp.nihtraining.com/beneficence/03_beneficence.php

137
REFERENCE LIST
Abrami, P. C., Perry, R. P., & Leventhal, L. (1982). The relationship between student
personality characteristics, teacher ratings, and student achievement. Journal of
Educational Psychology, 74(1), 111-125. doi:10.1037/0022-0663.74.1.111
Adams, M. D., & Umbach, P. (2012). Nonresponse and online student evaluations of
teaching: Understanding the influence of salience, fatigue, and academic
environments. Research in Higher Education, 53(5), 576-591.
doi:10.1007/s11162-011-9240-5
Akareem, H. S., & Hossain, S. S. (2016). Determinants of education quality: What makes
students’ perception different? Open Review of Educational Research, 3(1), 52-
67. doi:10.1080/23265507.2016.1155167
Alauddin, M., & Kifle, T. (2014). Does the student evaluation of teaching instrument
really measure instructors’ teaching effetiveness? An econometric analysis of
students’ perceptions in economics courses. Economic Analysis and Policy, 44(2),
156-168. doi:10.1016/j.eap.2014.05.009
Ali, H. I. H., & Ajmi, A. A. S. A. (2013). Exploring non-instructional factors in student
evaluations. Higher Education Studies, 3(5), 81-93.
Al-Issa, A., & Sulieman, H. (2007). Student evaluations of teaching: Perceptions and
biasing factors. Quality Assurance in Education, 15(3), 302-317.
doi:10.1108/09684880710773183
Anderson, V. J. (2012). Effective grading and assessment: Global insights to enhance
student learning, faculty satisfaction, and institutional success. Handbook of
College and University Teaching: A Global Perspective. Thousand Oaks, CA:
SAGE.
Anantharaman, S., Lee. J., & Jones B., (2010). Perception of control and overall program
evaluation among MBA students. International Journal of Business Research,
10(4), 96-104.
Annan, S. L., Tratnack, S., Rubenstein, C., Metzler-Sawin, E., & Hulton, L. (2013). An
integrative review of student evaluations of teaching: Implications for evaluation
of nursing faculty. Journal of Professional Nursing, 29(5), e10-e24.
doi:10.1016/j.profnurs.2013.06.004

138
Anstine, D. D. (1991). An investigation of the relationships between student evaluations
and faculty, class, and student demographic variables in rating instructional
effectiveness. (Doctoral dissertation). Available from ProQuest Dissertations and
Theses database (UMI No. 9214758).
Appleton-Knapp, S. L., & Krentler, K. A. (2006). Measuring student expectations and
their effects on satisfaction: The importance of managing student expectations.
Journal of Marketing Education, 28(3), 254-264.
Atek, E. S. E., Salim, H., Ab Halim, Z., Jusoh, Z., & Yusuf, M. A. M. (2015). Lecturer's
gender and their valuation of student evaluation of teaching. International
Education Studies, 8(6), 132-141.
Balam, E. M., & Shannon, D. M. (2009). Student ratings of college teaching: A
comparison of faculty and their students. Assessment & Evaluation in Higher
Education, 35(2), 209-221. doi:10.1080/02602930902795901
Batten, J., Birch, P. D. J., Wright, J., Manley, A. J., & Smith, M. J. (2013). An
exploratory investigation examining male and female students’ initial impressions
and expectancies of lecturers. Teaching in Higher Education, 19(2), 113-125.
doi:10.1080/13562517.2013.827645
Benton, S. L., & Cashin, W. E. (2012). Student ratings of teaching: A summary of
research and literature. IDEA Paper No.50. Manhattan, KS: Kansas State
University, Center for Faculty Evaluation and Development.
Benton, S. L., & Ryalls, K. R. (2016). IDEA paper No. 58: Challenging misconceptions
about student ratings of instruction. Manhattan, KS: The IDEA Center. Retrieved
from https://www.ideaedu.org/Portals/0/Uploads/Documents/
IDEA%20Papers/IDEA%20Papers/PaperIDEA_58.pdf
Beran, T., Violato, C., Kline, D., & Frideres, J. (2009). What do students consider useful
about student ratings? Assessment & Evaluation in Higher Education, 34(5), 519-
527. doi:10.1080/02602930802082228
Beuth, T., Danilova, S., Babu, H. U., Bogatscher, S., Shinohara, L., & Heussner, N.
(2015). Revision of an optical engineering lecture based on students' evaluation of
university teaching. International Journal of Information and Education
Technology, 5(12), 890-896. doi:10.7763/IJIET.2015.V5.633
Bonitz, V. S. (2011). Student evaluation of teaching: Individual differences and bias
effects. (Doctoral dissertation). Available from ProQuest Dissertations and Theses
database. (UMI No. 3472997)
Bowman, N. A., & Seifert, T. A. (2011). Can college students accurately assess what
affects their learning and development? Journal of College Student Development,
52(3), 270-290.

139
Braskamp, L. A., & Ory, J. C. (1994). Assessing faculty work: Enhancing individual and
institutional performance. San Francisco, CA: John Wiley & Sons.
Brockx, B., Spooren, P., & Mortelmans, D. (2011). Taking the grading leniency story to
the edge: The influence of student, teacher, and course characteristics on student
evaluations of teaching in higher education. Educational Assessment, Evaluation
and Accountability, 23(4), 289-306. doi:10.1007/s11092-011-9126-2
Brown, M. J. (2008). Student perceptions of teaching evaluations. Journal of
Instructional Psychology, 35(2), 177-181.
Burton, L. D., Katenga, J. E., & Moniyung, C. (2017, May 19). Toward a theory of
transition from public school to Christian higher education. Paper presented at
the annual meeting of the Adventist Human Subject Research American
Educational Research Association, Loma Linda University, Loma Linda, CA.
Campbell, K. P. (2015). From the editor: Gender equity in higher education. Diversity &
Democracy, 18(2). Retrieved from
https://www.aacu.org/diversitydemocracy/2015/spring/editor
Carbone, A., Ross, B., Phelan, L., Lindsay, K., Drew, S., Stoney, S., & Cottman, C.
(2014). Course evaluation matters: Improving students’ learning experiences with
a peer-assisted teaching programme. Assessment & Evaluation in Higher
Education, 40(2), 165-180. doi:10.1080/02602938.2014.895894
Cashin, W. E. (1995). Student ratings of teaching: The research revisited. IDEA Paper
No. 32. ERIC. Retrieved from http://files.eric.ed.gov/fulltext/ED402338.pdf
Catano, V. M., & Harvey, S. (2011). Student perception of teaching effectiveness:
Development and validation of the evaluation of teaching competencies scale
(ETCS). Assessment & Evaluation in Higher Education, 36(6), 701-717.
doi:10.1080/02602938.2010.484879
Centra, J. A. (1977). Student ratings of instruction and their relationship to student
learning. American Educational Research Journal, 14(1), 17-24.
doi:10.2307/1162516
Chen, Y., & Hoshower, L. B. (2003). Student evaluation of teaching effectiveness: An
assessment of student perception and motivation. Assessment & Evaluation in
Higher Education, 28(1), 71-88. doi:10.1080/02602930301683
Chickering, A. W., & Gamson, Z. F. (1989). Seven principles for good practice in
undergraduate education. Biochemical Education, 17(3), 140-141.
doi:10.1016/0307-4412(89)90094-0

140
Choi, B. K., & Kim, J. W. (2014). The influence of student and course characteristics on
monotonic response patterns in student evaluation of teaching in South Korea.
Asia Pacific Education Review, 15(3), 483-492. doi:10.1007/s12564-014-9332-y
Chulkov, D. V., & Jason Van, A. (2012). Challenges in designing student teaching
evaluations in a business program. The International Journal of Educational
Management, 26(2), 162-174. doi:10.1108/09513541211201979
Cohen, P. A. (1981). Student ratings of instruction and student achievement: A meta-
analysis of multisection validity studies. Review of Educational Research, 51(3),
281-309. doi:10.2307/1170209
Coffman, W. E. (1954). Determining students' concepts of effective teaching from their
ratings of instructors. Journal of Educational Psychology, 45(5), 277-286.
doi:10.1037/h0058214
Cole, M. D. (2013). Community college students' self-reports of persistence: Looking
beyond student satisfaction ratings of persisters and nonpersisters. (Doctoral
dissertation). Available from ProQuest Dissertations and Theses database. (UMI
No. 3550658)
Course Survey. (2014). Andrews University. Retrieved from
https://www.andrews.edu/services/effectiveness/assessment/coursesurveys/course
-survey.pdf
Cranton, P. A., & Smith, R. A. (1986). A new look at the effect of course characteristics
on student ratings of instruction. Aerican Educational Research Journal, 23(1),
117-128. doi:10.2307/1163047
Darby, J. A. (2006a). Evaluating courses: An examination of the impact of student
gender. Educational Studies, 32(2), 187-199. doi:10.1080/03055690600631093
Darby, J. A. (2006b). The effects of the elective or required status of courses on student
evaluations. Journal of Vocational Education & Training, 58(1), 19-29.
doi:10.1080/13636820500507708
Darwin, S. (2017). What contemporary work are student ratings actually doing in higher
education? Studies in Educational Evaluation, 54, 13-21.
https://doi.org/10.1016/j.stueduc.2016.08.002
D’Apollonia, S., & Abrami, P. C. (1997). Navigating student ratings of instruction.
American Psychologist, 52(11), 1198-1208. doi:10.1037/0003-066X.52.11.1198
Department of Statistics Online Program. (2018). Hypothesis testing: P-value approach.
Retrieved from https://onlinecourses.science.psu.edu/statprogram/node/138
141
Dev, S., & Qayyum, N. (2017). Major factors affecting students’ perception towards
faculty evaluation of teaching. Journal of Social Studies Education Research,
8(3), 149-167. Retrieved from http://jsser.org/article/view/5000213141
Diette, T. M., & Kester, G. W. (2015). Student course evaluations: Key determinants of
teaching effectiveness ratings in accounting, business and economics courses at a
small private liberal arts college. Journal of the Academy of Business Education,
16, 207-223
Donnon, T., Delver, H., & Beran, T. (2010). Student and teaching characteristics related
to ratings of instruction in medical sciences graduate programs. Medical Teacher,
32(4), 327-332. doi:10.3109/01421590903480097
Driscoll, J., & Cadden, D. (2010). Student evaluation instruments: The interactive impact
of course requirement, student level, department and anticipated grade. American
Journal of Business Education, 3(5), 21-30
Dujari, A. (1993). Vocabulary comprehension of evaluation form: Its influence on
student rating of faculty. Report: ED, 364 164.Retrieved from
https://files.eric.ed.gov/fulltext/ED364164.pdf
Evans, E. F., Baskerville, R., Wynn-Williams, K., & Gillett, S. J. (2014). How students’
ethnicity influences their respect for teachers. Asian Review of Accounting, 22(2),
159-178. doi:10.1108/ARA-01-2014-0001
Fah, B. C. Yin, & Osman, Syuhaily (2011). A case study of student evaluation of
teaching in university. International Education Studies, 4(1), 44-50.
Fairris, D. (2012). Using program evaluation to enhance student success. Liberal
Education, 98(1), 52-55.
Faleye, B. A., & Awopeju, O. A. (2012). A revalidation of students' evaluation of
teaching effectiveness rating scale. Ife Psychologia, 20(2), 150-160.
Feistauer, D., & Richter, T. (2017). How reliable are students’ evaluations of teaching
quality? A variance components approach. Assessment & Evaluation in Higher
Education, 42(8), 1263-1279. doi:10.1080/02602938.2016.1261083
Feldman, K. (2007). Identifying exemplary teachers and teaching: Evidence from student
ratings. In R. Perry & J. Smart (Eds.), The scholarship of teaching and learning in
higher education: An evidence-based perspective (pp. 93-143): Dordrecht, The
Netherlands: Springer.
Franklin, M. (2016). Student evaluations of teaching in business and accounting courses:
A perspective and a suggested improvement. Cogent Business & Management,
3(1). doi:10.1080/23311975.2016.1226458
142
Frey, P. W., Leonard, D. W., & Beatty, W. W. (1975). Student ratings of instruction:
Validation research. American Educational Research Journal, 12(4), 435-444.
doi:10.2307/1162743
Frick, T. W., Chadha, R., Watson, C., & Zlatkovska, E. (2010). Improving course
evaluations to improve instruction and complex learning in higher education.
Educational Technology, Research and Development, 58(2), 115-136.
Galbraith, C. S., Merrill, G. B., & Kline, D. M. (2012). Are student evaluations of
teaching effectiveness valid for measuring student learning outcomes in business
related classes? A neural network and bayesian analyses. Research in Higher
Education, (3), 353-374. doi:10.1007/s11162-011-9229-0
Gaubatz, N. B. (1999). Student perceptions of learning and their relationship to student
ratings of college teaching effectiveness. (Doctoral dissertation). Available from
ProQuest Dissertations and Theses database. (UMI No. 9946501
George, D., & Mallery, M. (2010). SPSS for windows step by step: A simple guide and
reference, 17.0 update (10th ed.) Boston, MA: Pearson.
Grace, D., Weaven, S., Bodey, K., Ross, M., & Weaven, K. (2012). Putting student
evaluations into perspective: The course experience quality and satisfaction model
(CEQS). Studies in Educational Evaluation, 38(2), 35-43.
doi:http://dx.doi.org/10.1016/j.stueduc.2012.05.001
Hammonds, F., Mariano, G. J., Ammons, G., & Chambers, S. (2016). Student evaluations
of teaching: Improving teaching quality in higher education. Perspectives: Policy
and Practice in Higher Education, 1-8. doi:10.1080/13603108.2016.1227388
Hansen, W. L. (2014). Rethinking the student course evaluation: How a customized
approach can improve teaching and learning. Liberal Education, 100(3), 6-13.
Harrison, P. D., Douglas, D. K., & Burdsal, C. A. (2004). The relative merits of different
types of overall evaluations of teaching effectiveness. Research in Higher
Education, 45(3), 311-323.
Hobler, D. A. (2014). An exploratory study of the longitudinal stability and effects of
demographics on student evaluations of teaching. (Doctoral dissertation).
Available from ProQuest Dissertations and Theses database. (UMI No. 3617516)
Hobson, S. M., & Talbot, D. M. (2001). Understanding student evaluations. College
Teaching, 49(1), 26.
Hoidn, S., & Kärkkäinen, K. (2014). Promoting skills for innovation in higher education:
A literature review on the effectiveness of problem-based learning and of teaching
behaviours. Paris, France: Organisation for Economic Cooperation and
Development (OECD).

143
Husain, M., & Khan, S. (2016). Students’ feedback: An effective tool in teachers’
evaluation system. International Journal of Applied & Basic Medical Research,
6(3), 178-181. doi:10.4103/2229-516X.186969
Jones, A. (2013). Perspectives on change: A study of the multiple dimensions of
changing teaching. Teaching in Higher Education, 19(2), 170-182. doi:10.1080/
13562517.2013.836088
Kember, D., & Leung, D. Y. (2011). Disciplinary differences in student ratings of
teaching quality. Research in Higher Education, 52(3), 278-299. doi:10.1007/
s11162-010-9194-z
Korte, L., Lavin, A., & Davies, T. (2013). Does gender impact business students'
perceptions of teaching effectiveness? Journal of College Teaching & Learning
(Online), 10(3), 167.
Kozub, R. M. (2010). Relationship of course, instructor, and student characteristics to
dimensions of student ratings of teaching effectiveness in business schools.
American Journal of Business Education, 3(1), 33-40.
Latif, E., & Miles, S. (2013). Students’ perception of effective teaching. Journal of
Economics and Economic Education Research, 14(1), 121-129.
Lidice, A., & Saglam, G. (2013). Using students’ evaluations to measure educational
quality. Procedia - Social and Behavioral Sciences, 70(0), 1009-1015.
doi:http://dx.doi.org/10.1016/j.sbspro.2013.01.152
Lindahl, M. W., & Unger, M. L. (2010). Cruelty in student teaching evaluations. College
Teaching, 58(3), 71-76.
Lizzio, A., Wilson, K., & Simons, R. (2002). University students' perceptions of the
learning environment and academic outcomes: Implications for theory and
practice. Studies in Higher Education, 27(1), 27.
Lumpkin, A., & Multon, K. D. (2013). Perceptions of teaching effectiveness. The
Educational Forum, 77(3), 288-299. doi:10.1080/00131725.2013.792907
Macfadyen, L. P., Dawson, S., Prest, S., & Gašević, D. (2016). Whose feedback? A
multilevel analysis of student completion of end-of-term teaching. Assessment &
Evaluation in Higher Education, 41(6), 821-839. Abingdon, England: Routledge.
http://researchoutputs.unisa.edu.au/11541.2/111736.
Malouff, J. M., Reid, J., Wilkes, J., & Emmerton, A. J. (2015). Using the results of
teaching evaluations to improve teaching: A case study of a new systematic
process. College Teaching, 63(1), 3-7. doi:10.1080/87567555.2014.956681

144
Marsh, H. W. (1982). SEEQ: A reliable, valid, and useful instrument for collecting
students' evaluation of university teaching. British Journal of Educational
Psychology, 52(1), 77-95. doi:10.1111/j.2044-8279.1982.tb02505.x
Marsh, H. W. (1983). Multidimensional ratings of teaching effectiveness by students
from different academic settings and their relation to student/course/instructor
characteristics. Journal of Educational Psychology, 75(1), 150-166.
doi:10.1037/0022-0663.75.1.150
Marsh, H. W. (1984). Students’ evaluations of university teaching: Dimensionality,
reliability, validity, potential baises, and utility. Journal of Educational
Psychology, 76(5), 707-754. doi:10.1037/0022-0663.76.5.707
Marsh, H. W. (2007). Students’ evaluations of university teaching: Dimensionality,
reliability, validity, potential biases and usefulness. In R. P. Perry and J. C. Smart
(Eds), The scholarship of teaching and learning in higher education: An
evidence-based perspective, (pp. 319–383). Dordrecht, The Netherlands:
Springer.
Marsh, H. W., & Roche, L. A. (1997). Making students' evaluations of teaching
effectiveness effective: The critical issues of validity, bias, and utility. American
Psychologist, 52(11), 1187-1197. doi:10.1037/0003-066X.52.11.1187
McMillan, J. H., & Schumacher, S. (2010). Research in education: Evidence-based
inquiry (7thth ed.). Upper Saddle River, NJ: Pearson.
McCann, S., & Gardner, C. (2013). Student personality differences are related to their
responses on instructor evaluation forms. Assessment & Evaluation in Higher
Education, 39(4), 412-426. doi:10.1080/02602938.2013.845647
McIntyre, R. M., Smith, D. E., & Hassett, C. E. (1984). Accuracy of performance ratings
as affected by rater training and perceived purpose of rating. Journal of Applied
Psychology, 69(1), 147-156. doi:10.1037/0021-9010.69.1.147
Meyers, L., Gamst, G., & Guarino, A. (2013). Applied multivariate research: Design and
interpretation (2nd ed., pp. 363-365). Thousand Oaks, CA: SAGE.
Mission & Vision (n.d.). Andrews University. Retrieved from
https://www.andrews.edu/about/mission/
Narayanan, A., Sawaya, W. J., & Johnson, M. D. (2014). Analysis of differences in
nonteaching factors influencing student evaluation of teaching between
engineering and business classrooms. Decision Sciences Journal of Innovative
Education, 12(3), 233-265. doi:10.1111/dsji.12035

145
Nargundkar, S., & Shrikhande, M. (2012). An empirical investigation of student
evaluations of instruction—The relative importance of factors. Decision Sciences
Journal of Innovative Education, 10(1), 117-135.
doi:http://dx.doi.org/10.1111/j.1540-4609.2011.00328.x
Nasser-Abu Alhija, F. (2017). Teaching in higher education: Good teaching through
students’ lens. Studies in Educational Evaluation, 54, 4-12.
https://doi.org/10.1016/j.stueduc.2016.10.006
Nasser, F., & Hagtvet, K. A. (2006). Multilevel analysis of the effects of student and
instructor/course characteristics on student ratings. Research in Higher Education,
47(5), 559-590. doi:10.1007/s11162-005-9007-y
Nerger, J. L., Viney, W., & Riedel, R. G., II. (1997). Student ratings of teaching
effectiveness: Use and misuse. The Midwest Quarterly, 38(2), 218-233.
Oermann, M. (2017, March). Student evaluations of teaching: There is more to course
evaluations than student ratings. Nurse Educator, 42(2), 55-56.
doi:10.1097/NNE.0000000000000366
Oliver, R. L., & Pookie, S. E. (2005). Using course management systems to enhance the
value of student evaluations of teaching. Journal of Education for Business, 80(4),
231-234.
Quaglia, R. J., & Corso, M. J. (2014). Student voice: The instrument of change.
Thousand Oaks, CA: Corwin.
Özgüngör, S., & Duru, E. (2015). Course and instructor characteristics distinguishing
highest and lowest student ratings of instructors. Eurasian Journal of Educational
Research(61), 118-136.
Patrick, C. L. (2011). Student evaluations of teaching: Effects of the big five personality
traits, grades and the validity hypothesis. Assessment & Evaluation in Higher
Education, 36(2), 239-249. doi:10.1080/02602930903308258
Peterson, R. L., Berenson, M. L., Misra, R. B., & Radosevich, D. J. (2008). An
evaluation of factors regarding students’ assessment of faculty in a business
school. Decision Sciences Journal of Innovative Education, 6(2), 375-402.
doi:10.1111/j.1540-4609.2008.00182.x
Philosophy of Course Evaluations. (2013, February). Andrews University. Retrieved from
https://www.andrews.edu/services/effectiveness/
assessment/resources/philosophy_of_course_evaluation_final.pdf
Pounder, J. S. (2007). Is student evaluation of teaching worthwhile?: An analytical
framework for answering the question. Quality Assurance in Education, 15(2),
178-191. doi:10.1108/09684880710748938
146
Pritchard, R. E., & Potter, G. C. (2011). Adverse changes in faculty behavior resulting
from use of student evaluations of teaching: A case study. Journal of College
Teaching and Learning, 8(1), 1-7.
Rantanen, P. (2013). The number of feedbacks needed for reliable evaluation: A
multilevel analysis of the reliability, stability and generalisability of students’
evaluation of teaching. Assessment & Evaluation in Higher Education, 38(2),
224-239. doi:10.1080/02602938.2011.625471
Reynolds, W. M. (1979). Relationship of affective characteristics of students to their
evaluations of instructors. Educational and Psychological Measurement, 39(4),
965-970. doi:10.1177/001316447903900435
Riekenberg, J. J. (2010). The relationship between student perceptions of teachers and
classrooms, teacher goal orientation toward teaching, and student ratings of
teacher effectiveness. (Doctoral dissertation). Available from ProQuest
Dissertations and Theses database. (UMI No. 3417481)
Sailor, P., & Worthen, B. R. (1997). Class level as a possible mediator of the relationship
between grades and student ratings. Assessment & Evaluation in Higher
Education, 22(3), 261-69.
Santhanam, E., & Hicks, O. (2002). Disciplinary, gender and course year influences on
student perceptions of teaching: Explorations and implications. Teaching in
Higher Education, 7(1), 17-31. doi:10.1080/13562510120100364
Sauer, T. M. (2012). Predictors of student course evaluations. (Doctoral dissertation).
Available from ProQuest Dissertations and Theses database. (UMI No. 3531422)
Seng, E. L. K. (2013). A qualitative study of factors contributing to international students'
satisfaction of institutional quality. Asian Social Science, 9(13), 126-131.
Shauki, E., Ratnam, A., Fiedler, B., & Sawon, K. (2009). Do learner's gender and
ethnicity really matter for academic performance evaluation. Journal of
International Education in Business, 2(2), 28-51. doi:10.1108/
18363261080001595
Shevlin, M., Banyard, P., Davies, M., & Griffiths, M. (2000). The validity of student
evaluation of teaching in higher education: Love me, love my lectures?
Assessment & Evaluation in Higher Education, 25(4), 397-405.
doi:10.1080/026029300449281
Smith, Bettye. P. P. H. D. (2007). Student ratings of teaching effectiveness: An analysis-
of-course faculty evaluations. College Student Journal, 41(4), 788-800.
Stewart, B. L. C., Goodson, C. E., Miertschin, S. L., & Faulkenberry, L. M. E. (2007).
Student surveys of teaching effectiveness: One measure for FCS evaluation.
Journal of Family and Consumer Sciences, 99(4), 36-41.
147
Svanum, S., & Aigner, C. (2011). The influences of course effort, mastery and
performance goals, grade expectancies, and earned course grades on student
ratings of course satisfaction. British Journal of Educational Psychology, 81(4),
667-679. doi:10.1111/j.2044-8279.2010.02011.x
Terry, C. B., Heitner, K. L., Miller, L. A., & Hollis, C. (2017, April). Predictive
relationships between students’ evaluation ratings and course satisfaction.
American Journal of Pharmaceutical Education, 81(3). Retrieved from
https://www.ncbi.nlm.nih.gov/pmc/articles/PMC5423069/
Tsai, K. C., & Lin, K. (2012). Rethink student evaluation of teaching. World Journal of
Education, 2(2), 17-n/a.
Watson, P. (2015, January 22). Collinearity. In MRC cognition and brain sciences unit.
Retrieved from http://imaging.mrc-cbu.cam.ac.uk/statswiki/FAQ/Collinearity
Wheelahan, L. (2014). Babies and bathwater: Revaluing the role of the academy in
knowledge. In P. Gibbs & R. Barnett (Eds.), Thinking about higher education (pp.
125-137): Dordrecht, The Netherlands: Springer.
Whitworth, J. E., Price, B. A., & Randall, C. H. (2002). Factors that affect college of
business student opinion of teaching and learning. Journal of Education for
Business, 77(5), 282-289.
Wibbecke, G., Kahmann, J., Pignotti, T., Altenberger, L., & Kadmon, M. (2015).
Improving teaching on the basis of student evaluation: Integrative teaching
consultation. Wie kann Lehre durch Evaluation verbessert werden? Durch eine
Integrative Lehrberatung., 32(1), 1-8. doi:10.3205/zma000944
Worthington, A. C. (2002). The impact of student perceptions and characteristics on
teaching evaluations: A case study in finance education. Assessment & Evaluation
in Higher Education, 27(1), 49-64. doi:10.1080/02602930120105054
Wyke, R. M. C. (2013). Teaching creativity and innovation in higher education.
(Doctoral dissertation). Available from ProQuest Dissertations and Theses
database. (UMI No. 3592900)
Yeoh, S. F., Ho Sze-Yin, J., & Chan Yin-Fah, B. (2012). Student evaluation of lecturer
performance among private university students. Canadian Social Science, 8(4),
238-243. doi:10.3968/j.css.1923669720120804.3022
Yin, H., Wang, W., & Han, J. (2016). Chinese undergraduates’ perceptions of teaching
quality and the effects on approaches to studying and course satisfaction. Higher
Education, 71(1), 39-57. Doi:10.1007/s10734-015-9887-5
Zhao, J., & Gallant, D. J. (2012). Student evaluation of instruction in higher education:
Exploring issues of validity and reliability. Assessment & Evaluation in Higher
Education, 37(2), 227-235. doi:10.1080/02602938.2010.523819

148
VITA
Fatimah Al Nasser
5807 Winamac Lake Dr.
Mishawaka, IN 46545
Tel: (616) 206 5372
Email: fatimah @ Andrews.edu
Education
Andrews University (Berrien Springs, MI)
PhD. Curriculum and Instruction 2018
Montessori Academy (Mishawaka, IN)
Teacher Certificate in Child Development 2016
Southern New Hampshire University (Manchester, NH) 2011-2012
M.S. Teaching English as a Foreign Language
King Saud University (Riyadh, Saudi Arabia) 1997- 2004
B.A. Translation in the Field: English- Arabic
Aujam High School/ Girl Section (Al-Awjam, Saudi Arabia) 1995-1997
High School Diploma in Science
Teaching Experience
Graduate Assistance EDRM636 Program Evaluation at Andrews University Fall 2014
Volunteer teacher at Summer English Language Program at
Al-Aujam Charity Society
2005/2006
149
Publications
Examining Identity Styles and Religiosity among Children Undergraduate Students
(submitted for publication JRCE 2015
Factorial Structure of the Identity Style Inventory-3 in a Multicultural Undergraduate
Midwestern Population in the US 2015
Professional Development
Michigan Academic of Sciences, Arts, and Letters Conference (MASAL)
March 13,2015
Andrews University, Berrien Springs, MI, Title “Examining Identity Styles and
Religiosity among Children Undergraduate Students”
AICER Roundtable April 7, 2015
Andrews University, Berrien Springs, MI, Title “Course Type, Course Level, Student’s
Age, Gender, and Personality Type as Correlated of Student Evaluation of Teaching”
Andrews University Teaching and Learning Conference April 8, 2014
Andrews University, Berrien Springs, MI, Title “A Curriculum for Teaching Evaluation
Skill”
Michigan College English Association (MCEA) October 24, 2014
Eastern Michigan University, Ypsilanti, MI, Title “Finding Factors to Develop a Student
Evaluation of Teaching Survey that Reflects the Voice of Non-Native English-Speaking
Students”
Michigan Academy of Sciences, Arts, and Letters Conference (MASAL) February
28, 2014
Oakland University, Rochester, MI, Title “Cross-cultural Autobiographical Accounts:
Narratives of Alienation, Understanding and Reconciliation”
Andrews University Teaching and Learning Conference April 3, 2013
Andrews University, Berrien Springs, MI, Title “Laboratory Schools”Laboratory
Schools”Laboratory Schools”

150
Affiliations/Memberships
Member of American Montessori Society
Member of Phi Kappa Phi
Member of Teachers of English to Speakers of Other
Languages (TESOL) organization
2015
2014
2012
Member of the Association for Supervision and Curriculum
Development (ASCD)
2012
Service
2 Peer reviews for Journal of Research on Christian Education 2015
Member of Assessment Committee at Andrews University 2013
References
References available upon request